a simple procedure for optimally scaling-up fine chemical ... · 1 a simple procedure for optimally...
TRANSCRIPT
1
A simple procedure for optimally scaling-up fine chemical processes.
Part I: practical tools.
Francesco Maestri, Sabrina Copelli, Renato Rota∗
Politecnico di Milano Dip. di Chimica, Materiali e Ingegneria Chimica “G. Natta”
via Mancinelli 7 - 20131 Milano - Italy fax: +39 0223993180; e-mail: [email protected]
Lucia Gigante, Angelo Lunghi, Paolo Cardillo
Stazione Sperimentale per i Combustibili viale De Gasperi 3 - 20097 San Donato Milanese - Milano - Italy
Abstract
A simple and general scale-up procedure, based on boundary and temperature diagrams safety criterion for exothermic semibatch reactors (SBRs), has been developed. Such a procedure is based on a few graphical correlations which allow end users, dealing with homogeneous as well as heterogeneous SBRs (with or without autocatalytic behavior), for an easy selection of safe operating conditions at the laboratory scale and for their scale-up to the industrial one, maximizing at the same time the industrial reactor productivity.
Keywords: Semibatch reactors; Scale-up; Safety; Productivity; QFS conditions; Temperature Rise
Curve.
∗ to whom correspondence should be addressed

2
1. Introduction
In fine chemical and pharmaceutical industries, relatively fast and exothermic reactions are usually
performed by adding, at a sufficiently low rate, one of the reactants (called coreactant) to the others,
namely, using indirectly cooled semibatch reactors (SBRs).
Operating conditions of an exothermic SBR can be considered safe if they correspond to a
sufficiently low coreactant accumulation so that cooling system can control the heat evolved by
chemical reaction, hence limiting also reaction temperature rise. Once a set of safe operating
conditions has been selected at laboratory scale, it must be scaled-up maximizing industrial reactor
productivity.
The thermal loss of control of exothermic batch and semibatch reactors has been thoroughly
analyzed in the literature. However, for a practical solution of the problem, any safety criterion and
scale-up procedure must be simple and general at the same time. Such goals are often not easy to fit
together, taking into account that, especially in fine chemical and pharmaceutical industries, a wide
range of products, in relative small amounts, are produced and that a detailed mathematical model
of every single process is often not affordable.
Methods presented in the literature for the selection of safe operating conditions of exothermic
SBRs are all intended to minimize coreactant accumulation into the system.
Among the others, Hugo et. al.1-3 firstly developed a semi-empirical criterion for homogeneous
SBRs, which has been then extended to heterogeneous (liquid-liquid) reactors by Steensma and
Westerterp4-6 and Westerterp and Molga7-9. These authors, on the basis of thermal effects associated
to coreactant accumulation, provided a quantitative definition of accumulation phenomena in a
SBR. In particular actual reactor temperature - time profile can be compared with a target one,
corresponding to both a sufficiently low coreactant accumulation and to a very high reactor cooling
efficiency. On the basis of such a comparison, the thermal behavior of the reactor itself can be
classified. This information has been then represented in a suitable dimensionless space through the
3
so-called Boundary Diagrams (BDs), allowing end users to easily discriminate between safe and
excessive accumulation operating conditions without solving the mathematical model of the reactor.
This safety criterion has been experimentally validated by van Woezik and Westerterp10,11, who
studied the nitric acid oxidation of 2-octanol to 2-octanone with further oxidation of reaction
product to unwanted carboxylic acids.
Maestri and Rota12-14 analyzed the role that estimated kinetic parameters play on conclusions drawn
through boundary diagrams calculated for different reaction orders, proving that unjustified
assumptions on the reaction kinetics cannot be accepted for a reliable application of the method:
such a conclusion has been found to be true for both heterogeneous and homogeneous reaction
systems and it makes a kinetic investigation (usually performed through calorimetric techniques) of
great importance.
Moreover, a number of reacting systems are characterized by a threshold temperature value (in the
following referred to as Maximum Allowable Temperature, MAT, which can arise either from
chemical or safety constraints14), which must not be exceeded neither during normal nor during
upset reactor operations. Therefore, limiting accumulation phenomena can be just a necessary, not a
sufficient condition for the selection of a proper set of operating conditions for an exothermic SBR.
For these reasons, Maestri and Rota14,15 introduced a new typology of diagrams, called Temperature
Diagrams (TDs), to be coupled with boundary diagrams, allowing end users for a safe prediction of
the maximum temperature increase with respect to initial reactor temperature. Combined boundary
and temperature diagrams criterion has been previously validated by analyzing the industrial
nitration process of N-(2-phenoxyphenyl) methane sulphonamide to N-(4-nitro, 2-phenoxyphenyl)
methane sulphonamide16.
Molga et al.17 calculated BDs for homogeneous SBRs and (1,1) reaction order kinetics, providing
diagrams for quick identification of inherently safe operating conditions. Maestri and Rota18
developed a safety criterion based on boundary and temperature diagrams for homogeneous SBRs
with autocatalytic behaviour, for which the corresponding criterion developed for non-autocatalytic

4
reaction systems cannot be applied7-9,17. Such a criterion involves initial catalyst amount as an
additional parameter with respect to the non-autocatalytic case.
Once a set of safe operating conditions has been selected at the laboratory scale (e.g., through the
usage of boundary and temperature diagrams) and validated through reaction calorimetry
experiments (e.g., using a RC1 equipment), it must be scaled-up to the industrial reactor scale.
However, such a scale-up process should be performed not only under safe conditions but also
maximizing industrial reactor productivity. In the literature the problem of scaling-up safe operating
conditions from laboratory to pilot and finally to full scale plant has been already analyzed on the
basis of parametric sensitivity concepts: Alòs et al.19 applied the generalized parametric sensitivity
criterion developed by Morbidelli et al.20 to exothermic SBRs and analyzed the scale-up of an acid
catalysed esterification process for the production of sec-butyl propionate. Recently Zaldivar et
al.21-24 developed an early warning criterion of runaway events, which can be applied to stirred tank
reactors and for several kinetic schemes.
The method of boundary and temperature diagrams, as described in the literature, does not provide
a procedure for optimally scaling-up a set of operating conditions verified at laboratory scale to full
plant scale. Therefore, in this work, a simple procedure has been developed which, under Quick
onset, Fair conversion, Smooth temperature profile (in the following referred to as QFS) operating
conditions4 and through a generalized form of temperature diagrams, allows end users to scale-up
safe operating conditions selected and verified at laboratory scale achieving, at the same time, safe
and productive conditions.

5
2. Mathematical model
Since the mathematical model on which boundary and temperature diagrams method is based has
been thoroughly discussed in the literature4-18, in the following it will be just briefly summarized.
A single exothermic reaction of the form:
A B DA B C Dν ν ν+ → + (1)
is assumed to occur. It is characterized by the following microkinetic rate expression:
,n m
n m A Br k C C= (2)
The reaction system can be either homogenous (consisting of a single liquid phase) or
heterogeneous (consisting of two liquid phases) and, in the latter case, reaction can occur either in
the continuous or in the dispersed phase.
The following model assumptions can be reasonably stated:
1) the reaction mass is perfectly macromixed;
2) the influence of the chemical reaction on the volume of the single phase is negligible;
3) no phase inversions occur;
4) in the heterogeneous cases, the solubility of the species A (dosed coreactant) and C in the
continuous phase, “c”, and of components B (reactant initially charged into the reactor) and
D in the dispersed phase, “d”, is small;
5) in the heterogeneous cases, chemical reaction takes place only in one of the two liquid
phases: this situation is very common in many industrial processes (such as nitrations and
oxidations), in which the catalyst (typically a strong acid) is present only in one phase;
6) heat effects are associated to the chemical reaction only;
7) reactor operates under isoperibolic conditions; in particular, at time equal to zero, reaction
mass temperature is equal to mean coolant temperature and to dosing stream temperature
(constant for the whole duration of the process).

6
Mass balance equation for component B, at the beginning of the dosing period, can be written in
dimensionless form as:
,B
A n md Da RE fdζ ν κϑ
= (3)
for homogeneous and heterogeneous (liquid-liquid) kinetically controlled reaction systems12,14 and
in the form:
1 2,
BA n m
d Da RE fdζ ν κϑ
= (4)
for heterogeneous (liquid-liquid) diffusion controlled reaction systems13. In equations (3) and (4)
Da=kn,m,RtDCB,0n+m-1 is the Damköhler number for (n,m) order kinetics, which contains information
about dosing time, and κn,m=exp[γ(1-1/τ)] is the dimensionless reaction rate constant, which is the
ratio of reaction rate constant to the same quantity evaluated at a reference temperature, TR.
γ=E/(RTR) is the dimensionless activation energy and τ=T/TR is the dimensionless temperature.
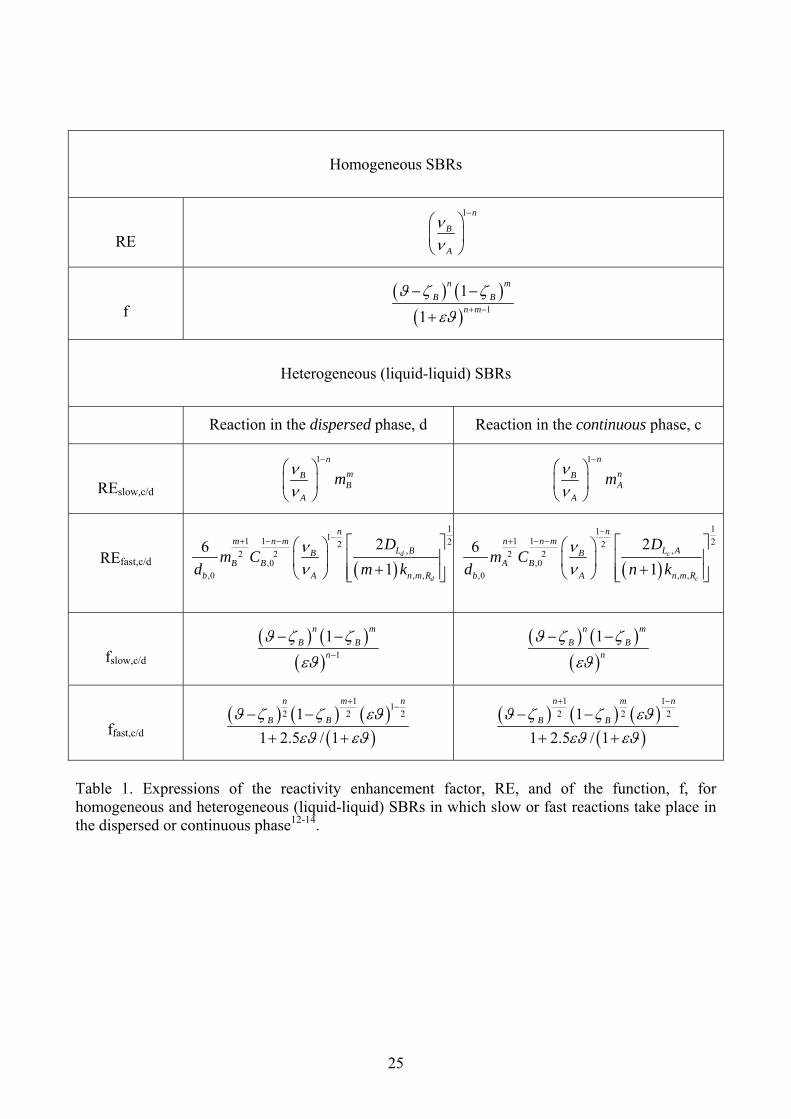
Expressions for the calculation of reactivity enhancement factor, RE, and for function, f, have been
derived elsewhere12-14 and they are summarized in Table 1.
Conversion rate, dζB/dϑ, can be determined either by chemical reaction, mass transfer phenomena
(in heterogeneous reaction systems) or coreactant supply.
Energy balance equation for the reactor can be rearranged as4:
( ) ( ) ( ),01 1 effBH ad H cool
ddR Co Rd d
ζτα εϑ τ ε εϑ τ τϑ ϑ
+ = Δ − + + −⎡ ⎤⎣ ⎦ (5)
where ( ) ( ), ,00 D c P c rCo UA t C Vρ ε= %% is cooling number, whose value is determined by heat transfer
efficiency of the reactor and dosing rate; ( )( )
11
cool H Deffcool
H
Co RCo R
εϑ τ ττ
εϑ+ +
=+ +
is an effective cooling
temperature which summarizes the enthalpic contributions of both coolant and dosing stream heat
removal; α is a flag parameter which is equal to 1/RH or 1 for homogeneous or heterogeneous
(liquid-liquid) reaction systems, respectively.
Equations (3) to (5), which have been derived for 0<ϑ≤1, can be easily extended to ϑ>1 by
7
substituting everywhere (ϑ-ζB)/ϑ or (ϑ-ζB) terms with (1-ζB), εϑ terms with ε and setting TD≡T in
the definition of the effective cooling temperature.
3. Safety criterion
When dealing with relatively fast and exothermic reactions, a safe process operation can be
achieved performing the reaction itself in an indirectly cooled SBR in which coreactant
accumulation is kept at sufficiently low values so that the available cooling system can balance the
enthaplic contribution due to the conversion rate.
On this basis, boundary and temperature diagrams method allows for a quick selection of reactor
operating conditions implying both a sufficiently low coreactant accumulation and a reaction
temperature increase, under isoperibolic conditions, lower than the Maximum Allowable
Temperature 15. As mentioned elsewhere in the literature15, MAT is not a thermodynamic parameter
of the system but it is only related to safety (when dangerous decomposition reactions can be
triggered) or productivity problems (when undesired side reactions can lower process selectivity or
influence product quality) which may affect the analyzed process. In both cases, MAT value
corresponds to a reaction mass temperature at which a suitable calorimetric equipment (such as
ARC or PHI-TEC II) is able to detect the onset of an exothermic phenomenon (e.g, a self heating
rate of reaction mass larger than 0.02 °C/min) during a standard Heat-Wait-Search (HWS) test.
Once, for a given reaction system, microkinetic parameters have been experimentally estimated
(e.g., through adiabatic ARC or Phi-TEC II experiments), the SBR thermal behavior (according to
the model presented in the previous section) can be represented in a suitable dimensionless space of
two parameters, called exothermicity, Ex, and reactivity, Ry, number, the former depending on
reaction enthalpy and the latter accounting for initial dependence of the reaction rate on
temperature:
( ),0
2ad
xcool H
ECo Rτγ
τ εΔ
=+
(6)
8
( )cool
Ay
H
Da RER
Co Rτ
ν κ
ε=
+ (7)
In these relations an apparent activation energy (which, for heterogeneous diffusion controlled
systems, is equal to half of the corresponding microkinetic value) has to be used.
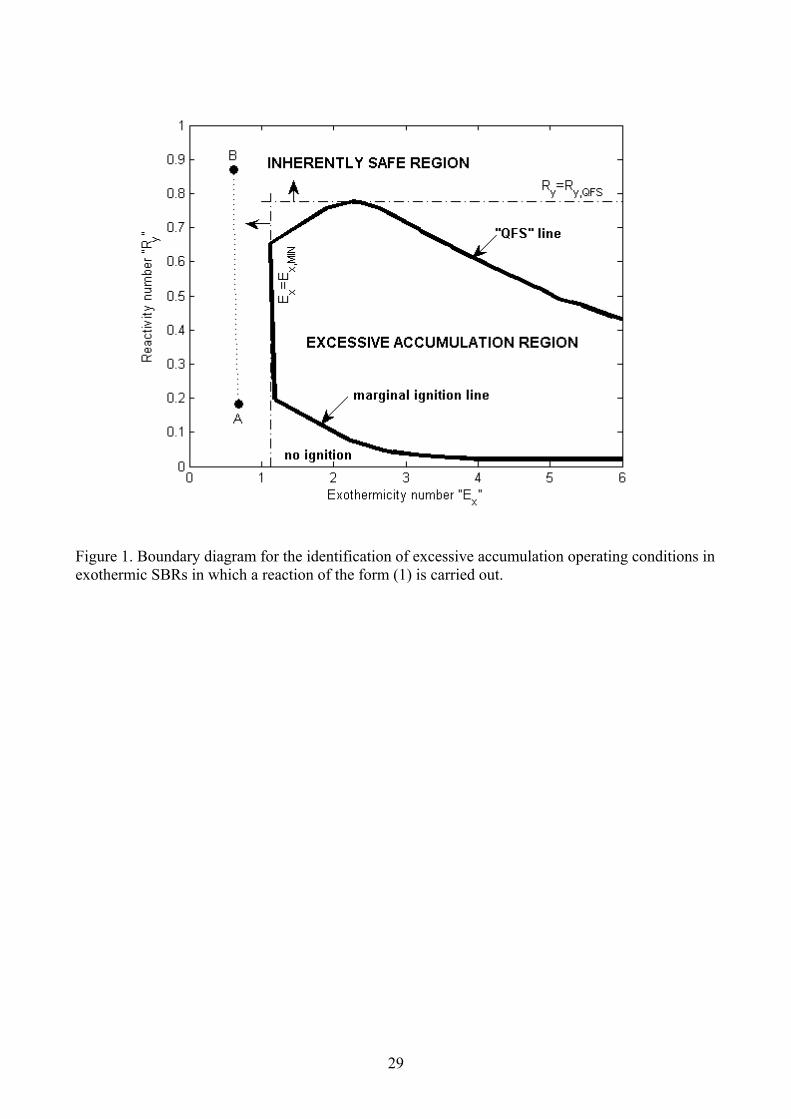
In this dimensionless space a boundary can be calculated4 (see Figure 1), inside which an excessive
coreactant accumulation occurs. This means that, in this region, a target temperature defined as4:
( ),01.05
1adeff
ta coolHCo R
ττ τ
ε εϑΔ
= +⎡ ⎤+ +⎣ ⎦
(8)
is exceeded. The target temperature relation can be extended to ϑ>1 by substituting the εϑ term
with ε.
The aforementioned excessive accumulation region is included in a larger domain, bounded by
Ry=Ry,QFS and Ex=Ex,MIN lines, which identifies inherently safe operating conditions.
In particular, QFS line shows a maximum because a reduction in Ex leads at first to a delayed
temperature rise during dosing time, thus requiring higher Ry values to avoid dangerous
accumulation. However, further reducing Ex, thermal effects of coreactant accumulation are so
small to imply a lowering in Ry value.
At Ex≤Ex,MIN accumulation of unreacted coreactant in the reaction system during dosing period still
increases at lower Ry values, but thermal effects associated to it (quantified through the exceeding
of the target temperature) are always negligible because of too low reaction exothemicity. On this
basis, a simplified safety criterion can be stated, according to which only operating conditions
characterized by a sufficiently low unreacted coreactant accumulation are accepted, independently
on reaction exothermicity. Such a safety criterion can be summarized for any Ex value through the
following condition:
,y y QFSR R≥ (9)
In the literature1-3,9 a number of safety criteria of this type can be found: as an example, the criterion
of Hugo and Steinbach1 for homogeneous SBRs with (1,1) reaction orders, states that only

9
operating conditions characterized by Ry values higher than one can be accepted, which complies
with Ry,QFS value calculated through boundary diagrams14.
Moreover, selecting even at Ex≤Ex,MIN, operating conditions characterized by Ry≥ Ry,QFS improves
reactor productivity: moving from operating conditions A to B in Figure 1, through an initial
reaction temperature increase (if allowed according to MAT constraint), the conversion at the end
of the supply period is higher and the further batch period after the end of coreactant dosing (in
which the reaction reaches full conversion) can be shortened.
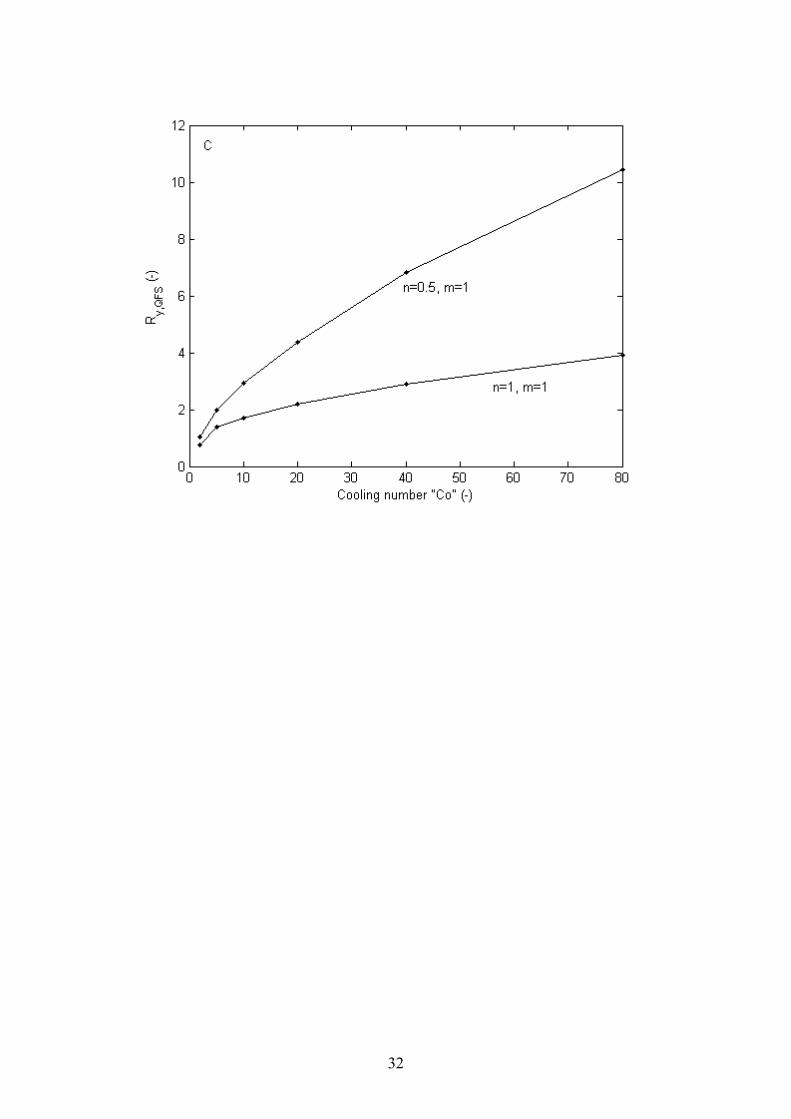
Ry,QFS values for the whole set of cooling numbers of industrial relevance are represented in Figures
2 and 3. Such curves, in the following referred to as Inherently Safe Conditions curves (ISC),
provide safe Ry,QFS values dependent on reaction order with respect to coreactant, n, but
independent on the estimated reaction order with respect to reactant initially charged into the
reactor, m, (because of low parametric sensitivity of Ry,QFS with respect to m). Limiting the
variation range of n between 0.5 and 2, only ISC curves for n=1 and n=2 (n=0.5) have been reported
since for homogeneous (heterogeneous) systems Ry,QFS value increases (decreases) with n.
Note that a low Co value can be related either to a short dosing time or to a low heat transfer rate
which, at the beginning of the dosing period, can cause a temperature rise delay and, consequently,
some coreactant accumulation. As a results, Ry,QFS vs. Co curves can exhibit a maximum.
Figures 2 and 3 allow end users for a safe and easy selection of low accumulation operating
conditions. It is worth mentioning that, in our knowledge for heterogeneous reaction systems, no
Ry,QFS values had been ever published in the literature for the lowest cooling number values (which
are most frequently encountered at the industrial scale) and for reaction orders with respect to the
dosed coreactant, n, lower than one, for which n=1 values can not be safely employed12,13.
Moreover, from Figures 2 and 3, it can be observed that, independently on reaction system, the
average sensitivity of Ry,QFS with respect to Co for n=1 cases represented is usually lower than that
for n≠1 cases (for which Ry,QFS values calculated assuming n=1 can not be safely employed). Also
for this reason in such cases the availability of Ry,QFS data extended to the whole set of Co values of

10
industrial relevance is of crucial importance. ISC curves reported in Figures 2 and 3 have been
calculated at RH=1 except for homogeneous reaction case, for which the sensitivity of Ry,QFS with
respect to RH is negligible14. In heterogeneous cases it must be taken into account that a lower RH
value (such that occurring when an organic phase is added to an aqueous one7) leads to a higher
Ry,QFS value at the current Co, since enthalpic contribution of dosing stream (and hence its cooling
capability) is lower. Such an Ry,QFS increase is significant just for n≠1 cases, for which a 15%
higher value with respect to that corresponding to RH=1 case can be safely assumed12,13.
Under QFS conditions the characteristic time of the process (which is related to the overall
conversion rate as well as to its enthalpic effects) is, at the same time, close to dosing time and
much higher than the characteristic time of reaction mass cooling. This means that system thermal
behavior is fully determined by the enthalpic contribution of the reaction and the kinetic parameters
(that is: n and m) as well as the heat transfer parameters (that is: Co and RH) have a small influence
on the system thermal behavior. Under such conditions, as demonstrated for autocatalytic reaction
systems18, the dimensionless maximum temperature rise (that is, max0max )( TT=Ψ ) in the
representation of temperature diagrams14, (which is in general a function of Co, RH, n, m, Ry and
Ex) becomes, as a first approximation, a function of Ex only and, consequently, all ψ vs. Ex curves
(for homogeneous as well as heterogeneous reaction systems with a slow or fast reaction occurring
in the dispersed or in the continuous phase) tend to overlap into a narrow region, as can be seen
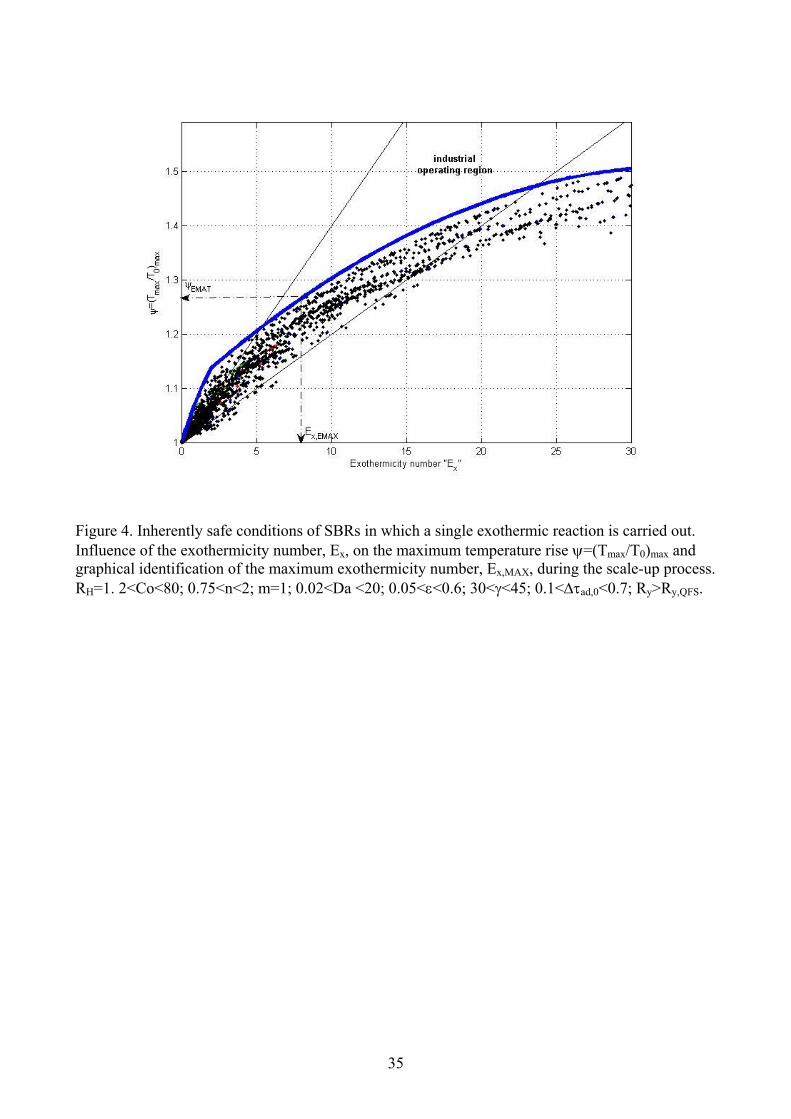
from raw data represented in Figure 4, whose superior boundary defines a general curve called
Temperature Rise Curve (TRC). In particular, points appearing in Figure 4 represent calculated ψ
values in a wide range of Co, RH, n and m parameters, and at Ry values such that Ry≥Ry,QFS.
It should be noticed that in the representation of TRC curve the same definition of the exothermicity
and reactivity numbers (that is, the one based on the microkinetic value of the activation energy)
has been used, also for heterogeneous diffusion controlled systems for which the apparent activation
energy is equal to the half of its microkinetic value. In fact, once QFS operating conditions are

11
attained, the behavior of heterogeneous reaction systems can not be determined by mass transfer
phenomena, since dosing time is much higher than all the other characteristic times. Moreover,
since under QFS conditions the role of reaction kinetics becomes less important, the same
temperature rise curve can be used for estimating maximum peak temperature also of autocatalytic
reaction systems, as can be observed from Figure 4, where also ψ data for homogeneous
autocatalytic systems have been superimposed. In this case, Ry,QFS values for the selection of low
accumulation operating conditions as well as full details on diagrams can be found elsewhere18.
TRC curve can therefore be used for a safe and general estimation of the maximum peak
temperature for any of the aforementioned systems and any combination of Co, RH, n, m (and ζB,0)
parameters into their specified range of variation, checking then that operating conditions selected
are characterized by an Ry value higher than the corresponding Ry,QFS.
It must be finally noticed that the usage of TRC diagram (and hence the criterion in question) is
based on QFS conditions. A low parametric sensitivity of the reactor’s behavior with respect to the
different process and plant parameters can therefore be expected, as a difference with excessive
accumulation operating conditions. Such a characteristic is very important in order to smooth the
effect of eventual inaccuracies in the estimation of the parameters involved.
4. Scale-up procedure
TRC and ISC diagrams, through which it is possible to easily select at laboratory scale (that is, at
RC1 scale) safe and productive operating conditions for an exothermic SBR, can also be used to
perform a safe scale-up to industrial scale. The five-steps procedure to do this is described in the
following and finally represented in the flow chart of Figure 5:
1) Execution of calorimetric screening tests in order to characterize thermal behavior of reactants,
products and reacting mixture in a suitable temperatures range. In particular DSC (Differential
Scanning Calorimetry) experiments must be performed on reactants and products to detect if they
may be affected by thermal decomposition or oxidation in the selected range of investigated

12
temperatures (e.g., in tests using inox sample holders temperatures vary between 40 and 280 °C).
Then it must be carried out a standard Heat-Wait-Search (HWS) test on the reacting mixture by
using an ARC (Accelerated Rate Calorimeter) equipment: such an experiment provides MAT
parameter as it has been previously defined (e.g self heating rate of reaction mass larger than 0.02
°C/min).
2) Execution of adiabatic tests (in an RC1 or PHI-TEC II equipment) in order to obtain microkinetic
rate expression (power law form). When treating with heterogeneous systems, such experiments
must be performed at different agitator speed to identify operating conditions where temperature
profiles stop to be affected by mass transfer phenomena, that is we are in kinetically controlled (or
slow) reaction regime.
3) Knowing process recipe and a suitable initial reactor temperature T0, it is possible to use TRC
and ISC diagrams in order to identify safe and productive operating conditions at laboratory scale
(namely, at the RC1 scale). The strategy is based on the main process variables of the system which
are initial reaction temperature, T0, and dosing time, tD. Since initial reaction temperature arises
mainly from chemical recipe, according to safety and product quality constraints, the procedure in
question will be based on dosing time, tD, as the only process parameter.
On TRC diagram, from a ψ value corresponding to an Effective Maximum Allowable Temperature
(EMAT), ψEMAT, lower than the MAT value obtained by the ARC test, obtained through a
parameter toll (EMAT = MAT(1-toll); this is a conservative assumption which allows us to prevent
dangerous effects if there is a certain degree of uncertainty in MAT estimation), it is possible to
read off the corresponding Ex value, Ex,EMAX, which is the maximum acceptable value of
exothermicity number at laboratory scale. Since all the other dimensionless parameters appearing in
the Ex expression (6) but Co are known, to a maximum Ex value a minimum value of the cooling
number corresponds ( 2,0 0 ,MIN ad x MAX HCo E Rγ τ τ ε= Δ − ) and finally (being physical and heat
transfer characteristics of RC1 known) also a minimum dosing time
13
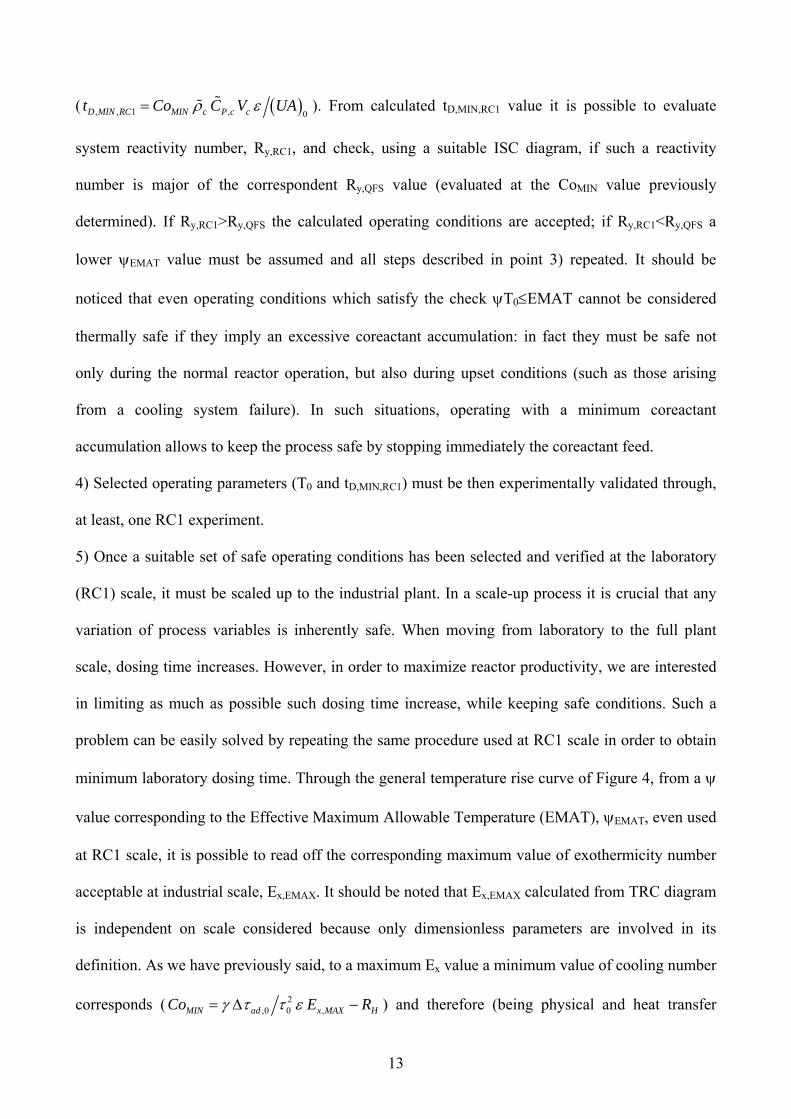
( ( ), , 1 , 0D MIN RC MIN c P c ct Co C V UAρ ε= %% ). From calculated tD,MIN,RC1 value it is possible to evaluate
system reactivity number, Ry,RC1, and check, using a suitable ISC diagram, if such a reactivity
number is major of the correspondent Ry,QFS value (evaluated at the CoMIN value previously
determined). If Ry,RC1>Ry,QFS the calculated operating conditions are accepted; if Ry,RC1<Ry,QFS a
lower ψEMAT value must be assumed and all steps described in point 3) repeated. It should be
noticed that even operating conditions which satisfy the check ψT0≤EMAT cannot be considered
thermally safe if they imply an excessive coreactant accumulation: in fact they must be safe not
only during the normal reactor operation, but also during upset conditions (such as those arising
from a cooling system failure). In such situations, operating with a minimum coreactant
accumulation allows to keep the process safe by stopping immediately the coreactant feed.
4) Selected operating parameters (T0 and tD,MIN,RC1) must be then experimentally validated through,
at least, one RC1 experiment.
5) Once a suitable set of safe operating conditions has been selected and verified at the laboratory
(RC1) scale, it must be scaled up to the industrial plant. In a scale-up process it is crucial that any
variation of process variables is inherently safe. When moving from laboratory to the full plant
scale, dosing time increases. However, in order to maximize reactor productivity, we are interested
in limiting as much as possible such dosing time increase, while keeping safe conditions. Such a
problem can be easily solved by repeating the same procedure used at RC1 scale in order to obtain
minimum laboratory dosing time. Through the general temperature rise curve of Figure 4, from a ψ
value corresponding to the Effective Maximum Allowable Temperature (EMAT), ψEMAT, even used
at RC1 scale, it is possible to read off the corresponding maximum value of exothermicity number
acceptable at industrial scale, Ex,EMAX. It should be noted that Ex,EMAX calculated from TRC diagram
is independent on scale considered because only dimensionless parameters are involved in its
definition. As we have previously said, to a maximum Ex value a minimum value of cooling number
corresponds ( 2,0 0 ,MIN ad x MAX HCo E Rγ τ τ ε= Δ − ) and therefore (being physical and heat transfer
14
characteristics of industrial reactor known) also a minimum industrial dosing time
( ( ), , , 0D MIN ind MIN c P c ct Co C V UAρ ε= %% ). From calculated tD,MIN,ind value it is possible to evaluate
industrial reactivity number, Ry,ind, and check, using a suitable ISC diagram, if such a reactivity is
larger than the correspondent Ry,QFS value (evaluated at the CoMIN value previously determined).
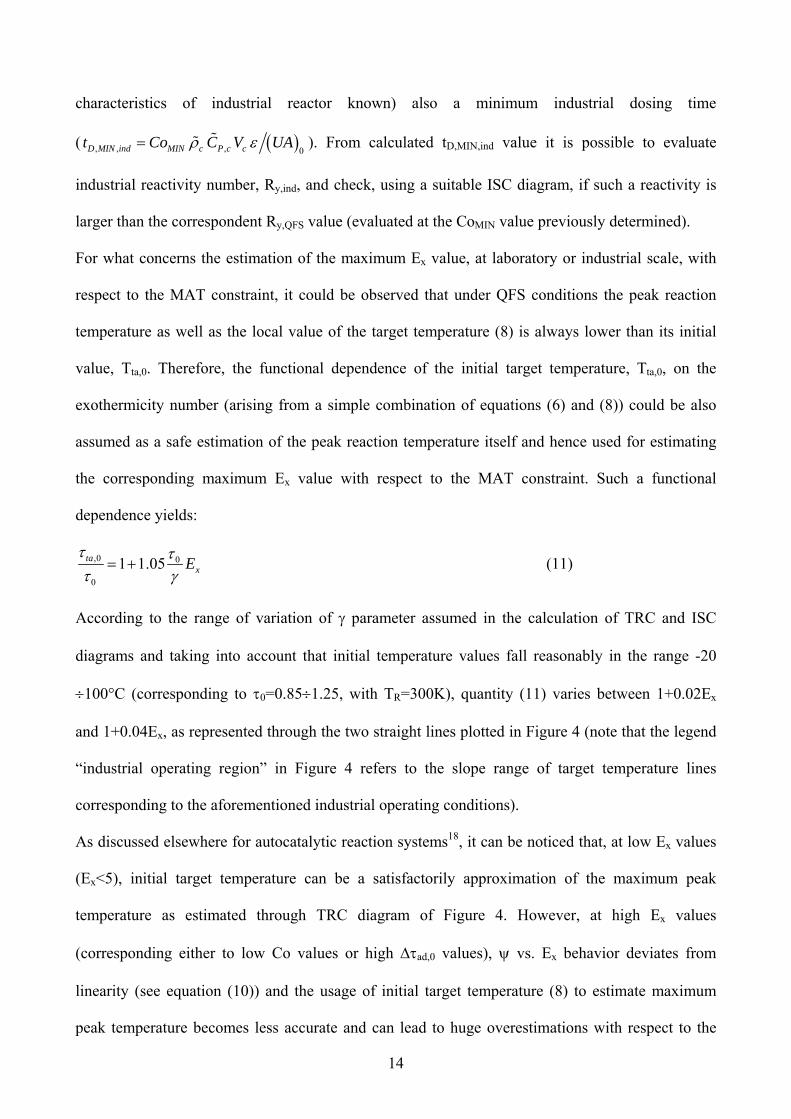
For what concerns the estimation of the maximum Ex value, at laboratory or industrial scale, with
respect to the MAT constraint, it could be observed that under QFS conditions the peak reaction
temperature as well as the local value of the target temperature (8) is always lower than its initial
value, Tta,0. Therefore, the functional dependence of the initial target temperature, Tta,0, on the
exothermicity number (arising from a simple combination of equations (6) and (8)) could be also
assumed as a safe estimation of the peak reaction temperature itself and hence used for estimating
the corresponding maximum Ex value with respect to the MAT constraint. Such a functional
dependence yields:
,0 0
0
1 1.05taxE
τ ττ γ
= + (11)
According to the range of variation of γ parameter assumed in the calculation of TRC and ISC
diagrams and taking into account that initial temperature values fall reasonably in the range -20
÷100°C (corresponding to τ0=0.85÷1.25, with TR=300K), quantity (11) varies between 1+0.02Ex
and 1+0.04Ex, as represented through the two straight lines plotted in Figure 4 (note that the legend
“industrial operating region” in Figure 4 refers to the slope range of target temperature lines
corresponding to the aforementioned industrial operating conditions).
As discussed elsewhere for autocatalytic reaction systems18, it can be noticed that, at low Ex values
(Ex<5), initial target temperature can be a satisfactorily approximation of the maximum peak
temperature as estimated through TRC diagram of Figure 4. However, at high Ex values
(corresponding either to low Co values or high Δτad,0 values), ψ vs. Ex behavior deviates from
linearity (see equation (10)) and the usage of initial target temperature (8) to estimate maximum
peak temperature becomes less accurate and can lead to huge overestimations with respect to the
15
value estimated through temperature rise curve. In fact, at low Co values (corresponding to high Ex
values) the ratio of the characteristic time of the process (which is close to dosing time) with respect
to that one characteristic of reaction mass cooling (which, under QFS conditions, is equal to
ε(Co+RH)) can be not sufficiently high18. Since conditions characterized by low Co values are
normally encountered at industrial scale7-9, it can be concluded that the usage of Tta,0 value for
estimating peak reaction temperature with respect to MAT constraint and the corresponding
maximum Ex value would lead to the selection of scaled-up operating conditions which can lower
industrial reactor productivity.
However, under different operating conditions, the value of initial target temperature (which can be
never overcome by real peak reaction temperature) can be a better estimation of the peak
temperature than the value provided by general temperature rise curve, as always shown by Figure
4, where a region characterized by values of initial target temperature lower than that provided by
temperature diagrams can also exist.
This leads to a simple rule of thumb for selecting maximum Ex value at industrial scale for
optimizing reactor productivity: once both Ex values corresponding to EMAT (through equation
(11) and through the general temperature rise curve of Figure 4, equation (10)) have been
calculated, the higher of these two values must be assumed to evaluate scaled-up cooling number
and the corresponding dosing time.
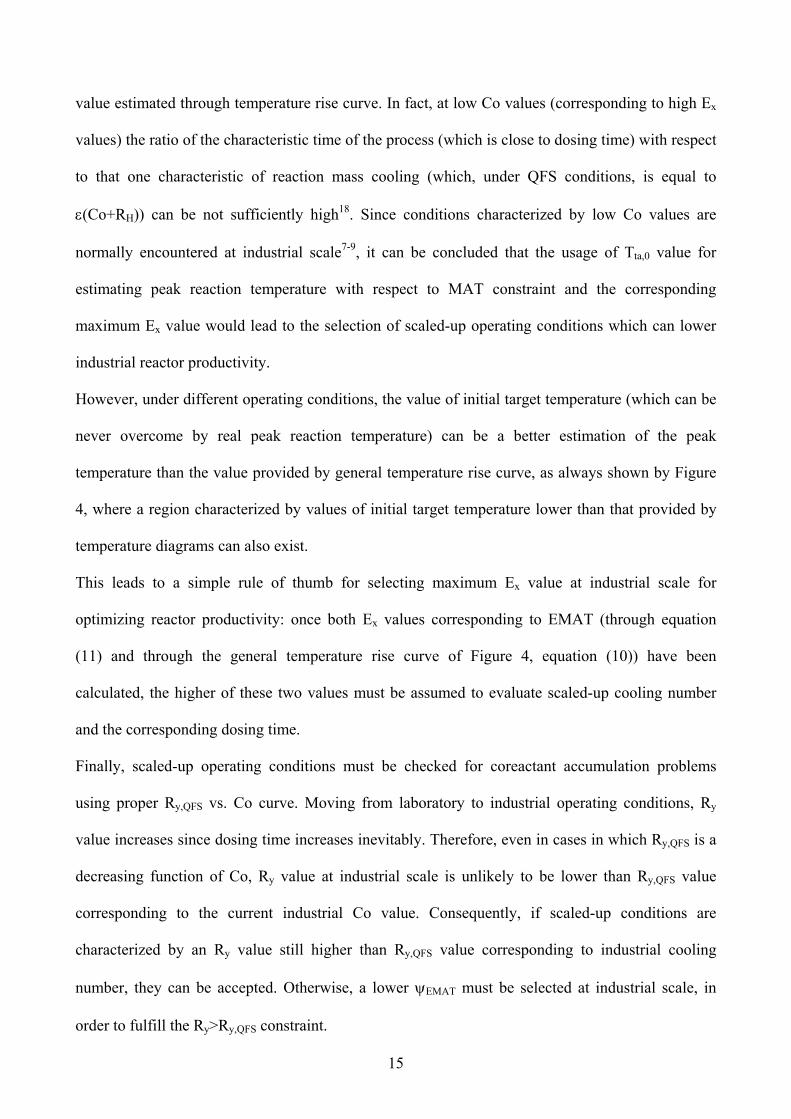
Finally, scaled-up operating conditions must be checked for coreactant accumulation problems
using proper Ry,QFS vs. Co curve. Moving from laboratory to industrial operating conditions, Ry
value increases since dosing time increases inevitably. Therefore, even in cases in which Ry,QFS is a
decreasing function of Co, Ry value at industrial scale is unlikely to be lower than Ry,QFS value
corresponding to the current industrial Co value. Consequently, if scaled-up conditions are
characterized by an Ry value still higher than Ry,QFS value corresponding to industrial cooling
number, they can be accepted. Otherwise, a lower ψEMAT must be selected at industrial scale, in
order to fulfill the Ry>Ry,QFS constraint.

16
5. Sensitivity analysis
The combined optimization – scale-up procedure previously described uses a series of experimental
parameters inevitably subjected to uncertainty. In order to define how safe a determined set of
selected operating conditions can be, it is necessary to perform a sensitivity analysis with respect to
all parameters subjected to uncertainty25. The simplest way to execute such an analysis is to perform
a numerical sensitivity analysis as discussed in the following procedure.
Let us consider a generic experimental parameter, β, subjected to a certain degree of uncertainty ε.
Real β value, βreal, falls between a minimum and a maximum threshold value dependent on the
calculated (from experimental measurements) parameter βcalc, as reported in (12):
( ) ( )εββεβ +≤≤− 11 calcrealcalc (12)
βcalc is the value used to perform the aforementioned TRC and ISC optimization - scale-up
procedure. Once this procedure has been carried out, if check on ISC diagram is positive (no
excessive coreactant accumulation is attained) a numerical sensitivity analysis should be carried out
to ensure that the selected tD,MIN value leads to safe conditions even if the real value of some
parameters differs from the calculated one. Consequently, using β values equal to both βcalc(1-ε) and
βcalc(1+ε) while keeping unchanged tD,MIN, TRC and ISC optimization – scale-up procedure has to
be repeated. If the check on ISC diagram is positive for both cases we may conclude that no
dangerous sensitivity of the procedure with respect to parameter β exists and that the selected
operating conditions are inherently safe. If at least one of the two ISC checks is not passed it is
necessary to repeat the optimization – scale-up procedure decreasing the previously selected ΨEMAT
value until all ISC checks are positive. Such a new value of ΨEMAT permits to recalculate a
maximum process exothermicity, Ex,EMAT, lower than the previous one and a minimum cooling
number (and so a minimum dosing time) larger than that one previously computed. Consequently,
Ry, which is proportional to the dosing time, will be higher.
This sensitivity analysis is not too cumbersome. However, for homogeneous and heterogeneous
kinetically controlled systems, it is possible to obtain a few analytical relations to perform such an
17
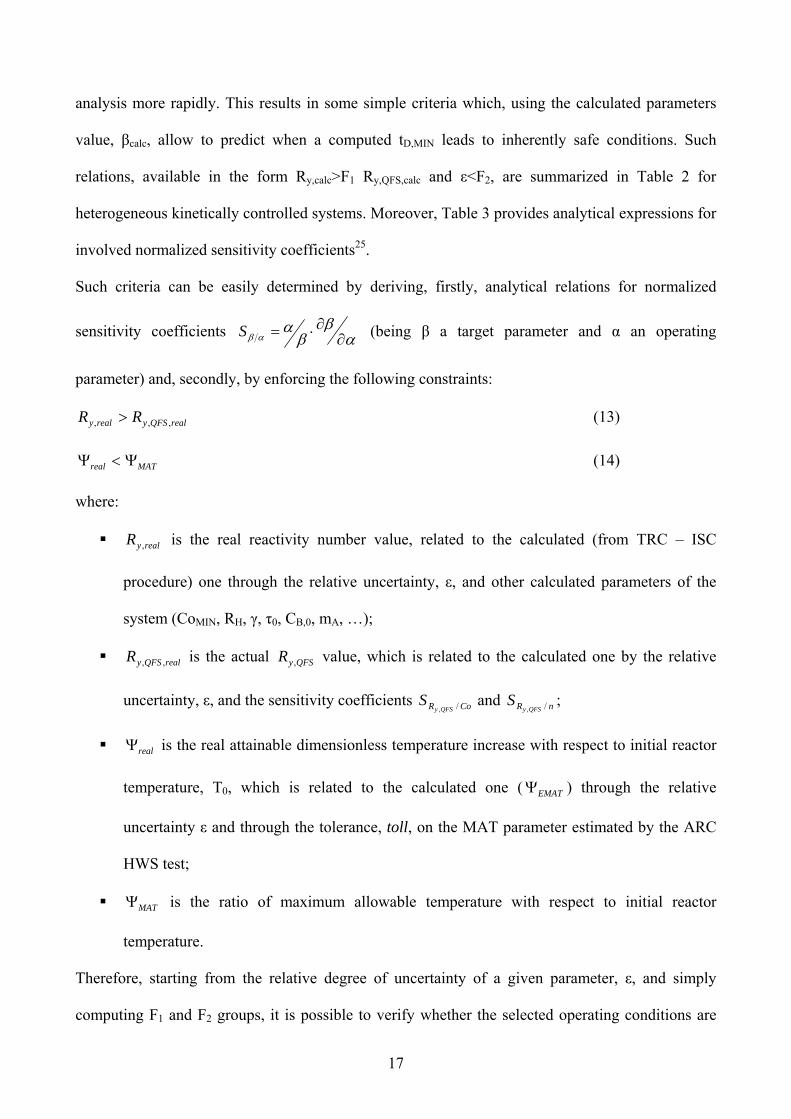
analysis more rapidly. This results in some simple criteria which, using the calculated parameters
value, βcalc, allow to predict when a computed tD,MIN leads to inherently safe conditions. Such
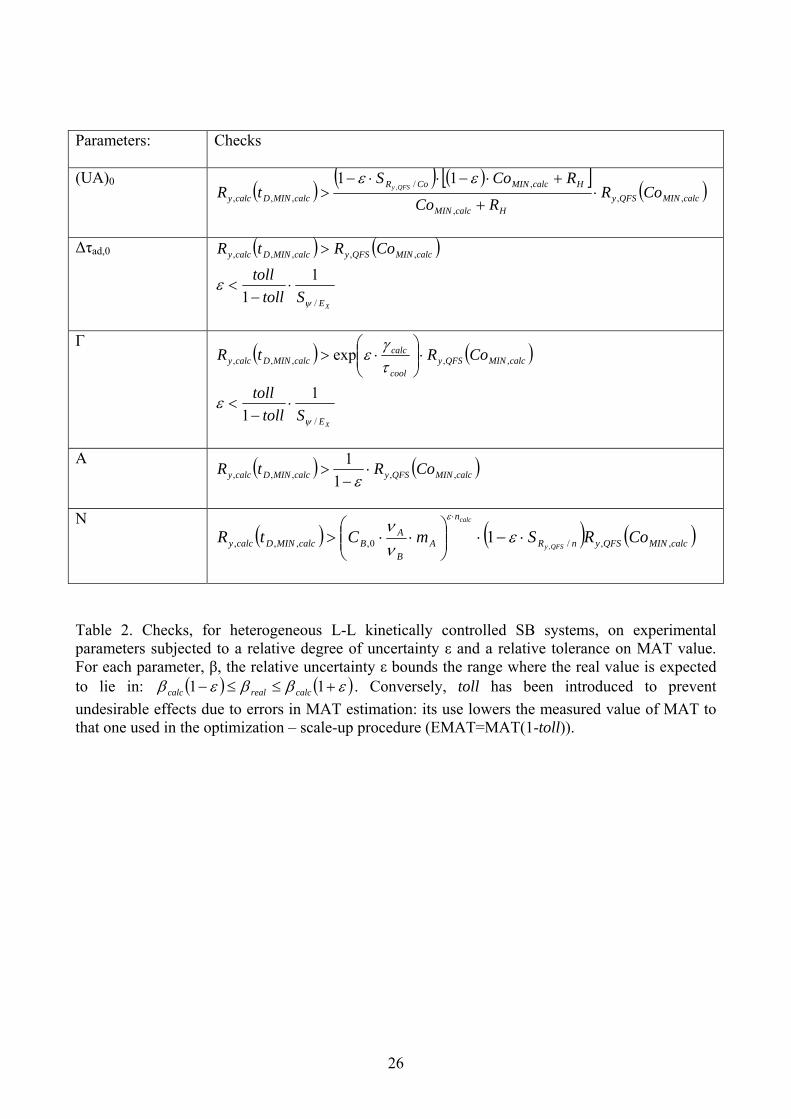
relations, available in the form Ry,calc>F1 Ry,QFS,calc and ε<F2, are summarized in Table 2 for
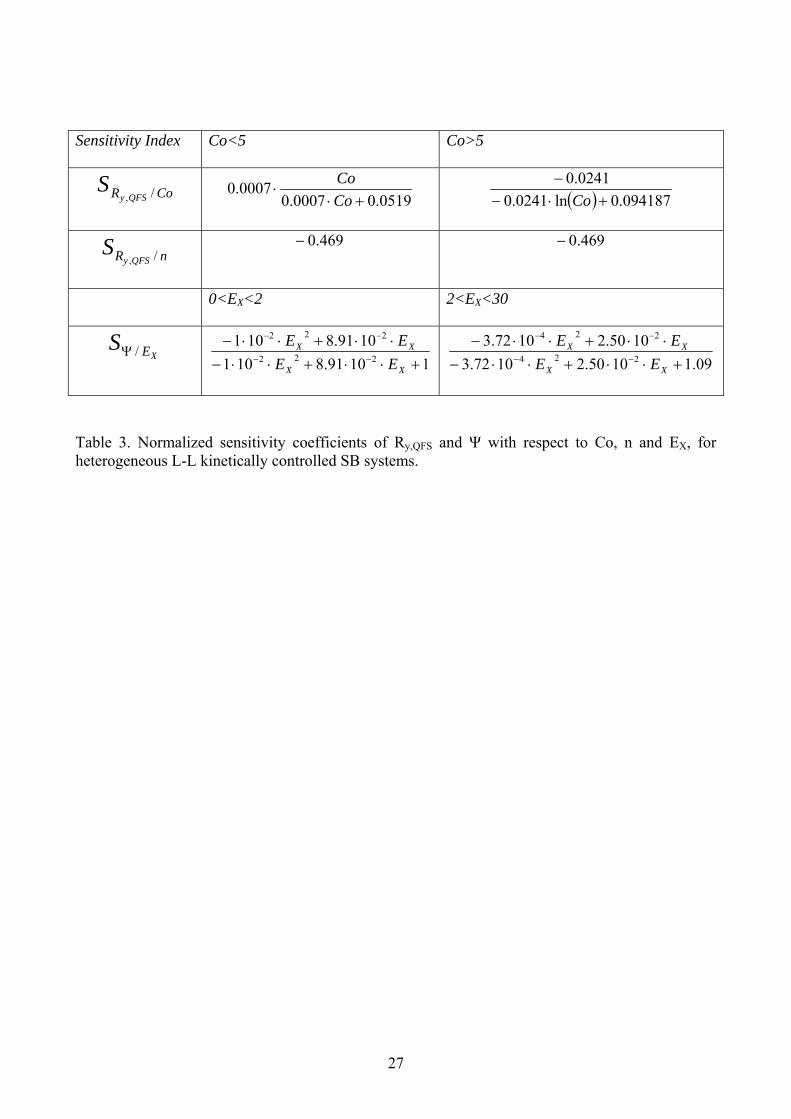
heterogeneous kinetically controlled systems. Moreover, Table 3 provides analytical expressions for
involved normalized sensitivity coefficients25.
Such criteria can be easily determined by deriving, firstly, analytical relations for normalized
sensitivity coefficients αβ
βα
αβ ∂∂⋅=S (being β a target parameter and α an operating
parameter) and, secondly, by enforcing the following constraints:
realQFSyrealy RR ,,, > (13)
MATreal Ψ<Ψ (14)
where:
realyR , is the real reactivity number value, related to the calculated (from TRC – ISC
procedure) one through the relative uncertainty, ε, and other calculated parameters of the
system (CoMIN, RH, γ, τ0, CB,0, mA, …);
realQFSyR ,, is the actual QFSyR , value, which is related to the calculated one by the relative
uncertainty, ε, and the sensitivity coefficients CoR QFSyS /,
and nR QFSyS /,
;
realΨ is the real attainable dimensionless temperature increase with respect to initial reactor
temperature, T0, which is related to the calculated one ( EMATΨ ) through the relative
uncertainty ε and through the tolerance, toll, on the MAT parameter estimated by the ARC
HWS test;
MATΨ is the ratio of maximum allowable temperature with respect to initial reactor
temperature.
Therefore, starting from the relative degree of uncertainty of a given parameter, ε, and simply
computing F1 and F2 groups, it is possible to verify whether the selected operating conditions are
18
safe or not, even when experimental parameters involved in the TRC and ISC optimization – scale-
up procedure are subjected to uncertainty.
6. Conclusions
In this work a simple and general scale-up procedure for optimally scaling-up safe operating
conditions verified at the laboratory scale for exothermic SBRs has been developed and presented.
Such a scale-up procedure not only allows to keep safe conditions but also to maximize industrial
reactor productivity.
Method developed, based on QFS operating conditions (ISC diagrams) and a generalized form of
temperature diagrams (TRC diagram), allows end users (dealing with homogeneous as well
heterogeneous slow or fast semibatch reactions, occurring in the dispersed or in the continuous
phase and even homogeneous autocatalytic systems) for a safe and easy scale-up, which also
maximizes industrial reactor productivity.
Once a set of operating conditions has been selected and experimentally validated at laboratory
scale, TRC diagram (or initial target temperature) can be used in order to identify maximum
exothermicity number at industrial (laboratory) scale with respect to the system EMAT constraint.
To such a maximum value of Ex a minimum cooling number and hence a minimum dosing time at
industrial scale corresponds. Then, the scaled-up conditions must be verified with respect to
coreactant accumulation through the Ry,QFS vs. Co curves (ISC diagrams). If industrial Ry is lower
than the corresponding Ry,QFS value, a lower EMAT value has to be assumed to which a higher
minimum dosing time will correspond. Finally, a sensitivity analysis of the optimization – scale-up
procedure with respect to all experimental parameters subjected to uncertainty should be performed
in order to classify as inherently safe the selected operating conditions.

19
Nomenclature
A heat transfer area of the reactor (associated to the jacket and/or the coil), m2
A preexponential factor, m3(n+m-1)/(kmoln+m-1·s)
C molar concentration, kmol/m3
Co ( ) ( ),0 D c P c cUA t C Vρ ε= %% , cooling number, -
PC% molar heat capacity, kJ/(kmol·K)
db,0 db at hold up of the dispersed phase approaching zero, m
D diffusivity, m2/s
Da =kn,m,RtDCB,0n+m-1, Damköhler number for (n,m) order reactions, -
E activation energy, kJ/kmol
Ex exothermicity number, eq. (6), -
EMAT =(1- toll) MAT, effective maximum allowable temperature, K
F function of the dimensionless time and conversion of B in eqs. (3) and (4), -
F1/2 security factors in checks on optimization – scale-up procedure sensitivity, -
HΔ % reaction enthalpy, kJ/kmol
kn,m reaction rate constant, m3(n+m-1)/(kmoln+m-1·s)
M Equilibrium distribution coefficient (mA=CA,c/CA,d; mB=CB,d/CB,c), -
MAT maximum allowable temperature, K
r reaction rate referred to the total liquid volume, kmol/(m3·s)
R gas constant = 8.314, kJ/(kmol·K)
RE reactivity enhancement factor in eqs. (3) and (4), -
RH = cpcdpd cc ,,~~~~ ⋅⋅ ρρ , heat capacity ratio, -
Ry reactivity number, eq. (7), -
T time, s
T temperature, K

20
U overall heat transfer coefficient, kW/(m2·K)
Subscripts and superscripts
A,B,C,D components A, B, C and D
Ad Adiabatic
B in the dispersed phase drop diameter db
C continuous phase
Cool Coolant
d dispersed phase
D dosing stream or dosing time
Eff Effective
Fast fast reaction regime
H in the heat capacity ratio RH
IND at the industrial scale
L in the liquid phase
LAB at the laboratory scale
M order of reaction respect to component B
MAT at the maximum allowable temperature
max or MAX maximum value of a quantity or at the maximum value of a quantity
n order of reaction respect to component A
MIN in Ex,MIN
QFS in Ry,QFS
R Reference
Slow slow reaction regime
toll safety parameter for MAT value: EMAT = (1-toll) MAT

21
X in the exothermicity number Ex
Y in the reactivity number Ry
0 start of the semibatch period
Greek symbols
α flag parameter in eq. (5), -
γ =E/(RTR), dimensionless activation energy, -
ε relative volume increase at the end of the semibatch period, -
ε relative error in sensitivity analysis
ζ molar conversion, -
ζ initial catalyst amount for autocatalytic reaction systems, -
ϑ =t/tD, dimensionless time, -
κ =k/kR, dimensionless reaction rate constant, -
ν stoichiometric coefficient, -
ρ% molar density, kmol/m3
τ =T/TR, dimensionless temperature, -
Δτad,0 =( ) ,0
,
r B
B c P c R
H C
C Tν ρ
−Δ
⋅
%
%%, dimensionless adiabatic temperature rise, -
ψ =(Tmax/T0)max, maximum dimensionless temperature rise, -
22
Literature cited
(1) Hugo, P.; Steinbach, J. Praxisorientierte Darstellung der Thermischen Sicherheitsgrenzen für
den Indirekt Gekühlten Semibatch-reaktor. Chem. Ing. Tech. 1985, 57, 780.
(2) Hugo, P.; Steinbach, J. A Comparison of the Limits of Safe Operation of a SBR and a CSTR.
Chem. Eng. Sci. 1986, 41, 1081.
(3) Hugo, P.; Steinbach, J.; Stoessel, F. Calculation of the Maximum Temperature in Stirred Tank
Reactors in Case of a Breakdown of Cooling. Chem. Eng. Sci. 1988, 43, 2147.
(4) Steensma, M.; Westerterp, K. R. Thermally Safe Operation of a Cooled Semi-batch Reactor.
Slow Liquid-liquid Reactions. Chem. Eng. Sci. 1988, 43, 2125.
(5) Steensma, M.; Westerterp, K. R. Thermally Safe Operation of a Semibatch Reactor for Liquid-
Liquid Reactions. Slow Reactions. Ind. Eng. Chem. Res. 1990, 29, 1259.
(6) Steensma, M.; Westerterp, K. R. Thermally Safe Operation of a Semibatch Reactor for Liquid-
liquid Reactions. Fast Reactions. Chem. Eng. Technol. 1991, 14, 367.
(7) Westerterp, K.R.; Molga, E.J. No More Runaways in Fine Chemical Reactors. Ind. Eng. Chem.
Res. 2004, 43, 4585.
(8) Westerterp, K. R.; Molga, E. J. Runaway Prevention in Liquid-liquid Semibatch Reactors.
Inzynieria Chemiczna i Procesowa 2004, 25, 2041.
(9) Westerterp, K. R.; Molga, E. J. Safety and Runaway Prevention in Batch and Semibatch
Reactors – A review. Chem. Eng. Res. Des. 2006, 84, 543.
(10) van Woezik, B. A. A.; Westerterp K. R. The Nitric Acid Oxidation of 2-octanol. A Model
Reaction for Multiple Heterogeneous Liquid-liquid Reactions. Chem. Eng. Process. 2000,
39, 521.
(11) van Woezik, B. A. A.; Westerterp K. R. Runaway Behaviour and Thermally Safe Operation of
Multiple Liquid-liquid Reactions in the Semibatch Reactor. The Nitric Acid Oxidation of 2-
octanol. Chem. Eng. Process. 2001, 41, 59.
23
(12) Maestri, F.; Rota, R. Thermally Safe Operation of Liquid-liquid Semibatch Reactors. Part I:
Single Kinetically Controlled Reactions with Arbitrary Reaction Order. Chem. Eng. Sci.
2005, 60, 3309.
(13) Maestri, F.; Rota, R. Thermally Safe Operation of Liquid-liquid Semibatch Reactors. Part II:
Single Diffusion Controlled Reactions with Arbitrary Reaction Order. Chem. Eng. Sci. 2005,
60, 5590.
(14) Maestri, F.; Rota, R. Safe and Productive Operation of Homogeneous Semibatch Reactors. I:
Development of a General Procedure. Ind. Eng. Chem. Res. 2006, 45, 8002.
(15) Maestri, F.; Rota, R. Temperature Diagrams for Preventing Decomposition or Side Reactions
in Liquid-liquid Semibatch Reactors. Chem. Eng. Sci. 2006, 61, 3068.
(16) Maestri, F.; Re Dionigi, L.; Rota, R.; Lunghi, A.; Gigante, L.; Cardillo, P. Safe and Productive
Operation of Homogeneous Semibatch Reactors. II: the Nitration of N-(2-phenoxyphenyl)
Methane Sulphonamide. Ind. Eng. Chem. Res. 2006, 45, 8014.
(17) Molga, E. J.; Lewak, M; Westerterp, K. R. Runaway Prevention in Liquid-phase Homogeneous
Semibatch Reactors. Chem. Eng. Sci. 2007, 62, 5074.
(18) Maestri, F.; Rota, R. Safe and Productive Operation of Homogeneous Semibatch Reactors
Involving Autocatalytic Reactions with Arbitrary Reaction Order. Ind. Eng. Chem. Res.
2007, 46, 5333.
(19) Alós, M. A.; Nomen, R.; Sempere, J. M.; Strozzi, F.; Zaldívar, J. M. Generalized Criteria for
Boundary Safe Conditions in Semi-batch Processes: Simulated Analysis and Experimental
Results. Chem. Eng. Process. 1998, 37, 405.
(20) Morbidelli, M.; Varma, A. A Generalized Criterion for Parametric Sensitivity: Application to
Thermal Explosion Theory. Chem. Eng. Sci. 1998, 43, 91.
(21) Strozzi, F.; Zaldívar, J. M.; Kronberg, A. E.; Westerterp, K. R. On-line Runaway Detection in
Batch Reactors Using Chaos Theory Techniques. AIChE J. 1999, 45, 2429.
24
(22) Zaldívar, J. M.; Cano, J. Alós, M.A.; Sempere, J. M.; Nomen, R.; Lister, D.; Maschio, G.;
Obertopp, T.; Gilles, E. D.; Bosch, J.; Strozzi, F. A General Criterion to Define Runaway
Limits in Chemical Reactors. J. Loss. Prev. 2003, 16, 187.
(23) Bosch, J.; Strozzi, F.; Zbilut, J. P; Zaldívar, J. M. On-line Runaway Detection in Isoperibolic
Batch and Semibatch Reactors Using the Divergence Criterion. Comp. Chem. Eng. 2004, 28,
527.
(24) Zaldívar, J. M.; Bosch, J.; Strozzi, F.; Zbilut, J. P. Early Warning Detection of Runaway
Initiation Using Non-linear Approaches. Nonlin. Sci. Num. Sim. 2005, 10, 299.
(25) Varma, A.; Morbidelli, M.; Wu, H. Parametric Sensitivity in Chemical Systems; University
Press: Cambridge, 1999.
25
Homogeneous SBRs
RE
1 n
B
A
νν
−⎛ ⎞⎜ ⎟⎝ ⎠
f ( ) ( )
( ) 1
11
n mB B
n m
ϑ ζ ζ
εϑ + −
− −
+
Heterogeneous (liquid-liquid) SBRs
Reaction in the dispersed phase, d Reaction in the continuous phase, c
REslow,c/d
1 nmBB
A
mνν
−⎛ ⎞⎜ ⎟⎝ ⎠
1 n
nBA
A
mνν
−⎛ ⎞⎜ ⎟⎝ ⎠
REfast,c/d ( )
111 1 22
,2 2,0
,0 , ,
261
d
d
nm n m
L BBB B
b A n m R
Dm C
d m kνν
−+ − − ⎡ ⎤⎛ ⎞⎢ ⎥⎜ ⎟ +⎢ ⎥⎝ ⎠ ⎣ ⎦
( )
111 1 22
,2 2,0
,0 , ,
261
c
c
nn n m
L ABA B
b A n m R
Dm C
d n kνν
−+ − − ⎡ ⎤⎛ ⎞
⎢ ⎥⎜ ⎟ +⎢ ⎥⎝ ⎠ ⎣ ⎦
fslow,c/d
( ) ( )( ) 1
1n mB B
n
ϑ ζ ζ
εϑ −
− − ( ) ( )
( )1n m
B Bn
ϑ ζ ζ
εϑ
− −
ffast,c/d ( ) ( ) ( )
( )
1 12 2 21
1 2.5 / 1
n m n
B Bϑ ζ ζ εϑεϑ εϑ
+−− −
+ + ( ) ( ) ( )
( )
1 12 2 21
1 2.5 / 1
n m n
B Bϑ ζ ζ εϑεϑ εϑ
+ −
− −+ +
Table 1. Expressions of the reactivity enhancement factor, RE, and of the function, f, for homogeneous and heterogeneous (liquid-liquid) SBRs in which slow or fast reactions take place in the dispersed or continuous phase12-14.
26
Parameters: Checks
(UA)0 ( ) ( ) ( )[ ] ( )calcMINQFSyHcalcMIN
HcalcMINCoRcalcMINDcalcy CoR
RCo
RCoStR QFSy
,,,
,/,,,
11, ⋅
+
+⋅−⋅⋅−>
εε
Δτad,0 ( ) ( )
XE
calcMINQFSycalcMINDcalcy
Stolltoll
CoRtR
/
,,,,,
11 ψ
ε ⋅−
<
>
Γ ( ) ( )
XE
calcMINQFSycool
calccalcMINDcalcy
Stolltoll
CoRtR
/
,,,,,
11
exp
ψ
ε
τγ
ε
⋅−
<
⋅⎟⎟⎠
⎞⎜⎜⎝
⎛⋅>
A ( ) ( )calcMINQFSycalcMINDcalcy CoRtR ,,,,, 11
⋅−
>ε
N ( ) ( ) ( )calcMINQFSynR
n
AB
ABcalcMINDcalcy CoRSmCtR
QFSy
calc
,,/0,,,, ,1 ⋅−⋅⎟⎟
⎠
⎞⎜⎜⎝
⎛⋅⋅>
⋅
ενν
ε
Table 2. Checks, for heterogeneous L-L kinetically controlled SB systems, on experimental parameters subjected to a relative degree of uncertainty ε and a relative tolerance on MAT value. For each parameter, β, the relative uncertainty ε bounds the range where the real value is expected to lie in: ( ) ( )εββεβ +≤≤− 11 calcrealcalc . Conversely, toll has been introduced to prevent undesirable effects due to errors in MAT estimation: its use lowers the measured value of MAT to that one used in the optimization – scale-up procedure (EMAT=MAT(1-toll)).
27
Sensitivity Index Co<5 Co>5
CoR QFSyS /, 0519.00007.0
0007.0+⋅
⋅CoCo ( ) 094187.0ln0241.0
0241.0+⋅−
−Co
nR QFSyS /,
469.0− 469.0−
0<EX<2 2<EX<30
XES /Ψ 11091.8101
1091.8101222
222
+⋅⋅+⋅⋅−⋅⋅+⋅⋅−
−−
−−
XX
XX
EEEE
09.11050.21072.31050.21072.3224
224
+⋅⋅+⋅⋅−⋅⋅+⋅⋅−
−−
−−
XX
XX
EEEE
Table 3. Normalized sensitivity coefficients of Ry,QFS and Ψ with respect to Co, n and EX, for heterogeneous L-L kinetically controlled SB systems.

28
Captions to the figures.
Figure 1. Boundary diagram for the identification of excessive accumulation operating conditions in exothermic SBRs in which a reaction of the form (1) is carried out.
Figure 2. Inherently safe conditions of heterogeneous (liquid-liquid) SBRs in which single reactions of the form (1) with n=0.5 and n=1 occur. Influence of the cooling number, Co, on the Ry,QFS parameter. RH=1. 0.02<νA Da RE<20; 0.05<ε<0.6; 30<γ<45; 0.1<Δτad,0<0.7. A) slow reaction occurring in the dispersed phase; B) slow reaction occurring in the continuous phase; C) fast reaction occurring in the dispersed phase; D) fast reaction occurring in the continuous phase.
Figure 3. Inherently safe conditions of homogeneous SBRs in which single reactions of the form (1) with n=1 and n=2 occur. Influence of the cooling number, Co, on the Ry,QFS parameter. RH=1. 0.02<νA Da RE<20; 0.05<ε<0.6; 30<γ<45; 0.1<Δτad,0<0.7.
Figure 4. Inherently safe conditions of SBRs in which a single exothermic reaction is carried out. Influence of the exothermicity number, Ex, on the maximum temperature rise ψ=(Tmax/T0)max and graphical identification of the maximum exothermicity number, Ex,MAX, during the scale-up process. RH=1. 2<Co<80; 0.75<n<2; m=1; 0.02<Da <20; 0.05<ε<0.6; 30<γ<45; 0.1<Δτad,0<0.7; Ry>Ry,QFS.
Figure 5. Flow diagram for the selection of safe operating conditions at the laboratory scale and for their optimum sale-up to the industrial reactor scale.
29
Figure 1. Boundary diagram for the identification of excessive accumulation operating conditions in exothermic SBRs in which a reaction of the form (1) is carried out.

30

31
32

33
Figure 2. Inherently safe conditions of heterogeneous (liquid-liquid) SBRs in which single reactions of the form (1) with n=0.5 and n=1 occur. Influence of the cooling number, Co, on the Ry,QFS parameter. RH=1. 0.02<νA Da RE<20; 0.05<ε<0.6; 30<γ<45; 0.1<Δτad,0<0.7. A) slow reaction occurring in the dispersed phase; B) slow reaction occurring in the continuous phase; C) fast reaction occurring in the dispersed phase; D) fast reaction occurring in the continuous phase.

34
Figure 3. Inherently safe conditions of homogeneous SBRs in which single reactions of the form (1) with n=1 and n=2 occur. Influence of the cooling number, Co, on the Ry,QFS parameter. RH=1. 0.02<νA Da RE<20; 0.05<ε<0.6; 30<γ<45; 0.1<Δτad,0<0.7.
35
Figure 4. Inherently safe conditions of SBRs in which a single exothermic reaction is carried out. Influence of the exothermicity number, Ex, on the maximum temperature rise ψ=(Tmax/T0)max and graphical identification of the maximum exothermicity number, Ex,MAX, during the scale-up process. RH=1. 2<Co<80; 0.75<n<2; m=1; 0.02<Da <20; 0.05<ε<0.6; 30<γ<45; 0.1<Δτad,0<0.7; Ry>Ry,QFS.

36
Figure 5. Flow diagram for the selection of safe operating conditions at the laboratory scale and for their optimum sale-up to the industrial reactor scale.
LABORATORY SCALE
YES
YES
YES
INDUSTRIAL SCALE
Screening tests (DSC, ARC) to estimate ΨMAT. RC1 (or PHI-TEC II)
tests to estimate T0 and thermo-kinetic parameters.
Assume a safety factor (toll) and estimate ΨEMAT= ΨMAT(1- toll)
Through TRC diagram, estimate: Ex,MAX ⇒ CoMIN and tD, MIN,RC1
Through ISC diagram, verify that: Ry,RC1≥Ry,QFS
Through TRC diagram, estimate: Ex,MAX ⇒ CoMIN and tD, MIN,ind
Through ISC diagram, verify that: Ry,ind≥Ry,QFS
STOP
Decrease ΨEMAT
NO
NO
Experimental validation of thermo-kinetic parameters and
tD,RC1,MIN with an RC1 test
START
Decrease ΨEMAT
NO