a simulation application for visitor … · a simulation application for visitor circulation in...
TRANSCRIPT
A SIMULATION APPLICATION FOR VISITOR CIRCULATION
IN EXHIBITION ENVIRONMENTS
A THESIS SUBMITTED TO THE DEPARTMENT OF
INTERIOR ARCHITECTURE AND ENVIRONMENTAL DESIGN AND THE INSTITUTE
OF ECONOMICS AND SOCIAL SCIENCES OF BİLKENT UNIVERSITY
IN PARTIAL FULFILLMENT OF THE REQUIREMENTS FOR THE DEGREE OF
MASTER OF FINE ARTS
By Ömer Kutay Güler
May, 2009
ii
I certify that I have read this thesis and that in my opinion it is fully adequate, in scope and in quality, as a thesis for the degree of Master of Fine Arts.
Assoc. Prof. Dr. Halime Demirkan (Principal Advisor)
I certify that I have read this thesis and that in my opinion it is fully adequate, in scope and in quality, as a thesis for the degree of Master of Fine Arts.
Asst. Prof. Dr. Burcu Şenyapılı Özcan
I certify that I have read this thesis and that in my opinion it is fully adequate, in scope and in quality, as a thesis for the degree of Master of Fine Arts.
Asst. Prof. Dr. Hazım Murat Karamüftüoğlu
Approved by the Institute of Fine Arts
Prof. Dr. Bülent Özgüç, Director of the Institute of Fine Arts
iii
ABSTRACT
A SIMULATION APPLICATION FOR VISITOR CIRCULATION IN EXHIBITION ENVIRONMENTS
Ömer Kutay Güler
MFA in Interior Architecture and Environmental Design
Supervisor: Assoc. Prof. Dr. Halime Demirkan
May, 2009.
The layout of the exhibit elements in an exhibition environment affects the visitor behavior
whose receptivity and time are limited. This study proposes a simulation application for visitor
circulation in exhibition environments in order to increase the number of visual contacts and
active engagements received by each exhibit element. Consequently, the interior designer
delivers an increase in the quality of the exhibition environment. The calculations of the
proposed simulation application are based on the data that are collected from the previous
literature related to visitor and exhibit element characteristics. The parameters of visitor
characteristics involve the interest level, visit plans and fatigue level of visitors. The parameters
of exhibit element characteristics involve the physical dimensions, viewing distance, attraction
index and holding power of exhibit elements. In order to assess the functionality of the proposed
simulation application, an example simulation of an exhibition environment is conducted. In the
simulation of an exhibition environment, while all the input parameters are kept constant, the
change in the layout of the exhibit elements resulted in different visitor circulation patterns and
different visual contact and active engagement outcomes for each exhibit element. Observing
and evaluating the various outputs of the simulation application that involve changes in the
layout of exhibit elements might help a designer in judging his/her design decisions more clearly.
Additionally, comparing the simulation application outputs of design alternatives might help the
designer to prevent possible design errors in his/her exhibition layout.
Key words : Behavior simulation, Exhibition design, Exhibit elements, Visitor behavior, Visitor circulation.
iv
ÖZET
SERGİ MEKANLARINDA ZİYARETÇİ DOLAŞIMI İÇİN BİR SİMULASYON UYGULAMASI
Ömer Kutay Güler
İç Mimarlık ve Çevre Tasarımı Bölümü, Yüksek Lisans
Danışman: Doç. Dr. Halime Demirkan
Mayıs, 2009.
Sergi elemanlarının bir mekan içerisindeki yerleşimi, zamanı ve algı gücü sınırlı olan
ziyaretçilerin davranışını etkilemektedir. Bu çalışma, sergi elemanlarının görsel temas ve aktif
incelenme sayılarını artırmak amacıyla sergi mekanlarında ziyaretçi dolaşımı için bir simulasyon
uygulaması önermektedir. Sonuç olarak iç mimar, tasarladığı sergi mekanının kalitesinde bir
artış sağlayabilmektedir. Önerilen simulasyon uygulamasının hesaplamaları ziyaretçi ve sergi
elemanları ile ilgili daha once yapılmış çalışmalar üzerine kurulmuştur. Ziyaretçi özellikleri ilgi
düzeyi, ziyaret planı ve yorgunluk düzeyi ile ilgili verileri kapsar. Sergi elemanları özellikleri
fiziksel boyutlar, izleme uzaklığı, çekicilik katsayısı ve izlenme gücü ile ilgili verileri kapsar.
Önerilen simulasyon uygulamasının işlevselliğini değerlendirmek için örnek bir sergi mekanı
simulasyonu düzenlenmiştir. Bu sergi mekanı simulasyonunda, tüm girdi değerleri sabit
tutulmuştur. Sergi elemanlarının yerleşimindeki değişiklikler farklı ziyaretçi dolaşım yolları,
farklı görsel temas ve aktif incelenme çıktı değerleri elde edilmesine sebep olmuştur. Sergi
elemanları düzeninde değişiklik içeren önerilen simulasyon uygulaması çıktı değerlerinin
gözlemlenmesi ve değerlendirilmesi tasarımcıya tasarımlarını daha açık bir biçimde yargılama
olanağı sağlayabilir. Ek olarak, değişik tasarım alternatiflerinin önerilen simulasyon uygulaması
çıktı değerlerinin karşılaştırılması, tasarımcının hazırladığı sergi yerleşimindeki tasarım
hatalarının oluşumunun engellemesine yardımcı olabilir.
Anahtar Sözcükler : Davranış simulasyonu, Sergi elemanları, Sergi tasarımı, Ziyaretçi davranışı, Ziyaretçi dolaşımı.

v
ACKNOWLEDGEMENTS I would like to thank my advisor Assoc. Prof. Halime Demirkan for her invaluable supervision,
guidance and support throughout the preparation of this thesis. Being her student and studying
with her has been a very educational and enjoyable experience.
I want to express my gratitude to Asst. Prof. Dr. Hazım Murat Karamüftüoğlu for his invaluable
suggestions and support.
Lastly, I want to thank my family and friends for their patience, love and understanding.
vi
TABLE OF CONTENTS
SIGNATURE PAGE ...................................................................................................... ii
ABSTRACT ................................................................................................................. iii
ÖZET ............................................................................................................................... iv
ACKNOWLEDGMENTS .......................................................................................... v
TABLE OF CONTENTS ............................................................................................... vi
LIST OF FIGURES ........................................................................................................ ix
LIST OF TABLES .......................................................................................................... x
1. INTRODUCTION ............................................................................................ 1
1.1. Aim of the Study ......................................................................................... 2
1.2. Structure of the Thesis .............................................................................. 3
2. VISITOR AND ENVIRONMENT INDICATORS ....................................... 5
2.1. The Visitor Indicators ............................................................................. 6
2.1.1. Visitor Characteristics ............................................................... 6
2.1.1.1. Visitor Profiles............................................................ 7
2.1.1.2. Visitor Motivation ...................................................... 9
2.1.1.3. Visit Plans ................................................................... 11
2.1.2. Visitor Behavior Patterns .......................................................... 12
2.1.2.1. Visitor Attention ......................................................... 13
2.1.2.2. Visitor Orientation ...................................................... 13
2.1.2.3. The Exploratory Movement ....................................... 15
2.1.2.4. The Visual Contact and the Active Engagement ....... 17
vii
2.2. The Environment Indicators .................................................................... 18
2.2.1. The Exhibition Space Indicators ............................................... 18
2.2.1.1. The Exhibition Layout ............................................... 18
2.2.1.2. The Circulation Paths ................................................. 20
2.2.2. The Exhibit Element Indicators ................................................. 21
2.2.2.1. The Attraction Power ................................................. 21
2.2.2.2. The Holding Time ...................................................... 24
3. FRAMEWORK OF THE SIMULATION ............................................................ 26
3.1. The User Domain ................................................................................... 28
3.1.1. The 3d Viewing Utilities ........................................................... 28
3.1.2. The 3d Modeling Utilities ......................................................... 30
3.1.3. The Simulation Utilities ............................................................ 32
3.2. The Information Domain........................................................................ 34
3.2.1. Inputs ......................................................................................... 37
3.2.1.1. Visitor Parameters ...................................................... 37
3.2.1.2. Exhibit Element Parameters ....................................... 38
3.2.1.3. Exhibition Space Parameters ...................................... 40
3.2.1.4. Simulation Parameters ................................................ 42
3.2.1.5. Internally Generated Parameters ................................ 42
3.2.2. Outputs ....................................................................................... 44
3.2.2.1. Output Data of the Exhibition Space ......................... 44
3.2.2.2. Output Data of the Visitors ........................................ 45
3.2.2.3. Output Data of the Exhibit Elements ......................... 46
3.3. The Process Domain .............................................................................. 48
3.3.1. The Visitor Generation Process ................................................. 48
3.3.2. The Visual Contact Process ....................................................... 49
3.3.3. The Visitor Movement Process ................................................. 50
3.3.4. The Active Engagement Process ............................................... 50
3.3.5. The Exiting Process ................................................................... 51
viii
4. SIMULATION OF AN EXHIBITION ENVIRONMENT ................................. 53
4.1. The Input Parameters ............................................................................. 54
4.1.1. The Virtual Exhibition Space .................................................... 54
4.1.2. The Exhibit Element Parameters ............................................... 56
4.1.3 The Visitor and Simulation Parameters ..................................... 56
4.2. The Exhibition Environment A .............................................................. 57
4.2.1. The Layout ................................................................................. 57
4.2.2. The Simulation Outputs............................................................. 58
4.3. The Exhibition Environment B .............................................................. 60
4.3.1. The Layout ................................................................................. 60
4.3.2. The Simulation Outputs............................................................. 60
4.4. Discussion .............................................................................................. 63
5. CONCLUSION ......................................................................................................... 66
REFERENCES ............................................................................................................... 68
APPENDIX A ................................................................................................................. 75
APPENDIX B ................................................................................................................. 83
ix
LIST OF FIGURES
Figure 3.1. The Domain Elements of the Proposed Simulation ................................. 27
Figure 3.2. The 3d Studio Max Interface. ................................................................... 29
Figure 3.3. The ‘Create Tab’ in the Command Panel ................................................. 30
Figure 3.4. ‘The ‘Modify Tab’ in the Command Panel and the Effect of the Bend
Modifier on a Rectangular Prism ............................................................. 31
Figure 3.5. The Scale Transformation Tool ................................................................ 31
Figure 3.6. The Simulation Utilities Toolbar. ............................................................. 32
Figure 3.7. Exhibit Element Tool Dialog .................................................................... 33
Figure 3.8. The Simulation Tool Dialog ..................................................................... 34
Figure 3.9. The Exhibition Space Output Parameters Dialog. ................................... 45
Figure 3.10. The Visitor Output Parameters Dialog.. ................................................. 46
Figure 3.11. The Exhibit Element Output Parameters Dialog.. ................................. 48
Figure 4.1. Plan and Dimensions of the Virtual Exhibition Space ............................ 55
Figure 4.2. The 3d Model of the Virtual Exhibition Space in 3ds Max ..................... 55
Figure 4.3. The Exhibition Layout for the Exhibition Environment A ...................... 57
Figure 4.4. A Screenshot From the Exhibition Environment A ................................. 59
Figure 4.5. The Exhibition Layout for the Exhibition Environment B ...................... 60
Figure 4.6. A Screenshot From the Exhibition Environment B ................................. 62
Figure 4.7. The Comparison of Visual Contacts for Both Exhibition
Environments ............................................................................................ 64
Figure 4.8. The Comparison of Active Engagements for Both Exhibition
Environments ............................................................................................ 65
x
LIST OF TABLES
Table 3.1. The Input Parameters, Their Explanations and Values ............................. 35
Table 3.2. The Output Parameters, Their Explanations and Values .......................... 36
Table 4.1. The Exhibit Element Input Parameters ...................................................... 56
Table 4.2. The Visitor and Simulation Parameters ..................................................... 57
Table 4.3. The Simulation Output Parameters Regarding the Exhibition
Environment A…………………………………………………………..58
Table 4.4. The Simulation Output Parameters Regarding the Exhibit Elements in
Exhibition Environment A……………………………………………….59
Table 4.5. The Simulation Output Parameters Regarding the Exhibition
Environment B…………………………………………………………...61
Table 4.6. The Simulation Output Parameters Regarding the Exhibit Elements in
Exhibition Environment B……………………………………………….62
Table 4.7. The Simulation Output Parameters Comparison Table ............................. 63
1
1. INTRODUCTION
Museum and gallery administrators have long been concerned to know their visitors.
Starting from the early 20th century, many studies related to visiting times and visitor
behavior were conducted (Loomis, 1987; Screven, 1976). The research has revealed that
the key factors in visiting experience are such as: age, gender, education, income,
specific interests and previous museum experience (Soren, 1999). These factors play a
critical role in understanding of visitors and their circulation patterns in exhibition
environments. Besides the preferences and profile of a visitor, the design and planning
of an exhibition environment affect the circulation pattern of a visitor. In the previous
studies, the researchers stated that the proper planning of an exhibition environment
plays a crucial role in visitor satisfaction level (Bitgood and Loomis, 1993; Bitgood,
Patterson and Benefield, 1988).
Although an exhibition design process mostly relies on artistic preference and personal
judgment (Eckel and Beckhaus, 2001), it also requires previously acquired knowledge
of visitor needs and expectations (Dean, 1994; Eckel and Beckhaus, 2001). There are
many ways to prevent false assumptions and direct the designer’s attention on visitor
needs and expectations. One way is visually aiding the designer with sketches or
cardboard models (Neal, 1987). However, the resulting visual aid may still contain
design deficiencies, since such models and sketches can provide only limited feedback.
2
Aiding the designer during design process is universally accepted and simulation
applications have been aiding the designers on different design problems for decades
(Kicinger, Arciszewski and De Jong, 2005). There are researches on simulation
applications that use exhibition design as implementation cases (Jun, Sung and Choi,
2006; Saunders and Gero, 2004). However, these studies do not intend to aid the
designer during an exhibition design process. In order to fill this gap in the literature,
this thesis tries to elaborate on the following question: “Can simulating visitor
circulation behavior in an exhibition environment help the designer during the layout
planning process?”
1.1. Aim of the Study
The complexity of the design process may induce many errors as the product advances
(Lawson,1997). Simulation applications are one way to detect these errors and improve
the quality of the design. There is a collection of statistical data regarding visitors and
their behavior in exhibition spaces (Bollo and Pozollo, 2005; Serrell, 1997). It is
possible to benefit from this statistical data with a simulation application.
The main purpose of this thesis is to propose a simulation application for visitor
circulation in exhibition environments. The proposed simulation application is based on
the collected statistical data and observations published in the previous researches. It is
believed that by implementing the data collected in the previous researches to a
simulation application, the designer will be able to integrate the academic knowledge
into the his/her design process.
3
The proposed simulation application is expected to be helpful to design professionals in
designing exhibition layouts. Also it is expected that this research will shed light to
further research on adapting simulation applications into the early phases of similar
interior design processes.
1.2. The Structure of the Thesis
This thesis is composed of five chapters. The first chapter is an introduction to the
thesis. In this chapter the difficulties of layout planning and the previous visitor research
is briefly mentioned. The aim of the thesis is explained and the proposed simulation
application is briefly introduced.
In the second chapter, the general exhibition dynamics are explained. In order to define
the operation of the simulation application, there is a need to understand the basics of
visitor behavior and the exhibition environment. Visitor profiles, expectations, needs
and motivations are explained as the visitor indicators. Major gallery types, physical and
mental plans, attraction power and viewing times of exhibit elements are explained as
the exhibition indicators.
In the third chapter, the framework of the simulation application and the
implementation of the literature data are explained. The user interface, the input and
output parameters and the simulation processes of the simulation application are
explained in detail.

4
In the fourth chapter, the example design problem experiment is explained. The aim of
the design problem experiment, the preparation and simulation processes of exhibition
environments are explained. The comparison of the simulation outputs of the exhibition
environments are made and the results are evaluated.
In the fifth chapter conclusions about the study are made. Limitations of the study are
discussed and suggestions for further research are proposed.
5
2. VISITOR AND ENVIRONMENT INDICATORS
Visitor behavior in an exhibition space is influenced by many factors that can be
resulting from environmental conditions or visitors themselves. These factors are listed
and thoroughly analyzed in the previous researches (Bitgood and Loomis, 1993;
Bitgood, Patterson and Benefield, 1988; Gorman, 2008; Loomis, 1987; Screven, 1976;
Serrell, 1996; Soren, 1999). In this thesis, data regarding visitor and environment
characteristics are based on the findings of the previous researches.
In an exhibition environment, visitors and exhibit elements have different functions and
roles, therefore, show distinct characteristics (Bollo and Pozzolo, 2005). The role of a
visitor in an exhibition environment directs him/her to explore the exhibition space. This
behavior renders the visitor as the active element of the exhibition environment. On the
other hand, exhibit elements and the exhibition space influence the behavior of visitors,
thus, becoming the passive elements of the exhibition environment (Bicknell and Mann,
1993; Bitgood, 2002; Bitgood et al., 1991; McManus, 1991; Peponis et al., 2004).
Within the scope of the above statements, the literature is analyzed under two sections.
These sections are named as ‘the visitor indicators’ and ‘the environment indicators’ in
order to explore visitor and environment characteristics, respectively.
In ‘the visitor indicators’ section, literature related to the visitor behavior in an
exhibition environment are explored. This section is composed of two sub-sections. The
6
first sub-section is named as ‘visitor characteristics’. In this sub-section, visitor profiles,
the concept of identity and the effects of identity on the visitor needs and motivations
are explored. The second sub-section is named as ‘visitor behavior patterns’. In this sub-
section, the effects of visitor motivation and needs on the visitor attention, orientation,
movement, and viewing times are explored.
In ‘the environment indicators’ section, literature related to exhibition types, exhibition
layouts and properties of exhibit elements are explored. This section is divided into two
sub-sections. The first sub-section named as ‘the exhibition space indicators’ explores
the literature related to the layout and visitor circulation in the exhibition space. The
second sub-section named as ‘the exhibit element indicators’ explores the literature
related to the influences on the attraction power and the holding time properties of an
exhibit element.
2.1. The Visitor Indicators
2.1.1. Visitor Characteristics
Various researchers stated that, visitors satisfaction should be the primary goal of the
designer (Bitgood, 2002; Bitgood and Loomis, 1993; Bitgood, Patterson and Benefield,
1988; D’agostino, Loomis and Webb, 1991; Kelly, 2002a; Kelly, 2002b, Kelly, 2002c).
The satisfaction level of a visitor can be assessed by the degree of his/her expectations
and needs are met. In this section, visitor characteristics involving the effects of visitor
profiles, visitor motivation and visit plans are explored.
7
2.1.1.1. Visitor Profiles
Visitor expectations and needs are closely related to the visitor profiles. Age, gender,
educational level, cultural profile, and leisure values are all important issues in
understanding a visitor’s characteristics (Andrews and Asia, 1979; Bitgood, 2002;
Davies, 1994; McManus, 1991; Sparacino, 2002). Understanding the characteristics of a
visitor’s profile is important for understanding his/her behavioral patterns.
Researchers have identified numerous visitor profiles according to different
characteristics of visitors. Several visitor groups are identified by Hooper-Greenhill
(1999) according to the visitors’ physical and social characteristics. These visitor groups
are families, school parties, other organize educational groups, leisure learners, tourists,
the elderly, and people with visual auditory, mobility or learning disabilities. Dean
(1994) identified visitor groups under three categories according to their attention and
viewing times in the exhibition space:
1- Casual visitors involve people who move through the exhibition space too
quickly without interacting with the exhibit elements too much. Dean (1994) also
defined this group as ‘people who rush’.
2- Cursory visitors wander around the exhibition space however they are more
responsive to the stimulus of the exhibit elements and if any exhibit element is
targeted, a close exploration might be observed. Dean (1994) also defined this
group as ‘people who stroll’.
8
3- Learners spend the most time in galleries closely examining exhibit elements.
This group is considered a minority by Dean (1994).
Other researchers have grouped visitor profiles into three categories similar to the one
proposed by Dean (1994). Serrell (1996) categorized visitor profiles as ‘transient’,
‘sampler’ and ‘methodological’ viewers. These three groups proposed by Serrell (1996)
are very similar in behavioral tendencies to ‘the casual visitors’, ‘the cursory visitors’
and ‘the learners’ proposed by Dean (1994). Serrell (1996) suggested that grouping
visitors according to the time they spent in exhibitions is more appropriate. Doering
(1999) also classified visitors into three categories as ‘strangers’, ‘guests’ and ‘clients’
according to the approach of the museum to its visitors. Doering’s (1999) visitor profiles
are shaped by the museums approach to their visitor’s but they show similar properties
to Serrell’s (1996) and Dean’s (1994) visitor profiles.
Besides the visitors’ profiles that are shaped according to their physical and behavioral
characteristics, their visiting patterns as a social group or an individual contribute to the
complexity of interactions in the exhibition environment. McManus (1991) described
the single visitors’ behavior as brief visits to exhibit elements, as they try to understand
exhibit elements while showing special interest to labels.
The way people see themselves and their expectations about the museum experience,
which is also defined as the identity of the visitor by Leinhardt and Crowley (1998),
affect the overall behavior of visitors in an exhibition. A visitor’s profile and his/her
9
identity affect the motivation and interests that is a result of his/her exhibition
experience. Identity is also claimed by Leinhardt and Crowley (1998) as a filter through
which museum experiences are interpreted.
2.1.1.2. Visitor Motivation
Exhibition dynamics are bound to a simple rule regarding the visitor: a visitor has to
move and stop in order to be able to see specific exhibit elements in an exhibition space
(Klein, 1993). There are three specific actions performed by the visitor in an exhibition
environment: exploration, visual contact and viewing (Peponis et al., 2004). The
continuity of exploration, visual contact and viewing depend on the cues that generate
interest for the visitor. As Bicknell and Mann (1993) stated, visitors like to orientate
themselves in the exhibition space but they also continue this orientation in order to find
some cues to make them stop. This phenomenon is also explained by Graf (1994) as
behaving in a mass-media manner and shopping around until something useful comes.
The continuity between exploration, visual contact and viewing in the exhibition space
can also be understood with the ‘flow’ state defined by Csikszentmihalyi and
Hermanson (1995) and Csikszentmihalyi and Robinson (1991). During the ‘flow’ state
people are motivated by the activity itself. Several researchers defined three general
rules in order to create motivation as follows: the activity should have clear and
appropriate rules, it should provide immediate and unambiguous feedback and it should
require skills that are matching with the visitors’ abilities (Alt and Shaw, 1984; Boisvert
and Slez, 1995; Borun and Dritsas, 1997; Csikszentmihalyi and Hermanson, 1995; Deci
10
and Ryan, 1985; Koran et al., 1984, 1986; Melton, 1972; Peart, 1984; Schiefele and
Rheinberg, 1997).
Another view on visitor motivation is the ‘general value principle’ defined by Bitgood
(2005; 2006). This principle argues that the value of an experience is usually
unconsciously calculated by the visitor as a ratio between the benefit and the cost of the
experience. Viewing an exhibit element is strongly interrelated to the value of the
experience of viewing it. In order to achieve a ‘high value’, the exhibit element should
be interesting enough and also the time and effort costs should be low. Since exhibit
elements are passive and their qualities cannot be immediately changed, visitors adjust
the value of the exhibit element by reducing the cost of time and effort spend for it. This
behavior reflects to the exhibition environment as visitors spending less effort in
viewing the exhibit elements.
Visitors need to be motivated in order to keep their attention on exhibit elements
(Bitgood, 2002). However, people have a limited attention and the attention decreases
with mental and physical effort. As Bitgood (2002) explained “The rate of depletion and
renewal is dependent upon the total amount of effort expended, the amount of cognitive
emotional arousal and the amount of time” (p. 13). During the course of a visit the
familiarity and comfort levels of a visitor also change with time and this level of
comfort and familiarity may cause the visitor to respond differently to the exhibit
elements (Falk, 1993).
11
2.1.1.3. Visitor Plans
Visitors arrive an exhibition with expectations depending on the experiences of their
previous exhibition visits (Falk and Dierking, 1992; Leinhardt and Crowley, 1998). The
circulation of the visitor through the exhibition space may depend on the expectations
and experiences that constitute ‘the pre-visit agenda’ (Hooper-Greenhill and Moussouri,
2001). Hooper-Greenhill and Moussouri (2001) defined three circulation plans that act
as a pre-visit agenda for the visitor:
1- Open plans may include first time or occasional visitors, who browse through
the exhibition trying to see everything. The attraction levels of individual exhibit
elements pose an important variable for this group of visitors.
2- Flexible plans include people who have been to the exhibition space before and
already familiar with the environment. This group of visitors has a specific plan
about what to see and do inside the exhibition space.
3- Fixed plans include visitors whom are frequent visitors of the exhibition and they
also visit other exhibitions frequently. Their visit is planned in advance however
they might still change their circulation plans during the visiting period.
A research conducted by Falk, Moussouri and Coulson (as cited in Hooper-Greenhill
and Moussouri, 2001) argued that a visitor with a ‘fixed plan’ has an ability to
comprehend the subject of the exhibition better and also engage in longer visits then
visitors with an ‘open plan’ or ‘flexible plan’ (p. 10).
12
2.1.2. Visitor Behavior Patterns
The goal of an exhibition layout is to get exhibit elements viewed by visitors. The
exhibit elements are often stationary. Therefore, in order the exhibit elements to be
viewed, the visitors are needed to be active and make contact with the exhibit elements
(Choi, 1999; Peponis et al., 2004). Depending on the visitor’s expectations and physical
abilities, every visitor develops their own attention and movement characteristics.
Although these characteristics vary between individuals, some are common among all
visitors (Loomis, 1987; Screven, 1976).
Rounds (2004) suggested that a visitor’s movement in the exhibition space can be
understood with the following three rules: ‘search rules’ allow the visitor to find
interesting items, ‘attention rules’ tell the visitor which exhibit element to focus on and
‘quit rules’ tell the visitor when to give up on an exhibit element, an area or the
exhibition. Peponis et al. (2004) suggested that the movement of a visitor can be
understood with three behavioral states which are exploratory movement, visual contact
and active engagement. In this thesis, relating to the studies of Peponis et al. (2004) and
Rounds (2004), the visitors’ exploration and contact pattern inside the exhibition space
is explained with the following five parameters: visitor attention, visitor orientation,
exploratory movement, visual contact and active engagement. These five parameters can
be considered as distinct action phases of a visitor during the course of a visit. Visitors
will perform these action phases which will make a cycle between each exhibit element
until the visitor exits the exhibition.
13
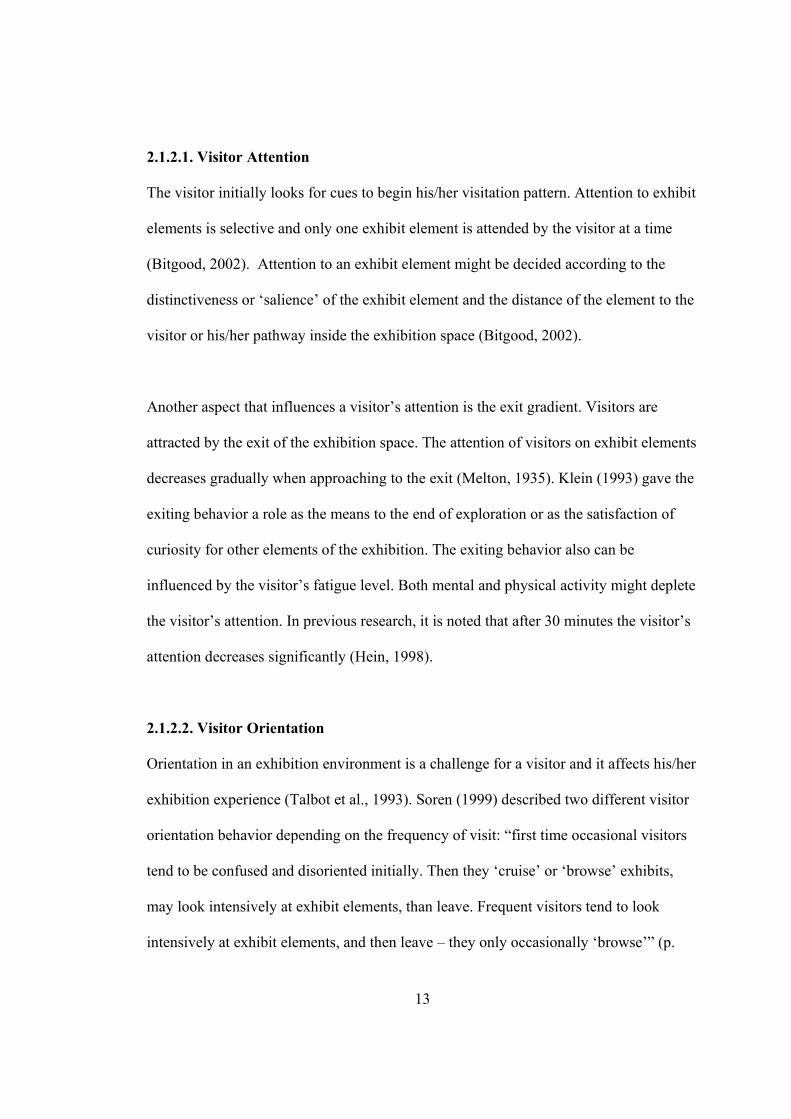
2.1.2.1. Visitor Attention
The visitor initially looks for cues to begin his/her visitation pattern. Attention to exhibit
elements is selective and only one exhibit element is attended by the visitor at a time
(Bitgood, 2002). Attention to an exhibit element might be decided according to the
distinctiveness or ‘salience’ of the exhibit element and the distance of the element to the
visitor or his/her pathway inside the exhibition space (Bitgood, 2002).
Another aspect that influences a visitor’s attention is the exit gradient. Visitors are
attracted by the exit of the exhibition space. The attention of visitors on exhibit elements
decreases gradually when approaching to the exit (Melton, 1935). Klein (1993) gave the
exiting behavior a role as the means to the end of exploration or as the satisfaction of
curiosity for other elements of the exhibition. The exiting behavior also can be
influenced by the visitor’s fatigue level. Both mental and physical activity might deplete
the visitor’s attention. In previous research, it is noted that after 30 minutes the visitor’s
attention decreases significantly (Hein, 1998).
2.1.2.2. Visitor Orientation
Orientation in an exhibition environment is a challenge for a visitor and it affects his/her
exhibition experience (Talbot et al., 1993). Soren (1999) described two different visitor
orientation behavior depending on the frequency of visit: “first time occasional visitors
tend to be confused and disoriented initially. Then they ‘cruise’ or ‘browse’ exhibits,
may look intensively at exhibit elements, than leave. Frequent visitors tend to look
intensively at exhibit elements, and then leave – they only occasionally ‘browse’” (p.
14
58). This statement points out that having a visiting experience of the exhibition layout
will help the user to create a visit plan in his/her mind. This visit plan may lead to a
more unified visitation pattern. On the other hand the lack of this plan may result in
chaotic movement patterns.
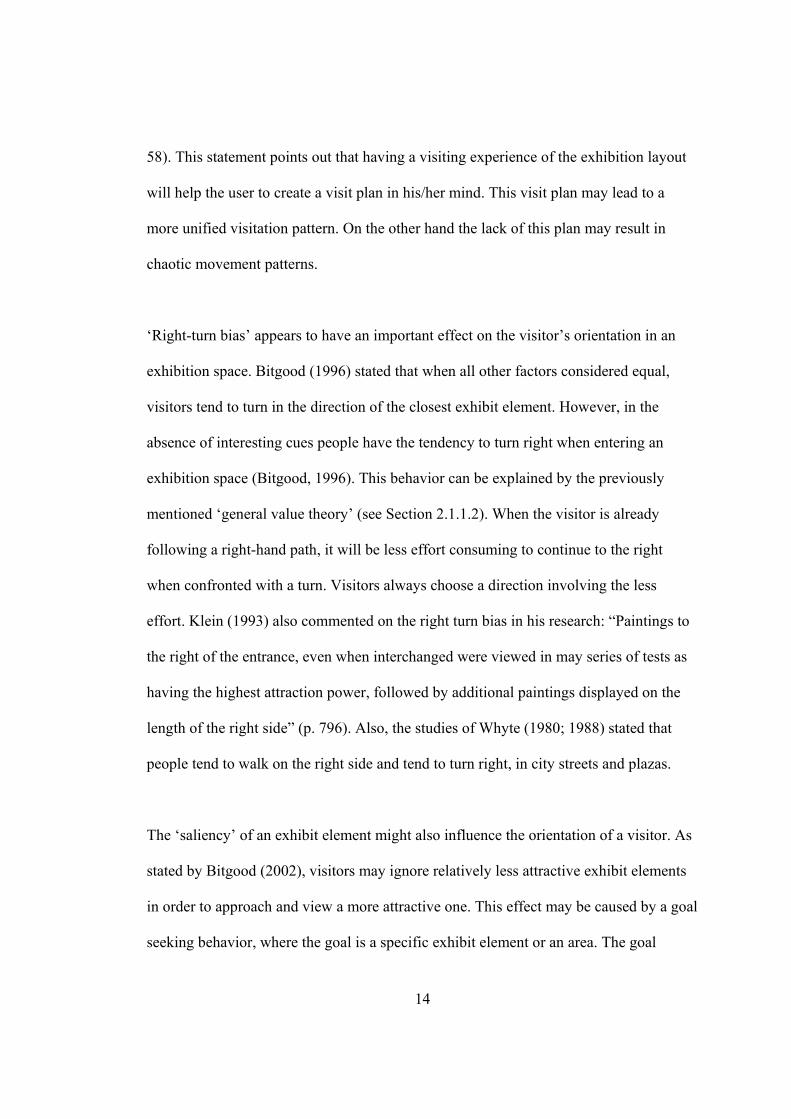
‘Right-turn bias’ appears to have an important effect on the visitor’s orientation in an
exhibition space. Bitgood (1996) stated that when all other factors considered equal,
visitors tend to turn in the direction of the closest exhibit element. However, in the
absence of interesting cues people have the tendency to turn right when entering an
exhibition space (Bitgood, 1996). This behavior can be explained by the previously
mentioned ‘general value theory’ (see Section 2.1.1.2). When the visitor is already
following a right-hand path, it will be less effort consuming to continue to the right
when confronted with a turn. Visitors always choose a direction involving the less
effort. Klein (1993) also commented on the right turn bias in his research: “Paintings to
the right of the entrance, even when interchanged were viewed in may series of tests as
having the highest attraction power, followed by additional paintings displayed on the
length of the right side” (p. 796). Also, the studies of Whyte (1980; 1988) stated that
people tend to walk on the right side and tend to turn right, in city streets and plazas.
The ‘saliency’ of an exhibit element might also influence the orientation of a visitor. As
stated by Bitgood (2002), visitors may ignore relatively less attractive exhibit elements
in order to approach and view a more attractive one. This effect may be caused by a goal
seeking behavior, where the goal is a specific exhibit element or an area. The goal
15
seeking behavior may overpower other factors influencing the orientation of the visitor
(Bitgood, 1996).
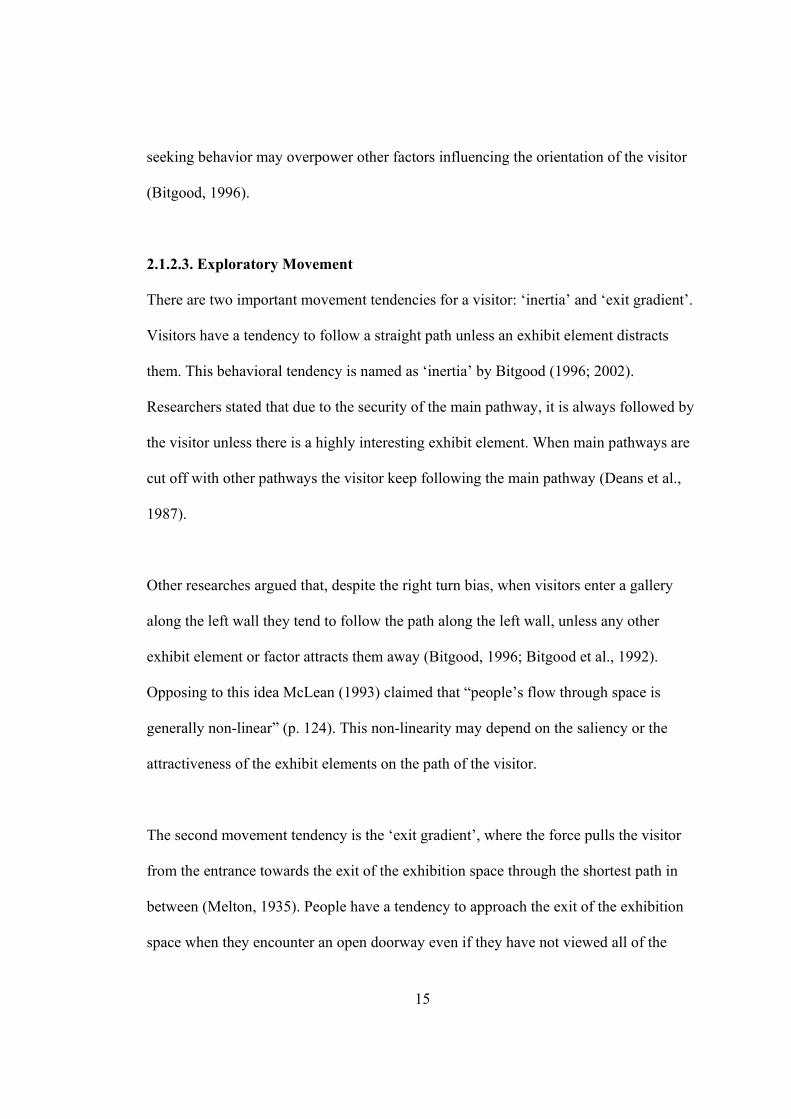
2.1.2.3. Exploratory Movement
There are two important movement tendencies for a visitor: ‘inertia’ and ‘exit gradient’.
Visitors have a tendency to follow a straight path unless an exhibit element distracts
them. This behavioral tendency is named as ‘inertia’ by Bitgood (1996; 2002).
Researchers stated that due to the security of the main pathway, it is always followed by
the visitor unless there is a highly interesting exhibit element. When main pathways are
cut off with other pathways the visitor keep following the main pathway (Deans et al.,
1987).
Other researches argued that, despite the right turn bias, when visitors enter a gallery
along the left wall they tend to follow the path along the left wall, unless any other
exhibit element or factor attracts them away (Bitgood, 1996; Bitgood et al., 1992).
Opposing to this idea McLean (1993) claimed that “people’s flow through space is
generally non-linear” (p. 124). This non-linearity may depend on the saliency or the
attractiveness of the exhibit elements on the path of the visitor.
The second movement tendency is the ‘exit gradient’, where the force pulls the visitor
from the entrance towards the exit of the exhibition space through the shortest path in
between (Melton, 1935). People have a tendency to approach the exit of the exhibition
space when they encounter an open doorway even if they have not viewed all of the
16
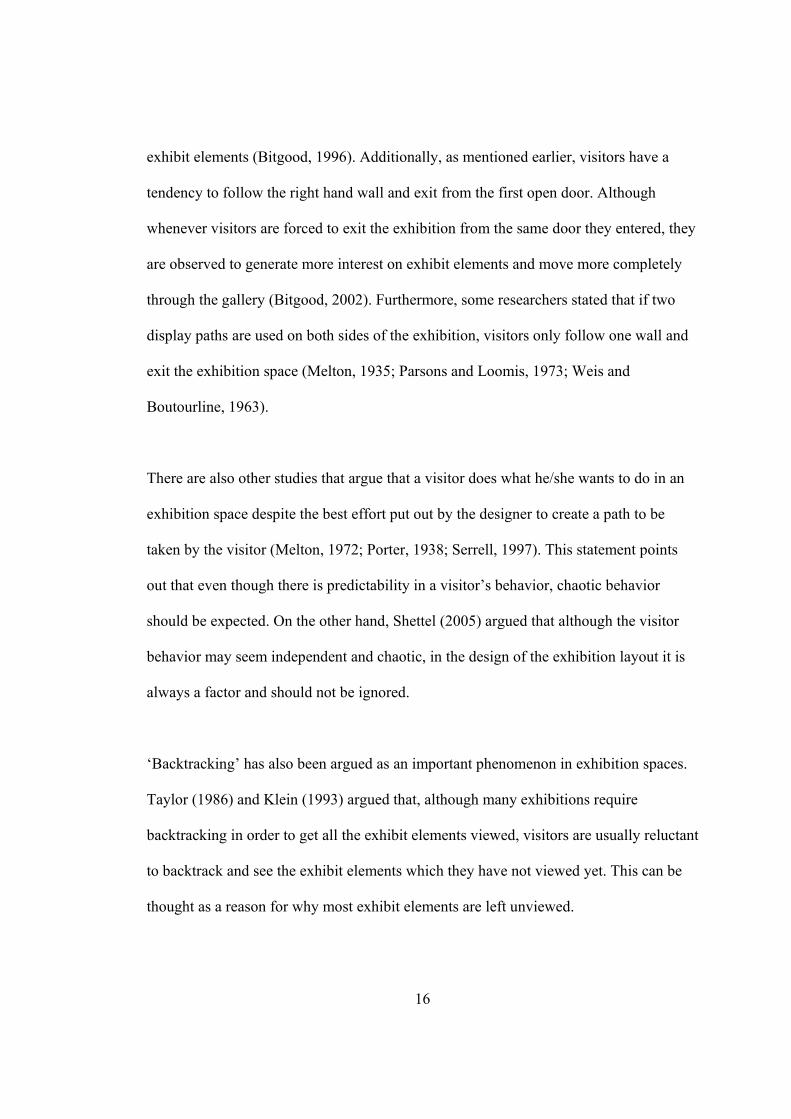
exhibit elements (Bitgood, 1996). Additionally, as mentioned earlier, visitors have a
tendency to follow the right hand wall and exit from the first open door. Although
whenever visitors are forced to exit the exhibition from the same door they entered, they
are observed to generate more interest on exhibit elements and move more completely
through the gallery (Bitgood, 2002). Furthermore, some researchers stated that if two
display paths are used on both sides of the exhibition, visitors only follow one wall and
exit the exhibition space (Melton, 1935; Parsons and Loomis, 1973; Weis and
Boutourline, 1963).
There are also other studies that argue that a visitor does what he/she wants to do in an
exhibition space despite the best effort put out by the designer to create a path to be
taken by the visitor (Melton, 1972; Porter, 1938; Serrell, 1997). This statement points
out that even though there is predictability in a visitor’s behavior, chaotic behavior
should be expected. On the other hand, Shettel (2005) argued that although the visitor
behavior may seem independent and chaotic, in the design of the exhibition layout it is
always a factor and should not be ignored.
‘Backtracking’ has also been argued as an important phenomenon in exhibition spaces.
Taylor (1986) and Klein (1993) argued that, although many exhibitions require
backtracking in order to get all the exhibit elements viewed, visitors are usually reluctant
to backtrack and see the exhibit elements which they have not viewed yet. This can be
thought as a reason for why most exhibit elements are left unviewed.
17
2.1.2.4. Visual Contact and Active Engagement
In order to distinguish the acts of detecting an exhibit element and viewing it, the
concepts of ‘visual contact’ and ‘active engagement’ were introduced (Peponis et al.,
2004). The difference between visual contact and active engagement is, when a visitor is
browsing, a visual contact is made with the browsed exhibit elements, however in active
engagement, a visitor stops at an exhibit element and studies its content.
Most people spend only a little time at most of the exhibit elements and pass until there
is something that tempts them to stop (Bicknell and Mann, 1993; Davies, 1994). Most
people spend a much longer time looking at a small portion of the exhibit elements, then
browsing through other exhibit elements (Bicknell and Mann, 1993). In an exhibition
space, the percentage of the active engagements received by an exhibit element is often
less than 50% (Bicknell and Mann, 1993; Hein, 1998; Serrell, 1997). This phenomenon
is explained by Bicknell and Mann (1993) as follows: “Few, if any, visitors will have
the time, concentration, determination, or interest to look at everything in the
exhibition” (p. 144). Visitors tend to ignore most of the exhibit elements especially if
they are not on their ‘inertia’ path.
The viewing time of an exhibit element may vary greatly depending on the visitor
profile (Sandifer, 2003). Serrell (1997) claimed that visitors usually spend much less
time for viewing exhibit elements then the designer anticipated. In some studies, the
average viewing time and the viewing time of the majority of visitors varied as much as
300% (Alt, 1979). Serell (1997) noted that the average viewing time of a single visitor
18
for the whole exhibition was usually less than 20 minutes. However, the time limit
might be deceiving since exhibitions greatly vary according to their sizes and contents.
Serrell (1996) reported that scanning an average of less than 28 square meters per
minute was recorded as a successful visitor exploration speed.
2.2. The Environment Indicators
2.2.1. The Exhibition Space Indicators
Visiting an exhibition is a complex experience that can have individual, social, aesthetic,
challenging and inspirational features (Hooper-Greenhill and Moussouri, 2001). The
activity of visiting may take place in galleries or exhibition spaces. Visiting an
exhibition in an architectural space, like a galleries or an exhibition space, requires
special attention in planning the exhibition layout and the circulation paths. These two
concepts would be explained in detail in the following sections.
2.2.1.1. The Exhibition Layout
A layout can be thought as an array of individual elements that are conceptually related
(Falk, 1993). The layout structure becomes more definite as exhibit elements and
boundaries are emplaced in the exhibition space. In an exhibition environment, the
exhibit elements and their boundaries work as obstacles that might limit the movement
and block the vision of a visitor. Hooper-Greenhill (1994) defined a good layout as
uncrowded and not overly structured or sequential.
19
Peponis and Stravroulaki (2003) stated that, the greater the limitations on visitors’ sight
in an exhibition space there will be more movement patterns distributed according to the
layout. As the numbers of obstructions increase, the limitations on visitor movement and
sight strongly affect the visitor's behavior patterns. Therefore, increasing the complexity
of a visitor’s behavior in an exhibition space resulting in a chaotic flow, and people start
to miss the exhibit elements unintentionally (Bitgood, 1993; Peponis et al., 2004).
Kaynar (2004) argued that visibility in a three dimensional physical environment is a
more elusive variable than accessibility. Also, she suggested that visibility can be
strategically planned in an exhibition space to direct the attention and motivation of
visitors.
A clearly defined visitor path in an exhibition space may increase the chances of getting
more attention for the exhibit elements (Bitgood, 2002). Getting the attention always
does not require a strongly defined path. Peponis et al. (2004) claimed that higher level
of visibility of an exhibit element from the viewing distance of another exhibit element
may also increase the attraction levels of an individual exhibit element dramatically.
This enables conceptually structured exhibitions also to be less chaotic. According to
Falk (1993), exhibition information can be sequenced in one of two ways:
1- Strongly linear, logically structured with exhibit elements that are hierarchically
arranged.
2- Non-linear unstructured with self-contained exhibit elements.
20
Gallery shape also poses an import role in defining the exhibition layout. Although the
shape of a gallery is usually rectangular, different forms have been applied by many
contemporary architects. Simple geometric forms as circles, rectangles and cloverleaves
help visitors in forming cognitive maps easily. As the intersections start to create angles
other than 90 degrees, forming a cognitive map becomes a harder task for visitors
(Bitgood, 1996). Some of the planning decisions that have to be made before starting to
shape the layout are defined by Spencer (1999) as follows:
1. The layout can be a Linearly Progressing one in which a visitor is expected to
follow a path from the beginning of the exhibition to the exit.
2. The layout can be an Open Plan which allows visitors to explore the exhibition
according to his/her own choice of viewing, duration, and in a linear or non-linear
fashion.
Often exhibition spaces are constructed with fixed walls, that is appropriate for
permanent exhibitions, linear progression. Open plan layouts may require flexibility.
Moveable walls and panels provide maximum flexibility in an exhibition environment
but may result in clustered appearance and noise (Spencer, 1999).
2.2.1.2. The Circulation Paths
Visitor circulation is largely influenced by the arrangement of the exhibit elements in
the exhibition space, however in each exhibition space there are some points or areas
that have their own attraction power that is independent from the exhibit elements
around the area (Bollo and Pozzolo, 2005). In every exhibition space some intersections,
21
areas and points gain the role of being hot and cold spots depending on the visitor
attention and their circulation patterns (Bitgood, 2002). Peponis et al. (2004) suggested
that more critical exhibit elements should be placed in more attractive points or areas in
order to make them more visible to increase the chance of viewing. Bollo and Pozollo
(2005) also suggested that hot and cold spots can also be used to manipulate visitor
circulation.
2.2.2. The Exhibit Element Indicators
There are two measurable characteristics of an exhibit element. These characteristics are
‘the attraction power’ and ‘the holding time’ of an exhibit element (Sandifer, 2003).
Peponis et al. (2004) described the visitor movement in an exhibition space in three
phases: the exploratory movement, the visual contact and the active engagement. The
last two of these movement phases, the visual contact and the active engagement, are
directly related to the attraction power and the holding time of an exhibit element,
respectively. The attraction power of an exhibit element determines the frequency of the
visual contacts and the holding time of an exhibit element determines how long an
active engagement will last. These relationships will be explained in detail in the
following sub-sections.
2.2.2.1. The Attraction Power
The attraction power of an exhibit element is synonymous to the popularity of the
exhibit element in an exhibition environment. The salience or distinctiveness of the
exhibit element and the traffic flow patterns in an exhibition environment are
22
interconnected issues in deciding the attraction power of an exhibit element. The more
salient an exhibit element, the more attractive it becomes (Bitgood, 2002). Additionally,
as mentioned previously, the traffic flow in the exhibition environment also influences
the attraction power of an exhibit element (see Section 2.2.1.2). Exhibit elements that
are located along the shortest route between the entrance and the exit of the exhibition
space receive a high amount of interest (Bitgood, 1996; Parsons and Loomis, 1973). As
Bitgood (2002) stated, exhibit elements that are situated along the pathway taken by the
visitors of the exhibition space have a reasonable chance of being seen when compared
to the exhibit elements outside this pathway.
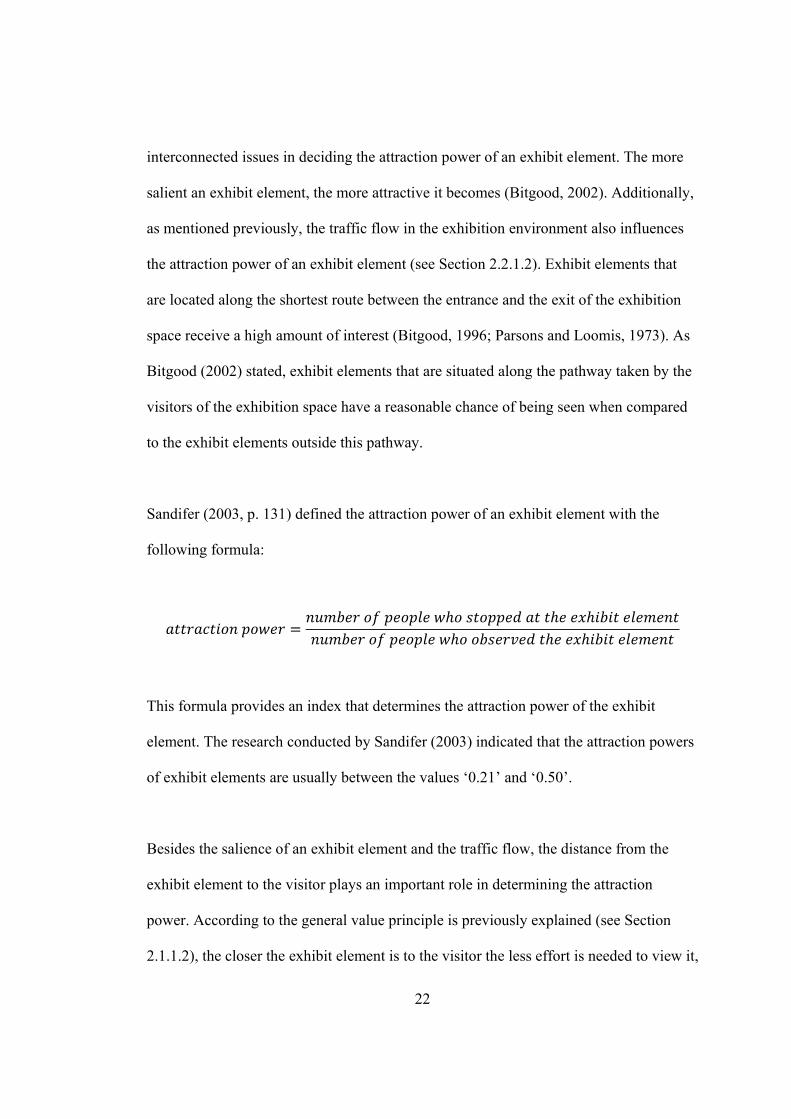
Sandifer (2003, p. 131) defined the attraction power of an exhibit element with the
following formula:
This formula provides an index that determines the attraction power of the exhibit
element. The research conducted by Sandifer (2003) indicated that the attraction powers
of exhibit elements are usually between the values ‘0.21’ and ‘0.50’.
Besides the salience of an exhibit element and the traffic flow, the distance from the
exhibit element to the visitor plays an important role in determining the attraction
power. According to the general value principle is previously explained (see Section
2.1.1.2), the closer the exhibit element is to the visitor the less effort is needed to view it,
23
which will result in viewing the closest exhibit element. Visitors show a tendency to
move to the closest exhibit element in their vicinity (Bitgood, 2002). Additionally,
Peponis et al. (2004) mentioned that exhibit elements that are visible from other exhibit
elements have high chance of generating interest therefore generating higher attraction
power compared to the invisible ones.
When a new exhibit element is introduced to the exhibition environment, it does not
only affect the layout of the exhibition space, but also affects the way other exhibit
elements are perceived (Bitgood and Patterson, 1993). The new exhibit element might
compete with other exhibit elements by distracting the visitor. Melton (1973) claimed
that as the number of exhibit elements in an exhibition space increases, the viewing time
for each exhibit element decreases. Kaynar (2004) stated that when the density of the
environmental information is minimal, the attention of the visitor is directed to exhibit
elements.
Bitgood (2002) has outlined some general properties that influence the attraction power
of exhibition elements:
• If an exhibit element is emplaced further at a distance between
other exhibit elements, then it will generate more attraction
power.
• If the size of an exhibit element increases, then its attraction
power also increases.
24
• The size of the exhibit element might also have an influence on
the circulation of visitors. Larger exhibit elements might attract
the visitors who are entering the exhibition space.
• If an exhibit element is blending into the background, then it
may generate less attraction power.
• If an exhibit element is in the vision angle of a visitor, then it
will generate more attraction power.
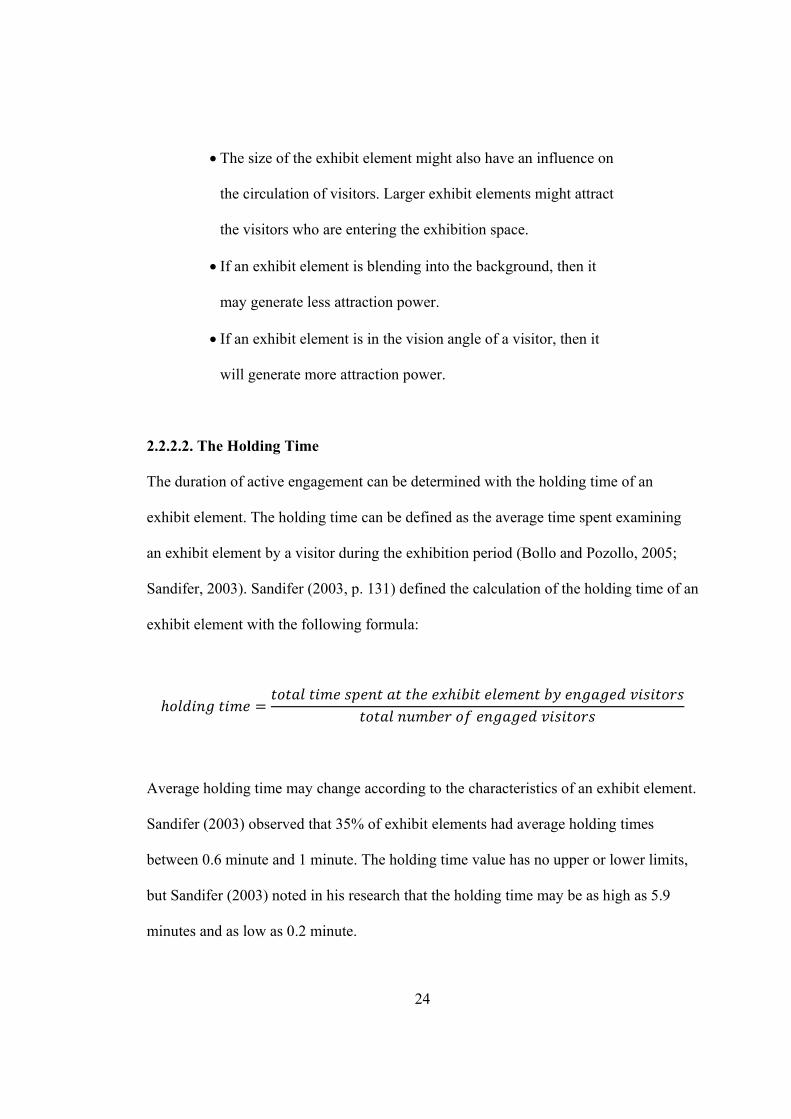
2.2.2.2. The Holding Time
The duration of active engagement can be determined with the holding time of an
exhibit element. The holding time can be defined as the average time spent examining
an exhibit element by a visitor during the exhibition period (Bollo and Pozollo, 2005;
Sandifer, 2003). Sandifer (2003, p. 131) defined the calculation of the holding time of an
exhibit element with the following formula:
Average holding time may change according to the characteristics of an exhibit element.
Sandifer (2003) observed that 35% of exhibit elements had average holding times
between 0.6 minute and 1 minute. The holding time value has no upper or lower limits,
but Sandifer (2003) noted in his research that the holding time may be as high as 5.9
minutes and as low as 0.2 minute.

25
This chapter explained the different elements of an exhibition environment and their
iterrelations. In the next chapter the implementation of the explained literature data to
the different domains of the simulation application will be explained in detail.
26
3. FRAMEWORK OF THE SIMULATION
In this thesis, a computer application is proposed to simulate the circulation behavior of
visitors in an exhibition environment by considering the interaction of visitors with
exhibit elements. The proposed application works as a plug-in with 3d Studio Max as
the host program. 3d Studio Max (hereafter 3ds Max) is a 3d modeling, animation and
rendering program developed by Autodesk (Autodesk, 2006). 3ds Max is a widely used
and well practiced program among interior designers, thus, it is chosen as the host
program for the simulation application (Bozdağ, 2008).
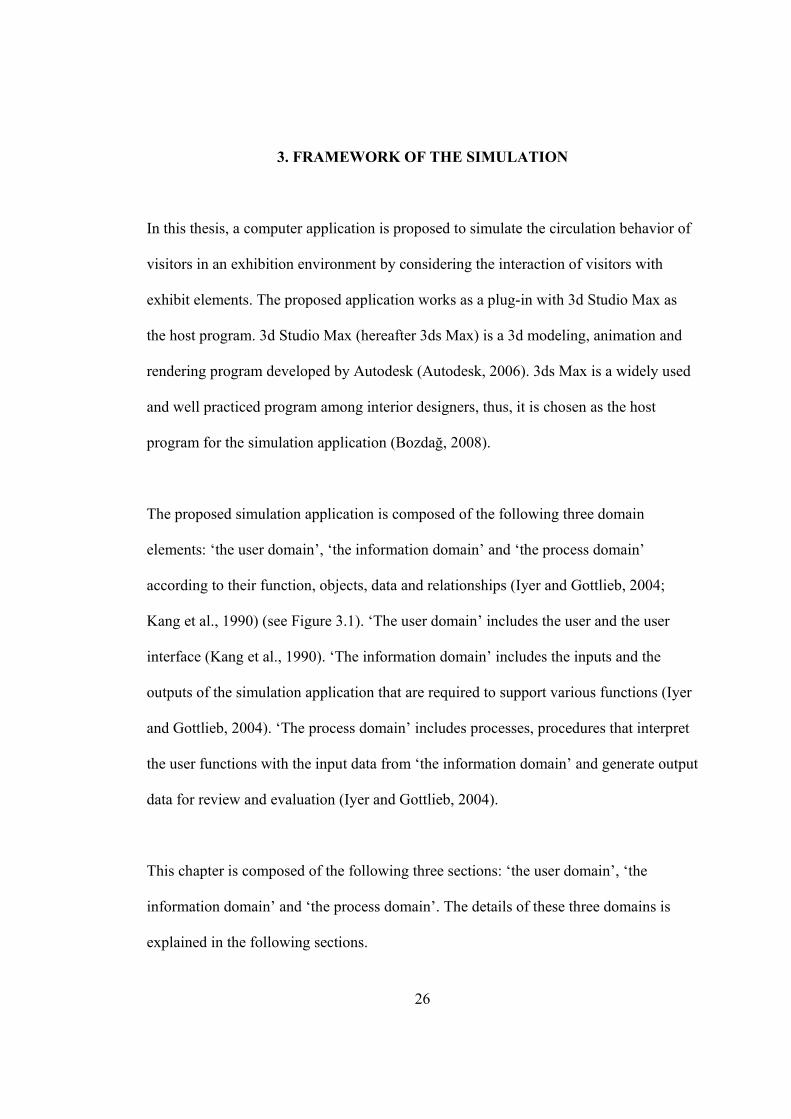
The proposed simulation application is composed of the following three domain
elements: ‘the user domain’, ‘the information domain’ and ‘the process domain’
according to their function, objects, data and relationships (Iyer and Gottlieb, 2004;
Kang et al., 1990) (see Figure 3.1). ‘The user domain’ includes the user and the user
interface (Kang et al., 1990). ‘The information domain’ includes the inputs and the
outputs of the simulation application that are required to support various functions (Iyer
and Gottlieb, 2004). ‘The process domain’ includes processes, procedures that interpret
the user functions with the input data from ‘the information domain’ and generate output
data for review and evaluation (Iyer and Gottlieb, 2004).
This chapter is composed of the following three sections: ‘the user domain’, ‘the
information domain’ and ‘the process domain’. The details of these three domains is
explained in the following sections.
27
Figure 3.1. The domain elements of the proposed simulation.
28
3.1. The User Domain
The user domain consists two elements: the user and the user interface. The user
operates the simulation application through the user interface. He/she is required to
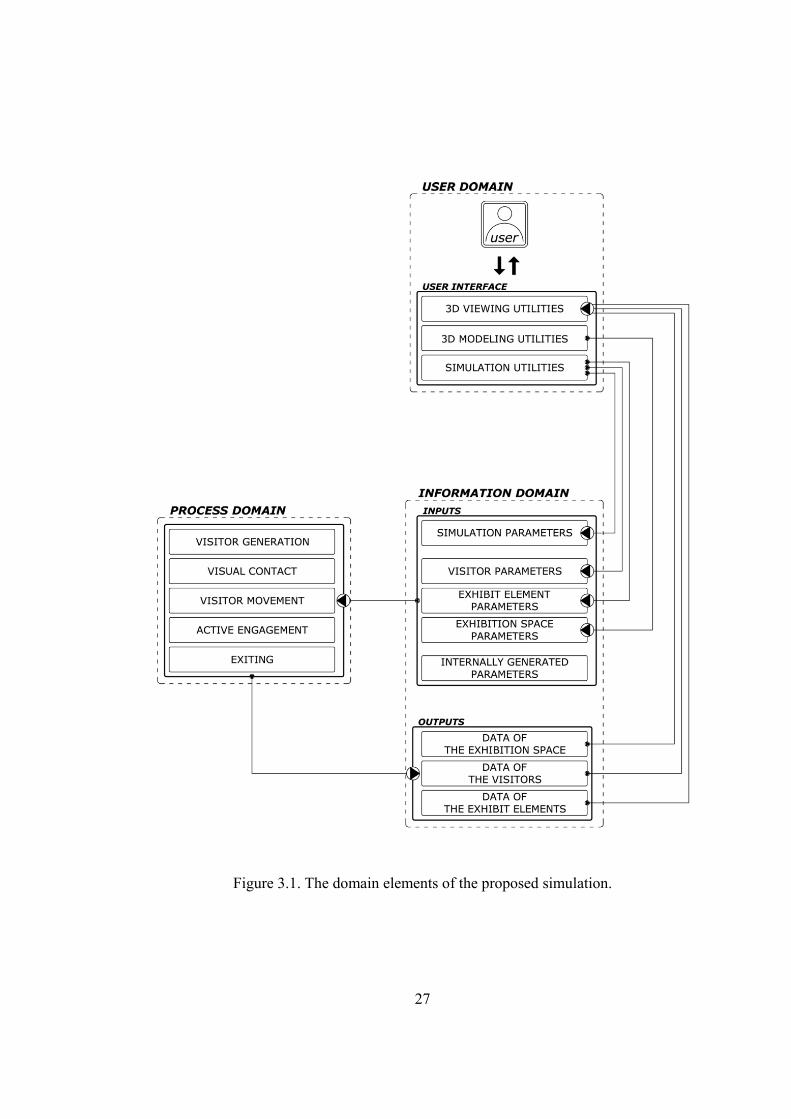
provide inputs and evaluate the outputs of the simulation application. The user handles
the tasks and the products of the proposed simulation application using the 3ds Max
interface (see Figure 3.2).
The following sections explain the main utilities of the user domain, their tools and the
uses of these tools during the operation of the simulation application.
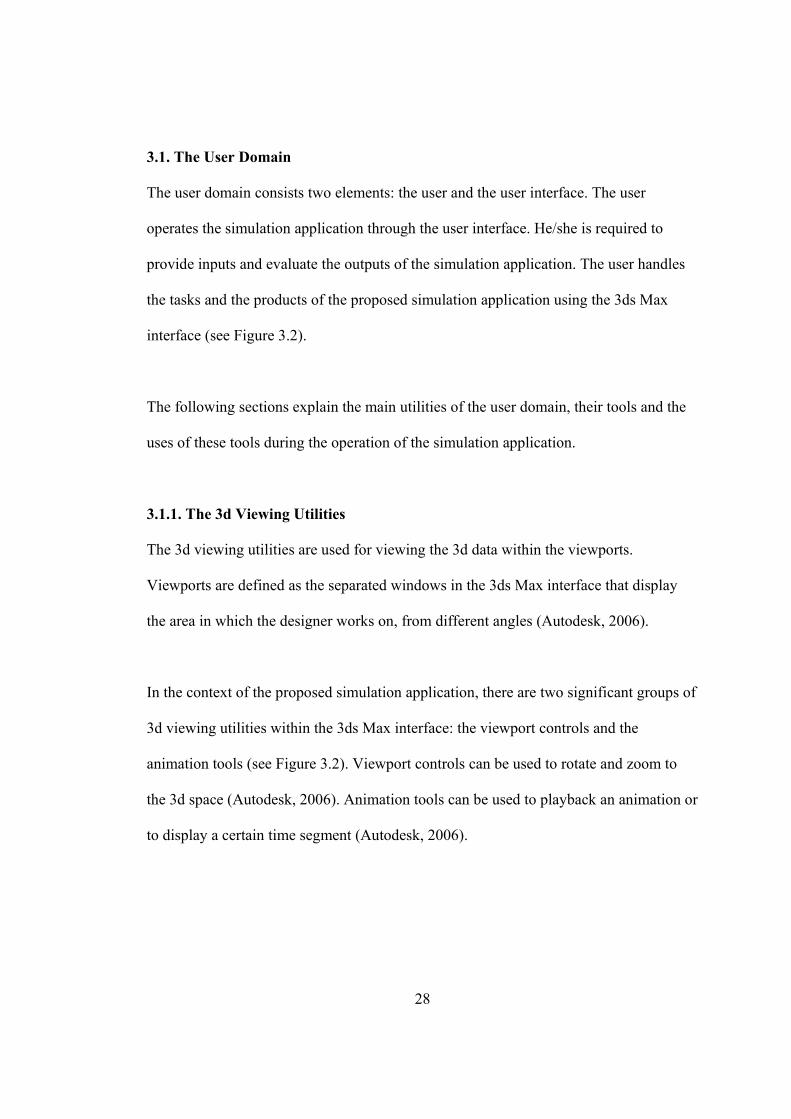
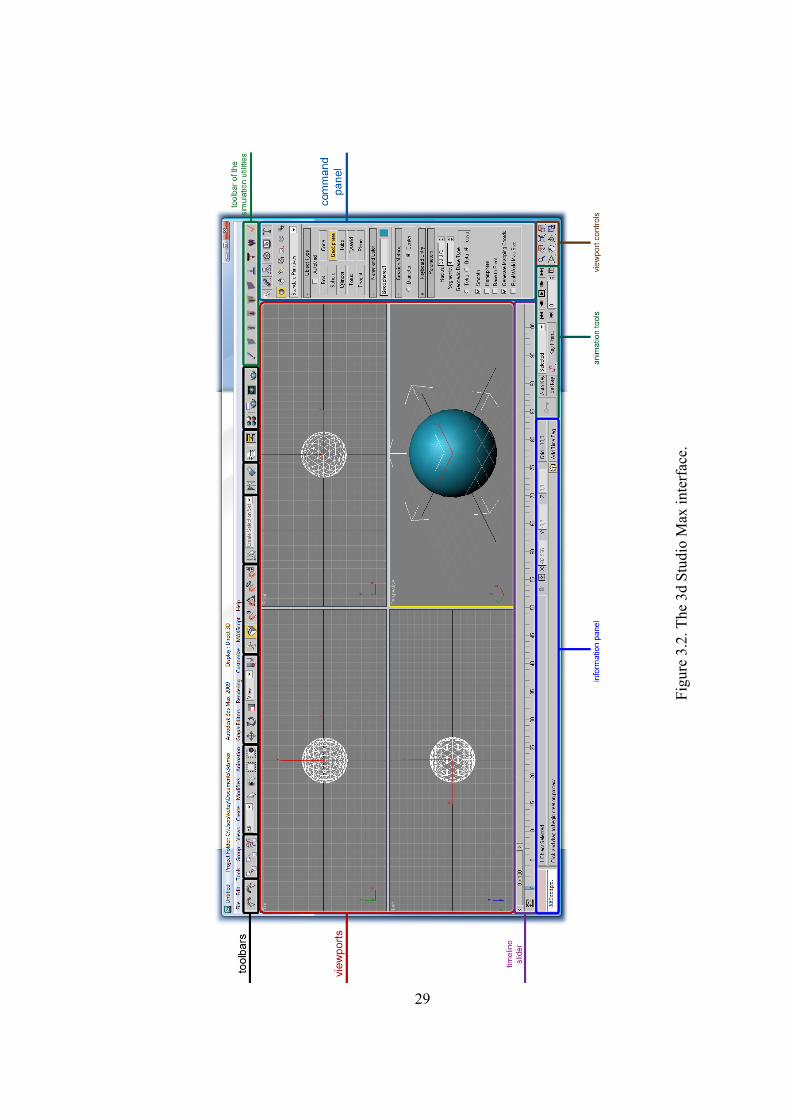
3.1.1. The 3d Viewing Utilities
The 3d viewing utilities are used for viewing the 3d data within the viewports.
Viewports are defined as the separated windows in the 3ds Max interface that display
the area in which the designer works on, from different angles (Autodesk, 2006).
In the context of the proposed simulation application, there are two significant groups of
3d viewing utilities within the 3ds Max interface: the viewport controls and the
animation tools (see Figure 3.2). Viewport controls can be used to rotate and zoom to
the 3d space (Autodesk, 2006). Animation tools can be used to playback an animation or
to display a certain time segment (Autodesk, 2006).
29
Figu
re 3
.2. T
he 3
d St
udio
Max
inte
rfac
e.
30
3.1.2. The 3d Modeling Utilities
3d object modeling process in 3ds Max is based on creating, combining and modifying
simple geometrical shapes (Autodesk, 2006; Breton and Gerhard, 2007). 3ds Max
provides geometry creation, modification and transformation tools for the 3d object
modeling processes (Autodesk, 2008). The 3d modeling utilities in 3ds Max can be
listed as follows:
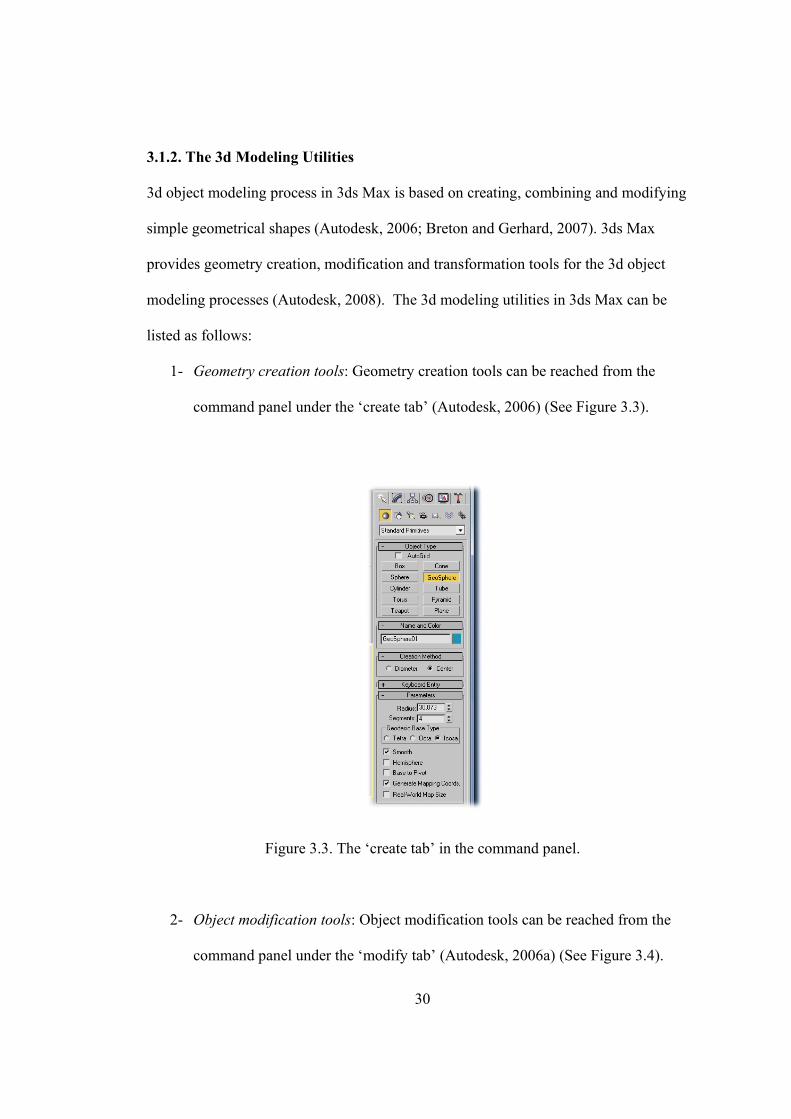
1- Geometry creation tools: Geometry creation tools can be reached from the
command panel under the ‘create tab’ (Autodesk, 2006) (See Figure 3.3).
Figure 3.3. The ‘create tab’ in the command panel.
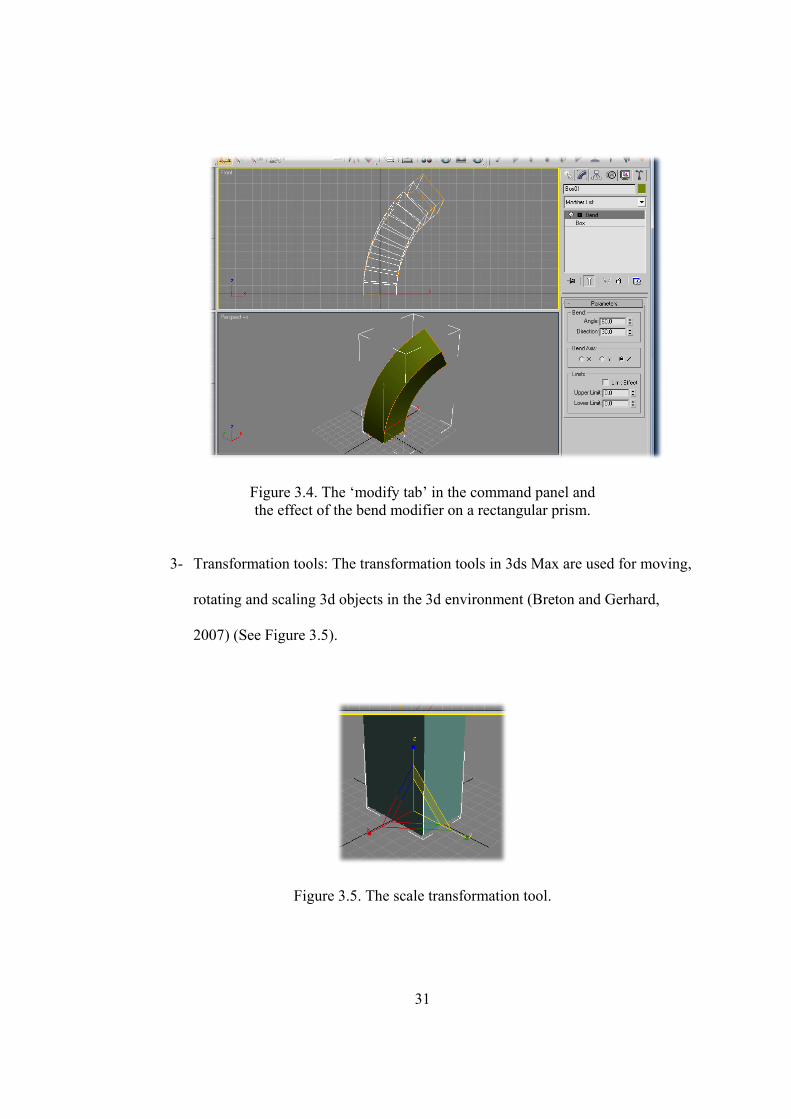
2- Object modification tools: Object modification tools can be reached from the
command panel under the ‘modify tab’ (Autodesk, 2006a) (See Figure 3.4).
31
Figure 3.4. The ‘modify tab’ in the command panel and the effect of the bend modifier on a rectangular prism.
3- Transformation tools: The transformation tools in 3ds Max are used for moving,
rotating and scaling 3d objects in the 3d environment (Breton and Gerhard,
2007) (See Figure 3.5).
Figure 3.5. The scale transformation tool.
32
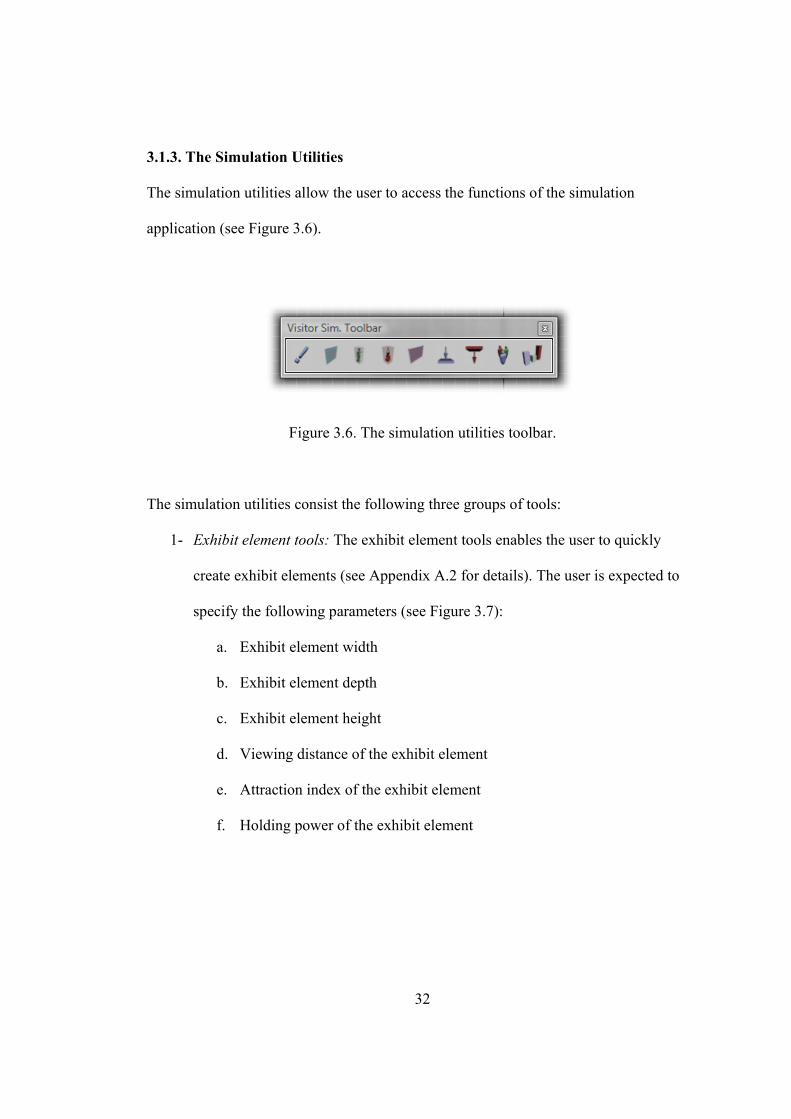
3.1.3. The Simulation Utilities
The simulation utilities allow the user to access the functions of the simulation
application (see Figure 3.6).
Figure 3.6. The simulation utilities toolbar.
The simulation utilities consist the following three groups of tools:
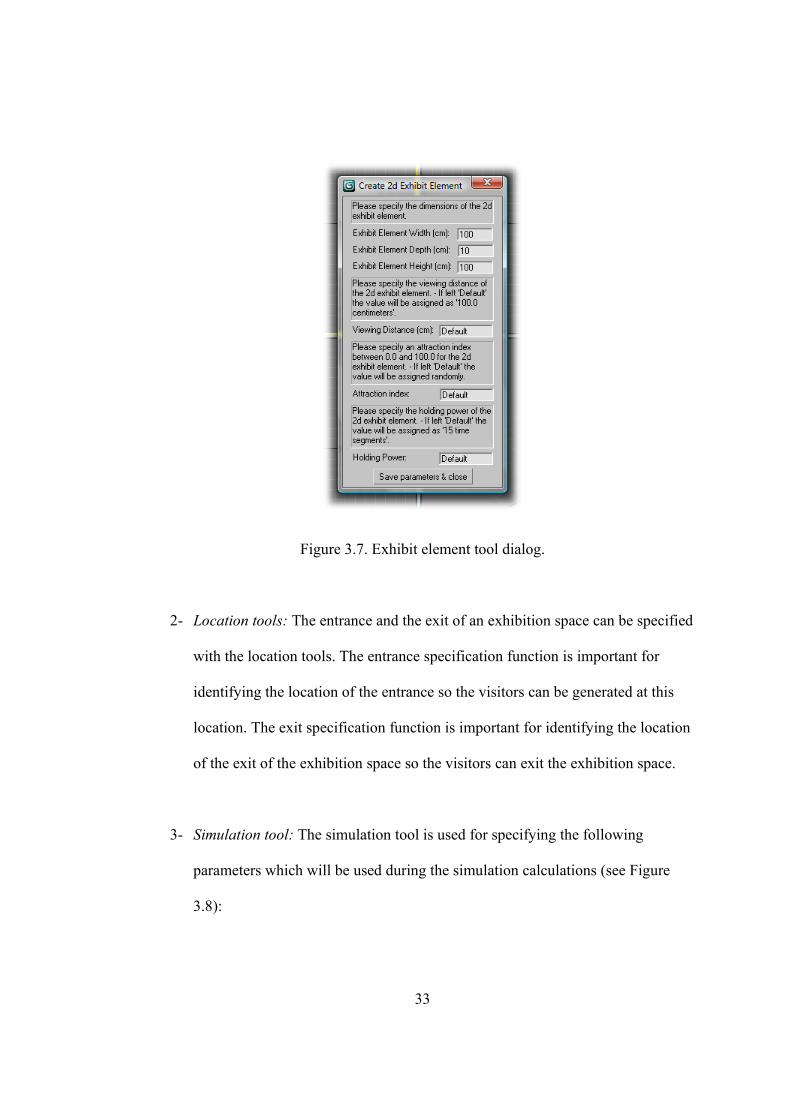
1- Exhibit element tools: The exhibit element tools enables the user to quickly
create exhibit elements (see Appendix A.2 for details). The user is expected to
specify the following parameters (see Figure 3.7):
a. Exhibit element width
b. Exhibit element depth
c. Exhibit element height
d. Viewing distance of the exhibit element
e. Attraction index of the exhibit element
f. Holding power of the exhibit element
33
Figure 3.7. Exhibit element tool dialog.
2- Location tools: The entrance and the exit of an exhibition space can be specified
with the location tools. The entrance specification function is important for
identifying the location of the entrance so the visitors can be generated at this
location. The exit specification function is important for identifying the location
of the exit of the exhibition space so the visitors can exit the exhibition space.
3- Simulation tool: The simulation tool is used for specifying the following
parameters which will be used during the simulation calculations (see Figure
3.8):
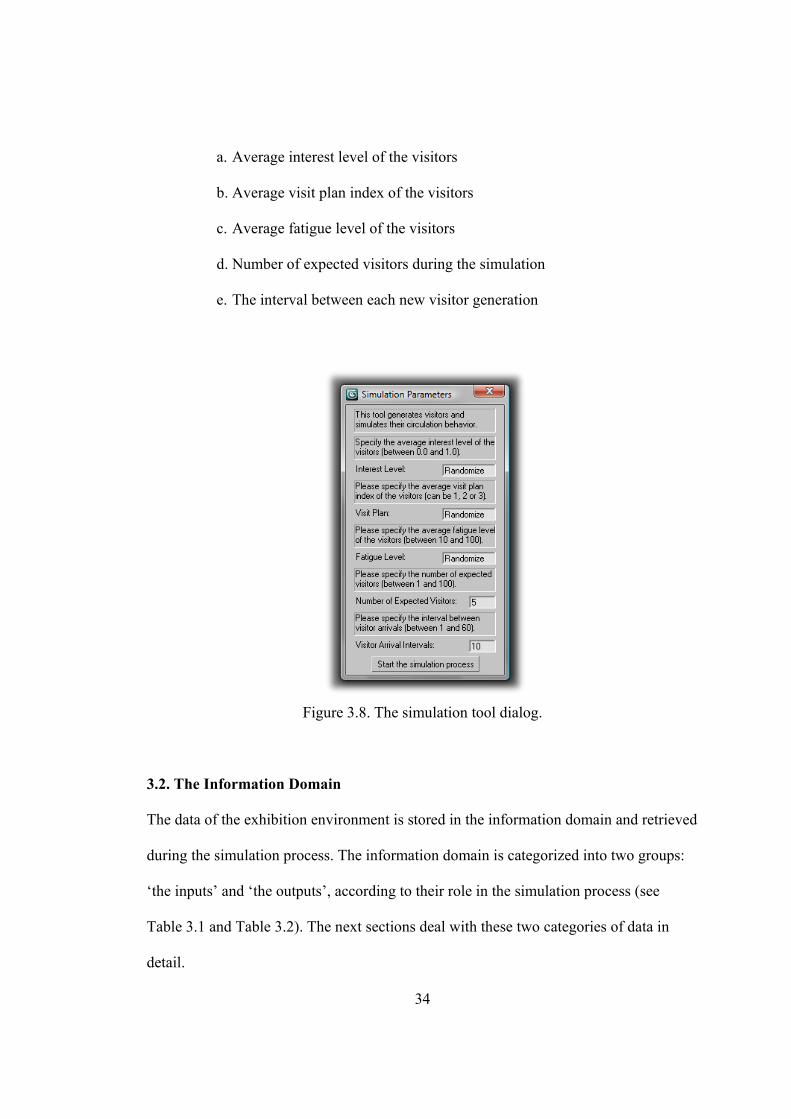
34
a. Average interest level of the visitors
b. Average visit plan index of the visitors
c. Average fatigue level of the visitors
d. Number of expected visitors during the simulation
e. The interval between each new visitor generation
Figure 3.8. The simulation tool dialog.
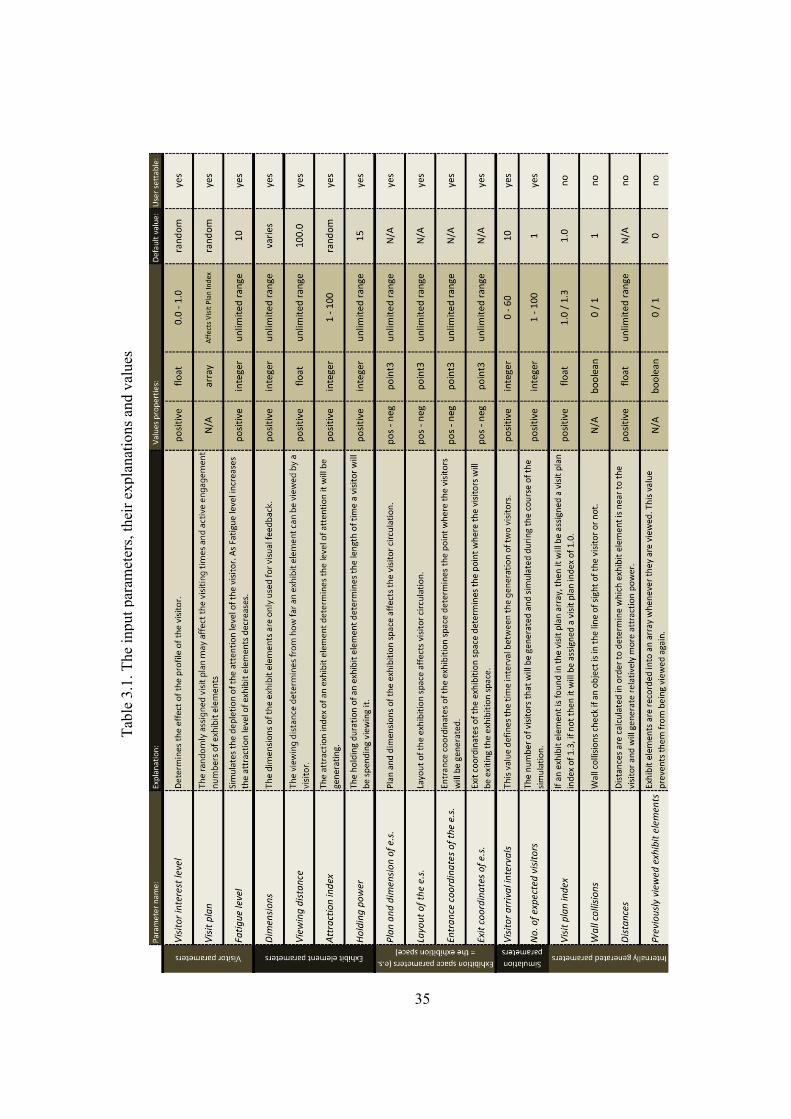
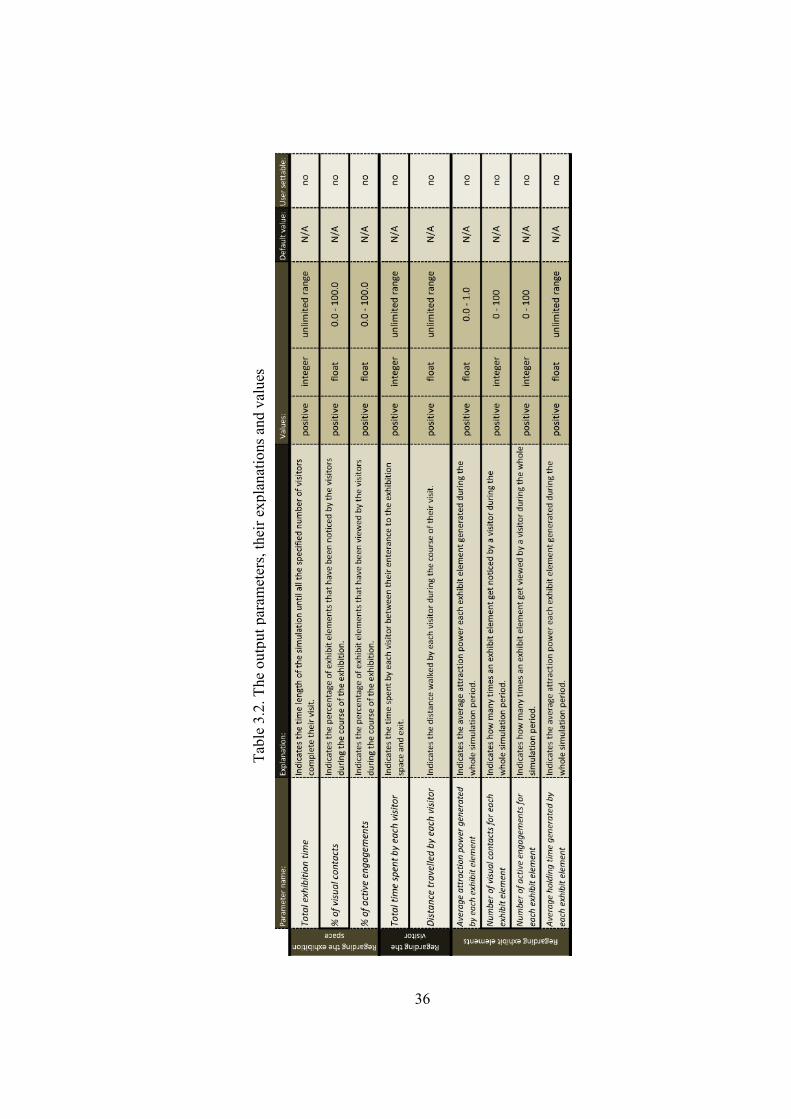
3.2. The Information Domain
The data of the exhibition environment is stored in the information domain and retrieved
during the simulation process. The information domain is categorized into two groups:
‘the inputs’ and ‘the outputs’, according to their role in the simulation process (see
Table 3.1 and Table 3.2). The next sections deal with these two categories of data in
detail.
35
Tabl
e 3.
1. T
he in
put p
aram
eter
s, th
eir e
xpla
natio
ns a
nd v
alue
s
36
Tabl
e 3.
2. T
he o
utpu
t par
amet
ers,
thei
r exp
lana
tions
and
val
ues
37
3.2.1. Inputs
3.2.1.1. Visitor Parameters
The visitor parameters consist the following three inputs:
1- Visitor interest level: As mentioned previously (see Chapter 2.1.1.1), a visitor’s
behavior is closely related to his/her profile. During the simulation the profiles of
the visitors are determined according to their interest level (see Table 3.1 for
details).
The interest level of a visitor affects the attraction powers and holding times of
the exhibit elements, therefore affecting the number of visual contacts, the
number and the duration of the active engagements (see Appendix B for details).
2- Visit plan: As explained previously (see Chapter 2.1.1.3), the circulation of the
visitor in the exhibition space may depend on the expectations and the
experiences that constitute his/her ‘pre-visit agenda’ (Hooper-Greenhill and
Moussouri, 2001).
The visit plan constitutes a percentage of exhibit elements that are planned to be
seen or preferred over the others (see Table 3.1 for details). The specified visit
plan will randomly generate a visit plan array for each newly generated visitor
which will include a number of exhibit elements from the exhibition (see
Appendix B for details).
38
The visit plan affects the attraction power of an exhibit element, the number of
visual contacts and active engagements it will be receiving from the visitors. The
visit plan may lead to a more random visitor behavior, therefore to a more
realistic circulation simulation (Robinson, 2004).
3- Fatigue level: As explained before (see Chapter 2.1.1.2 and Chapter 2.1.2.1), the
physical and mental effort of the visitor depletes the visitor’s attention. This
change in attention may cause the visitor to respond differently to the exhibit
elements (Falk, 1993; Hein, 1998).
In the proposed simulation, the fatigue level of a visitor is defined with a positive
integer number (see Table 3.1 for details). During the visiting period This value
linearly increases 1 point if the visitor performs an activity at a time segment.
The fatigue level has a negative effect on the attraction power and holding time
of exhibit elements. On the other hand the fatigue level has a positive effect on
the attraction power of the exit, therefore, it may cause early exiting behavior of
the visitors.
3.2.1.2. Exhibit Element Parameters
The visitor parameters consist of the following four inputs:
1- Dimensions: As explained previously (see Chapter 2.2.2.1), dimensions of an
exhibit element might influence its attraction power and the surrounding
39
circulation (Bitgood, 2002).However, in the proposed simulation application, the
dimensions of the exhibit elements are only effective as a visual feedback for the
user for preventing complexity (see Table 3.1 for details).
2- Viewing distance: is the optimum distance that a user should view an exhibit
element (Neal, 1987). In the proposed simulation application, the viewing
distance does not affect the attraction power or the holding time of any exhibit
element (See Table 3.1 for details).
3- Attraction index: As mentioned previously (see Chapter 2.2.2.1), the saliency of
an exhibit element is proportional to the attraction power it generates (Bitgood,
2002). In the proposed simulation application, the saliency of an exhibit element
is expressed with the attraction index.
The attraction index affects the attraction power of the exhibit element and is
directly related to the number of visual contacts and active engagements with the
exhibit element (see Table 3.1 for details).
4- Holding power: As explained previously (see Chapter 2.2.2.2), holding time
determines the duration of an active engagement (Sandifer, 2003). In the
proposed simulation, the holding power is a variable that expresses the capability
of an exhibit element for keeping the attention of a visitor.
40
The holding power is a user definable integer value and it primarily determines
the length of time the visitors is spending while viewing the exhibit element (see
Table 3.1 for details).
3.2.1.3. Exhibition Space Parameters
The exhibition space parameters consist of the following three inputs:
1- Plan and dimensions of the exhibition space: As mentioned previously (see
Chapter 2.2.1.1), the exhibition space and the exhibit elements work as obstacles
that might limit the vision and the circulation of visitors (Peponis et al., 2004).
The exhibition space model is prepared using the modeling tools of 3ds Max (see
Section 3.2.2).
The main function of the exhibition space model is to provide virtual stimulus to
the visitors to obtain realistic visitor circulation behavior by allowing them to
detect wall collisions on their circulation path. The exhibition space model also
provides visual feedback for the user during the design process as well as
inevaluating the simulation process (see Table 3.1 for details).
2- Layout of the exhibition space: As mentioned previously (see Chapter 2.2.1.1),
the layout of an exhibition space influences the visitor circulation (Bitgood,
1993; Bitgood, 2002; Peponis et al., 2004). The layout of the exhibition space
constitutes the locations of the exhibit elements (see Table 3.1 for details).
41
The primary function of the layout of the exhibition space is to store the
coordinates of the exhibit elements, consequently, the distances between the
exhibit elements and the visitors can be calculated. Distances between exhibit
elements and their relative distances to the visitors directly affect the circulation
patterns of the visitors. Additionally, the layout of the exhibition space provides
a visual feedback to the user.
3- The entrance and the exit coordinates of the exhibition space: These parameters
are crucial in providing the starting and ending locations for the visitor
circulation. Entrance coordinates of the exhibition space determine the location
where visitors are generated (see Table 3.1 for details). Exit coordinates of the
exhibition space determine the location of the visitors who exit the exhibition
space from (see Table 3.1 for details).
The exit of the exhibition space is also important in creating the exit gradient
effect that was explained previously (see Chapter 2.1.2.1). An attraction index is
assigned to each exit of the exhibition space. Therefore, the exit has an attraction
power that is greater than the exhibit elements. A high attraction power of the
exit may cause early exiting behavior of the visitors.
42
3.2.1.4. Simulation Parameters
The simulation parameters consist the following two inputs:
1- Visitor arrival interval: This parameter defines the time interval between the
generation of two visitors (see Table 3.1 for details). This value might affect the
density of visitors inside the exhibition space, therefore, affecting the circulation
behavior of the visitors. Additionally, the visitor arrival interval may influence
the total length of the exhibition.
2- Number of expected visitors: This value determines the total number of visitors
that is generated during the course of the simulation (see Table 3.1 for details).
This value affects the total exhibition time.
3.2.1.5. Internally Generated Parameters
The internally generated parameters consist of the following four groups of data:
1- Visit plan index: The visit plan index is an internally generated value which is
the result of the visit plan of a visitor (see Section 3.3.1.1). During the
simulation, if an exhibit element is found in the visit plan array of a visitor, then
the exhibit element will generate 30% more attraction power (see Table 3.1 for
details). The visit plan index affects the numbers of visual contacts and active
engagements with an exhibit element.
2- Wall collisions: As previously explained (see Section 3.3.1.3), the plan of the
exhibition space affects the visitor behavior. Wall collision index is represented
43
by a Boolean value that determines if an exhibit element is visible to the visitor
or blocked by an obstacle. (See Table 3.1 for details).
3- Distances: As explained previously (see Chapter 2.1.1.2), the general value
principle is an important motivational factor for visitors (Bitgood 2005; 2006).
The general value principle argues that the cost of an experience is
unconsciously calculated by the visitor and compared with the benefit of the
experience (Bitgood, 2005; 2006).
According to the above statements in order to achieve a high value, an exhibit
element should be interesting while the effort of viewing it is minimal. In this
thesis, the distance between the visitor and the exhibit element is interpreted as
the effort that a visitor has to be spent to view the exhibit element.
For each time segment the distances between each exhibit element and each
visitor are calculated. The distance affects the attraction power of an exhibit
element and also is used to determine if the visitor is close enough to the target
object for active engagement or not (see Table 3.1 for details).
4- Previously viewed exhibit elements index: As mentioned earlier (see Chapter
2.1.2.3), visitors are reluctant to view exhibit elements that are left behind or
previously viewed (Klein, 1993; Taylor, 1986). The previously viewed exhibit
element index is used for determining if an exhibit element is previously viewed
44
by the visitor or not (see Table 3.1 for details). For practical purposes the
visitors simulated with the proposed simulation application do not view a
previously viewed exhibit element a second time.
3.2.2. Outputs
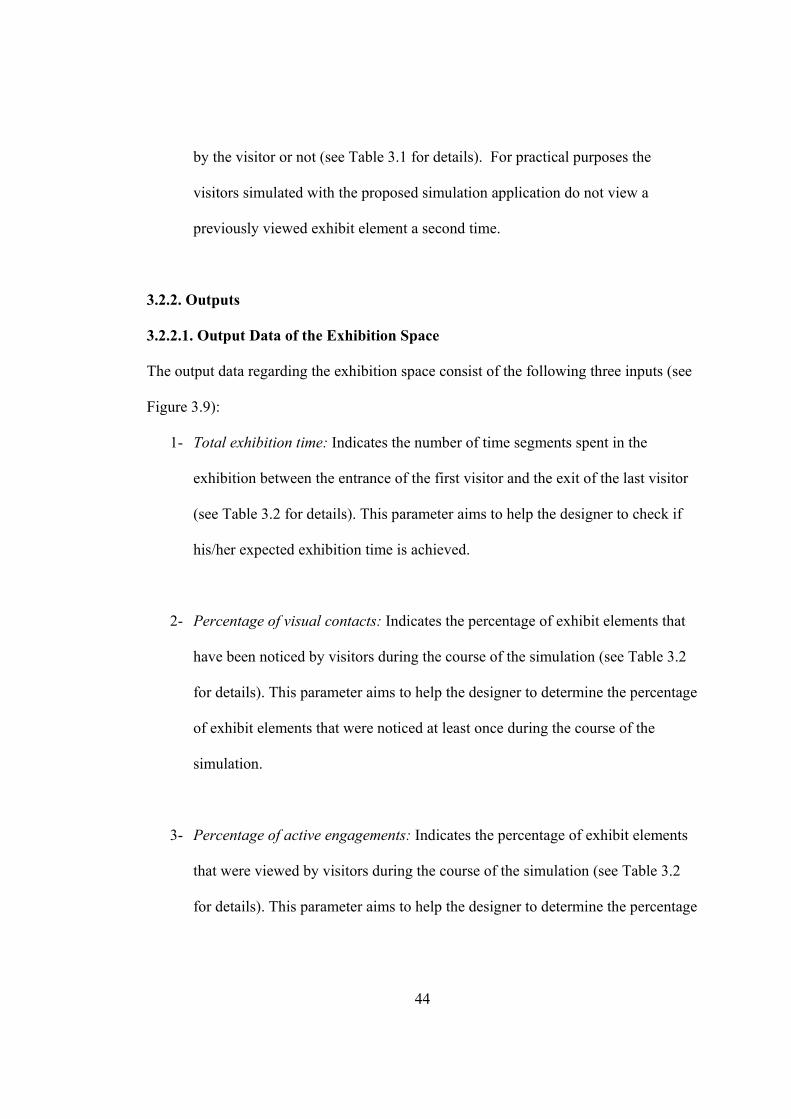
3.2.2.1. Output Data of the Exhibition Space
The output data regarding the exhibition space consist of the following three inputs (see
Figure 3.9):
1- Total exhibition time: Indicates the number of time segments spent in the
exhibition between the entrance of the first visitor and the exit of the last visitor
(see Table 3.2 for details). This parameter aims to help the designer to check if
his/her expected exhibition time is achieved.
2- Percentage of visual contacts: Indicates the percentage of exhibit elements that
have been noticed by visitors during the course of the simulation (see Table 3.2
for details). This parameter aims to help the designer to determine the percentage
of exhibit elements that were noticed at least once during the course of the
simulation.
3- Percentage of active engagements: Indicates the percentage of exhibit elements
that were viewed by visitors during the course of the simulation (see Table 3.2
for details). This parameter aims to help the designer to determine the percentage
45
of exhibit elements that were viewed at least once during the course of the
simulation.
Figure 3.9. The exhibition space output parameters dialog.
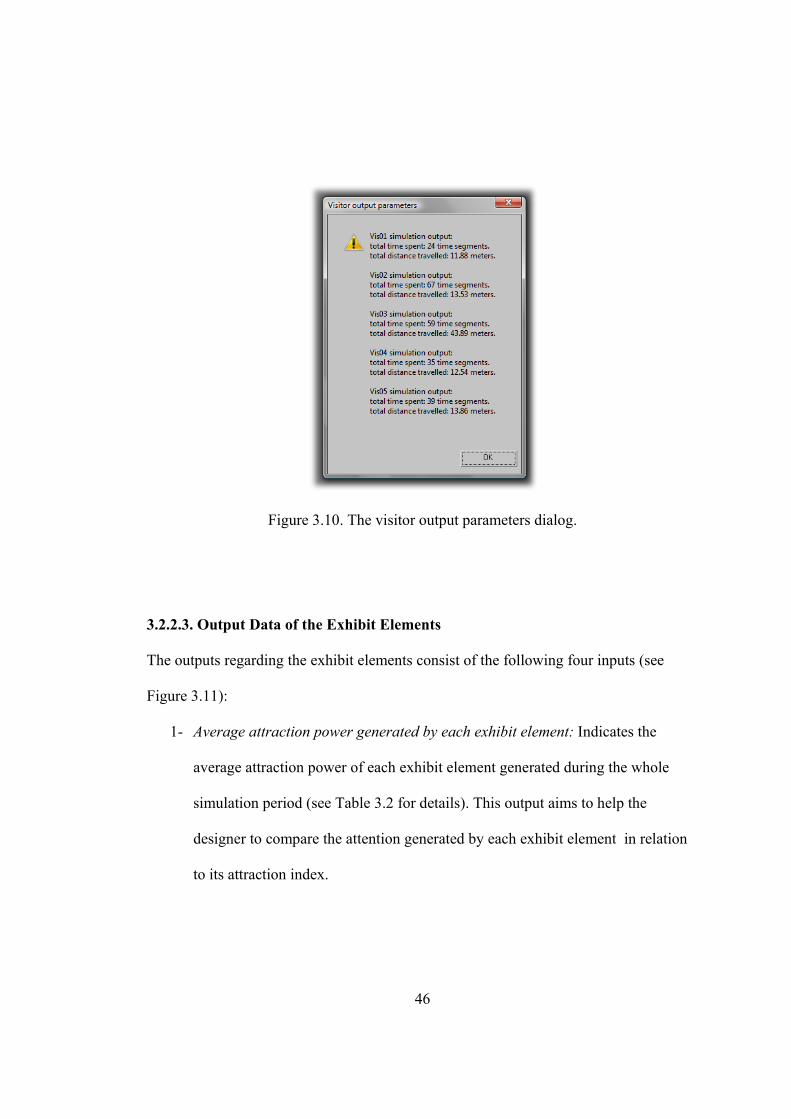
3.2.2.2. Output Data of the Visitors
The output data regarding the visitor consist of the following two inputs (see Figure
3.10):
1- Total time spent by each visitor: Indicates the number of time segments spent by
each visitor between the entrance to the exhibition space and from the exit (see
Table 3.2 for details). A time segment represents one second in real world terms.
This output enables the designer to compare, how the duration of the visit varied
according to the interest level and the visit plan of the visitor.
2- Total distance travelled by each visitor: Indicates the distances walked in meters
by each visitor during the course of visit (see Table 3.2 for details). This output
enables the designer to compare how the walking distances varied according to
the interest level and the visit plan of the visitor.
46
Figure 3.10. The visitor output parameters dialog.
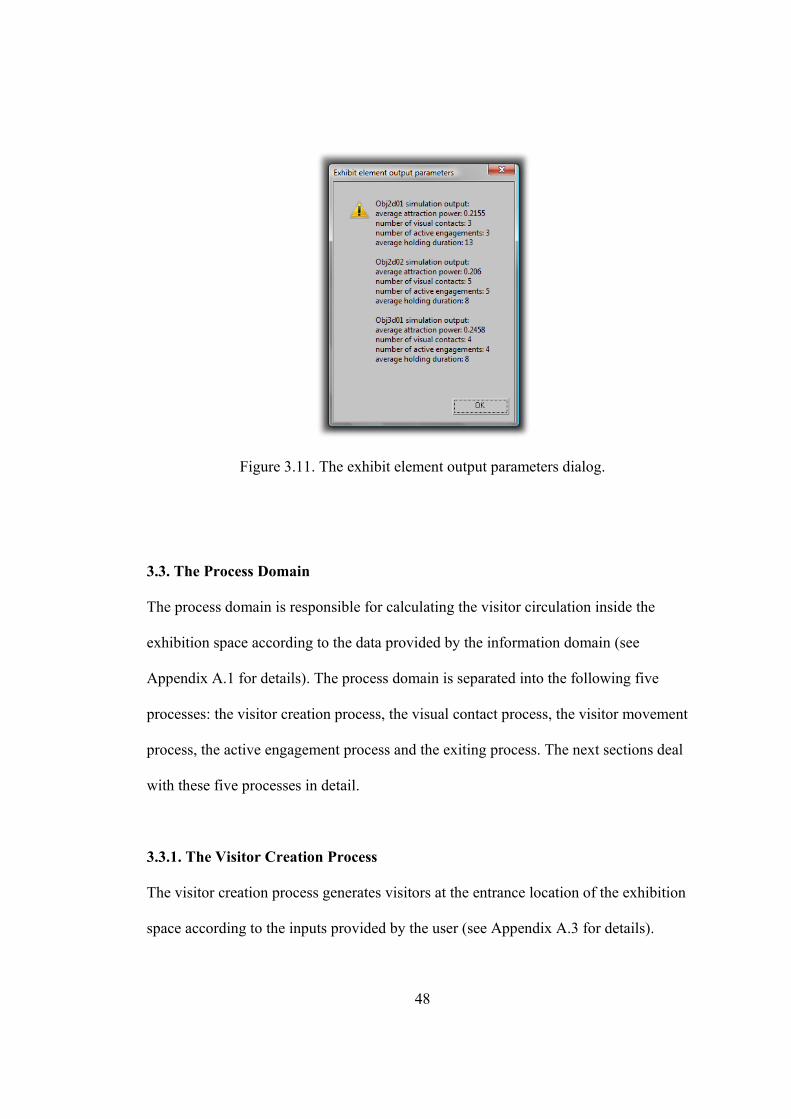
3.2.2.3. Output Data of the Exhibit Elements
The outputs regarding the exhibit elements consist of the following four inputs (see
Figure 3.11):
1- Average attraction power generated by each exhibit element: Indicates the
average attraction power of each exhibit element generated during the whole
simulation period (see Table 3.2 for details). This output aims to help the
designer to compare the attention generated by each exhibit element in relation
to its attraction index.
47
2- Number of visual contacts received by each exhibit element: Indicates how many
times an exhibit element gets noticed by the visitors during the whole simulation
period (see Table 3.2 for details). This output helps the designer to compare the
number of visual contacts generated by each exhibit element in relation to its
attraction index.
3- Number of active engagements received by each exhibit element: Indicates how
many times an exhibit element is viewed by the visitors during the whole
simulation period (see Table 3.2 for details). This output aims to help the
designer to compare the number of active engagements generated by each
exhibit element in relation to its attraction index.
4- Average holding time generated by each exhibit element: Indicates the average
holding time of each exhibit element generated during the whole simulation
period (see Table 3.2 for details). This output aims to help the designer to
compare the average holding time generated by each exhibit element in relation
to its holding time.
48
Figure 3.11. The exhibit element output parameters dialog.
3.3. The Process Domain
The process domain is responsible for calculating the visitor circulation inside the
exhibition space according to the data provided by the information domain (see
Appendix A.1 for details). The process domain is separated into the following five
processes: the visitor creation process, the visual contact process, the visitor movement
process, the active engagement process and the exiting process. The next sections deal
with these five processes in detail.
3.3.1. The Visitor Creation Process
The visitor creation process generates visitors at the entrance location of the exhibition
space according to the inputs provided by the user (see Appendix A.3 for details).
49
The visitor creation process involves reading and assigning the visitor and simulation
parameters inputted by the user and setting the time interval between each visitor
generation (see Appendix B for details). This process provides a realistic visitor arrival
behavior compared to generating visitors at random locations (McLean, 1993; Peponis
et al., 2004; Weis and Boutourline, 1963).
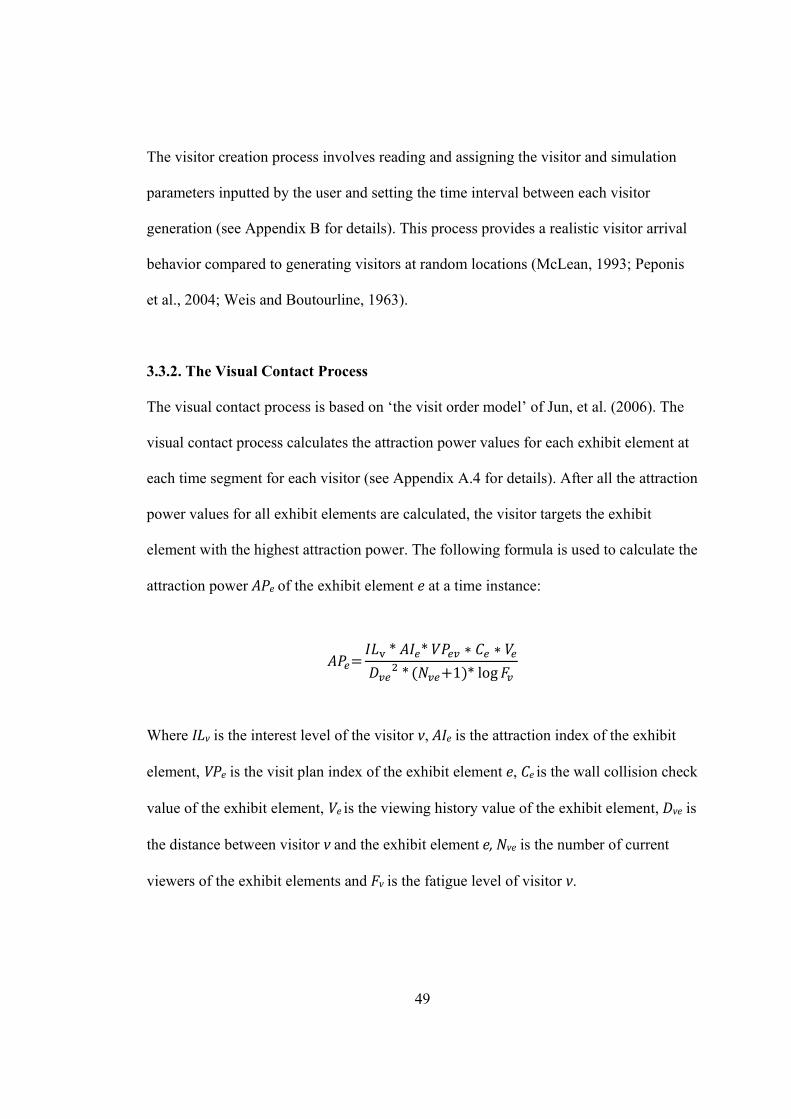
3.3.2. The Visual Contact Process
The visual contact process is based on ‘the visit order model’ of Jun, et al. (2006). The
visual contact process calculates the attraction power values for each exhibit element at
each time segment for each visitor (see Appendix A.4 for details). After all the attraction
power values for all exhibit elements are calculated, the visitor targets the exhibit
element with the highest attraction power. The following formula is used to calculate the
attraction power APe of the exhibit element e at a time instance:
* * * 1 * log
Where ILv is the interest level of the visitor v, AIe is the attraction index of the exhibit
element, VPe is the visit plan index of the exhibit element e, Ce is the wall collision check
value of the exhibit element, Ve is the viewing history value of the exhibit element, Dve is
the distance between visitor v and the exhibit element e, Nve is the number of current
viewers of the exhibit elements and Fv is the fatigue level of visitor v.
50
3.3.3. The Visitor Movement Process
The visitor movement process decides at a certain time segment if the visitor will be
walking, waiting or viewing (see Appendix A.5 for details).
As stated by Bruderlin and Calvert (1989) the walking speed for an adult may vary
between 0.50 meters and 1.05 meters a second. According to Bruderlin and Calvert
(1989), a natural walking speed is 0.77 meters per second. Therefore, for every time
segment a visitor moves a length of 0.77 meters. Pedestrians also adjust their walking
speeds according to other pedestrians along the path (Ashida, et al., 2001). Therefore, if
there is a visitor collision on the path of the visitor, then the visitor slows his/her
walking pace (see Appendix B for details).
For each time segment, the position and the rotation of each visitor are recorded as key
frames into the visitor circulation animation. After the simulation is processed, the
position of the animation time slider returns to its starting point and the user can view
the processed circulation of the visitors as an animation (see Figure 3.2).
3.3.4. The Active Engagement Process
The active engagement process is based on ‘the appreciation time model’ of Jun, et al.
(2006). The active engagement process assigns a viewing time value for the visitor in
viewing distance (see Appendix A.6 for details). The visitor stays at the viewing
distance of the exhibit element for the length of the holding time specified by the active
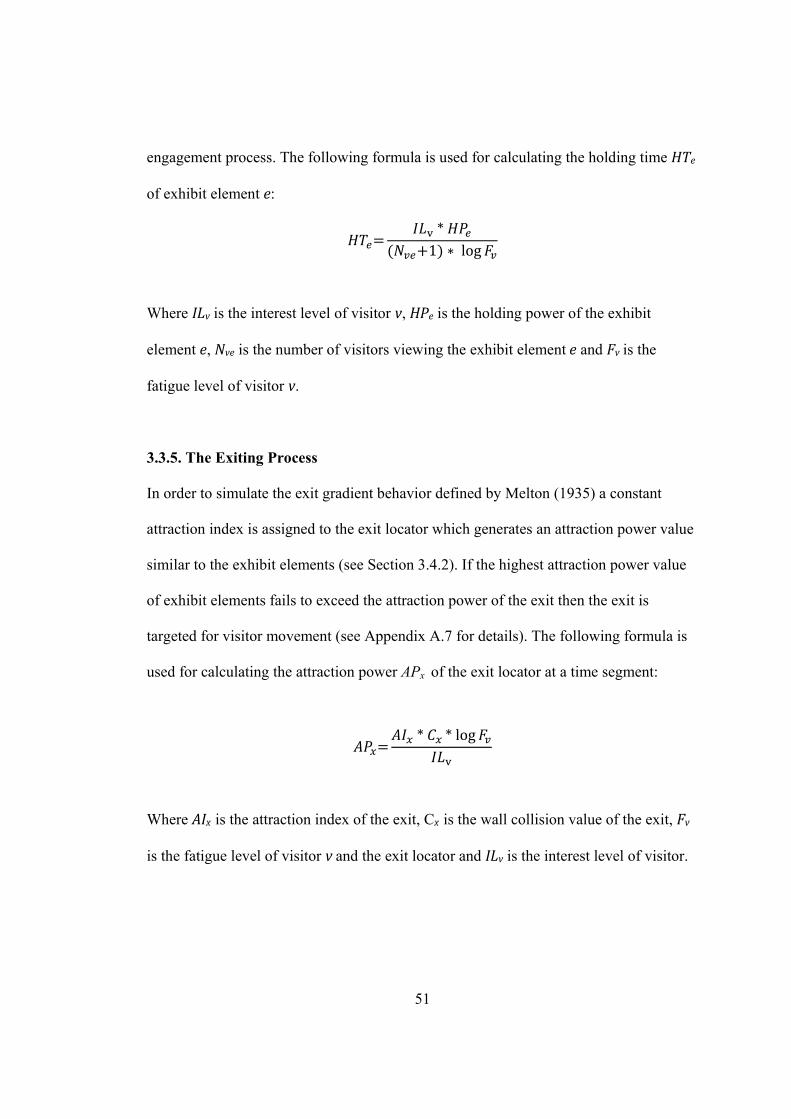
51
engagement process. The following formula is used for calculating the holding time HTe
of exhibit element e:
* 1 log
Where ILv is the interest level of visitor v, HPe is the holding power of the exhibit
element e, Nve is the number of visitors viewing the exhibit element e and Fv is the
fatigue level of visitor v.
3.3.5. The Exiting Process
In order to simulate the exit gradient behavior defined by Melton (1935) a constant
attraction index is assigned to the exit locator which generates an attraction power value
similar to the exhibit elements (see Section 3.4.2). If the highest attraction power value
of exhibit elements fails to exceed the attraction power of the exit then the exit is
targeted for visitor movement (see Appendix A.7 for details). The following formula is
used for calculating the attraction power APx of the exit locator at a time segment:
* * log
Where AIx is the attraction index of the exit, Cx is the wall collision value of the exit, Fv
is the fatigue level of visitor v and the exit locator and ILv is the interest level of visitor.

52
In this chapter, the integration of the collected literature data and the simulation
application is explained. In order to assess the functionality of the simulation
application, an example simulation of an exhibition environment is conducted. The
details and the outcomes of the simulation of the exhibition environment will be
explained in the next chapter.
53
4. SIMULATION OF AN EXHIBITION ENVIRONMENT
In this thesis, an example simulation of an exhibition environment is conducted in order
to assess the functionality of the simulation application during the exhibition layout
design process. Two exhibition environments are prepared as two phases of the design
problem according to the values proposed to the following requirement:
1- All exhibit elements should generate an average attraction power value greater
than 0.
2- Visual contacts with the exhibit elements should involve at least 60% of the
visitors.
3- Active engagements with the exhibit elements should involve at least 60% of the
visitors.
4- Holding times of the exhibit elements should be longer than 15 time segments.
During the two phases of the example design problem experiment two different
exhibition environments are designed and simulated with different exhibit element
layouts, but identical input parameters. The input and output parameters of both
exhibition environments are explained in the following sections. In the discussion
section, the output parameters of both exhibition environments are compared and the
outcomes are evaluated.
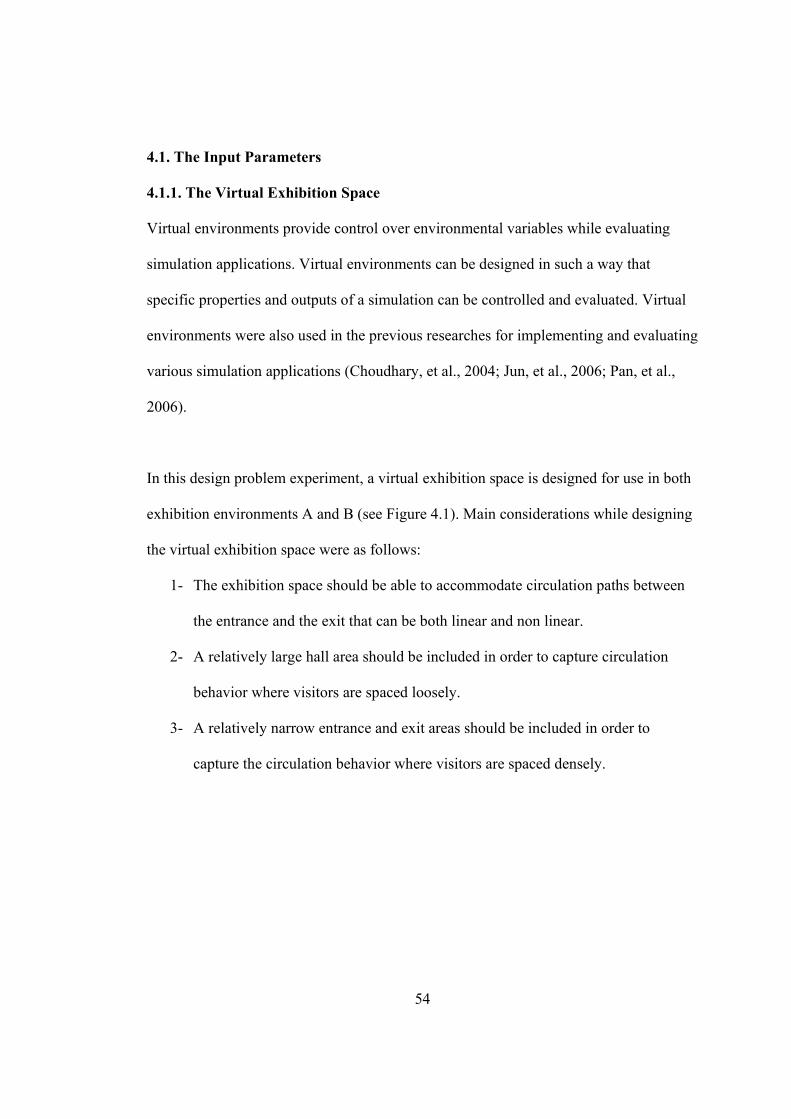
54
4.1. The Input Parameters
4.1.1. The Virtual Exhibition Space
Virtual environments provide control over environmental variables while evaluating
simulation applications. Virtual environments can be designed in such a way that
specific properties and outputs of a simulation can be controlled and evaluated. Virtual
environments were also used in the previous researches for implementing and evaluating
various simulation applications (Choudhary, et al., 2004; Jun, et al., 2006; Pan, et al.,
2006).
In this design problem experiment, a virtual exhibition space is designed for use in both
exhibition environments A and B (see Figure 4.1). Main considerations while designing
the virtual exhibition space were as follows:
1- The exhibition space should be able to accommodate circulation paths between
the entrance and the exit that can be both linear and non linear.
2- A relatively large hall area should be included in order to capture circulation
behavior where visitors are spaced loosely.
3- A relatively narrow entrance and exit areas should be included in order to
capture the circulation behavior where visitors are spaced densely.
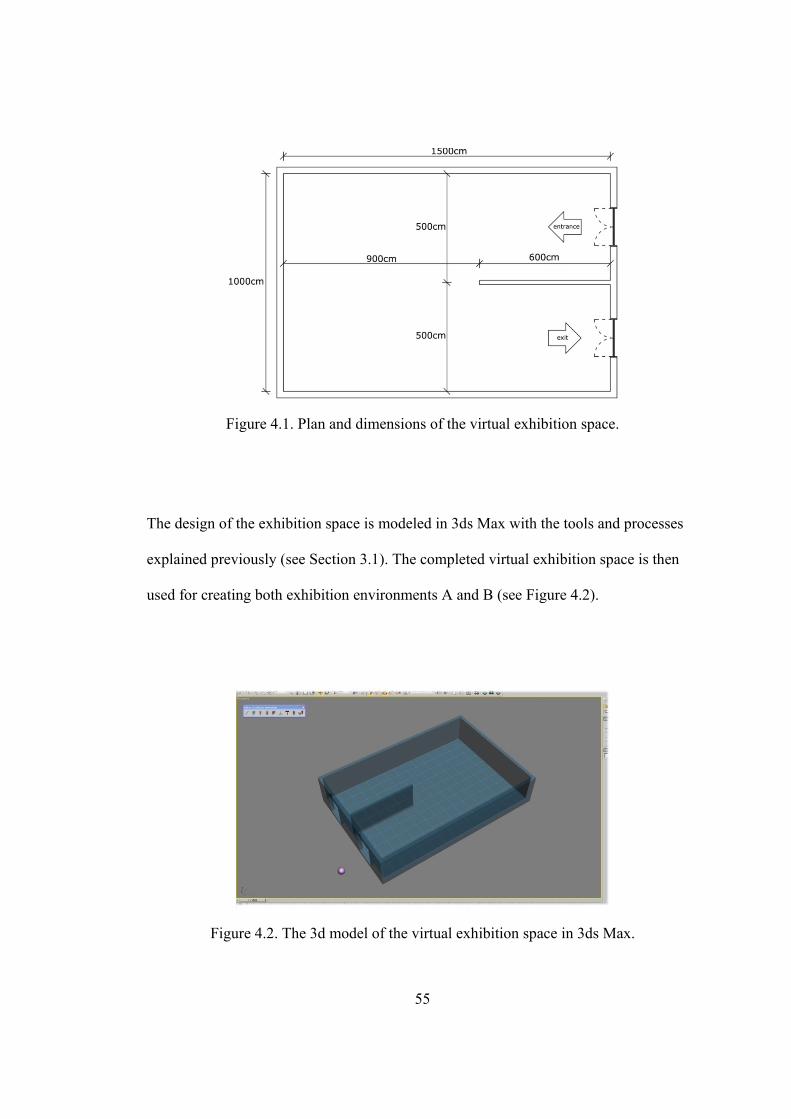
55
Figure 4.1. Plan and dimensions of the virtual exhibition space.
The design of the exhibition space is modeled in 3ds Max with the tools and processes
explained previously (see Section 3.1). The completed virtual exhibition space is then
used for creating both exhibition environments A and B (see Figure 4.2).
Figure 4.2. The 3d model of the virtual exhibition space in 3ds Max.
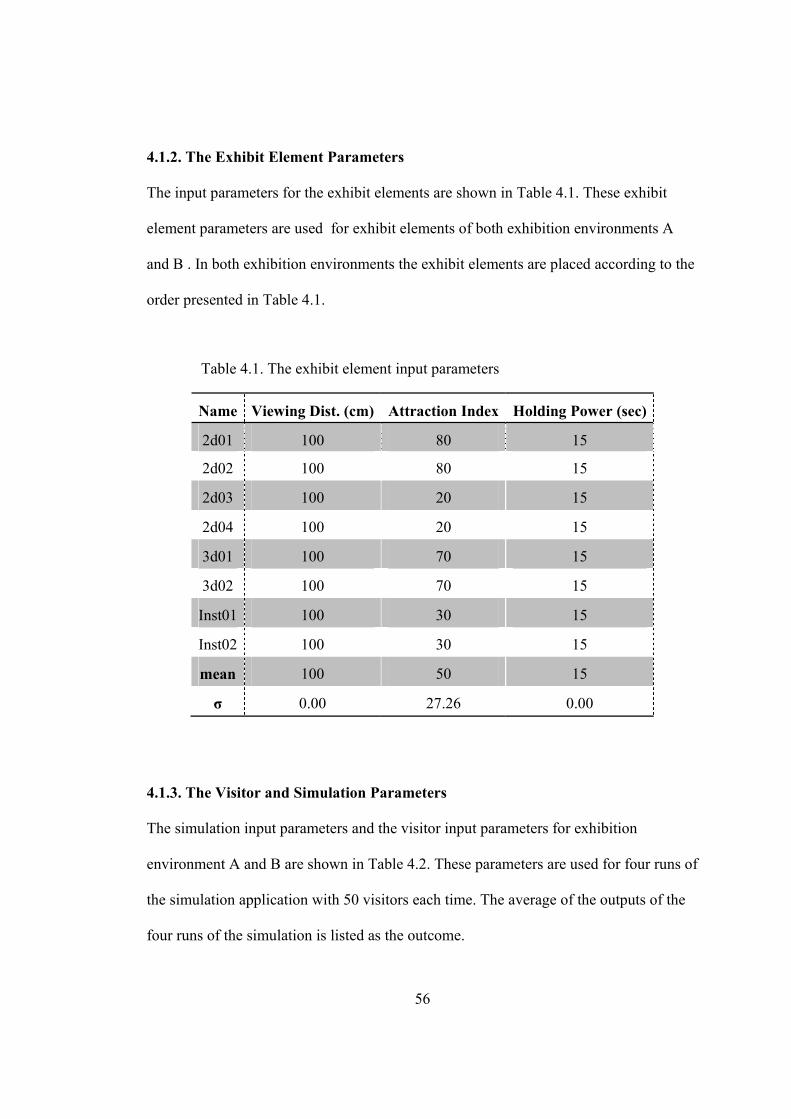
56
4.1.2. The Exhibit Element Parameters
The input parameters for the exhibit elements are shown in Table 4.1. These exhibit
element parameters are used for exhibit elements of both exhibition environments A
and B . In both exhibition environments the exhibit elements are placed according to the
order presented in Table 4.1.
Table 4.1. The exhibit element input parameters
Name Viewing Dist. (cm) Attraction Index Holding Power (sec)
2d01 100 80 15
2d02 100 80 15
2d03 100 20 15
2d04 100 20 15
3d01 100 70 15
3d02 100 70 15
Inst01 100 30 15
Inst02 100 30 15
mean 100 50 15
σ 0.00 27.26 0.00
4.1.3. The Visitor and Simulation Parameters
The simulation input parameters and the visitor input parameters for exhibition
environment A and B are shown in Table 4.2. These parameters are used for four runs of
the simulation application with 50 visitors each time. The average of the outputs of the
four runs of the simulation is listed as the outcome.
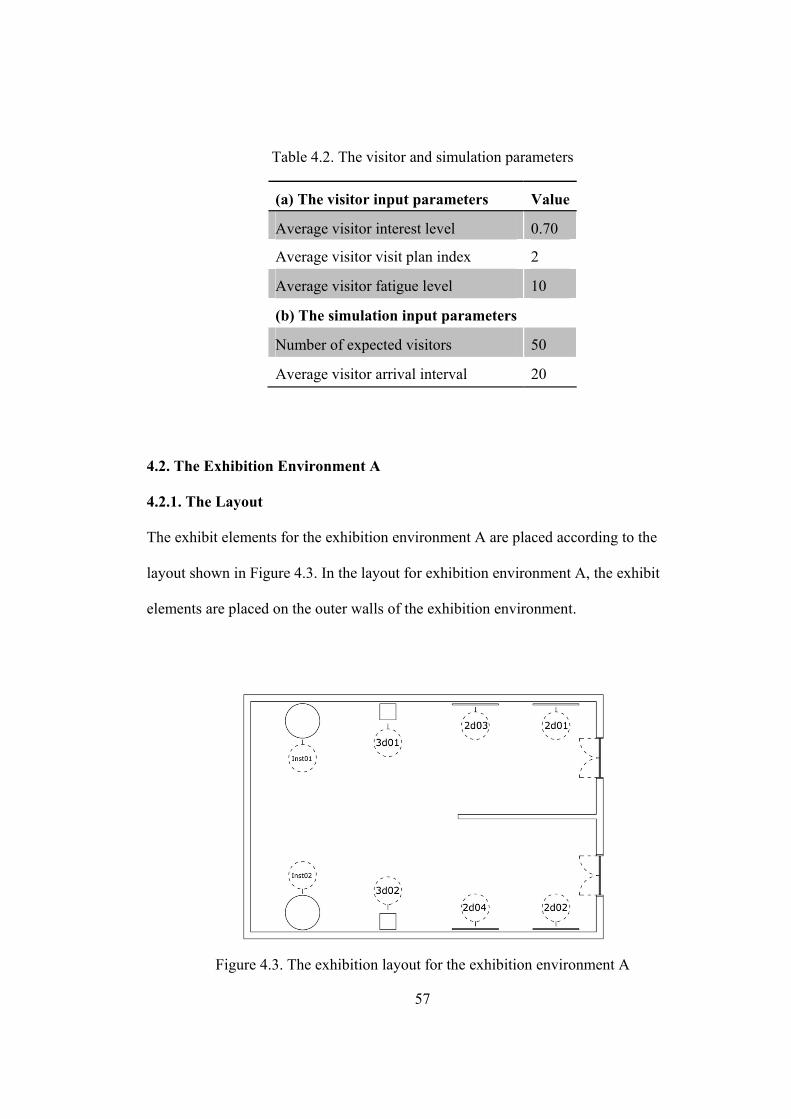
57
Table 4.2. The visitor and simulation parameters
(a) The visitor input parameters Value
Average visitor interest level 0.70
Average visitor visit plan index 2
Average visitor fatigue level 10
(b) The simulation input parameters
Number of expected visitors 50
Average visitor arrival interval 20
4.2. The Exhibition Environment A
4.2.1. The Layout
The exhibit elements for the exhibition environment A are placed according to the
layout shown in Figure 4.3. In the layout for exhibition environment A, the exhibit
elements are placed on the outer walls of the exhibition environment.
Figure 4.3. The exhibition layout for the exhibition environment A
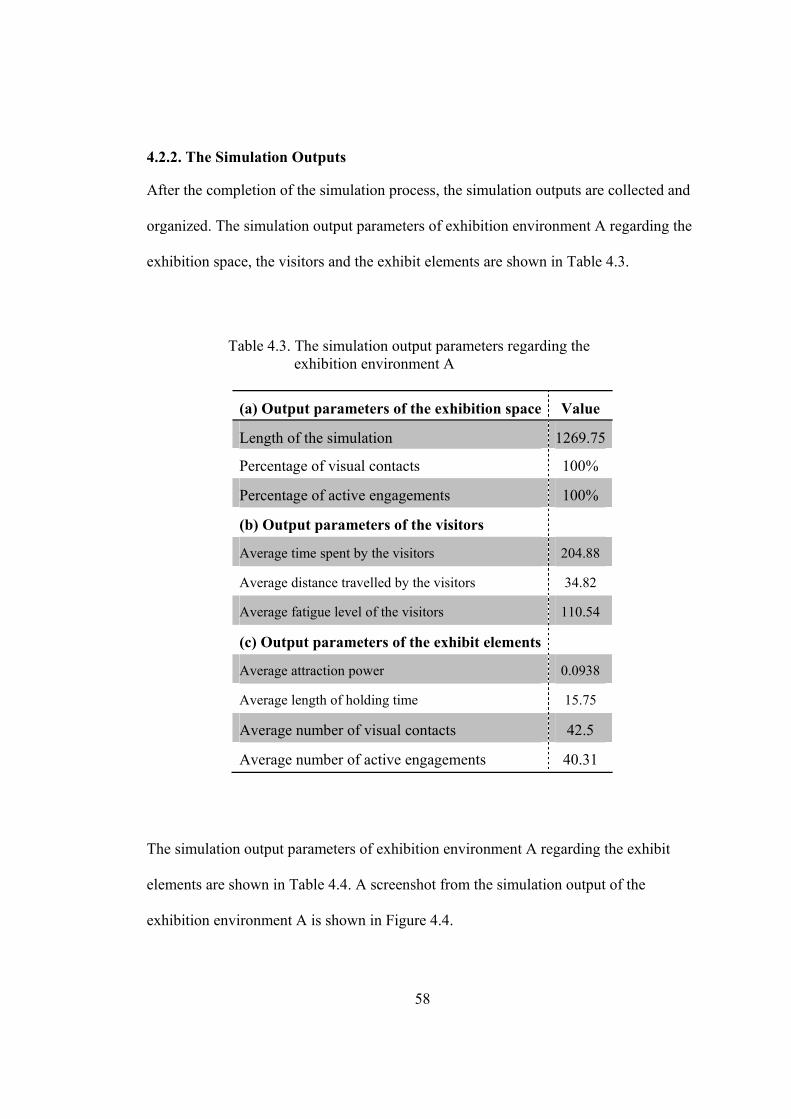
58
4.2.2. The Simulation Outputs
After the completion of the simulation process, the simulation outputs are collected and
organized. The simulation output parameters of exhibition environment A regarding the
exhibition space, the visitors and the exhibit elements are shown in Table 4.3.
Table 4.3. The simulation output parameters regarding the exhibition environment A
(a) Output parameters of the exhibition space Value
Length of the simulation 1269.75
Percentage of visual contacts 100%
Percentage of active engagements 100%
(b) Output parameters of the visitors
Average time spent by the visitors 204.88
Average distance travelled by the visitors 34.82
Average fatigue level of the visitors 110.54
(c) Output parameters of the exhibit elements
Average attraction power 0.0938
Average length of holding time 15.75
Average number of visual contacts 42.5
Average number of active engagements 40.31
The simulation output parameters of exhibition environment A regarding the exhibit
elements are shown in Table 4.4. A screenshot from the simulation output of the
exhibition environment A is shown in Figure 4.4.
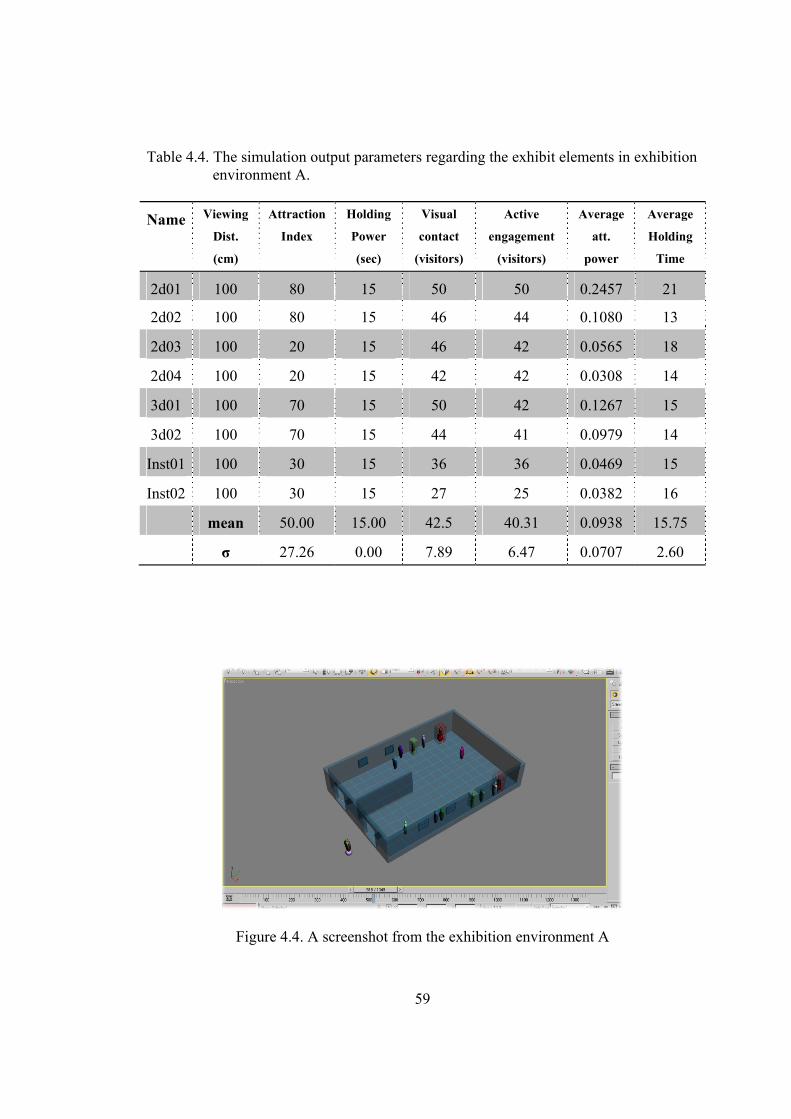
59
Table 4.4. The simulation output parameters regarding the exhibit elements in exhibition environment A.
Name Viewing
Dist.
(cm)
Attraction
Index
Holding
Power
(sec)
Visual
contact
(visitors)
Active
engagement
(visitors)
Average
att.
power
Average
Holding
Time
2d01 100 80 15 50 50 0.2457 21
2d02 100 80 15 46 44 0.1080 13
2d03 100 20 15 46 42 0.0565 18
2d04 100 20 15 42 42 0.0308 14
3d01 100 70 15 50 42 0.1267 15
3d02 100 70 15 44 41 0.0979 14
Inst01 100 30 15 36 36 0.0469 15
Inst02 100 30 15 27 25 0.0382 16
mean 50.00 15.00 42.5 40.31 0.0938 15.75
σ 27.26 0.00 7.89 6.47 0.0707 2.60
Figure 4.4. A screenshot from the exhibition environment A
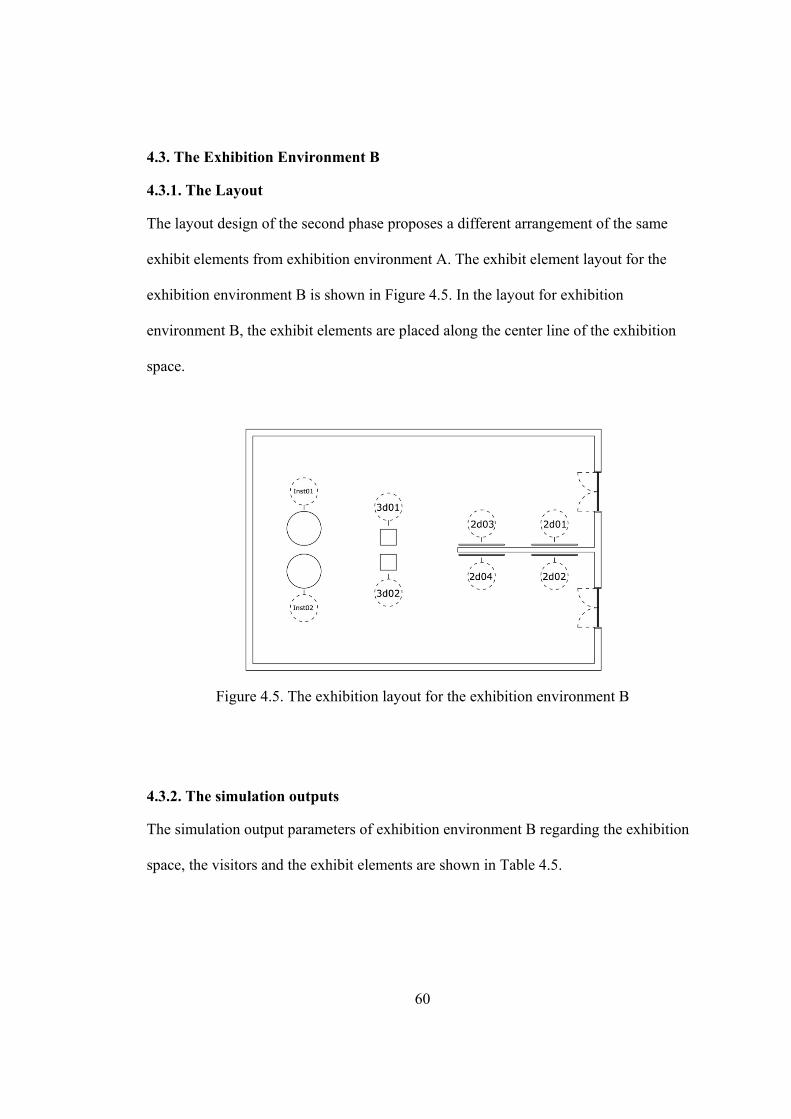
60
4.3. The Exhibition Environment B
4.3.1. The Layout
The layout design of the second phase proposes a different arrangement of the same
exhibit elements from exhibition environment A. The exhibit element layout for the
exhibition environment B is shown in Figure 4.5. In the layout for exhibition
environment B, the exhibit elements are placed along the center line of the exhibition
space.
Figure 4.5. The exhibition layout for the exhibition environment B
4.3.2. The simulation outputs
The simulation output parameters of exhibition environment B regarding the exhibition
space, the visitors and the exhibit elements are shown in Table 4.5.
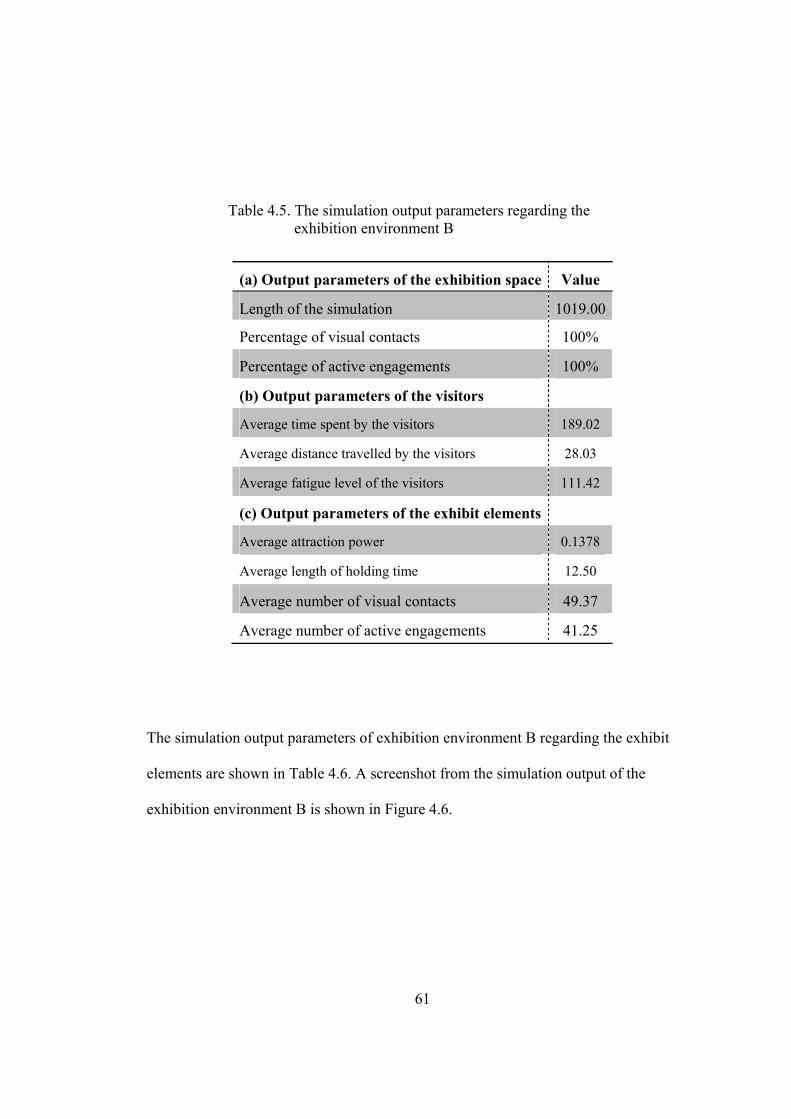
61
Table 4.5. The simulation output parameters regarding the
exhibition environment B
(a) Output parameters of the exhibition space Value
Length of the simulation 1019.00
Percentage of visual contacts 100%
Percentage of active engagements 100%
(b) Output parameters of the visitors
Average time spent by the visitors 189.02
Average distance travelled by the visitors 28.03
Average fatigue level of the visitors 111.42
(c) Output parameters of the exhibit elements
Average attraction power 0.1378
Average length of holding time 12.50
Average number of visual contacts 49.37
Average number of active engagements 41.25
The simulation output parameters of exhibition environment B regarding the exhibit
elements are shown in Table 4.6. A screenshot from the simulation output of the
exhibition environment B is shown in Figure 4.6.
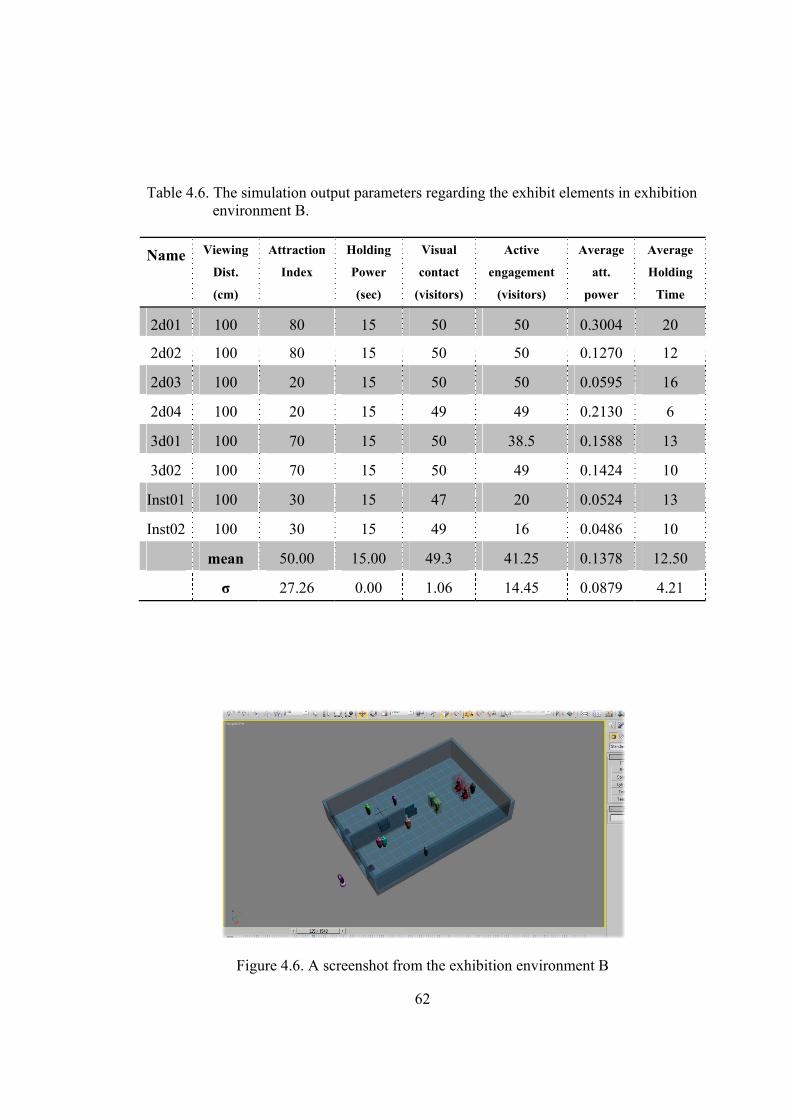
62
Table 4.6. The simulation output parameters regarding the exhibit elements in exhibition environment B.
Name Viewing
Dist.
(cm)
Attraction
Index
Holding
Power
(sec)
Visual
contact
(visitors)
Active
engagement
(visitors)
Average
att.
power
Average
Holding
Time
2d01 100 80 15 50 50 0.3004 20
2d02 100 80 15 50 50 0.1270 12
2d03 100 20 15 50 50 0.0595 16
2d04 100 20 15 49 49 0.2130 6
3d01 100 70 15 50 38.5 0.1588 13
3d02 100 70 15 50 49 0.1424 10
Inst01 100 30 15 47 20 0.0524 13
Inst02 100 30 15 49 16 0.0486 10
mean 50.00 15.00 49.3 41.25 0.1378 12.50
σ 27.26 0.00 1.06 14.45 0.0879 4.21
Figure 4.6. A screenshot from the exhibition environment B
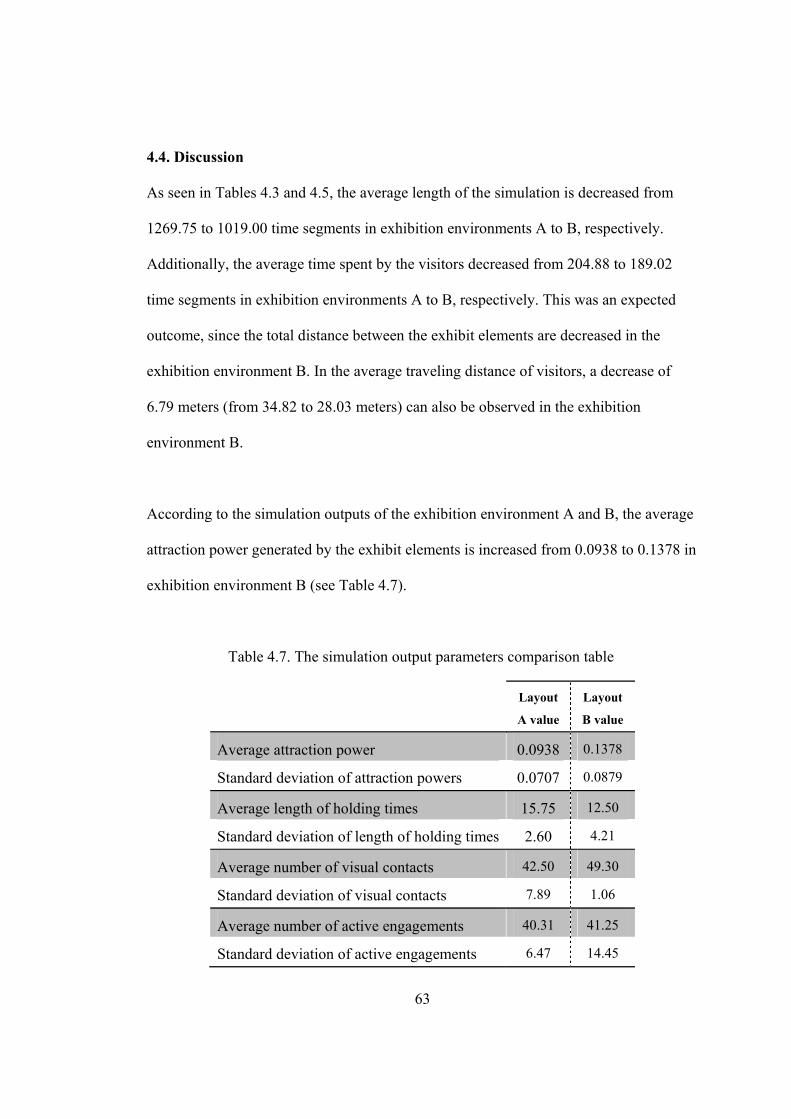
63
4.4. Discussion
As seen in Tables 4.3 and 4.5, the average length of the simulation is decreased from
1269.75 to 1019.00 time segments in exhibition environments A to B, respectively.
Additionally, the average time spent by the visitors decreased from 204.88 to 189.02
time segments in exhibition environments A to B, respectively. This was an expected
outcome, since the total distance between the exhibit elements are decreased in the
exhibition environment B. In the average traveling distance of visitors, a decrease of
6.79 meters (from 34.82 to 28.03 meters) can also be observed in the exhibition
environment B.
According to the simulation outputs of the exhibition environment A and B, the average
attraction power generated by the exhibit elements is increased from 0.0938 to 0.1378 in
exhibition environment B (see Table 4.7).
Table 4.7. The simulation output parameters comparison table
Layout
A value
Layout
B value
Average attraction power 0.0938 0.1378
Standard deviation of attraction powers 0.0707 0.0879
Average length of holding times 15.75 12.50
Standard deviation of length of holding times 2.60 4.21
Average number of visual contacts 42.50 49.30
Standard deviation of visual contacts 7.89 1.06
Average number of active engagements 40.31 41.25
Standard deviation of active engagements 6.47 14.45
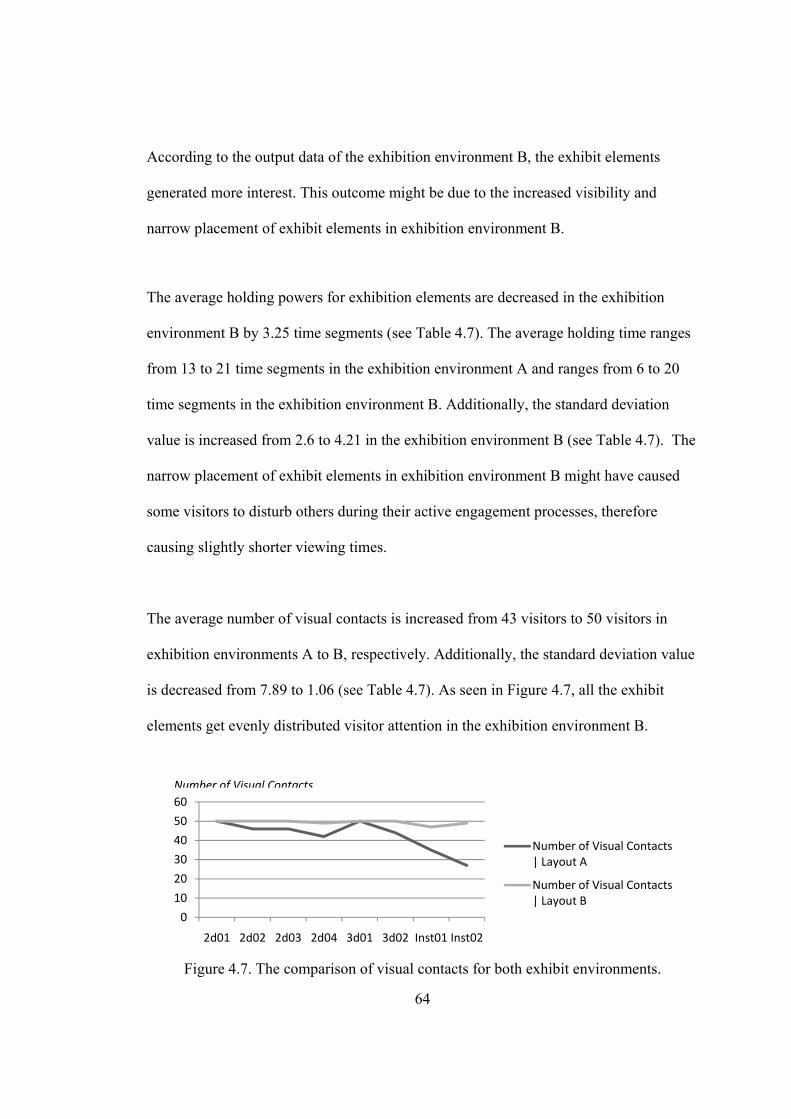
64
According to the output data of the exhibition environment B, the exhibit elements
generated more interest. This outcome might be due to the increased visibility and
narrow placement of exhibit elements in exhibition environment B.
The average holding powers for exhibition elements are decreased in the exhibition
environment B by 3.25 time segments (see Table 4.7). The average holding time ranges
from 13 to 21 time segments in the exhibition environment A and ranges from 6 to 20
time segments in the exhibition environment B. Additionally, the standard deviation
value is increased from 2.6 to 4.21 in the exhibition environment B (see Table 4.7). The
narrow placement of exhibit elements in exhibition environment B might have caused
some visitors to disturb others during their active engagement processes, therefore
causing slightly shorter viewing times.
The average number of visual contacts is increased from 43 visitors to 50 visitors in
exhibition environments A to B, respectively. Additionally, the standard deviation value
is decreased from 7.89 to 1.06 (see Table 4.7). As seen in Figure 4.7, all the exhibit
elements get evenly distributed visitor attention in the exhibition environment B.
Figure 4.7. The comparison of visual contacts for both exhibit environments.
Number of Visual Contacts
Exhibit Elements
0
10
20
30
40
50
60
2d01 2d02 2d03 2d04 3d01 3d02 Inst01 Inst02
Number of Visual Contacts | Layout A
Number of Visual Contacts | Layout B
(b)
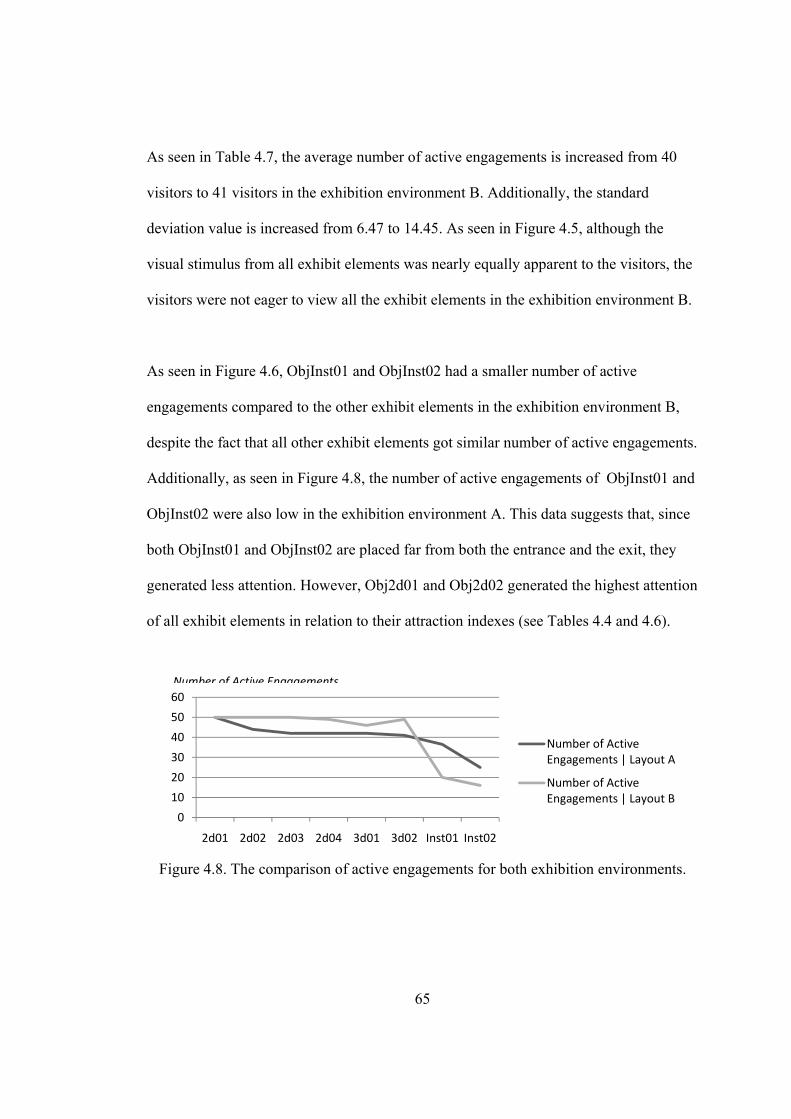
65
As seen in Table 4.7, the average number of active engagements is increased from 40
visitors to 41 visitors in the exhibition environment B. Additionally, the standard
deviation value is increased from 6.47 to 14.45. As seen in Figure 4.5, although the
visual stimulus from all exhibit elements was nearly equally apparent to the visitors, the
visitors were not eager to view all the exhibit elements in the exhibition environment B.
As seen in Figure 4.6, ObjInst01 and ObjInst02 had a smaller number of active
engagements compared to the other exhibit elements in the exhibition environment B,
despite the fact that all other exhibit elements got similar number of active engagements.
Additionally, as seen in Figure 4.8, the number of active engagements of ObjInst01 and
ObjInst02 were also low in the exhibition environment A. This data suggests that, since
both ObjInst01 and ObjInst02 are placed far from both the entrance and the exit, they
generated less attention. However, Obj2d01 and Obj2d02 generated the highest attention
of all exhibit elements in relation to their attraction indexes (see Tables 4.4 and 4.6).
Figure 4.8. The comparison of active engagements for both exhibition environments.
Number of Active Engagements
Exhibit Elements
0
10
20
30
40
50
60
2d01 2d02 2d03 2d04 3d01 3d02 Inst01 Inst02
Number of Active Engagements | Layout A
Number of Active Engagements | Layout B
(b)
66
5. CONCLUSION
In this thesis, a simulation application for visitor circulation in exhibition environments
is proposed. The model of this simulation application is based on the data collected from
the previous studies, so that the possible outcomes of a simulation process will generate
realistic outputs. These outputs can help the designer in preventing possible design
errors due to the lack of knowledge of visitor behavior.
As a result of the simulation application, the outputs obtained from both exhibition
environments suggested that, the change in the layout design of an exhibition space
results in a different visitor circulation patterns. Additionally, this change in behavior
can be clearly observed through the outputs of the proposed simulation application
before the exhibition elements are allocated in the real exhibition space. Additionally,
the outputs of the simulation application for both exhibition environments matches with
the real-world data collected in the previous researches (Kaynar, 2004; Peponis et al.,
2004). One more benefit of the simulation application is, with the visitor circulation
animation, it is possible to examine the visitor circulation paths, manipulate them and
take precautions before the final application of the exhibition environment.
During the development of the simulation application, Maxscript provided the
programming environment, however this scripting language was largely dependent on
the host program 3ds Max and was not very flexible. Therefore, some possibly useful
functions such as, displaying exhibit element and visitor properties at a certain time
segment while viewing the visitor circulation animation or simulation of visitor groups,
67
could not be implemented. However in the future studies, using the software
development kit of 3ds Max rather than the scripting language might prevent this
drawback.
The benefit from the simulation application proposed in this thesis can be extended
beyond exhibition environments. In the future studies, it is possible to propose similar
simulation applications for other interior design problems. Additionally architectural
features like ceiling height or effects of openings can also be implemented in the future
studies.
As a conclusion, the proposed simulation application offers a method for improving the
quality of the design of exhibition environments. The thesis may contribute to the
literature since it proposes a method for implementing a simulation application to the
early phases of the interior design process. The proposed simulation application may
also be useful to interior designers during the professional practice, since it helps the
designer to see, before the implementation of a design, if his/her assumptions and
decisions on certain qualities of the design will cause problems during the use of the
interior space before the final application of the product.
68
REFERENCES
Alt, M.B. (1979). Improving audio-visual representations. Curator, 22(2), 85-95. Alt, M.B., and Shaw, K.M. (1984). Characteristics of ideal museum exhibits. British
Journal of Psychology, 75, 25–36.
Andrews, K., and Asia, C. (1979). Teenagers’ attitudes about art museums. Curator, 22(3), 224 - 232.
Ashida, K., Lee, S.J., Allbeck, J.M., Sun, H., Balder, N.I., Metaxas, D. (2001). Pedestrians:
creating agent behaviors through statistical analysis of observation data. In Proceedings of Computer Animation (pp. 84-92). IEEE Computer Society.
Autodesk (2006). Autodesk Official Training Courseware: 3d Studio Max 9 Essentials. New
York: Focal Press. Autodesk (2008). Autodesk 3ds Max 2009 Help. Bicknell, S., and Mann, P. (1993). A Picture of Visitors for Exhibition. In G. Durbin (Ed.),
Developing Museum Exhibitions for Lifelong Learning (pp. 142-147). London: The Stationery Office.
Bitgood, S. (1996). Visitor orientation and circulation: Some general principles. In G.
Durbin (Ed.), Developing Museum Exhibitions for Lifelong Learning (pp.149-151). London: The Stationery Office.
Bitgood, S. (2002). Environmental psychology in museums, zoos, and other exhibition
centers. In R. B. Bechtel and A. Churchman (Eds.), Handbook of Environmental Psychology (pp.461-480). New York : John Wiley & Sons, Inc..
Bitgood, S. (2005). The cost-benefit ratio and visitor behavior. Presented at the Annual
Visitor Studies Conference, Philadelphia, PA. Bitgood, S. (2006). Capturing attention and creating value. Presented at the Annual
Meeting of the Alabama Museum Association, Anniston, AL. Bitgood, S. and Loomis, R.J. (1993). Environmental design and evaluation in museums.
Environment and Behavior, 25, 683-697. Bitgood, S. and Patterson, D.D. (1993). The effect of gallery changes on visitor reading and
object viewing time. Environment and Behavior, 25, 761-781.
69
Bitgood, S., Patterson, D., and Benefield, A. (1988). Exhibit design and visitor behavior: Empirical relationship. Environment and Behavior, 20, 474-491.
Bitgood, S., Hines, J., Hamberger, W., and Ford, W. (1992). Visitor circulation through a
changing exhibits gallery. In A. Benefield, S. Bitgood, and H. Shettel (Eds.), Visitor studies: Theory, research, and practice (pp. 103 - 114). Jacksonville, AL: Center for Social Design.
Boisvert, D.L. and Slez, B.J. (1995). The relationship between exhibit characteristics and
learning-associated behaviors in a science museum discovery space. Science Education, 79, 503–518.
Bollo, A. and Pozzolo, L. D. (2005). Analysis of Visitor Behavior Inside the Museum: An
Empirical Study. Retrieved September 30, 2007, from http://neumann.hec.ca/aimac2005/PDF_Text/BolloA_DalPozzoloL.pdf.
Borun, M. and Dritsas, J. (1997). Developing family-friendly exhibits. Curator, 40, 178–
196. Bozdağ, B.G. (2008). Proposal for a software model based on the critical analysis of
packages used in interior architecture. (Masters Thesis, Bilkent University). Breton, R. and Gerhard, M. (2007). Learning Autodesk 3dS Max 2008. New York: Focal
Press. Bruderlin, A. and Calvert, T. W. (1989). Goal-directed dynamic animation of human
walking. Computer Graphics, 23(3), 233-242. Choi Y. K., (1999) The morphology of exploration and encounter in museum layouts.
Environment and Planning B: Planning and Design, 26, 241-250. Choudhary, R., Malkawi, A., and Pampalambros B.Y. (2005). Analytic Target
Cascading in Simulation Based Building Design. Automation in Construction, 14, 551-568.
Csikszentmihalyi, M. and Hermanson, K. (1995). Intrinsic motivation in museums: Why
does one want to learn? In Falk, J.H. and Dierking, L.D. (Eds.), Public institutions for personal learning: Establishing a research agenda (pp. 67–77). Washington, DC: American Association of Museums.
Csikszentmihalyi, M. and Robinson, R. E. (1991). The Art of Seeing: An Interpretation of
the Aesthetic Encounter. Los Angeles: Getty Center for Education in the Arts.
70
D’Agostino, J., Loomis, R., and Webb, B. (1991). Attitudes, beliefs, intended behaviors, and exhibit evaluation. In A. Benefield, S. Bitgood, and H. Shettel (Eds.), Visitor studies: Theory, research, and practice, vol. 4 (pp. 92-102). Jacksonville, AL: Center for Social Design.
Davies, S. (1994). The Museum Visitor: Statistical Information and Trends. In G. Durbin
(Ed.), Developing Museum Exhibitions for Lifelong Learning (pp. 52-55). London: The Stationery Office.
Dean, D. (1994). Museum Exhibition: Theory and Practice. London: Routledge. Deans, C., Martin, J., Neon, K., Nuesea, B. and O’Reilly, J. (1987). A Zoo for Who? A Pilot
Study in Zoo Design for Children. The Reid Park Zoo. Jacksonville, AL: Center for Social Design.
Deci, E.L. and Ryan, R.M. (1985). Intrinsic motivation and self-determination in human
behavior. New York: Plenum. Doering, Z.D. (1999). Strangers, guests, or clients? Visitor experiences in museums.
Curator, 42, 74-78. Eckel, G. and Beckhaus, S. (2001). ExViz: A virtual exhibition design environment. In
Proceedings of the International Symposium on Virtual and Augmented Architecture, Trinity College, Dublin, 21-22 June 2001 (pp. 171-182).
Falk, J.H. (1993). Assessing the impact of exhibit arrangement on visitor behavior and
learning. Curator, 36, 133-146. Falk, J.H. and Dierking, L.D. (1992). The museum experience. Washington D.C.:
Whalesback Books. Graf, B. (1994). Visitor Studies in Germany: Methods and Examples. In R. Miles and L.
Zavala (eds.). Toward the Museum of The Future: New European Perspectives (pp.75-80). London: Routledge.
Gorman, A. (2008). Museum Education Assessment: Survey of Practitioners in Florida Art
Museums. (Doctoral Thesis, Florida State University). Hein, G. (1998). Learning in the Museum. London: Routledge. Hooper-Greenhill, E. (1994). Museums and Their Visitors. London-New York: Routledge. Hooper-Greenhill, E. (1999). The educational Role of the Museum. London-New York:
Routledge.
71
Hooper-Greenhill, E. and Moussouri, T. (2001). Making Meaning in Art Museums 2: Visitors’ Interpretive Strategies at Nottingham Castle Museum and Art Gallery. Leicester: RCMG.
Iyer, B. and Gottlied, R. (2004). The four-domain arhitecture: An approach to support
enterprise architecture design. IBM systems Journal, 43(3), 587-597. Jun, K., Sung, M.Y. and Choi, B. (2006). Steering behavior model of visitor NPCs in virtual
exhibition. In Z. Pan, et al. (Eds), Advances in Artificial Reality and Tele-Existence: 16th International Conference on Artificial Reality and Telexistence, ICAT 2006, Hangzhou, China (pp. 113-121). Heidelberg: Springer Berlin.
Kang, K.C., Cohen, S.G., Hess, J.A., Novak, W.E. and Peterson, A.S. (1990). Feature
Oriented Domain Analysis (FODA) Feasibility Study, Technical report CMU/SEI-90-TR-21, Software Engineering Institute, Carnegy Mellon University, Pittsburgh, PA.
Kaynar, İ. (2004). Visibility, movement paths and preferences in open plan museums: An
observational and descriptive study of the Ann Arbor Hands-on Museum. Retrieved November 15, 2008, from http://www.spacesyntax.tudelft.nl/media/longpapers2/ipekkaynar.pdf
Klein, H. (1993). Tracking visitor circulation in museum settings. Environment and
Behavior, 25(6), 782–800. Kelly, L. (2002a). What do people want from their museum experiences. Retrieved
September 29, 2007, from http://www.amonline.net.au/amarc/pdf/research/needs.pdf. Kelly, L. (2002b). What do people do when they visit a museum. Retrieved September
29, 2007, from http://www.amonline.net.au/amarc/pdf/research/visitorbehaviour.pdf. Kelly, L. (2002c). Australian museum visitors. Retrieved September 29, 2007, from
http://www.amonline.net.au/amarc/pdf/research/visitors.pdf. Kicinger, R., Arciszewski, T., and De Jong, K. (2005). Evolutionary Computation
and Structural Design: A Survey of the State‐of‐Art. Computers and Structures, 83, 1943‐1978.
Koran, J.J. Jr., Koran, M.L., and Longino, S.J. (1986). The relationship of age, sex,
attention, and holding power with two types of science exhibits. Curator, 29, 227–235. Koran, J.J. Jr., Morrison, L., Lehman, J.R., Koran, M.L., and Gandara, L. (1984). Attention
and curiosity in museums. Journal of Research in Science Teaching, 21, 357–363. Lawson, B. (1997). How designers think: The design process demystified. Oxford:
Architectural Press.
72
Leinhardt, G. and Crowley, K. (1998). Museum Learning as Controversial Elaboration: A Proposal to Capture, Code and Analyze Talk in Museums. . Retrieved September 30, 2007, from http://mlc.lrdc.pitt.edu/mlc.
Loomis, R. (1987). Museum Visitor Evaluation: New Tool for Management. Nashville:
American Association for State and Local History. McLean, K. (1993). Planning for People in Museum Exhibitions. Washington, DC:
Association of Science-Technology Centers. McManus, P.M. (1991). Visitors: Their expectations and social behavior. In G. Durbin
(Ed.), Developing Museum Exhibitions for Lifelong Learning (pp. 59-62). London: The Stationery Office.
Melton, A. (1935). Problems of Installation in Museums of Art. American Association of
Museums Monograph New Series No. 14. Washington, DC: American Association of Museums.
Melton, A. (1972). Visitor behavior in museums: Some early research in environmental
design. Human Factors, 14(5), 393-403.
Neal A. (1987). Help for the Small Museum: Handbook of Exhibit Ideas and Methods. New York: Pruett.
Pan, X., Han, C., Dauber, K. and Law, K. (2006). Human and social behavior in
computational modeling and analysis of egress. Automation in Construction, 15(4), 448–461.
Parsons, M., and R. Loomis. (1973). Visitor Traffic Patterns: Then and Now. Washington,
DC: Office of Museum Programs, Smithsonian Institution. Peponis, J. and Stravroulaki, G. (2003) The spatial construction of seeing Castelveccio.
Proceedings, 4th International Space Syntax Symposium, London, University College London.
Peponis, J., Dalton, R.C., Wineman, J., and Dalton, N. (2004). Measuring the effects of
layout upon visitors’ spatial behaviors in open plan exhibition settings. Environment and Planning B: Planning and Design, 31, 453-473.
Peart, B. (1984). Impact of exhibit type on knowledge gain, attitudes, and behavior.
Curator, 27, 220–237.
Porter, M. (1938). The Behavior of the Average Visitor in the Peabody Museum of Natural History. American Association of Museums Monograph New Series No. 16. Washington, DC: American Association of Museums.
73
Robinson, S. (2004). Simulation: The practice of model development and use. New York: John Wiley & Sons.
Rounds, J. (2004). Strategies for the curiosity-driven museum visitor. Curator: The Museum
Journal, 47 (4), 389-411. Schiefele, U. and Rheinberg, F. (1997). Motivation and knowledge acquisition. In Maehr,
M.L. and Pintrich, P.R. (Eds.), Advances in motivation and achievement, Vol. 10 (pp. 251–301). Greenwich, CT: JAI Press.
Sandifer, C. (2003). Technological novelty and open endedness: Two characteristics of
interactive exhibits that contribute to the holding of visitor attention in a science museum. Journal of Research in Science Teaching, 40, 131-137.
Saunders R., Gero, J. S. (2004). Curious Agents and situated Design Evaluations. Artificial
Intelligence for Engineering Design, 18, 153-161. Screven, C.G. (1976). Exhibit evaluation: a goal-reference approach. Curator, 19, 271-
190. Serrell, B. (1996). Using Behavior to Define the Effectiveness of Exhibitions . In G. Durbin
(Ed.), Developing Museum Exhibitions for Lifelong Learning (pp. 224-227). London: The Stationery Office.
Serrell, B. (1997). Paying attention: the duration and allocation of visitors’ time in museum
exhibitions. Curator 40, 108-125. Shettel, H. (2005). Interacting with interactives. Curator: The Museum Journal, 48(2), 210–
212. Soren, B. (1999). Meeting the needs of museum visitor. In G. Dexter Lord and B. Lord
(Eds.) The Manual of Museum Planning (pp. 55-67). London: The Stationary Office. Sparacino, F. (2002). Real-time Sensor-Dirven Understanding of Visitors’ Interests for
Personalized Visually Augmented Museum Experiences. Retrieved November 15, 2008, from http://www.archimuse.com/mw2002/papers/sparacino/sparacino.html.
Spencer, H.A.D. (1999). Exhibition Development. In G. Dexter Lord and B. Lord (Eds.)
The Manual of Museum Planning (pp.155-173). London: The Stationary Office. Talbot, J.F., Kaplan, R., Kuo, F.E., and Kaplan, S. (1993). Factors that enhance
effectiveness of visitor maps. Environment and Behavior, 25, 743-760. Taylor, S. (1986). Understanding processes of informal education: A naturalistic study of
visitors to a public aquarium. Unpublished doctoral dissertation. University of California, Berkeley, CA.

74
Weis, R., and Boutourline S. (1963). The communication value of exhibits. Museum News,
(Nov.), 23–27. Whyte, W. (1980). The Social Life of Small Urban Spaces. Washington, DC: The
Conservation Foundation. Whyte, W. (1988). City: Rediscovering the Center. New York: Doubleday.

75
APPENDIX A
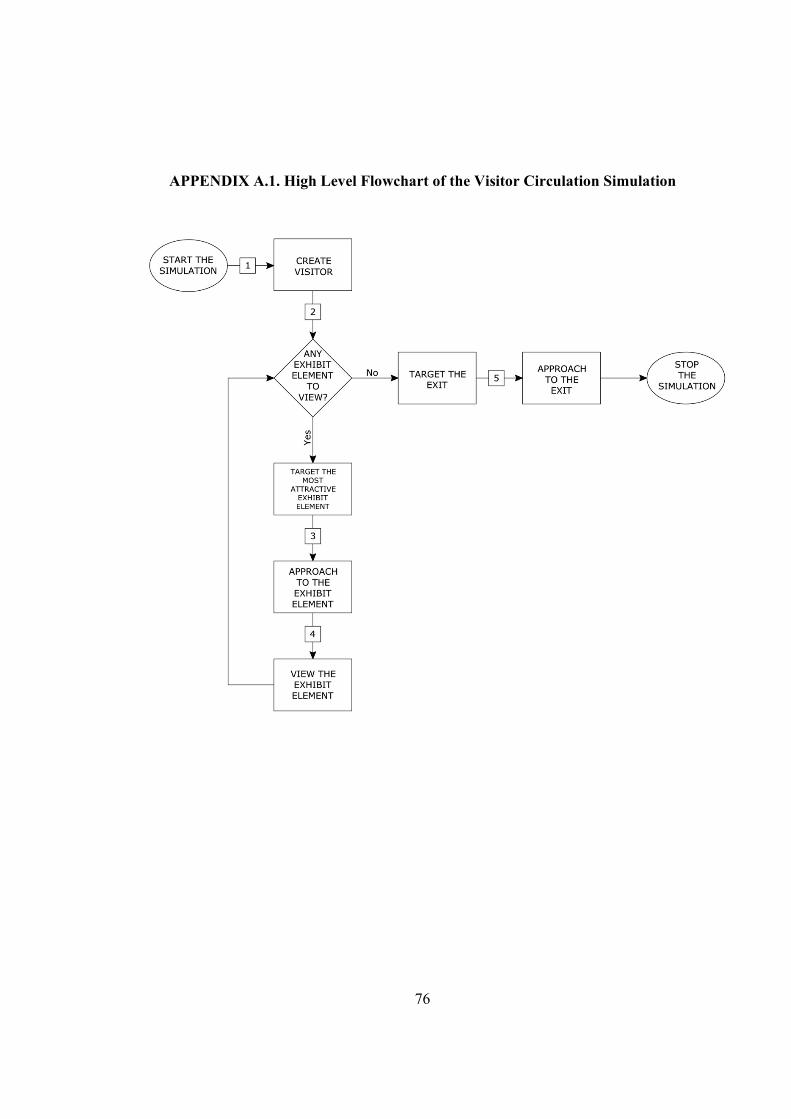
76
APPENDIX A.1. High Level Flowchart of the Visitor Circulation Simulation
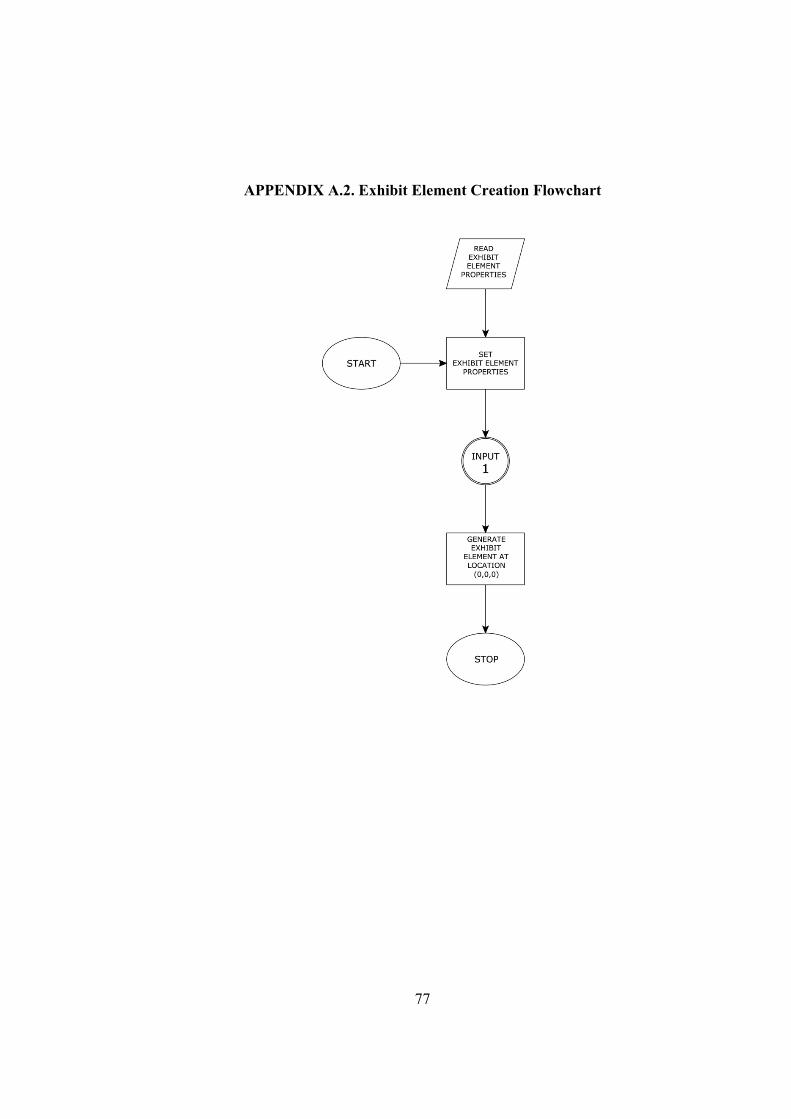
77
APPENDIX A.2. Exhibit Element Creation Flowchart
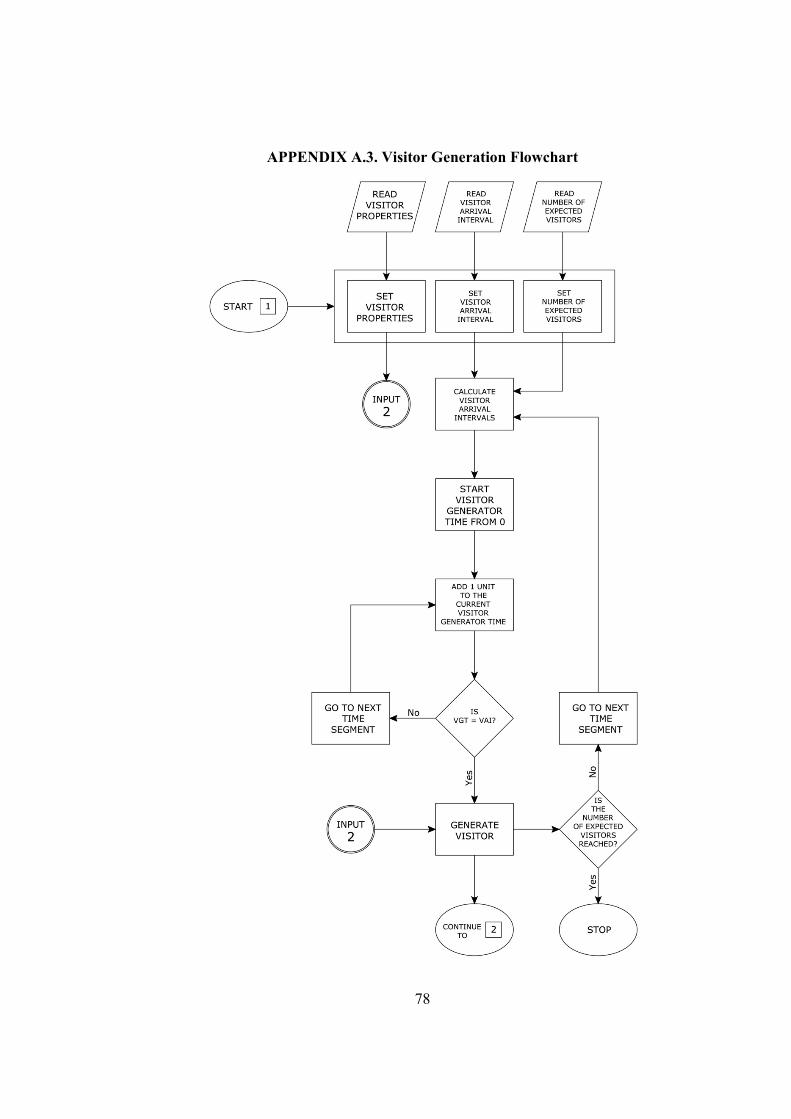
78
APPENDIX A.3. Visitor Generation Flowchart
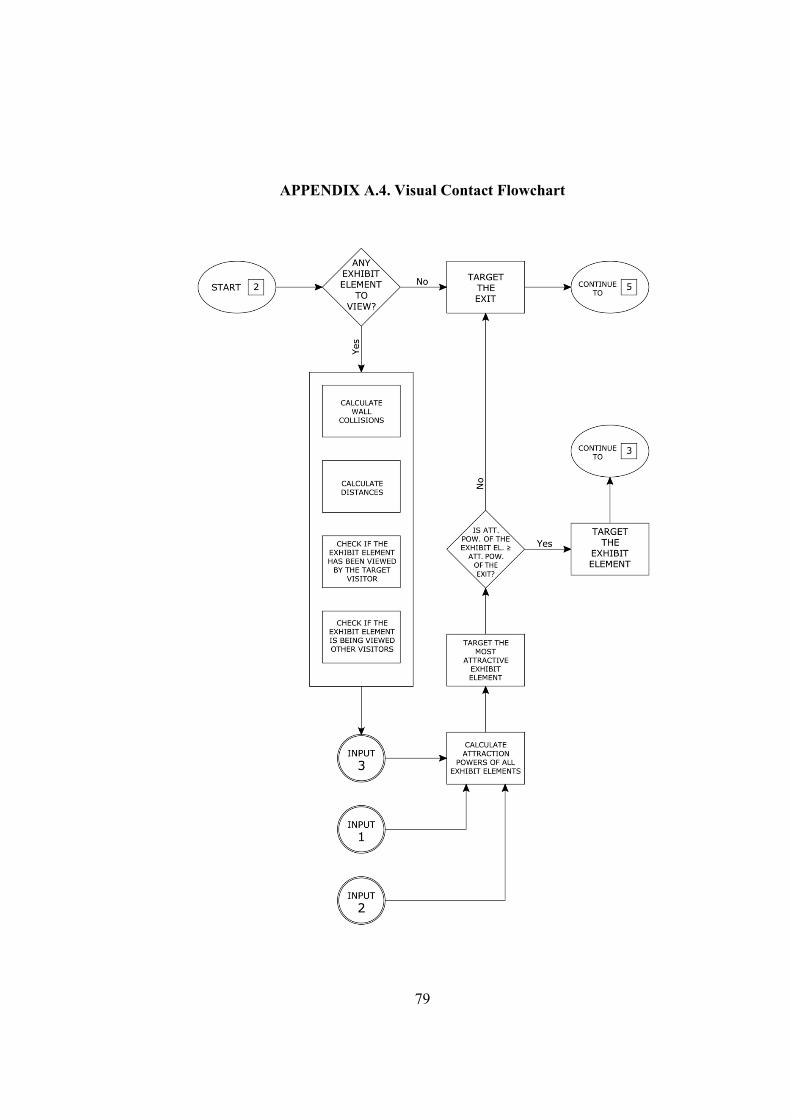
79
APPENDIX A.4. Visual Contact Flowchart
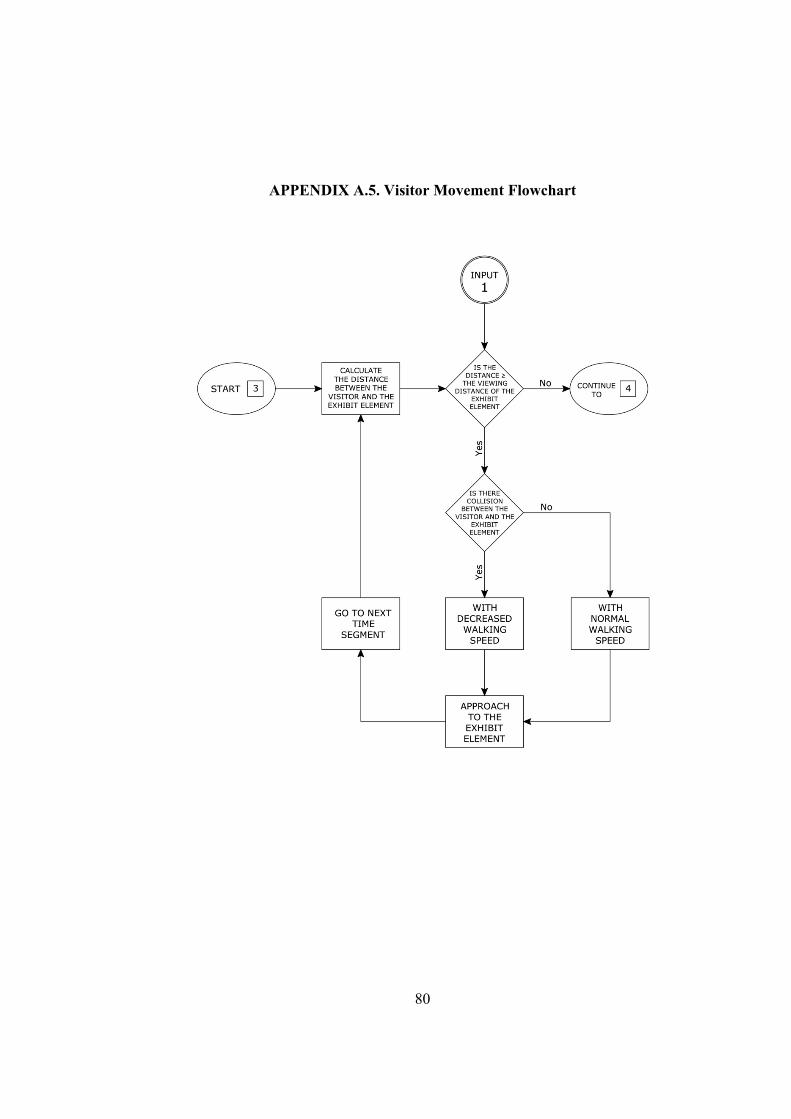
80
APPENDIX A.5. Visitor Movement Flowchart
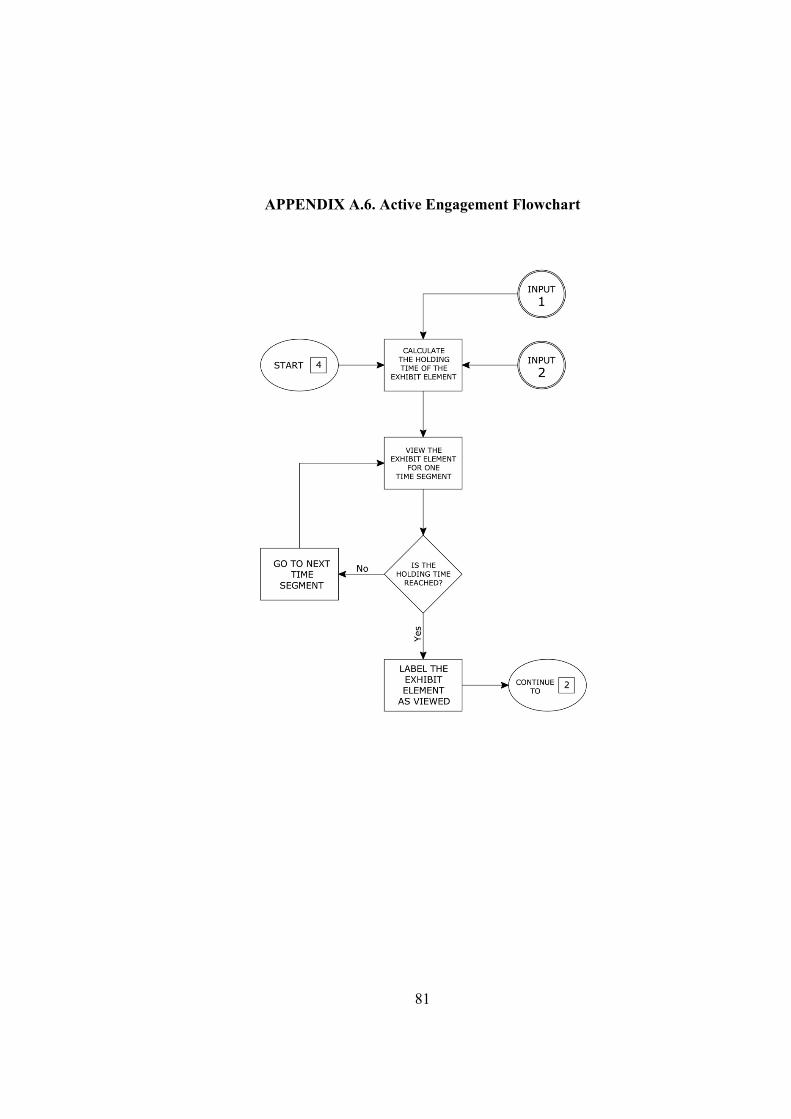
81
APPENDIX A.6. Active Engagement Flowchart
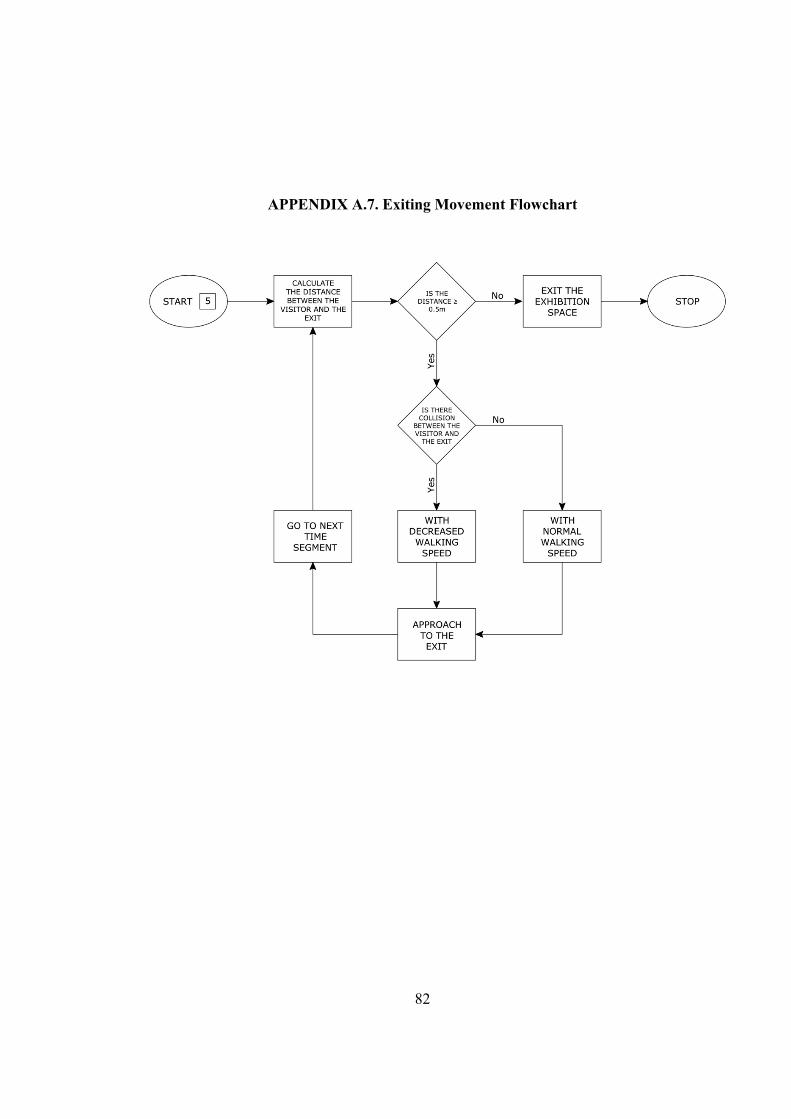
82
APPENDIX A.7. Exiting Movement Flowchart

83
APPENDIX B
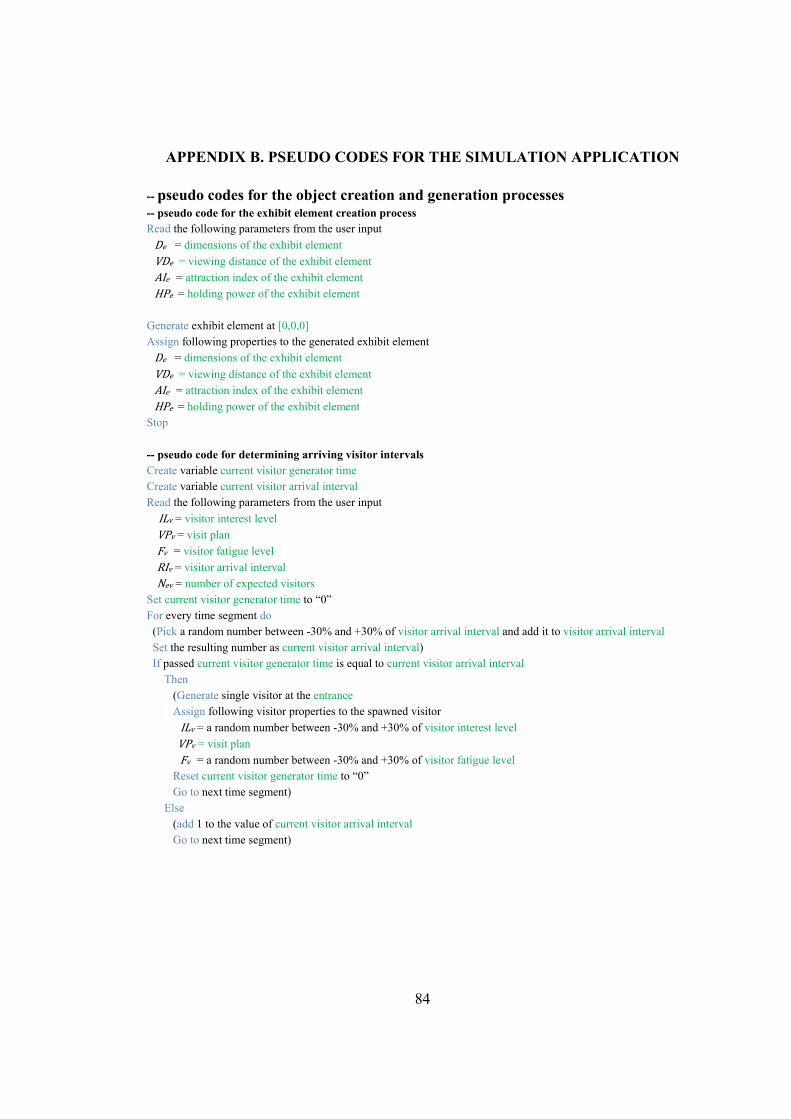
84
APPENDIX B. PSEUDO CODES FOR THE SIMULATION APPLICATION -- pseudo codes for the object creation and generation processes -- pseudo code for the exhibit element creation process Read the following parameters from the user input De = dimensions of the exhibit element VDe = viewing distance of the exhibit element AIe = attraction index of the exhibit element HPe = holding power of the exhibit element Generate exhibit element at [0,0,0] Assign following properties to the generated exhibit element De = dimensions of the exhibit element VDe = viewing distance of the exhibit element AIe = attraction index of the exhibit element HPe = holding power of the exhibit element Stop -- pseudo code for determining arriving visitor intervals Create variable current visitor generator time Create variable current visitor arrival interval Read the following parameters from the user input ILv = visitor interest level VPv = visit plan Fv = visitor fatigue level RIv = visitor arrival interval Nev = number of expected visitors Set current visitor generator time to “0” For every time segment do (Pick a random number between -30% and +30% of visitor arrival interval and add it to visitor arrival interval Set the resulting number as current visitor arrival interval) If passed current visitor generator time is equal to current visitor arrival interval Then (Generate single visitor at the entrance Assign following visitor properties to the spawned visitor ILv = a random number between -30% and +30% of visitor interest level VPv = visit plan Fv = a random number between -30% and +30% of visitor fatigue level Reset current visitor generator time to “0” Go to next time segment) Else (add 1 to the value of current visitor arrival interval Go to next time segment)
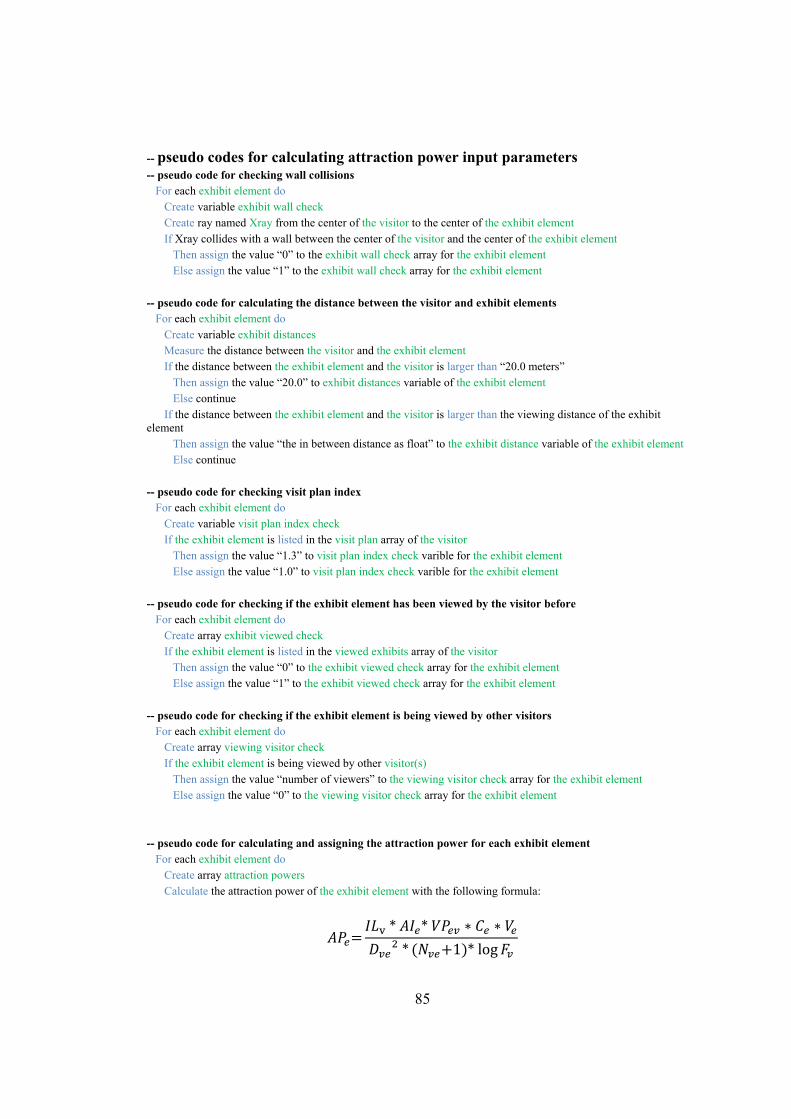
85
-- pseudo codes for calculating attraction power input parameters -- pseudo code for checking wall collisions For each exhibit element do Create variable exhibit wall check Create ray named Xray from the center of the visitor to the center of the exhibit element If Xray collides with a wall between the center of the visitor and the center of the exhibit element Then assign the value “0” to the exhibit wall check array for the exhibit element Else assign the value “1” to the exhibit wall check array for the exhibit element -- pseudo code for calculating the distance between the visitor and exhibit elements For each exhibit element do Create variable exhibit distances Measure the distance between the visitor and the exhibit element If the distance between the exhibit element and the visitor is larger than “20.0 meters” Then assign the value “20.0” to exhibit distances variable of the exhibit element Else continue If the distance between the exhibit element and the visitor is larger than the viewing distance of the exhibit element Then assign the value “the in between distance as float” to the exhibit distance variable of the exhibit element Else continue -- pseudo code for checking visit plan index For each exhibit element do Create variable visit plan index check If the exhibit element is listed in the visit plan array of the visitor Then assign the value “1.3” to visit plan index check varible for the exhibit element Else assign the value “1.0” to visit plan index check varible for the exhibit element -- pseudo code for checking if the exhibit element has been viewed by the visitor before For each exhibit element do Create array exhibit viewed check If the exhibit element is listed in the viewed exhibits array of the visitor Then assign the value “0” to the exhibit viewed check array for the exhibit element Else assign the value “1” to the exhibit viewed check array for the exhibit element -- pseudo code for checking if the exhibit element is being viewed by other visitors For each exhibit element do Create array viewing visitor check If the exhibit element is being viewed by other visitor(s) Then assign the value “number of viewers” to the viewing visitor check array for the exhibit element Else assign the value “0” to the viewing visitor check array for the exhibit element -- pseudo code for calculating and assigning the attraction power for each exhibit element For each exhibit element do Create array attraction powers Calculate the attraction power of the exhibit element with the following formula:
* * * 1 * log
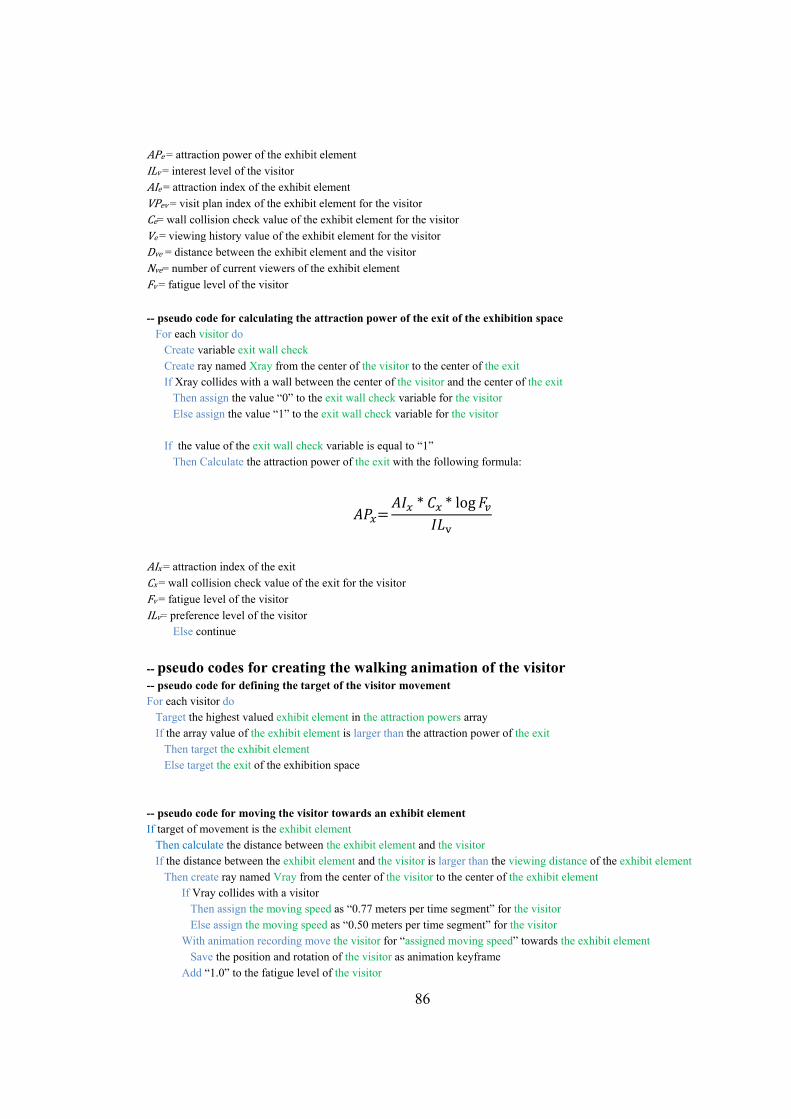
86
APe = attraction power of the exhibit element ILv = interest level of the visitor AIe = attraction index of the exhibit element VPev = visit plan index of the exhibit element for the visitor Ce= wall collision check value of the exhibit element for the visitor Ve = viewing history value of the exhibit element for the visitor Dve = distance between the exhibit element and the visitor Nve= number of current viewers of the exhibit element Fv = fatigue level of the visitor -- pseudo code for calculating the attraction power of the exit of the exhibition space For each visitor do Create variable exit wall check Create ray named Xray from the center of the visitor to the center of the exit If Xray collides with a wall between the center of the visitor and the center of the exit Then assign the value “0” to the exit wall check variable for the visitor Else assign the value “1” to the exit wall check variable for the visitor If the value of the exit wall check variable is equal to “1” Then Calculate the attraction power of the exit with the following formula:
* * log
AIx = attraction index of the exit Cx = wall collision check value of the exit for the visitor Fv = fatigue level of the visitor ILv= preference level of the visitor Else continue -- pseudo codes for creating the walking animation of the visitor -- pseudo code for defining the target of the visitor movement For each visitor do Target the highest valued exhibit element in the attraction powers array If the array value of the exhibit element is larger than the attraction power of the exit Then target the exhibit element Else target the exit of the exhibition space -- pseudo code for moving the visitor towards an exhibit element If target of movement is the exhibit element Then calculate the distance between the exhibit element and the visitor If the distance between the exhibit element and the visitor is larger than the viewing distance of the exhibit element Then create ray named Vray from the center of the visitor to the center of the exhibit element If Vray collides with a visitor Then assign the moving speed as “0.77 meters per time segment” for the visitor Else assign the moving speed as “0.50 meters per time segment” for the visitor With animation recording move the visitor for “assigned moving speed” towards the exhibit element Save the position and rotation of the visitor as animation keyframe Add “1.0” to the fatigue level of the visitor

87
-- pseudo code for viewing the exhibit element If the distance between the exhibit element and the visitor is smaller than the viewing distance of the exhibit element Then calculate holding time of the exhibit element for the visitor with the following formula
* 1 log
HTe = holding time of the exhibit element ILv = interest level of the visitor HPe = holding power of the exhibit element Nve = number of current viewers of the exhibit element Fv= fatigue level of the visitor Add the visitor’s name to the viewer list of the exhibit element With animation recording hold the position of the visitor for one time segment Save the position and rotation of the visitor as animation keyframe Add “1” to the viewing time value of the visitor If the viewing time of the visitor is equal to the holding time of the exhibit element Then add the name of the exhibit element to the viewed exhibit elements array of the visitor Add “holding time value as float” to the fatigue level of the visitor -- pseudo code for moving the visitor towards the exit of the exhibition space If target of movement is the exit of the exhibition space Then calculate the distance between the exit and the visitor If the distance between the exit and the visitor is larger than “0.10 meters” Then create ray named Vray from the center of the visitor to the center of the exit If Vray collides with a visitor Then assign the moving speed as “0.77 meters per time segment” for the visitor Else assign the moving speed as “0.50 meters per time segment” for the visitor With animation recording move the visitor for “assigned moving speed” towards the exhibit element Save the position and rotation of the visitor as animation keyframe Add “1.0” to the fatigue level of the visitor If the distance between the exit and the visitor is smaller than “0.10 meters” Then save the visitor information and delete the visitor model