a simulation of proportional representation and instant runoff...
TRANSCRIPT

A Simulation of Proportional Representation and Instant Runoff Voting in the
1993, 1997, and 2000 Canadian General Elections
by Tony L. Hill
Pol 8990
Fall 2002
University of Minnesota
Accepted for presentation at the 2003 biennial conference of the Association for Canadian Studies in the United States (ACSUS), Portland, Ore., November 19-23, 2003.

1
INTRODUCTION
Canada is one of only four democracies in the world using plurality election in
single-member districts, or SMP. (The others are the United States, the United Kingdom,
and New Zealand.) While the other countries have two-party systems, which minimize
the effect of SMP elections, at least in actual elections (although the system discourages
the formation of minor parties), in Canada the multi-party system reveals the degree to
which SMP distorts the proportion of the vote. The primary complaint of those who
would see Canada revise its electoral system is that SMP produces what Amy calls
"manufactured majorities."1 The Liberals won 60 percent of the seats in 1993 with 41
percent of the vote, 51 percent in 1997 with 38 percent of the vote, and 57 percent in
2000 with 41 percent. Another party benefiting from the system is the Bloc Québécois.
In 1993, it won 14 percent of the vote and 18 percent of seats. (It became the Official
Opposition even though two other opposition parties had more votes.) In 1997 and 2000,
it won 11 percent of the vote and 15 and 13 percent of seats, respectively. The big loser
in these three elections was the Progressive Conservative Party, which took 16 percent of
the vote in 1993 but got only one percent of the seats. The party took 19 percent of the
vote in 1997 but only seven percent of seats, and 12 percent in 2000 but only four percent
of seats. The New Democratic Party (NDP) also came up short under the current
electoral system, although less dramatically than the Tories. The NDP took seven
percent of the popular vote in 1993 but only three percent of seats; eleven percent of the
vote in 1997 and seven percent of seats; and nine percent of the vote in 2000 and four
percent of seats. The Reform Party (which changed its name to the Canadian Alliance 1 Amy, p. 33.
2
before the 2000 election) was minimally disadvantaged in 1993 and 1997, when it polled
19 percent and took 18 and 20 percent of seats, respectively, but in 2000 it took 25
percent of the vote and won only 22 percent of seats.
PART I – PROPORTIONAL REPRESENTATION
The most frequent remedy proposed for manufactured majorities is to institute
some form of proportional representation. Proportional representation (PR) is any
electoral system designed to give political parties (or other groups) a number of seats
proportional to the votes cast for them.2 There are three essential characteristics of
proportional representation:
1. Multi-member districts
2. No need for a majority or even a plurality to win
3. Proportionality in allocating seats to parties.3
While this paper is intended to demonstrate the implications for imposition of PR
in Canada rather than argue for or against its imposition, a brief discussion of the merits
of the electoral system change is in order. Amy outlines eight problems of SMP that
proportional representation is often believed to solve.4 One, low voter turnout. Countries
with proportional representation tend to have higher turnout. There is need for caution
here. Switzerland has PR and turnout is as low or lower than the United States. In
2 Lakeman 1982, p. ix. 3 Amy, p. 14. 4 Amy, pp. 5-6.

3
Canada, turnout has traditionally been as high as some PR countries.5 Two, the tendency
of SMP to produce a two-party duopoly. This is also not currently a problem in Canada!
Three, the high degree of sameness between the two major party candidates. This is
closely tied to the two-party duopoly and incorporates Downsian ideas about where the
two parties should fall ideologically. This too is more of a problem in the United States
than in Canada, where the five-party system has produced a set of regional competitions
that most would see as downright odd, such as the socialist NDP competing principally
with the right-wing Canadian Alliance in parts of the West rather than with the Liberals
and Progressive Conservatives, both closer to the NDP on a Downsian spectrum than the
Alliance.6
Four, the wasting of votes that happens because many ridings are not competitive;
in a few provinces, nearly all ridings are overwhelmingly won by one party. Amy rejects
Edmund Burke's notion that voters whose party loses locally are represented virtually by
others from other ridings who win. This is an especially hollow idea in contemporary
Canada considering that the Tories have won almost as many votes as the Alliance in
recent elections but have come up with many fewer seats. Five, the bland and largely
issueless campaigns that frequently result under SMP.
Six, the underrepresentation of women that tends to happen under SMP. There is
some evidence that PR systems produce more women in office,7 but caution needs to be
exercised insofar as PR is not necessarily the magic pill that produces the result.
Women's electoral success has been most pronounced in left-of-center Scandinavian
5 Martha Angle, "Low Voter Turnout Prompts Concern on Hill," Congressional Quarterly Weekly Report 46: 863, April 2, 1988. 6 Hill, p. 10. 7 Amy, p. 103.

4
countries. Women have been much less successful in more conservative countries that
use PR, like Italy, Israel, and Ireland.8 In a sense, this is tied to the Downsian model.
Women in both the Democratic and the Republican parties of the U.S. are to the left of
the men in those parties ideologically. This puts Republican women much closer to the
median voter than Democratic women and is one possible explanation why Repub lican
women have an easier time getting elected, especially to executive and other state- level
positions, than Democratic women.
Seven, the lack of minority representation under SMP. This has changed
somewhat in the U.S. with the creation of minority-majority districts, but the paradigm
racially often is that whites vote for whites and blacks for blacks. Of course, the obvious
mechanism for this under PR is the creation of racial and ethnic parties, which is not
necessarily something everyone would find desirable. The lack of minority
representation in Canada is often a non- issue, since many of the black MPs come from
districts with hardly any blacks (e.g., Ovid L. Jackson who represents a rural Ontario
riding; Marlene Jennings who represents Notre Dame-de-Grace—Lachine riding in
Montreal; this paradigm holds for other minorities as well: Inky Mark, a Chinese native,
represents a rural Manitoba riding whose visible minority population is negligible; there
are few Arabs in Mac Harb's Ottawa riding. )
Eight, the lessening of gerrymandering. While districts often exist under PR, they
are larger than single-member districts. As discussed below, PR as implemented in
Canada could have entire provinces constitute electoral units (in which case redistricting
and the resulting gerrymandering would be completely eliminated), or there could be
smaller electoral units constituted. These electoral unit boundaries, while more likely to 8 Ibid.

5
be based on normal boundaries (city limits, natural regions, etc.) than are ridings, would
still be subject to periodic readjustment, and this would involve the possibility of some
gerrymandering. Still, gerrymandering is both less common and less extreme in Canada
than the U.S. or even the U.K., so this is less of an issue in selling PR to the Canadian
electorate.
One possible outcome under SMP is an electoral inversion. An electoral
inversion is when one party wins more of the popular vote but another wins enough seats
to form the government.9 This is a form of minority rule that currently governs the
United States. (Al Gore won the popular vote in the 2000 presidential election, but
George W. Bush supposedly won the electoral vote.) Two Canadian provinces had
inversions in their 1999 provincial elections. The Saskatchewan Party won the popular
vote in that province, but the NDP won more seats. The Liberals won the popular vote in
Quebec, but the Parti Québécois formed the government. This is because the Liberals did
very well in a small number of seats, but the PQ won more of the close contests. This is a
prime example of the wasting of votes that Amy laments.
Just as surely, there are arguments against PR. Amy summarizes them as
follows:10 First, PR is much more complex than SMP voting. Rae calls the ballot most
SMP systems use categoric – the voter chooses a category. He calls the ballots used in
many PR systems ordinal – the voter indicates choices by ranking. (This type of ballot
also has uses in the single-member system, as will be discussed below.) Some PR
systems require voting on more than one ballot. Second, some alternative forms of
voting, especially Single Transferable Vote and Instant Runoff Voting, take much longer
9 Hill, p. xii. 10 Amy, p. 154.
6
to count than categoric ballots. Third, PR tends to produce weak, instable minority
governments and coalitions instead of majority governments. Fourth, having more
parties and ideologies present in Parliament inherently produces more conflicts. Fifth,
small political parties often hold the balance of power in the coalition and minority
governments likely to be produced under PR. Sixth, PR encourages the proliferation of
fringe parties (e.g., Communists, white supremacists) who would be marginalized under
SMP. Seventh, there is less focus on constituent representation in large, multi-member
electoral units than there is in SMP, especially in Canada where ridings are only about
100,000 population. Eighth, most PR systems have people vote for parties and not for
individual candidates, and this is counter to what most people want.
Proportional Representation is frequently proposed as a solution to the problem of
manufactured majorities. The simplistic solution for many is to simply award seats to
parties on the basis of the popular vote. Of course, the solution is never that simple, but
in practice, mechanisms are instituted along with PR that greatly affect how it works.
Two of these mechanisms are the electoral unit and the viability threshold.
In Canada, the electoral unit is the riding, and each riding elects one member on
the basis of plurality. Under a PR scheme, the electoral unit needs to elect more than two
members in order for proportionality to have any meaning. Canadian provinces will be
analyzed as electoral units here, although smaller ones would probably be used in
practice. For example, although here we consider Alberta being a single electoral unit
with 26 seats, Calgary could be an electoral unit with seven seats, Edmonton an electoral
unit with six seats, and the rest of the province an electoral unit with 13 seats. (Or the
rest of the province could be two electoral units, Southern Alberta with seven seats and

7
Northern Alberta with six seats. There are other possibilities.) Electoral unit
boundaries need to be fixed at the time PR is instituted and like riding boundaries, they
can be subject to periodic adjustment.
The viability threshold is the share of the vote within an electoral unit that a party
needs to accrue to be eligible for seats. In some cases, the viability threshold applies on
the national level. In some countries, the viability threshold is set by law. In others, a
particular threshold results mathematically from the district magnitude. For example, if
there are five members to be chosen in a particular district, the threshold becomes
effectively 16 percent. If there are 20 members to be chosen, the threshold is effectively
five percent.11 In some countries, the legal threshold is so low as to be meaningless. In
the Netherlands, a party only needs to capture 0.67 percent of the national popular vote to
be eligible for seats. In Israel, it is one percent. In West Germany, it was five percent.12
In France it is five percent, but that figure effectively applies only in Paris because no
other electoral unit has 20 members. In Argentina, the legal threshold is eight percent.13
In Greece it is 17 percent for parties and 30 percent for electoral alliances.14 If no
viability threshold is specified, then the viability threshold is effectively the minimum
percentage needed to elect one member. In such an instance, the threshold is closely tied
to the number of seats in the electoral unit. For example, if Ontario were a single
electoral unit with 108 seats (which it will have when the redistribution currently in
process is implemented), then any party winning even 0.926 percent of the vote would be
entitled to a seat in the House of Commons. Most political scientists and other observers
11 Taagepera & Shugart, p. 113. 12 Taagepera & Shugart, p. 37. 13 Taagepera & Shugart, p. 133. 14 Taagepera & Shugart, p. 37.

8
would believe this to be too low, as such a low threshold would encourage the formation
of many wild political parties with no hope of forming a government. (Israel's one
percent viability threshold is too low to be meaningful, since the entire country is a single
electoral unit. Effectively, any party receiving even 1.5 percent of the vote is eligible for
a seat there.) On the other hand, if Prince Edward Island were to be an electoral unit with
the four seats it currently has, then the de facto threshold there would be almost 25
percent, and it would not matter if a lower legal one were instituted. (The alternative to
this high threshold would be to combine PEI as an electoral unit with another province to
gain a lower threshold, but this would have the drawback of not guaranteeing any
Members from PEI.)
Sometimes the threshold is set high for a political purpose. In Liechtenstein in
1939, for example, it was set at 18 percent expressly to keep Nazis out. In Sweden, the
national threshold of four percent is overridden if a party receives 12 percent in a single
district.15
This model evaluates viability thresholds of 5, 10, 15, 20, and 25 percent, using
provinces as electoral units. The results are presented in Table 1. The three territories
are excluded from this analysis. It is assumed that even if Canada adopted PR, they
would continue to use SMP because they have only one seat each. The model evaluates
the actual votes cast in the 1993, 1997, and 2000 general elections, although there
obviously would be movement of votes under a PR system. More people would vote for
minor parties nationally, and for the less viable major parties in various provinces were
PR in place. (For example, under SMP there is little reason to vote for the NDP in
Quebec since the party has never won a seat in a general election there. But certainly 15 Taagepera & Shugart, p. 134.

9
more than 1.8 percent of the electorate – the share the party received in 2000 – would
vote NDP in Quebec if only five percent would guarantee them a seat.) So the figures
presented here are apt to overstate the win for the Liberals and understate the seat share
of other parties.
Consider first the 1993 election. Using a 5 percent viability threshold, the
Liberals and Tories are viable in all provinces. The NDP falls below even five percent in
Newfoundland and Labrador, Prince Edward Island, New Brunswick, Quebec, and
Alberta. They won no seats in those places in 1993 under SMP. The Reform Party falls
below five percent in Newfoundland and Labrador and Prince Edward Island. (They ran
no candidates in Quebec.) The "other" vote meets viability only in Prince Edward Island
and British Columbia. (For purposes of this simulation, "other" is treated as a single
category, although in a real election each individual party would be treated as its own
category and need to meet the viability threshold.) Although technically viable, the
"other" party vote in PEI nets no seats, because it falls below the 22 percent needed for
effective viability in a unit with only four seats. So the Liberals take 127 seats (instead of
175 plus two territorial seats), the Tories take 50 (more than the Liberals won in the real
1984 election), which is much better than two, and the NDP takes eighteen (their real
take was eight plus their leader's Yukon seat), the Reform Party becomes the Official
Opposition with 57 (up from 52), and the Bloc takes 38, considerably less than the 54
they won in that election.
With the threshold raised to 10 percent, the Liberals and Tories are still viable
everywhere. The NDP is viable only in Manitoba, Saskatchewan, and British Columbia.
Reform falls from viability in New Brunswick, and the "other" category is no longer

10
viable. The Liberals take 133 seats, the Tories 52, the NDP 11, Reform forms the
Official Opposition with 58, and the Bloc still has 38. (There was no change in the
viability of parties in Quebec from five to ten percent so the seats remain stable there.)
At 15 percent – a level sometimes proposed by political scientists as an ideal
viability threshold – the Liberals are the only party viable everywhere. The Tories fall
from viability in Quebec and the four western provinces. The NDP is viable only in
Manitoba, Saskatchewan, and British Columbia. Reform is no longer viable in Nova
Scotia. The Liberals take 142 seats. Considering two from the territories, they are just
short of the 148 needed for a majority. The Tories drop dramatically to 28 seats (they had
11 in Quebec and 13 in the western provinces at 10 percent viability), the Reform Party is
the Official Opposition with 64 seats, and the Bloc is at 45. (The Bloc benefited more
than the Liberals from the elimination of the Tories in Quebec.)
At 20 percent, the Tories are no longer viable in Ontario. The NDP is viable only
in Saskatchewan. The other parties remain viable in the same provinces they had at 15
percent. The loss of Tory seats in Ontario benefits the Liberals more than Reform. The
Liberals pick up 14 and the Reform Party five. The Liberals now have a majority with
161 seats (plus two), while the Tories and NDP lose official party status with nine and
four (plus one), respectively. The Reform Party takes 73 seats and the Bloc stays at 45.
Using a 25 percent viability threshold, the Liberals are still viable in every
province. The Tories lose viability in Nova Scotia, giving the Liberals a sweep there.
The Tories fall to six seats while the NDP holds at four (plus Yukon). The Reform Party
is only viable in Alberta and British Columbia, giving the Liberals a sweep in Ontario

11
and Manitoba. Reform falls to 41 seats, making the Bloc the Official Opposition with 45.
The Liberals now have a stunning majority of 196 seats (plus two territorial seats).
Next, consider the 1997 election. At five percent viability, the Liberals and
Tories are viable everywhere. The NDP and Reform are unviable in Quebec even at five
percent. No "other" parties make viability this time. (An independent was elected in
Ontario.) The Liberals take 117 seats (plus two from the NWT), far fewer than the 153
they took under the current system (plus two from the NWT.) The Tories take 59, far
more than the 20 they actually won. The NDP wins 34 plus Yukon, up from 20 plus
Yukon under the current system. The Reform Party captures 59 seats, one fewer than
they won in the real election. The Bloc takes 29, far fewer than 44.
At 10 percent, the Tories become unviable in Saskatchewan and British Columbia.
The NDP loses Alberta (where it has never won a seat in a general election). Reform is
no longer viable in three of the Atlantic provinces: Newfoundland and Labrador, Prince
Edward Island, and Nova Scotia. These drops don't make much difference in the seat
count: Liberal, 119, Tory, 56, NDP, 34, Reform, 60, and Bloc, 29.
At 15 percent, the Tories lose viability in Alberta. The NDP falls below viability
in Ontario. Reform loses the last of the Atlantic provinces, New Brunswick. Buoyed
mostly by seats that would have gone to the NDP in Ontario at 10 percent, the Liberals
take 127 seats, the Tories 54, the NDP 23, Reform 65, and the Bloc 29.
Using a 20 percent viability threshold, neither the Tories nor the Reform Party are
viable in Ontario, and the Liberals sweep the province's 103 seats. The NDP falls from
viability in Prince Edward Island, New Brunswick, and British Columbia. The Liberals
12
ascend dramatically to a solid majority of 177 seats, the Tories drop to 31, the NDP drops
to 14, Reform maintains Official Opposition status with 47, and the Bloc holds its 29.
At 25 percent viability, the Liberals fall below the threshold in Saskatchewan and
Alberta, resulting in a Reform sweep of the latter province. The Tories lose viability in
Quebec, and more of its seats go to the Bloc than the Liberals. The NDP and Reform
Party both fall below viability in Manitoba, giving the Liberals a sweep there. The NDP
also loses Newfoundland and Labrador. The Liberals take 182 seats, the Tories 14, the
NDP falls just below official status with 10 seats from the simulation plus the one it won
in the Yukon, Reform takes 54 and the Bloc 38.
Finally, consider the 2000 election. Even at five percent, the Liberals are the only
party viable everywhere. The Tories miss viability in Saskatchewan (they didn't have
candidates in three ridings, and this adversely affects their total vote, which is used in this
simulation.) The NDP as usual fails to be viable in Quebec even at five percent (although
the Canadian Alliance is viable there this time.) The Alliance is unviable in Prince
Edward Island. Although the NDP is viable there, they do not get any seats because the
de facto requirement is higher. The same thing keeps the Alliance from getting any seats
in Newfoundland and Labrador even though they are technically viable there. The
Liberals take 126 seats (versus 169 plus all three territories in the real election), the
Tories 39 (as opposed to 12), the NDP 26 (twice as many as the 13 they won), the
Canadian Alliance 76 (up from 66), and the Bloc 31 (fewer than the 38 they got in the
election.) Unfathomable as it seems, the Alliance takes five seats in Quebec.
At 10 percent viability, the Tories lose viability in Quebec and British Columbia.
The NDP becomes unviable in Prince Edward Island, Ontario, and Alberta. The Alliance

13
loses Atlantic Canada except for New Brunswick, and also Quebec. These developments
boost the Liberals to 136 seats. The Tories drop to 35, the NDP takes 16, the Alliance is
down one to 75, and the Bloc goes up to 36 seats.
At 15 percent, the Liberals are still viable everywhere. The Tories lose Ontario,
Manitoba, and Alberta, making them viable only in the four Atlantic provinces. The
NDP falls from viability in Newfoundland and Labrador, New Brunswick, and British
Columbia. The Liberals rise to 152 seats, which would give them a majority without
even counting the three territories. The Tories make official party status at 12, which the
NDP just misses at 11. The Canadian Alliance is at 87, including 32 seats in Ontario, and
the Bloc holds at 36.
At 20 percent, the only difference from 15 percent is that the Alliance is no longer
viable in New Brunswick. The Tories and Liberals each pick up one of the Alliance's
two New Brunswick seats.
At 25 percent, the Liberals fall from viability in Saskatchewan and Alberta. The
Alliance sweeps Alberta's 26 seats. The NDP loses viability in Nova Scotia and
Manitoba. Most significantly, the Alliance is no longer viable in Ontario, and the
Liberals take all 103 seats. The Liberals have 179 (plus three), a few more than the 169
(plus three) they took under the current system. The Tories take 14, one more than their
share under SMP. The NDP, which was viable only in Saskatchewan, winds up with a
mere five seats. The Canadian Alliance takes 64, two fewer than the real election. The
Bloc also took two fewer than the election results, 36.
The obvious conclusion is that PR with a high viability threshold would do a good
job of replicating the current system, or of manufacturing majorities even more than the

14
current system does. This is especially true using the provinces as electoral units. For
example, many of those parties eliminated on the basis of the total provincial vote in
provinces where they are successful under the current system (e.g., the NDP in Manitoba,
the Liberals in Alberta) would not be eliminated were a smaller electoral unit used. (The
NDP would assuredly win seats if Winnipeg were an electoral unit; the Liberals would
win seats in Edmonton and perhaps Calgary if those cities were electoral units.) Thus, it
would be to PR advocates' extreme disadvantage to agree to a PR system using provinces
as electoral units with a high viability threshold. It is easy to see how these mechanisms
could be imposed politically should a Constitution Act amendment ever make it to
Parliament. Taagepera & Shugart call electoral systems "the most easily manipulable
feature of a political system."16
The Liberals also benefit from being the only party with a truly national base in
the period studied. Although the Tories are also national, rather than regional, in focus,
in the elections studied here, their vote was quite low in certain parts of the country.
Were the Tories able to reclaim some of their former glory in the West, they would do
better under PR than this simulation indicates. In a sense, the problem for all of the
opposition parties is not each other but the Liberals.
Why do the Liberals and Bloc do so much better under the current system than
under PR with a low viability threshold? It is because they win so many seats under SMP
with unimpressive shares of the vote. Taking 35 percent in each of three ridings in the
current system might get them three seats, but under PR they would likely get only one.
SMP rewards parties who have their strength in specific places and penalizes parties who
come in a close second in many ridings. 16 Taagepera & Shugart, p. 4.

15
In conclusion, a PR scheme with a 5 percent viability threshold would do the best
job of replicating the national popular vote, although this does not take into consideration
the likely effect of vote splintering by minor parties should PR be implemented with the
threshold that low. This is why a threshold of 10 percent or 15 percent is so often
regarded as ideal by political scientists; it is high enough to prevent the proliferation of
fringe parties but still does a reasonably good job of translating the popular vote into
seats.
There is more to proportional representation than mere mathematics, however.
There are substantive issues with the concept that ought to be given more consideration
than the political outcomes of certain vote patterns. First and foremost, rather than being
a drawback as Amy suggests, it might be a useful function of SMP that it ordinarily
produces a majority government even though parties rarely receive a majority of the
popular vote. An analogue would be the U.S. electoral college, which has only failed to
produce a majority three times, most recently in 1888, even though many more than three
presidents have been elected without a majority of the popular vote (more so recently.)
A majority government is inherently more stable than a minority government. Secondly,
in a pure PR system, ridings are lost. Even those who complain most loudly about a
party winning 60 percent of the seats with 41 percent of the popular vote is apt to be
disaffected by the removal of one's local representative and his or her replacement by a
constituent-service bureaucracy operated on the provincial level. Thirdly, the role of
party leaders in selecting candidates for PR elections is apt to be greater than it is now,
where local voters on the riding level usually choose candidates.
16
PART II – INSTANT RUNOFF VOTING
Instant Runoff Voting (IRV) is a form of preferential voting. It is essentially the
PR method known as Single Transferable Vote applied in single-member districts. It is
also called alternative vote or majority preferential vote. It is used to elect the lower
house in the Australian Parliament. Voters use an ordinal ballot. After voting closes, the
first choices are tallied. If no candidate receives a majority, the candidate who received
the fewest votes is eliminated, and the ballots on which he or she was the first choice are
redistributed among the other candidates according to the voters' second choice. The
redistributed ballots are then counted, and these counts added to the vote totals for the
remaining candidates. If no candidate has a majority, then the remaining candidate with
the smallest vote total is eliminated, and the ballots on which he or she was the first
choice and the ballots from the first round of redistribution on which he or she was the
second choice are redistributed. In case of ballots for whom the second choice is one of
the candidates who has already been eliminated, then the ballot is redistributed to the
highest viable choice. The process continues candidate by candidate until someone has a
majority or there is only one candidate remaining. When a ballot has had all of its
choices redistributed to non-viable candidates, the ballot is said to be stranded.
For the purposes of this exercise, the process of redistribution had to be simplified
somewhat. Instead of having up to five choices on every ballot, each party's ballots were
given percentages for reassignment to the other parties based roughly on what would be
expected if voters in those regions were asked their second choice. For example, in the
eastern provinces, the second choice of Tory voters would be the Liberals, and in the

17
western provinces, it would be the Reform/Alliance Party. These reassignment
percentages are listed in Table 2. These are, of course, merely informed speculation, but
they give us a starting point to decide how IRV would work in practice. Also, rather than
track each set of ballots through the process, the simulation treats redistributed ballots as
if they had originally been cast for the party to which they are redistributed for purposes
of subsequent redistributions. For example, 65 percent of NDP ballots are redistributed
to the Liberals in British Columbia. Should these now-Liberal ballots need to be
redistributed again, they would go 20 percent to the Tories and 10 percent to the
Reform/Alliance Party, the same as Liberal ballots in that province. (The remaining 70
percent would be stranded, because they should have gone to the NDP, which in this
example has already been eliminated.) The question of what would have been the NDP
voters' third choice is disregarded in order to simplify the simulation.
The paper also assumes that 100 percent of voters will state a second choice. This
is well out of line with what would happen in a real election, but this assumption allows
us to discuss what would happen should every voter participate in IRV. The actual effect
of IRV in a real election where fewer than 100 percent use it would be even less than this
model projects.
Finally, the vote for candidates other than the five major parties are not
redistributed for this simulation. They immediately become stranded votes.
The results of the IRV simulation are given in Table 3. In the 1993 general
election, candidates won with a majority in 164 (of 295) ridings. This means the IRV
simulation is performed for 131 ridings. The first redistribution produced majorities in
19 ridings. The second redistribution produced majorities in 60 ridings. There were 52

18
ridings with no majority. The candidate leading at the end of the second redistribution is
considered the winner.
In the 1997 general election, candidates won with a majority in 104 (of 301)
ridings. (Reapportionment took place between the 1993 and 1997 elections resulting in
the increase in number of ridings.) The IRV simulation is performed for 197 ridings.
The first redistribution produced majorities in 47 ridings. The second redistribution
produced majorities in 102 ridings. There were 41 ridings with only two candidates left
and no majority. The candidate leading is considered the winner in these ridings. A third
redistribution was necessary in seven Quebec ridings. This is because, unlike in 1993,
the Reform Party ran in Quebec in 1997, meaning there were five major party candidates
on the ballot in many ridings, and three redistributions are necessary in some places to
narrow the candidates to two. The third redistribution produced majorities in six ridings,
and there was one riding with no majority, where the leader is considered the winner.
In the 2000 general election, candidates won with a majority in 155 (of 301)
ridings. The IRV simulation is performed for 146 ridings. The first redistribution
produced majorities in 35 ridings. The second redistribution produced majorities in 62
ridings. There were 22 ridings with only two candidates left and no majority, wherein the
leader is considered the winner. A third redistribution was necessary in 27 Quebec
ridings. It produced majorities in 16 ridings, and there were 11 ridings with no majority
where the leading candidate is considered the winner.
The tendency of the IRV simulation is to give the Liberals an even bigger
landslide in seats than they have under the current system. For most of the opposition
parties, the simulation makes only a small difference in the number of seats. The

19
magnitude is small, and in some cases, the direction is wrong (i.e., the IRV simulation
makes the proportion of seats even farther from the popular vote than the proportion of
seats under the current system).
In the case of the 1993 election, the Liberals won only a net gain of three seats
more through the simulation than they did in the actual election. Under the model, they
take five Quebec seats from the Bloc and six seats from Reform (one in Ontario, two in
Saskatchewan, and three in British Columbia). They lose two seats in Ontario and one
seat each in Nova Scotia and New Brunswick to the Tories, two Alberta and one B.C.
seat to the Reform Party, and one B.C. seat to the NDP. The Tories took eight seats (the
four Liberal seats mentioned, and one seat in Quebec from each of the Bloc and an
independent), which while still an embarrassing number, is better than the two they did
get that year. The NDP takes eleven under the model instead of nine. They gain one seat
from each of the Reform Party and the Liberals in British Columbia. Both figures keep
them from official party status, which is twelve. The losers are the Bloc Québécois and
the Reform Party, which tie at 48 seats instead of the 54 and 52 seats, respectively, they
won in the real election. (This would have been an interesting scenario since they would
have had to draw lots to determine who would become the Official Opposition.)
Altogether 22 seats move under this simulation.
In the case of the 1997 election, 38 seats move. In part this is because so many
seats in Quebec were won with less than a majority due to the strength of the Tories there
under Jean Charest. Although the Tories won only six seats, the redistribution of their
vote benefits the Liberals more than the Bloc. Under the simulation, the Liberals move
from the narrow majority (155 of 301) that they took in the real election to a landslide of

20
173 seats. Almost all of the net gain is accounted for in the 17 seats they gain from the
Bloc under the simulation. They also take four seats in Atlantic Canada from the NDP
(two in Nova Scotia, where the Liberals were wiped out in 1997, and two in New
Brunswick). They take three seats on the prairies (one in each province) from Reform,
and the one independent seat, John Nunziata's win in Toronto. They lose six seats to the
Tories: two in New Brunswick, and four in Ontario. The Tories are also big winners
under the IRV simulation, taking 31 seats instead of 20. (This is slightly more than 10
percent of seats, still far fewer than the 19 percent of the vote they got.) In addition to the
six from the Liberals, they also take three seats from the Bloc and two Nova Scotia seats
from the NDP. They experience no losses. Besides losing seats to both the Liberals and
Progressive Conservatives, the NDP gains a seat in Saskatchewan and two in British
Columbia from the Reform Party. Reform loses six seats, but they still qualify as the
Official Opposition, mostly because the Bloc is so greatly reduced at the hands of the
traditional parties.
In the 2000 election, the movement under the IRV simulation is more subtle, in
part because so many more seats were won with majorities. With fewer seats included in
the redistribution scenario, there is less room for change. Only 17 seats change hands
under the IRV simulation. The Liberals take six seats from the Bloc and one of its two
Ontario seats from the Alliance. They take two Nova Scotia seats and its only Ontario
seat from the NDP. This does not mean the Liberals sweep Ontario, however, because
they lose two Ontario seats to the Tories, and also a seat in Nova Scotia and three in New
Brunswick, giving both the Liberals and Tories a net gain of five seats under the
simulation. The NDP has a net loss of one, because in addition to their loss to the
21
Liberals, they take two seats in Saskatchewan from the Alliance. The Alliance's net loss
is three, and the Bloc's is six.
Here is a brief description of where these ridings are. For the most part, they are
rural ridings. In 2000, the Bloc loses two suburban Quebec City ridings and one
suburban Montreal riding. They lose three rural ridings, one in the Outaouais, one in the
St. Lawrence Valley, and one on the Gaspé Peninsula. The Alliance loses a suburban
fringe riding in Ottawa to the Liberals and two urban/rural fringe ridings in Saskatchewan
to the NDP. The NDP loses two ridings in greater Halifax and one in Windsor to the
Liberals. The Tories pick up two rural ridings in Atlantic Canada from the Liberals and
also Fredericton. They also gain one rural riding and one small-city riding (Oxford) in
Ontario.
In 1997, the NDP revival in Nova Scotia and New Brunswick would not have
happened. The NDP would have won only one of four ridings in Halifax and one of the
two Cape Breton ridings and neither of the New Brunswick ridings. The Tories and not
the Liberals would have won in Fredericton and Moncton. The Tories also would have
deprived the Liberals of four rural and small-city Ontario ridings. The Tories would have
defeated the Bloc in three rural ridings between Montreal and Quebec City. The 16
ridings the Bloc would have lost to the Liberals include five of the six ridings in greater
Quebec City, the two Laval ridings the Liberals didn't already win, two ridings exurban
to Montreal, three rural ridings between Montreal and Quebec City, Trois-Rivières riding,
and three rural ridings east of Quebec City. The Liberals would take from Reform one
rural/urban fringe riding in each of Manitoba and Saskatchewan and one riding in
Calgary (the only inner city riding that moves, besides those in Quebec City and the

22
riding that was won by an independent in Toronto). The NDP would take from Reform a
rural/urban fringe riding in Saskatchewan, a riding in greater Vancouver, and a rural
riding in British Columbia.
It is reasonable to believe that the IRV process would have made little or no
difference in 1993 and 2000 given the share of people who would make use of it is apt to
be much less than the 100 percent assumed in the model. Since the model augmented the
winning Liberal seat count in all three of the simulations -- and made it dramatically
higher in the close 1997 election – it is worth believing that instituting instant runoff
voting would either be useless or counterproductive in taming the tendency of the
Canadian electoral system to produce landslide majorities in the House of Commons on
the basis of mere plurality wins in the popular vote.
Why is this so? Part of it is explained in the redistribution percentages, part is
explained in the places the IRV simulation was done, and part is explained in the order
the vote was redistributed. First, not only are the Liberals the first choice of more
Canadian voters than any other party, they are the second choice of more voters than any
other party too. This is true for Tory voters in the eastern half of the country and NDP
voters nationwide. In the rare instances when the Bloc takes third, it is in ridings where
voters favor Liberals more than Conservatives.
Second, the Alliance and the Bloc tend to win ridings with large majorities. The
IRV process is not used in ridings where one party wins a majority in the voting. So for
those two parties, the process can't help them win huge numbers of seats. The IRV
process is much more salient in areas where the traditional parties are more competitive.
This includes most of the ridings in New Brunswick, Nova Scotia, Manitoba, and

23
Saskatchewan. While the Reform/Alliance Party is prosperous in the last two provinces,
they have less of a grip there than in Alberta and even British Columbia.
Third, the order in which the parties are redistributed tends to benefit the Liberals.
In most of Ontario, the NDP takes fourth place. The model assumes that the Liberals are
the second choice of 70 percent of Ontario NDP voters. So these redistributed NDP votes
can put the Liberals over the top in a riding before the so-called "right of center" vote can
be combined to the benefit of either the Tories or Alliance.
In application, there is also the practical problem of holding the election results in
each riding until the first choices have been tallied and reported to the chief returning
officer for the riding, who would then determine if a majority had been achieved. If not,
the chief returning officer would then instruct the local returning officers (election judges)
to redistribute the last place candidate, and the process would repeat until there was a
majority. Many would have trouble justifying even the expense of this when the impact
on the outcome is apt to be small.
In summary, while IRV would produce a majority winner in more ridings than
happens under the current system, it is unlikely there would be much change in outcome
from the current system, and if there were, it would not quell the problem of
manufactured majorities.
24
BIBLIOGRAPHY
Douglas J. Amy, Real Choices/New Voices: The Case for Proportional Representation Elections in the United States, New York: Columbia University Press, 1993.
Steven J. Brams & Peter C. Fishburn, "Some logical defects of the single transferable
vote," in Arend Lijphart and Bernard Grofman, eds., Choosing an Electoral System: Issues and Alternatives, pp. 147-151, New York: Praeger, 1984.
Lani Guinier, The Tyranny of the Majority: Fundamental Fairness and Representative
Democracy, New York: Free Press, 1994. F.A. Hermens, P.R., Democracy and Good Government , Notre Dame, Ind.: Review of
Politics, 1943. Tony L. Hill, Canadian Politics, Riding by Riding: An In-Depth Analysis of Canada's
301 Federal Electoral Districts, Minneapolis: Prospect Park Press, 2002. Clarence G. Hoag & George H. Hallett Jr., Proportional Representation, New York:
Mamillan, 1926. Enid Lakeman, Power to Elect: The Case for Proportional Representation, London:
Heinemann, 1982. Enid Lakeman & James D. Lambert, Voting in Democracies: A Study of Majority and
Proportional Electoral Systems, London: Faber & Faber, 1955. Arend Lijphart, Democracies: Patterns of Majoritarian and Consensus Government in
Twenty-One Countries, New Haven, Conn.: Yale University Press, 1984. Robert A. Newland, Comparative Electoral Systems, London: Arthur McDougall, 1982. Douglas W. Rae, The Political Consequences of Electoral Laws, New Haven, Conn.:
Yale University Press, 1967. Rein Taagepera & Matthew Shugart, Seats and Votes: The Effects and Determinants of
Electoral Systems, New Haven: Yale University Press, 1989. Gordon Tullock, On Voting: A Public Choice Approach (The John Locke Series),
Cheltenham, Gloucester, UK: Edward Elgar, 1998. J.F.H. Wright, Mirror of the Nation’s Mind: Australia's Electoral Experiments, Sydney:
Hale & Iremonger, 1980.
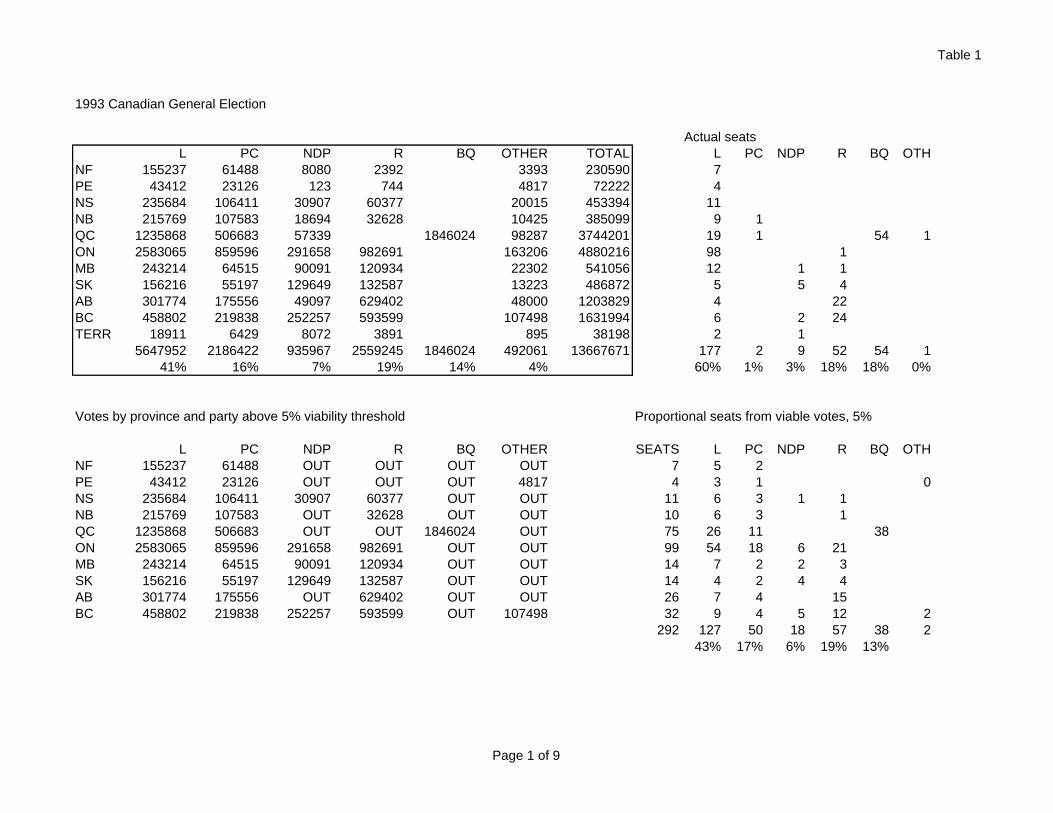
Table 1
1993 Canadian General Election
Actual seatsL PC NDP R BQ OTHER TOTAL L PC NDP R BQ OTH
NF 155237 61488 8080 2392 3393 230590 7PE 43412 23126 123 744 4817 72222 4NS 235684 106411 30907 60377 20015 453394 11NB 215769 107583 18694 32628 10425 385099 9 1QC 1235868 506683 57339 1846024 98287 3744201 19 1 54 1ON 2583065 859596 291658 982691 163206 4880216 98 1MB 243214 64515 90091 120934 22302 541056 12 1 1SK 156216 55197 129649 132587 13223 486872 5 5 4AB 301774 175556 49097 629402 48000 1203829 4 22BC 458802 219838 252257 593599 107498 1631994 6 2 24TERR 18911 6429 8072 3891 895 38198 2 1
5647952 2186422 935967 2559245 1846024 492061 13667671 177 2 9 52 54 141% 16% 7% 19% 14% 4% 60% 1% 3% 18% 18% 0%
Votes by province and party above 5% viability threshold Proportional seats from viable votes, 5%
L PC NDP R BQ OTHER SEATS L PC NDP R BQ OTHNF 155237 61488 OUT OUT OUT OUT 7 5 2PE 43412 23126 OUT OUT OUT 4817 4 3 1 0NS 235684 106411 30907 60377 OUT OUT 11 6 3 1 1NB 215769 107583 OUT 32628 OUT OUT 10 6 3 1QC 1235868 506683 OUT OUT 1846024 OUT 75 26 11 38ON 2583065 859596 291658 982691 OUT OUT 99 54 18 6 21MB 243214 64515 90091 120934 OUT OUT 14 7 2 2 3SK 156216 55197 129649 132587 OUT OUT 14 4 2 4 4AB 301774 175556 OUT 629402 OUT OUT 26 7 4 15BC 458802 219838 252257 593599 OUT 107498 32 9 4 5 12 2
292 127 50 18 57 38 243% 17% 6% 19% 13%
Page 1 of 9

Table 1
Votes by province and party above 10% viability threshold Proportional seats from viable votes, 10%
L PC NDP R BQ OTHER SEATS L PC NDP R BQ OTHNF 155237 61488 OUT OUT OUT OUT 7 5 2PE 43412 23126 OUT OUT OUT OUT 4 3 1NS 235684 106411 OUT 60377 OUT OUT 11 6 3 2NB 215769 107583 OUT OUT OUT OUT 10 7 3QC 1235868 506683 OUT OUT 1846024 OUT 75 26 11 38ON 2583065 859596 OUT 982691 OUT OUT 99 58 19 22MB 243214 64515 90091 120934 OUT OUT 14 7 2 2 3SK 156216 55197 129649 132587 OUT OUT 14 4 2 4 4AB 301774 175556 OUT 629402 OUT OUT 26 7 4 15BC 458802 219838 252257 593599 OUT OUT 32 10 5 5 12
292 133 52 11 58 38 045% 18% 4% 20% 13%
Votes by province and party above 15% viability threshold Proportional seats from viable votes, 15%
L PC NDP R BQ OTHER SEATS L PC NDP R BQ OTHNF 155237 61488 OUT OUT OUT OUT 7 5 2PE 43412 23126 OUT OUT OUT OUT 4 3 1NS 235684 106411 OUT OUT OUT OUT 11 8 3NB 215769 107583 OUT OUT OUT OUT 10 7 3QC 1235868 OUT OUT OUT 1846024 OUT 75 30 45ON 2583065 859596 OUT 982691 OUT OUT 99 58 19 22MB 243214 OUT 90091 120934 OUT OUT 14 7 3 4SK 156216 OUT 129649 132587 OUT OUT 14 5 4 5AB 301774 OUT OUT 629402 OUT OUT 26 8 18BC 458802 OUT 252257 593599 OUT OUT 32 11 6 15
292 142 28 13 64 45 049% 10% 5% 21% 15%
Page 2 of 9

Table 1
Votes by province and party above 20% viability threshold Proportional seats from viable votes, 20%
L PC NDP R BQ OTHER SEATS L PC NDP R BQ OTHNF 155237 61488 OUT OUT OUT OUT 7 5 2PE 43412 23126 OUT OUT OUT OUT 4 3 1NS 235684 106411 OUT OUT OUT OUT 11 8 3NB 215769 107583 OUT OUT OUT OUT 10 7 3QC 1235868 OUT OUT OUT 1846024 OUT 75 30 45ON 2583065 OUT OUT 982691 OUT OUT 99 72 27MB 243214 OUT OUT 120934 OUT OUT 14 9 5SK 156216 OUT 129649 132587 OUT OUT 14 5 4 5AB 301774 OUT OUT 629402 OUT OUT 26 8 18BC 458802 OUT OUT 593599 OUT OUT 32 14 18
292 161 9 4 73 45 055% 3% 1% 25% 15%
Votes by province and party above 25% viability threshold Proportional seats from viable votes, 25%
L PC NDP R BQ OTHER SEATS L PC NDP R BQ OTHNF 155237 61488 OUT OUT OUT OUT 7 5 2PE 43412 23126 OUT OUT OUT OUT 4 3 1NS 235684 OUT OUT OUT OUT OUT 11 11NB 215769 107583 OUT OUT OUT OUT 10 7 3QC 1235868 OUT OUT OUT 1846024 OUT 75 30 45ON 2583065 OUT OUT OUT OUT OUT 99 99MB 243214 OUT OUT OUT OUT OUT 14 14SK 156216 OUT 129649 132587 OUT OUT 14 5 4 5AB 301774 OUT OUT 629402 OUT OUT 26 8 18BC 458802 OUT OUT 593599 OUT OUT 32 14 18
292 196 6 4 41 45 067% 2% 1% 14% 15%
Page 3 of 9

Table 1
1997 Canadian General Election
Actual seatsL PC NDP R BQ OTHER TOTAL L PC NDP R BQ OTH
NF 84657 82214 49125 5632 1952 223580 5 2PE 31595 26998 10675 1056 219 70543 4NS 132539 143854 142081 45207 3689 467370 5 6NB 131246 139431 73249 52270 2519 398715 3 5 2QC 1342667 811410 71558 10767 1385821 37772 3659995 25 6 44ON 2294593 871616 495155 886787 85549 4633700 101 1 1MB 163226 84511 110181 112863 5162 475943 6 1 4 3SK 109200 34460 136555 159332 2739 442286 1 5 8AB 253983 152309 60633 577551 12444 1056920 2 24BC 438769 94550 277006 655699 56500 1522524 6 3 25TERR 11902 5352 8291 5906 2937 34388 2 1
4994377 2446705 1434509 2513070 1385821 211482 12985964 155 20 21 60 44 138% 19% 11% 19% 11% 2% 51% 7% 7% 20% 15% 0%
Votes by province and party above 5% viability threshold Proportional seats from viable votes, 5%
L PC NDP R BQ OTHER SEATS L PC NDP R BQ OTHNF 84657 82214 49125 OUT OUT OUT 7 3 3 1PE 31595 26998 10675 OUT OUT OUT 4 2 1 1NS 132539 143854 142081 45207 OUT OUT 11 3 4 3 1NB 131246 139431 73249 52270 OUT OUT 10 3 4 2 1QC 1342667 811410 OUT OUT 1385821 OUT 75 29 17 29ON 2294593 871616 495155 886787 OUT OUT 103 52 20 11 20MB 163226 84511 110181 112863 OUT OUT 14 5 3 3 3SK 109200 34460 136555 159332 OUT OUT 14 4 1 4 5AB 253983 152309 60633 577551 OUT OUT 26 6 4 2 14BC 438769 94550 277006 655699 OUT OUT 34 10 2 7 15
298 117 59 34 59 29 039% 19% 11% 20% 10%
Page 4 of 9

Table 1
Votes by province and party above 10% viability threshold Proportional seats from viable votes, 10%
L PC NDP R BQ OTHER SEATS L PC NDP R BQ OTHNF 84657 82214 49125 OUT OUT OUT 7 3 3 1PE 31595 26998 10675 OUT OUT OUT 4 2 1 1NS 132539 143854 142081 OUT OUT OUT 11 3 4 4NB 131246 139431 73249 52270 OUT OUT 10 3 4 2 1QC 1342667 811410 OUT OUT 1385821 OUT 75 29 17 29ON 2294593 871616 495155 886787 OUT OUT 103 52 20 11 20MB 163226 84511 110181 112863 OUT OUT 14 5 3 3 3SK 109200 OUT 136555 159332 OUT OUT 14 4 5 5AB 253983 152309 OUT 577551 OUT OUT 26 7 4 15BC 438769 OUT 277006 655699 OUT OUT 34 11 7 16
298 119 56 34 60 29 040% 18% 11% 21% 10%
Votes by province and party above 15% viability threshold Proportional seats from viable votes, 15%
L PC NDP R BQ OTHER SEATS L PC NDP R BQ OTHNF 84657 82214 49125 OUT OUT OUT 7 3 3 1PE 31595 26998 10675 OUT OUT OUT 4 2 1 1NS 132539 143854 142081 OUT OUT OUT 11 3 4 4NB 131246 139431 73249 OUT OUT OUT 10 4 4 2QC 1342667 811410 OUT OUT 1385821 OUT 75 29 17 29ON 2294593 871616 OUT 886787 OUT OUT 103 58 22 23MB 163226 84511 110181 112863 OUT OUT 14 5 3 3 3SK 109200 OUT 136555 159332 OUT OUT 14 4 5 5AB 253983 OUT OUT 577551 OUT OUT 26 8 18BC 438769 OUT 277006 655699 OUT OUT 34 11 7 16
298 127 54 23 65 29 042% 18% 8% 22% 10%
Page 5 of 9

Table 1
Votes by province and party above 20% viability threshold Proportional seats from viable votes, 20%
L PC NDP R BQ OTHER SEATS L PC NDP R BQ OTHNF 84657 82214 49125 OUT OUT OUT 7 3 3 1PE 31595 26998 OUT OUT OUT OUT 4 2 2NS 132539 143854 142081 OUT OUT OUT 11 3 4 4NB 131246 139431 OUT OUT OUT OUT 10 5 5QC 1342667 811410 OUT OUT 1385821 OUT 75 29 17 29ON 2294593 OUT OUT OUT OUT OUT 103 103MB 163226 OUT 110181 112863 OUT OUT 14 6 4 4SK 109200 OUT 136555 159332 OUT OUT 14 4 5 5AB 253983 OUT OUT 577551 OUT OUT 26 8 18BC 438769 OUT OUT 655699 OUT OUT 34 14 20
298 177 31 14 47 29 059% 10% 5% 16% 10%
Votes by province and party above 25% viability threshold Proportional seats from viable votes, 25%
L PC NDP R BQ OTHER SEATS L PC NDP R BQ OTHNF 84657 82214 OUT OUT OUT OUT 7 4 3PE 31595 26998 OUT OUT OUT OUT 4 2 2NS 132539 143854 142081 OUT OUT OUT 11 3 4 4NB 131246 139431 OUT OUT OUT OUT 10 5 5QC 1342667 OUT OUT OUT 1385821 OUT 75 37 38ON 2294593 OUT OUT OUT OUT OUT 103 103MB 163226 OUT OUT OUT OUT OUT 14 14SK OUT OUT 136555 159332 OUT OUT 14 6 8AB OUT OUT OUT 577551 OUT OUT 26 26BC 438769 OUT OUT 655699 OUT OUT 34 14 20
298 182 14 10 54 38 061% 5% 3% 18% 13%
Page 6 of 9

Table 1
2000 Canadian General Election
Actual seatsL PC NDP CA BQ OTHER TOTAL L PC NDP CA BQ OTH
NF 103103 79157 29993 8837 8408 229498 5 2PE 35021 28610 6714 3719 400 74464 4NS 158870 126557 104277 41752 3813 435269 5 3 3NB 159803 116980 44778 60277 1174 383012 5 4 1QC 1529642 192153 63611 212874 1377727 80891 3456898 36 1 38ON 2292075 642438 368709 1051209 98174 4452605 100 1 2MB 158713 70635 101741 148293 8450 487832 5 1 4 4SK 89697 20855 113626 207004 2515 433697 2 2 10AB 263008 169093 68363 739514 16021 1255999 2 1 23BC 446624 117614 182993 797518 69973 1614722 5 2 27TERR 15475 2906 9063 5932 402 33778 3
5252031 1566998 1093868 3276929 1377727 290221 12857774 172 12 13 66 3841% 12% 9% 25% 11% 2% 57% 4% 4% 22% 13% 0%
Votes by province and party above 5% viability threshold Proportional seats from viable votes, 5%
L PC NDP CA BQ OTHER SEATS L PC NDP CA BQ OTHNF 103103 79157 29993 8837 OUT 7 3 3 1 0PE 35021 28610 6714 OUT OUT 4 2 2 0NS 158870 126557 104277 41752 OUT 11 4 3 3 1NB 159803 116980 44778 60277 OUT 10 4 3 1 2QC 1529642 192153 OUT 212874 1377727 OUT 75 35 4 5 31ON 2292075 642438 368709 1051209 OUT 103 54 15 9 25MB 158713 70635 101741 148293 OUT 14 5 2 3 4SK 89697 OUT 113626 207004 OUT 14 3 4 7AB 263008 169093 68363 739514 OUT 26 6 4 1 15BC 446624 117614 182993 797518 OUT 34 10 3 4 17
298 126 39 26 76 31 042% 13% 9% 26% 10%
Page 7 of 9

Table 1
Votes by province and party above 10% viability threshold Proportional seats from viable votes, 10%
L PC NDP CA BQ OTHER SEATS L PC NDP CA BQ OTHNF 103103 79157 29993 OUT OUT 7 3 3 1PE 35021 28610 OUT OUT OUT 4 2 2NS 158870 126557 104277 OUT OUT 11 4 4 3NB 159803 116980 44778 60277 OUT 10 4 3 1 2QC 1529642 OUT OUT OUT 1377727 OUT 75 39 36ON 2292075 642438 OUT 1051209 OUT 103 59 17 27MB 158713 70635 101741 148293 OUT 14 5 2 3 4SK 89697 OUT 113626 207004 OUT 14 3 4 7AB 263008 169093 OUT 739514 OUT 26 6 4 16BC 446624 OUT 182993 797518 OUT 34 11 4 19
298 136 35 16 75 36 046% 11% 5% 25% 12%
Votes by province and party above 15% viability threshold Proportional seats from viable votes, 15%
L PC NDP CA BQ OTHER SEATS L PC NDP CA BQ OTHNF 103103 79157 OUT OUT OUT 7 4 3PE 35021 28610 OUT OUT OUT 4 2 2NS 158870 126557 104277 OUT OUT 11 4 4 3NB 159803 116980 OUT 60277 OUT 10 5 3 2QC 1529642 OUT OUT OUT 1377727 OUT 75 39 36ON 2292075 OUT OUT 1051209 OUT 103 71 32MB 158713 OUT 101741 148293 OUT 14 5 4 5SK 89697 OUT 113626 207004 OUT 14 3 4 7AB 263008 OUT OUT 739514 OUT 26 7 19BC 446624 OUT OUT 797518 OUT 34 12 22
298 152 12 11 87 36 051% 4% 3% 29% 12%
Page 8 of 9

Table 1
Votes by province and party above 20% viability threshold Proportional seats from viable votes, 20%
L PC NDP CA BQ OTHER SEATS L PC NDP CA BQ OTHNF 103103 79157 OUT OUT OUT 7 4 3PE 35021 28610 OUT OUT OUT 4 2 2NS 158870 126557 104277 OUT OUT 11 4 4 3NB 159803 116980 OUT OUT OUT 10 6 4QC 1529642 OUT OUT OUT 1377727 OUT 75 39 36ON 2292075 OUT OUT 1051209 OUT 103 71 32MB 158713 OUT 101741 148293 OUT 14 5 4 5SK 89697 OUT 113626 207004 OUT 14 3 4 7AB 263008 OUT OUT 739514 OUT 26 7 19BC 446624 OUT OUT 797518 OUT 34 12 22
298 153 13 11 85 36 052% 4% 3% 29% 12%
Votes by province and party above 25% viability threshold Proportional seats from viable votes, 25%
L PC NDP CA BQ OTHER SEATS L PC NDP CA BQ OTHNF 103103 79157 OUT OUT OUT 7 4 3PE 35021 28610 OUT OUT OUT 4 2 2NS 158870 126557 OUT OUT OUT 11 6 5NB 159803 116980 OUT OUT OUT 10 6 4QC 1529642 OUT OUT OUT 1377727 OUT 75 39 36ON 2292075 OUT OUT OUT OUT 103 103MB 158713 OUT OUT 148293 OUT 14 7 7SK OUT OUT 113626 207004 OUT 14 5 9AB OUT OUT OUT 739514 OUT 26 26BC 446624 OUT OUT 797518 OUT 34 12 22
298 179 14 5 64 36 060% 5% 2% 21% 12%
Page 9 of 9

Table 2
Party Region LIB PC NDP REF BQLib Atlantic 40% 45% 15%
Quebec 1993 80% 5% 15%1997 80% 5% 5% 10%
Man-Sask 40% 40% 20%Alberta 30% 60% 10%Brit. Columbia 20% 75% 10%Territories 30% 55% 15%
PC Atlantic 50% 20% 30%Quebec 1993 70% 10% 20%
1997 70% 5% 5% 15%2000 60% 5% 5% 30%
Ontario 50% 10% 40%Man-Sask 40% 20% 40%Alberta 25% 5% 70%Brit. Columbia 20% 15% 65%Territories 45% 35% 20%
NDP Atlantic 65% 30% 5%Quebec 1993 60% 30% 10%
1997 60% 30% 5% 5%2000 70% 20% 5% 5%
Ontario 70% 25% 5%Man-Sask 70% 15% 15%Alberta 70% 5% 25%Brit. Columbia 65% 25% 10%Territories 70% 15% 15%
Ref/CA Atlantic 15% 80% 5%Quebec 1997 20% 60% 5% 15%
2000 40% 40% 5% 15%Ontario 10% 80% 10%Man-Sask 5% 80% 15%Brit. Columbia 5% 55% 40%Territories 1993, 1997 15% 65% 20%
2000 25% 65% 20%
BQ Quebec 1997 45% 45% 5% 5%2000 50% 40% 5% 5%
Page 1 of 1

Table 3
POPULAR VOTE ACTUAL SEATS SEATS UNDER IRV MODEL
1993L PC NDP R BQ OTHER L PC NDP R BQ OTH L PC NDP R BQ OTH
NF 155237 61488 8080 2392 3393 7 7PE 43412 23126 123 744 4817 4 4NS 235684 106411 30907 60377 20015 11 10 1NB 215769 107583 18694 32628 10425 9 1 8 2QC 1235868 506683 57339 1846024 98287 19 1 54 1 24 3 48 0ON 2583065 859596 291658 982691 163206 98 1 97 2 0MB 243214 64515 90091 120934 22302 12 1 1 12 1 1SK 156216 55197 129649 132587 13223 5 5 4 7 5 2AB 301774 175556 49097 629402 48000 4 22 2 24BC 458802 219838 252257 593599 107498 6 2 24 7 4 21TERR 18911 6429 8072 3891 895 2 1 2 1
5647952 2186422 935967 2559245 1846024 492061 177 2 9 52 54 1 180 8 11 48 48 041% 16% 7% 19% 14% 4% 60% 1% 3% 18% 18% 0% 61% 3% 4% 16% 16% 0%
W R R W R
1997L PC NDP R BQ OTHER L PC NDP R BQ OTH L PC NDP R BQ OTH
NF 84657 82214 49125 5632 1952 5 2 5 2PE 31595 26998 10675 1056 219 4 4NS 132539 143854 142081 45207 3689 5 6 2 7 2NB 131246 139431 73249 52270 2519 3 5 2 3 7 0QC 1342667 811410 71558 10767 1385821 37772 25 6 44 41 9 25ON 2294593 871616 495155 886787 85549 101 1 1 98 5 0MB 163226 84511 110181 112863 5162 6 1 4 3 7 1 4 2SK 109200 34460 136555 159332 2739 1 5 8 2 6 6AB 253983 152309 60633 577551 12444 2 24 3 23BC 438769 94550 277006 655699 56500 6 3 25 6 5 23TERR 11902 5352 8291 5906 2937 2 1 2 1
4994377 2446705 1434509 2513070 1385821 211482 155 20 21 60 44 1 173 31 18 54 25 038% 19% 11% 19% 11% 2% 51% 7% 7% 20% 15% 0% 57% 10% 6% 18% 8% 0%
W R W R R
Page 1 of 2

Table 3
2000L PC NDP CA BQ OTHER L PC NDP CA BQ OTH L PC NDP CA BQ OTH
NF 103103 79157 29993 8837 8408 5 2 5 2PE 35021 28610 6714 3719 400 4 4NS 158870 126557 104277 41752 3813 5 3 3 6 4 1NB 159803 116980 44778 60277 1174 5 4 1 3 6 1QC 1529642 192153 63611 212874 1377727 80891 36 1 38 42 1 32ON 2292075 642438 368709 1051209 98174 100 1 2 100 2 0 1MB 158713 70635 101741 148293 8450 5 1 4 4 5 1 4 4SK 89697 20855 113626 207004 2515 2 2 10 2 4 8AB 263008 169093 68363 739514 16021 2 1 23 2 1 23BC 446624 117614 182993 797518 69973 5 2 27 5 2 27TERR 15475 2906 9063 5932 402 3 3
5252031 1566998 1093868 3276929 1377727 290221 172 12 13 66 38 0 177 17 12 63 32 041% 12% 9% 25% 11% 2% 57% 4% 4% 22% 13% 0% 59% 6% 4% 21% 11% 0%
W R W W R
W/R = Direction of change under simulation: Right or Wrong
Page 2 of 2