a single-cell atlas of the developing drosophila ovary
TRANSCRIPT

RESOURCE/METHODOLOGY
A single-cell atlas of the developingDrosophila ovary identifies folliclestem cell progenitorsMaija Slaidina,1 Torsten U. Banisch,1 Selena Gupta, and Ruth Lehmann
Department of Cell Biology, Howard HughesMedical Institute, Skirball Institute of BiomolecularMedicine, NewYork UniversitySchool of Medicine, New York 10016, USA
Addressing the complexity of organogenesis at a system-wide level requires a complete understanding of adult celltypes, their origin, and precursor relationships. The Drosophila ovary has been a model to study how coordinatedstem cell units, germline, and somatic follicle stem cells maintain and renew an organ. However, lack of cell type-specific tools have limited our ability to study the origin of individual cell types and stem cell units. Here, we used asingle-cell RNA sequencing approach to uncover all known cell types of the developing ovary, reveal transcriptionalsignatures, and identify cell type-specific markers for lineage tracing. Our study identifies a novel cell type corre-sponding to the elusive follicle stem cell precursors and predicts subtypes of known cell types. Altogether, we reveala previously unanticipated complexity of the developing ovary and provide a comprehensive resource for the sys-tematic analysis of ovary morphogenesis.
[Keywords: Drosophila; gene expression signature; single-cell RNA sequencing; cluster analysis; lineage analysis;ovary development]
Supplemental material is available for this article.
Received July 7, 2019; revised version accepted December 2, 2019.
Organs are often maintained by tissue-specific adult stemcells, which reside in specialized niches and contribute totissue maintenance during the lifetime of the organism.These niche:stem cell compartments are establishedduring development and are tightly regulated in adult-hood to ensure organ homeostasis in changing environ-mental conditions and during aging. Dissecting theorigins and molecular mechanisms of adult stem cellspecification and morphogenesis is challenging. In manysystems, it is unclear whether adult stem cells are directdescendants of embryonic progenitors or whether theyare specified later during development.Drosophila melanogaster is a genetically tractable or-
ganism and their ovaries have served as a model for adultstem cell studies for decades. However, addressing celltype-specific functions and how cells interact with eachother to establish an adult organ has been hampered bylack of cell type-specific tools and markers. Here, we re-
port on a comprehensive single cell atlas of the developingDrosophila ovary and identify the progenitors of adultstem cell units. Drosophila ovaries house two adultstem cell units—germline stem cell (GSC) and folliclestem cell (FSC) (Dansereau and Lasko 2008)—thus provid-ing an excellent model system to study adult stem celldevelopment and regulation in a genetically tractable or-ganism. The major ovary function, egg production, isachieved by coordinated proliferation and differentiationofGSCs and FSCs,which are both regulated by specializedsomatic niche cells. The GSC daughter cells differentiateinto eggs, while cells deriving from FSCs give rise to an es-sential follicle epithelium that covers and nurtures theegg and provides the developing oocyte with essential ax-ial patterning information (Riechmann and Ephrussi2001). Numerous studies of GSCs have revealed key prin-ciples of niche:stem cell signaling, and delivered a wealthof knowledge of GSC development and establishment.However, the exact origin of FSCs remains elusive, theirdevelopment has yet to be studied, and a clear definitionof the stem cell pool is lacking (Nystul and Spradling
1These authors contributed equally to this work.Corresponding authors: [email protected],[email protected] published online ahead of print. Article and publication date areonline at http://www.genesdev.org/cgi/doi/10.1101/gad.330464.119. Free-ly available online through the Genes & Development Open Accessoption.
© 2020 Slaidina et al. This article, published inGenes&Development, isavailable under a Creative Commons License (Attribution 4.0 Internation-al), as described at http://creativecommons.org/licenses/by/4.0/.
GENES & DEVELOPMENT 34:1–12 Published by Cold Spring Harbor Laboratory Press; ISSN 0890-9369/20; www.genesdev.org 1
Cold Spring Harbor Laboratory Press on January 10, 2022 - Published by genesdev.cshlp.orgDownloaded from

2007; Reilein et al. 2017). In addition to GSCs and FSCs,ovaries contain a number of other somatic cell typesthat support the development and adult functions of theovary. During development, their proliferation, move-ment, and differentiation needs to be coordinated to estab-lish a functional adult organ. How this is orchestratedand the exact function of individual cell types remainsto be elucidated. This knowledge gap is partly caused bya lack of cell type-specific markers and tools.
Single-cell RNA sequencing (scRNA-seq) allows cap-ture of individual cells of an entire organ to sequencetheir transcriptomes (Stuart and Satija 2019). We appliedthis technology to developing fly ovaries to gain a sys-tems view of the complete repertoire of ovarian cell typesand their functions during development. For our studies,we chose the late third larval instar (LL3) stage for tworeasons. First, specific progenitor populations for the ma-jority of cell types are thought to be established by thisstage and, second, germ cells transition from undifferen-tiated primordial germ cells to self-renewing germlinestem cells that reside adjacent to their somatic nichesand produce more proximally located differentiatingcysts, which will give rise to the eggs (Fig. 1A; Gilboa2015).
Using scRNA-seq, we identified all known ovarian celltypes, additional subtypes, and a novel cell type. By line-age tracing and genetic cell ablation experiments, wedemonstrated that this novel cell type corresponds tothe long sought after FSC and follicle cell (FC) progenitors.Furthermore, we computed transcriptional signatures forall cell types in the developing ovary, started predictingtheir function using gene list annotation tools, and select-ed cell type-specific markers that can be used for furtherinterrogation of cell type function and lineage tracing.Our work provides a resource for future morphogenesisstudies of niche:stem cell unit establishment and gonadalsupport cell function.
Results
Single-cell RNA sequencing of developing Drosophilaovaries
For single-cell RNA sequencing (scRNA-seq) analysis, wedissected ovaries from developing larvae at LL3 stage thatexpressed a His2AV::GFP transgene. In these animals, allcell nuclei were labeled with GFP (Supplemental Fig.S1A), allowing cell purification from debris by fluores-cence-activated cell sorting (FACS) (Fig. 1B). scRNA-seqwas performed on two independently collected samplesusing the 10× Genomics Chromium system for comple-mentary DNA (cDNA) synthesis and amplification,library preparation, and sequencing. We obtained 753and 1178 single-cell transcriptomes from ∼15 and 45 lar-val ovaries, respectively, and used Seurat v2 (Satija et al.2015; Butler et al. 2018) pipeline to perform establishedquality control (QC) steps. By plotting the number ofgenes detected per cell transcriptome, we uncovered twodistinct cell populations, separated by the number ofgenes detected (Supplemental Fig. S1B). Subsequent anal-yses using known germ cell marker genes (including, vas,AGO3 and others) determined that the population withhigher number of genes detected are germ cells (4930±36 in germ cells vs. 2931± 17 in somatic cells [mean ±SEM]) (see Fig. 1C; Supplemental Fig. S1C; SupplementalMaterial). Moreover, we detected a higher number ofunique molecular identifiers (UMIs) in germ cells thanin somatic cells (53,531 ± 1001 vs. 21,097 ± 27) (Fig. 1C;Supplemental Fig. S1D), suggesting that germ cells con-tain higher RNA levels than somatic cells. Therefore,wemanually separated germ cell transcripts from somaticcell transcripts for initial QC steps (Supplemental Materi-al). Subsequently, we retained 699 and 1048 high-qualitycell transcriptomes from the two samples, respectively.Gene expression levels highly correlated between bothreplicates (Spearman=0.97) (Fig. 1D) and between our
r = 0.97 r = 0.87
Adultgermarium
Developing ovaryat LL3
TFSH
IC/ECGC
CC
SW
FSCFC
dissociation
FACS10X Genomics
scRNA-seq
analysis
Workflow
−3
−2
−1
0
1
2
−3 −2 −1 0 1 2 3Replicate 1
Rep
licat
e 2
−2
0
2
0 2 4 6bulkRNA-seq
scR
NA-
seq
A
C D E
B
LL3 larva
Figure 1. scRNA-seq experiment design and statis-tics. (A) Schematic of a developing ovary, and adultgermarium. The drawings are not to scale. (SH) Sheathcells; (TF) terminal filament cells; (CC) cap cells; (IC)intermingled cells; (EC) escort cells; (GC) germ cells;(SW) swarm cells; (FSC) follicle stem cells; (FC) folliclecells. (B) scRNA-seq experiment workflow. (C )scRNA-seq experiment statistics. (D) Gene expressionaveraged among individual cells in each replicate andcompared with each other. (E) Gene expression in rep-licate 1 averaged among individual cells and comparedwith bulk RNA-seq.
Slaidina et al.
2 GENES & DEVELOPMENT
Cold Spring Harbor Laboratory Press on January 10, 2022 - Published by genesdev.cshlp.orgDownloaded from

scRNA-seq data set and bulk RNA-seq generated fromdissected LL3 ovaries (Spearman=0.87) (Fig. 1E) despitedifferent library preparation experiments (see the Materi-als and Methods). Thus, our sample preparation methodsare robust and did not significantly alter ovarian transcrip-tion profiles. Together, scRNA-seq of dissected develop-ing ovaries yielded a high-quality data set containing1747 ovarian cell transcriptomes.
The cell types of the developing ovary
Next, we determined the cell type identity for each high-quality cell transcriptome. We batch corrected (aligned)the data sets from the two independent experiments, re-duced dimensionality and binned cells into clusters usingunsupervised hierarchical clustering (Fig. 2A; Satija et al.2015; Butler et al. 2018). With multiple clustering
bond Fas3
sogodd
SHa
SHm
Csimsim tj
SW
odd sog
SHaSHm
Con bondbond tj
FSCP
Con tj
IC
Dh44-R2 Cpr49Ac
TFa
Wnt4
TFp
Cpr49Ac Dh44-R2Wnt4
Him vas Dh44-R2
CC
Himodd Dh44-R2
SH
TFodd Dh44-R2
TFp
TFa
averageexpressionlevel0
1
2 percent of cellsexpress
FSCP SW
SH
TF
GC CC
IC
−50
0
50
tSNE
2
tSNE 1−50 0 50
02550
75
100
GC SH TF CC IC FSCP SWvas
odd
Dh44−R2
hh
en
Con
bond
sim
stumps
tj
Him
vas
SHaSHmTFa
TFp CCIC
FSCPSW
GC
GC
Fas3
−2−1012
Expr
essi
on
IC FSCP
A B
C
D E E’ F’E’’ F
G G’ H I’H’ I
J J’ K L’’L L’
M N N’ N’’ ON’”
Figure 2. scRNA-seq reveals 7 cell types in developingDrosophila ovaries. (A) Visualization of cell clusters using t-distributed stochasticneighbor embedding (tSNE). Each point corresponds to a single cell and is color-coded according to cluster membership. (B) Visualizationof previously described and newly identified marker gene expression in a dot plot. For each gene in each cluster expression levels are in-dicated by a color gradient; the percentage of cells expressing the gene is indicated by the size of the dot. (C ) Schematic drawing of a LL3ovary with newly identified cell types and subtypes. The drawing is not to scale. (D–J,L,N) mRNA in situ hybridization using HCR. Scalebars, 10 μm. (D) vas (grayscale) labels GCs. (E) odd (cyan, grayscale) labels SH, andDh44-R2 (magenta, grayscale) labels TFs. (F )Him (cyan,grayscale) labels CCs,Dh44-R2 (magenta) labels TFs, and vas (yellow) labels GCs. (G) Con (cyan, grayscale) labels ICs, tj (magenta) labelsICs, andCCs and FSCPs. (H) bond (cyan, grayscale) labels FSCPs, and tj (magenta) labels ICs, CCs, and FSCPs. (I ) bond (cyan) labels FSCPs,and Fas3 (magenta, grayscale) labels SH, TF, and FSCPs (arrowhead). (J) sim (cyan, grayscale) labels SWs, and tj (magenta) labels ICs, CCs,and FSCPs. (K ) tSNE plot revealing two SH subclusters. (L) odd (cyan, grayscale) labels all SH, and sog (magenta, grayscale) labels SHm.(M ) tSNE plot revealing two TF subclusters. (N)Dh44-R2 (magenta, grayscale) labels all TFs, Cpr49Ac (yellow, grayscale) labels TFa, andWnt4 (cyan, grayscale) labels TFp, CCs, ICs, FSCPs, and SWs. Scale bars, 10 μm. (O) Visualization of gene expression levels of genes differ-entially expressed between IC and FSCP in a heat map. (Red) High expression; (blue) low expression.
Single-cell atlas of Drosophila larval ovary
GENES & DEVELOPMENT 3
Cold Spring Harbor Laboratory Press on January 10, 2022 - Published by genesdev.cshlp.orgDownloaded from
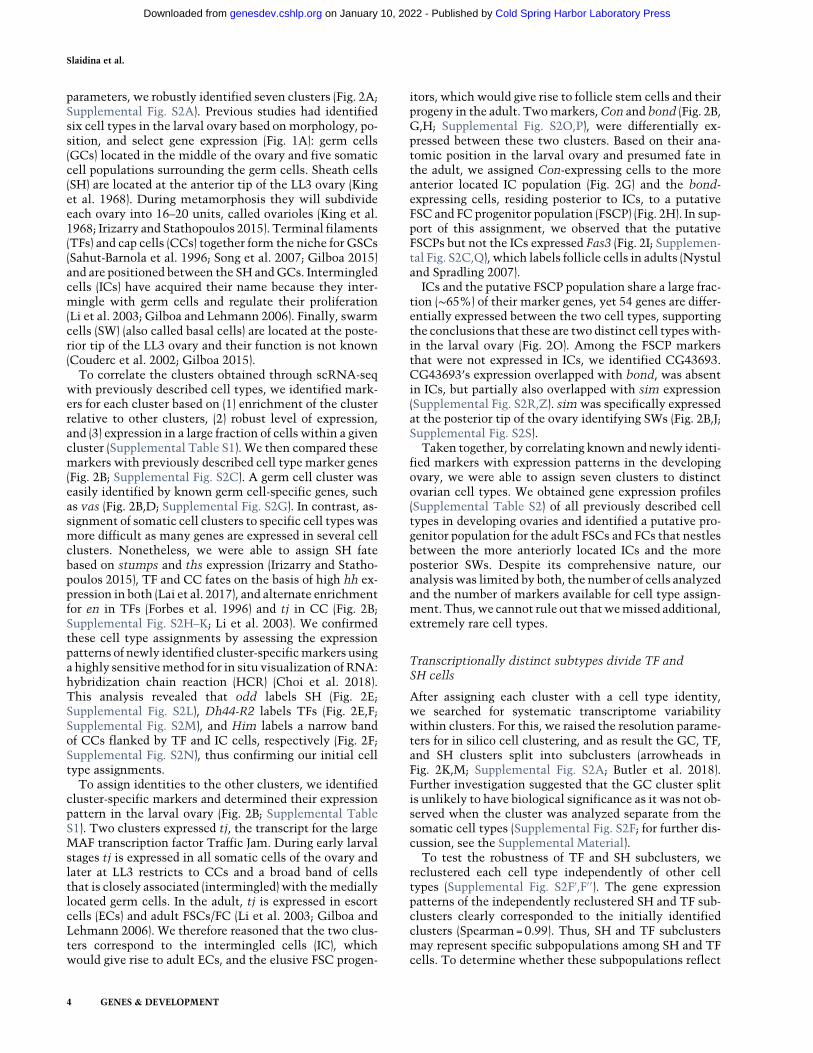
parameters, we robustly identified seven clusters (Fig. 2A;Supplemental Fig. S2A). Previous studies had identifiedsix cell types in the larval ovary based onmorphology, po-sition, and select gene expression (Fig. 1A): germ cells(GCs) located in the middle of the ovary and five somaticcell populations surrounding the germ cells. Sheath cells(SH) are located at the anterior tip of the LL3 ovary (Kinget al. 1968). During metamorphosis they will subdivideeach ovary into 16–20 units, called ovarioles (King et al.1968; Irizarry and Stathopoulos 2015). Terminal filaments(TFs) and cap cells (CCs) together form the niche for GSCs(Sahut-Barnola et al. 1996; Song et al. 2007; Gilboa 2015)and are positioned between the SH andGCs. Intermingledcells (ICs) have acquired their name because they inter-mingle with germ cells and regulate their proliferation(Li et al. 2003; Gilboa and Lehmann 2006). Finally, swarmcells (SW) (also called basal cells) are located at the poste-rior tip of the LL3 ovary and their function is not known(Couderc et al. 2002; Gilboa 2015).
To correlate the clusters obtained through scRNA-seqwith previously described cell types, we identified mark-ers for each cluster based on (1) enrichment of the clusterrelative to other clusters, (2) robust level of expression,and (3) expression in a large fraction of cells within a givencluster (Supplemental Table S1). We then compared thesemarkers with previously described cell type marker genes(Fig. 2B; Supplemental Fig. S2C). A germ cell cluster waseasily identified by known germ cell-specific genes, suchas vas (Fig. 2B,D; Supplemental Fig. S2G). In contrast, as-signment of somatic cell clusters to specific cell types wasmore difficult as many genes are expressed in several cellclusters. Nonetheless, we were able to assign SH fatebased on stumps and ths expression (Irizarry and Statho-poulos 2015), TF and CC fates on the basis of high hh ex-pression in both (Lai et al. 2017), and alternate enrichmentfor en in TFs (Forbes et al. 1996) and tj in CC (Fig. 2B;Supplemental Fig. S2H–K; Li et al. 2003). We confirmedthese cell type assignments by assessing the expressionpatterns of newly identified cluster-specificmarkers usinga highly sensitivemethod for in situ visualization of RNA:hybridization chain reaction (HCR) (Choi et al. 2018).This analysis revealed that odd labels SH (Fig. 2E;Supplemental Fig. S2L), Dh44-R2 labels TFs (Fig. 2E,F;Supplemental Fig. S2M), and Him labels a narrow bandof CCs flanked by TF and IC cells, respectively (Fig. 2F;Supplemental Fig. S2N), thus confirming our initial celltype assignments.
To assign identities to the other clusters, we identifiedcluster-specific markers and determined their expressionpattern in the larval ovary (Fig. 2B; Supplemental TableS1). Two clusters expressed tj, the transcript for the largeMAF transcription factor Traffic Jam. During early larvalstages tj is expressed in all somatic cells of the ovary andlater at LL3 restricts to CCs and a broad band of cellsthat is closely associated (intermingled) with themediallylocated germ cells. In the adult, tj is expressed in escortcells (ECs) and adult FSCs/FC (Li et al. 2003; Gilboa andLehmann 2006). We therefore reasoned that the two clus-ters correspond to the intermingled cells (IC), whichwould give rise to adult ECs, and the elusive FSC progen-
itors, which would give rise to follicle stem cells and theirprogeny in the adult. Twomarkers,Con and bond (Fig. 2B,G,H; Supplemental Fig. S2O,P), were differentially ex-pressed between these two clusters. Based on their ana-tomic position in the larval ovary and presumed fate inthe adult, we assigned Con-expressing cells to the moreanterior located IC population (Fig. 2G) and the bond-expressing cells, residing posterior to ICs, to a putativeFSC and FC progenitor population (FSCP) (Fig. 2H). In sup-port of this assignment, we observed that the putativeFSCPs but not the ICs expressed Fas3 (Fig. 2I; Supplemen-tal Fig. S2C,Q), which labels follicle cells in adults (Nystuland Spradling 2007).
ICs and the putative FSCP population share a large frac-tion (∼65%) of their marker genes, yet 54 genes are differ-entially expressed between the two cell types, supportingthe conclusions that these are two distinct cell typeswith-in the larval ovary (Fig. 2O). Among the FSCP markersthat were not expressed in ICs, we identified CG43693.CG43693’s expression overlapped with bond, was absentin ICs, but partially also overlapped with sim expression(Supplemental Fig. S2R,Z). simwas specifically expressedat the posterior tip of the ovary identifying SWs (Fig. 2B,J;Supplemental Fig. S2S).
Taken together, by correlating known and newly identi-fied markers with expression patterns in the developingovary, we were able to assign seven clusters to distinctovarian cell types. We obtained gene expression profiles(Supplemental Table S2) of all previously described celltypes in developing ovaries and identified a putative pro-genitor population for the adult FSCs and FCs that nestlesbetween the more anteriorly located ICs and the moreposterior SWs. Despite its comprehensive nature, ouranalysis was limited by both, the number of cells analyzedand the number of markers available for cell type assign-ment. Thus, we cannot rule out thatwemissed additional,extremely rare cell types.
Transcriptionally distinct subtypes divide TF andSH cells
After assigning each cluster with a cell type identity,we searched for systematic transcriptome variabilitywithin clusters. For this, we raised the resolution parame-ters for in silico cell clustering, and as result the GC, TF,and SH clusters split into subclusters (arrowheads inFig. 2K,M; Supplemental Fig. S2A; Butler et al. 2018).Further investigation suggested that the GC cluster splitis unlikely to have biological significance as it was not ob-served when the cluster was analyzed separate from thesomatic cell types (Supplemental Fig. S2F; for further dis-cussion, see the Supplemental Material).
To test the robustness of TF and SH subclusters, wereclustered each cell type independently of other celltypes (Supplemental Fig. S2F′,F′′). The gene expressionpatterns of the independently reclustered SH and TF sub-clusters clearly corresponded to the initially identifiedclusters (Spearman=0.99). Thus, SH and TF subclustersmay represent specific subpopulations among SH and TFcells. To determine whether these subpopulations reflect
Slaidina et al.
4 GENES & DEVELOPMENT
Cold Spring Harbor Laboratory Press on January 10, 2022 - Published by genesdev.cshlp.orgDownloaded from

a developmental or morphological distinction within theknown cell type, we identified markers that distinguishedthe subclusters (Supplemental Table S1) and assessedtheir expression patterns in vivo. For the SH subclusters,we found that SH cells expressing both sog and odd aremi-grating between the TF stacks, hereafter referred to asSHm (migrating) (Fig. 2L; Supplemental Fig. S2U,V), andthat SH cells, which only express odd correspond to thesheath cells located at the anterior tip of the ovary, whichwe now call SHa (anterior). For TF subtypes, Dh44-R2 la-beled both TF subclusters, while Cpr4Ac was expressedonly in the anterior half and Wnt4 labeled the posteriorhalf of the TFs as well as other cell types (CC, IC, FSCPs,and SW) (Fig. 2N; Supplemental Fig. S2W–Y). We refer tothese subtypes as TFa and TFp for anterior and posterior,respectively. Thus, individual cell type clustering re-vealed subpopulations in previously described cell types.It will be of interest to probe their developmental trajecto-ries and biological roles in the future.
Cell type-specific transcriptional signatures revealfunctional connections between cell types
Cell states and functions should be reflected by the generepertoire they express. Thus, the transcriptomes foreach cell type in developing ovaries should allow us to ex-plore their respective functions. To enrich for transcrip-
tional signatures that are cell type-specific, we excludedthose genes that are uniformly expressed in all cell typesandmostly encode proteins associated with general cellu-lar processes (Supplemental Table S1). We also excludedmarker genes that were assigned to more than three celltypes.Wevisualized the gene expression levels of the tran-scriptional signature in each cell type by heat map (Fig.3A,B; Supplemental Table S3). We then used the genelist annotations for Drosophila (GLAD) online resource(Hu et al. 2015), hypergeometric tests, and manual cura-tion to correlate transcriptional signatures with potentialfunctional specializations for each cell type (Supplemen-tal Fig. S3A; Supplemental Table S3).Germ cells are specified earlier and independently of
the somatic gonadal cells. Consistently, germ cells havethe highest number of signature genes (1073 genes) (Fig.3A). The germ cell transcriptional signature was enrichedfor multiple GLAD categories that fit well with knownand prominent features of the germline, including post-transcriptional regulation (splicing, RNA regulation,translation, protein degradation) andmitochondrialmatu-ration and selection (oxidative phosphorylation, autoph-agy) (Cox and Spradling 2003; Kai et al. 2005; Slaidinaand Lehmann 2014; Teixeira et al. 2015; Lieber et al.2019).All somatic cells of the gonad arise from a somatic go-
nadal precursor population that is specified during
A B
C D
Figure 3. Transcriptional signatures reveal sharedfunctions between cell types. (A,B) Visualization ofcell type signature gene expression in all cell typesin a heat map. (Red) High expression; (blue) low ex-pression. (A) Transcriptional signature for each celltype. (B) Transcriptional signatures of somatic celltypes. (C,D) Immunofluorescence of lineage trac-ing in larvae (C ) and adults (D) using G-TRACE.(C ) Schematic drawings in the left column indicatethe larval cell type that is being targeted: SH usingct-Gal4 (panel i), TF using hh-Gal4 (panel ii), CCusing CG3625-Gal4 (panel iii), IC using Con-Gal4 (panel iv), FSCP using bond-Gal4 (panel v),and SW using sim-Gal4 (panel vi). GFP labels thelineage expression (cyan), RFP labels current ex-pression (magenta), and Tj labels ICs, CCs, andFSCPs (yellow). (D) Schematic drawings of adultovarioles indicate cell types where lineage expres-sion is detected. DAPI labels all cell nuclei (white),Tj labels CCs, ECs, FSCs, and FCs (yellow), andGFP labels lineage expression (cyan). (Right col-umn) Schematic representation (not to scale) oftemperature shifts used to restrict Gal4 activityto larval and/or pupal stages of development to en-sure faithful developmental lineage labeling. NoRFP (current expression) was observed in the adultovaries.
Single-cell atlas of Drosophila larval ovary
GENES & DEVELOPMENT 5
Cold Spring Harbor Laboratory Press on January 10, 2022 - Published by genesdev.cshlp.orgDownloaded from

embryogenesis (Boyle and DiNardo 1995; Moore et al.1998; Riechmann et al. 1998). The signature gene heatmap reflects this shared origin as most cell types can bedistinguished from each other by only a small number ofgenes. We arranged the somatic gonadal cell types alongthe ovarian anterior-to-posterior axis in a pattern thatmay reveal developmental relationships between celltypes and distinct functional specialization (Fig. 3B). Forexample, the two most anterior cell types, SH and TFshave clear transcriptional signatures that set them apartfrom each other and all other somatic gonadal cell types(SH: 179 genes; TF: 404 genes), suggesting that these celltypes may have diverged from a common precursor poolearly in development (Godt and Laski 1995). Consistentwith their common function in forming the germlinestem cell niche, CCs and TFs share a fraction of their tran-scriptional signature (CC: 262 genes; common: 122 genes).Finally, the strongly correlated transcriptional signatureof ICs and FSCPs (IC: 155 genes; FSCP: 161 genes; com-mon: 101 genes) suggests that they originated from a com-mon progenitor subpopulation late in development or thatthey fulfill related functions.
Consistent with their role in germ cell support and go-nad morphogenesis, all somatic cell types are enrichedfor gene ontology terms associated with cell signaling.For example, Notch ligands are enriched in SH and TFs,and all other cell types highly express Notch receptorsand/or their downstream pathway components (Songet al. 2007). Multiple somatic cell types are significantlyenriched for genes expressing proteins with roles in medi-ating cell–cell communication. These protein classes willexpand previous observations which showed that, in addi-tion to conventional signaling pathways, ovarian cells co-ordinate their behaviors through alternative modes ofsignaling (Gilboa et al. 2003; Banisch et al. 2017). For ex-ample, the gap junction protein zpg is highly enriched ingerm cells, while other gap junction proteins, inx2, inx3,and ogre, are expressed in somatic cell types surroundingthe germ cells. Cell type-specific enrichment for tran-scription factors and DNA-binding proteins can providea useful tool to study gene regulatory networks for gonaddevelopment at a cell type resolution. For example, thebab1 and bab2 transcription factors are required for thedevelopment of TFs and CCs, the GSC niche (Godt andLaski 1995). Adult FSCs are regulated by the Hedgehogsignaling pathway (Zhang and Kalderon 2001), and itsdownstream transcription factor Ci is specifically en-riched in FSCPs, suggesting that similar regulation mighttake place during development aswell. For amore detailedanalysis and summary of gene classes enriched in specificcell types, refer to Supplemental Figure S3A; Supplemen-tal Table S3.
Connecting precursors to adult cell types by lineagetracing
Duringmetamorphosis, developing ovaries turn into theirrespective adult structures. However, for only a fraction ofadult descendants are the progenitor cell types known.Therefore, we took advantage of our newly identified
cell type markers and designed lineage tracing experi-ments that determined the lineage relationships betweendefined cell types in developing ovaries and adult descen-dants. For lineage analysis, we used G-TRACE, a methodthat in our experimental design combines a cell type-spe-cific Gal4 driver with the UAS-FLP recombinase-FRT sys-tems to generate clones marked with nuclear GFP forlineage analysis and a UAS- fluorescent reporter to ob-serve real-time expression patterns (Evans et al. 2009).To identify appropriate driver lines for each larval celltype, we tested 79 publicly available lines with Gal4 inte-grated near the regulatory sequences of individual somaticcell type marker genes. We first tested the expression pat-tern of each line at LL3 by costainingwith anti-Tj antibod-ies and Dapi (Fig. 3C). We identified at least one Gal4driver line for each somatic cell type (Fig. 3C,D; Supple-mental Fig. S3B,C). Real-time labelingwith theG-TRACEcassette confirmed driver expression predominantly inthe predicted cell types (Fig. 3C). In contrast to RNA ex-pression analysis by mRNA in situ hybridization, thedrivers showed relatively sparse expression within thetissue of interest and also labeled a few cells most likelyassociated with other cell types. We used the thermosen-sitive Gal80 (Gal80TS) repressor to restrict the time inter-val, at which the drivers were active, to larval or up toearly pupal stages only (Fig. 3D). Due to the sparse label-ing, we did not expect that all cells of a particular celltype in the adult would be labeled. Therefore, we countedthe number of ovarioles with labeling for each cell type(Supplemental Fig. S3C). Dependent on the driver lineand cell type analyzed, GFP-labeled cells were detectedin between 14% to 54% of adult ovarioles (SupplementalFig. S3C). Altogether, we were able to follow the cell line-ages and determine the cell type lineage relationships be-tween larval and adult ovaries for each cell type identifiedby RNA sequencing (Fig. 3C,D; Supplemental Fig. S3B,C).For example, cut-Gal4-labeled SH cells at LL3 gave risepredominantly to the epithelial sheath that surroundseach ovariole in the adult (Fig. 3C [panel i],D [panel i], Sup-plemental Figs. S3C, S4A,C; Irizarry and Stathopoulos2015). As described previously, hh-Gal4 marked TFs con-tinuously from the larva to the adult (Fig. 3C [panel ii],D[panel ii]; Supplemental Fig. S3C; Lai et al. 2017). ACG3625-Gal4 line predominantly labeled CCs at LL3(Fig. 3C [panel iii],D [panel iii]; Supplemental Figs. S3C,S4B) and their progeny gave rise to adult CCs and rarelyECs, supporting the notion of common ancestry of thesetwo cell types (Song et al. 2007). Consistently, ICs labeledbyCon-Gal4 gave rise to ECs and less frequently toCCs inadults (Fig. 3C [panel iv],D [panel iv]; Supplemental Fig.S3C). The adult descendants of SWs had not been deter-mined. A sim-Gal4 driver labeled SWs at LL3 (Fig. 3C,panel vi); however, we did not detect any robust lineageexpression in the adult germarium (besides rare labelingof single SH, EC, and FCs). Instead, we identified line-age-labeled cells in the outer ovarian sheath (also calledperitoneal sheath) (Spradling 1993), suggesting that it orig-inates, at least in part, from the larval SW population (Fig.3D, panel vi; Supplemental Fig. S3C). To follow the puta-tive FSCP population we chose bond-Gal4. We found that
Slaidina et al.
6 GENES & DEVELOPMENT
Cold Spring Harbor Laboratory Press on January 10, 2022 - Published by genesdev.cshlp.orgDownloaded from

cells expressing this marker in the larva gave rise predom-inantly to follicle cells and FSCs in the adult (Fig. 3C [pan-el v],D [panel v]; Supplemental Fig. S4D). We noted thatbond-Gal4 drives expression in a slightly broader patternthan what was observed with HCR for the bond gene inthe LL3 ovary (Figs. 2H, 4C); this may explain sparse line-age expression in ECs and some other cell types in theadult (Fig. 3D, panel v). Together, these results suggestthat follicle cells are derived from a larval precursor popu-lation nested between the ICs, the precursors of the adultECs, and the SWs.The Gal4 driver lines we identified for each somatic cell
type allowed us to establish lineage trajectories to theiradult descendants. As mentioned above, expression ofthe Gal4 drivers was prominent but not completely con-fined to a single cell type. This either suggests that thedrivers do not fully recapitulate the expression patternof the targeted gene, or it reflects that some somatic celltypes of the LL3 ovary have recently diverged from a com-mon progenitor pool. In this scenario, cell type boundariesare still fluid and the activity of the Gal4 driver line re-flects the dynamics of evolving gene expression patterns.We reasoned that the lattermight be the case, in particularfor the CC, IC, and FSCP lineages. It has been proposedthat ICs give rise to CCs, and that adult FC and EC fates
might still be in flux at adult stages (Song et al. 2007; Rei-lein et al. 2017).
FSCP ablation during development causes follicle celldefects in adults
Expression signatures and lineage labeling identified aputative FSCP population at the LL3 stage. By observingthe expression of bondRNA during earlier stages of devel-opment, we asked when these cells are first specified. Wedetected bond expression first at the early third larvalinstar stage (EL3, 72 h AEL [after egg laying]) (Fig. 4A; Sup-plemental Fig. S4E). At this stage, sparse and weak bondexpression covers the entire tj expression domain, sug-gesting that the FSCPs share common ancestry withICs, which also express tj. AtML3 (96 hAEL) (Fig. 4B; Sup-plemental Fig. S4F), bond expression restricted towardposterior, and a strong band of bond expression was pre-sent at the posterior part of the tj expression domain atLL3, now likely restricted to the FSCP lineage (Fig. 4C;Supplemental Fig. S4G).It remained unclear whether the putative FSCP popula-
tion contained only the precursors for the adult FSC oralso those for other follicle cell precursor populations.To test which follicle cell populations arise directly
Oogenesis stages present inovarioles with egg chamber
>rpr n= 33
no egg st 1 st 2 st 3 st 4
45.5
33.3
6.112.1
3.0
% ov
ariol
es 40
20
0
chamber
formation defects
bond tj
ML3
bond
A’
Gal4 active
Gal4 inactive
Gal4 inactive
29 C0
18 C0
ML3 P3
EL3
bond tj
A B
bond
B’
FSCP ablationcontrol
LL3C
bond tj
C’
bond
bond-Gal4>>LacZ; Gal80TS
Fraction of ovarioles with defects>LacZ>rpr
n=806n= 933
bond-Gal4>>rpr; Gal80TS
mid-stageegg chamber death
bond-Gal4>>rpr; Gal80TS
egg chamber formation defects
J
N
D E
K
O
F
G
H
L
P
Fraction of ovaries with
7.1>LacZ>rpr
n=82n=112
00
5
10
% ov
aries
severe defects
severe defects
M
Dapi Dcp-1 Fas3Dapi Dcp-1 Fas3
Dapi Dcp-1 Fas3 Dapi Dcp-1Dapi Dcp-1 Fas3
% ov
ariol
es
egg chamber mid-stageformation egg chamber
40
20
03.8
27.9
07.6
defects deathDapi Dcp-1 Fas3
I st 9st 7
st 2st 3
st 5st 9
st 1st 3
st 6
st 2st 1
st 4germarium
germarium
Figure 4. FSCP ablation disrupts normal de-velopment of adult FSCs and FCs. (A–C )mRNA in situ hybridization using HCR atEL3 (A), ML3 (B), and LL3 (C ). (Magenta) tj ;(cyan, grayscale) bond. Scale bars, 10 μm. (D–
P) Ablation of FSCPs by bond-Gal4 driven ex-pression of the proapoptotic factor rpr restrict-ed to late larval and early pupal stages causesFC defects in adults. (D,I,M ) Control. (E,F,J,K,N,O) FSCP ablation by rpr expression usingbond-Gal4; Gal80TS. (D–F ) Wide-field imageof entire ovary pair. (G) Gal4 activation (29°C) and inactivation (18°C) by Gal80TS is indi-cated in a schematic drawing. (H) Quantifica-tion of a number of severely distorted ovaries(shown in E). (I–K,M–O) Immunofluorescencestaining of cleavedDcp-1 (yellow) labeling apo-ptotic cells, Fas3 (magenta) labeling folliclecells, and DAPI (cyan) labeling nuclei. Scalebars, 10 μm. (I ) Control ovariole with a stringof egg chambers of various stages indicatedabove each egg chamber. (J) Multiple FSCP-ab-lated germaria with dying germ cells andsomatic cells (labeled by Dcp-1). Mature eggchambers are absent from these ovarioles. (K )FSCP-ablated ovariole with a string of eggchamberswith themost posterior egg chamberdying (labeled by Dcp-1). (L) Quantification offrequency of egg chamber formation defects(shown in J and N) and mid-stage egg chamberdeath (shown in K andO) in control and FSCP-ablated ovaries. (M ) Control germarium with
stage 1 and a stage 2 egg chambers. (N) FSCP-ablated germarium with severe defects (as in J). (O) Dying egg chamber from FSCP ablatedovary. A gap in the follicular layer is indicated by a bracket. (P) Quantification of oogenesis stages present in ovarioles with egg chamberformation defects.
Single-cell atlas of Drosophila larval ovary
GENES & DEVELOPMENT 7
Cold Spring Harbor Laboratory Press on January 10, 2022 - Published by genesdev.cshlp.orgDownloaded from

from the larval cell population, we ablated the FSCPs be-tween ML3 to the mid-pupal stages using bond-Gal4 andGal80TS-mediated temporal expression of reaper (rpr), anapoptosis-inducing gene (Fig. 4G; White et al. 1996). Con-trol adult females developed normal ovaries (Fig. 4D,H),while ovary morphology was grossly abnormal in 7% ofFSCP-ablated females (Fig. 4E,F,H). Detailed analyses ofFSCP-ablated ovaries revealed defects in 35.5%of all ovar-ioles. We detected two distinct phenotypes. The first phe-notype, which we refer to as “egg chamber formationdefects,”was very severe and led to complete egg chamberformation defects, which were generally associated withhighly abnormal, distorted ovaries (7.6% of total ovariolesof FSCP-ablated females vs. 0% in controls) (Fig. 4I,J,L). Inthe majority of ovarioles with this phenotype, oogenesiswas blocked before stage 2 (Fig. 4M,N,P), and germlineand somatic cells were undergoing apoptosis, as deter-mined by staining for the cleaved Drosophila cell deathprotease Dcp-1 (Fig. 4J,N). The second phenotype, whichwe refer to as “egg chamber death” was characterized bymid-stage egg chamber death (stages 8–9) and was ob-served in 27.9% of total ovarioles of FSCP ablated females(compared with 3.8% in controls) (Fig. 4K,L,O). This phe-notype was characterized by Dcp-1 staining and pyknoticnurse cell nuclei, hallmarks of egg chamber apoptosis(Pritchett et al. 2009). In these dying egg chambers, we ob-served gaps in the follicular epithelium revealed by Dlg, alateral membrane marker of the follicular epithelium(brackets in Fig. 4O; Supplemental Fig. S4H,I; Bilderet al. 2000).
We reasoned that these two distinct phenotypes couldarise from the targeted deletion of two FSCP subpopula-tions that would give rise, respectively, to two adult fol-licle cell populations: the follicle stem cells (FSC) andprefollicle cell (pre-FC) precursor populations. In adultovaries, FSCs divide rarely to produce a transient ampli-fying population called the prefollicle cells, which rapid-ly proliferate to produce the large pool of follicle cellsthat is needed to ensheath each egg chamber. Thesetwo adult populations express different levels of the ad-hesion protein Fasciclin 3 (Fas3), which is strong in adultprefollicle cells and weak or absent in FSCs (Nystul andSpradling 2007; Reilein et al. 2017). Analyzing Fas3 lev-els in the developing ovary, we also observed a low tohigh anterior to posterior Fas3 expression gradient with-in the bond-expressing domain at LL3 (Fig. 2I). These re-sults are consistent with the larval ovary possessingboth, weak Fas3-expressing precursors for the adultFSC population situated more anterior at the interfaceto the future escort cells and strong Fas3 expressersthat mark the more posterior located precursors to thepre-FCs. We propose that by ablation of FSC precursorsfollicle development would be completely abolished,thereby causing the abnormal and grossly distorted ova-ries with egg chamber formation defects. Ablation of pre-FCs, on the other hand, would cause follicle epithelialdefects, such defective egg chambers would be eliminat-ed during mid-oogenesis due to checkpoint activation asreported previously (Chao and Nagoshi 1999; Pritchettet al. 2009).
Discussion
The development of Drosophila ovaries has been studiedfor decades. Nevertheless, functional studies of mostovarian cell types have been hindered by a lack of celltype-specificmarkers and driver lines. Our study has iden-tified cell type-specificmarker genes, which now open thetargeted use of hundreds of publicly available GFP fusionconstructs (Sarov et al. 2016) that can be used for cell la-beling, live imaging, and functional studies. For example,a GFP fusion of a highly specific SH marker drm, can beused to label SH (Supplemental Fig. S4J–L), and additionallines exist for other cell types. We used a number ofpublicly available Gal4 drivers for lineage analyses. Whilesome of these were expressed broader than expected frommRNA expression patterns, we were able to identify Gal4driver lines for lineage tracing of each larval ovary celltype. In particular, these lines helped us to determinethe adult descendants of the swarm cells and identifiedthe long sought-after follicle stem cell progenitors. Goingforward, the cell type-specific markers identified in thisstudy can be used for further tool building to more specif-ically and completely target individual cell types (Sup-plemental Fig. S4L). For example, strategies involvingGal80TS and split-Gal4 systems may improve driver spe-cificity and avoid expression in other tissues (Pfeiffer et al.2010). Our GLAD analysis grouped cell type signaturegenes according to their molecular and cellular functions(Hu et al. 2015). Predicted cellular functions and proteinclasses enriched in each cell type will provide new insightinto how cells in the developing ovary interact, how stemcell units are established, and how these precursor cell in-teractions support the morphogenesis and homeostasis ofthe adult ovary.
Amajor finding of our study is the identification of a fol-licle stem cell and follicle cell progenitor population. Ourresults show that the transcriptional signatures of FSCPsand ICs are similar. This could indicate that these twocell types are specified from a common progenitor. In sup-port, the FSCP marker gene bond is detected as early asEL3 in a broad expression domain spanning both theFSCP and IC progenitors. bond may be expressed in thecommon progenitor pool and later become restricted tothe FSCPs, or the bond-expressing FSCPs may be initiallydispersed and later migrate posteriorly. In addition tocommon developmental origins, an overlap in transcrip-tional signatures may also reflect shared functions. Con-sistently, ICs and FCs both intimately interact withgerm cells and guide their differentiation (Wu et al.2008; Xie 2013; Banisch et al. 2017); thus, analyzing theoverlap between the IC and FSCP transcriptional signa-tures might reveal the nature of IC/FSCP to GC signaling,and shed light on stem cell-to-support cell communica-tion in general.
Altogether, our study provides a systems-wide overviewof cell types, and their transcriptional profiles and signa-tures in the developing Drosophila ovary. This resourcewill facilitate future studies, leading to a better under-standing of how stem cell populations are specified, regu-lated, and maintained in the context of a growing organ,
Slaidina et al.
8 GENES & DEVELOPMENT
Cold Spring Harbor Laboratory Press on January 10, 2022 - Published by genesdev.cshlp.orgDownloaded from

and more general, how a complex interplay of several celltypes achieves to build an organ. Future scRNA-seq exper-iments using additional stages of development (earlier lar-val, pupal, adult) or using scRNA-seq methods that allowsimultaneous lineage tracing, like scGESTALT (Raj et al.2018) will allow us to identify the complete lineage rela-tionships between the ovarian cell types. Moreover, per-turbing functions of individual cell types will provideinformation about cellular processes that are coordinatedbetween the cells and how this coordination is achieved.Together, our work should provide an invaluable resourcefor the stem cell and developmental biology researchcommunities.
Materials and methods
Experimental model and subject details
Fly husbandry Flieswere raised onmediumcontaining yeast,mo-lasses, and cornmeal, and kept at 25°C. The lineage tracing andablation experiments were performed at 18°C and 29°C as indi-cated in the text.
Method details
Dissections For EL3, ML3, and LL3, properly staged larvae wererinsed in PBS (for immunofluorescence) or DPBS (for RNA insitu hybridization) and sexed (if possible). Posterior part of the cu-ticlewas removed using forceps, and specimenswere inverted. In-testines were gently removed, leaving the fat body and otherorgans intact and attached to the cuticle.For L2, properly staged larvaewere rinsed and their anteriorwas
removed, leaving most organs partly extruding from the cuticle.Female adults were fattened on yeast for 2–3 d. Abdomenswere
removed using forceps and parts of intestine were removed, leav-ing ovaries partly covered by abdominal cuticle.
Immunofluorescence All steps were done with gentle rotation.Specimenswere fixed in PBS, 0.3%Triton-X (Tx), and 4%parafor-maldehyde for 20 min at room temperature with gentle rotation,washed twice with PBS and Tx 1%, and blocked/permeated for 2h in PBS, 1%Tx, and 5%normal goat serum (NGS) for 2 h at roomtemperature. Primary antibody was diluted in PBS, 0.3% Tx, 5%NGS, and incubated for 2 h at room temperature or overnight at4°C. Subsequently, specimenswerewashed in PBS, 0.3%Tx threetimes for 20 min at room temperature and in PBS, 0.3% Tx, 5%NGS twice for 30min. Secondary antibodies andDAPIwere dilut-ed in PBS, 0.3% Tx, and 5% NGS and incubated for 2 h at roomtemperature or overnight at 4°C. Subsequently, specimens werewashed in PBS and 0.3%Tx four times for 20min at room temper-ature. Finally, specimens were equilibrated in VectaShieldmounting medium overnight at 4°C and pieces of larval fat bodycontaining ovaries/adult ovarioles were mounted in VectaShield.
RNA in situ hybridization All steps are done using RNAse freereagents and supplies with gentle rotation, except for steps at37°C. The protocol was adapted from Choi et al. (2018). Speci-mens were fixed in PBS, 0.1%Tween (Tw), and 4% paraformalde-hyde for 20min at room temperature; washed twicewith PBS and0.1% Tw at room temperature; and dehydrated with sequentialwashes with 25%, 50%, 75%, and 100% methanol in PBS for5 min each on ice. Samples were stored at least overnight (up to1 wk) at −20°C. Samples were rehydrated with sequential washes
with 100%, 75%, 50%, and 25%methanol in PBS on ice; perme-ated for 2 h in PBS and 1% Tx at room temperature; postfixed inPBS, 0.1%Tw, and 4%paraformaldehyde for 20min at room tem-perature; washed twice with PBS and 0.1% Tw for 5 min on ice;washed with 50% PBS and 0.1% Tw/50% 5× SSCT (5× SSC,0.1% Tween) for 5 min on ice; washed twice with 5× SSCT for5 min on ice; incubated in probe hybridization buffer for 5 minon ice; prehybridized in probe hybridization buffer for 30 min at37°C; and hybridized overnight (16–24 h) at 37°C. Probe con-centrations were determined empirically, and ranged from 4 to8 pmol of each probe in 1mL; probe solutionwas prepared by add-ing probes to prewarmed probe hybridization solution. After hy-bridization, specimens were washed four times with probe washbuffer for 15 min each at 37°C, and twice with 5× SSCT for5 min each at room temperature. Specimens were equilibratedin amplification buffer for 5min at room temperature. Hairpin so-lutions were prepared by heating 30 pmol of each hairpin for90 sec at 95°C, cooling at room temperature in the dark for30 min, and subsequently adding the snap-cooled hairpins to500 μL of amplification buffer at room temperature. Specimenswere incubated in hairpin solution overnight (∼16 h) at room tem-perature, and washed multiple times with 5× SSCT—twice for5 min, twice for 30 min, and once for 5 min. DAPI was added inthe first 30-min wash. Specimens were equilibrated in Vecta-Shield overnight at 4°C and mounted in VectaShield, or furtherstained using the immunofluorescence protocol (see above).
Imaging Imaging was performed using Zeiss LSM 800 and ZeissLSM 780 confocal microscopes using 40× oil NA 1.3 objectives.
Ovary dissociation Fifteen to 45 LL3 ovaries were dissected persample in ice-cold DPBS; the majority of associated fat bodywas removed with forceps and dissection needles. For dissocia-tion, ovaries were transferred to 9-well glass plates and incubatedin dissociation solution (0.5% type I collagenase, 1% Trypsin;1:250 in DPBS) for 15 min with gentle rotation. The suspensionwas vigorously pipetted multiple times during the dissociationto enhance the dissociation efficiency. Enzymatic dissociationwas stopped by adding Schneider cell culture medium with fetalbovine serum (S-FBS). Starting from this step, all plasticmaterials—pipet tips, tubes, filters—were coated with S-FBS. Cell suspen-sion was filtered through a custom-made 40-micron cell strainer.The strainerwas built by securing nylonmesh in a cap of a 0.2-mLPCR tube and cutting the bottom of the tube and the cap. Uponfiltering, dissociated cells were purified by fluorescence-activatedcell sorting (FACS) using a 100-µm nozzle on Sony SY3200 cellsorter.
10×Genomics Chromium single-cell 3′ V2 reagent kits were usedfor scRNA-seq library preparation following the manufacturer’sprotocol.
Bulk RNA library preparation RNA was prepared from dissectedLL3 ovaries using QuiagenMicro kit. The libraries were preparedwith 5 ng of total RNA input using the NuGenOvation RNA-seqsystemV2, 7102-32, and theNuGenOvation ultralow systemV2,0344-32 kits using the manufacturer’s protocol. The sampleswere sequenced in one lane of HiSeq 4000 as paired-end 150.
Sequencing Single-cell RNA-seq analysis was performed for 10×libraries sequenced on paired-end 26/98 Illumina HiSeq 4000runs.
Single-cell atlas of Drosophila larval ovary
GENES & DEVELOPMENT 9
Cold Spring Harbor Laboratory Press on January 10, 2022 - Published by genesdev.cshlp.orgDownloaded from

Quantification and statistical analysis
10× Genomics data preprocessing Per-read per-sample FASTQ fileswere generated using the Illumina bcl2fastq Conversion software(v2.17) to convert BCL base call files outputted by the sequencinginstrument into the FASTQ format.The 10× Genomics analysis software, Cell Ranger (v1.3.1 for
replicate 1 and v2.0.0 for replicate 2), specifically the “cellrangercount” pipeline, was used to process the FASTQ files in order toalign reads to the Drosophila melanogaster reference genome(dm6) (Dos Santos et al. 2015) and generate gene-barcode expres-sion matrices. The output of multiple samples from the “cell-ranger count” pipeline were aggregated using the “cellrangeraggr” pipeline of Cell Ranger, normalizing the combined outputto the same sequencing depth and recomputing the gene-barcodematrices and expression analysis accordingly for the aggregateddata.
10× Genomics data quality control Seurat 2 package (Butler et al.2018) was used for all scRNA-seq analysis. In brief, to removelow-quality cells and potential doublets, we filtered out cells inwhich >5% of reads were from mitochondrial genes, and cellsthat express <500 genes. We had determined that germ cells ex-press a higher number of genes and UMIs than somatic cells;therefore, to filter out doublets, we set different filtering thresh-olds for somatic cells and germ cells. We identified germ cellsby expression of five highly specific previously known and newlyidentified germ cell genes: vas, ovo, bru1, AGO3, and CG9926.We filtered out germ cells in which we detected >90,000 UMIsand somatic cells with >60,000 UMIs.
scRNA-seq data analysis The two scRNA-seq data sets were inte-grated (aligned) using Seurat v2 (Butler et al. 2018). We followedthe Seurat v2 guidelines for identification of variable genes, di-mensionality reduction, and cell clustering. We used multipleresolution parameters (1.2–1.7) and obtained similar results (dis-cussed in results). To find markers, we used Wilcox statisticaltest built in Seurat 2.
Transcriptional signatures To compute transcriptional signaturesfor GC, SH, TF, CC, IC, FSCP, and SW, we selected all the mark-ers that are assigned to only one, two, or three of these cell types.
GLAD analyses We used the GLAD online tool (Hu et al. 2015)to determine whether the marker genes for each cell type fallinto particular gene categories. We used the hypergeometrictest to determine whether each gene category is significantly en-riched in each cell type’s transcriptional signature.
Bulk RNA-seq data preprocessing Per-read per-sample FASTQ fileswere generated using the Illumina bcl2fastq conversion software(v2.20) to convert per-cycle BCL base-call files outputted by thesequencing instrument into the FASTQ format. The alignmentprogram STAR (v2.4.5a) (Dobin et al. 2013) was used for mappingreads to the D. melanogaster reference genome dm6 (Dos Santoset al. 2015) and the application FastQ Screen (v0.5.2) (Wingett andAndrews 2018) was used to check for contaminants. The softwarefeatureCounts (Subread package v1.4.6-p3) (Liao et al. 2013, 2014)was used to generate the matrix of read counts for annotated ge-nomic features.
scRNA-seq and bulk RNA-seq correlation The mean expression val-ue was calculated for each gene among all cells in the scRNA seqdata sets, transformed to log10 scale and plotted against log10scaled counts of bulk RNA-seq data.
Data and software availability
The scRNA-seq data have been deposited inGEOunder accessioncode GEO GSE131971.
Acknowledgments
We thank Dr. Michael Buszczak, Dr. Dorothea Godt, and Dr.Erika Bach for sharing reagents. We are grateful to Dr. Brian Oli-ver (National Institutes ofHealth) andDr.MarkVanDoren (JohnsHopkins University) for communication prior to publication. Wethank Dr. Daniel Kalderon (Columbia University), Dr. TobyLieber, and Dr. Lacy Barton for discussion and comments onthe manuscript. Transgenic fly stocks were obtained from the Vi-enna Drosophila Resource Center (VDRC, http://www.vdrc.at),the Bloomington Drosophila Stock Center (National Institutesof Health P40OD018537), and Kyoto Stock Center (DGRC) atKyoto Institute of Technology. The Fas3 and Dlg antibodies de-veloped by C. Goodman were obtained from the DevelopmentalStudies Hybridoma Bank, created by the National Institute ofChildHealth andHumanDevelopment of theNational Institutesof Health, and maintained at the Department of Biology of theUniversity of Iowa. We thank the Genome Technology Center(GTC) for expert library preparation and sequencing, and the Ap-plied Bioinformatics Laboratories (ABL) for providing bioinfor-matics support at the initial steps of the project. The GTC andABL are shared resources partially supported by the Cancer Cen-ter Support grant P30CA016087 at the Laura and Isaac PerlmutterCancer Center. Cell sorting technologies were provided byNewYorkUniversity Langone’s Cytometry andCell Sorting Lab-oratory, which is supported in part by grant P30CA016087 fromthe National Institutes of Health/National Cancer Institute. Weare grateful to Claudia Skok Gibbs for assistance with statisticaland computational analyses. M.S. was a Howard HughesMedicalInstitute Fellow of the Life Sciences Research Foundation. S.G. issupported by a Dean’s Undergraduate Research Fund Grant, R.L.is supported by the Simons Foundation andNational Institutes ofHealth grant R37HD41900 and is a Howard Hughes Medical In-stitute investigator.Author contributions: M.S., T.U.B., and R.L. conceived the ex-
periments and wrote the manuscript. M.S. conducted single-cellsequencing experiments and cluster and signature analysis. M.S.and S.G. conducted in vivo expression analysis. T.U.B. conductedlineage analysis and ablation experiments. R.L. acquired fundingfor the project.
References
Banisch TU, Maimon I, Dadosh T, Gilboa L. 2017. Escort cellsgenerate a dynamic compartment for germline stem cell dif-ferentiation via combined Stat and Erk signalling. Develop-ment 144: 1937–1947. doi:10.1242/dev.143727
Bilder D, Li M, Perrimon N. 2000. Cooperative regulation of cellpolarity and growth byDrosophila tumor suppressors. Science289: 113–116. doi:10.1126/science.289.5476.113
BoyleM,DiNardo S. 1995. Specification,migration and assemblyof the somatic cells of the Drosophila gonad. Development121: 1815–1825.
Butler A, Hoffman P, Smibert P, Papalexi E, Satija R. 2018. Inte-grating single-cell transcriptomic data across different condi-tions, technologies, and species. Nat Biotech 36: 411–420.doi:10.1038/nbt.4096
Slaidina et al.
10 GENES & DEVELOPMENT
Cold Spring Harbor Laboratory Press on January 10, 2022 - Published by genesdev.cshlp.orgDownloaded from

Chao S,Nagoshi RN. 1999. Induction of apoptosis in the germlineand follicle layer of Drosophila egg chambers. Mech Dev 88:159–172. doi:10.1016/S0925-4773(99)00183-5
Choi HMT, Schwarzkopf M, Fornace ME, Acharya A, ArtavanisG, Stegmaier J, Cunha A, Pierce NA. 2018. Third-generationin situ hybridization chain reaction:multiplexed, quantitative,sensitive, versatile, robust. Development 145: dev165753.doi:10.1242/dev.165753
Couderc J-L, Godt D, Zollman S, Chen J, Li M, Tiong S, CramtonSE, Sahut-Barnola I, Laski FA. 2002. The bric à brac locus con-sists of two paralogous genes encoding BTB/POZ domain pro-teins and acts as a homeotic and morphogenetic regulator ofimaginal development in Drosophila. Development 129:2419–2433.
Cox RT, Spradling AC. 2003. A Balbiani body and the fusomemediate mitochondrial inheritance during Drosophilaoogenesis. Development 130: 1579–1590. doi:10.1242/dev.00365
DansereauDA, Lasko P. 2008. The development of germline stemcells inDrosophila.MethodsMol Biol 450: 3–26. doi:10.1007/978-1-60327-214-8_1
Dobin A, Davis CA, Schlesinger F, Drenkow J, Zaleski C, Jha S,Batut P, ChaissonM, Gingeras TR. 2013. STAR: ultrafast uni-versal RNA-seq aligner. Bioinformatics 29: 15–21. doi:10.1093/bioinformatics/bts635
Dos Santos G, Schroeder AJ, Goodman JL, Strelets VB, CrosbyMA, Thurmond J, Emmert DB, Gelbart WM, FlyBase Consor-tium. 2015. FlyBase: introduction of the Drosophila mela-nogaster release 6 reference genome assembly and large-scale migration of genome annotations. Nucleic Acids Res43: D690–D697. doi:10.1093/nar/gku1099
Evans CJ, Olson JM, Ngo KT, Kim E, Lee NE, Kuoy E, PatanananAN, Sitz D, Tran P, Do M-T, et al. 2009. G-TRACE: rapidGal4-based cell lineage analysis in Drosophila. Nat Meth 6:603–605. doi:10.1038/nmeth.1356
ForbesAJ, SpradlingAC, InghamPW, LinH. 1996. The role of seg-ment polarity genes during early oogenesis inDrosophila.De-velopment 122: 3283–3294.
Gilboa L. 2015. Organizing stem cell units in theDrosophila ova-ry.Curr OpinGenet Dev 32: 31–36. doi:10.1016/j.gde.2015.01.005
Gilboa L, Lehmann R. 2006. Soma-germline interactions coordi-nate homeostasis and growth in theDrosophila gonad.Nature443: 97–100. doi:10.1038/nature05068
Gilboa L, Forbes A, Tazuke SI, Fuller MT, Lehmann R. 2003.Germ line stem cell differentiation in Drosophila requiresgap junctions and proceeds via an intermediate state. Devel-opment 130: 6625–6634. doi:10.1242/dev.00853
Godt D, Laski FA. 1995. Mechanisms of cell rearrangement andcell recruitment in Drosophila ovary morphogenesis and therequirement of bric à brac. Development 121: 173–187.
Hu Y, Comjean A, Perkins LA, Perrimon N, Mohr SE. 2015.GLAD: an online database of gene list annotation for Droso-phila. J Genomics 3: 75–81. doi:10.7150/jgen.12863
Irizarry J, Stathopoulos A. 2015. FGF signaling supportsDrosophila fertility by regulating development of ovarianmuscle tissues. Dev Biol 404: 1–13. doi:10.1016/j.ydbio.2015.04.023
Kai T, Williams D, Spradling AC. 2005. The expression profile ofpurified Drosophila germline stem cells. Dev Biol 283: 486–502. doi:10.1016/j.ydbio.2005.04.018
King RC, Aggarwal SK, Aggarwal U. 1968. The development ofthe female Drosophila reproductive system. J Morphol 124:143–165. doi:10.1002/jmor.1051240203
Lai C-M, Lin K-Y, Kao S-H, Chen Y-N, Huang F, Hsu H-J. 2017.Hedgehog signaling establishes precursors for germline stemcell niches by regulating cell adhesion. J. Cell Biol 216:1439–1453. jcb.201610063.
LiMA,Alls JD, Avancini RM,KooK,GodtD. 2003. The largeMaffactor Traffic Jam controls gonad morphogenesis in Droso-phila. Nat Cell Biol 5: 994–1000. doi:10.1038/ncb1058
Liao Y, Smyth GK, Shi W. 2013. The Subread aligner: fast, accu-rate and scalable read mapping by seed-and-vote. Nucleic Ac-ids Res 41: e108. doi:10.1093/nar/gkt214
Liao Y, Smyth GK, ShiW. 2014. featureCounts: an efficient gene-ral purpose program for assigning sequence reads to genomicfeatures. Bioinformatics 30: 923–930. doi:10.1093/bioinformatics/btt656
Lieber T, Jeedigunta SP, Palozzi JM, Lehmann R, Hurd TR. 2019.Mitochondrial fragmentation drives selective removal of del-eterious mtDNA in the germline. Nature 319: 958.
Moore LA, Broihier HT, Van DorenM, Lehmann R. 1998. Gonad-al mesoderm and fat body initially follow a common develop-mental path in Drosophila. Development 125: 837–844.
Nystul T, Spradling A. 2007. An epithelial niche in theDrosophila ovary undergoes long-range stem cell replace-ment. Cell Stem Cell 1: 277–285. doi:10.1016/j.stem.2007.07.009
Pfeiffer BD, Ngo T-TB, Hibbard KL, Murphy C, Jenett A, TrumanJW, RubinGM. 2010. Refinement of tools for targeted gene ex-pression in Drosophila. Genetics 186: 735–755. doi:10.1534/genetics.110.119917
Pritchett TL, Tanner EA, McCall K. 2009. Cracking open celldeath in the Drosophila ovary. Apoptosis 14: 969–979.doi:10.1007/s10495-009-0369-z
Raj B, Gagnon JA, Schier AF. 2018. Large-scale reconstruction ofcell lineages using single-cell readout of transcriptomes andCRISPR–Cas9 barcodes by scGESTALT. Nat Protoc 13:2685–2713. doi:10.1038/s41596-018-0058-x
Reilein A, Melamed D, Park KS, Berg A, Cimetta E, Tandon N,Vunjak-Novakovic G, Finkelstein S, Kalderon D. 2017. Alter-native direct stem cell derivatives defined by stem cell loca-tion and graded Wnt signalling. Nat Cell Biol 19: 433–444.doi:10.1038/ncb3505
Riechmann V, Ephrussi A. 2001. Axis formation during Droso-phila oogenesis. Curr Opin Genet Dev 11: 374–383. doi:10.1016/S0959-437X(00)00207-0
Riechmann V, Rehorn KP, Reuter R, LeptinM. 1998. The geneticcontrol of the distinction between fat body and gonadal meso-derm in Drosophila. Development 125: 713–723.
Sahut-Barnola I, Dastugue B, Couderc J-L. 1996. Terminal fila-ment cell organization in the larval ovary of Drosophila mel-anogaster: ultrastructural observations and pattern ofdivisions. Roux’s Arch Dev Biol 205: 356–363. doi:10.1007/BF00377215
Sarov M, Barz C, Jambor H, Hein MY, Schmied C, Suchold D,Stender B, Janosch S, Vikas VKJ, Krisnan RT, et al. 2016. A ge-nome-wide resource for the analysis of protein localisation inDrosophila. Elife 5: e12068. doi:10.7554/eLife.12068
Satija R, Farrell JA, Gennert D, Schier AF, Regev A. 2015. Spatialreconstruction of single-cell gene expression data. Nat Bio-tech 33: 495–502. doi:10.1038/nbt.3192
Slaidina M, Lehmann R. 2014. Translational control in germlinestem cell development. J Cell Biol 207: 13–21. doi:10.1083/jcb.201407102
Song X, Call GB, Kirilly D, Xie T. 2007. Notch signalingcontrols germline stem cell niche formation in the Droso-phila ovary. Development 134: 1071–1080. doi:10.1242/dev.003392
Single-cell atlas of Drosophila larval ovary
GENES & DEVELOPMENT 11
Cold Spring Harbor Laboratory Press on January 10, 2022 - Published by genesdev.cshlp.orgDownloaded from

Spradling AC. 1993. Developmental genetics of oogenesis. InDe-velopment of Drosophila melanogaster (ed. Bate M, MartinezArias A), pp. 1–70. Cold Spring Harbor Laboratory Press, ColdSpring Harbor, New York.
Stuart T, Satija R. 2019. Integrative single-cell analysis.Nat. Rev.Genet 20: 257–272. doi:10.1038/s41576-019-0093-7
Teixeira FK, Sanchez CG, Hurd TR, Seifert JRK, Czech B, PreallJB, Hannon GJ, Lehmann R. 2015. ATP synthase promotesgerm cell differentiation independent of oxidative phosphory-lation. Nat Cell Biol 17: 689–696. doi:10.1038/ncb3165
White K, Tahaoglu E, Steller H. 1996. Cell killing by the Droso-phila gene reaper. Science 271: 805–807. doi:10.1126/science.271.5250.805
Wingett SW, Andrews S. 2018. FastQ screen: a tool for multi-ge-nome mapping and quality control. F1000Res 7: 1338. doi:10.12688/f1000research.15931.2
Wu X, Tanwar PS, Raftery LA. 2008. Drosophila follicle cells:morphogenesis in an eggshell. Semin Cell Dev Biol 19: 271–282. doi:10.1016/j.semcdb.2008.01.004
Xie T. 2013. Control of germline stem cell self-renewal and differ-entiation in the Drosophila ovary: concerted actions of nichesignals and intrinsic factors. WIREs Dev Biol 2: 261–273.doi:10.1002/wdev.60
Zhang Y, Kalderon D. 2001. Hedgehog acts as a somatic stem cellfactor in the Drosophila ovary. Nature 410: 599–604. doi:10.1038/35069099
Slaidina et al.
12 GENES & DEVELOPMENT
Cold Spring Harbor Laboratory Press on January 10, 2022 - Published by genesdev.cshlp.orgDownloaded from

10.1101/gad.330464.119Access the most recent version at doi: published online January 9, 2020Genes Dev.
Maija Slaidina, Torsten U. Banisch, Selena Gupta, et al. stem cell progenitors
ovary identifies follicleDrosophilaA single-cell atlas of the developing
Material
Supplemental
http://genesdev.cshlp.org/content/suppl/2020/01/06/gad.330464.119.DC1
Published online January 9, 2020 in advance of the full issue.
License
Commons Creative
.http://creativecommons.org/licenses/by/4.0/License (Attribution 4.0 International), as described at
, is available under a Creative CommonsGenes & DevelopmentThis article, published in
ServiceEmail Alerting
click here.right corner of the article or
Receive free email alerts when new articles cite this article - sign up in the box at the top
Published by © 2020 Slaidina et al.; Published by Cold Spring Harbor Laboratory Press
Cold Spring Harbor Laboratory Press on January 10, 2022 - Published by genesdev.cshlp.orgDownloaded from