a single service solution for your document management …icbe.ie/documents/symp2011_dmg1.pdf ·...
TRANSCRIPT

�A single service solution for
your document management
needs�

• providing document and data management since 1989
• privately owned SME company with 250 employees
• combined customer base of 4000 customers across all industry sectors
• proven track record across all sector and industry types including Government, Public and SME
• competitors generally global
About Us

Filestores
• secure and confidential off-site records management solutions for customers
• online records/information hosting

Shred-It
on-site destruction of customers records
Paper and electronic
electronic recycling
• Environmentally recycling outdated
computer and electronic equipment
Current Customers
Why Change
Key business challenges
• increasing costs
• decreasing revenue/margin pressures
• increasing competition

There is a profit problem
Reaction :Cut Costs!
Target areas of excess spending
Cut the budgets
Constrain development & de-motivate staff
Process performance fails
Customer perception suffers
Sales Fall
The Business Shrinks!
The Cost Cutting Spiral

Why Lean ?
Strategic change program (DI) responding to the changing market place
improved workflow and exceptional customer service
Implementation through “Lean System” (CI)developing people and processes
strong cultural fit
€
Time
Sales
Resources / Costs

Definition
Lean is a path to profitable growth
driven by
the provision of exceptional Customer Value at the lowest
possible cost
enabled by
the ruthless and relentless elimination of Waste
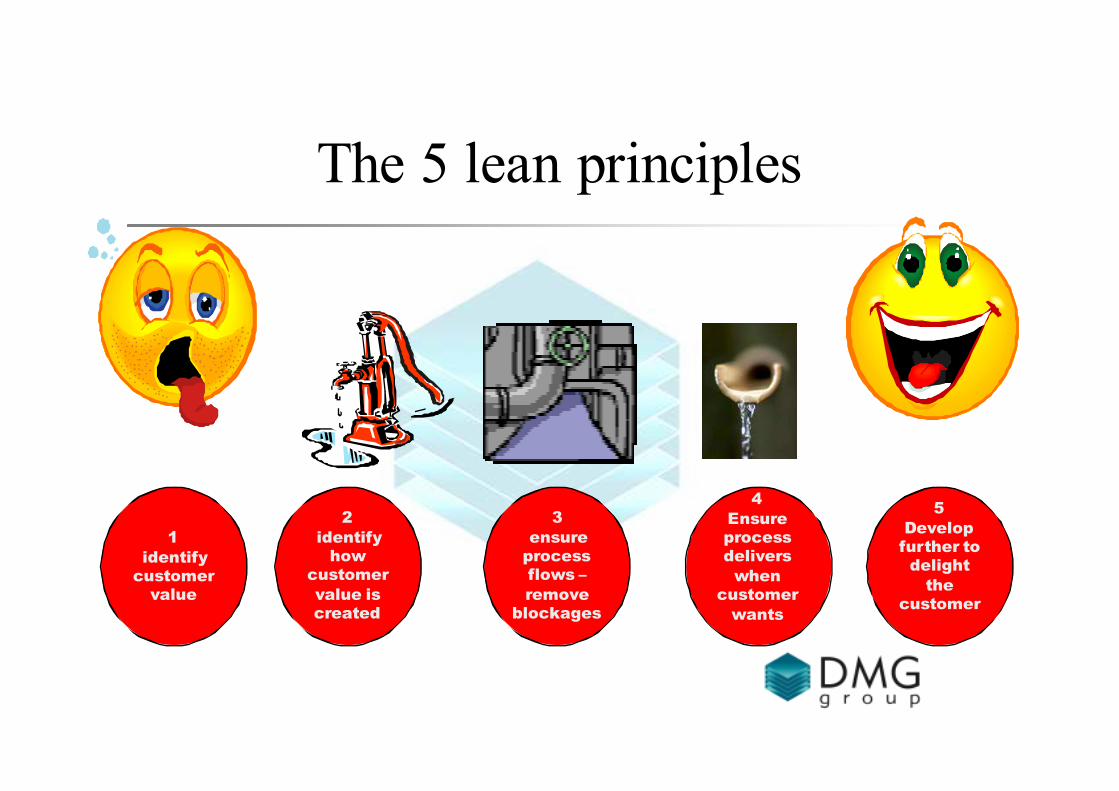
The 5 lean principles
1
identify customer value
2
identify how
customer
value is created
3
ensure process flows –
remove blockages
4
Ensure process delivers
when customer
wants
5
Develop further to delight
the customer

The Customer Offer
Product
Service
Financing
Brand and Image
The value of our offer to the market place –
more than just product or service
Payment Terms
Staff training
Brand Equity “Trust”

Organisation Structure
Silo Business Units / Silo Functions(blockages/wastes)
Culture of Silo KPI (Not Value Stream KPIs)
Silo targets/results drive Behaviours(Culture)
BU1
Operation,Sales &
Marketing KPIs
Finance (KPIs) ITHR
BU2
Operation,Sales &
Marketing KPIs
BU3
Operation,Sales &
Marketing KPIs
BU4
Operation,Sales &
Marketing KPIs
No end-to-end KPIsto drive Customer Value
“Not Value Stream”

How did we start?
• project selection was key
– credible /deliver business value &
measurable
– people involved able to influence and
shape solutions
• senior team involvement key
• people based project
• “order winning to cash in the bank”
process
• touch all business functions Improvement Opportunity
Improvement Opportunity
TimeTime
Short termgains made
Lost and repeated results due to no sustainability
Results could be lost entirelyif organizational structure not
aligned to support and education level of all employees not increased.
Improvement leveled off and eventually stopped due to lack of realizing “true”lean opportunity
Greater, sustainedresults achieved
Awareness, education, organisation structurecreated to support lean
Kaizen Blitz vs. Lean Management
Source: C. Craycraft, Whirlpool
We are not “doing lean”
We are improving our business

What did we do?
• Two team were set up
• Shred It
• Filestores
– cross functional teams from Sales, Operations and Accounts
– visualise and understand how we managed the customer, team focused on improving existing processes
– ALIN then we ENGAGE around a common goal of customer satisfaction
– Tools and techniques were minimal ,power of the team to solve problems
The Lean Business Model
Align
Engage

The key challengeWhat is customer value?
The business needs to generate cash
The customers do Not like our invoicesAnd do not pay
Internally we have high levels of rework
We need to improve our Invoice quality and
timing
We need to reduce ourDebtors days
The target:-•We need to reduce debtor days to under 50 and ensure all invoices are raised within 2 days
Why?•This will “provoke”necessay improvements that will benefit both the business and the customer

How did we start?Visualise the value stream
• cross functional team look at each revenue stream-
• issues with silos –break down barriers
• visioning the end gave us benefits we started to see people sharing problems, understanding inter and intra process waste
• This was completed for both income streams
yes yes
no
yes no no
yes
no
no
yes
no
yes
no
yes
yes
no
yes
yes
Purge customer process
C ustomer re ques ts a
purge
N ew
cu stomer?
In stru ct to pay bi l l and
cas h o n compl et i on
30 day
d ebt?Ty pe A?
A ct ive accou nt?
Pa ss to ac cou nts to
chas e d ebt
T reat a s n ew cu stomer Ty pe A?
C redit check ok?
Offer inv oi ce paymen t
I de nt ify quan ti ty loc at ion
a nd type of b usi nes s
Wi th in
scop e?
Mi nimum
purge ?
Ha nd ove r to sal es re p
Iss ue verbal or e ma il q uote
A ccept?
Sche dul e wo rk
C ontact customer
C arry out p urge
Ha nd ove r to sal es re p
Ha nd ove r to sal es re p
Ha nd ove r to sal es re p
A ccep t?

Next stepsMake it flow
• set problem statements / brainstormed solutions around the issues we identified in the end to end diagnostic.
• drive flow (no rework) via removal of wastes, unevenness and overburden

What level of debt is managed
Size and nature of business is
changing
€

Account profitabilityPlanned versus actual costs
• examine the profitability of key accounts within our business and the “breakeven point”
• great information to drive improvement further as we extend scope around Order to cash
Overall All Process Sunk Cost 31/8/2010Monthly trading CostMethod of costing
4 week month
1 Hire of c rates 3,996 1,486 1756 a month
50c a crate
2 Drop off c rates to Hospital - - A s part of retrieval process
3 St James put F/S Barcode on every fi le - - no cost
4 St James put F/S Barcode on every crate - - no cost
5 F/S Collec ts crates from James H ospital 450 - D one for a 4 w eek period
250 250 1.5 hours a day
6 F/S scan crate 4,500 - 6 hrs a day for 10 weeks employee €15 per hour
7 F/S scan fi les in cr ate, both James Hospital code and F/S - - part of above
8 Everyday fi les are pulled from cr ates to be delivered to James 675 450 1.5 hrs a day
s ince week 2
9 Delivery of fi les to James Hospital 250 E very day, 30 mins
10 Crates are taken up s tairs - - N on value added
11 Files are prepared for scanning activ ities inc ludeJoe 3,910 1,955 4 employees, preparing on
remove s taplesSamantha 443 1,772 average 5 crates each a week
remove c l ipsJames 1,502 Joe, S amantha, James and A udrey 20 hrs a w eek
insert barcoded fi le dividersAudrey 1,238 751 s td 37.5 hrs a w eek
re fi le back section of fi le
12 Files are taken to scanning room 2 employees scanning on average
MRN number is tyed into scanner (7 digits )Jennifer C 1,351 2 crates each a day - 10K - 12K per
Jennifer B 1,351 day per person
Brian 900 122K pages per w eek
13 Scan every thing
14 File storage 1,842 921 Indefinately 743 crates on s ite
4 times the s ize of a std box
15 Shredding of fi les 200 20 crates a week are scanned, €2.5 per crate shredding
Non Pr ocess Costs
Martin Finn 10% 1,030 515 Edward Hanrahan 4,000 IT support 1,000 1,000 Darren Walsh 30% 650 325 Lyndsey Power 10% 262 262
Stephen Mackey 10% 2,948 1,600 Overhead allocation 1,000 500 Light, heat, rent, repairs and maintence, group overhead
Total C osts 29,093 16,441
Income July 1,417
August 10,348
Prepar e 112K sheets per week 17,472
Total Income 11,764 17,472
Trading deficit 17,329- 1,031 16,298-
Margin -147% 6%
Projected break even
Revenue
Time
Set upRun
Decline
Actual break even
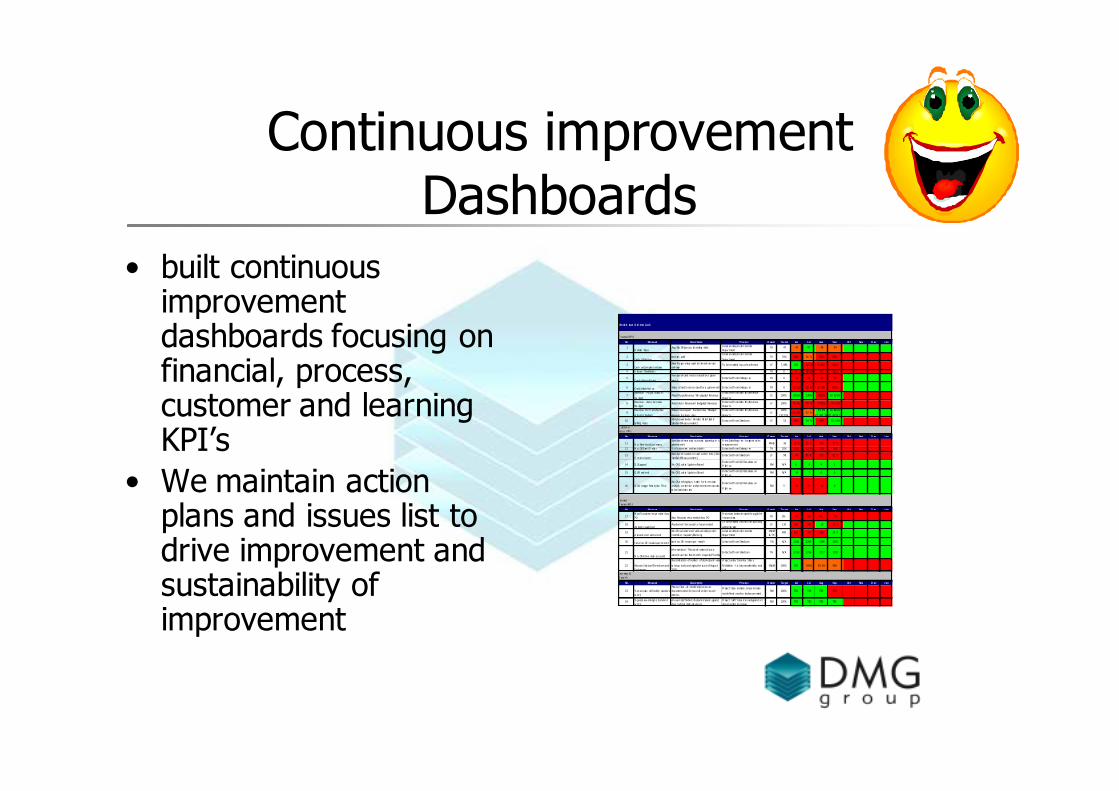
Continuous improvementDashboards
• built continuous improvement dashboards focusing on financial, process, customer and learning KPI’s
• We maintain action plans and issues list to drive improvement and sustainability of improvement
Shr ed- It Lean O rd er to Cash
Fi nancial KPI 's
No. M easure Descri pt ion Pr ocess O wner Tar get Jun J ul Aug Sep Oct Nov D ec J an
1D ebtor Days
Avg. No. Of days ou tst anding debt Cal cul at ed by Cr edi t Cont rol
Depar t mentTH 47 49 47 48 49
2Cash Coll ecti on
Invoi ces paidCal cul at ed by Cr edi t Cont rol
Depar t mentTH 70% 60% 66 % 65% 62%
3Cash on Com plet i on Sales
New Pur ge - value paid at t im e of ser vice
deli veryTo be r ecorded by cash col lect ion LF 7, 985 TBC 4,2 28 3, 541 6,331
4 V al ue o f Bad Debt s TH 0 0 3,8 89 777 2,512
5Cr edi t Not es Rai sed
Num ber of credi t not es r aised f or a given
mont hExt ract ed f r om Exchequ er TH 0 16 15 13 16
6 Cr edi t Not e Val ue Value of credi t not es r aised f or a given m ont h Ext ract ed f r om Exchequ er TH 0 10, 102 2,2 40 3, 495 8,765
7Revenue - Pur ge, Actual vs
Bu dgetActual Pur ge Revenue V B udgeted Revenue
Ext ract ed f r om Mon thl y Revenue
Repor t sLF 100% 106.1% 130% 76.21% 10 9.31%
8 Revenue - Aut o, Act ual vs
Bu dgetActual Aut o Revenue V Budgeted Revenue Ext ract ed f r om Mon thl y Revenue
Repor t sLF 100% 79. 3% 79 % 77.72% 73. 52%
9Revenue Per Tr uck Per Day
A ct ual V Budget
Actual r evenue per tr uck per day V Budget
revenue tr uck per day
Ext ract ed f r om Mon thl y Revenue
Repor t sLF
100%
( €1,310)87. 8% 97 %
99. 4%
€1 ,302. 29
10 8.65%
€1, 4233. 13
10Bi ll ing Rati o
Mi nut es wor ked vs mi nutes bil led (Gol d
Standar d M easur ement )Ext ract ed f r om Shredcom LF 52 46% 54 % 46% 57. 14%
C ust om er
Focus KPI' s
No. M easure Descri pt ion Pr ocess O wner Tar get Jun J ul Aug Sep Oct Nov D ec J an
11 N o. New Aut o Cust omer s
Num ber of new auto accounts si gned up in a
given m ont h
Fr om Sales Repo rt s - t ar get ed sal es
m easur em ent AM cG 36 15. 5 15 .5 15.5 17. 5
12 N o. Of Di rect D ebit s % of cust om ers on di rect debi t Ext ract ed f r om Exchequ er TH 20% 12% 12 % 12% 13%
13O n t im e r epor t
Num ber of custom er s servi ced on ti me. ( Gol d
Standar d M easur ement )Ext ract ed f r om Shredcom LF 98 76 81 .8 83.3 81. 8
14 Q U Logged No. Of Q uali ty Updat es RaisedExt ract ed f r om QU Dat abase on
P: \dr i ve RM N/ A 6 8 4 1
15 Q U R esol ved No. Of Q uali ty Updat es Closed Ext ract ed f r om QU Dat abase on
P: \dr i veRM N/ A 14 7 6 0
16 Q U A verage Reso lut ion Tim e
No. Of w or ki ng days t aken f or ro ot cause
analys is , cor rect ive and pr eventi ve m easures
to be i mpl emen ted.
Ext ract ed f r om QU Dat abase on
P: \dr i veRM 5 54 15 22 0
I nt ernal
P rocess KPI 's
No. M easure Descri pt ion Pr ocess O wner Tar get Jun J ul Aug Sep Oct Nov D ec J an
17N o of I nvoices r et urn ed wi t h no
PO No o f Invoi ces ret ur ned w it h no PO
Pr ocess to be devel oped t hr ough t he
l ean pr ocess TH 0% 0% 0% 0% 0%
18do cket s r ewor ked
Any docket t hat needs t o be am endedTo be r ecorded on checkl is t by bi ll ing
adm ini st r atorLF 110 TBC TBC 19 11 1
19A ccount s not cont act ed
No. Of cust omer s not cont act ed by cr edi t
contr oll er . Capaci t y Planni ng
Cal cul at ed by Cr edi t Cont rol
Depar t ment
SMcM
& TH400 429 597 548 39 9
20 t ot al no. Of i nvoices per m ont h tot al no. Of i nvoices per mont h Ext ract ed f r om Shredcom TW N/ A 2331 2265 2296 2209
21
N o. Of Act ive Auto accounts
Inf or mat ional : The t ot al n umber of aut o
account s act ive that m ont h. Capacit y Pl anningExt ract ed f r om Shredcom TH N/ A 1733 1736 1717 1720
22 Reconci li ati on of Shr edcom and
Exchequer
Reconcili at ion of number of dockets and value
to be up and r unni ng by t he st ar t of August
2010
Pr oject under t aken by Shan e
M cMahon - t o be com plet ed by end
J uly
SMcM 100% TBC 99.9% 99. 9% 98%
Lear ning &
G row t h
No. M easure Descri pt ion Pr ocess O wner Tar get Jun J ul Aug Sep Oct Nov D ec J an
23 % pr ocesses defi ned by s tandar d
w or k
Process f low , all i denti fi ed pr ocesses
document ed w it hi n over all or der t o cash
process
Pr oject : Gap analys is , any pr ocesses
not def ined need t o be docum ented .RM 100% TBC TBC TBC 33%
24 % peopl e w or ki ng t o st andar d
w or k
rel evant s taf f indent i fi ed and tr ained against
requi r ed s t an dard pro cesses
Pr oject : Staf f t o be tr ai ned against al l
docum ented pr ocessesRM 100% TBC TBC TBC TBC
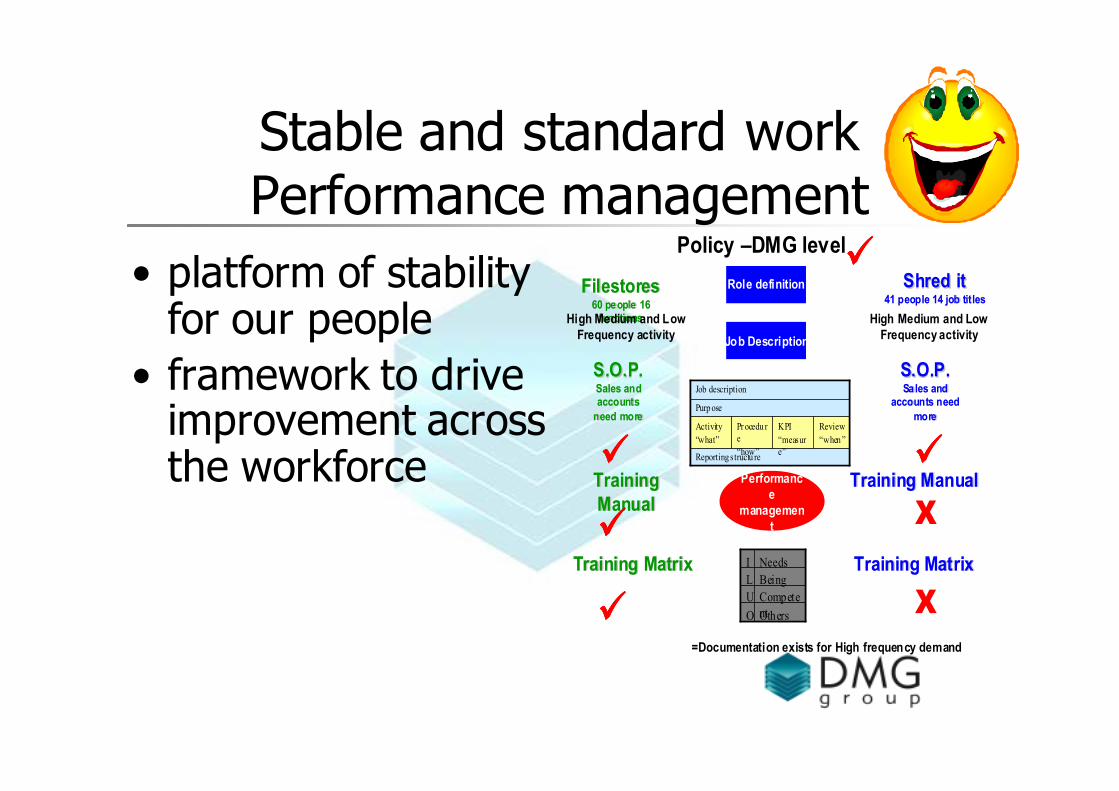
Stable and standard workPerformance management
• platform of stability for our people
• framework to drive improvement across the workforce
Policy –DMG level
FilestoresFilestores60 people 16 60 people 16 functionsfunctions
S.O.P.S.O.P.Sales and Sales and accounts accounts
need moreneed more
Training Training
ManualManual
Training MatrixTraining Matrix
Shred itShred it41 people 14 job titles41 people 14 job titles
S.O.P.S.O.P.Sales and Sales and
accounts need accounts need
moremore
Training ManualTraining Manual
Training MatrixTraining Matrix
OthersO
Compete
nt
U
BeingL
NeedsI
OthersO
Compete
nt
U
BeingL
NeedsI
Performanc
e
managemen
t
Role definition
Job Description
Reporting structu re
Review
“when”
KPI
“measur
e”
Pr ocedu r
e
“how”
Activity
“what”
Purpose
Job description
Reporting structu re
Review
“when”
KPI
“measur
e”
Pr ocedu r
e
“how”
Activity
“what”
Purpose
Job description
����
����
����
����
����
=Documentation exists for High frequency demand
X
X
High Medium and Low
Frequency activity
High Medium and Low
Frequency activity

So where are we now?
• identified customer value
• mapped our processes and understood the value stream
• starting to improve flow and align our processes to demand
• need to drive stability and secure our gains to date
• developed improvement systems
• have engagement • We have generated €300K of benefits

What are the next steps
• Drive improvement from the KPI’s
• Assess existing KPI’s across the business
• Integrate improvement activity into the day
job
• Create greater diagnostic skills across the
business-more lean champions
• Expand the scope of activity across the
organisation

Thank You