a six sigma application for the reduction of floor ... papers/jssh vol. 26 (t) apr. 2018/07... ·...
TRANSCRIPT

Pertanika J. Soc. Sci. & Hum. 26 (T): 71 - 88 (2018)
ISSN: 0128-7702 © Universiti Putra Malaysia Press
SOCIAL SCIENCES & HUMANITIESJournal homepage: http://www.pertanika.upm.edu.my/
E-mail addresses: [email protected] (Sambudi Hamali)[email protected] (Shelvy Kurniawan)[email protected] (Cecep Hidayat)[email protected] (An Nisaa Amalia Fitriani)[email protected] (Garvin Osmond)[email protected] (Natasha Evanti) * Corresponding author
Article history:Received: 06 October 2017Accepted: 28 March 2018
ARTICLE INFO
A Six Sigma Application for the Reduction of Floor Covering Defects
Sambudi Hamali*, Shelvy Kurniawan, Cecep Hidayat, An Nisaa Amalia Fitriani, Garvin Osmond and Natasha Evanti Management Department, BINUS Business School, Undergraduate Program, Bina Nusantara University,Jl. K. H. Syahdan No. 9, Kemanggisan / Palmerah, Jakarta Barat, Indonesia 11480
ABSTRACT
Quality of a product is a key to improving a company’s competitiveness. PT. “X” is a company engaged in plastic waste processing. It converts the waste into a floor carpet. The purpose of this study was to determine the number of sigma levels generated by PT. “X” in producing Floor covering, what caused the defects and how to reduce defective products using Six Sigma methods based on DMAIC step. Data for the study was collected from interviews and production statistics. The results showed the level of product quality was sigma 3.67, which is an average industry standard for Indonesia. Further, it was found that man (worker) is the major factor for occurrence of defective products. Therefore, a new employment policy at PT. “X” is needed.
Keywords: Defective products, DMAIC, quality control, Six Sigma
INTRODUCTION
Successful strategies using differentiation, low cost, or response are part quality management. Increases in sales can occur if the company has responds quickly both in increasing or decreasing their selling prices and increasing their reputation based on the quality of the product. When these steps are done correctly, the organisation usually can satisfy their customers and gain competitive advantage (Heizer, Render, & Munson, 2016).

Sambudi Hamali, Shelvy Kurniawan, Cecep Hidayat, An Nisaa Amalia Fitriani, Garvin Osmond and Natasha Evanti
72 Pertanika J. Soc. Sci. & Hum. 26 (T): 71 - 88 (2018)
PT. “X” is engaged in plastic processing industry. Currently, its focus is on producing floor covering with PVC as the basic ingredient. PT. “X” has two types of product: 2-layer products (bottom layer and printing) and 3-layer products (bottom layer, printing and mica layer). The company is currently experiencing problems with product defects, with “Pataya 20 M” and “Original 20 M” as 2-layer products which have a high percentage of defects. This happens because of the incompatibility of the products based on the established company standards. The company’s tolerance for defective products is 2% -2.5%, while the percentage of defective products for Pataya 20 M is 4.49% and for Original 20 M is 4.31%. Therefore, a tool to reduce defects, minimise variation as well as improve capability in manufacturing processes is Six Sigma (Kabir, Boby, & Lutfi, 2013).
Six Sigma is a management philosophy that focuses on eliminating errors, waste and rework. The Six Sigma implementation framework has many versions. A widely used version is DMAIC (define-measure-analyse-improve-control) that systematically helps organisations solve problems and improve the process (Hadidi, Bubshait, & Khreishi, 2017; Jirasukprasert, Arturo Garza-Reyes, Kumar, & Lim, 2014). Several previous studies have demonstrated the successful application of Six Sigma with DMAIC. Among them is Hadidi et al. (2017) on the extruded aluminium profile, Sanny, Scherly and Novela (2016) on the tofu production, Laosiritaworn, Rangsee,
Chanduen and Klanarong (2015) in the lost-wax casting, Jirasukprasert et al. (2014) on the manufacturing process of rubber gloves.
Based on the above description, to overcome the problems faced by PT. “X” and considering the limited studies that discussed the use of Six Sigma in the floor covering industry with PVC as the basic materials, this study was aimed at finding out (1) how many sigma levels were generated by PT. “X” in producing floor covering, (2) factors which caused the defective products and (3) how to reduce the defective products at PT. “X”.
LITERATURE REVIEW
Total Qual i ty Management (TQM) focuses on quality that requires continuous improvement that includes people, tools, suppliers, materials, and procedures. It is important because quality decisions affect each of the 10 decisions made by the operations manager. One of the most effective TQM programmes is Six Sigma (Heizer et al., 2016).
Six Sigma is an approach f i rs t introduced by Motorola in 1986, focusing on improvements relating to process and quality by identifying the causes of errors and reducing variability. This methodology is known as a powerful tool for process improvement with wide applications in many industries (Hadidi et al., 2017). Six Sigma’s goal is to increase profit margins, improve financial conditions by minimising the level of defective product (Kabir et al., 2013).

Six Sigma Application to Reduce Defects
73Pertanika J. Soc. Sci. & Hum. 26 (T): 71 - 88 (2018)
The Six Sigma has two methodologies which consist of:
Six Sigma – DMAIC (Define, Measure, Analyse, Improve, Control)
Design for Six Sigma (DFSS), DMADV (Define, Measure, Analyse, Design, Verify).
The DMAIC model is used when it is applied to an existing product, process, or service performance improvement and when the goal of the project is the development of product, process or service which is redesigned radically. DMADV is part of the Six Sigma toolkit design (DFSS) (Pyzdek & Keller, 2010). It consists of five main stages (Pyzdek & Keller, 2010):
“Define the goals of the improvement activity and incorporate into a Project Charter. Obtain sponsorship and assemble team.”
“Measure the existing system. Establish valid and reliable metrics to help monitor progress toward the goals which is defined at the previous step. Establish current process baseline performance using metric.”
“Analyse the system to identify ways to eliminate the gap between the current performance of the system or process and the desired goal. Use exploratory and descriptive data
analysis to help you understand the data. Use statistical tools to guide the analysis.”
“Improve the system. Be creative in finding new ways to do things better, cheaper, or faster. Use project management and other planning and management tools to implement the new approach. Use statistical methods to validate the improvement.”
“ C o n t ro l t h e n e w s y s t e m . Institutionalize the improved system by modifying compensation and incentive systems, policies, p rocedures , MRP, budge t s , operating instructions and other management systems. You may wish to utilize standardization such as ISO 9000 to ensure that documentation is correct. Use statistical tools to monitor stability of the new systems.”
Several previous studies have shown the successful application of Six Sigma by using DMAIC. Hadidi et al. (2017) showed DMAIC can significantly reduce aesthetic defects in the extruded aluminium profile by reaching the Four Sigma quality level. Laosiritaworn et al. (2015) using DMAIC was able to reduce damaged mould and leak in lost-wax casting. In addition, Jirasukprasert et al. (2014) applied DMAIC
Sambudi Hamali, Shelvy Kurniawan, Cecep Hidayat, An Nisaa Amalia Fitriani, Garvin Osmond and Natasha Evanti
74 Pertanika J. Soc. Sci. & Hum. 26 (T): 71 - 88 (2018)
framework to reduce defects in the rubber gloves manufacturing process from 19.5 to 8.4 percent.
Although some previous studies have demonstrated the successful application of Six Sigma with DMAIC, according to Wu, Yang and Chiang (2012), its implementation must pay attention to several determinants of its success, including executive management support, leadership, cohesiveness of members, and resource management. In addition, Goh (2010) suggested industries should take advantage of the power of Six Sigma which he called “triumphs” and be careful not to become victims who are not aware of the weaknesses they call “tragedies.” However, Hadidi et al. (2017) asserted that Six Sigma methodology is a well-known quality improvement framework that is used to control defects in quantities (quantitative data) such as weight and altitude, but also to control qualitative data as well as aesthetic.
MATERIALS AND METHODS
This is a descriptive study. This research was conducted between January 2015 and June 2016 with PT. “X” as the research object. The instruments used in data collection are literature review as well as field research through interviews and observations. Data was analysed using Six Sigma which is based on using DMAIC (Define, Measure, Analyse, Improve and Control).
Definition
In this first stage, a SIPOC diagram was created by identifying the Supplier (all suppliers involved), Input (all inputs into the process), Process (process which will be improved), Output (all output coming from process), and Customer (those who receive output from the process) (Basu, 2009). Supplier, Input, Process, Output, and Customer data from PT. “X” is obtained from production process data and interview results with General Manager and Manager of HRD PT. “X”. The author also uses the CTQ (Critical to Quality) tool, which is used to describe the main output characteristics of a process (Basu, 2009).
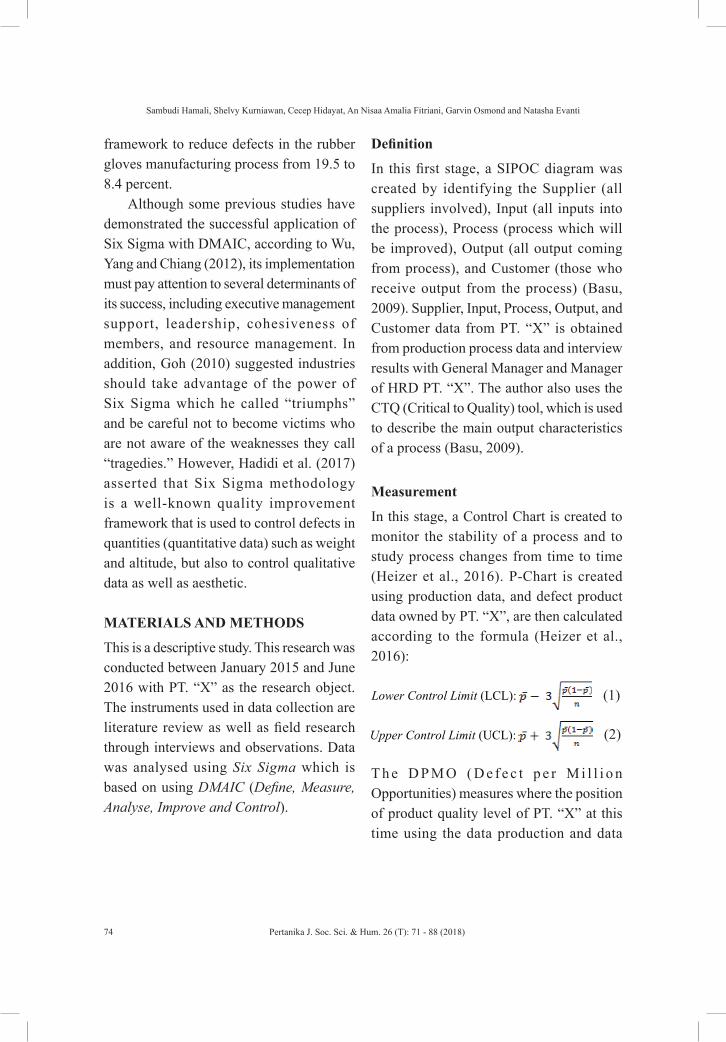
Measurement
In this stage, a Control Chart is created to monitor the stability of a process and to study process changes from time to time (Heizer et al., 2016). P-Chart is created using production data, and defect product data owned by PT. “X”, are then calculated according to the formula (Heizer et al., 2016):
(1)
(2)
T h e D P M O ( D e f e c t p e r M i l l i o n Opportunities) measures where the position of product quality level of PT. “X” at this time using the data production and data

Six Sigma Application to Reduce Defects
75Pertanika J. Soc. Sci. & Hum. 26 (T): 71 - 88 (2018)
defect products owned by PT. “X” which is then calculated using the formula DPMO (Wahyani, Chobir, & Rahmanto, 2010) as follows:
(3)
The sigma level is often associated with process capability, which is calculated in defects per million opportunities. Some levels of sigma are:
Table 1 Level of sigma achievement
% DPMO Sigma Level Description31% 691.462 1-sigma Very uncompetitive69.20% 308.538 2-sigma Average industry of Indonesia93.32% 66.807 3-sigma99.379% 6.210 4-sigma Average industry of USA99.977% 233 5-sigma99.9997% 3,4 6-sigma World-class industrySource: Wahyani, Chobir and Rahmanto (2011)
The next step is to create a Pareto Chart that is used to identify the cause of poor quality. Data used is the frequency of types of defects in PT. “X”.
Analysis
This stage determines factors that affect the production process, as well as the desired output or target of a process by using Cause & Effect Diagram or Fishbone Diagram (Russell & Taylor, 2011). The next step is making FMEA (Failure Mode and Error Analysis), a systematic approach to identify all possible failures in a design, manufacturing process or service process (Verma & Boyer, 2010).
Improvement
After identifying the root of the problem and validating it, it is necessary to take corrective action to the problem by testing and experimenting to optimising the solution so that it is really useful to solve the problem (Russell & Taylor, 2011). This is done via brainstorming which is a tool used to obtain the best ideas from every member of the team which is done in a structured (Round Robin) and unstructured (Free Wheeling) way (Basu, 2009). The ideas can be based on the results of previous research by creating an Effort Benefit Matrix that is a graph that discusses all the details of potential initiative gained compared to effort within the required timeframe and resources (Meran, John, Roenpage, Staudter, & Lunau, 2013).

Sambudi Hamali, Shelvy Kurniawan, Cecep Hidayat, An Nisaa Amalia Fitriani, Garvin Osmond and Natasha Evanti
76 Pertanika J. Soc. Sci. & Hum. 26 (T): 71 - 88 (2018)
Control
The last stage is the Control phase that provides suggestions to improve the standard operating procedures or existing production systems. These proposals are expected to improve the quality of products that can be maintained and prevent similar potential problems.
RESULTS AND DISCUSSIONS
Define
In the early stages, the production process from raw materials to finished goods is clarified, namely floor covering by looking at five variables to clarify SIPOC (Supplier, Input, Process, Output and Customer) diagram.
Figure 1. SIPOC
Figure 1. SIPOC
What are the factors that affect the quality of Floor Covering
products? Based on the interview result, these factors are Man, Machine,
Method, Material, and Environment. In addition, the type of defect in the
floor covering products are hollow, folded, early pull and the position of
motives or colours that are not appropriate.
What are the factors that affect the quality of Floor Covering products? Based on the interview result, these factors are Man, Machine, Method, Material, and
Environment. In addition, the type of defect in the floor covering products are hollow, folded, early pull and the position of motives or colours that are not appropriate.
Six Sigma Application to Reduce Defects
77Pertanika J. Soc. Sci. & Hum. 26 (T): 71 - 88 (2018)
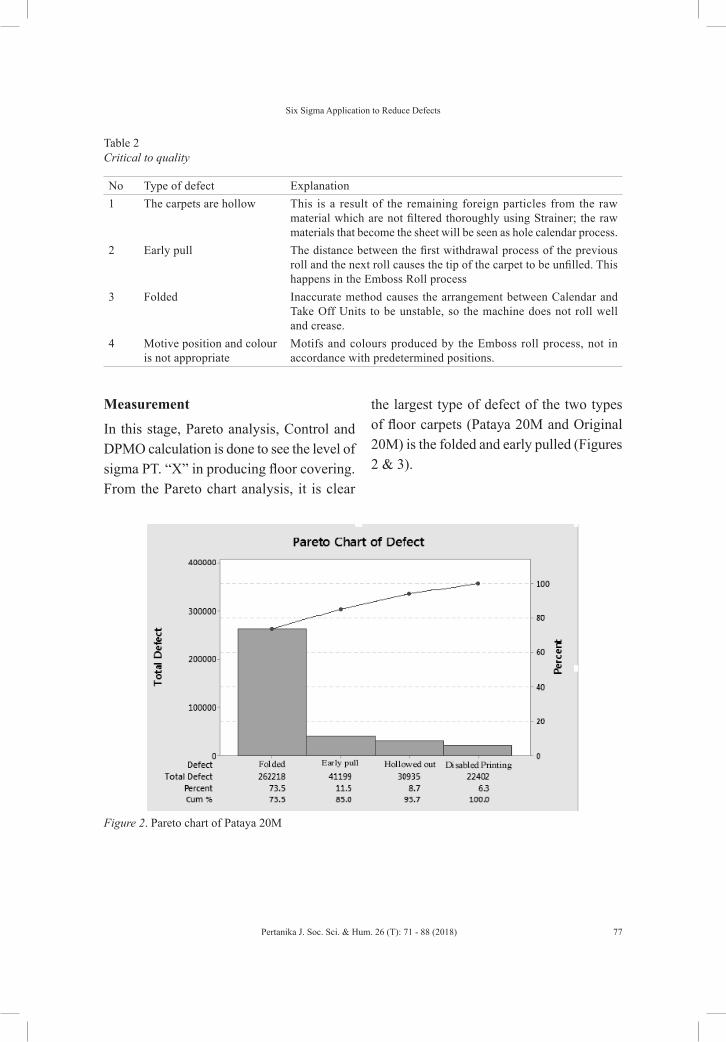
Measurement
In this stage, Pareto analysis, Control and DPMO calculation is done to see the level of sigma PT. “X” in producing floor covering. From the Pareto chart analysis, it is clear
the largest type of defect of the two types of floor carpets (Pataya 20M and Original 20M) is the folded and early pulled (Figures 2 & 3).
Table 2 Critical to quality
No Type of defect Explanation1 The carpets are hollow This is a result of the remaining foreign particles from the raw
material which are not filtered thoroughly using Strainer; the raw materials that become the sheet will be seen as hole calendar process.
2 Early pull The distance between the first withdrawal process of the previous roll and the next roll causes the tip of the carpet to be unfilled. This happens in the Emboss Roll process
3 Folded Inaccurate method causes the arrangement between Calendar and Take Off Units to be unstable, so the machine does not roll well and crease.
4 Motive position and colour is not appropriate
Motifs and colours produced by the Emboss roll process, not in accordance with predetermined positions.
Figure 2. Pareto chart of Pataya 20M
Figure 2. Pareto chart of Pataya 20M
Figure 3. Pareto chart of Original 20M
The Control Chart tool shows the production process conducted by
PT. "X" is still out of control and needs supervision (figures 4 & 5).

Sambudi Hamali, Shelvy Kurniawan, Cecep Hidayat, An Nisaa Amalia Fitriani, Garvin Osmond and Natasha Evanti
78 Pertanika J. Soc. Sci. & Hum. 26 (T): 71 - 88 (2018)
The Control Chart tool shows the production process conducted by PT. “X” is still out
of control and needs supervision (Figures 4 & 5).
Figure 3. Pareto chart of Original 20M
Figure 2. Pareto chart of Pataya 20M
Figure 3. Pareto chart of Original 20M
The Control Chart tool shows the production process conducted by
PT. "X" is still out of control and needs supervision (figures 4 & 5).
Figure 4. P-Chart Pataya
Figure 4. P-Chart Pataya
Figure 5. P-Chart Original
The DPMO tool (Defect per Million Opportunities) shows the product
quality achieved by PT. "X" in producing floor carpet. Table 3 shows the
result of DPMO for Pataya 20 M and Original 20 M:

Six Sigma Application to Reduce Defects
79Pertanika J. Soc. Sci. & Hum. 26 (T): 71 - 88 (2018)
The DPMO tool (Defect per Million Opportunities) shows the product quality achieved by PT. “X” in producing floor
carpet. Table 3 shows the result of DPMO for Pataya 20 M and Original 20 M:
Figure 5. P-Chart Original
Figure 4. P-Chart Pataya
Figure 5. P-Chart Original
The DPMO tool (Defect per Million Opportunities) shows the product
quality achieved by PT. "X" in producing floor carpet. Table 3 shows the
result of DPMO for Pataya 20 M and Original 20 M:
Table 3 Defect per million opportunities (DPMO) Pataya 20 m
Month Production Total
Defect Total
Opportunities Defect Per Unit
DMPO Sigma Level
January 119,158 11078 4 0.092968999 23242.24979 3.5February 66,939 5919 4 0.088423789 22105.94721 3.5March 167,787 13287 4 0.079189687 19797.42173 3.6April 215,275 19035 4 0.088421786 22105.44652 3.5May 238,520 18280 4 0.076639276 19159.81888 3.6June 94,205 6245 4 0.066291598 16572.89953 3.6July 86,203 4183 4 0.048524993 12131.24833 3.8August 94,383 4323 4 0.04580274 11450.68498 3.8September 105,184 5104 4 0.04852449 12131.1226 3.8October 114,750 4730 4 0.041220044 10305.01089 3.8November 125,163 5103 4 0.040770835 10192.70871 3.8December 135,803 5723 4 0.042141926 10535.48154 3.8

Sambudi Hamali, Shelvy Kurniawan, Cecep Hidayat, An Nisaa Amalia Fitriani, Garvin Osmond and Natasha Evanti
80 Pertanika J. Soc. Sci. & Hum. 26 (T): 71 - 88 (2018)
Based on DPMO calculation data at PT. “X”, overall it can be seen that the sigma and DPMO levels are 3.68 and 14595.76 for Original 20M products and 3.67 and 14965.95 for Pataya 20M products.
Therefore, product quality owned by PT. “X” meets the industry average standard in Indonesia at the level of sigma 2 and 3 (See Table 1).
January 130,552 5502 4 0.042144126 10536.03162 3.8February 134,121 6021 4 0.044892299 11223.07469 3.8March 115,170 5170 4 0.044890162 11222.54059 3.8April 135,720 5720 4 0.042145594 10536.39847 3.8May 130,750 5150 4 0.039388145 9847.036329 3.8June 116,008 5208 4 0.044893456 11223.36391 3.8Total 2,325,691 135,781
Table 3 (continue)
Month Production Total
Defect Total
Opportunities Defect Per Unit
DMPO Sigma Level
Table 4 Defect per million opportunities (DPMO) Original 20m
Month Production Total
Defect Total
Opportunities Defect Per Unit
DMPO Sigma Level
January 153,413 14,053 4 0.091602407 22900.60164 3.5February 69,945 6,185 4 0.088426621 22106.65523 3.5March 286,125 24,345 4 0.08508519 21271.29751 3.5April 263,445 21,085 4 0.080035681 20008.92027 3.6May 49,038 3,758 4 0.076634447 19158.61169 3.6June 98,399 5,919 4 0.06015305 15038.26258 3.7July 99,025 4,445 4 0.044887655 11221.91366 3.8August 100,754 4,154 4 0.041229132 10307.28309 3.8September 103,345 4,545 4 0.043978906 10994.7264 3.8October 99,198 3,998 4 0.040303232 10075.80798 3.8November 100,850 4,250 4 0.042141795 10535.44869 3.8December 102,752 3,952 4 0.038461538 9615.384615 3.8January 99,379 4,279 4 0.043057386 10764.34659 3.8February 100,721 4,521 4 0.044886369 11221.59232 3.8March 99,056 4,356 4 0.043975125 10993.7813 3.8April 101,470 4,370 4 0.043066916 10766.72908 3.8May 95,249 4,449 4 0.046709152 11677.28795 3.8June 95,827 4,127 4 0.043067194 10766.7985 3.8Total 2,117,991 126,791

Six Sigma Application to Reduce Defects
81Pertanika J. Soc. Sci. & Hum. 26 (T): 71 - 88 (2018)
Analysis
Cause & Effect Diagram or fishbone and Failure Mode and Effect Analysis (FMEA) are used to analyse results.
Based on the Pareto diagram, two types of defects are common: folded and pull early products. The Cause and Effect Diagram analysis indicates the defects.
Figure 6. Cause and effect diagram analysis of folded defect
Based on DPMO calculation data at PT. "X", overall it can be seen
that the sigma and DPMO levels are 3.68 and 14595.76 for Original 20M
products and 3.67 and 14965.95 for Pataya 20M products. Therefore,
product quality owned by PT. "X" meets the industry average standard in
Indonesia at the level of sigma 2 and 3 (See Table 1).
Analysis
Cause & Effect Diagram or fishbone and Failure Mode and Effect
Analysis (FMEA) are used to analyse results.
Based on the Pareto diagram, two types of defects are common: folded
and pull early products. The Cause & Effect Diagram analysis indicates the
defects.
Figure 6. Cause & Effect Diagram analysis of Folded Defect
Figure 7. Cause and effect diagram analysis of pull early defect
Figure 7. Cause & Effect Diagram analysis of Pull Early Defect
Based on the analysis of Cause & Effect Diagram, it has been identified
the defects are a result of man, material, method, and machine errors.
Furthermore, Failure mode and effects analysis (FMEA) is the stage to
identify the causes, check the potential weak points, assess the risks and
determine what needs to be addressed first based on the problems
experienced by PT. "X".
Table 5
Failure Mode and Effect (FMEA)
Process Potential Failure
Mode
Potential Failure
Effects S
Potential
Causes O
Current
Controls D RPN Actions Recommended
Mixing
Incorrect
composition
Product results
vary 1
Negligence and
lack of
knowledge of
workers
7
Workers are
instructed to
follow SPK.
5 35
1. Checking the
composition measurement
before starting production
activities,
2. Improving methods for
training workers.
Lack of quality of
raw materials
Product result is
defective 7
1. Lack of
quality control,
2. Lack of good
storage,
3. worker's skill
8
Inspection of
raw materials
upon arrival
at the factory
3 168
1. Improving quality
control of raw materials,
2. Adding 15 Minutes of
rest time.
Based on the analysis of Cause and Effect Diagram, it has been identified the defects are a result of man, material, method, and machine errors.
Furthermore, Failure mode and effects analysis (FMEA) is the stage to identify the causes, check the potential weak points, assess the risks and determine what needs to be addressed first based on the problems experienced by PT. “X”.

Sambudi Hamali, Shelvy Kurniawan, Cecep Hidayat, An Nisaa Amalia Fitriani, Garvin Osmond and Natasha Evanti
82 Pertanika J. Soc. Sci. & Hum. 26 (T): 71 - 88 (2018)
Tabl
e 5
Failu
re m
ode
and
effe
ct (F
MEA
)
Proc
ess
Pote
ntia
l Fai
lure
M
ode
Pote
ntia
l Fai
lure
Ef
fect
sS
Pote
ntia
l Cau
ses
OC
urre
nt
Con
trols
DRP
NA
ctio
ns R
ecom
men
ded
Mix
ing
Inco
rrec
t co
mpo
sitio
nPr
oduc
t res
ults
va
ry1
Neg
ligen
ce
and
lack
of
know
ledg
e of
w
orke
rs
7W
orke
rs a
re
inst
ruct
ed to
fo
llow
SPK
.
535
1. C
heck
ing
the
com
posi
tion
m
easu
rem
ent b
efor
e sta
rting
pro
duct
ion
activ
ities
,2.
Im
prov
ing
met
hods
for
tra
inin
g w
orke
rs.
Lack
of q
ualit
y of
ra
w m
ater
ials
Prod
uct r
esul
t is
defe
ctiv
e7
1. L
ack
of
qual
ity c
ontro
l, 2.
Lac
k of
goo
d st
orag
e,
3. w
orke
r’s
skill
8In
spec
tion
of
raw
mat
eria
ls
upon
arr
ival
at
the
fact
ory
316
81.
Im
prov
ing
qual
ity c
ontr
ol o
f ra
w
mat
eria
ls,
2. A
ddin
g 15
Min
utes
of r
est t
ime.
Filte
ring
raw
m
ater
ials
are
not
pe
rfec
t
Hol
low
pro
duct
s6
1. W
orke
r ne
glig
ence
, 2.
Filt
erin
g m
achi
ne d
oes
not w
ork
optim
ally
,3.
Too
man
y an
d la
rge
fore
ign
parti
cles
8R
egul
ar
chan
ge o
f m
achi
ne fi
lter
314
41.
Impr
oved
mac
hine
che
ckin
g be
fore
an
d af
ter p
rodu
ctio
n pr
oces
s. 2.
Add
ing
the
filte
ring
proc
ess.
Stra
iner
Del
iber
ate
by
wor
ker
1. S
low
dow
n th
e pr
oduc
tion
proc
ess,
2. P
rodu
ct
Perf
orat
ed.
8La
ck o
f wor
kers
w
elfa
re (l
ess
rest
pe
riod
& le
ss
holid
ay)
4Pr
ovid
e re
war
d an
d pu
nish
men
t
722
41.
Incr
ease
Com
pens
atio
n an
d B
enefi
t, E
stab
lish
goo
d re
lati
onsh
ips
wit
h w
orke
rs.

Six Sigma Application to Reduce Defects
83Pertanika J. Soc. Sci. & Hum. 26 (T): 71 - 88 (2018)
Wro
ng s
ettin
g1.
Acc
umul
atio
n an
d va
cuum
of
mat
eria
l to
be
proc
esse
d on
st
rain
er,
2.D
elay
pr
oduc
tion
proc
ess,
3. p
rodu
ct d
efec
t
81.
Lac
k of
kn
owle
dge
of
wor
kers
, 2.
wor
ker f
atig
ue
due
to e
xces
sive
w
orki
ng h
ours
71.
Initi
al
train
ing
for 3
m
onth
s, 2.
The
ex
iste
nce
of S
OP,
re
gard
ing
the
setti
ng o
f the
m
achi
ne
739
21.
Con
duct
ing
Trai
ning
eve
ry s
ix
mon
ths,
2. F
orm
a s
peci
al t
eam
to
chec
k pr
epar
atio
n be
fore
pro
duct
ion
proc
ess.
Cal
enda
rW
rong
set
ting
The
laye
r be
com
es to
o th
in4
Wor
ker
negl
igen
ce4
Det
erm
inin
g th
e m
in. l
imit
of c
arpe
t th
ickn
ess
is
2.5m
l.
464
The
team
in c
harg
e sh
ould
be
give
n a
SPK
brie
fing
befo
re st
artin
g pr
oduc
tion
Take
Off
Uni
tW
rong
set
ting
The
mat
eria
l be
com
es
disc
onne
cted
and
fo
lded
6La
ck o
f wor
ker
know
ledg
e an
d ne
glig
ence
7Pr
ovis
ion
of c
lear
SP
K, i
nitia
l tra
inin
g, a
nd
the
exis
tenc
e of
SO
P
625
21.
Per
form
reg
ular
tra
inin
g ev
ery
6 m
onth
s, 2.
For
m a
spe
cial
tea
m t
o ch
eck
the
prep
arat
ion
befo
re t
he p
rodu
ctio
n pr
oces
s
Prin
ting/
Embo
ss R
oll
Wro
ng s
ettin
gC
olou
r and
imag
e la
yout
are
not
ap
prop
riate
8La
ck o
f wor
ker
know
ledg
e an
d ne
glig
ence
7Pr
ovis
ion
of c
lear
SP
K, i
nitia
l tra
inin
g, a
nd
the
exis
tenc
e of
SO
P
633
61.
Per
form
regu
lar e
very
6 m
onth
s, 2.
For
m a
spe
cial
tea
m t
o ch
eck
the
prep
arat
ion
befo
re t
he p
rodu
ctio
n pr
oces
s
Coo
ling
Rol
lM
achi
ne d
amag
eD
elay
s th
e pr
oduc
tion
proc
ess
due
to le
akag
e in
th
e w
ater
flow
cy
linde
r
6Th
e ex
iste
nce
of
a fo
reig
n ob
ject
(N
ail)
3Pe
rfor
m
mai
nten
ance
pe
riodi
cally
354
Shor
ten
the
6-m
onth
mac
hine
-wid
e ch
ecki
ng p
erio
d
Tabl
e 5
(con
tinue
)
Proc
ess
Pote
ntia
l Fai
lure
M
ode
Pote
ntia
l Fai
lure
Ef
fect
sS
Pote
ntia
l Cau
ses
OC
urre
nt
Con
trols
DRP
NA
ctio
ns R
ecom
men
ded

Sambudi Hamali, Shelvy Kurniawan, Cecep Hidayat, An Nisaa Amalia Fitriani, Garvin Osmond and Natasha Evanti
84 Pertanika J. Soc. Sci. & Hum. 26 (T): 71 - 88 (2018)
Based on the analysis, the potential weak point is the Stainer process, which has setting flaws, with a total RPN (Risk Priority Number) of 392. This error results in the build-up and void of raw materials to be processed on the strainer, delays the production process and making defective products. This is due to fatigue among workers which has an impact on the accuracy
machine setting done manually in addition to workers’ lack of knowledge in this matter.
Improve
Recommendation from the brainstorming session is presented in the Effort Benefit Matrix. Table 6 presents the results of brainstorming session.
Table 6 Brainstorming
No Solution1 Training for all workers every 6 months. (Training in machine operation, safety and understanding
in reading SPK (Work Order) and IK (Work Instructions)).2 Conduct additional training, such as leadership training. It is useful for the team leader to be able
to lead its members, make decisions, communicate and maintain good relationships.3 Provide Reward to workers in the form of bonuses if they successfully produce at least 8000 meters/
shift (1 shift = 8-10 people), additional holidays, and others. There should be penalty for violation of rules or company policy, to improve discipline of workers.
4 Provide motivation to workers by hosting events, such as lunch, get togethers, Independence Day event or breakfast during Ramadhan.
5 Increase/provide additional rest periods (at least 60 minutes) to minimise fatigue.6 The company has a special team (2-3 people) to ensure the machine’s settings are based on the
SPK (Work Order) and IK (Work instructions) specifications before starting the production process.7 Make SOP (Standard Operating Procedure), IK (Work Instruction) and SPK (Work Order) detailed
and easy to understand by other workers so that it can be applied to minimise errors8 Have a written schedule about work hygiene after production process (machine and environment),
such as daily picket schedule.9 Improve quality control and screening process, in particular ensuring raw materials are checked for
its condition upon arrival at the factory. The PVC Powder material for example have to be separated, to prevent there is no contamination of foreign particles.
10 Periodic evaluation and system maintenance or scheduling machine repair for all machines (daily, weekly, monthly and yearly) every 6 months.
Six Sigma Application to Reduce Defects
85Pertanika J. Soc. Sci. & Hum. 26 (T): 71 - 88 (2018)
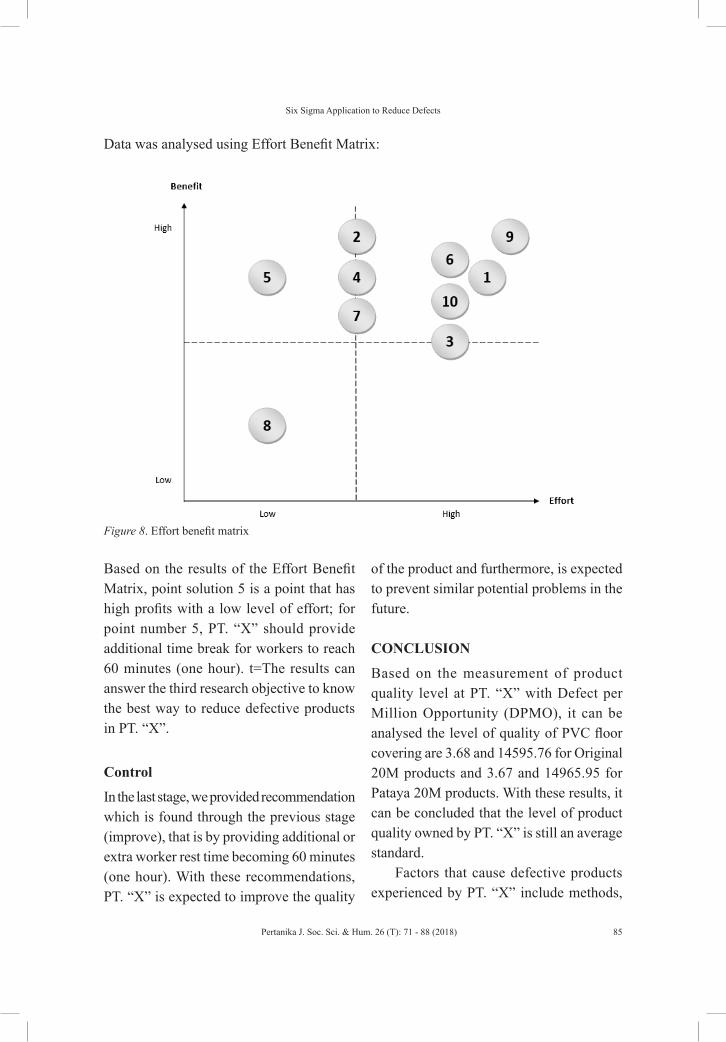
Figure 8. Effort benefit matrix
Figure 8. Effort Benefit Matrix
Based on the results of the Effort Benefit Matrix, point solution 5 is a
point that has high profits with a low level of effort; for point number 5, PT.
"X" should provide additional time break for workers to reach 60 minutes
(one hour). t=The results can answer the third research objective to know
the best way to reduce defective products in PT. "X".
Control
In the last stage, we provided recommendation which is found through
the previous stage (improve), that is by providing additional or extra worker
rest time becoming 60 minutes (one hour). With these recommendations,
PT. "X" is expected to improve the quality of the product and furthermore,
is expected to prevent similar potential problems in the future.
Data was analysed using Effort Benefit Matrix:
Based on the results of the Effort Benefit Matrix, point solution 5 is a point that has high profits with a low level of effort; for point number 5, PT. “X” should provide additional time break for workers to reach 60 minutes (one hour). t=The results can answer the third research objective to know the best way to reduce defective products in PT. “X”.
Control
In the last stage, we provided recommendation which is found through the previous stage (improve), that is by providing additional or extra worker rest time becoming 60 minutes (one hour). With these recommendations, PT. “X” is expected to improve the quality
of the product and furthermore, is expected to prevent similar potential problems in the future.
CONCLUSION
Based on the measurement of product quality level at PT. “X” with Defect per Million Opportunity (DPMO), it can be analysed the level of quality of PVC floor covering are 3.68 and 14595.76 for Original 20M products and 3.67 and 14965.95 for Pataya 20M products. With these results, it can be concluded that the level of product quality owned by PT. “X” is still an average standard.
Factors that cause defective products experienced by PT. “X” include methods,

Sambudi Hamali, Shelvy Kurniawan, Cecep Hidayat, An Nisaa Amalia Fitriani, Garvin Osmond and Natasha Evanti
86 Pertanika J. Soc. Sci. & Hum. 26 (T): 71 - 88 (2018)
machine, materials, and man. However, the factor of man or worker is the factor that most affected the occurrence of defective products. The main factor causing the defective product on the worker is wrong in the arrangement. It can be analysed from the Risk Priority Number (RPN) value of 392. The recommendation given to overcome this is by the addition of rest time and knowledge of the workers.
The managerial implication of this research is that company should use Six Sigma method of DMAIC method (Define, Measure, Analyse, Improve, and Control) periodically. This is to improve its quality regarding the products and processes, and it can also identify the cause in case of defective products and correct the production error. In addition, the company should also update the policy that addresses the issue of creating employment, providing training and provision of time off.
REFERENCESBasu, R. (2009). Implementing Six Sigma and Lean: A
practical guide to tools and techniques. Oxford: Elsevier.
Goh, T. N. (2010). Six triumphs and six tragedies of six sigma. Quality Engineering, 22(4), 299-305.
Hadidi, L. A., Bubshait, A. A., & Khreishi, S. (2017). Six-sigma for improving aesthetic defects in aluminium profiles facility. Facilities, 35(3/4), 242-267.
Heizer, J., Render, B., & Munson, C. (2016). Operations management: Sustainability and supply chain management (12th ed.). Boston: Pearson.
Jirasukprasert, P., Arturo Garza-Reyes, J., Kumar, V., & Lim, M. K. (2014). A six sigma and DMAIC application for the reduction of defects in a rubber gloves manufacturing process. International Journal of Lean Six Sigma, 5(1), 2-21.
Kabir, M. E., Boby, S. M. I., & Lutfi, M. (2013). Productivity improvement by using six-sigma. International Journal of Engineering and Technology, 3(12), 1056-1084.
Laosiritaworn, W., Rangsee, P., Chanduen, P., & Klanarong, P. (2015). Improving lost-wax casting with six sigma methodology. Applied Engineering Sciences, Vol. 1, pp. 59-64.
Meran, R., John, A., Roenpage, O., Staudter, C., & Lunau, S. (Ed.). (2013). Six sigma+lean toolset mindset for successful implementation of improvement projects. Berlin: Springer Heidelberg.
Pyzdek, T., & Keller, P. A. (2010). The six sigma handbook: A complete guide for green belts, black belts, and managers at all levels. New York: McGraw-Hill Companies.
Russell, R. S., & Taylor III, B. W. (2011). Operations management, creating value along the supply chain (7th ed.). New Jerseys: John Wiley and Sons, Inc.
Sanny, L., Scherly, N., & Novela, S. (2016). Product quality development analysis with six sigma method: Case of sme tofu production in Indonesia. Pertanika Journal of Social Sciences and Humanities, 24, 155-168.
Verma, R., & Boyer, K. (2010). Operations and supply chain management: World class theory and practice. Boston: Cengage Learning.

Six Sigma Application to Reduce Defects
87Pertanika J. Soc. Sci. & Hum. 26 (T): 71 - 88 (2018)
Wahyani, W., Chobir, A., & Rahmanto, D. D. (2010). Penerapan metode six sigma dengan konsep dmaic sebagai alat pengendali kualitas. Prosiding Seminar Nasional, Manajemen Teknologi XII, Program Studi Magister Manajemen Teknologi, Program Pasca Sarjana, Institut Teknologi Sepuluh Nopember, Surabaya.
Wu, K. S., Yang, L. R., & Chiang, I. C. (2012). Leadership and six sigma project success: The role of member cohesiveness and resource management. Production Planning and Control, 23(9), 707-717.
