a sizing study of microsoft® lync® server 2010 and its back - dell
TRANSCRIPT

Global Solutions Engineering
Dell
A Sizing Study of Microsoft® Lync®
Server 2010 and its Back End SQL
Database on Dell™ PowerEdge™ Servers
Make the most of Dell hardware running Microsoft Lync Server

A Sizing Study of Lync® Server 2010 and its Back End SQL Database on Dell™ PowerEdge™ Servers
2
This document is for informational purposes only and may contain typographical errors and
technical inaccuracies. The content is provided as is, without express or implied warranties of any
kind.
© 2012 Dell Inc. All rights reserved. Dell and its affiliates cannot be responsible for errors or omissions
in typography or photography. Dell, the Dell logo, EqualLogic, and PowerEdge are trademarks of Dell
Inc. Intel and Xeon are registered trademarks of Intel Corporation in the U.S. and other countries.
Microsoft, Active Directory, Hyper-V, Lync, SQL Server, PowerPoint, Excel, Windows, and Windows
Server are either trademarks or registered trademarks of Microsoft Corporation in the United States
and/or other countries. Other trademarks and trade names may be used in this document to refer to
either the entities claiming the marks and names or their products. Dell disclaims proprietary interest
in the marks and names of others.
September 2012| Rev 3.0
A Sizing Study of Lync® Server 2010 and its Back End SQL Database on Dell™ PowerEdge™ Servers
3
Contents Executive Summary .................................................................................................... 5
Introduction, Scope, and Purpose ................................................................................... 6
Advantages of Dell with Lync Server ................................................................................ 6
Overview of Lync Server ............................................................................................... 9
Topology Builder ..................................................................................................... 9
Central Management Store and Active Directory............................................................. 10
Lync Server Management Shell and Lync Control Panel..................................................... 10
Lync Server Roles .................................................................................................. 11
SQL Servers ......................................................................................................... 12
Test Methodology ..................................................................................................... 13
PowerEdge System Configuration .................................................................................. 14
Tools Used for Testing and Validation ............................................................................ 17
Stress and Performance Tool .................................................................................... 17
Performance Counters from Front End Server VMs and Hyper-V Host .................................... 18
Quality of Experience Reports ................................................................................... 19
Performance Counters from Back End Server ................................................................. 20
Load Generation Performance Counters ....................................................................... 21
Results and Analysis .................................................................................................. 22
Results from the Front End Server VM(s) Counters .......................................................... 23
Results from Host Counters ...................................................................................... 24
Quality of Experience Results ................................................................................... 26
Stress and Performance Tool Counters ........................................................................ 27
Back End SQL Database Results ................................................................................. 27
Reference Configuration ............................................................................................ 30
Conclusion ............................................................................................................. 33

A Sizing Study of Lync® Server 2010 and its Back End SQL Database on Dell™ PowerEdge™ Servers
4
Tables Table 1. Configuration of R720 (Lync VMs host) ............................................................... 14
Table 2. Configuration of R610 (Back-End Server) ............................................................ 15
Table 3. LUNs for SQL and Capacity Requirements ........................................................... 15
Table 4. Log Files in LUN 5. ....................................................................................... 15
Table 5. Configuration of Performance Tool Load Generators .............................................. 17
Table 6. Host and Hyper-V Counters ............................................................................. 18
Table 7. Monitoring Server QoE Statistics and Thresholds ................................................... 20
Table 8. Performance Counters and Thresholds for SQL ..................................................... 20
Table 9. Load Generation Counters .............................................................................. 21
Table 10. Test Scenarios ............................................................................................ 22
Table 11. Lync Counter Thresholds for Front End VMs ......................................................... 24
Table 12. Storage Latency for Hyper-V VMs on SAN (12,000 users) .......................................... 26
Table 13. QoE Summary for Peer-to-Peer Calls ................................................................. 26
Table 14. QoE Summary for Conferencing........................................................................ 27
Table 15. Stress and Performance Tool Counters ............................................................... 27
Table 16. Back End SQL Memory Counters ....................................................................... 29
Table 17. Disk Transfers/sec vs User Login Rates ............................................................... 30
Table 18. Disk Queue Length and Cache Hits vs. User Login Rates .......................................... 30
Table 19. Reference Configuration for 12,000 Users ........................................................... 31
Figures
Figure 1. Dell PowerEdge R720 ...................................................................................... 7
Figure 2. Dell PowerEdge R620 ...................................................................................... 7
Figure 3. Dell PowerEdge R420 ...................................................................................... 7
Figure 4. Dell Force10 S55 and S60 TOR Switches ................................................................ 8
Figure 5. Lync Server Topology Builder .......................................................................... 10
Figure 6. Lync Server Control Panel .............................................................................. 11
Figure 7. LUN Layout for Lync Server ............................................................................ 16
Figure 8. Lync User Connections per VM ......................................................................... 23
Figure 9. Conference Distribution per Front-End for 12,000 users .......................................... 24
Figure 10. Processor Utilization and Scaling as Lync Users Increase ......................................... 25
Figure 11. Memory Availability and Scaling as Lync Users Increase .......................................... 25
Figure 12. CPU and Memory Utilization for SQL Back End ...................................................... 28
Figure 13. Latency During Login .................................................................................... 29
Figure 14. Reference Architecture for 12,000 users on Dell PowerEdge Servers .......................... 32

A Sizing Study of Lync® Server 2010 and its Back End SQL Database on Dell™ PowerEdge™ Servers
5
Executive Summary
Microsoft Lync Server provides enterprise-grade communications for instant messaging,
Web/audio/video conferencing, application sharing, and telephony (or voice over IP). Users within an
organization use the Lync client to connect to a Lync Server, and then use it to communicate with
other users.
Virtualization is becoming increasingly important in many IT datacenters because it allows multiple
operating systems or workloads to be installed on a single machine. By virtualizing the Lync Servers, IT
administrators can:
Take maximum advantage of available datacenter resources with Intel® Xeon® E5-2600 product
family processors offering up to 8 processing cores per CPU, the latest Dell PowerEdge R720
supporting up to 768 GB of memory, and multiple Lync server components as separate VMs allow
administrators to make use of hardware effectively.
Scale the infrastructure to run the Lync workload while minimizing the physical resources needed;
virtualize multiple Lync Servers on a physical machine instead of restricting the IT datacenter’s
servers to a dedicated workload.
Provide better availability through the use of Microsoft’s Hyper-V® failover-clustering; if one of the
Lync Servers becomes unavailable, the Lync Server VM can be brought up, either running on the
same physical machine or on another physical machine.
Keeping these advantages in mind, engineers at Dell’s Global Solutions Engineering team conducted a
scalability study of the Lync Server on Microsoft Hyper-V. The results show linear scaling when the
number of heavy users was increased from 3000 to 6000 to 12,000 with 1, 2 and 4 VMs, respectively, on
a single Dell PowerEdge R720.
As an extension of this study of Lync 2010, the Back End SQL database performance was also measured.
Based on performance data, user login causes the most substantial load to the SQL database.
Therefore, to measure performance, users were incrementally logged into the Lync infrastructure at
different rates and the impact on the Back End database was noted. In this study, users were logged in
at 100 users/minute, 200 users/minute, and 400 users/minute. At the end of this paper, a sample
reference configuration is presented that takes both Lync and SQL database results into consideration
in a highly-available deployment.

A Sizing Study of Lync® Server 2010 and its Back End SQL Database on Dell™ PowerEdge™ Servers
6
Introduction, Scope, and Purpose
This paper begins with an overview of the Lync Server workload and the advantages of using Dell’s
latest R720 server, and then details the test environment and analyzes the collected performance
metrics. Finally, based on the study’s results, the paper presents a reference configuration for the Lync
Server 2010 on PowerEdge R720 using virtualization.
Lync Server sizing would not be complete without considering the SQL Back End server and storage
requirements. The SQL Back-End is most stressed at user login periods and these tests were conducted
by varying the login rate.
This study benefits IT administrators and other professionals interested in using Microsoft Lync Server
2010 and Dell PowerEdge 12th generation servers. This white paper analyzes the scalability of the
PowerEdge R720 server with an increasing Lync user workload in a Hyper-V environment.
Advantages of Dell with Lync Server
The Dell PowerEdge R720 server features the latest Intel processors, highly scalable memory, and I/O
optimizations that create a compelling building block for the Microsoft Lync Server 2010.
First, the R720 uses the new Intel Xeon E5-2600 processor product family. The processor’s Intel
Integrated I/O provides up to 80 PCIe lanes per server, and supports the PCIe 3.0 specification. In
addition, a key feature included with the Intel Integrated I/O technology is the Intel Data Direct I/O
(DDIO). Intel DDIO allows I/O traffic to skip the main memory and be directed straight to the processor
cache. This redirection results in reduced latency and power consumption and increased bandwidth.
Furthermore, the R720 has highly expandable memory: 24 memory slots with up to 32GB per DIMM,
coming to a total memory capacity of 768 GB. The R720’s flexible I/O capabilities allow it to handle
the heavy I/O demands as well.
Lync supports audio/video, web conferencing, instant messaging, VoIP, and other client features.
These workloads can be computationally intensive, with audio/video traffic, web conferencing, instant
messaging, VoIP, and other client traffic moving simultaneously in an organization. The R720 flexible
I/O capabilities allow it to handle the I/O demands of the Lync Server 2010. In fact, its reduced
latency, improved bandwidth and reduced power consumption are critical for ensuring the quality of
service (QoS) when a Lync deployment is scaled out. If space utilization is important, then the
PowerEdge R620 can be considered and it will handle the stress of the Lync deployment just as well.
Shown below is the PowerEdge R720.
A Sizing Study of Lync® Server 2010 and its Back End SQL Database on Dell™ PowerEdge™ Servers
7
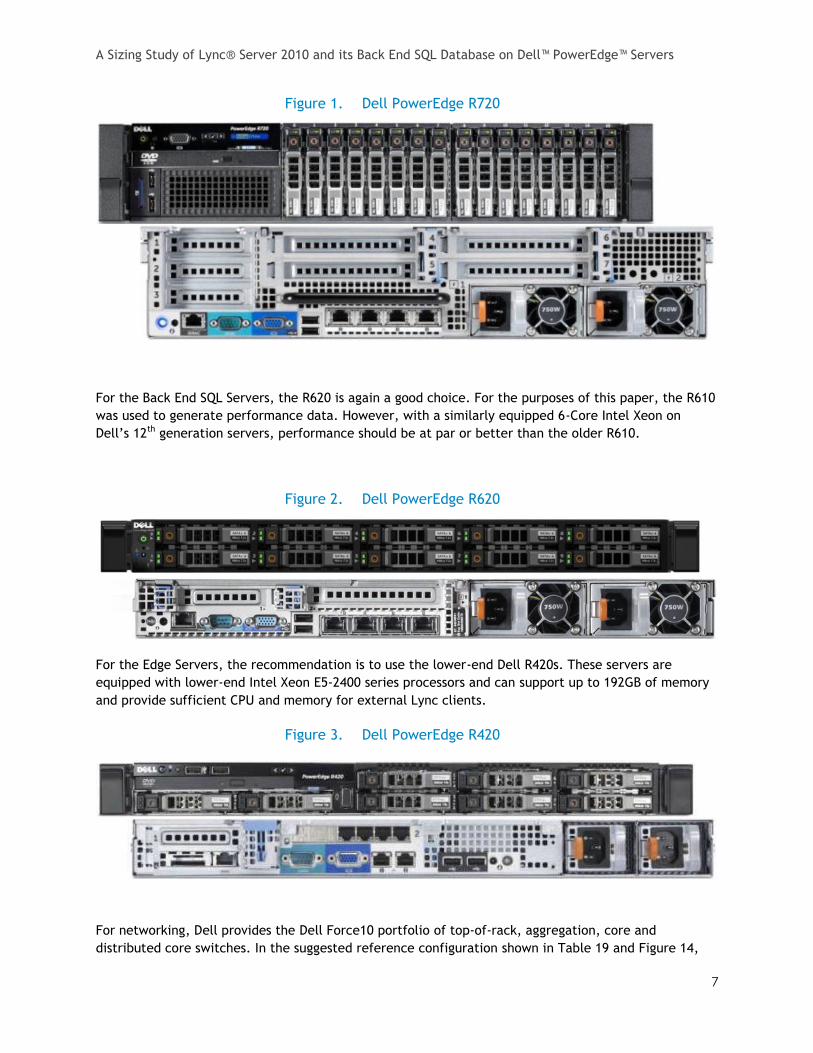
Dell PowerEdge R720 Figure 1.
For the Back End SQL Servers, the R620 is again a good choice. For the purposes of this paper, the R610
was used to generate performance data. However, with a similarly equipped 6-Core Intel Xeon on
Dell’s 12th generation servers, performance should be at par or better than the older R610.
Dell PowerEdge R620 Figure 2.
For the Edge Servers, the recommendation is to use the lower-end Dell R420s. These servers are
equipped with lower-end Intel Xeon E5-2400 series processors and can support up to 192GB of memory
and provide sufficient CPU and memory for external Lync clients.
Dell PowerEdge R420 Figure 3.
For networking, Dell provides the Dell Force10 portfolio of top-of-rack, aggregation, core and
distributed core switches. In the suggested reference configuration shown in Table 19 and Figure 14,
A Sizing Study of Lync® Server 2010 and its Back End SQL Database on Dell™ PowerEdge™ Servers
8
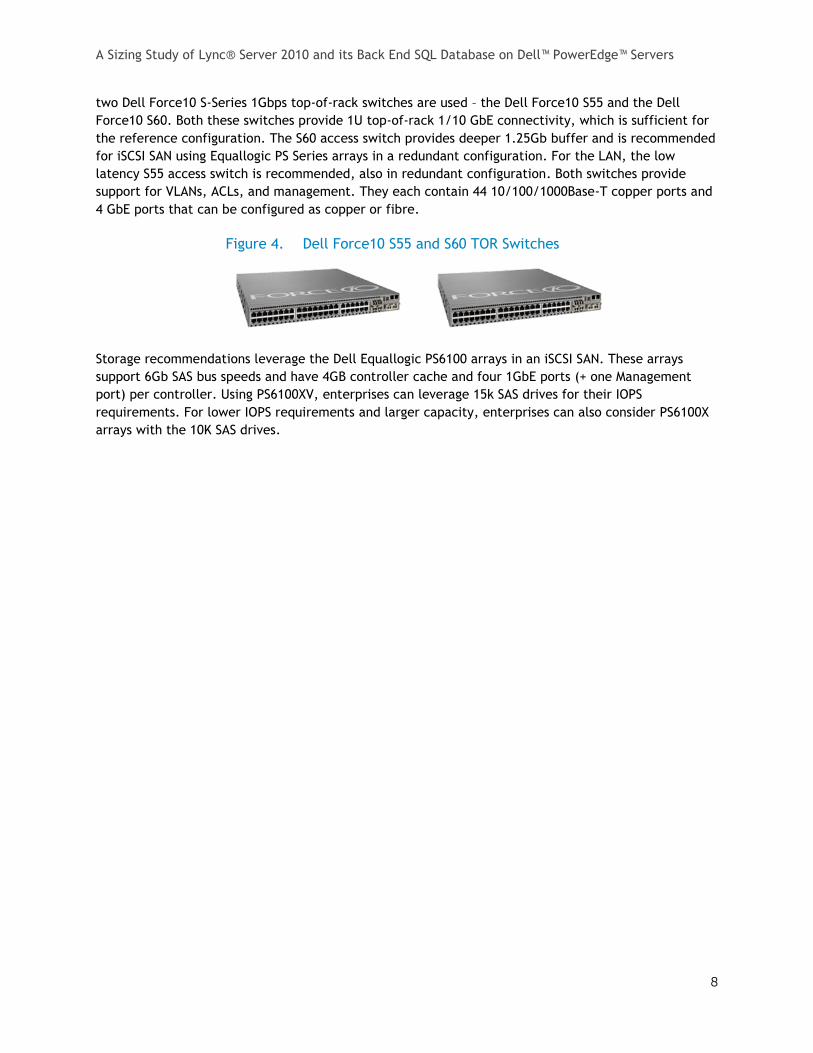
two Dell Force10 S-Series 1Gbps top-of-rack switches are used – the Dell Force10 S55 and the Dell
Force10 S60. Both these switches provide 1U top-of-rack 1/10 GbE connectivity, which is sufficient for
the reference configuration. The S60 access switch provides deeper 1.25Gb buffer and is recommended
for iSCSI SAN using Equallogic PS Series arrays in a redundant configuration. For the LAN, the low
latency S55 access switch is recommended, also in redundant configuration. Both switches provide
support for VLANs, ACLs, and management. They each contain 44 10/100/1000Base-T copper ports and
4 GbE ports that can be configured as copper or fibre.
Dell Force10 S55 and S60 TOR Switches Figure 4.
Storage recommendations leverage the Dell Equallogic PS6100 arrays in an iSCSI SAN. These arrays
support 6Gb SAS bus speeds and have 4GB controller cache and four 1GbE ports (+ one Management
port) per controller. Using PS6100XV, enterprises can leverage 15k SAS drives for their IOPS
requirements. For lower IOPS requirements and larger capacity, enterprises can also consider PS6100X
arrays with the 10K SAS drives.

A Sizing Study of Lync® Server 2010 and its Back End SQL Database on Dell™ PowerEdge™ Servers
9
Overview of Lync Server
Microsoft Lync Server 2010 Enterprise Edition is a communications server solution that supports
enterprise-level collaboration requirements. The Enterprise edition was selected for this study because
it provides improved scalability and high availability. This scalable solution also includes a rich
infrastructure that supports four different features for an integrated and unified user experience.
These features are instant messaging (IM), application sharing, audio/video and web conferencing, and
Enterprise Voice (VoIP).
In the Enterprise Edition of Lync Server, services that are installed together are consolidated. As a
result, the number of server roles—a defined set of Lync Server 2010 functionality provided by a
server—is reduced, resulting in reduced complexity during installation. Before Lync Server can be
deployed, back end services such as Active Directory®, DNS and Microsoft SQL Server® must be
functional. During deployment, a front end pool is created that consists of a set of front end servers—
set of physical servers or set of virtual servers— that provide front end services. These services include
Session Initiation Protocol (SIP) Registrar, SIP proxy, conferencing and other server services such as A/V
conferencing, Web conferencing, instant messaging, application sharing, response group, bandwidth
policy, call park, conferencing announcement and audio test service.
One advantage of a front end pool is the load balancing it performs on the front end servers; with load
balancing, the number of client connections is evenly distributed across these servers. In the reference
architecture described in this document, DNS load balancing is used for all the services and
applications except Web traffic. For Web communication, a hardware load balancer is used instead. A
load balancer is essential for high availability because it can redirect failed client connections, and also
to ensure that each front end server in the front end pool is not overloaded.
The following subsections describe some of the Lync key features including the Topology Builder,
Central Management Store, Lync Control Panel, and Lync Server Management Shell and the Lync Server
roles. The back end services are also further described.
Topology Builder
The Lync Topology Builder manages the deployed Lync Server environment topology configuration. It
can add components and roles to a temporary configuration file that is then published by saving the
changes in a central database on the Central Management Store (CMS); the store is described in the
next section. The server roles are installed by running the Lync Remote Setup Wizard on each server
defined in the topology. The functionality of this wizard is not covered in this overview.

A Sizing Study of Lync® Server 2010 and its Back End SQL Database on Dell™ PowerEdge™ Servers
10
Lync Server Topology BuilderFigure 5.
Central Management Store and Active Directory
Lync uses a new Central Management Store (CMS) that stores server and service configuration data.
Individual user information, such as the user policy, the user’s SIP URI, and the user’s phone number,
are stored in the CMS database. The CMS also provides data to the Lync Server Management Shell and
file sharing. For backward compatibility with the deprecated Microsoft Office Communications Server
2007, Active Directory Domain Services (AD DS) contains only basic user information.
Lync Server Management Shell and Lync Control Panel
The Lync Server Management Shell contains 550 additional cmdlets to manage all aspects of a Lync
Server deployment using PowerShell. In addition to this management shell, a graphical user interface
(GUI) the Lync Control Panel, uses the Lync Server Management cmdlets as the underlying mechanism
to perform management tasks, including the management of users in an organization. Figure 6 shows
the Lync Server Control Panel. As seen in the figure along the left sidebar, it provides an interface for
the management of Users, Topology, IM and Presence, Voice Routing, Voice Features, Response Groups,
Conferencing, Clients, External Users, Monitoring and Archiving, Security, and Network Configuration.
The Lync Control Panel replaces the Microsoft Management Console (MMC) snap-ins, the administrative
interfaces of the older Microsoft Office Communications Server.

A Sizing Study of Lync® Server 2010 and its Back End SQL Database on Dell™ PowerEdge™ Servers
11
Lync Server Control PanelFigure 6.
Lync Server Roles
To test the scalability of Lync in a virtual environment, the Front End, A/V Conferencing, Mediation,
Monitoring, and Back End server roles were installed. The Front End, A/V, and Mediation Server roles
were collocated in the lab deployment and these roles are described in the sections below.
Front End Server
The Front End Server role provides basic services for users. In the Enterprise Edition, a Front End Pool
uses a group of servers that are configured identically and provide a similar set of resources; physical
and virtual servers may not be mixed in a Front End Pool. The Front End Pool uses the Front End
Servers in the pool to provide scalability and failover capabilities. Lync Server supports one or more
Front End pools in a deployment, but only one pool can run the CMS.
The reference configuration, shown in Figure 14, uses a single Front End pool with four Front End
Server Virtual Machines (VMs). More details about the deployment of Lync can be found in the
PowerEdge System Configuration and Reference Configuration sections.
A/V Conferencing Role (Collocated with Front End)
Web conferencing enables users to view, share, and collaborate on documents, and to share their
applications and desktops with each other. A/V conferencing enables users to communicate online with
real-time audio. Either A/V and Web conferencing, or just Web conferencing, can be enabled when
deploying conferencing. The Reference Configuration contains a recommendation that the A/V
Conferencing role is collocated with the Front End Server role. The Lync Stress and Performance Tool
does not presently offer the capability to test video conferencing and our sizing was limited to audio
conferencing capability.
Some best practices call out the A/V conferencing role separately from the Front-End for
configurations over 10,000 users. For the purpose of this study, and in order to analyze the scalability
of Lync Server from 3,000 up to 12,000 users, the A/V Conferencing role was collocated with the Front-
End.

A Sizing Study of Lync® Server 2010 and its Back End SQL Database on Dell™ PowerEdge™ Servers
12
Mediation Server (collocated with Front End)
This server role bridges Public Switched Telephone Network (PSTN) traffic to and from the media
gateway to the Lync server network. It supports the routing of outbound calls to multiple media
gateways, instead of a single media gateway as was the case in Office Communications Server. It also
enables Media bypass that allows Lync clients and phones to directly route media traffic, excluding SIP
traffic, to the media gateway without routing to the Meditation server. This role includes the Lync
Server Meditation service and the Lync Server Replica Replicator Agent. This study recommends that
the Mediation Server role be collocated with the Front End Server role in a similar manner as the Web
and A/V Conferencing roles. The outbound calls to the PSTN were partially successful using the Stress
and Performance Tool. Therefore, our final reference architecture is sized to accommodate the
additional load that these calls could place.
Edge Servers
The Lync Edge Server enables remote access to the internal Lync infrastructure. The Edge Server allows
these users to send and receive instant messages, perform Web & A/V conferencing, and share desktop
or presentations. In addition, Edge Server provides public IM connectivity to Windows Live, AOL and
Yahoo! Messenger users and federation to users in partner organizations.
Edge Server has three sub roles—Access Edge, Web Conferencing and Audio/Video Edge. Deploying each
role is not mandatory and depends on each organizational requirement. By deploying all three sub
roles, users can avail of the complete set of Lync features inside or outside the network. The Access
Edge service provides a single access point for SIP traffic from outside the organization. The Web
Conferencing Edge service allows external user access to meetings. Finally, the A/V Edge service
enables A/V conferencing and application sharing capabilities for external users. Note that a reverse
proxy is required to publish the Web components services that do not run through an Edge Server.
Lync Edge Servers are designed to be deployed in Perimeter or DMZ Network and run limited set of
services so that security is not compromised. Unlike many of the internal roles, the Edge Server does
not require database or file shares because it does not store data other than the Local Configuration
Store replica from the Central Management Store.
The Edge Server role requires a reasonably high performance, efficient and scalable server. Dell’s
PowerEdge R420 provides all the requirements and has greater operational efficiency, strong
performance & flexibility. R420 comes with two 4, 6, or 8 core Intel Xeons, up to 192GB of memory.
SQL Servers
The SQL Servers include an Archiving Server role co-located with the Monitoring Server and a Back-End
Server. The SQL Servers can use shared storage with multiple volumes to store their databases.
Back End Server
The Back End Server provides database services for the Front End pool. For smaller deployments with
no high availability requirements, a single database server is sufficient. In cases where failover is
desired, additional servers may be deployed to create a SQL Server cluster. It is recommended, as
suggested in the Reference Configuration, to have multiple Back End Servers in a cluster.
Archiving Server
This server role can archive IM and meeting content for compliance purposes. This role was collocated
with the Monitoring Server.
A Sizing Study of Lync® Server 2010 and its Back End SQL Database on Dell™ PowerEdge™ Servers
13
Monitoring Server
A monitoring server role can be deployed to collect statistical usage metrics for IM, conferencing, and
Enterprise voice by tracking call detail records. It uses a back-end SQL database to store usage metrics
through the SQL reporting services. For high performance, asynchronous messaging with Lync Server,
the monitoring server depends on the Microsoft Windows® Message Queuing feature that guarantees
message delivery, efficient routing, security and priority-based messaging. This feature must be
installed on the monitoring server and Front End servers. Microsoft’s best practices for Lync Server
recommend that the Monitoring role be deployed on a separate server.
Test Methodology
In order to determine the scalability of supporting multiple Lync Server VMs on a single R720, a two-
step approach was taken. First, the maximum number of users (using the Heavy profile in the Microsoft
Stress and Performance Tool1) per VM was determined; it was found to be 3,000 users. Following these
tests, additional VMs were added with identical host configurations until the solution could no longer
scale due to the CPU, memory and other performance indicator thresholds. Note that for the study, a
PowerEdge R720 was used and can be substituted by PowerEdge R620 with equivalent CPU and
memory.
For the Back End SQL database, users were logged in at 100, 200 and 400 users/min. These login rates
will typically correspond to the peak user login rate into Lync. For example, in a 6000 user deployment,
if all users were to login within a period of 1 hour, the login rate would be 100 users/min. However, for
a 12,000 user deployment assuming all users login over the same time period, a reasonable login rate
would be 200 users/min. Similarly, a login rate of 400 users/min can be applied to a 25,000 user
deployment. These three scenarios assume that users are located in the same geographic location. If
users were to be dispersed geographically, then the login rates for each location should be calculated
separately and the maximum value should be used for sizing. For example, if 12,000 users were located
in the Americas and 6000 in Asia, then the login rate of Americas would dictate the maximum load on
SQL Back End servers and storage.
For a new Lync deployment, it is recommended that the login rates first be studied using performance
counters in the present OCS or OCS R2 infrastructure and recommendations be made accordingly. The
counter that can be used to study login rates is:
<Lync Server>\LS: SIP – 01 – Peers\SIP – 000 – Connections Active
Record this counter from the beginning of a peak login period (ex. 7 am) to the end of the login period
(ex. 9 am) and note the difference. This will provide an estimation of the login rate over the interval,
which can then be used to compute the login rate. For example:
Connections active at 7 am: 100
Connections active at 9 am: 6500
1 Microsoft Lync Server 2010 Stress and Performance Tool: http://www.microsoft.com/en-us/download/details.aspx?id=25005
A Sizing Study of Lync® Server 2010 and its Back End SQL Database on Dell™ PowerEdge™ Servers
14
Connections from 7 am – 9 am: 6400
Login Rate = 6400 / (2 * 60) = ~50 users/min
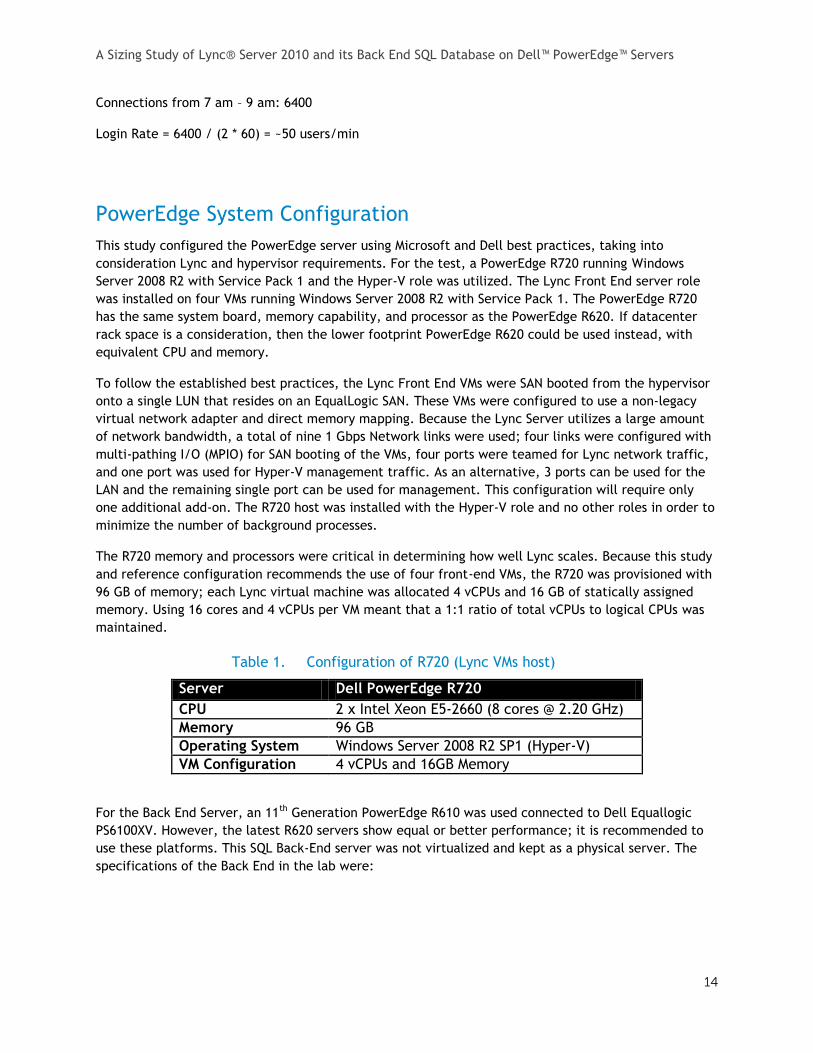
PowerEdge System Configuration
This study configured the PowerEdge server using Microsoft and Dell best practices, taking into
consideration Lync and hypervisor requirements. For the test, a PowerEdge R720 running Windows
Server 2008 R2 with Service Pack 1 and the Hyper-V role was utilized. The Lync Front End server role
was installed on four VMs running Windows Server 2008 R2 with Service Pack 1. The PowerEdge R720
has the same system board, memory capability, and processor as the PowerEdge R620. If datacenter
rack space is a consideration, then the lower footprint PowerEdge R620 could be used instead, with
equivalent CPU and memory.
To follow the established best practices, the Lync Front End VMs were SAN booted from the hypervisor
onto a single LUN that resides on an EqualLogic SAN. These VMs were configured to use a non-legacy
virtual network adapter and direct memory mapping. Because the Lync Server utilizes a large amount
of network bandwidth, a total of nine 1 Gbps Network links were used; four links were configured with
multi-pathing I/O (MPIO) for SAN booting of the VMs, four ports were teamed for Lync network traffic,
and one port was used for Hyper-V management traffic. As an alternative, 3 ports can be used for the
LAN and the remaining single port can be used for management. This configuration will require only
one additional add-on. The R720 host was installed with the Hyper-V role and no other roles in order to
minimize the number of background processes.
The R720 memory and processors were critical in determining how well Lync scales. Because this study
and reference configuration recommends the use of four front-end VMs, the R720 was provisioned with
96 GB of memory; each Lync virtual machine was allocated 4 vCPUs and 16 GB of statically assigned
memory. Using 16 cores and 4 vCPUs per VM meant that a 1:1 ratio of total vCPUs to logical CPUs was
maintained.
Configuration of R720 (Lync VMs host) Table 1.
Server Dell PowerEdge R720
CPU 2 x Intel Xeon E5-2660 (8 cores @ 2.20 GHz)
Memory 96 GB
Operating System Windows Server 2008 R2 SP1 (Hyper-V)
VM Configuration 4 vCPUs and 16GB Memory
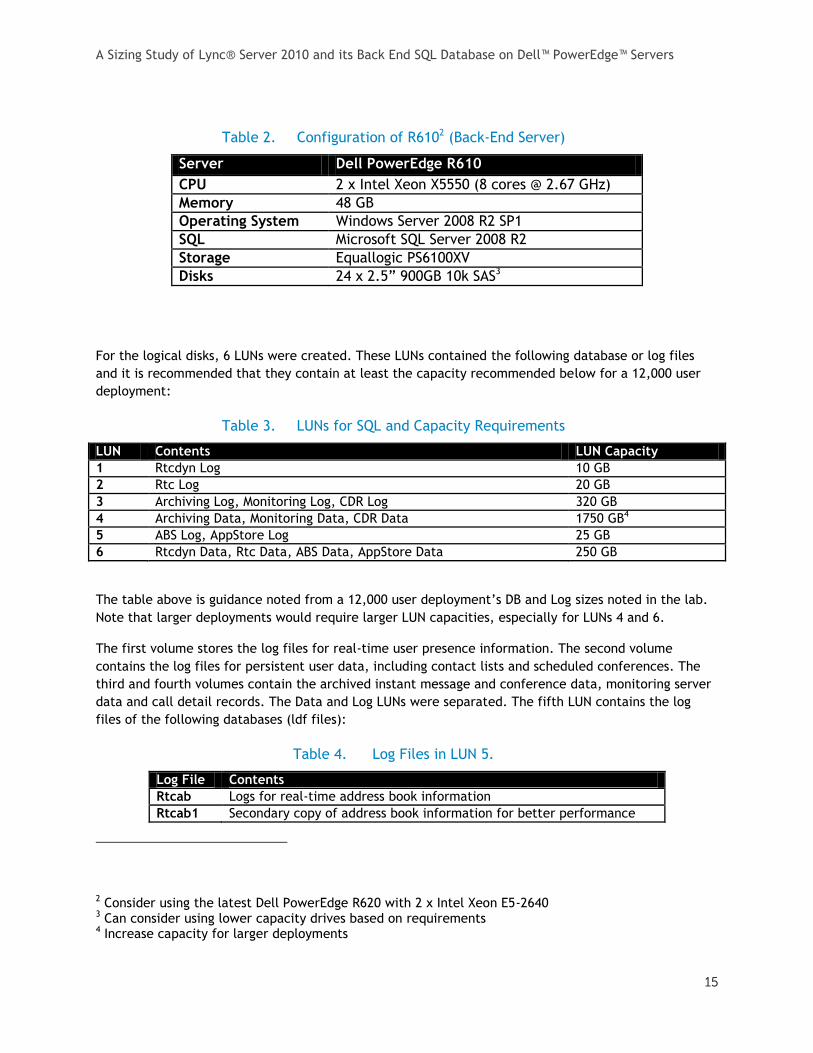
For the Back End Server, an 11th Generation PowerEdge R610 was used connected to Dell Equallogic
PS6100XV. However, the latest R620 servers show equal or better performance; it is recommended to
use these platforms. This SQL Back-End server was not virtualized and kept as a physical server. The
specifications of the Back End in the lab were:
A Sizing Study of Lync® Server 2010 and its Back End SQL Database on Dell™ PowerEdge™ Servers
15
Configuration of R6102 (Back-End Server) Table 2.
Server Dell PowerEdge R610
CPU 2 x Intel Xeon X5550 (8 cores @ 2.67 GHz)
Memory 48 GB
Operating System Windows Server 2008 R2 SP1
SQL Microsoft SQL Server 2008 R2
Storage Equallogic PS6100XV
Disks 24 x 2.5‖ 900GB 10k SAS3
For the logical disks, 6 LUNs were created. These LUNs contained the following database or log files
and it is recommended that they contain at least the capacity recommended below for a 12,000 user
deployment:
LUNs for SQL and Capacity Requirements Table 3.
LUN Contents LUN Capacity
1 Rtcdyn Log 10 GB
2 Rtc Log 20 GB
3 Archiving Log, Monitoring Log, CDR Log 320 GB
4 Archiving Data, Monitoring Data, CDR Data 1750 GB4
5 ABS Log, AppStore Log 25 GB
6 Rtcdyn Data, Rtc Data, ABS Data, AppStore Data 250 GB
The table above is guidance noted from a 12,000 user deployment’s DB and Log sizes noted in the lab.
Note that larger deployments would require larger LUN capacities, especially for LUNs 4 and 6.
The first volume stores the log files for real-time user presence information. The second volume
contains the log files for persistent user data, including contact lists and scheduled conferences. The
third and fourth volumes contain the archived instant message and conference data, monitoring server
data and call detail records. The Data and Log LUNs were separated. The fifth LUN contains the log
files of the following databases (ldf files):
Log Files in LUN 5. Table 4.
Log File Contents
Rtcab Logs for real-time address book information
Rtcab1 Secondary copy of address book information for better performance
2 Consider using the latest Dell PowerEdge R620 with 2 x Intel Xeon E5-2640 3 Can consider using lower capacity drives based on requirements 4 Increase capacity for larger deployments

A Sizing Study of Lync® Server 2010 and its Back End SQL Database on Dell™ PowerEdge™ Servers
16
Cpsdyn Logs for Call Park Service
Rgsconfig Logs for Response Group Service (configuration Information)
Rgsdyn Logs for Response Group Service (runtime operations)
The final volume contains all the data files for those logs placed in LUNs 1,2,4, and 5. The contents of
this LUN are:
Rtcdyn.mdf
Rtc.mdf
Rtcab.mdf
Rtcab1.mdf
Cpsdyn.mdf
Rgsconfig.mdf
Rgsdyn.mdf
In summary, the LUNs required are shown in the figure below. Note that LUNs 3 and 4 are not required
if Archiving and Monitoring server roles are not deployed.
LUN Layout for Lync Server Figure 7.

A Sizing Study of Lync® Server 2010 and its Back End SQL Database on Dell™ PowerEdge™ Servers
17
As shown above, volumes 1, 2, 5, and 6 should be made accessible from the SQL Back End. Volumes 3
and 4 should be accessible from the Archiving/Monitoring Server. The SQL servers will have dedicated
NICs connected to the iSCSI SAN, which is also attached to the Dell Equallogic storage array.
Tools Used for Testing and Validation
There were two main tools used for testing and validation: the Lync Stress and Performance Tool and
the Windows Performance Monitor counters. The Lync Stress and Performance tool is written by
Microsoft to generate a realistic load on a Lync system. The Windows Performance Counters provide
fine-grained data for the Front End Server VMs and the Hyper-V host. Quality of Experience (QoE)
reports from the Lync Monitoring role allow administrators to monitor good end-user call quality.
Finally, performance counters from the load generation machines that run the Lync Stress and
Performance tool validate that these machines are is running correctly; these tools are explored in
depth in the following sections.
Stress and Performance Tool
The primary tool used for sizing the Lync Server is the Lync Server Stress and Performance Tool from
Microsoft. This tool can simulate the following end user features:
Instant messaging: two-party communication between Lync clients using instant messages.
Presence: updates to the user status (Available, Busy, Away, etc.)
Audio, Application Sharing, and IM conferencing: conversations involving multiple parties using
audio, instant messaging, and application sharing tools like Microsoft PowerPoint® or Excel®.
VoIP calls using a PSTN simulator: VoIP calls can be made to and from the PSTN. For example, a
call from a cell phone to a Lync user within the enterprise would be handled as an incoming
PSTN call. Due to limitations in the capability of the tool, the outbound calls to the PSTN
simulator were partially successful.
Address book retrieval: one of the servers running the Lync Server in your deployment runs the
ABS service. Lync clients download address books from the ABS to complete user look ups.
Distribution List Expansion (DLX): Lync uses DLX to retrieve distribution list memberships that
would consist of other Lync users.
It is important to note that the Stress and Performance Tool does not currently support video and Web
conferencing and the VoIP functionality was only partially functional. Therefore, our final reference
architecture is conservative on the number of users that can be supported on Lync VMs. The Stress and
Performance Tool was set up on multiple servers to generate the load on the Lync Server(s). The
machines used for load generation were configured as follows:
Configuration of Performance Tool Load Generators Table 5.
Server Dell PowerEdge R710
CPU 2 x Intel Xeon X5670 (4 cores @ 2.93 GHz)
Memory 72 GB
Operating System Windows Server 2008 R2
The tests conducted on the R720 host that contained the Lync VMs were configured at the maximum
load possible from the Stress and Performance Tool; the ―Heavy‖ setting among 4 choices: ―Heavy‖,
―Medium‖, ―Low‖, or ―None.‖

A Sizing Study of Lync® Server 2010 and its Back End SQL Database on Dell™ PowerEdge™ Servers
18
Performance Counters from Front End Server VMs and Hyper-V Host
To collect more fine-grained data, performance counters were captured while running the Stress and
Performance tool; these counters were collected on the Front-End and Host Hyper-V servers. Some of
the important performance counters and thresholds used for the analysis are below.
Host and Hyper-V Counters Table 6.
Front End Servers (Hyper-V Virtual Machines)
Performance Counter Threshold
SIP Connections Active >3000
Available Memory >15%
Memory – Pages/sec <2500
Memory – Page Life Expectancy >3600
AVMCU – Number of Conferences Evenly Distributed across FEs
ASMCU – Number of Conferences Evenly Distributed across FEs
DataMCU – Number of Conferences Evenly Distributed across FEs
IMMCU – Number of Conferences Evenly Distributed across FEs
DBStore – Queue Latency <100ms
DBStore – SPROC Latency <100ms
MCU Health State – AS 0 (Normal)
MCU Health State – AV 0
MCU Health State – Data 0
MCU Health State – IM 0
Average Holding Time for Incoming Messages
<10
Local 503 Responses/sec ~0
Local 504 Responses/sec ~0
Host Server (Windows Server 2008 R2 SP1 on PowerEdge R720)
Performance Counter Threshold
Network Utilization <40%
Network – Output Queue Length 0
Available Memory >15%
Processor Utilization (Logical Processor)
<60%
Processor Utilization (Hypervisor Root Virtual Processor)
<60%
Processor Utilization (Hypervisor Virtual Processor)
<60%
Disk sec/read <15ms
Disk sec/write <15ms
A Sizing Study of Lync® Server 2010 and its Back End SQL Database on Dell™ PowerEdge™ Servers
19
Initially, the tests were executed on a single Hyper-V virtual machine to establish the number of users
that can be supported while maintaining performance thresholds. It was found that the Front End VMs
running on the R720 could support 3000 users using the heavy profile for all the supported end-user
features in the Stress and Performance tool. During the process, SIP connections to each Front End
server were monitored to ensure that no connections were dropped as a result of bottlenecks in the
server, storage, or networking. In addition, the metrics presented in Table 6 were all measured, and
they verified that the system was within performance thresholds. These performance metrics are
discussed below.
A value of 15% of available memory was used to identify issues related to a lack of memory. For
memory pages, if a page has to be retrieved from the disk instead of from the memory, there is a
negative impact to performance; the rate at which pages in memory are swapped with those in the disk
needs to be below a 2500 pages per second. If the rate is above this number, it indicates a lack of
memory available to service requests quickly and will result in a substantial system slow-down. The
page life expectancy can also indicate memory pressure, and anything below the threshold value of
3600 indicates insufficient memory.
To ensure that the tool was working and generating an acceptable load that is balanced across the
entire Front End Pool, the number of conferences was recorded for Audio, Instant Messaging,
Application Sharing, and Data Collaboration. To verify that none of the Front End Servers became
overloaded during the tests, this counter was used in addition to the number of SIP connections.
The DBStore queue and sproc latency counters are essential for measuring bottlenecks within the Back
End database; the queue counter represents the time taken by the backend database’s queue for a
particular request. The sproc counter represents the time taken for the backend database to actually
process the request.
The MCU health counters give an indication of the overall system health; these should be 0 at all times,
indicating normal operation. The average holding time for client transactions should be less than 3
seconds to allow up to 20 transactions per client; the 503 and 504 response counters should be close to
zero. The 503 responses are more important because these counters indicate that the server is
unavailable for client transactions, and 504 responses are more common and can be caused by an
abrupt client logoff.
The primary indicators of the R720’s performance are the processor, network, and memory utilization.
Processor utilization can be impacted if measured from the Front-End VMs, because the CPU cycles are
sliced for each VM, introducing latencies in the counters; for this reason the Hyper-V host’s CPU
utilization is used because it is not impacted. The Logical Processor counters give the total CPU usage
running on all available machine cores. The hypervisor root virtual processor counters measure the CPU
utilization for the Hyper-V host OS, and the hypervisor virtual processor counters measure the CPU
utilization for the VMs. These counters suffer a slight amount of clock impact, and can exceed 100%.
For networking, we made certain that there was sufficient bandwidth across the teamed NIC and no
queues were impacted due to network congestion. Memory utilization was monitored to ensure that
there were no I/O bottlenecks.
Quality of Experience Reports
Quality of Experience (QoE) is an important parameter for any real-time communication, and the Lync
Server provides a Monitoring Server role that can analyze the QoE metrics of calls taking place over a

A Sizing Study of Lync® Server 2010 and its Back End SQL Database on Dell™ PowerEdge™ Servers
20
fixed time period. For this study, a time period of 8 hours was selected for analysis, and the QoE
indicators measured are in the following table.
Monitoring Server QoE Statistics and Thresholds Table 7.
QoE Metric Threshold
Jitter < 20ms
Packet Loss < 0.1%
MOS < 0.5
Round Trip Time < 200ms
Across TCP/IP networks, packets can arrive from one Lync client to another at irregular intervals,
causing jitter, and packets can also be lost in the network leading to poor call quality. The MOS metric
measures the degradation of VoIP calls in the Lync system using computer algorithms. The round-trip
time is the time it takes for a packet to travel from one client to another in addition to the receiver’s
acknowledgement to the transmitter; high round-trip times indicate choppy voice quality.
Performance Counters from Back End Server
As mentioned previously, a physical machine was used in this deployment for the SQL Back End on a
PowerEdge R610. The counters that were measured on this server are in the table below, along with
their thresholds.
Performance Counters and Thresholds for SQL Table 8.
Performance Counter Threshold
Processor Utilization (%) < 60%
Available Memory (%) > 15%
Memory – Pages/sec < 2500
Memory – Page Faults/sec < 1000
Memory – Page Life Expectancy > 3600
Logical Disks – reads/sec NA
Logical Disks – writes/sec NA
Logical Disks – transfers/sec NA
Logical Disks – sec/read < 20ms
Logical Disks – sec/write < 20ms
Logical Disks – sec/transfer < 20ms
Logical Disks – Avg disk queue length < 245
MSSQL – Buffer Manager – cache hit ratio > 90%
The primary counters of interest in the Back-End SQL deployment are CPU, memory, disk, and MSSQL
buffer counters. The CPU utilization threshold was set at 60%, consistent with the threshold for the
Lync Front-Ends. To ensure that there was not significant memory pressure, the available memory
threshold was set at 15% or approximately 5GB of free memory. The pages/sec counter indicates the
5 This is the value for the entire array. Number of disks (22) + 2.

A Sizing Study of Lync® Server 2010 and its Back End SQL Database on Dell™ PowerEdge™ Servers
21
instances when the SQL Server has to fetch a page from disk after it was not found in its memory. The
page faults/sec counter measures the soft page faults in addition to the hard page faults. These soft
page faults happen when pages are found at other locations within main memory and these are not as
expensive as retrieving pages from disk. Finally, the page life expectancy of less than 3600 (or 1 hour)
indicates that the server has run out of memory with progressively lower values indicating more critical
memory issues. Hence, it is desirable to have values greater than 3600 for these counters.
For Logical Disks, the reads/sec, writes/sec and transfers/sec counters have to be looked at taking in
to consideration their corresponding latencies. A latency value higher than 10ms is acceptable but
latencies greater than 20ms indicate an IO bottleneck. In the lab deployment, these logical disk
counters were measured for the Back End SQL databases and logs contained in LUNs 1, 2, 5, and 6,
each containing database or log files as explained in Table 3. The disk queue length is recommended to
be below 24 as suggested by Microsoft.
The MSSQL Buffer Manager counter for cache hits indicates the number of page reads or writes issued
to physical storage, and because this is expensive, it is recommended to be well above 90%. This will
ensure that the server does not have to issue requests for pages from disks and can instead use its
memory contents.
Load Generation Performance Counters
In addition to the counters from the Lync VMs and their host machine, counters from the load
generators were also collected to verify that the load generation system did not introduce latencies.
The major performance counters are in the Load Generation Counters Table below.
Load Generation Counters Table 9.
Performance Counter Threshold
CPU Utilization <60%
Available Memory >15%
Network utilization <50%
On the client machines, the CPU, memory, and network utilization were set below the acceptable
limits of the Hyper-V Host, so that the desired load can be generated for the Lync Servers. Ensuring the
CPU and available memory counters are within these thresholds eliminates the possibility of a
bottleneck at the load generator machines. To verify that the Lync system was healthy, the following
client counters were also recorded:
Total Active Endpoints
Presence Pass Rate Percentage
Total IM Calls Active
Total Number of IM Conferences Active
Total Number of AV Conferences Active
Total Number of AS Conferences Active

A Sizing Study of Lync® Server 2010 and its Back End SQL Database on Dell™ PowerEdge™ Servers
22
Total Number of Data Conferences Active
Distribution List Calls per second
CAA Calls in progress
Results and Analysis
Three test scenarios were run, and the results were collected from the Front-End VMs, Host, Monitoring
Server Reports and the Stress and Performance Tool counters. The three major scenarios in the testing
included:
Test Scenarios Table 10.
Scenario Number of VMs
Total Number of Users
Users per VM
Hostnames of running VMs
Scenario A 1 3000 3000 FrontA
Scenario AB 2 6000 3000 FrontA, FrontB
Scenario ABCD6 4 12000 3000 FrontA, FrontB, FrontC, FrontD
In Scenario A, one front end VM – named FrontA – was running with a total of 3000 heavy users. In
Scenario AB, FrontA from Test A was running with a 3000 users, and an additional VM named FrontB
was added that supported an additional 3000 users, resulting in a total of 6000 heavy users. In Scenario
ABCD, two more virtual machines were added, each supporting 3000 additional users for a total of
12,000 heavy users. This scenario involving 4 VMs was used in creating the reference configuration.
The Reference Configuration uses four Front End servers across two R720 Hyper-V hosts, and in the
worst case, support all four VMs on a single physical host (scenario ABCD). If one of the R720 Hyper-V
hosts goes offline, the two Front End servers running on it can be migrated to the other operation R720
Hyper-V host. In that instance, there would be a worst case of four Front End VMs running on a single
Hyper-V Host. The three test scenarios were conducted on a single R720 Hyper-V host, which due to its
identical system board, memory, and processor, will perform similarly to a R620. Scenario AB
represents normal operation in the Reference Configuration (Figure 14) and Scenario ABCD represents
the worst case scenario in the Reference Configuration. To study the scalability of the R720 platform
with increasing Lync Load, ―Scenario A‖ investigated the performance of a single VM.
To present our analysis of these results, first the Front End Server VMs performance is discussed,
followed by the results of the Hyper-V host’s performance. Third, the Lync QoE thresholds are verified
6 These scenarios assume 3000 users per VM. Per Microsoft guidance, the recommendation is 2500 users per VM (http://www.microsoft.com/en-us/download/details.aspx?id=22746). Our sizing tests indicate that though an extra 500 users can be accommodated on each VM, the Microsoft recommendation is representative of real-world Lync scenario with video, web conferencing and PSTN capability. Hence, the Reference Configuration is sized for 2500 users per VM or 10,000 total users.

A Sizing Study of Lync® Server 2010 and its Back End SQL Database on Dell™ PowerEdge™ Servers
23
to be within acceptable levels, the counters from the Stress and Performance Tool are also verified to
be within acceptable levels, and then the discussion of the SQL Server Back End performance
continues.
Results from the Front End Server VM(s) Counters
To show that the Front End Servers are performing correctly, the Lync load needs to be balanced across
all running Front End Servers and then the performance counters verified to be within acceptable
levels. To ensure that 3000 users were connected to each Front End VM, the user connections to the
Front-End servers were logged; the results from the counters indicate that at least 3000 users were
logged in, which can be seen in the Lync User Connections per VM chart below.
Lync User Connections per VM Figure 8.
The ―Four Lync VMs Running‖ bar shows a near even distribution of around 3000 users connected to
each Front End VM. The ―Two Lync VMs Running‖ bar also shows an even distribution. The ―One Lync
VM Running‖ bar verifies that there are approximately 3000 users. The number of user connections is
greater than 3000 because users connect and disconnect to different Front End Servers during the test;
the connection balance demonstrates that DNS Load Balancing worked effectively in distributing the
clients amongst the VMs.
In addition to client connections, conferences should be evenly distributed across the Front End VMs.
For 12,000 users, the total number of conferences and their distribution among the four front-ends are
shown below. There were a total of 329 audio conferences, 208 app-sharing conferences, 248 IM
conferences, and 163 data conferences all running concurrently.
3312
3380
3351
3299
3410 3408 3407
0 3000 6000 9000 12000 15000
One Lync VM Running
Two Lync VMs Running
Four Lync VMs Running
Connections
Front-End A Front-End B Front-End C Front-End D

A Sizing Study of Lync® Server 2010 and its Back End SQL Database on Dell™ PowerEdge™ Servers
24
Conference Distribution per Front-End for 12,000 users Figure 9.
As can be seen above, the distribution of conferences is evenly distributed between the four VMs. The
table below summarizes the results from the Front End VMs counters.
Lync Counter Thresholds for Front End VMs Table 11.
Performance Counter Threshold 1 VM 2 VMs 4 VMs
LS:SIP - 01 - Peers(_Total)\SIP - 000 - Connections Active >3000 3312 3339 3393
Available Memory >15% 61% 63% 62%
Memory\Pages/sec <150 0.16 1.24 0.36
Page Life Expectancy >3600 16830 17214 18538
SIP - Local 503 Responses/sec ~0 0 0 0.01
SIP - Local 504 Responses/sec ~0 0 0 0
SIP - Average Holding Time For Incoming Messages <10 0.27 0.11 0.46
DBStore - Queue Latency (msec) <100 1.26 1.42 18.75
DBStore - Sproc Latency (msec) <100 5.93 7.71 16.9
MCU Health State (AS, AV, Data, IM) 0 0 0 0
SIP - Average Holding Time For Incoming Messages <10 0.27 0.11 0.46
All of these numbers were taken from the eight hour tests, ignoring the initial period during which
clients log-in to the Front End(s). All metrics are within the necessary thresholds, showing that the
Lync Server deployment performed correctly.
Results from Host Counters
As mentioned previously, the processor counters are best measured from the Front End VMs host. These
measurements are shown in the chart below.
23.72% 24.58% 23.75% 25.75%
25.82% 25.10% 25.88% 23.77%
24.73% 24.91% 24.55% 25.20%
25.73% 25.42% 25.82% 25.28%
0.00%
10.00%
20.00%
30.00%
40.00%
50.00%
60.00%
70.00%
80.00%
90.00%
100.00%
Audio Conferences(Total: 329)
App SharingConferences (Total:
208)
IM Conferences(Total: 248)
Data Conferences(Total: 163)
Front End A Front End B Front End C Front End D

A Sizing Study of Lync® Server 2010 and its Back End SQL Database on Dell™ PowerEdge™ Servers
25
Processor Utilization and Scaling as Lync Users Increase Figure 10.
In the chart above, there is a linear scaling of CPU usage when the user load is increased from 3000
users on one VM to 6000 users on two VMs, and then to 12,000 users on four VMs. At 12,000 users, the
observed CPU usage over the eight hour test period was 56%. The chart below shows the available
memory when the load is increased.
Memory Availability and Scaling as Lync Users Increase Figure 11.
0%
10%
20%
30%
40%
50%
60%
70%
1 2 3 4
Pro
ce
sso
r U
tili
za
tio
n
Number of VMs
VM Processes
Hypervisor Processes
Total Processes
Threshold
0%
10%
20%
30%
40%
50%
60%
70%
80%
90%
1 2 3 4
Number of Lync Front End VMs
R720 Memory Available
Memory Available % Threshold
A Sizing Study of Lync® Server 2010 and its Back End SQL Database on Dell™ PowerEdge™ Servers
26
Again, the available memory shows a linear relationship to the number of users supported by the VM’s.
As the number of users ( & VM’s) increases on same HyperV host, the available memory decreases;
however, the decrease is not close to the prior set threshold of 15%.
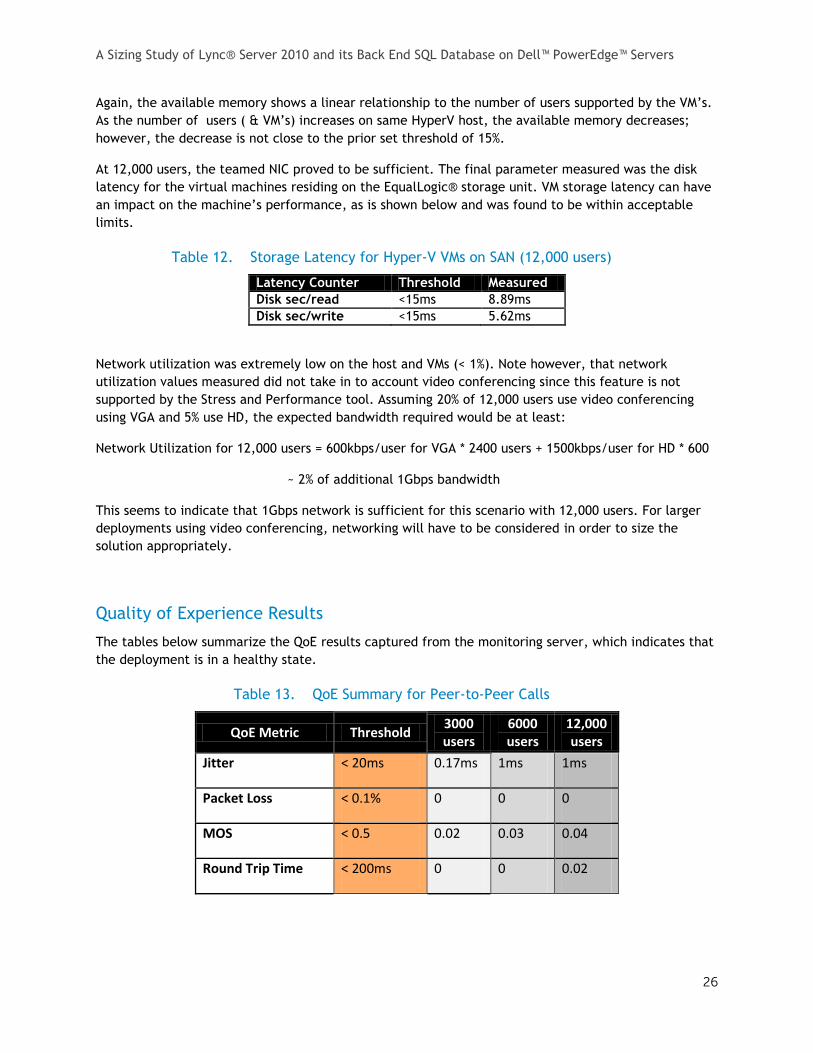
At 12,000 users, the teamed NIC proved to be sufficient. The final parameter measured was the disk
latency for the virtual machines residing on the EqualLogic® storage unit. VM storage latency can have
an impact on the machine’s performance, as is shown below and was found to be within acceptable
limits.
Storage Latency for Hyper-V VMs on SAN (12,000 users) Table 12.
Latency Counter Threshold Measured
Disk sec/read <15ms 8.89ms
Disk sec/write <15ms 5.62ms
Network utilization was extremely low on the host and VMs (< 1%). Note however, that network
utilization values measured did not take in to account video conferencing since this feature is not
supported by the Stress and Performance tool. Assuming 20% of 12,000 users use video conferencing
using VGA and 5% use HD, the expected bandwidth required would be at least:
Network Utilization for 12,000 users = 600kbps/user for VGA * 2400 users + 1500kbps/user for HD * 600
~ 2% of additional 1Gbps bandwidth
This seems to indicate that 1Gbps network is sufficient for this scenario with 12,000 users. For larger
deployments using video conferencing, networking will have to be considered in order to size the
solution appropriately.
Quality of Experience Results
The tables below summarize the QoE results captured from the monitoring server, which indicates that
the deployment is in a healthy state.
QoE Summary for Peer-to-Peer Calls Table 13.
QoE Metric Threshold 3000 users
6000 users
12,000 users
Jitter < 20ms 0.17ms 1ms 1ms
Packet Loss < 0.1% 0 0 0
MOS < 0.5 0.02 0.03 0.04
Round Trip Time < 200ms 0 0 0.02

A Sizing Study of Lync® Server 2010 and its Back End SQL Database on Dell™ PowerEdge™ Servers
27
QoE Summary for Conferencing Table 14.
QoE Metric Threshold 3000 users
6000 users
12,000 users
Jitter < 20ms 1ms 1ms 1ms
Packet Loss < 0.1% 0 0 0
MOS < 0.5 0.07 0.08 0.08
Round Trip Time < 200ms 1ms 1ms 1ms
As shown above, both peer-to-peer and conference scenario statistics are within acceptable QoE limits.
Stress and Performance Tool Counters
To ensure that the Stress and Performance tool running on the load generator servers did not
experience bottlenecks, the following counters were measured.
Stress and Performance Tool Counters Table 15.
Performance Counter 3000 users
6000 users
12,000 users
Processor Utilization < 20% < 60% < 60%
Available Memory > 50% > 50% > 50%
Network Utilization <1% <1% <1%
Total Active Endpoints 3236 6492 13000
Presence Pass Rate % 100 100 100
Total IM Calls Active 790 1584 3176
Total IM Conferences Active 44 89 176
Total AV Conferences Active 34 69 136
Total AS Conferences Active 21 42 86
Total Data Conferences Active 7 7 28
Total DLX Calls / Second 0 1 2
CAA Calls in Progress 8 18 36
As can be seen from the table above, the processor, memory, and network utilization were well within
the thresholds and the resources were adequate, indicating that the load was generated on the Front
End VMs without any bottlenecks.
Back End SQL Database Results
The results for the SQL database were measured during user login periods because during this time, the
SQL Server is most stressed. The CPU and memory utilization trends are shown below and are well
A Sizing Study of Lync® Server 2010 and its Back End SQL Database on Dell™ PowerEdge™ Servers
28
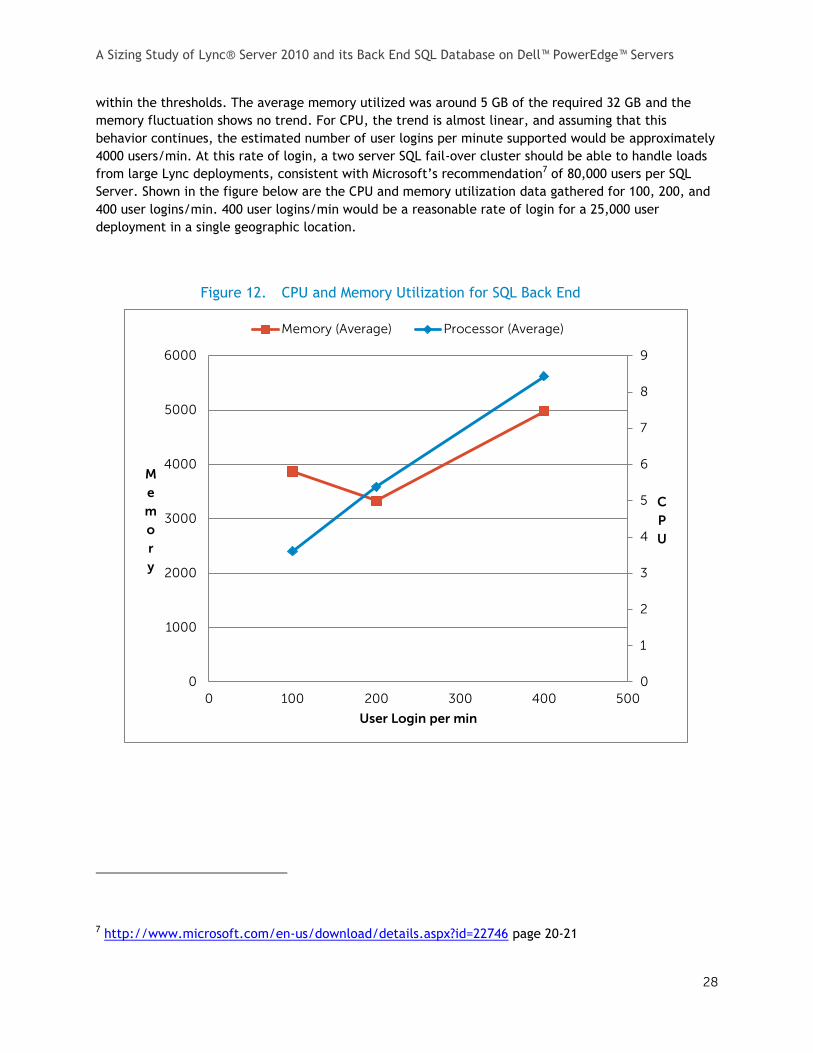
within the thresholds. The average memory utilized was around 5 GB of the required 32 GB and the
memory fluctuation shows no trend. For CPU, the trend is almost linear, and assuming that this
behavior continues, the estimated number of user logins per minute supported would be approximately
4000 users/min. At this rate of login, a two server SQL fail-over cluster should be able to handle loads
from large Lync deployments, consistent with Microsoft’s recommendation7 of 80,000 users per SQL
Server. Shown in the figure below are the CPU and memory utilization data gathered for 100, 200, and
400 user logins/min. 400 user logins/min would be a reasonable rate of login for a 25,000 user
deployment in a single geographic location.
CPU and Memory Utilization for SQL Back End Figure 12.
7 http://www.microsoft.com/en-us/download/details.aspx?id=22746 page 20-21
0
1
2
3
4
5
6
7
8
9
0
1000
2000
3000
4000
5000
6000
0 100 200 300 400 500
C
P
U
M
e
m
o
r
y
User Login per min
Memory (Average) Processor (Average)

A Sizing Study of Lync® Server 2010 and its Back End SQL Database on Dell™ PowerEdge™ Servers
29
The remaining memory counters also looked healthy and these are shown in the table below.
Back End SQL Memory Counters Table 16.
Memory Counters Threshold 100 users/min 200 users/min 400 users/min
Page Faults/sec < 2500 228.36 448.99 301.33
Pages/sec < 1000 0.24 0.22 0.04
Page life expectancy > 3600 4660 3686 5325
The page life expectancy at 200 users/min is close to the one hour threshold, but there are no critical
memory issues. As shown in Figure 12, the memory usage is 3-5GB of the available 32GB.
For the Back End SQL store, database IOPS was measured and their latency was noted. The latency
during the login period is shown for the three scenarios and these were well below the threshold of
20ms.
Latency During Login Figure 13.
0
5
10
15
20
25
0 100 200 300 400 500
Mil
lise
co
nd
s
User Login per min
Disk Latency (LUN 1, 2, 5, and 6)
RTCDYN Log DiskLatency
RTC Log Disk Latency
Data Disk Latency
ABS-APP Log DiskLatency
Threshold
A Sizing Study of Lync® Server 2010 and its Back End SQL Database on Dell™ PowerEdge™ Servers
30
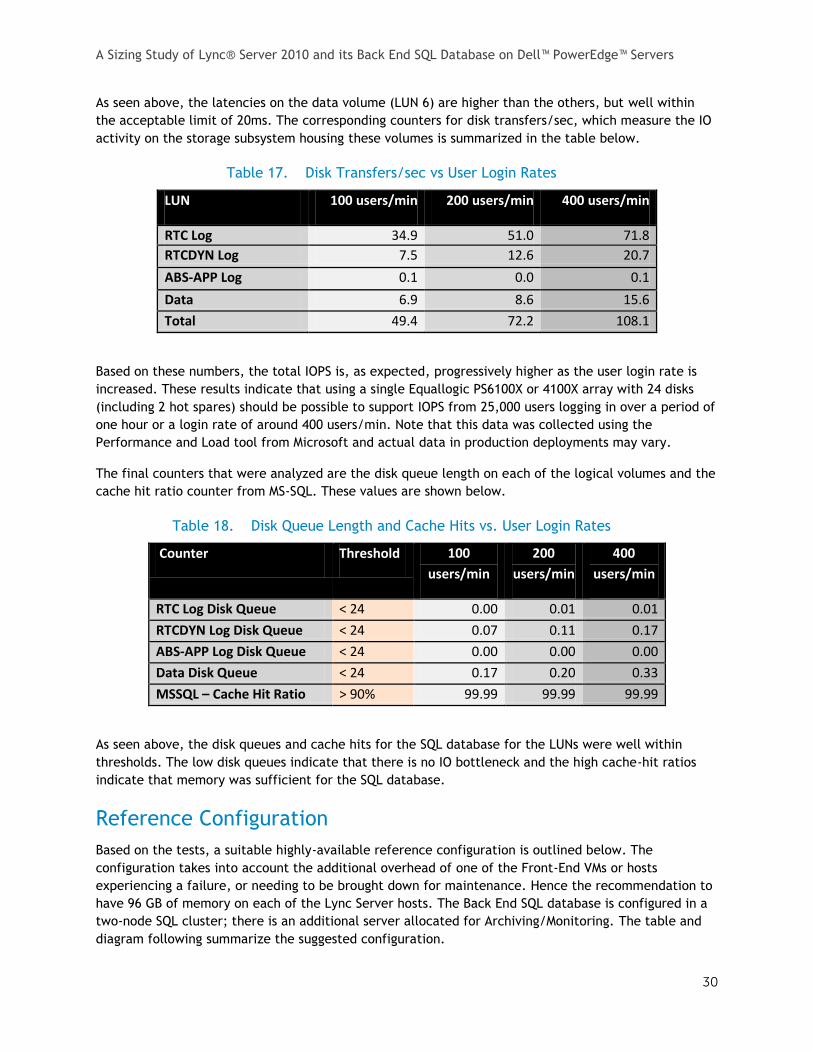
As seen above, the latencies on the data volume (LUN 6) are higher than the others, but well within
the acceptable limit of 20ms. The corresponding counters for disk transfers/sec, which measure the IO
activity on the storage subsystem housing these volumes is summarized in the table below.
Disk Transfers/sec vs User Login Rates Table 17.
LUN 100 users/min 200 users/min 400 users/min
RTC Log 34.9 51.0 71.8
RTCDYN Log 7.5 12.6 20.7
ABS-APP Log 0.1 0.0 0.1
Data 6.9 8.6 15.6
Total 49.4 72.2 108.1
Based on these numbers, the total IOPS is, as expected, progressively higher as the user login rate is
increased. These results indicate that using a single Equallogic PS6100X or 4100X array with 24 disks
(including 2 hot spares) should be possible to support IOPS from 25,000 users logging in over a period of
one hour or a login rate of around 400 users/min. Note that this data was collected using the
Performance and Load tool from Microsoft and actual data in production deployments may vary.
The final counters that were analyzed are the disk queue length on each of the logical volumes and the
cache hit ratio counter from MS-SQL. These values are shown below.
Disk Queue Length and Cache Hits vs. User Login Rates Table 18.
Counter Threshold 100
users/min
200
users/min
400
users/min
RTC Log Disk Queue < 24 0.00 0.01 0.01
RTCDYN Log Disk Queue < 24 0.07 0.11 0.17
ABS-APP Log Disk Queue < 24 0.00 0.00 0.00
Data Disk Queue < 24 0.17 0.20 0.33
MSSQL – Cache Hit Ratio > 90% 99.99 99.99 99.99
As seen above, the disk queues and cache hits for the SQL database for the LUNs were well within
thresholds. The low disk queues indicate that there is no IO bottleneck and the high cache-hit ratios
indicate that memory was sufficient for the SQL database.
Reference Configuration
Based on the tests, a suitable highly-available reference configuration is outlined below. The
configuration takes into account the additional overhead of one of the Front-End VMs or hosts
experiencing a failure, or needing to be brought down for maintenance. Hence the recommendation to
have 96 GB of memory on each of the Lync Server hosts. The Back End SQL database is configured in a
two-node SQL cluster; there is an additional server allocated for Archiving/Monitoring. The table and
diagram following summarize the suggested configuration.
A Sizing Study of Lync® Server 2010 and its Back End SQL Database on Dell™ PowerEdge™ Servers
31
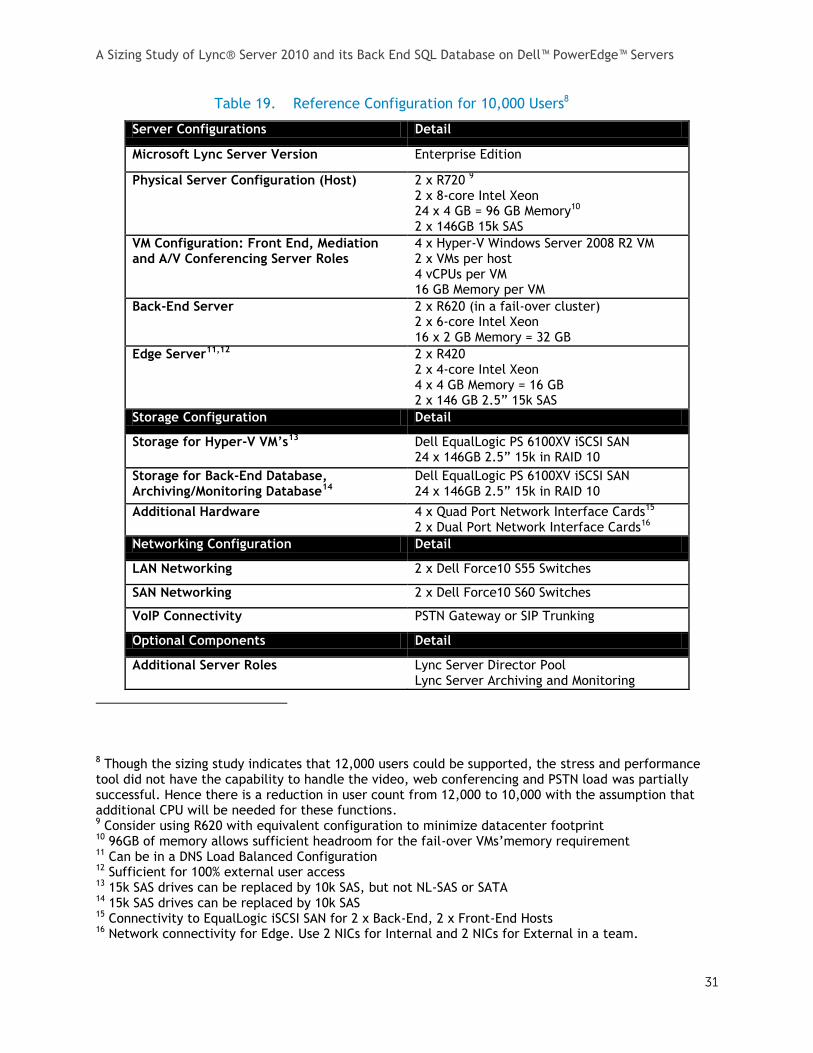
Reference Configuration for 10,000 Users8 Table 19.
Server Configurations Detail
Microsoft Lync Server Version Enterprise Edition
Physical Server Configuration (Host) 2 x R720 9 2 x 8-core Intel Xeon 24 x 4 GB = 96 GB Memory10 2 x 146GB 15k SAS
VM Configuration: Front End, Mediation and A/V Conferencing Server Roles
4 x Hyper-V Windows Server 2008 R2 VM 2 x VMs per host 4 vCPUs per VM 16 GB Memory per VM
Back-End Server 2 x R620 (in a fail-over cluster) 2 x 6-core Intel Xeon 16 x 2 GB Memory = 32 GB
Edge Server11,12 2 x R420 2 x 4-core Intel Xeon 4 x 4 GB Memory = 16 GB 2 x 146 GB 2.5‖ 15k SAS
Storage Configuration Detail
Storage for Hyper-V VM’s13 Dell EqualLogic PS 6100XV iSCSI SAN 24 x 146GB 2.5‖ 15k in RAID 10
Storage for Back-End Database, Archiving/Monitoring Database14
Dell EqualLogic PS 6100XV iSCSI SAN 24 x 146GB 2.5‖ 15k in RAID 10
Additional Hardware 4 x Quad Port Network Interface Cards15 2 x Dual Port Network Interface Cards16
Networking Configuration Detail
LAN Networking 2 x Dell Force10 S55 Switches
SAN Networking 2 x Dell Force10 S60 Switches
VoIP Connectivity PSTN Gateway or SIP Trunking
Optional Components Detail
Additional Server Roles Lync Server Director Pool Lync Server Archiving and Monitoring
8 Though the sizing study indicates that 12,000 users could be supported, the stress and performance tool did not have the capability to handle the video, web conferencing and PSTN load was partially successful. Hence there is a reduction in user count from 12,000 to 10,000 with the assumption that additional CPU will be needed for these functions. 9 Consider using R620 with equivalent configuration to minimize datacenter footprint 10 96GB of memory allows sufficient headroom for the fail-over VMs’memory requirement 11 Can be in a DNS Load Balanced Configuration 12 Sufficient for 100% external user access 13 15k SAS drives can be replaced by 10k SAS, but not NL-SAS or SATA 14 15k SAS drives can be replaced by 10k SAS 15 Connectivity to EqualLogic iSCSI SAN for 2 x Back-End, 2 x Front-End Hosts 16 Network connectivity for Edge. Use 2 NICs for Internal and 2 NICs for External in a team.
A Sizing Study of Lync® Server 2010 and its Back End SQL Database on Dell™ PowerEdge™ Servers
32
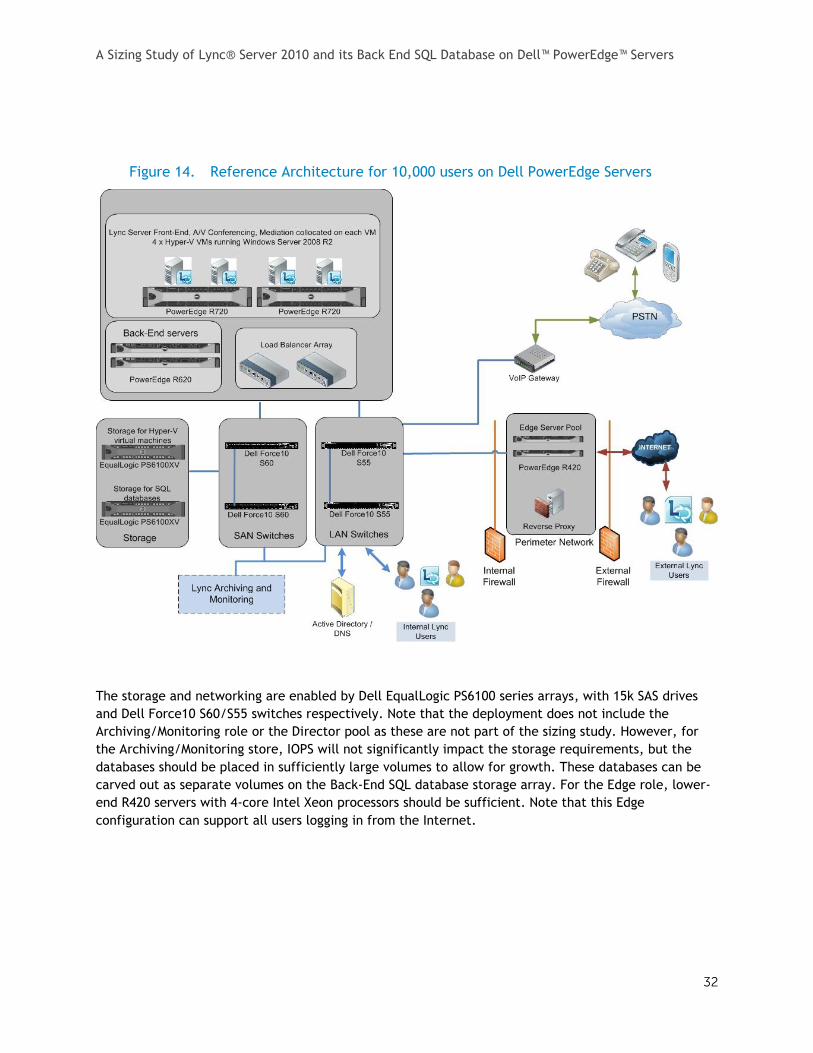
Reference Architecture for 10,000 users on Dell PowerEdge Servers Figure 14.
The storage and networking are enabled by Dell EqualLogic PS6100 series arrays, with 15k SAS drives
and Dell Force10 S60/S55 switches respectively. Note that the deployment does not include the
Archiving/Monitoring role or the Director pool as these are not part of the sizing study. However, for
the Archiving/Monitoring store, IOPS will not significantly impact the storage requirements, but the
databases should be placed in sufficiently large volumes to allow for growth. These databases can be
carved out as separate volumes on the Back-End SQL database storage array. For the Edge role, lower-
end R420 servers with 4-core Intel Xeon processors should be sufficient. Note that this Edge
configuration can support all users logging in from the Internet.
A Sizing Study of Lync® Server 2010 and its Back End SQL Database on Dell™ PowerEdge™ Servers
33
Conclusion
This paper presented testing results from a virtualized Microsoft Lync Server 2010 deployment on a Dell
PowerEdge R720 server. It discussed the new capabilities on the PowerEdge servers, and how the Lync
Server scales well with these new hardware features. By collecting data from the Lync Stress and
Performance Tool and performance counters, the almost linear scaling of Lync Server 2010 was
observed. Care was taken to validate that the Lync deployment and load generation tool were within
good performance thresholds, and a Reference Configuration was created based on the Lync server’s
performance.
The Reference Configuration uses a SAN, physical backend servers, and two Hyper-V hosts to run four
Lync Front End Server VMs, and Edge Servers. It uses Dell PowerEdge R720, R620 and R420 servers,
Force10 S60 and S55 switches, and EqualLogic PS6100XV storage units. The test results show that even
in the worst case scenario, Lync will perform within performance thresholds and the resource
utilization scales linearly with increasing load on the virtual machines. R420 Servers should be
sufficient for Edge Servers.
As an extension of this study, the Back End SQL server and storage were analyzed for any performance
bottlenecks. With users logging in at 100, 200, and 400 users per minute, the server and storage
requirements were sufficient. These results indicate that a Back End SQL server with its corresponding
PS6100XV in an iSCSI SAN should be capable of easily handing 25,000 users logging in over one hour.