a social impact assessment - hia connecthiaconnect.edu.au/old/files/lhrs_sia_reportt.pdf · a...
TRANSCRIPT
A Social Impact Assessment
on the Lower Hunter Regional
Strategy
A guide for documenting a Social Impact Assessment
AUGUST 2006
This guide was written by the Project Team Venessa Wells (Project Officer) Milly Licata (Project Officer) Karen Gillham (Project Manager) Anne Kempton (Project Manager) The authors would also like to thank the Social Impact Assessment Working Group members who contributed to the success and documentation of this project. Further Information can be obtained from: Karen Gillham [email protected] Manager Hunter New England Population Health Hunter New England Area Health Service Locked Bag 10 Wallsend NSW 2287 Australia Phone: + 61 2 49 246 241 Fax: + 61 2 49 246 215 Anne Kempton [email protected] Manager, Hunter Premier’s Department Premier’s Department Level 4, 251 Wharf Road Newcastle NSW 2300 Australia Phone: + 61 2 49 278 799 Fax: + 61 2 49 278 798 Suggested Reference Wells, V., Licata, M., Gillham, K. and Kempton, A. (2006). A Social Impact Assessment on the Lower Hunter Regional Strategy: A guide for documenting a Social Impact Assessment. The Regional Coordination Management Group – Hunter Branch, NSW, Australia. Report Design by Venessa Wells. Front page picture taken from the Lower Hunter Regional Strategy, 2005 – The City of Newcastle. Pictures throughout this document were taken by Ailsa MacKenzie.
ii

Acknowledgments This report was produced by Venessa Wells, Milly Licata, Karen Gillham and Anne Kempton on behalf of the Hunter Regional Coordination Management Group Social Impact Assessment Working Group. The report details a Social Impact Assessment on the Lower Hunter Regional Strategy which was undertaken in collaboration with representatives of the Hunter Regional Coordination Management Group and managed by the Hunter branch of the Premier’s Department and Hunter New England Population Health. With thanks to the following people for their involvement in the Social Impact Assessment. Regional Coordination Management Group Social Impact Assessment Working Group David Bonjer Department of Planning Peter Britt Department of Tourism, Sport and Recreation Steven Brown Department of Planning Kim Browne Hunter New England Area Health Service Linda Christine Department of Housing Jennifer Collison Premier’s Department Ruth Jordan Department of Community Services Nidia Marneros NSW Department of Health Sally Anne Price NSW Police Liz Rushton Department of Education and Training Christine Warrington TAFE NSW Lower Hunter Regional Strategy Social Impact Assessment Project Team NSW Premier’s Department (Hunter Branch) Anne Kempton (Program Manager) Hunter New England Population Health
Project Officers Venessa Wells (Project Officer) Milly Licata (Project Officer)
Project Managers Karen Gillham (Program Manager) Edouard Tursan d’Espaignet (Service Director, Surveillance and Performance)
With grateful acknowledgements Sue Maxwell Former Project Officer - Hunter New England Population Health Ailsa MacKenzie Assisting Project Officer - Hunter New England Population Health Alex Donaldson Former Project Manager - Hunter New England Population Health Jenny Hughes Chronic Disease Prevention & Health Manager, NSW Dept. of Health Ben Harris-Roxas Research Officer - Centre for Health Equity Training and Research Evaluation (CHETRE) Patrick Harris Research Officer - Centre for Health Equity Training and Research Evaluation (CHETRE) Phillip O’Neill Director - Centre for Urban and Regional Studies (CURS)
iii

iv
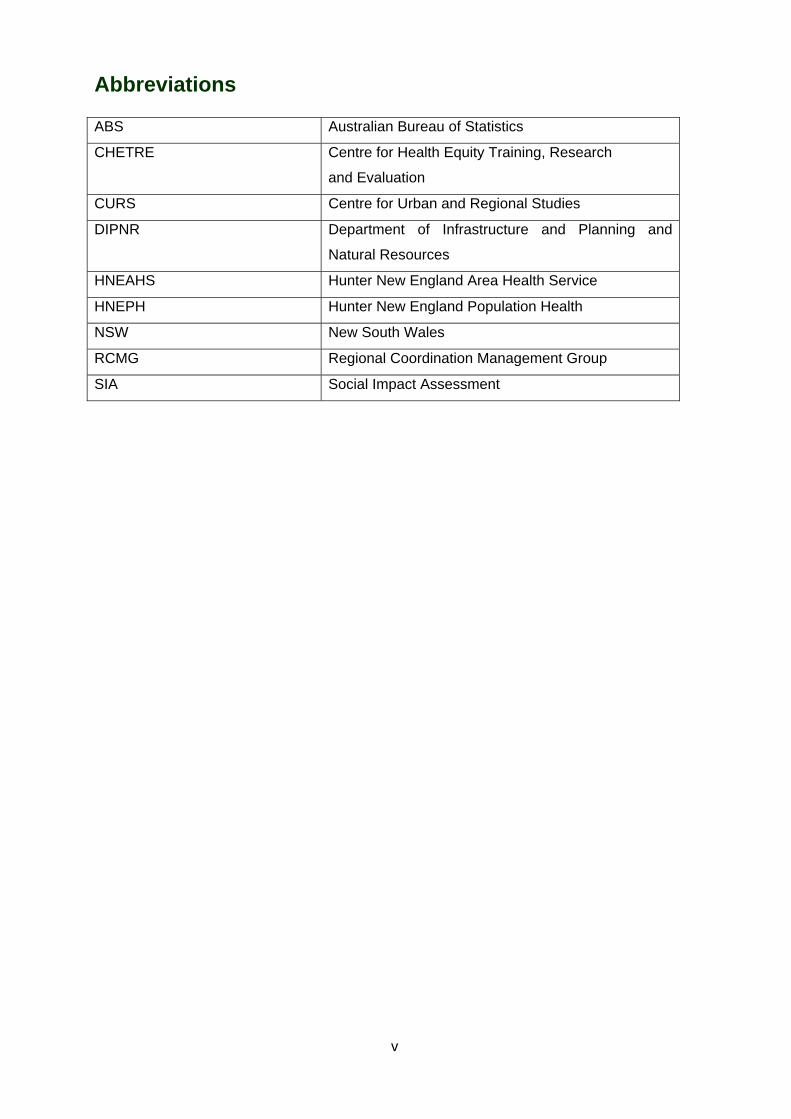
Abbreviations ABS Australian Bureau of Statistics
CHETRE Centre for Health Equity Training, Research
and Evaluation
CURS Centre for Urban and Regional Studies
DIPNR Department of Infrastructure and Planning and
Natural Resources
HNEAHS Hunter New England Area Health Service
HNEPH Hunter New England Population Health
NSW New South Wales
RCMG Regional Coordination Management Group
SIA Social Impact Assessment
v

vi

Table of Contents
Acknowledgments....................................................................................................................... iii Abbreviations ............................................................................................................................... v Executive Summary .................................................................................................................... ix 1 Background to Project.......................................................................................................... 3
1.1 About the New South Wales Health Impact Assessment Project................................. 3 1.2 Background to the Draft Lower Hunter Regional Strategy ........................................... 4 1.3 What is an Impact Assessment? .................................................................................. 5
2 Screening Report .................................................................................................................. 9 2.1 Background to this Chapter .......................................................................................... 9 2.2 The Purpose of Screening............................................................................................ 9 2.3 Context and Content of the Draft Lower Hunter Regional Strategy............................ 10 2.4 Desired Outcomes of the Strategy ............................................................................. 13 2.5 Potential Social Impacts of the Strategy..................................................................... 15 2.6 Agencies to be involved in the Social Impact Assessment......................................... 22 2.7 Justification for the Social Impact Assessment .......................................................... 23 2.8 Principles of the Social Impact Assessment............................................................... 25
3 Scoping Report.................................................................................................................... 29 3.1 Background to this Chapter ........................................................................................ 29 3.2 The Purpose of Scoping ............................................................................................. 29 3.3 Conclusions from the Screening Process................................................................... 30 3.4 Methodology for Obtaining Evidence.......................................................................... 36 3.5 Planning an Evaluation............................................................................................... 39
4 Recommendation Report.................................................................................................... 43 4.1 Background to this Chapter ........................................................................................ 43 4.2 Purpose of the Recommendation Report ................................................................... 43 4.3 Social Impact Statement............................................................................................. 45 4.4 Analysis of Impacts and Interpretation ....................................................................... 47 4.5 Example of Agency comments ................................................................................... 50 4.6 Recommendations...................................................................................................... 61
5 Evaluation Report................................................................................................................ 67 5.1 Background to this Chapter ........................................................................................ 67 5.2 Purpose of the Evaluation Stage ................................................................................ 67 5.3 Evaluation Methodology ............................................................................................. 68 5.4 Summary of Key Findings .......................................................................................... 69 5.5 Evaluation Findings .................................................................................................... 70
6 Case Study........................................................................................................................... 83 6.1 Background to this Chapter ........................................................................................ 83
vii
6.2 The Purpose of the Case Study ................................................................................. 83 6.3 Background to the Social Impact Assessment ........................................................... 84 6.4 Rationale for the Social Impact Assessment .............................................................. 87 6.5 Undertaking the Social Impact Assessment ............................................................... 89 6.6 Main Findings and Recommendations ....................................................................... 93 6.7 Key Learning’s............................................................................................................ 97 6.8 Conclusion................................................................................................................ 101
References................................................................................................................................ 103 Appendix................................................................................................................................... 105
Appendix 1 – Developmental Site Application................................................................... 105 Appendix 2 – Draft Lower Hunter Region Strategy ........................................................... 107 Appendix 3a –Lower Hunter Region Map.......................................................................... 123 Appendix 3c –Lower Hunter Region Employment Map..................................................... 127 Appendix 4 – Social Impact Statement.............................................................................. 131 Appendix 5 – Evaluation Survey ......................................................................................... 133
List of Tables ............................................................................................................................ 139 List of Figures........................................................................................................................... 141
viii
Executive Summary The Lower Hunter Regional Strategy prepared by the Department of Planning identifies how development in the region will be managed on a sustainable basis over the next 25 years. The Strategy, projecting a population increase of 125 000 people, has the potential to influence the health and social well-being of the community and the equitable access to, and distribution of services across the region. In order to ensure that further disadvantage is not created by the implementation of the Strategy, the Hunter Regional Coordination Management Group, comprising of senior representatives of state government agencies from the Hunter Region of New South Wales, Australia, completed an equity-focused Social Impact Assessment of the Strategy. A draft version of the Strategy was released for public comment on 4 November 2005 and the Social Impact Assessment was produced in response to this release. Hunter New England Area Health Service, on behalf of the Hunter Regional Co-ordination Management Group, was successful in obtaining approval to become one of six developmental sites to undertake an impact assessment in 2005/2006, as part of CHETRE’s (Centre for Health Equity Training Research and Evaluation) third phase of their capacity building project. Hunter New England Population Health and the NSW Premier’s Department – Hunter Branch, led the social impact assessment. These agencies worked closely with officers from the Hunter Department of Planning and members of the Hunter Regional Coordination Management Group who would be required to implement the outcomes of the social impact assessment. This report is a collection of documents produced by the Project Team and Working Group throughout the social impact assessment. Each chapter is designed to be a stand alone body of work demonstrating information that can be considered at each stage of a impact assessment.
Chapter 1 outlines how the agencies became involved in a social impact assessment; the Lower Hunter Regional Strategy; and what is involved in an impact assessment.
Chapter 2 is an example of a screening document and details the rationale for conducting a social impact assessment. Chapter 3 presents key consideration in the scoping stage, focusing on project planning issues. Chapter 4 displays extracts of the Social Impact Statement. A modified version of the document submitted to the Department of Planning as part of the public submission phase is in Appendix 4. Presenting the recommendations document in total is to give practitioners an example of what can be included in this type of submission. Chapter 5 is the process evaluation report produced as part of the social impact assessment. This chapter evaluates the process of the impact assessment. Chapter 6 is an example of a case study of this impact assessment. This chapter is a collection of reflections from the Project Team.
This document is designed to assist first time impact assessment practitioners document the assessment process. It is one possible approach to completing an impact assessment on a regional strategy.
ix

x
Chapter 1
Background to the
Project
Maitland Railway Station, Maitland.
1

2

1 Background to Project
1.1 About the New South Wales Health Impact Assessment Project
“The NSW Health Equity Statement recommended processes should be developed for undertaking rapid health impact appraisals and comprehensive health impact assessment as one set of strategies that would ensure that proposed government polices, programs and projects would improve health and address health inequalities (p. 1)1”
Over the last four years, in partnership with New South Wales (NSW) Department of Health, the Centre for Health Equity Training, Research and Evaluation (CHETRE) has been managing a capacity building project on Health Impact Assessmentsa. The first phase of the project conducted in 2002/2003, involved a range of capacity building strategies to promote Health Impact Assessments such as; consultation with key internal NSW Department of Health stakeholders, workshops with Area Health Service Staff, dissemination of a Health Impact Assessment newsletter and development of publications. The second phase conducted in 2004, involved five sites across NSW Department of Health undertaking Health Impact Assessment, with CHETRE the supporting agency. The third phase of the capacity building project was similar to phase two. The aim of the third phase was to develop the capacity of five sites across the NSW Department of Health to conduct Health Impact Assessments, through a ‘learning by doing’ approach. Unlike phase two, CHETRE was interested in developmental sites that were able to examine major developments such as proposed developments or land releases. Hunter New England Area Health Service (HNEAHS), on behalf of the Hunter Regional Co-ordination Management Group (RCMG)b, was successful in obtaining approval to become one of six developmental sites to undertake an Impact Assessment in 2005/2006. Appendix 1 is the completed Development Site Application form. The Hunter development site undertook a Social Impact Assessment (SIA) on the Lower Hunter Regional Strategy.
a For full details of the NSW Health Impact Assessment Project see 1;2 b The Regional Coordination Program began in 1994 as an opportunity to explore the enhancement of government responses to issues impacting on rural and regional areas. This now state-wide program includes a Regional Coordinator, designated to lead and support projects and a RCMG which comprises of senior regional managers of government agencies. 3
3
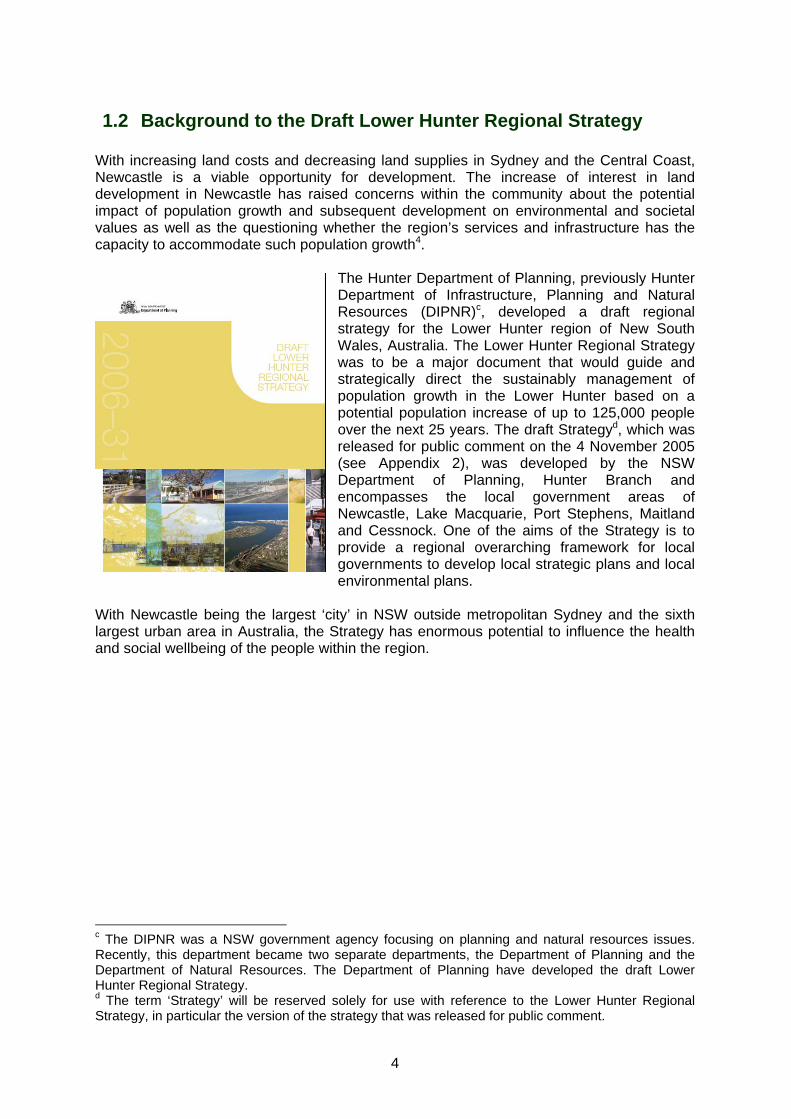
1.2 Background to the Draft Lower Hunter Regional Strategy With increasing land costs and decreasing land supplies in Sydney and the Central Coast, Newcastle is a viable opportunity for development. The increase of interest in land development in Newcastle has raised concerns within the community about the potential impact of population growth and subsequent development on environmental and societal values as well as the questioning whether the region’s services and infrastructure has the capacity to accommodate such population growth4.
The Hunter Department of Planning, previously Hunter Department of Infrastructure, Planning and Natural Resources (DIPNR)c, developed a draft regional strategy for the Lower Hunter region of New South Wales, Australia. The Lower Hunter Regional Strategy was to be a major document that would guide and strategically direct the sustainably management of population growth in the Lower Hunter based on a potential population increase of up to 125,000 people over the next 25 years. The draft Strategyd, which was released for public comment on the 4 November 2005 (see Appendix 2), was developed by the NSW Department of Planning, Hunter Branch and encompasses the local government areas of Newcastle, Lake Macquarie, Port Stephens, Maitland and Cessnock. One of the aims of the Strategy is to provide a regional overarching framework for local governments to develop local strategic plans and local environmental plans.
With Newcastle being the largest ‘city’ in NSW outside metropolitan Sydney and the sixth largest urban area in Australia, the Strategy has enormous potential to influence the health and social wellbeing of the people within the region.
c The DIPNR was a NSW government agency focusing on planning and natural resources issues. Recently, this department became two separate departments, the Department of Planning and the Department of Natural Resources. The Department of Planning have developed the draft Lower Hunter Regional Strategy. d The term ‘Strategy’ will be reserved solely for use with reference to the Lower Hunter Regional Strategy, in particular the version of the strategy that was released for public comment.
4
1.3 What is an Impact Assessment? An impact assessment is a structured process involving the identification of potential consequences of a current or proposed action5. Impact assessments seek to predict and understand what impacts may occur, attempting to reveal unintentional, avoidable consequences of a proposed action. Ideally an impact assessment should be conducted on a proposal before it is implemented, preferably after the formal planning stage6. There are many types of impact assessments focusing on different issues: social; health; and the environment7. Although each type of impact assessment varies slightly in the issues it assesses, the processes are similar. Below is an outline of the steps involved in an Equity-Focused Health Impact Assessment. These stages reflect the steps taken in the SIA on the Lower Hunter Regional Strategy. This SIA followed these steps.
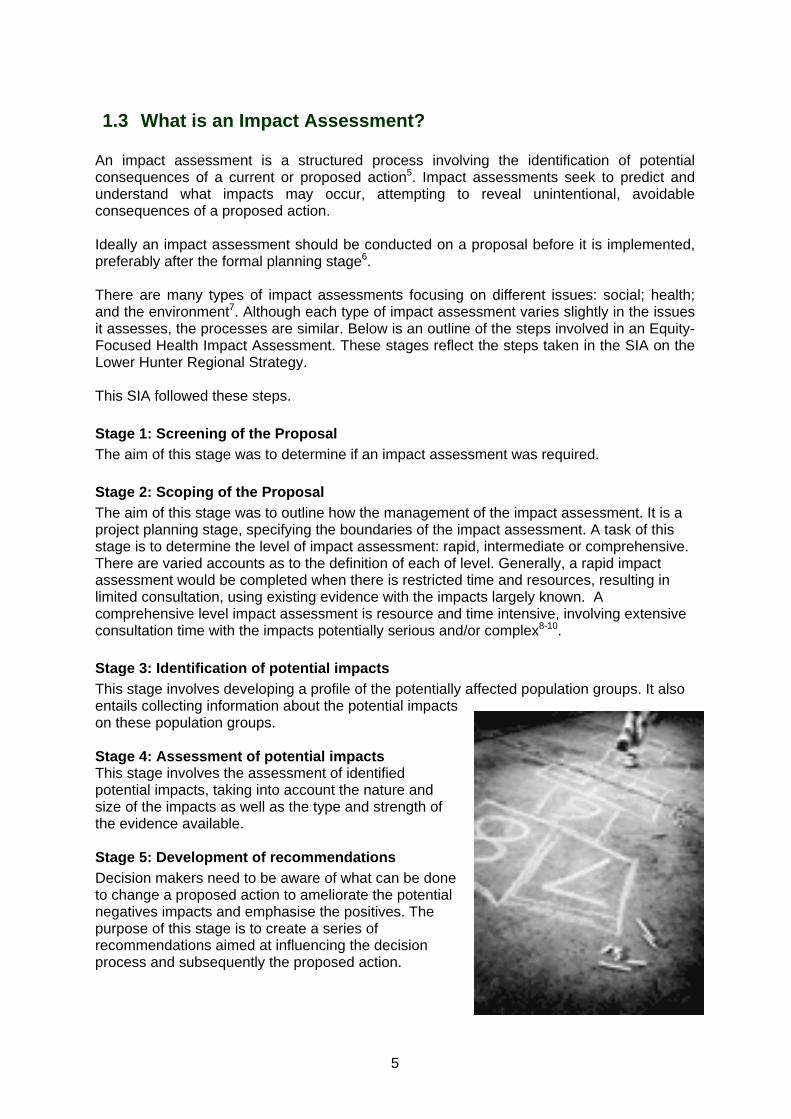
Stage 1: Screening of the Proposal The aim of this stage was to determine if an impact assessment was required. Stage 2: Scoping of the Proposal The aim of this stage was to outline how the management of the impact assessment. It is a project planning stage, specifying the boundaries of the impact assessment. A task of this stage is to determine the level of impact assessment: rapid, intermediate or comprehensive. There are varied accounts as to the definition of each of level. Generally, a rapid impact assessment would be completed when there is restricted time and resources, resulting in limited consultation, using existing evidence with the impacts largely known. A comprehensive level impact assessment is resource and time intensive, involving extensive consultation time with the impacts potentially serious and/or complex8-10. Stage 3: Identification of potential impacts This stage involves developing a profile of the potentially affected population groups. It also entails collecting information about the potential impacts on these population groups. Stage 4: Assessment of potential impacts This stage involves the assessment of identified potential impacts, taking into account the nature and size of the impacts as well as the type and strength of the evidence available.
Stage 5: Development of recommendations Decision makers need to be aware of what can be done to change a proposed action to ameliorate the potential negatives impacts and emphasise the positives. The purpose of this stage is to create a series of recommendations aimed at influencing the decision process and subsequently the proposed action.
5

Stage 6: Monitoring and evaluation This stage involves the evaluation of the impact assessment. Ideally it should involve process, impact and outcome evaluation of the impact assessment, as well as the examination of indicators or an agreed method for monitoring the implementation of the proposed action.
To ensure potential inequities are addressed, an equity-lens should be applied. An equity lens is referred to as, ‘a metaphorical pair of glasses that ensures people ask ‘who will benefit?’11. An equity-focused impact assessment assesses whether differential impacts are inequitable9. For more details on impact assessments please see the following references6;8;12.
6

Chapter 2
Screening Report
Merewether, Newcastle.
7

8
2 Screening Report
2.1 Background to this Chapter This chapter is the screening document detailing the rationale for conducting the SIA on the Lower Hunter Regional Strategy.
2.2 The Purpose of Screening The purpose of the screening stage is to examine the viability of conducting a SIA on a proposal. It should examine whether there are possible links between the proposal and social outcomes and what areas of well being the proposal might affect.
2.2.1 Issues addressed in the Screening Process The screening stage was guided by questions outlined in a number of papers9;13. The SIA focused on the following issues:
1. The context and the content in which the Strategy was developed. a. Where is the Strategy being implemented – the geographical context? b. The Strategy content. c. Who is required to implement the Strategy? d. What other documents will influence the Strategy? e. What is the political context in which the Strategy is being implemented?
2. Identifying key stakeholders. a. Which populations are targeted by the Strategy? b. Which populations are excluded by the Strategy? c. Which agencies are likely to be involved?
3. The identified desired outcomes of the Strategy. 4. The potential social impacts. 5. The principles of the SIA. 6. Justification for the SIA.
a. Identifying aspects of the Strategy which can be influenced and changed.
To address these questions, the Project Team in consultation with Department of Planning representatives reviewed the Lower Hunter Regional Strategy. Information about the Working Group and the Project Team are discussed in more detail in Chapter 3: Scoping Report.
9
2.3 Context and Content of the Draft Lower Hunter Regional Strategy
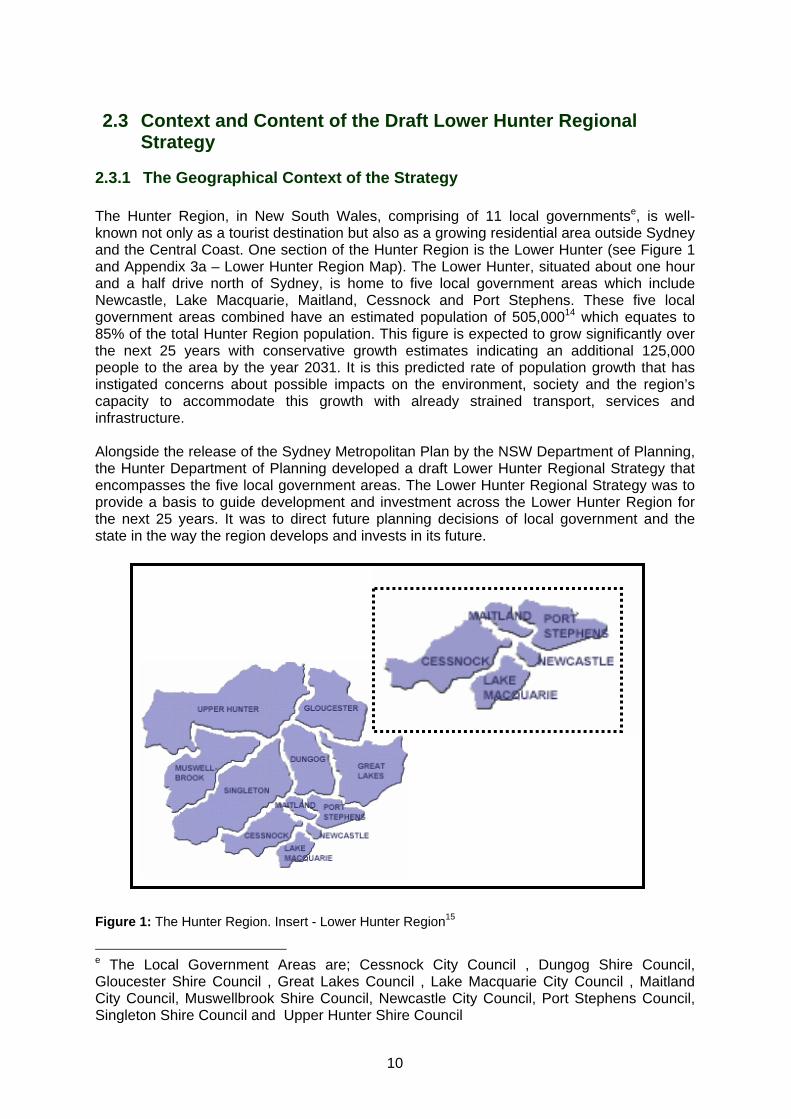
2.3.1 The Geographical Context of the Strategy The Hunter Region, in New South Wales, comprising of 11 local governmentse, is well-known not only as a tourist destination but also as a growing residential area outside Sydney and the Central Coast. One section of the Hunter Region is the Lower Hunter (see Figure 1 and Appendix 3a – Lower Hunter Region Map). The Lower Hunter, situated about one hour and a half drive north of Sydney, is home to five local government areas which include Newcastle, Lake Macquarie, Maitland, Cessnock and Port Stephens. These five local government areas combined have an estimated population of 505,00014 which equates to 85% of the total Hunter Region population. This figure is expected to grow significantly over the next 25 years with conservative growth estimates indicating an additional 125,000 people to the area by the year 2031. It is this predicted rate of population growth that has instigated concerns about possible impacts on the environment, society and the region’s capacity to accommodate this growth with already strained transport, services and infrastructure. Alongside the release of the Sydney Metropolitan Plan by the NSW Department of Planning, the Hunter Department of Planning developed a draft Lower Hunter Regional Strategy that encompasses the five local government areas. The Lower Hunter Regional Strategy was to provide a basis to guide development and investment across the Lower Hunter Region for the next 25 years. It was to direct future planning decisions of local government and the state in the way the region develops and invests in its future.
Figure 1: The Hunter Region. Insert - Lower Hunter Region15
e The Local Government Areas are; Cessnock City Council , Dungog Shire Council, Gloucester Shire Council , Great Lakes Council , Lake Macquarie City Council , Maitland City Council, Muswellbrook Shire Council, Newcastle City Council, Port Stephens Council, Singleton Shire Council and Upper Hunter Shire Council
10

2.3.2 The Content of the Strategy The Department of Planning released a confidential version of the draft Lower Hunter Regional Strategy to the Working Group. This allowed the SIA to begin prior to the public release of the draft Lower Hunter Regional Strategy. Once the draft Strategy was publicly released on the 4 November 2005, the Working Group discarded the confidential draft and proceeded to complete the SIA on the publicly released draft. See Appendix 2 for the publicly released draft of the Lower Hunter Regional Strategy.
2.3.3 Documents relating to the Strategy The draft Strategy represents an agreed NSW Government position on the future of the Lower Hunter. As stated in the Strategy14,
“It will be the pre-eminent planning document for the Lower Hunter and has been prepared to complement and inform other relevant state planning instruments (p1).”
The draft Strategy must be taken into account when planning and developing other planning documents such as:
• NSW government plans and policies; • Local government environmental plans; • Other relevant local government plans and policies; and • Planning and development process under the Environmental Plan and
Assessment Act.
However, it is currently not a policy, meaning that there is no legislation enforcing its implementation. Also, where current local government planning instruments contradict the Strategy, the planning instruments must be amended to ensure alignment with the Strategy.
2.3.4 Principles underpinning the Strategy The Strategy released for public comment does not explicitly state any underlying principles or strategic directions. Below are some of the implicit principles which the Project Team identified and are similar to various other principles such as the Smart Growth Principles16:
• sustainable future; • urban consolidation; • urban renewal; • reducing urban sprawl; • economic growth; • utilisation of existing infrastructure; • promoting opportunities for employment ; • access to services including transport, health and education; • preservation and protection of ecological and significant landscapes; • direct development towards existing communities; • efficiency; • mixed land use;
11

• create a range of housing opportunities and choices; and • providing choice for residents and visitors of :
o quality living environments; o cultural opportunities; o recreational opportunities; o employment opportunities; and o transport opportunities.
2.3.5 Assumptions underpinning the Strategy Some assumptions underpinning the draft Strategy identified by the Project Team was:
• local government areas will use the Strategy to guide their strategic urban planning, environmental planning and social planning;
• government and other agencies will communicate and cooperate in a timely manner to provide the necessary infrastructures and services set out by the Strategy, complementing the suggested urban form;
• the Strategy will be able to guide sustainable growth and change in the Lower Hunter;
• infrastructure issues will be addressed by subsequent plans; • the Strategy will benefit all communities in the Lower Hunter; • planning for population growth will be a positive influence on the environmental,
social and economic needs of the Lower Hunter; • the sustainability criteria is adequate to ensure developments outside the planned
areas will be sustainable; • economic growth can (and will) occur through the planning; • population growth can be guided through planning; • allocating a higher proportion of new housing in centres will maintain the
character of existing established suburbs; • allocating a higher proportion of new housing in centres will reduce pressure on
the existing established suburbs; • employment opportunities will be filled by residents; • residents will have the required skills to fill the employment positions that will be
created; and • all residents and visitors will benefit from the choice of high quality living, cultural
and recreational opportunities.
12

2.4 Desired Outcomes of the Strategy The following expected outcomes have been stated in the draft Strategy.
2.4.1 Housing
See Appendix 2, pages 12-15 for detail desired outcomes of the Strategy for housing and Appendix 3b for the Lower Hunter Regional Strategy housing map. Summary • A hierarchy of centres, ranging from a major central business district to six major
regional centres each with a greater population density surrounding the centres. • Mixed use urban centres for more efficient land use. • A series of new release areas. • A number of corridors within the central business district with higher densities and a
variety of dwelling types. • A greater proportion of the population living nearer to employment, education facilities,
services and public transport. • Allocation of lands for development beyond 2031. • Shift the percentage of detached dwellings from 80% to 85% and attached or multi-unit
dwellings from 15% to 20%. • Provide mix of housing styles and allotment size in new release areas.
2.4.2 Employment
See Appendix 2, pages 16-19 for detailed desired outcomes of the Strategy for employment and Appendix 3c for the Lower Hunter Regional Strategy employment map. Summary • Use existing zoned vacant industrial land before other areas are zoned. • Maintain an adequate supply of vacant industrial land. • Employment growth will capitalise on key regional infrastructure. • A greater proportion of employment to be located in major centres, close to higher
population densities and accessible via public transport. • Possible increase of home-based, self-sufficient and localised employment opportunities.
13
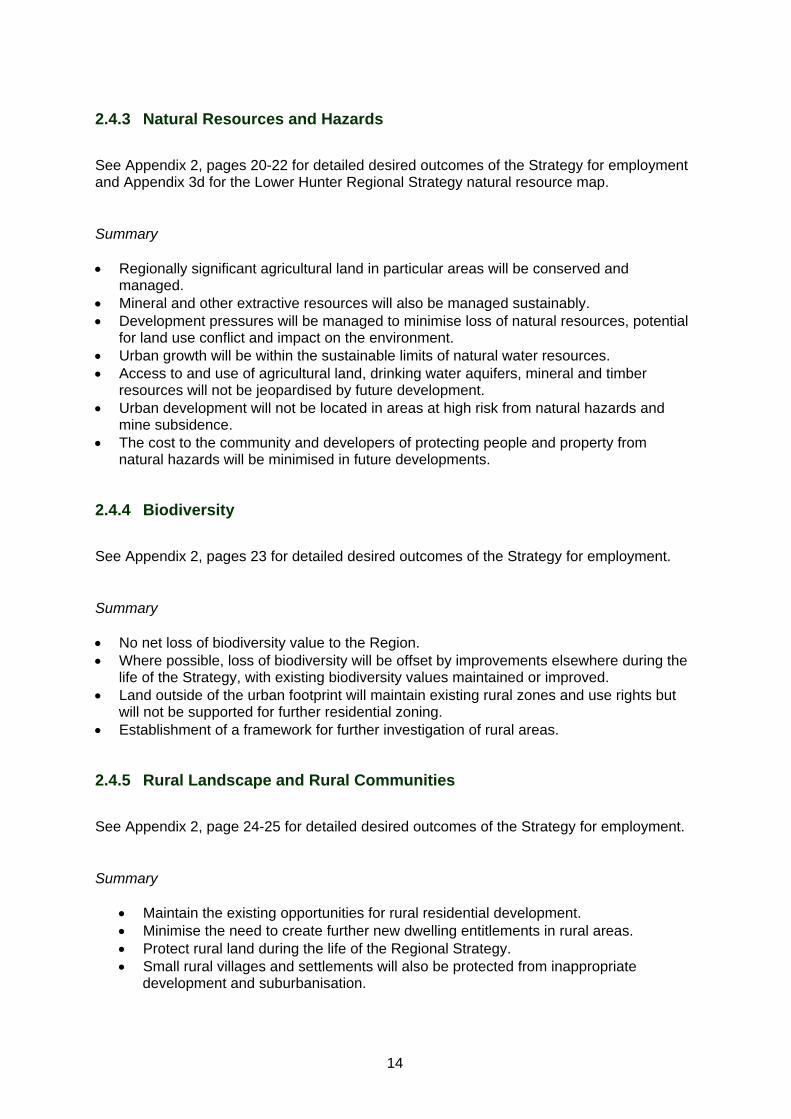
2.4.3 Natural Resources and Hazards
See Appendix 2, pages 20-22 for detailed desired outcomes of the Strategy for employment and Appendix 3d for the Lower Hunter Regional Strategy natural resource map. Summary • Regionally significant agricultural land in particular areas will be conserved and
managed. • Mineral and other extractive resources will also be managed sustainably. • Development pressures will be managed to minimise loss of natural resources, potential
for land use conflict and impact on the environment. • Urban growth will be within the sustainable limits of natural water resources. • Access to and use of agricultural land, drinking water aquifers, mineral and timber
resources will not be jeopardised by future development. • Urban development will not be located in areas at high risk from natural hazards and
mine subsidence. • The cost to the community and developers of protecting people and property from
natural hazards will be minimised in future developments.
2.4.4 Biodiversity
See Appendix 2, pages 23 for detailed desired outcomes of the Strategy for employment. Summary • No net loss of biodiversity value to the Region. • Where possible, loss of biodiversity will be offset by improvements elsewhere during the
life of the Strategy, with existing biodiversity values maintained or improved. • Land outside of the urban footprint will maintain existing rural zones and use rights but
will not be supported for further residential zoning. • Establishment of a framework for further investigation of rural areas.
2.4.5 Rural Landscape and Rural Communities
See Appendix 2, page 24-25 for detailed desired outcomes of the Strategy for employment. Summary
• Maintain the existing opportunities for rural residential development. • Minimise the need to create further new dwelling entitlements in rural areas. • Protect rural land during the life of the Regional Strategy. • Small rural villages and settlements will also be protected from inappropriate
development and suburbanisation.
14

2.5 Potential Social Impacts of the Strategy
2.5.1 Stakeholders potentially affected
A Strategy of this magnitude has the potential to influence the health and social well-being of people across the Lower Hunter. Those who are concerned with, or will be affected by a proposal17, or those who are involved in the development of the proposal18 are defined as stakeholders. This section will discuss the potentially affected populations and agencies and those who are involved in the development proposal.
2.5.1.1 Agencies involved in the development of the Strategy The NSW Department of Planning – Hunter Branch and the Minister for Planning are intricately involved in the development and release of the Strategy. These agencies hold key decision making roles over information included or excluded in the Strategy.
2.5.1.2 Populations and Agencies potentially affected by the Strategy This section includes a brief outline of the populations potentially affected by the draft Strategy. Obviously those living within the Lower Hunter over the next 25 years and those moving into the region over the next 25 years are the target population for the Strategy. However, this Strategy has the potential to affect many other populations as listed below. The regional centres of
• Newcastle Central Business District • Charlestown • Glendale/Cardiff • Raymond Terrance • Maitland • Cessnock • Morisset
The proposed employment centres
• Newcastle Airport • The port of Newcastle • The University of Newcastle • The John Hunter Hospital • Kotara retail area • Greenhills retail area
The proposed areas for building on existing communities and further investigation areas
• Cessnock • Morisset • West Newcastle • Maitland West
The proposed agricultural land areas in
• Cessnock
15

The proposed new release areas • Medowie • North Raymond Terrace • Thornton North • Lochinvar • Bellbird • Cooranbong • Wyee
The proposed renewal corridors
• Maitland Road – Newcastle West to Mayfield • Tudor Street – Newcastle West to Broadmeadow
Other more specific populations in which the LHRS may affect are: • Existing residents, both long and short-term residents in the five local government
areas o Port Stephens o Newcastle o Lake Macquarie o Maitland o Cessnock
• Residents of neighbouring local government areas • Various commercial business and industrial services operators • Various service industry and industry providers (eg. doctors, allied health
professionals, teachers etc) • Various government services in the area
o Health o Police o Education o Primary Industries o Community Services o Sport and Recreation o Transport o Housing
• Local Government Planners • Property developers/building contractors • Future residential populations • Indigenous groups • People from culturally and linguistically diverse backgrounds • People across the socioeconomic spectrum • Rural residents • Urban communities • Communities who are isolated • Children and young people • Families • People who have a mental health issues/health issues • People who have a disability • Homeowners • People who rent
A range of environments and habitats may be affected by the draft Strategy are also mentioned.
16

2.5.2 Preliminary Social Impacts of the Strategy The following are possible impacts from the Strategy discussed by the Project Team. Discussion focused on housing and employment as these were considered the main expertise of the Project Team and the main aims of the SIA. However, the Strategy does not address infrastructure, transport, funding or service allocation which may also affect the impacts of the proposal. These possible impacts were only preliminary ideas.
17

Table 1: Potential Impacts from the Lower Hunter Regional Strategy - Housing
Housing
• A hierarchy of centres, ranging from a major central business district to six major regional centres each with a greater population density surrounding the centres.
• Mixed use urban centres for more efficient land use.
• A series of new release areas.
• A number of corridors within the centre business district with higher densities and a variety of dwelling types.
• Allocation of lands for developed beyond 2031.
• Shift the percentage of detached dwellings from 80% to 85% and attached or multi-unit dwellings from 15% to 20%.
• Provide mix of housing styles and allotment size in new release areas.
• Encourage a greater proportion of the population living nearer to employment, education facilities, services and public transport.
Possible Positive Impacts Possible Negative Impacts
Planning for housing in particular areas may
• increase affordability • increase available choice of residential housing type • increase access to public transport choices if available • decrease urban sprawl which in turn can positively affect
o the activity of those living in non-sprawling urban area • maintain an adequate supply of land for increased population
Planning for an increase in population density in centres may
• decrease the likelihood of social isolation • decrease the reliance on private car use which may
o increase physical activity levels o decreased traffic accidents o decreased noise and air pollution
• possibly increase of social cohesiveness • increase in communication • change existing neighbourhoods physical structure • change existing neighbourhood characteristics • changes in existing neighbourhood economic status
Placement/co-locating infrastructure
• may increase accessibility
Changes to Housing may
• decrease availability of affordable housing (increase house prices) which may lead to
o increase in shared accommodation (with subsequent overcrowding) o people living in substandard ‘temporary’ accommodation
• increase in weekly spending which may lead to o restriction on spending money on other budget items such as
nutritious food education health service access
• increase in housing and population density through urban infill may lead to o social exclusion through
higher housing costs displacement of affordable housing
o creates conditions favourable to spread of infectious diseases o reduced mental health associated with housing height and multiple
dwellings Increases in Population may
• change the existing neighbourhoods physical structure/characteristics • change existing neighbourhood economic status. These changes may not
please the
18

• may influence participation in social life Increased access to transport
• reduce isolation • increase opportunities for work– having the potential to improve
health, economic opportunities • increase opportunities for social activities – having the potential to
improve health • increase access to businesses and services
Increase access to services
• reducing the impact on the environment • encouraging more active transport opportunities
o increase spending
o existing residents o the incoming residents o or the local authorities
• treasured places may be lost affecting people’s o fundamental trust o sense of security
• demands for land/houses outstrip provision of services
Change in Quality of Life may • increase stress and anxiety on already socially disadvantaged groups • increase stress and anxiety on existing neighbourhood populations through
large influx of people • possible displacement of existing populations
o increase fear of crime due to o increase levels of new residents o increased social isolation
• change the urban design • loss of sense of neighbourhood • restrict personal use of land/property • increase disadvantage in already disadvantaged groups due to increase of the
population • Employment, schools, services and transport systems may not be able to support
the population • Smaller segments of the population who do not live near employment, schools,
services and transport systems will be disadvantage, or have limited access
19
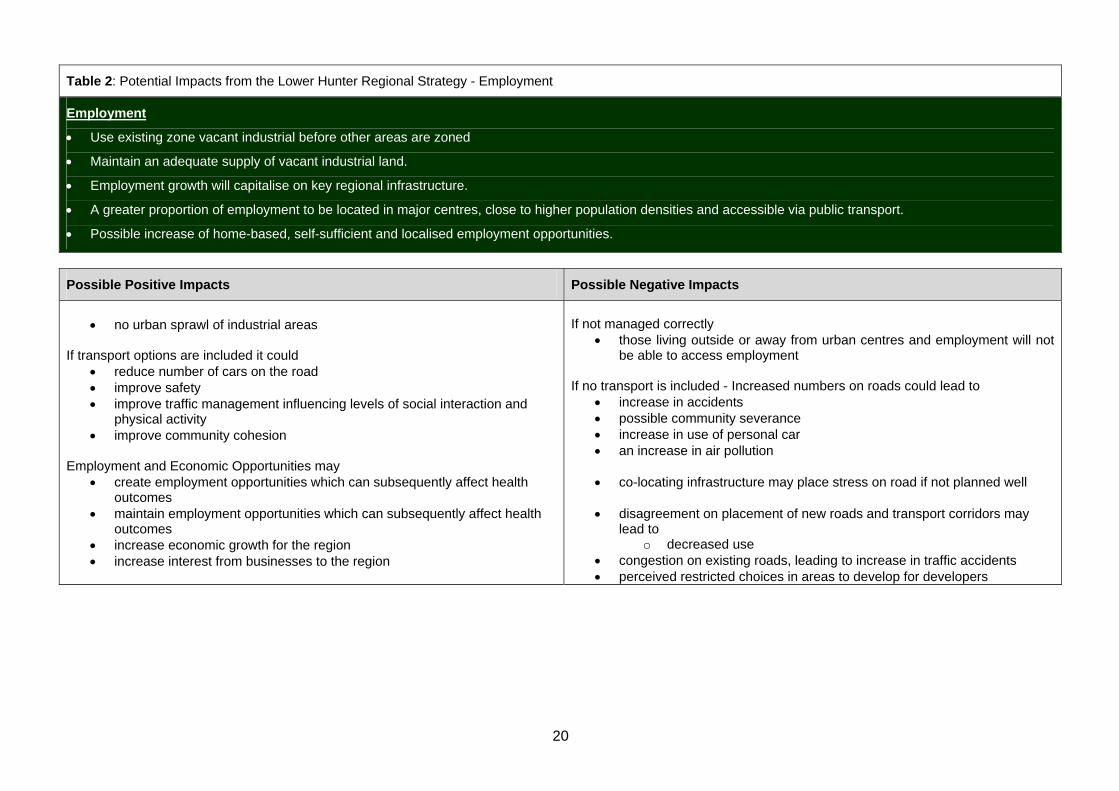
Table 2: Potential Impacts from the Lower Hunter Regional Strategy - Employment
Employment
• Use existing zone vacant industrial before other areas are zoned
• Maintain an adequate supply of vacant industrial land.
• Employment growth will capitalise on key regional infrastructure.
• A greater proportion of employment to be located in major centres, close to higher population densities and accessible via public transport.
• Possible increase of home-based, self-sufficient and localised employment opportunities.
Possible Positive Impacts Possible Negative Impacts
• no urban sprawl of industrial areas
If transport options are included it could
• reduce number of cars on the road • improve safety • improve traffic management influencing levels of social interaction and
physical activity • improve community cohesion
Employment and Economic Opportunities may
• create employment opportunities which can subsequently affect health outcomes
• maintain employment opportunities which can subsequently affect health outcomes
• increase economic growth for the region • increase interest from businesses to the region
If not managed correctly
• those living outside or away from urban centres and employment will not be able to access employment
If no transport is included - Increased numbers on roads could lead to
• increase in accidents • possible community severance • increase in use of personal car • an increase in air pollution • co-locating infrastructure may place stress on road if not planned well • disagreement on placement of new roads and transport corridors may
lead to o decreased use
• congestion on existing roads, leading to increase in traffic accidents • perceived restricted choices in areas to develop for developers
20

Table 3: Potential Impacts from the Lower Hunter Regional Strategy – Environment
Natural Resources and Hazards
• Regionally significant agricultural land in particular areas will be conserved and managed.
• Mineral and other extractive resources will also be managed sustainably.
• Development pressures will be managed to minimise loss of natural resources, potential for land use conflict and impact on the environment.
• Urban growth will be within the sustainable limits of natural water resources.
• Access to and use of agricultural land, drinking water aquifers, mineral and timber resources will not be jeopardised by future development.
• Urban development will not be located in areas at high risk from natural hazards and mine subsidence.
• The cost to the community and developers of protecting people and property from natural hazards will be minimised in future developments
Biodiversity
• No net loss of biodiversity value to the Region.
• Where possible, loss of biodiversity to be offset by improvements elsewhere during the life of the Strategy, with existing biodiversity values maintained or improved.
• Land outside of the urban footprint will maintain existing rural zones and use rights but will not be supported for further residential zoning.
• Establishment of a framework for further investigation of rural areas.
Rural landscape and rural communities
• Maintain the existing opportunities for rural residential development
• Minimise the need to create further new dwelling entitlements in rural areas
• Protect rural land during the life of the Regional Strategy
• Small rural villages and settlements will also be protected from inappropriate development and suburbanisation.
Possible Positive Impacts Possible Negative Impacts
Planning regarding the Natural Environment
• increase and conservation of existing vegetation • increase conservation of natural resources • increase public space in natural reserves which can act as positive health
determinants
Managing mineral resources sustainably may reduce jobs in the industry
21

2.6 Agencies to be involved in the Social Impact Assessment
2.6.1 Working Group In order to identify the potential social and health impacts arising from the proposed population increase, Hunter RCMG, wanted to complete an equity-focused SIA of the Strategy to ensure that the implementation of the Strategy did not create further disadvantage. As a RCMG project, a Working Group was formed consisting of the RCMG representatives to provide advice and guidance on the conduct of the SIA. The Working Group included representatives from the following State Government Departments:
1. NSW Department of Education and Training
2. NSW Department of Housing
3. NSW Department of Technical and Further Education
4. NSW Department of Community Services
5. NSW Department of Sport and Recreation
6. NSW Department of Primary Industries
7. Hunter New England Area Health Service
8. NSW Premier’s Department – Hunter Branch
9. NSW Department of Planning – Hunter Branch (formerly DIPNR)
10. NSW Police
11. NSW Department of Health
2.6.2 Project Team As designated lead agencies, the NSW Premier’s Department, Hunter Branch and Hunter New England Population Health (HNEPH) formed a Project Team. The proposed membership of the Project Team was a project manager from the Hunter Premier’s Department and HNEPH, one project officer from HNEPH and one statistician from HNEPH as outlined in table 4. Table 4 describes the anticipated staff hour allocations as outlined in the initial development site application.
Table 4: Anticipated staff time allocations to the Social Impact Assessment project
Staff position Period allocated to SIA project Hours allocated to SIA project
Project Director (HNEPH) August 2005 – January 2006 Not allocated hours
Project Manager (Premier’s) August 2005 – January 2006 0.3 FTE or 12 hours per week
Project Manager (HNEPH) August 2005 – January 2006 1.0 FTE or 40 hours per week
Project Officer (HNEPH) August 2005 – January 2006 0.4 FTE or 16 hours per week
Statistician (HNEPH) August 2005 – January 2005 0.2 FTE or 8 hours per week
22

2.7 Justification for the Social Impact Assessment
2.7.1 Language The Hunter RCMG decided to name the project a SIA instead of a Health Impact Assessment. This was based on the view that the Department of Health is only one of the agencies interested in considering the social impacts of the Lower Hunter Regional Strategy and although a broad definition of ‘health’ is often used in health impact assessments, incorporating the social determinants of health – it can incorrectly portray that health is the sole focus. Nevertheless, the SIA followed similar steps to a health impact assessment.
2.7.2 Goal of the Social Impact Assessment The overall aim of the SIA was to create a series of recommendations about the potential social impacts the Lower Hunter Regional Strategy could have on both the existing populations and the expected increased population of the Lower Hunter. Information gathered through the scoping process would form the recommendations.
2.7.3 Rationale and Objectives for conducting a Social Impact Assessment on the Strategy
Currently within the Lower Hunter region, people are experiencing levels of disadvantage that have required a whole of government focus to attempt to address some of the ensuring issues. In order to ensure the Lower Hunter Regional Strategy does not create further disadvantage, it was most important to conduct a SIA. Therefore the project’s rationale for conducting a SIA is similar to key reasons outlined in the New Zealand Public Health Advisory Committee Health Impact Assessment Guide 19. It’s first and foremost objective was to improve the social wellbeing and improve social equity across the Lower Hunter. Other key reasons were:
• to promote evidence-based policy development; • to promote multi-agency working by encouraging policy-makers to collaborate with
one another, focusing on a common goal; • to encourage policy-makers to consider positive, negative and unknown impacts of a
proposal on people’s social well-being and use these findings to enhance a proposal; • to empower the Strategy developers to examine and secure positive social-wellbeing
outcomes for communities within the Lower Hunter; • to empower government departments to cohesively examine and identify social-
wellbeing outcomes for communities they service within the Lower Hunter; • to encourage both Strategy developers and government departments to consider
relevant SIA recommendations in their future planning processes; and • to examine the application of an equity lens to a proposal through the SIA process.
2.7.4 Can a Social Impact Assessment be applied to the Strategy? Working Group members agreed that the Strategy was suitable for the SIA process. The decision for conducting an SIA was because: • the Strategy would not be part of an Environmental Impact Assessment;
23

• the screening process identified numerous links within which potential actions can modify the impacts on the social issues and health of the target population;
• the screening process also identified considerable uncertainty about the ‘potential’ impacts suggesting that if growth is not well planned, further strain could be placed on social services.
2.7.5 What level should the Social Impact Assessment occur? A rapid SIA largely draws on existing evidence but consultation with relevant agencies is needed to draw out contextual or local area impacts. Unfortunately due to the nature of the SIA, no community consultations were held and the assessment was heavily reliant on ‘expert’ opinion and literature reviewing. This was agreed upon in the screening meeting.
2.7.6 The Recommendation to proceed or not At the screening meeting the Working Group unanimously agreed to proceed with the SIA and that all agency representatives on the Working Group will contribute to the process where possible.
2.7.7 Potential opportunities for change to the Strategy Documents such as the Lower Hunter Regional Strategy have enormous potential to influence the health and social wellbeing of the people of the region. Department of Planning allowing the RCMG to analyse the social impact of Strategy, offered an enormous opportunity for a multi-agency response. In addition, it also allowed for key determinants of health and social issues to be integrated in policy. Department of Planning has assured the RCMG that all recommendations made by the Working Group would be considered during the public display period. Although this is no guarantee that each and every recommendation will be incorporated, two senior members of Department of Planning were members of the Working Groups which highlights Department of Planning’s dedication to, and exploration of this new decision making process.
24

2.8 Principles of the Social Impact Assessment Prior to the formation of the Working Group, the RCMG discussed the need for the Department of Planning to consider social cohesionf as a principle in the Lower Hunter Regional Strategy. However, discussion during the pre-screening meeting of the Working Group concluded that the concept of social cohesion would be difficult to apply to this macro level document. The Working Group agreed that applying the concept of equity, possibly via an equity lens would be more applicable and achievable. Basing a SIA on equityg is about identifying and assessing differential social impacts and making judgements about whether these potential differential social impacts will be, are, or were, inequitable, whether they are avoidable and unfair. An equity lens refers to a metaphorical pair of glasses that ensures people ask who will benefit? 22 An equity lens was applied throughout the process of the SIA. However, due to people’s different perspectives, it was necessary for the Working Group to consider a range of definitions, and agreed upon a definition. The definition was fair and just. To expand on the concepts of fair and just, the Working Group also identified the need of a set of criteria, in order to apply the ‘equity lens’ when deciding if the impact of implementing the Strategy, whether negative, neutral or positive, is fair and just. The Project Team developed the following criterion for applying an equity lens. At the screening meeting, the Working Group reviewed the criterion. The suggested criterion is: 1. Stabilising or increasing the levels of advantage across the whole community, with
particular attention to the population groups that are most vulnerable. 2. No creation or re-allocation of disadvantageh among the existing or new populations. 3. The gap between the levels of advantage and disadvantage not to be widened, and
narrowed if possible.
The Working Group also identified the need to define vulnerability and agreed on the following explanation.
How you define as a vulnerable population will vary according to location, time and circumstance. Vulnerable population can be defined as a subgroup of the overall population who are at higher risk of problem(s). They may be defined by age, gender, ethnicity, health status etc. Some examples of vulnerable populations are; children, economically disadvantaged and disabled, indigenous, elderly, culturally and linguistically diverse and people with mental illness. However we must remember to keep the concept of vulnerable groups flexible due to the broad reach of the Strategy.
The Working Group formulated a series of questions to focus discussion around equity. f Social Cohesion can be defined as, “collective values people hold, patterns of social engagement and participation and the levels of unity and harmony within society” .20 It can occur when a community has the ability to work together and support each other” 21 g Sometime the terms inequity and inequality are used interchangeably, how there are definite differences. Inequity is, “a difference that is unnecessary and avoidable and considered unfair and unjust” whereas inequality is, “a descriptive form of observed differences that are unavoidable, like differences in health due to age, sex, genetics” 21. h Disadvantage, is, “a pattern of limitation of life opportunities in health or in social or economic well-being” 21.
25

The questions were;
• Is the Lower Hunter Regional Strategy creating disadvantage? • Is the Lower Hunter Regional Strategy increasing disadvantage? • Is the Lower Hunter Regional Strategy re-allocating disadvantage?
26
27
Chapter 3
Scoping Report
Honeysuckle Foreshore, Newcastle.

28

3 Scoping Report
3.1 Background to this Chapter This chapter provides an example of a scoping report. This report expands on the screening report, outlining the method and resources that will be used to complete the SIA.
3.2 The Purpose of Scoping The screening process reveals whether there is a project, program or policy that could have impacts on social wellbeing and what the type of impacts may be. If further information is required, or if it is agreed that a SIA needs to be completed, the scoping stage is carried out. The scoping stage outlines the impact assessment process, including what resources are available and the time frame. This stage examines the specific nature of the SIA, documenting what level the SIA will be conducted (rapid, intermediate or comprehensive)23, what further work needs to be completed, how this work will be carried out and by whom. Its aim is to assess what populations will need to be considered and most importantly, what methods, resources and timeframe will the HIA be implemented building upon the screening process 24. In other words, the scoping document defines the review of the literature and method of the SIA.
3.2.1 Issues addressed in the Scoping Process Scoping the Strategy was guided by questions outlined in a number of papers 9;13. This stage required formal confirmation of the following issues; 1. SIA process and goals:
a. confirmation that the SIA is to be undertaken; b. confirmation of what level the SIA will be undertaken; and c. the goal, objectives, strategies and expected outcomes of the SIA process.
2. Participation:
a. identification of working group; and b. identification of who will facilitate the process.
3. Project management:
a. timeframe for the SIA; b. project management requirements; and c. project team.
4. SIA information:
a. clarifying dimensions of SIA; b. agreement on defining key terms, principles and values; c. agreement on how information will be gathered; d. identifying outcome measures; and e. planning the evaluation.
The Project Team in consultation with Department of Planning representatives and the Working Group reviewed the Strategy to address these questions.
29

3.3 Conclusions from the Screening Process
3.3.1 Is a Social Impact Assessment to be undertaken? At the screening meeting, the Working Group unanimously agreed to complete a SIA on the Strategy. Each agency on the Working Group agreed that they would contribute where possible.
3.3.2 What level will the Social Impact Assessment occur? As discussed in the screening stage, a rapid prospective SIA largely drawing on existing evidence but in consultation with relevant agencies was conducted. This was agreed upon in the screening meeting.
3.3.3 Goals, Objectives, Strategies and Expected Outcomes of the Social Impact Assessment
Aims 1) To assess levels of existing vulnerability and access to services within geographical sites identified by the Strategy. 2) To assess the potential social impact the proposed population growth could have on the existing populations. 3) To create a series of recommendations about the appropriateness of proposed growth areas. Information gathered through the scoping process will formed the recommendations. The recommendations will be predominately associated with future population increases in new release areas, existing sites and corridors. Objectives The project’s objectives for conducting a SIA is similar to key reasons outlined in the New Zealand Public Health Advisory Committee Health Impact Assessment Guide 19. It’s first and foremost objective was to improve the social wellbeing and reduce social inequalities across the Lower Hunter. Other key reasons were:
• to promote evidence-based policy development; • to promote multi-agency working by encouraging policy-makers to collaborate with
one another, focusing on a common goal; • to encourage policy-makers to consider positive, negative and unknown impacts of a
proposal on people’s social well-being and use these findings to enhance a proposal; • to empower the Strategy developers to examine and secure positive social-wellbeing
outcomes for communities within the Lower Hunter; • to empower government departments to cohesively examine and identify social-
wellbeing outcomes for communities they service within the Lower Hunter; • to encourage both Strategy developers and government departments to consider
relevant SIA recommendations in their future planning processes; and • to examine the application of an equity lens to a proposal through the SIA process.
30
Strategies
• A Working Group established from members of the Hunter RCMG worked collaboratively through the SIA process by attending meetings and email/phone communication.
• Each department was asked to contribute information and expert knowledge to the process.
• An equity lens was applied to each stage of the SIA to ensure social inequities were reduced.
Expected outcomes
• A series of recommendations outlining possible strengths and limitations with population increase in particular areas of the Lower Hunter.
• Increase skills in conducting SIAs. • Continual building and maintenance of partnerships across state government
agencies. • Increase sharing of information across government departments.
3.3.4 Who is undertaking the Social Impact Assessment?
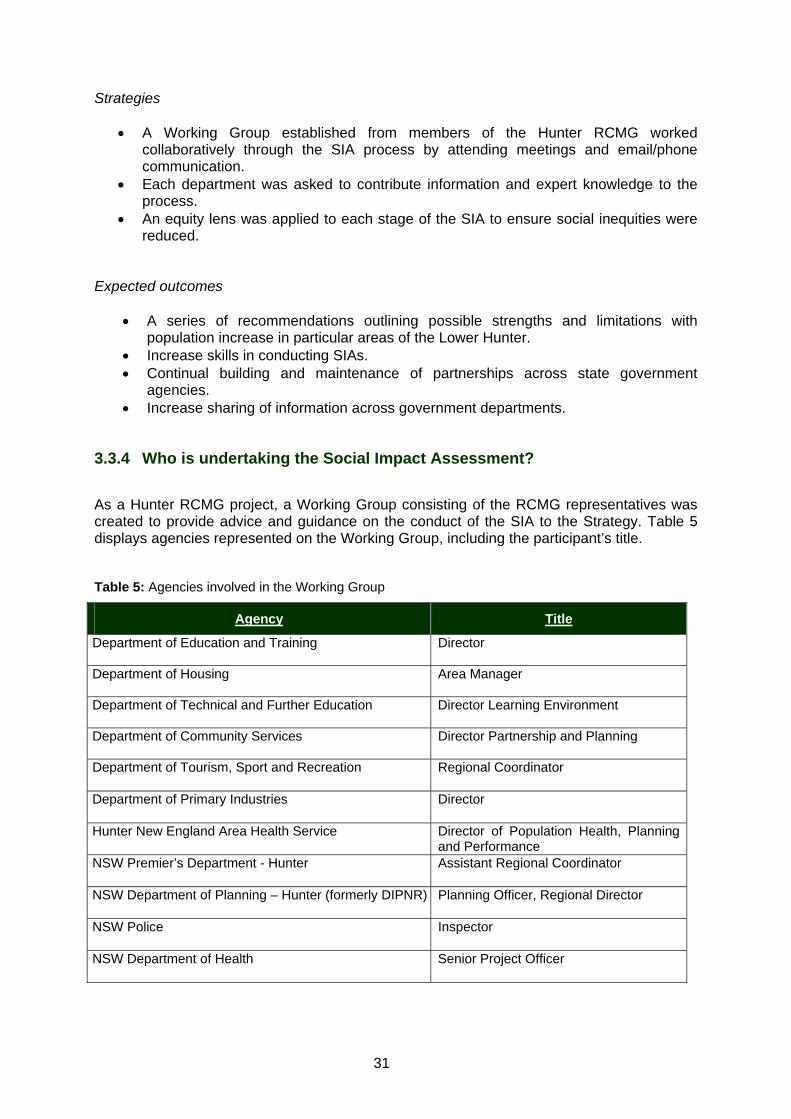
As a Hunter RCMG project, a Working Group consisting of the RCMG representatives was created to provide advice and guidance on the conduct of the SIA to the Strategy. Table 5 displays agencies represented on the Working Group, including the participant’s title.
Table 5: Agencies involved in the Working Group
Agency Title
Department of Education and Training Director
Department of Housing Area Manager
Department of Technical and Further Education Director Learning Environment
Department of Community Services Director Partnership and Planning
Department of Tourism, Sport and Recreation Regional Coordinator
Department of Primary Industries Director
Hunter New England Area Health Service Director of Population Health, Planning and Performance
NSW Premier’s Department - Hunter Assistant Regional Coordinator
NSW Department of Planning – Hunter (formerly DIPNR) Planning Officer, Regional Director
NSW Police Inspector
NSW Department of Health Senior Project Officer
31

3.3.5 Identification of who will facilitate the Social Impact Assessment
Hunter Premier’s Department and HNEPH created a Project Team. These agencies were lead agencies on the project. A review of staff allocations occurred after the screening stage. The Project Team membership changed to include a project manager from both the Hunter Premier’s Department and HNEPH, and the equivalent of two full-time project officers from HNEPH as outlined in table 6. CHETRE supported the Project team throughout the SIA.
Table 6: Reviewed Staff Allocations
Staff position Period allocated to SIA project Hours allocated to SIA project
Project Director (HNEPH) August 2005 – January 2006 Not allocated hours
Project Manager (Premier’s) August 2005 – January 2006 0.3 FTE or 12 hours per week
Project Manager (HNEPH) August 2005 – January 2006 0.15 FTE or 6 hours per week
Project Officer (HNEPH) August 2005 – December 2006 2.0 FTE or 80 hours per week
Project Officer (HNEPH) January 2005 – February 2005 1.2 FTE or 48 hours per week
3.3.6 Rationale for Working Group selection Currently within the Hunter region, people are experiencing levels of disadvantage that have required a whole of government focus in order to attempt to address some of the ensuring issues. The Hunter RCMG stressed the need for undertaking a project to consider the social impacts of the Lower Hunter Regional Strategy, and to make recommendations about the Strategy to the Department of Planning. It was considered that a SIA could be a useful tool to achieve these outcomes.
3.3.7 Terms of Reference for the Working Group The agreed terms of reference for the Steering Group, as outlined in table 7, cover:
• the purpose of the working group; • roles and responsibilities of members; • meeting arrangements; • arrangements for addressing issues that arise out of session; • require members’ input; and • timeline of the project.
32
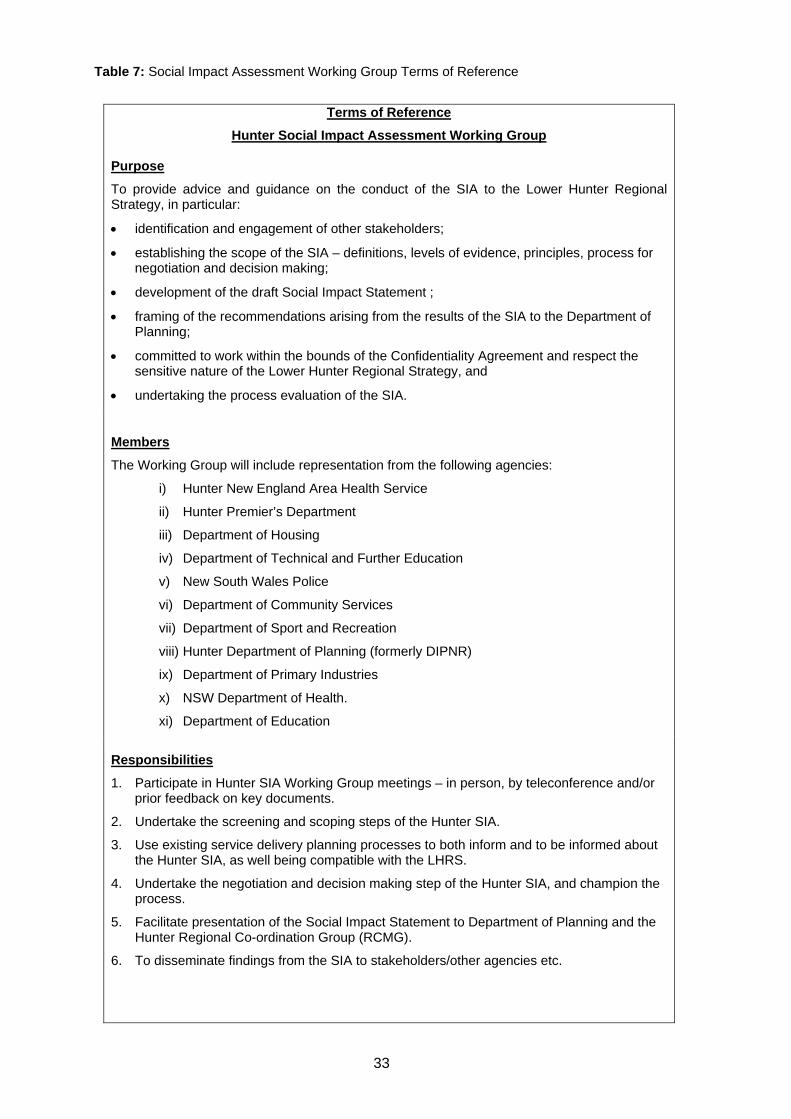
Table 7: Social Impact Assessment Working Group Terms of Reference
Terms of Reference
Hunter Social Impact Assessment Working Group Purpose
To provide advice and guidance on the conduct of the SIA to the Lower Hunter Regional Strategy, in particular:
• identification and engagement of other stakeholders;
• establishing the scope of the SIA – definitions, levels of evidence, principles, process for negotiation and decision making;
• development of the draft Social Impact Statement ;
• framing of the recommendations arising from the results of the SIA to the Department of Planning;
• committed to work within the bounds of the Confidentiality Agreement and respect the sensitive nature of the Lower Hunter Regional Strategy, and
• undertaking the process evaluation of the SIA.
Members
The Working Group will include representation from the following agencies:
i) Hunter New England Area Health Service
ii) Hunter Premier’s Department
iii) Department of Housing
iv) Department of Technical and Further Education
v) New South Wales Police
vi) Department of Community Services
vii) Department of Sport and Recreation
viii) Hunter Department of Planning (formerly DIPNR)
ix) Department of Primary Industries
x) NSW Department of Health.
xi) Department of Education
Responsibilities
1. Participate in Hunter SIA Working Group meetings – in person, by teleconference and/or prior feedback on key documents.
2. Undertake the screening and scoping steps of the Hunter SIA.
3. Use existing service delivery planning processes to both inform and to be informed about the Hunter SIA, as well being compatible with the LHRS.
4. Undertake the negotiation and decision making step of the Hunter SIA, and champion the process.
5. Facilitate presentation of the Social Impact Statement to Department of Planning and the Hunter Regional Co-ordination Group (RCMG).
6. To disseminate findings from the SIA to stakeholders/other agencies etc.
33

Meetings and Timeline
It is proposed that the Hunter SIA Working Group will meet up to 6 times during the course of the SIA: Meeting Overview
9 – 11.30 am
1st September
2005
o Overview of the Lower Hunter Strategy;
o endorse terms of reference;
o agreement on the parameters of social cohesion (definition &
components); and
o identification of key stakeholders.
9 – 11.30 am
14th September
2005
o Screening meeting;
o need to decide on the scope of the SIA - definitions, levels of
evidence, principles, process for negotiation and decision
making.
End October 2005 o Draft Scoping;
o progress review meeting – progress to date with the literature
review; content analysis.
Mid November
2005
o Draft report with recommendations;
o to undertake the negotiation & decision making step of the SIA;
o consideration of the draft Social Impact Statement; and
o develop and/or endorse recommendations as part of the SIA.
Mid December
2005
o Evaluation;
o progress report on the process evaluation of the SIA; and
o finalise any outstanding issues.
The venue for the face to face meetings will be at either:
Premiers Department Boardroom,
Level 4, 251 Wharf Road,
Newcastle
Department of State & Regional Development
Level 3, 251 Wharf Road
Newcastle
Out of session issues
Issues that arise out of session and may require member’s input, will be dealt with by emails circulated to all members by either Project Manager (Premiers) or Project Manager (Health).
34

3.3.8 Agreement on defining Key Terms, Principles and Values
3.3.8.1 Equity The Working Group agreed to conduct a SIA based on equity, identifying and assessing differential social impacts and making judgements about whether these potential differential social impacts will be, or are, inequitable. Equity was defined as being ‘fair and just’. The Working Group agreed to apply an ‘equity lens’ throughout the process of the SIA. The Working Group identified the need for a set of criteria, in order to apply the ‘equity lens’ when deciding if the impact of implementing the LHRS, whether negative or positive, is fair and just. HNEPH and the Hunter Premier’s Department developed an equity lens which was agreed upon by the Working Group. The suggested criterion was:
1. Stabilising or increasing the levels of advantage across the whole community, with particular attention to the population groups that are most vulnerable.
2. No creation or re-allocation of disadvantage among the existing or new populations. 3. The gap between the levels of advantage and disadvantage not to be widened, and
narrowed if possible.
3.3.8.2 Vulnerability The Working Group reviewed the draft definition of vulnerability used in the screening meeting, and agreed on the following.
How you define as a vulnerable population will vary according to location, time and circumstance. A vulnerable population can be defined as a subgroup of the overall population who are at higher risk of problem(s). They may be defined by age, gender, ethnicity, health status etc. Some examples of vulnerable populations are; children, economically disadvantaged and disabled, indigenous, elderly, culturally and linguistically diverse and people with mental illness. However we must remember to keep the concept of vulnerable groups flexible due to the broad reach of the Strategy. It can be summarised as the increase susceptibility to adverse social, economic, physical events, processes or actions.
An additional definition of vulnerability was added.
Vulnerability is the increase susceptibility to adverse social, economic, physical events, processes or actions 21.
The Working Group also posed some basic questions to help focus discussion around equity as discussed in the screening stage.
• Are we creating disadvantage? • Are we increasing disadvantage? • Are we re-allocating disadvantage?
35
3.4 Methodology for Obtaining Evidence
3.4.1 A Profile of the Communities and Population Groups affected by the Strategy
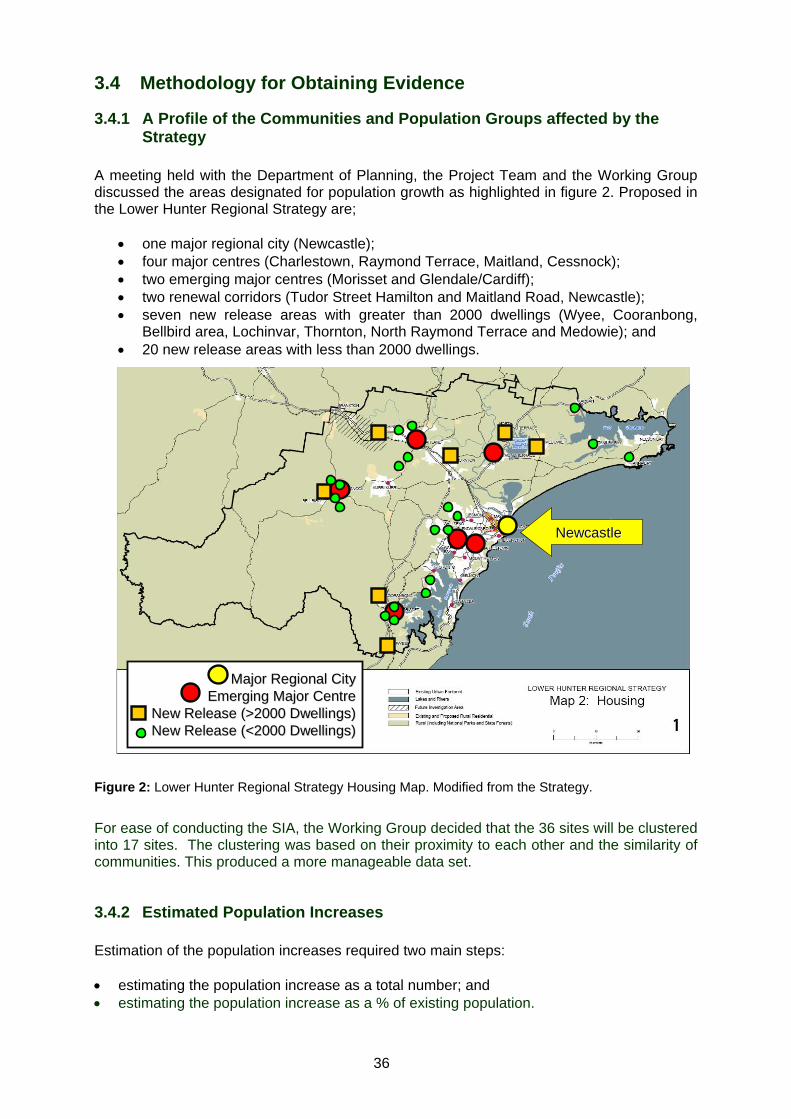
A meeting held with the Department of Planning, the Project Team and the Working Group discussed the areas designated for population growth as highlighted in figure 2. Proposed in the Lower Hunter Regional Strategy are;
• one major regional city (Newcastle); • four major centres (Charlestown, Raymond Terrace, Maitland, Cessnock); • two emerging major centres (Morisset and Glendale/Cardiff); • two renewal corridors (Tudor Street Hamilton and Maitland Road, Newcastle); • seven new release areas with greater than 2000 dwellings (Wyee, Cooranbong,
Bellbird area, Lochinvar, Thornton, North Raymond Terrace and Medowie); and • 20 new release areas with less than 2000 dwellings.
NewcastleNewcastle
Major Regional CityMajor Regional CityEmerging Major CentreEmerging Major Centre
New Release (>2000 Dwellings)New Release (>2000 Dwellings)New Release (<2000 Dwellings)New Release (<2000 Dwellings)
Figure 2: Lower Hunter Regional Strategy Housing Map. Modified from the Strategy.
For ease of conducting the SIA, the Working Group decided that the 36 sites will be clustered into 17 sites. The clustering was based on their proximity to each other and the similarity of communities. This produced a more manageable data set.
3.4.2 Estimated Population Increases Estimation of the population increases required two main steps: • estimating the population increase as a total number; and • estimating the population increase as a % of existing population.
36
Whilst the SIA was mostly concerned with population increase, much of the analysis for the draft Strategy was based on dwelling numbers as this was more relevant when trying to identify sufficient land and locations for housing. The draft Strategy plans for an estimated population increase of 125 000 people between 2006 and 2031 with a corresponding estimate of 95 000 dwellings being required. Due to changing occupancy ratios (number of people per dwelling) over time, there is not a linear relationship between the two. For example, approximately 1/3 of new dwellings are required to house current population at a lower occupancy ratio – regardless of population increase. Therefore the following formula was used to translate dwelling numbers into population increase
number of dwellings x 2.1 0.66
This was based on the assumption that each dwelling would contain 2.1 people (the forecast occupancy rate in 2031) but only 2/3 of the people (0.66) would be “new” people. This occupancy ratio would vary depending on the proportion of single-detached dwellings compared to multi-unit dwellings. The 0.66 would also vary depending on whether the area was predominantly greenfield (in which case the number would be higher) as opposed to predominantly urban consolidation (number would be lower). However, as this was a rapid SIA the nuances of demographics in each area were not investigated. Therefore the estimated population increase has been assumed using some very broad assumptions and should not be used as an accurate prediction of population increase in each area. The current population of areas proposed for increase was obtained by selecting the Census Collector Districts that:
a) overlapped or partially overlapped with areas proposed for population growth; and b) represented the adjoining urban area.
The reason for including (b) was that it gave a better indication of the existing population than just looking at (a) alone. For example, many greenfield areas are currently farmland and analysing the social issues for rural land users would be significantly different to adjacent urban areas. Since the SIA aim was primarily at social issues for the future urban areas, this data was seen as more relevant.
3.4.3 Collecting Evidence on Social Impacts Participating Working Group agencies were asked;
1. to identify performance indicators which indicate current vulnerability levels; 2. provide a brief literature review outlining the evidence of the relationship between
the identified indicators and their effect on social wellbeing; 3. to supply appropriate agency data associated with their identified indicators for each
of the 17 clustered sites; 4. to provide information on their agency’s current capacity within each of the 17
clustered sites; and 5. to provide information on their agency’s potential future capacity to absorb the
population growth in each of the 17 clustered sites. The indicators needed to be;
1. measurable at a collector district level, which is an Australian Bureau of Statistics (ABS) level based on approximately 200 households; and
37

2. with known links to vulnerability. The indicators need to be seen as key influences on social wellbeing that are shaped by urban planning.
Data pertaining to each indicator were submitted to the Centre of Urban and Regional Studies at the University of Newcastle (CURS). CURS, analysed both the agency data and additional ABS data to develop a scatter graph identifying where each of the 17 geographical sites sit in regards to their level of current vulnerability. This formed the basis for determining the level of impact. The data was standardised by CURS and graphed to show the relative positions of the sites for each of the indicators submitted by each department. A standardised measure for Socio-Economic Index for Area (SEIFA)i was also added to indicate relative disadvantage. Any indicator below the zero point was considered to indicate areas of vulnerability for each site. CURS also displayed these standardised data on projected population increases for each site.
i SEIFA is a number of Socio-Economic Indexes from the 2001 Census of Population and Housing which allows the ranking of regions and areas. This provides a method of determining the level of social and economic well being in that region.
38

3.5 Planning an Evaluation The Project Team proposed that an evaluation of the SIA process would occur in February 2006. The evaluation would be based on progress against the agreed goals, objectives and strategies and be the responsibility of the Project Team.
39

40
41
Chapter 4
Recommendations
Report
Morpeth.

42

4 Recommendation Report
4.1 Background to this Chapter This chapter gives a brief overview of the contents of the Social Impact Statement submitted to the Department of Planning on the 20 January 2006. The modified report is in Appendix 4. The modified report varies from the report submitted to the Department of Planning in two ways. Firstly, as agreed upon by the Working Group, data in this document has been de-identified for reasons of confidentiality. Table 8 is a legend outlining the de-identified data codes. Table 8: Legend for data
Site 1 through to Site 17 Proposed Development Areas
As outlined in the Strategy
Site A through to Site RR Existing Suburbs, Cities and Local Government Areas
Sites numbered Site 1 to Site 17 were sites proposed for population growth examined in the Strategy. These sites were the focus of the SIA. Sites referred to by letters, Site A through to Site RR, are existing areas which were not directly discussed in the Strategy. In addition, only three examples of specific site recommendations have been included in this chapter. The expected population and dwelling increases have also been de-identified. These are displayed as a range. Secondly, for brevity, only three examples of site based recommendations are included in section 4.6; a low vulnerability site; medium vulnerability site; and high vulnerability site. The Social Impact Statement Report submitted to the Department of Planning reported on all 17 geographical sites. This is in appendix 4. This chapter contains extracts from the final modified report. The extracts include the analysis and interpretation of impacts, and the recommendations. Sections not included are replicated elsewhere in the screening or scoping chapters. Appendix 4 contains the modified report in its entirety to demonstrate the content of the report submitted to the Department of Planning.
4.2 Purpose of the Recommendation Report The purpose of the recommendation report is to communicate both the process and outcome of the impact assessment, particularly to those who will make the final decision regarding the proposal. Recommendations should:
• highlight the practical ways in which the policy should be strengthened or changed to maximise (potential) social and health gains and minimize harmful effects on the wellbeing of the population or specific groups within the population;
• be solution focused; • be achievable;
43
• be prioritised; • acknowledge all those who have been part of the process; • review and approved by all working group members; and • provide appropriate evidence to support each recommendation, where available9;25.
Each of these issues needs to be presented in a clear and concise report that highlights the potential impacts, the changes that are needed. Producing a concise report or engaging decision makers in the impact assessment process are suggested ways that increase the likelihood of decision makers adopting recommendations10. For more information about reporting recommendations see 19;26.
4.2.1 Issues addressed in the Recommendations Report The recommendations and the report were guided by the following considerations19;
• Who are likely to be affected by the proposal? o Who may benefit? o Who may suffer?
• What steps could change the Strategy? o What steps could mitigate the negative social impacts? o What steps could strength the positive social impacts?
• How will the recommendations be conveyed to decision makers?
o In a report? o In a presentation?
• Are recommendations going to be made only to decision makers? o Can recommendations be made to other stakeholders?
44

4.3 Social Impact Statement The report was finalised in January 2006, by the Hunter RCMG Social Impact Assessment Working Group. Table 9 is the table of contents for the Social Impact Statement. Section 1, the executive summary gives an overview of the SIA process as well as outlining the recommendations made for each site. Section 2 and 3 provide a background to the project, highlighting the rationale and objectives for the RCMG to conduct a SIA. These sections also note the steps involved in the SIA. Section 4 outlines how the Working Group was established, and provides a brief overview of the screening, scoping and impact identification stage. Section 5 graphically displays the analysis and interpretation of results. Section 6 replicates the recommendations previously discussed in the executive summary, with section 7 providing contact details for the Project Team.
45

Table 9: Table of contents of the Social Impact Statement
Table of Contents Acknowledgements .............................................................................................................21 Executive Summary ......................................................................................................32 Introduction .................................................................................................................10
2.1 Background ........................................................................................................ 10
2.2 Project objectives................................................................................................ 10
3 What is a Social Impact Assessment?.......................................................................113.1 What is a Social Impact Assessment? ................................................................ 11
4 Methodology................................................................................................................134.1 Working Group established................................................................................. 13
4.2 Screening Stage ................................................................................................. 13
4.2.1 The Purpose of Screening .................................................................................. 13
4.3 Scoping Stage .................................................................................................... 17
4.3.1 The Purpose of Scoping ..................................................................................... 17
4.3.2 Scoping Process................................................................................................. 17
4.4 Identification and Assessment of Social Impacts................................................. 18
4.4.1 A profile of the communities and population groups affected by the proposal ..... 18
4.4.2 Estimated population increases .......................................................................... 18
4.4.3 Identification of potential social impacts .............................................................. 19
4.4.4 Evidence for identified impacts ........................................................................... 20
5 Analysis of Impacts and Interpretation......................................................................246 Recommendations ......................................................................................................297 Further Information .....................................................................................................348 References...................................................................................................................359 Appendices..................................................................................................................37
9.1 Appendix 1: Detailed Analysis of Potential Impacts............................................. 37
46
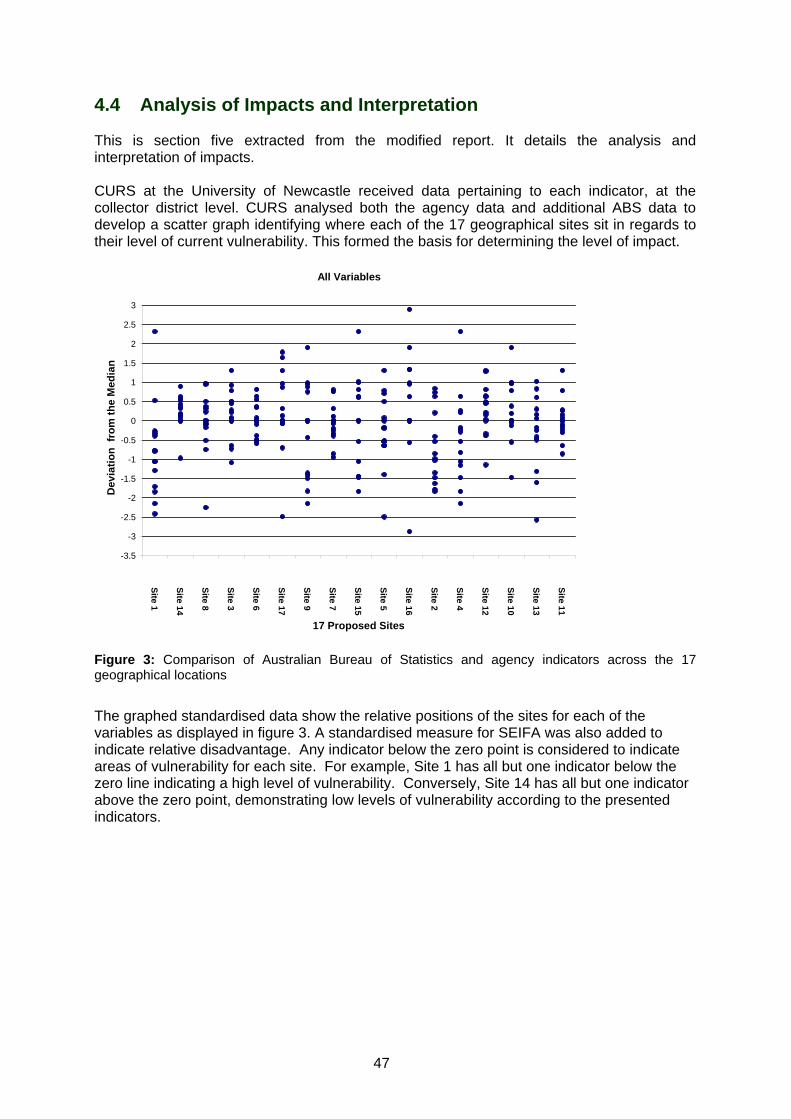
4.4 Analysis of Impacts and Interpretation This is section five extracted from the modified report. It details the analysis and interpretation of impacts. CURS at the University of Newcastle received data pertaining to each indicator, at the collector district level. CURS analysed both the agency data and additional ABS data to develop a scatter graph identifying where each of the 17 geographical sites sit in regards to their level of current vulnerability. This formed the basis for determining the level of impact.
All Variables
-3.5
-3
-2.5
-2
-1.5
-1
-0.5
0
0.5
1
1.5
2
2.5
3
Site 1
Site 14
Site 8
Site 3
Site 6
Site 17
Site 9
Site 7
Site 15
Site 5
Site 16
Site 2
Site 4
Site 12
Site 10
Site 13
Site 11
17 Proposed Sites
Dev
iatio
n fr
om th
e M
edia
n
Figure 3: Comparison of Australian Bureau of Statistics and agency indicators across the 17 geographical locations
The graphed standardised data show the relative positions of the sites for each of the variables as displayed in figure 3. A standardised measure for SEIFA was also added to indicate relative disadvantage. Any indicator below the zero point is considered to indicate areas of vulnerability for each site. For example, Site 1 has all but one indicator below the zero line indicating a high level of vulnerability. Conversely, Site 14 has all but one indicator above the zero point, demonstrating low levels of vulnerability according to the presented indicators.
47

Key Variables
-3.5
-3
-2.5
-2
-1.5
-1
-0.5
0
0.5
1
1.5
2
Site 1
Site 14
Site 8
Site 3
Site 6
Site 17
Site 9
Site 7
Site 15
Site 5
Site 16
Site 2
Site 4
Site 12
Site 10
Site 13
Site 11
17 Proposed Sites
Dev
iatio
n fr
om th
e M
edia
n
Figure 4: Comparison of six key Australian Bureau of Statistics and agency indicators across the 17 geographical locations A simpler version of figure 3 was generated using only one variable from each of the domains; health, education, transport, social capital, disadvantage and housing. This represents similar patterns of vulnerability as shown in Figure 4. Table 10: Standardised aggregated vulnerability scores for the 17 geographical locations
Site Standard Score Aggregate
Site 1 -1.65 Site 14 0.87 Site 8 0.09 Site 3 -0.13 Site 6 -0.03
Site 17 0.99 Site 9 -1.94 Site 7 -0.63
Site 15 0.98 Site 5 -1.60
Site 16 0.32 Site 2 -1.89 Site 4 -0.23
Site 12 0.88 Site 10 0.00 Site 13 0.27 Site 11 0.10
48
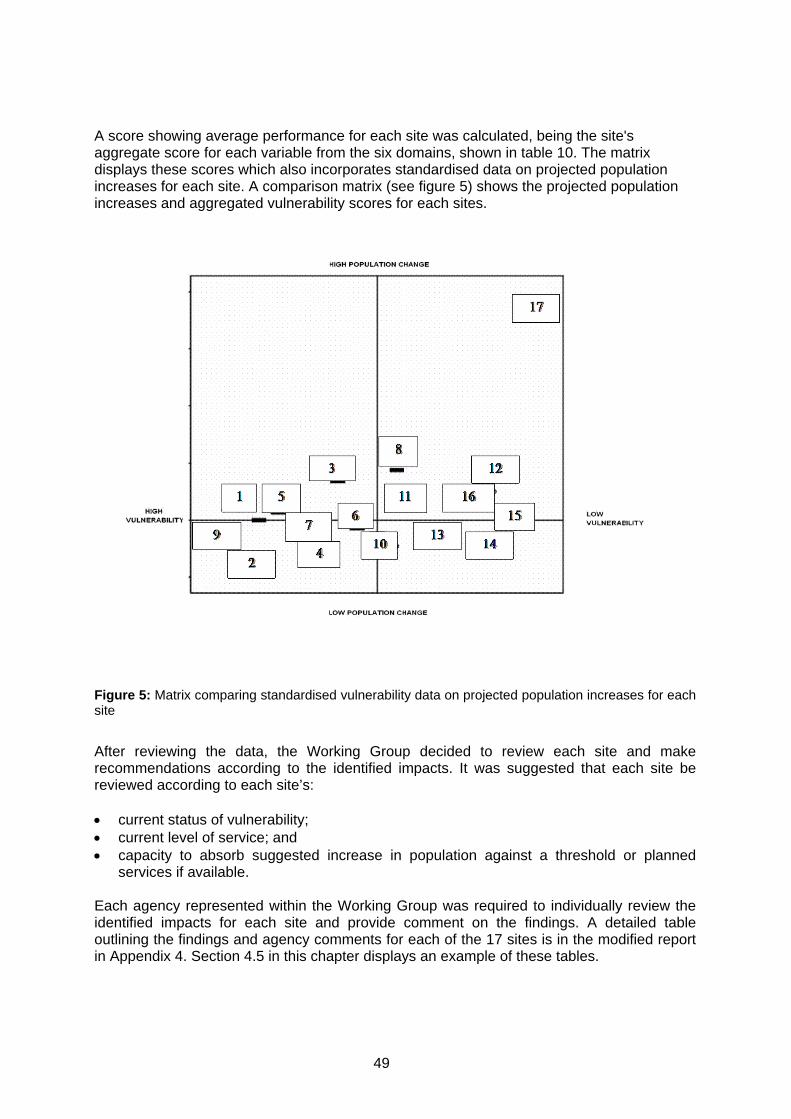
A score showing average performance for each site was calculated, being the site's aggregate score for each variable from the six domains, shown in table 10. The matrix displays these scores which also incorporates standardised data on projected population increases for each site. A comparison matrix (see figure 5) shows the projected population increases and aggregated vulnerability scores for each sites.
Figure 5: Matrix comparing standardised vulnerability data on projected population increases for each site
After reviewing the data, the Working Group decided to review each site and make recommendations according to the identified impacts. It was suggested that each site be reviewed according to each site’s: • current status of vulnerability; • current level of service; and • capacity to absorb suggested increase in population against a threshold or planned
services if available. Each agency represented within the Working Group was required to individually review the identified impacts for each site and provide comment on the findings. A detailed table outlining the findings and agency comments for each of the 17 sites is in the modified report in Appendix 4. Section 4.5 in this chapter displays an example of these tables.
49

4.5 Example of Agency comments This section displays three examples of site based agency comments and recommendations. It includes a low vulnerability site; medium vulnerability site; and a high vulnerability site. As previously discussed, the Social Impact Statement Report submitted to the Department of Planning reported on all 17 geographical sites.
50

4.5.1 Example 1: A currently low level vulnerability site SITE 14: New urban release in the vicinity of Site 14 STEP 1: Background Background Estimated population increase
0 - 2500
% Population change
27%
Total population
Expected increase in number of dwellings
2000 - 3000
Type of proposed dwelling • Proposed single detached • Proposed multi-unit
2,000 (100%)
STEP 2: Vulnerability levels based on key performance indicators (as outlined figure 3, page 24) Performance Indicator Level of current
vulnerability
Transport
• Access to bus & train
Housing
• Home ownership
Health
• Smoking in mothers
Public School Education
• Retention rates
Employment
• Unemployment rate
Community Capacity
• Volunteer rate (sporting)
Overall Disadvantage
• SEIFA Low
leve
l of v
ulne
rabi
lity
51

STEP 3: CAPACITY OF CURRENT SERVICES TO ABSORB PROPOSED GROWTH TRANSPORT 3
Current Situation: • Site 14 is on the commercial contract area of Newcastle State Transit Authority buses and has connections to numerous suburban
locations. • Private bus operators including a number of bus companies also run services to Site 14. • The area has good cross regional connectivity. • No train services in Site 14. Future Situation: • Some park and ride commuting from Site 6 may be occurring. PUBLIC HOUSING
Current Situation: • Current Department of Housing stock of 62 properties. Future Situation: • Department of Housing is considering redeveloping some detached cottages to supply more 1 and 2 bedroom apartment/multi-unit sites
for public housing – leading to a modest increase in public housing (target result 150 units in 10 years). HEALTH SERVICES
Current Situation: • Nearest health services is Site N Hospital. • Nearest community Health Centre is Site U. • Nearest General Practitioner Access After Hours is Site N Hospital. Future Situation: • There would be no anticipated problem in supporting the development, as the existing health infrastructure is well established and
comprehensive.
52
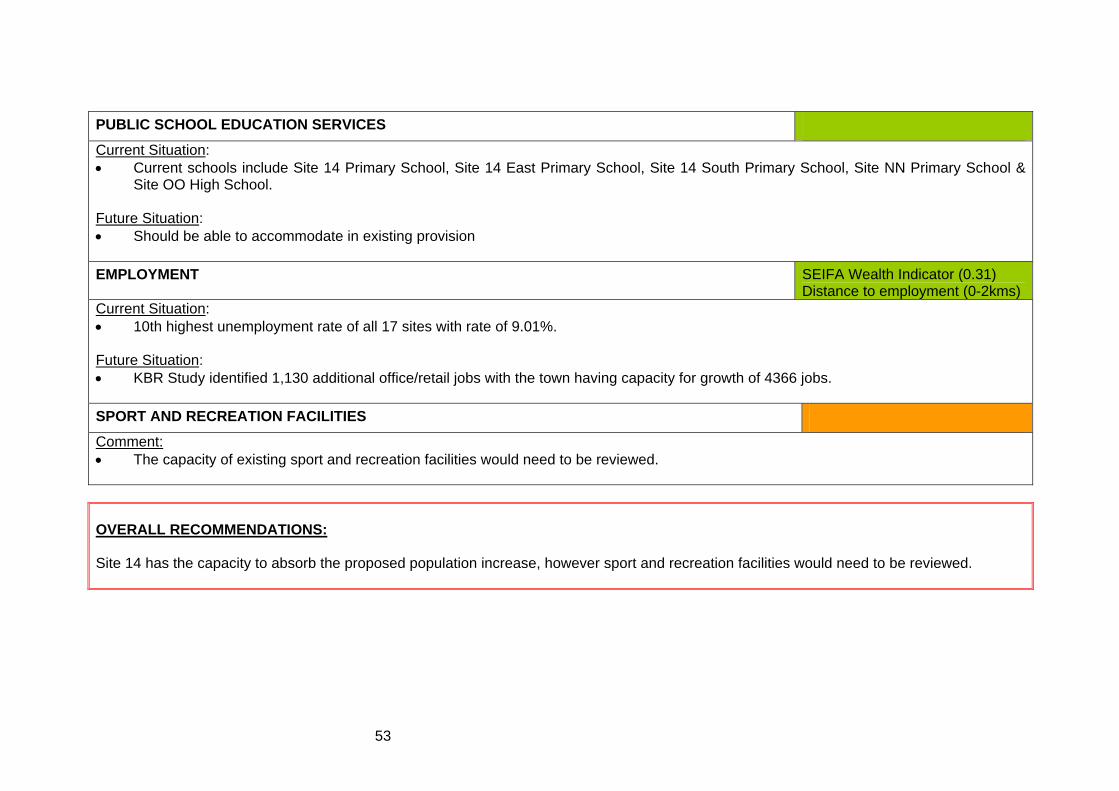
PUBLIC SCHOOL EDUCATION SERVICES
Current Situation: • Current schools include Site 14 Primary School, Site 14 East Primary School, Site 14 South Primary School, Site NN Primary School &
Site OO High School. Future Situation: • Should be able to accommodate in existing provision EMPLOYMENT SEIFA Wealth Indicator (0.31)
Distance to employment (0-2kms) Current Situation: • 10th highest unemployment rate of all 17 sites with rate of 9.01%. Future Situation: • KBR Study identified 1,130 additional office/retail jobs with the town having capacity for growth of 4366 jobs. SPORT AND RECREATION FACILITIES
Comment: • The capacity of existing sport and recreation facilities would need to be reviewed. OVERALL RECOMMENDATIONS: Site 14 has the capacity to absorb the proposed population increase, however sport and recreation facilities would need to be reviewed.
53

4.5.2 Example 2: A currently medium level vulnerable site SITE 10: New urban renewal areas in the vicinity of Site II STEP 1: Background Background Estimated population increase
2500 - 5000
% Population change
46%
Total population
Expected increase in number of dwellings
2000 - 3000
Type of proposed dwelling • Proposed single detached • Proposed multi-unit
2,000 (100%)
STEP 2: Vulnerability levels based on key performance indicators Performance Indicator Level of current
vulnerability
Transport
• Access to bus & train
Housing
• Home ownership
Health
• Smoking in mothers
Public School Education
• Retention rates
Employment
• Unemployment rate
Community Capacity
• Volunteer rate (sporting)
Overall Disadvantage
• SEIFA
Med
ium
leve
l of
vuln
erab
ility
54
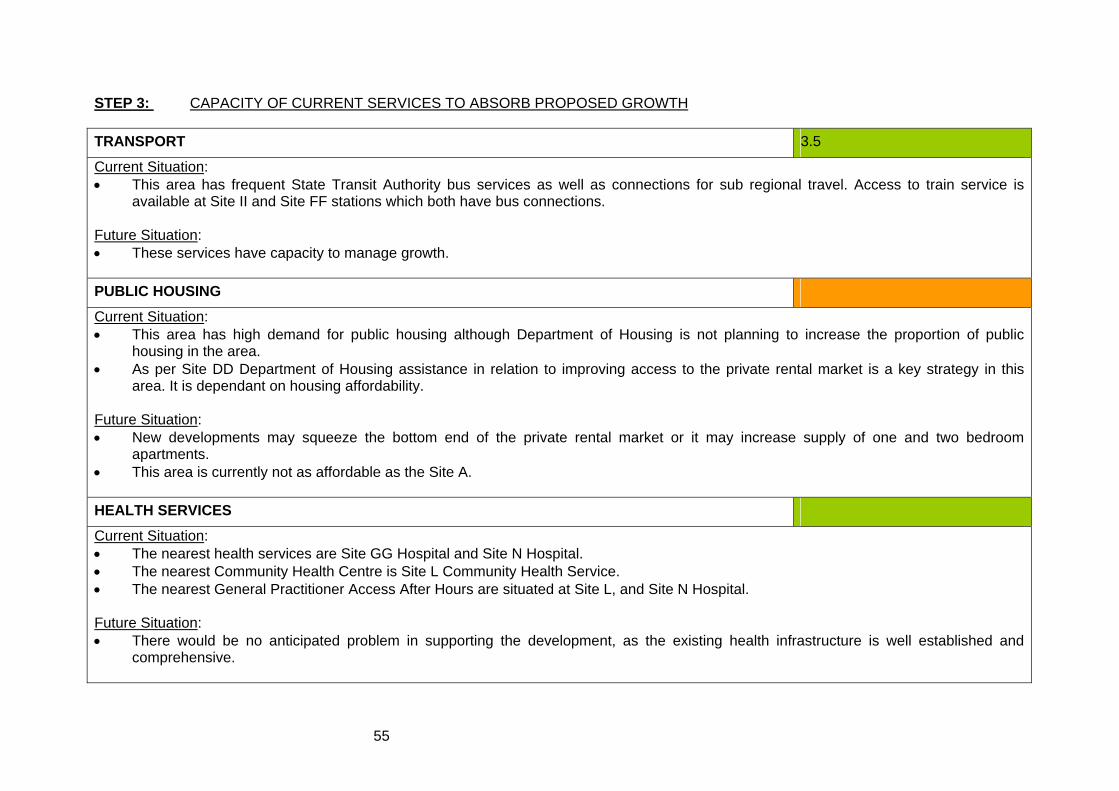
STEP 3: CAPACITY OF CURRENT SERVICES TO ABSORB PROPOSED GROWTH TRANSPORT 3.5
Current Situation: • This area has frequent State Transit Authority bus services as well as connections for sub regional travel. Access to train service is
available at Site II and Site FF stations which both have bus connections. Future Situation: • These services have capacity to manage growth. PUBLIC HOUSING
Current Situation: • This area has high demand for public housing although Department of Housing is not planning to increase the proportion of public
housing in the area. • As per Site DD Department of Housing assistance in relation to improving access to the private rental market is a key strategy in this
area. It is dependant on housing affordability. Future Situation: • New developments may squeeze the bottom end of the private rental market or it may increase supply of one and two bedroom
apartments. • This area is currently not as affordable as the Site A. HEALTH SERVICES
Current Situation: • The nearest health services are Site GG Hospital and Site N Hospital. • The nearest Community Health Centre is Site L Community Health Service. • The nearest General Practitioner Access After Hours are situated at Site L, and Site N Hospital. Future Situation: • There would be no anticipated problem in supporting the development, as the existing health infrastructure is well established and
comprehensive.
55

PUBLIC SCHOOL EDUCATION SERVICES
Current Situation: • Current schools include Site FF North Primary School, Site FF South Primary School, Site JJ Primary School, Site II School. Future Situation: • Site limitation for two Primary School –need for additional Primary School. EMPLOYMENT SEIFA Wealth Indicator (-1.44)
Distance to employment (0-2kms) Current Situation: • 5th highest unemployment rate of all 17 sites with rate of 12.4%. Future Situation: • KBR study identified Site FF to Site KK corridor had potential additional jobs of 932 with actual capacity for growth of 1,594 jobs. • Potential access to industrial employment opportunities around the Port and Steel River. SPORT AND RECREATION FACILITIES
Comment: • The capacity of existing sport and recreation facilities would need to be reviewed. OVERALL RECOMMENDATIONS: Site 10 is currently experiencing medium to low levels of vulnerability. Existing services within the Site 10 have the capacity to absorb the proposed growth, however require:
- consideration of housing affordability; - a review of current educational facilities; - a review of current sport and recreation facilities.
56
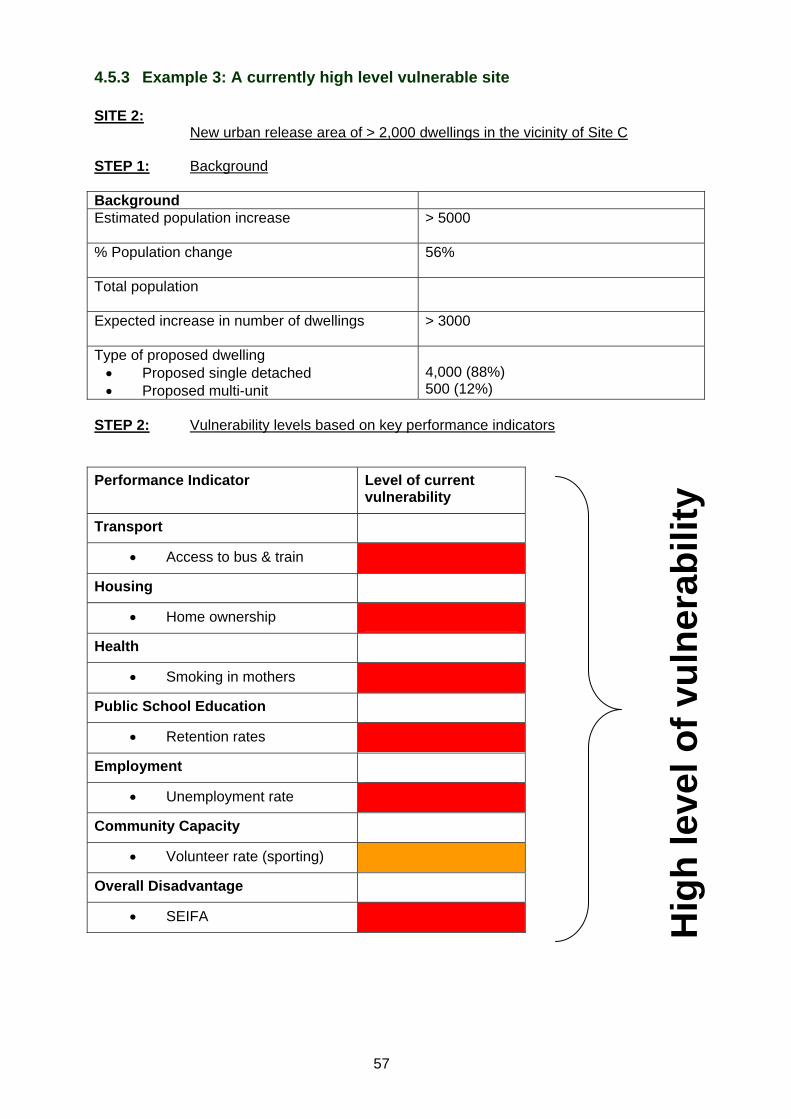
4.5.3 Example 3: A currently high level vulnerable site SITE 2: New urban release area of > 2,000 dwellings in the vicinity of Site C STEP 1: Background Background Estimated population increase
> 5000
% Population change
56%
Total population
Expected increase in number of dwellings
> 3000
Type of proposed dwelling • Proposed single detached • Proposed multi-unit
4,000 (88%) 500 (12%)
STEP 2: Vulnerability levels based on key performance indicators Performance Indicator Level of current
vulnerability
Transport
• Access to bus & train
Housing
• Home ownership
Health
• Smoking in mothers
Public School Education
• Retention rates
Employment
• Unemployment rate
Community Capacity
• Volunteer rate (sporting)
Overall Disadvantage
• SEIFA Hig
h le
vel o
f vul
nera
bilit
y
57

STEP 3: CAPACITY OF CURRENT SERVICES TO ABSORB PROPOSED GROWTH TRANSPORT SERVICES 0.5
Current Situation: • A Coaches company hold the commercial contract for Site C. • There may be other operators who have a commercial interest in this area such, as they provide school services through this area. • No train services in this area however, there are both Countrylink Coaches and also Long Distance Coach operators on Highway Future Situation: • Transport services / corridors for Site 2 needs to be identified to ensure access to services and jobs. PUBLIC HOUSING
Current Situation: • The majority of current public housing in this area is detached three bedroom cottages. • Access to support services for Department of Housing clients is limited. Future Situation: • Any future Department of Housing purchases or re-developments are likely to be duplex/unit style to cater for seniors. • Department of Housing is not proposing any increase in Department of Housing stock in Site C in the next 10 years. However, are looking
to diversify ownership internal to Department of Housing, housing estates through selective redevelopment and sales. HEALTH SERVICES
Current Situation: • Currently, Site C has a Community Health Centre. • The nearest hospital services are located at Site M (Community hospital 12 beds) 40km away, Site L 40 km away and Site A 50 km away. • Nearest General Practitioner Access After Hours are situated at Site A Hospital, Site N Hospital and Site L Community Health Centre. • Site C is also known to have a significant population of socio-economic disadvantage which impacts on public health service provision. Future Situation: • With the estimated increase in population Hunter New England Area Health Service would need to perform a comprehensive review to
identify the health needs of the population. This is influenced by the existing lack of infrastructure in Site C.
58
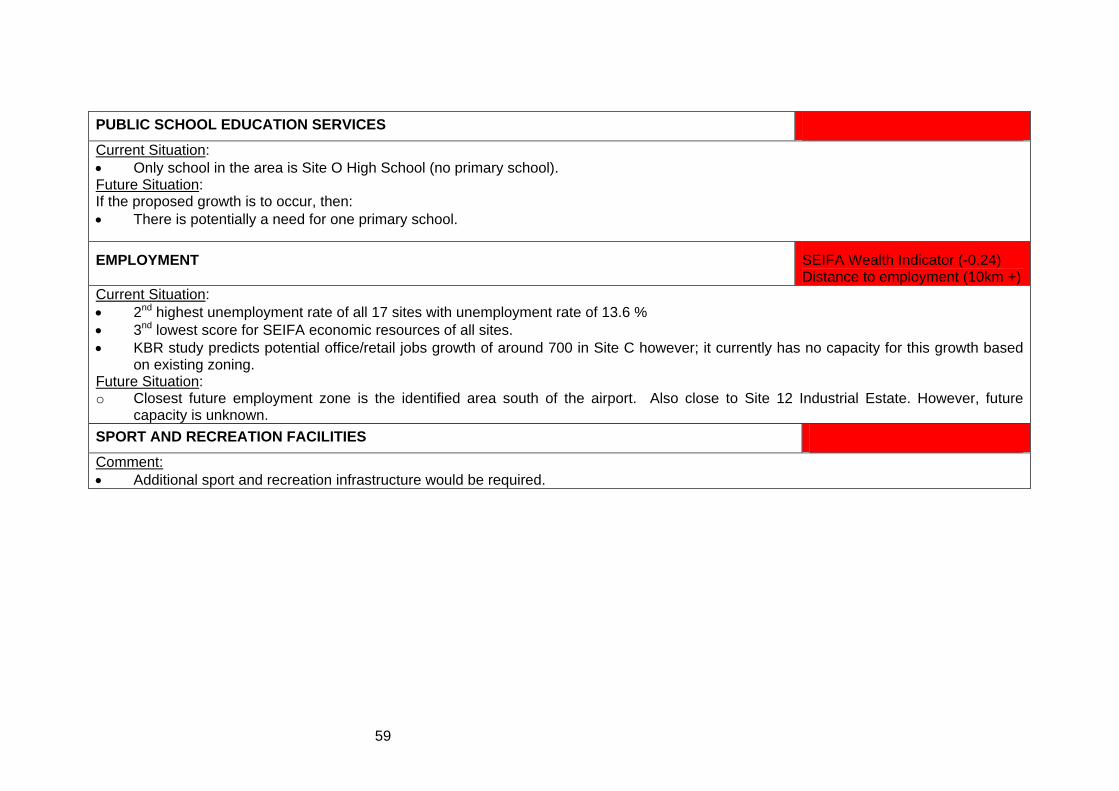
PUBLIC SCHOOL EDUCATION SERVICES
Current Situation: • Only school in the area is Site O High School (no primary school). Future Situation: If the proposed growth is to occur, then: • There is potentially a need for one primary school.
EMPLOYMENT SEIFA Wealth Indicator (-0.24) Distance to employment (10km +)
Current Situation: • 2nd highest unemployment rate of all 17 sites with unemployment rate of 13.6 % • 3nd lowest score for SEIFA economic resources of all sites. • KBR study predicts potential office/retail jobs growth of around 700 in Site C however; it currently has no capacity for this growth based
on existing zoning. Future Situation: o Closest future employment zone is the identified area south of the airport. Also close to Site 12 Industrial Estate. However, future
capacity is unknown. SPORT AND RECREATION FACILITIES
Comment: • Additional sport and recreation infrastructure would be required.
59

OVERALL RECOMMENDATIONS: Site 2 has high levels of vulnerability. Based on existing services, there is limited capacity for Site 2 to absorb the proposed population growth. Access to essential services such as public housing and health is poor, with limited transport and employment options. To enable the proposed population growth to occur Site 2 would require:
- better direct transport links with major centres such as Site A and Site 16; - improved transport access to Site 12, Site C plus the proposed Intermodal Freight facility (the employment zone identified in the
Regional Strategy) would lead to greater access to employment opportunities; - increased access to education, health and housing services; - increased sport and recreation infrastructure; - increased employment opportunities identified in the Site C area.
From these summary pages, site recommendations were formulated and presented to the Department of Planning, as outlined in Section 4.5.
60

4.6 Recommendations This is section six extracted from the modified report. It outlines the recommendations submitted to the Department of Planning. New release areas proposed for less than 2,000 dwellings.
Site 4 Site 4 is an isolated community with medium levels of vulnerability.
There is currently poor access to health services, education, employment and transport links. There is limited capacity within existing services to absorb the proposed population growth. There are also concerns of further impacting on the existing problems experienced in a near by site. To enable the proposed population growth to occur Site 4 would require:
- a review of all infrastructure and access to services; - identification of and access to employment opportunities.
New release areas proposed for more than 2,000 dwellings
Site 1 Site 1 has high levels of vulnerability. Based on current levels of service,
to enable the proposed population growth Site 1 would require: - improved transport links to major centre, especially to the
employment zone near Site B; - increased access to General Practitioners; - one additional primary school and one additional high school; - review of sport and recreation facilities.
Roads and public transport are key issues to be addressed to enable employment growth opportunities. It is also recommended that consolidation close to Site 1 should occur, rather than solely relying on Greenfield sites for growth.
Site 2 Site 2 has high levels of vulnerability. Based on existing services, there
is limited capacity for Site 2 to absorb the proposed population growth. Access to essential services such as public housing and health is poor, with limited transport and employment options. To enable the proposed population growth to occur Site 2 would require:
- better direct transport links with major centres (Site A and Site 16); - improved transport access to employment opportunities such as
Intermodal Freight facility (the employment zone identified in the Regional Strategy) would lead to greater access to employment opportunities;
- increased access to education, health and housing services; - increased sport and recreation infrastructure; - increased employment opportunities identified in the Site C area.
61

Site 3 Site 3 is an isolated community with medium levels of vulnerability.
Existing services within the Site 3 area have the capacity to absorb the proposed growth, however require:
- transport improvement (connection to major centres); - improved health service options particularly from the major centre; - greater access to major employment zones in the Site 5 areas; - improved transport to access Site D Employment Zone; - additional educational facilities.
Site 5 Site 5 is currently an isolated community with medium levels of
vulnerability. There is currently limited public transport and access to employment options. However, with improved transport links Site 5 has the capacity to absorb an increase in population for both housing and education services. To enable the proposed population growth to occur Site 5 would require:
- a review of access to health services by both Hunter New England Areas Health Service and Northern Sydney Central Coast Area Health Service;
- a review of employment lands, in addition to the opportunities that have already been identified, in retail/commercial jobs in a major centre;
- improved transport options to better access employment opportunities in the major centre Employment Zone;
- additional sport and recreation infrastructure.
Site 6 The Site 6 area has medium levels of vulnerability, however, the current
agencies servicing the area have the capacity to absorb the proposed increased population with the exception of health and education. A review of health services and sport and recreation facilities would be required. Additional education facilities would be required.
Site 7 Site 7 is experiencing medium levels of vulnerability. The current
services for Site 7 can absorb an increased population growth, however require:
- improved transport options, particularly to a major employment centres such as Site B; - additional education facilities; - a review of employment opportunities; - a review of sport and recreation facilities.
Employment opportunities in office/retail jobs have been identified for the Site A Regional Centre. In relation to Site 7, access to employment needs to be reviewed to identify further employment zones. The
62
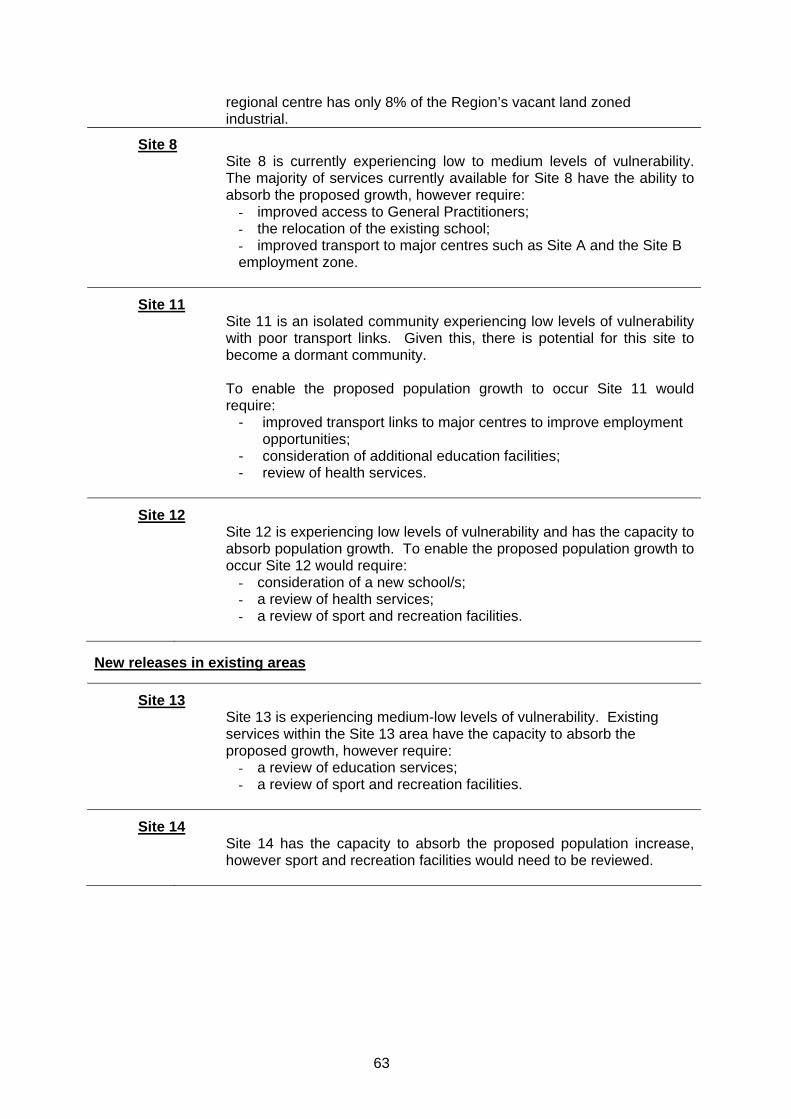
regional centre has only 8% of the Region’s vacant land zoned industrial.
Site 8 Site 8 is currently experiencing low to medium levels of vulnerability.
The majority of services currently available for Site 8 have the ability to absorb the proposed growth, however require:
- improved access to General Practitioners; - the relocation of the existing school; - improved transport to major centres such as Site A and the Site B employment zone.
Site 11 Site 11 is an isolated community experiencing low levels of vulnerability
with poor transport links. Given this, there is potential for this site to become a dormant community. To enable the proposed population growth to occur Site 11 would require:
- improved transport links to major centres to improve employment opportunities;
- consideration of additional education facilities; - review of health services.
Site 12 Site 12 is experiencing low levels of vulnerability and has the capacity to
absorb population growth. To enable the proposed population growth to occur Site 12 would require:
- consideration of a new school/s; - a review of health services; - a review of sport and recreation facilities.
New releases in existing areas
Site 13 Site 13 is experiencing medium-low levels of vulnerability. Existing
services within the Site 13 area have the capacity to absorb the proposed growth, however require:
- a review of education services; - a review of sport and recreation facilities.
Site 14 Site 14 has the capacity to absorb the proposed population increase,
however sport and recreation facilities would need to be reviewed.
63
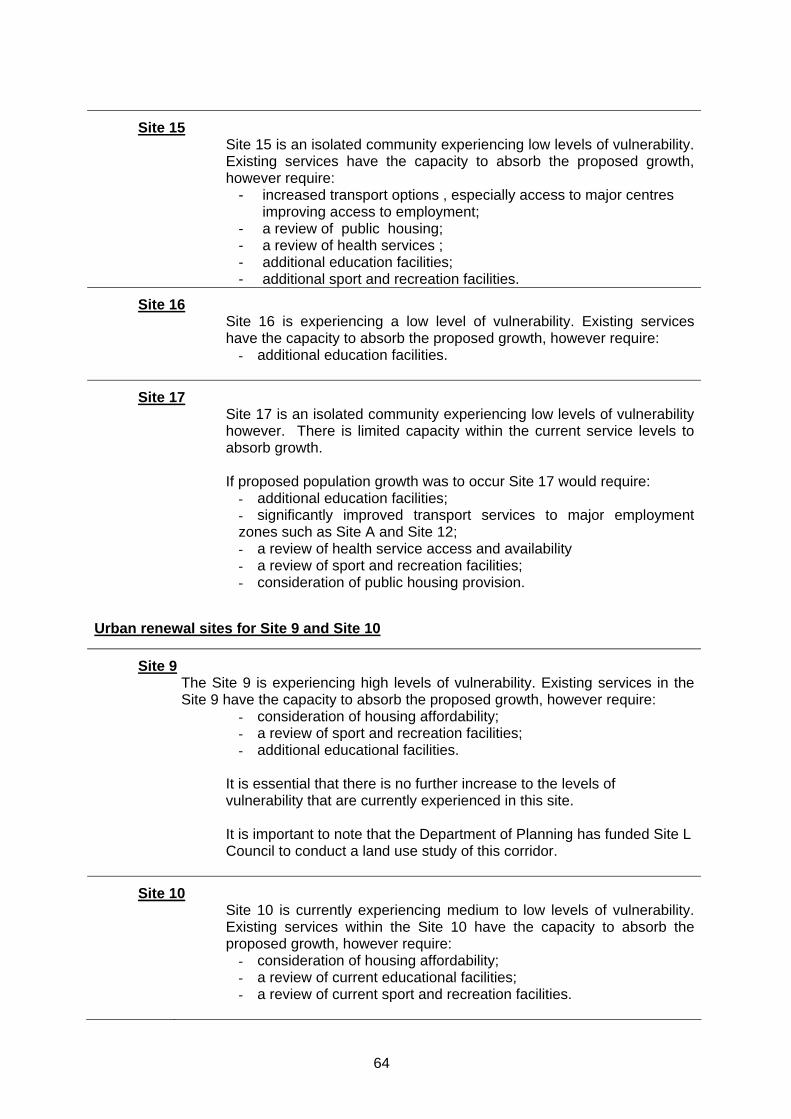
Site 15 Site 15 is an isolated community experiencing low levels of vulnerability.
Existing services have the capacity to absorb the proposed growth, however require:
- increased transport options , especially access to major centres improving access to employment;
- a review of public housing; - a review of health services ; - additional education facilities; - additional sport and recreation facilities.
Site 16 Site 16 is experiencing a low level of vulnerability. Existing services
have the capacity to absorb the proposed growth, however require: - additional education facilities.
Site 17 Site 17 is an isolated community experiencing low levels of vulnerability
however. There is limited capacity within the current service levels to absorb growth. If proposed population growth was to occur Site 17 would require:
- additional education facilities; - significantly improved transport services to major employment zones such as Site A and Site 12; - a review of health service access and availability - a review of sport and recreation facilities; - consideration of public housing provision.
Urban renewal sites for Site 9 and Site 10
Site 9 The Site 9 is experiencing high levels of vulnerability. Existing services in the
Site 9 have the capacity to absorb the proposed growth, however require: - consideration of housing affordability; - a review of sport and recreation facilities; - additional educational facilities.
It is essential that there is no further increase to the levels of vulnerability that are currently experienced in this site. It is important to note that the Department of Planning has funded Site L Council to conduct a land use study of this corridor.
Site 10 Site 10 is currently experiencing medium to low levels of vulnerability.
Existing services within the Site 10 have the capacity to absorb the proposed growth, however require:
- consideration of housing affordability; - a review of current educational facilities; - a review of current sport and recreation facilities.
64

Chapter 5
Evaluation
Report
King Edward Park, East Maitland.
65

66

5 Evaluation Report
5.1 Background to this Chapter This chapter summarises the process evaluation conducted on the impact assessment on the Lower Hunter Regional Strategy. At the time of publication of this report, the final Lower Hunter Regional Strategy had not been released, and therefore no impact evaluation or outcome evaluation had been conducted.
5.2 Purpose of the Evaluation Stage The purpose of the evaluation is to reflect upon and determine the effectiveness of the impact assessment. It is a process which can:
• provide evidence which can enhance practice; • provide information for future practitioners; and • build the knowledge base for impact assessments 27.
There are three types of evaluations that are relevant to impact assessments. These are:
• process evaluation; • impact evaluation; and • outcome evaluation.
Process evaluation evaluates how the impact assessment was undertaken. It examines whether the impact assessment process had been effectively completed 28. This type of evaluation helps other practitioners learn from other’s experience of conducting an impact assessment 27. Impact evaluation examines whether the recommendations made by the impact assessment were taken on board and implemented by the decision makers 19. Outcome evaluation reflects upon whether the changes made to a proposal made a difference to the health and social wellbeing of the population. However, this is often a challenging process due to the complex, multi-causal pathways and long timeframes required to monitor social and health impacts 19.
5.2.1 Issues addressed in the Evaluation The process evaluation report was guided by the following questions 9;19;
• Were the aims and objectives of the impact assessment met? • What did those involved think about in the process? • What were the strengths of the process? • What were the challenges of the process? • What changes could be made to improve the process? • Were resources and time used efficiently?
67

5.3 Evaluation Methodology The objectives for the evaluation of the Strategy SIA process were:
- to document and report on the SIA process; - to gauge perception of the SIA Process among Working Group members; - to assess the perceived usefulness of the SIA process overall; and - to provide recommendations for future SIA processes.
To ensure the objectives of the evaluation could be met, a mix of methodologies was used. Method 1: Working Group Survey A survey was sent via email to all members of the Working Group in late January of 2006. See appendix 5 for evaluation survey. This survey could be completed either on their computer and returned by email or printed out and completed. The survey collected Working Group and Project Team member’s perceptions of the SIA process, including: its perceived representativeness, effectiveness and usefulness. The survey data was collated and frequency distributions produced. Of the 15 questionnaires that were sent to Working Group members, 10 were returned equally a 67% response rate. Method 2: Analysis of SIA Process documentation A detailed review and analysis of all SIA process documentation was undertaken. This included a review of:
• agenda and minutes of each meeting; • screening document; and the • scoping document.
68

5.4 Summary of Key Findings Key findings of the survey were as follows:
- 90% of participants agreed or strongly agreed that, ‘Working Group members were willing to share ideas, resources and influence to fulfil the aims’; that ‘Working Group members were dedicated to what the Group was trying to achieve’; that ‘time spent in meetings were used efficiently’; and that ‘the requirements of my agency were appropriate’.
- 100% of participants responded that, ‘the meetings were useful’. - 90% of participants responded that, ‘length of the SIA was too short’. - 90% of participants responded that, ‘their agency benefited from the SIA process’. - 90% of participants agreed or strongly agreed that working on the Lower Hunter
Regional Strategy was rewarding. - 50% of participants disagreed that, ‘there was sufficient time to share ideas with
other agencies’; and only 60% agreed or strongly agreed that, ‘all Working Group members were involved in planning and setting priorities for collaborative action’.
- 78% of participants were satisfied or very satisfied with the overall SIA process. Perceptions of the SIA process were predominantly positive. However, a few respondents felt that not all Working Group members contributed throughout the process and more time to undertake the SIA would have been beneficial.
69

5.5 Evaluation Findings
5.5.1 Evaluation of the Social Impact Assessment Working Group A Working Group representing the RCMG was formed with the following brief.
To provide advice and guidance on the conduct of the SIA to the Lower Hunter Regional Strategy, in particular:
- identification and engagement of other stakeholders;
- establishing the scope of the SIA – definitions, levels of evidence, principles, process for negotiation and decision making;
- development of the draft Social Impact Statement;
- framing of the recommendations arising from the results of the SIA to the Department of Planning;
- committed to work within the bounds of the Confidentiality Agreement and respect the sensitive nature of the Lower Hunter Regional Strategy; and
- undertaking the process evaluation of the SIA.
Members of the Working Group included representatives from:
1. NSW Department of Housing
2. NSW Department of Technical and Further Education
3. NSW Department of Community Services
4. NSW Department of Tourism, Sport and Recreation
5. NSW Department of Primary Industries
6. Hunter New England Area Health Service
7. NSW Premier’s Department – Hunter Branch
8. NSW Department of Planning – Hunter Branch (formerly DIPNR)
9. NSW Police
10. NSW Department of Health
5.5.1.1 Format of the Working Group Meetings Table 11 summarises the SIA meeting process. All meetings were held at the Hunter Branch of the Premier’s Department in Newcastle. The dates of the meetings were set some weeks apart in order to allow time for the collection of evidence, preparation of drafts and responses.
70
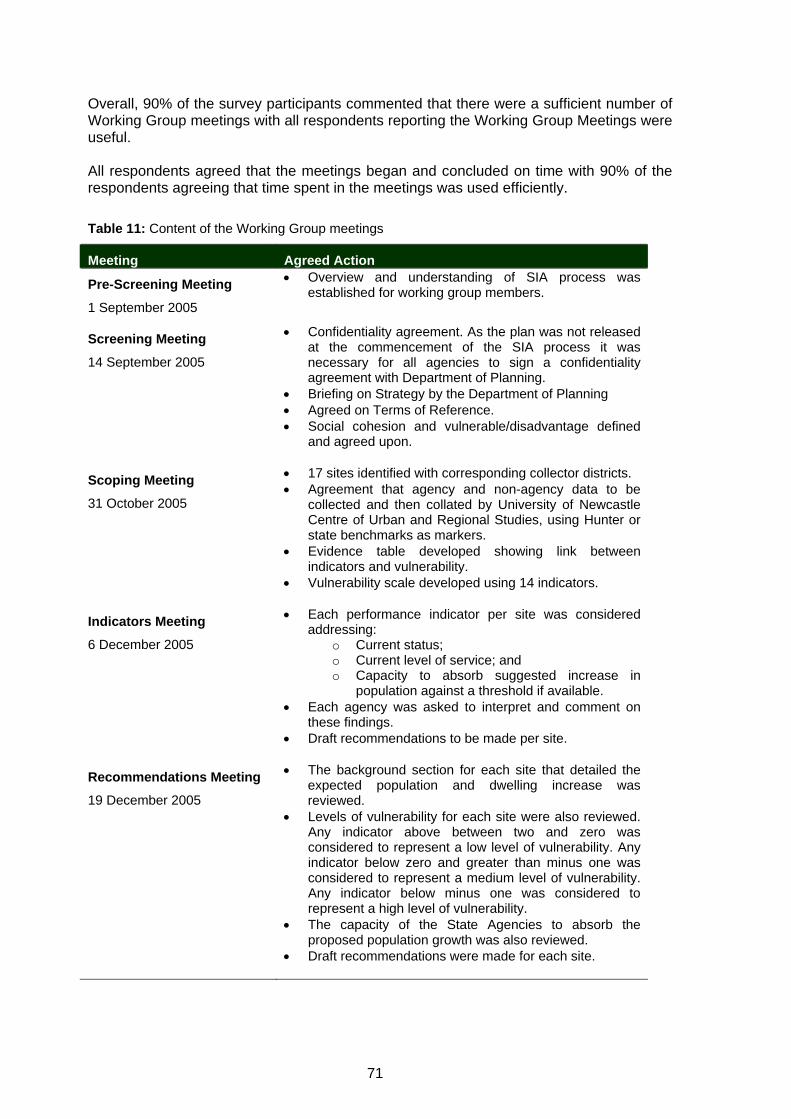
Overall, 90% of the survey participants commented that there were a sufficient number of Working Group meetings with all respondents reporting the Working Group Meetings were useful. All respondents agreed that the meetings began and concluded on time with 90% of the respondents agreeing that time spent in the meetings was used efficiently. Table 11: Content of the Working Group meetings
Meeting Agreed Action
Pre-Screening Meeting
1 September 2005
• Overview and understanding of SIA process was established for working group members.
Screening Meeting
14 September 2005
• Confidentiality agreement. As the plan was not released at the commencement of the SIA process it was necessary for all agencies to sign a confidentiality agreement with Department of Planning.
• Briefing on Strategy by the Department of Planning • Agreed on Terms of Reference. • Social cohesion and vulnerable/disadvantage defined
and agreed upon.
Scoping Meeting
31 October 2005
• 17 sites identified with corresponding collector districts. • Agreement that agency and non-agency data to be
collected and then collated by University of Newcastle Centre of Urban and Regional Studies, using Hunter or state benchmarks as markers.
• Evidence table developed showing link between indicators and vulnerability.
• Vulnerability scale developed using 14 indicators.
Indicators Meeting
6 December 2005
• Each performance indicator per site was considered addressing:
o Current status; o Current level of service; and o Capacity to absorb suggested increase in
population against a threshold if available. • Each agency was asked to interpret and comment on
these findings. • Draft recommendations to be made per site.
Recommendations Meeting
19 December 2005
• The background section for each site that detailed the expected population and dwelling increase was reviewed.
• Levels of vulnerability for each site were also reviewed. Any indicator above between two and zero was considered to represent a low level of vulnerability. Any indicator below zero and greater than minus one was considered to represent a medium level of vulnerability. Any indicator below minus one was considered to represent a high level of vulnerability.
• The capacity of the State Agencies to absorb the proposed population growth was also reviewed.
• Draft recommendations were made for each site.
71

Meeting (continued) Agreed Action
Evaluation Meeting
16 February 2006
• Update regarding the submission to the Department of Planning
• Update on the Strategy • Discussion regarding further presentations and reports • Update on the Evaluation of the SIA
5.5.1.2 Agency Attendance at Working Group Meetings Departments external to the Project Team, that attended the most Working Group meetings, were the Department of Planning, Department of Education, followed by Department of Technical and Further Education and the Department of Sport and Recreation as shown in Table 12.
Table 12: Attendance at Working Group meetings
Departments
Hun
ter
Prem
iers
Dep
t.
Hun
ter N
ew
Engl
and
Hea
lth
Dep
t. of
Com
mun
ity
Serv
ices
Dep
t. Te
chni
cal
& F
urth
er E
duca
tion
Dep
t. H
ealth
(P
artic
ipan
t Obs
erve
r)
New
Sou
th W
ales
P
olic
e
Dep
t. of
Pla
nnin
g
Dep
t. of
Tou
rism
, Sp
ort
& R
ecre
atio
n
Dep
t. of
Ed
ucat
ion
&
Trai
ning
Dep
t. Pr
imar
y In
dust
ries
Dep
t. of
Hou
sing
Meetings P E P E
Pre-screening 1 1 2 1 1 1 1 0 2 1 1 0 0
Screening 1 1 3 1 1 1 1 0 1 1 1 1 0
Scoping 1 1 3 1 1 1 0 0 1 1 1 0 1
Indicators 1 1 3 0 0 0 1 0 1 1 1 0 0
Recommendations 1 2 3 0 0 1 0 0 1 0 1 0 0
Evaluation 1 1 4 1 0 0 1 0 1 1 1 0 0
TOTAL 6 7 18 4 3 4 4 0 7 5 6 1 1
(P) Member of Project Team
(E) External to Project Team
5.5.1.3 Working Group members contribution to the Meetings A majority of respondents felt that most Working Group members were sufficiently prepared for each meeting (80%), that they understood their roles and responsibilities (80%) and were willing to share resources and ideas (90%). However, respondent’s reports were mixed regarding whether they felt free to disagree with one another in meetings and whether there was a shared understanding of and commitment to carrying out the responsibilities assigned to them, as shown in table 13.
72
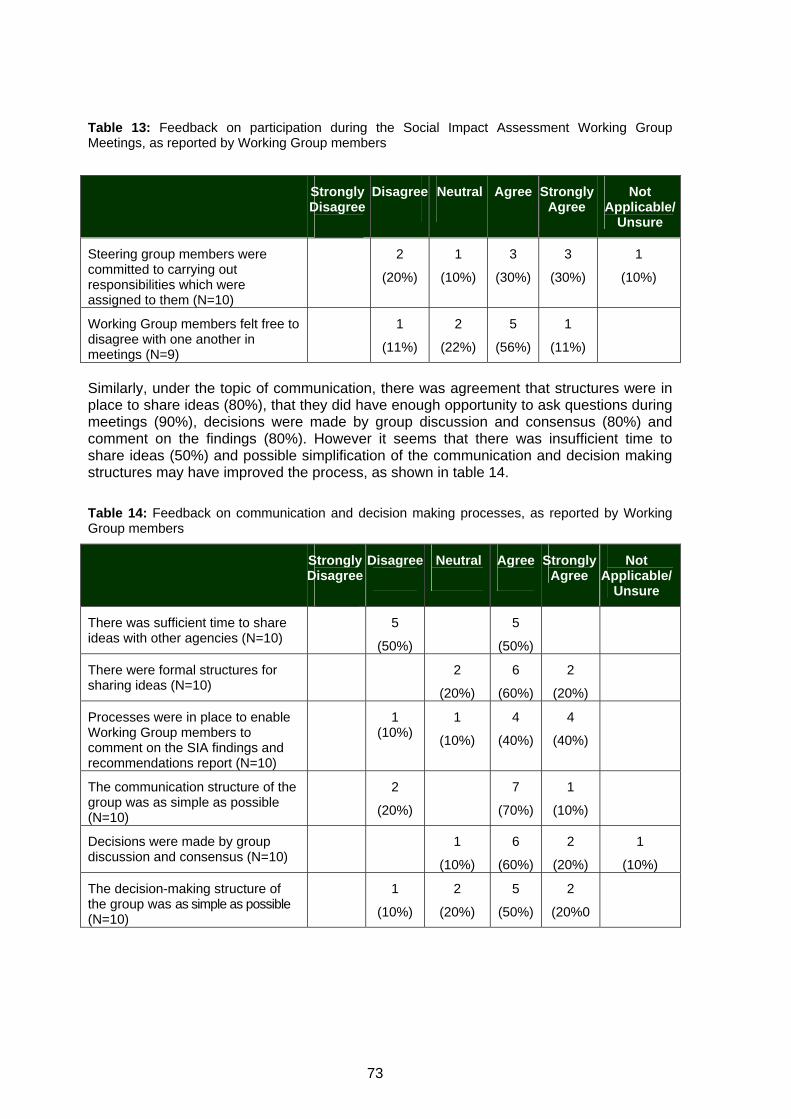
Table 13: Feedback on participation during the Social Impact Assessment Working Group Meetings, as reported by Working Group members
Strongly
Disagree
Disagree
Neutral
Agree
Strongly Agree
Not Applicable/
Unsure
Steering group members were committed to carrying out responsibilities which were assigned to them (N=10)
2
(20%)
1
(10%)
3
(30%)
3
(30%)
1
(10%)
Working Group members felt free to disagree with one another in meetings (N=9)
1
(11%)
2
(22%)
5
(56%)
1
(11%)
Similarly, under the topic of communication, there was agreement that structures were in place to share ideas (80%), that they did have enough opportunity to ask questions during meetings (90%), decisions were made by group discussion and consensus (80%) and comment on the findings (80%). However it seems that there was insufficient time to share ideas (50%) and possible simplification of the communication and decision making structures may have improved the process, as shown in table 14. Table 14: Feedback on communication and decision making processes, as reported by Working Group members
Strongly Disagree
Disagree
Neutral
Agree
Strongly Agree
Not Applicable/
Unsure
There was sufficient time to share ideas with other agencies (N=10)
5
(50%)
5
(50%)
There were formal structures for sharing ideas (N=10)
2
(20%)
6
(60%)
2
(20%)
Processes were in place to enable Working Group members to comment on the SIA findings and recommendations report (N=10)
1 (10%)
1
(10%)
4
(40%)
4
(40%)
The communication structure of the group was as simple as possible (N=10)
2
(20%)
7
(70%)
1
(10%)
Decisions were made by group discussion and consensus (N=10)
1
(10%)
6
(60%)
2
(20%)
1
(10%)
The decision-making structure of the group was as simple as possible (N=10)
1
(10%)
2
(20%)
5
(50%)
2
(20%0
73
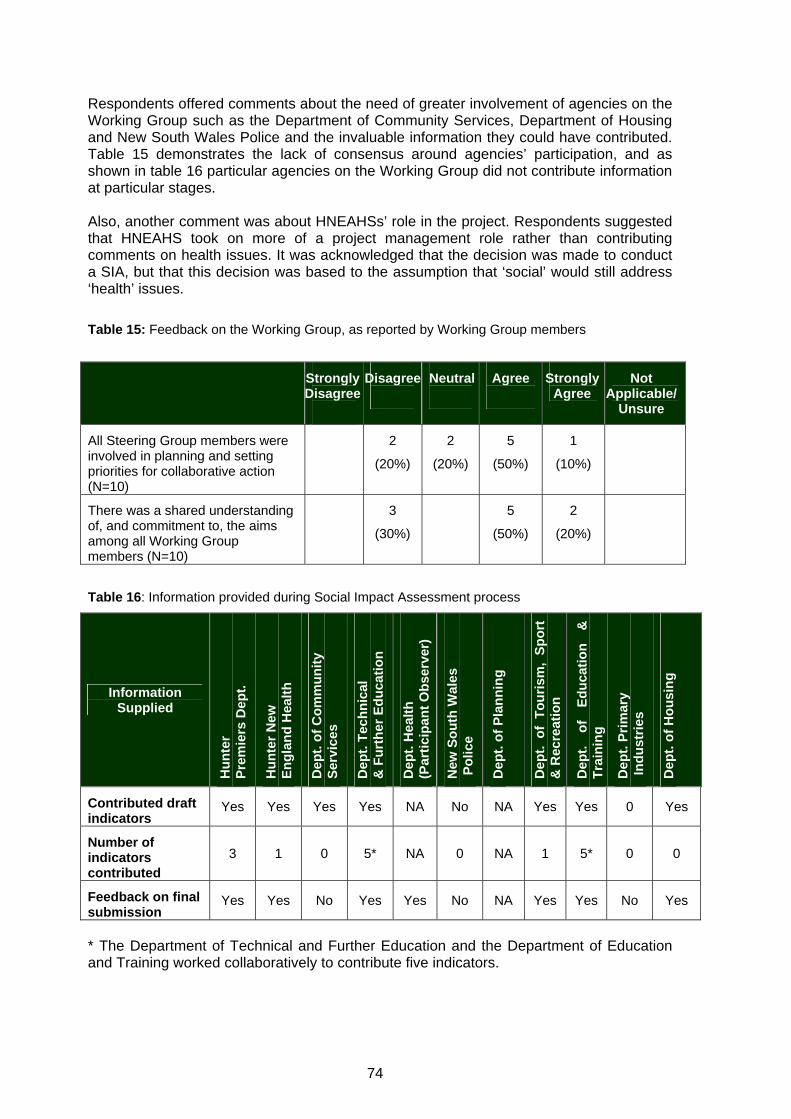
Respondents offered comments about the need of greater involvement of agencies on the Working Group such as the Department of Community Services, Department of Housing and New South Wales Police and the invaluable information they could have contributed. Table 15 demonstrates the lack of consensus around agencies’ participation, and as shown in table 16 particular agencies on the Working Group did not contribute information at particular stages. Also, another comment was about HNEAHSs’ role in the project. Respondents suggested that HNEAHS took on more of a project management role rather than contributing comments on health issues. It was acknowledged that the decision was made to conduct a SIA, but that this decision was based to the assumption that ‘social’ would still address ‘health’ issues. Table 15: Feedback on the Working Group, as reported by Working Group members
Strongly
Disagree
Disagree
Neutral
Agree
Strongly Agree
Not Applicable/
Unsure
All Steering Group members were involved in planning and setting priorities for collaborative action (N=10)
2
(20%)
2
(20%)
5
(50%)
1
(10%)
There was a shared understanding of, and commitment to, the aims among all Working Group members (N=10)
3
(30%)
5
(50%)
2
(20%)
Table 16: Information provided during Social Impact Assessment process
Information Supplied
Hun
ter
Prem
iers
Dep
t.
Hun
ter N
ew
Engl
and
Hea
lth
Dep
t. of
Com
mun
ity
Serv
ices
Dep
t. Te
chni
cal
& F
urth
er E
duca
tion
Dep
t. H
ealth
(P
artic
ipan
t Obs
erve
r)
New
Sou
th W
ales
P
olic
e
Dep
t. of
Pla
nnin
g
Dep
t. of
Tou
rism
, Sp
ort
& R
ecre
atio
n
Dep
t. of
Ed
ucat
ion
&
Trai
ning
Dep
t. Pr
imar
y In
dust
ries
Dep
t. of
Hou
sing
Contributed draft indicators
Yes Yes Yes Yes NA No NA Yes Yes 0 Yes
Number of indicators contributed
3 1 0 5* NA 0 NA 1 5* 0 0
Feedback on final submission
Yes Yes No Yes Yes No NA Yes Yes No Yes
* The Department of Technical and Further Education and the Department of Education and Training worked collaboratively to contribute five indicators.
74
5.5.1.4 Additional Working Group Members Participants were asked, “What other organisation do you feel should have been involved in the SIA process?” Below is a list of other agencies that the Working Group commented could have been invited to participate:
• Division of General Practice; • Ambulance Services; • Emergency Services (Police, Fire, Ambulance); and • Department of Local Government.
5.5.2 Evaluation of the Screening Stage Working Group members were asked to indicate their perception of the planning and screening stage. There were mixed responses regarding the success of the screening phase. Although some respondents reflected that the screening phase was well done, a majority of the working group felt that the planning stage was too short (80%). A majority of respondents (90%) felt that the project aims were made clear. Below is a summary of themes extracted from the qualitative responses regarding the screening stage.
Screening – Process
• Comprehensive. • Purpose understood by Working Group. • Agencies did well to undertake each stage, even when they had not undertaken
such a process. • A learning experience as well as a process for producing a set of
recommendations. • A little frustrating as the group was both “learning” and "doing" at the same time. • Little cloudy but came together gradually over the meetings. • Extremely rushed due to lack of clarity of project officers, managers and directors.
Screening – Documentation
• Screening report captured the appropriate process. • Reading information was useful. • Needed more time to become acquainted with the literature.
Screening – Project Team
• Needed concrete project membership prior to commencement of project. • Needed mechanism in place for changing of staff.
Screening – Working Group
• Very good that those who are core decision makers participated.
75

• Communication that occurred within the Working Group meetings at this stage were effective, clear and simple.
5.5.3 Evaluation of the Scoping Stage In general, respondents agreed that the scoping phase worked well. Similarly with the screening phase, there was a mixture of themes within the qualitative feedback. Below is a summary of themes extracted from the qualitative responses regarding the scoping stage. Scoping – Process
• Handled well. • Gained clarity about the scope. • Comprehensive. • Purpose understood by Working Group. • Decisions were not transparent.
Scoping – Agency Involvement
• Gave parameters about how the organisation could fit into the process. • Our purpose for being part of the process became evident.
Scoping – Documentation
• Process was not explicit as it should have been. • Needed better documentation of the process.
Scoping – Project Team
• Communication was not effective with the Project Team, or between members of the Project Team and other agencies.
• Poor team communication within the Project Team resulted in duplication of tasks. • Needed clear communication structures with the Project Team. • Needed clear communication lines and specified roles for Project Team.
5.5.4 Evaluation of the Identification and Assessment of Indicators Stage Overall, reports on this stage indicated that it was less well articulated and more confusing. Below is a summary of themes extracted from the qualitative responses regarding the identification and assessment of indicators stage. Identification and assessment of indicators – Process
• Confusing stage. • Time was limited/rushed which impacted on thoroughness.
76

• Deletion of principles in Strategy appeared to make this task irrelevant. • Challenging. • Excellent. • Less clearly articulated, as a result some agencies reluctant to provide sensitive
but relevant data. • Needed more clarity on the difference between indicators that describe an existing
community as opposed to indicators that describe the expected change in the community.
• Needed clearer guidelines of what was wanted (in regards to indicators) from the agencies to avoid wasteful effort.
• Clearer method needed and documented. Identification and assessment of indicators – Agencies
• CURS was a key partner. • Analyses by CURS was worthwhile. • Possible involvement of professionals in area. • Indicators stage established a solid link between agencies and how the indicators
impact on social outcomes of communities. • Better communication within the Project Team. • Great to see an agency contribute sensitive information to the project, highlights
the level of trust developed within the Working Group. • Disappointing that health was unable to contribute more indicators, and that only
one agency contributed sensitive data. Possibly due to unclear aims of this stage.
5.5.5 Evaluation of the Recommendation Stage
Similarly with previous stages, timing was an issue. Below is a summary of themes extracted from the qualitative responses regarding the recommendations stage.
Recommendations – Process
• More time/very rushed to form recommendations. • Need to be able to meet again to review recommendations. • Gained broader cross section of views. • Cross referencing with peers and other agencies. • Great to go through process. • Challenging to work through what recommendations were acceptable and still meet
equity etc. • Synthesis of indicators and recommendations were appropriate.
Recommendations – Documentation
• Comprehensive. • Evidence bases. • Good document. • Conveyed complicated information in a very presentable way.
77

Recommendations –Agencies
• Varying level of input from different agencies. • Identification of strategies for different communities enables our agency to
consider resource and program implications for communities both as part of the Strategy and normal operations.
5.5.5.1 Evaluation of the Entire Process Participants were asked to rate their satisfaction with the overall SIA. Table 17 shows the frequencies and percentages of responses within each of the satisfaction categories. A majority (70%) of the participants were satisfied with the overall process, with most feeling that the length of the project (August 2005 – January 2006) was too short (90%). More specifically, people commented that;
• it was a worthwhile process; • that it added value to the Strategy; • that it is an effective tool to encourage decision makers; and • it could be applied to larger policy documents.
Participants acknowledged that the requirements asked of their agency were appropriate with 90% of respondent feeling that their agency’s views were included.
Table 17: Feedback on the overall Social Impact Assessment process
Very
Dissatisfied Dissatisfied
Neither Satisfied nor Dissatisfied Satisfied
Very Satisfied
How satisfied are you with the OVERALL SIA Process? (N=9)
2
(22%)
4
(44%)
3
(33%) Participants reported on whether their agency benefited from the SIA, with 90% of the agencies acknowledging that their agency did benefit and that the processes meet their agency’s needs (90%). Below are comments from agencies on how they did or did not benefit:
• great process for whole of government; • help strengthen and create partnerships; • learned about SIA process; • learned about issues and needs of other agencies and common areas; • information will be useful to inform our thinking for future service development; • capacity building on how to conduct a HIA; • practicalities of applying a framework to a large scale urban plan; • interesting to gain access to the confronting issues of confidentiality and agency
data; • useful to have Department of Education and Training’s input into the planning
process of the region; and • learned about interaction of our services and how they impact on a communities
wellbeing.
78
Participants were asked if they would complete another SIA in the future, with 89% (N = 9) responding yes.
5.5.6 Reflection on the Strengths of the Social Impact Assessment Process Participants were asked to comment on the strengths of the SIA process. Participants were instructed to give up to two responses to this question. Responses are as follows: Leadership
• Strong leadership by Premiers and Planning staff. Whole of government
• Strong cross-agency commitment by Hunter human service agencies. • All agencies collaborating on issues. • All agencies working and learning together. • The range of agencies involved. • Commitment and support of agencies to project. • Collaborative approach taken by agencies. • Willingness to explore new concepts.
Information
• Good use of data. • Objective. • Extremely valuable process in providing input to future growth areas in the region.
Staff and agency involvement
• The project manager from Hunter Premier’s Department did well to deliver in time available.
• Having the decision makers at the table and participating in the process. Other
• An opportunity of the human services agencies to respond to large scale urban plans in their formative stage.
• Comprehensive. • An opportunity to analyse and review our agencies operations from a social
perspective and the links they have with other agencies. • Being able to critically appraise a strategy before it is implemented/signed off.
79
5.5.7 Improvements in the Social Impact Assessment Process Participants were also asked to list what improvements for future SIAs. Participants were instructed they could give up to two responses to this question. Responses were as follows: Agencies
• Involvement of all members of the working party/all agencies. • Investment in relationship building may have resulted in a heightened willingness
of agencies to share information. Process
• Practice makes perfect (though team did a great job – no specific areas for improvement)
• Timeframe (more time). • An overview of the process would be a useful guide for future studies. • Clearer criteria for gathering of information. • Clearer boundaries about what can be achieved in the time specificed must be
explicit.
Process support
• Appreciating that this was a learning experience, it would have been useful to have had a bit more guidance from someone who had undertaken such a process before.
• Links to similar projects that may have been conducted elsewhere could also provide useful background material.
Staff
• Allocation of a designated project officer at the onset of the project. • Specified Project Team membership within HNEAHS with clear communication
lines and roles. Other
• The health aspect seemed to get a bit lost. In the early stages there was talk about looking at each of the potential housing locations from a health aspect, for example, mosquito borne disease, lead - but this seemed to be forgetten or deliberately dropped because it was too sensitive. If the latter, then what is the appropriate forum to discuss these issues?
80
Chapter 6
Case Study
Report
Greenhills, Ashtonfield.
81

82
6 Case Study
6.1 Background to this Chapter This chapter is a case study, with reflections from the Project Team. It discusses key learning’s from the impact assessment process.
6.2 The Purpose of the Case Study The purpose of a case study is to provide an account of the impact assessment process and reflect upon lessons learnt, providing other practitioners insight to both the successes and hurdles of the project.
6.2.1 Issues addressed in the Case Study This case study provides an overview:
• of the proposal being assessed; • of the impact assessment; and • of the findings and recommendations.
It also documents:
• key learning points; • the strengths of the process perceived by the project team; and • the challenges of the process perceived by the project team.
83

6.3 Background to the Social Impact Assessment
6.3.1 Description of the Strategy The Lower Hunter Regional Strategy prepared by the NSW Department of Planning – Hunter branch, identified the sustainable management of development in the region over the next 25 years. The Strategy, projecting a population increase of 125 000 people, has the potential to influence the health and social well-being of the community and the equitable access to, and distribution of services across the region. In order to identify the potential social and health impacts arising from the proposed population increase, Hunter RCMG, led by the NSW Premier’s Department – Hunter Branch, and Hunter New England Health, completed an equity-focused SIA of the Strategy to establish a baseline of vulnerability for sites identified in the Strategy and to ensure that further disadvantage was not created by its implementation.
6.3.2 Description of the Social Impact Assessment At the screening meeting, the Working Group anticipated that a rapid prospective SIA largely drawing on existing evidence would be conducted. However, upon completion of the process, the Project Team in discussion with CHETRE believes they conducted an intermediate SIA because it not only drew upon existing evidence, but also relied on ‘expert’ opinion to draw out contextual or local area impacts, and involved a significant amount of work.
6.3.3 Who from the Developmental Site Team was involved in the Social Impact Assessment
HNEPH and the NSW Premier’s Department – Hunter Branch, jointly managed the SIA. These agencies worked collaboratively with officers from the Department of Planning and members of the Hunter RCMG. Table 18 compares anticipated hours of allocation to the project as outlined in the screening document, with actual hours of involvement in the project. Table 19 lists the type of tasks performed by each of the Project Team members.
84
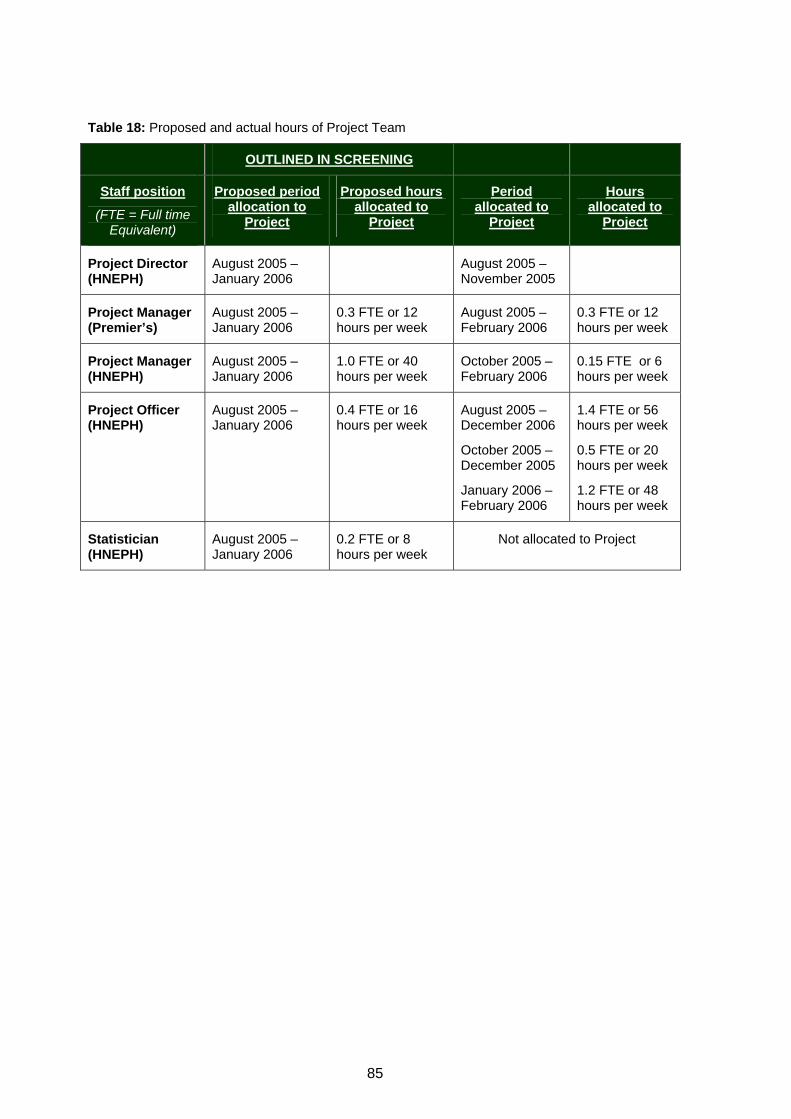
Table 18: Proposed and actual hours of Project Team
OUTLINED IN SCREENING
Staff position
(FTE = Full time Equivalent)
Proposed period allocation to
Project
Proposed hours allocated to
Project
Period allocated to
Project
Hours allocated to
Project
Project Director (HNEPH)
August 2005 – January 2006
August 2005 – November 2005
Project Manager (Premier’s)
August 2005 – January 2006
0.3 FTE or 12 hours per week
August 2005 – February 2006
0.3 FTE or 12 hours per week
Project Manager (HNEPH)
August 2005 – January 2006
1.0 FTE or 40 hours per week
October 2005 – February 2006
0.15 FTE or 6 hours per week
Project Officer (HNEPH)
August 2005 – January 2006
0.4 FTE or 16 hours per week
August 2005 – December 2006
October 2005 – December 2005
January 2006 – February 2006
1.4 FTE or 56 hours per week
0.5 FTE or 20 hours per week
1.2 FTE or 48 hours per week
Statistician (HNEPH)
August 2005 – January 2006
0.2 FTE or 8 hours per week
Not allocated to Project
85

Table 19: Type of tasks completed by Project Team members
Staff position
Period allocated to Project
Tasks
Project Director (HNEPH)
August 2005 – November 2005
Attended four out of six Working Group meetings
Attend two days of CHETRE training
Project Manager (Premier’s)
August 2005 – February 2006
Co-managed the project from August to February
Liaised with members of the Working Group
Presented project findings
Attend all Working Group meetings
Attend two days of CHETRE training
Assisted in the preparation of the screening, scoping, evaluation and recommendation report
Project Manager (HNEPH)
October 2005 – February 2006
Co-managed the project from October to February
Liaised with members of the Working Group
Presented project findings
Attended four out of six Working Group meetings
Attend one day of CHETRE training
Assisted in the preparation of the evaluation and recommendation report
Project Officer (HNEPH)
August 2005 – December 2006
January 2006 – February 2006
Project officer on the project from August to February
Liaised with members of the Working Group
Presented project findings
Attend all Working Group meetings
Designated minute taker at Working Group meetings
Assisted in the preparation of the screening, scoping, evaluation and recommendation report
Attend three days of CHETRE training
Project Officer (HNEPH)
October 2005 – December 2005
January 2006 – February 2006
Project officer on the project from October to February
Liaised with members of the Working Group
Attended four out of six Working Group meetings
Attend one day of CHETRE training
Assisted in the preparation of the evaluation and recommendation report
86

6.4 Rationale for the Social Impact Assessment
6.4.1 Goals and Objectives As stated in Chapter 3: Scoping document, the goals of the SIA were: 1) to assess levels of existing vulnerability and access to services within geographical sites identified by the Strategy; 2) to assess the potential social impact the proposed population growth could have on the existing populations; 3) to create a series of recommendations about the appropriateness of proposed growth areas. These recommendations were based on information gathered through the scoping process. The recommendations were predominately associated with future population increases in new release areas, existing sites and corridors. Objectives The project’s objectives for conducting a SIA were:
• to improve the social wellbeing of people within the Lower Hunter; • to reduce social inequalities across the Lower Hunter; • to promote evidence-based policy development; • to promote multi-agency working by encouraging policy-makers to collaborate with
one another, focusing on a common goal; • to encourage policy-makers to consider positive, negative and unknown impacts of
a proposal on people’s social well-being and use these findings to enhance a proposal;
• to empower the Strategy developers to examine and secure positive social-wellbeing outcomes for communities within the Lower Hunter;
• to empower government departments to cohesively examine and identify social-wellbeing outcomes for communities they service within the Lower Hunter;
• to encourage both Strategy developers and government departments to consider relevant SIA recommendations in their future planning processes; and
• to examine the application of an equity lens to a proposal through the SIA process 19.
Strategies
• A Working Group established from members of the Hunter RCMG worked collaboratively through the SIA process by attending meetings and participating in email/phone communication.
• Each department was asked to contribute information and expert knowledge to the process.
• An equity lens was applied to each stage of the SIA to ensure that future social inequities were reduced.
87

Expected outcomes
• A series of recommendations outlining possible strengths and limitations with population increase in particular areas of the Lower Hunter.
• Increase skills in conducting SIAs. • Continual building and maintenance of partnerships across state government
agencies. • Increase sharing of information across government departments.
88

6.5 Undertaking the Social Impact Assessment The Working Group comprised of:
• Department of Education and Training – Director; • Department of Housing - Area Manager; • Department of Technical and Further Education - Director Learning Environment; • Department of Community Services - Director Partnership and Planning; • Department of Tourism, Sport and Recreation - Regional Coordinator; • Department of Primary Industries – Director; • Hunter New England Area Health Service - Director of Population Health,
Planning and Performance; • NSW Premier’s Department (Hunter) - Assistant Regional Coordinator; • NSW Premier’s Department (Hunter) – Project Manager; • NSW Department of Planning (Hunter) - Planning Officer & Regional Director; • NSW Police – Inspector; • NSW Department of Health - Senior Project Officer; • Hunter New England Population Health – Project Manager; and • Two Hunter New England Population Health – Project Officers.
NSW Premier’s Department – Hunter Branch and HNEPH created a Project Team, working collaboratively on the project.
The SIA followed a number of steps.
1. Screening of the Strategy revealed that there was considerable uncertainty about its potential impacts, in particular sites proposed for population growth and that such impacts could have an adverse impact on the social and health wellbeing of target populations.
2. Scoping of the Strategy identified 35 sites for proposed population growth. These
sites were clustered into 17 aggregate sites for appraisal. An ‘equity lens’ was used by the Working Group to assess whether the impact of increasing population in the proposed development areas would have a positive, negative or neutral impact on the wellbeing of the proposed communities, and if there would be a beneficial impact on wellbeing from the proposed population growth.
3. Identification of impacts involved the creation of a profile that examined the
sites’ current levels of vulnerability. A site’s vulnerability profile was based on a set of indicators, supplied by agencies participating in the Working Group, which focused on the social determinants of health (see Table 20). The indicators were required to be measurable at a collector district level and with known links to vulnerability. These indicators were plotted for each of the 17 aggregate geographical sites. See Figure 6 for vulnerability profiles for each of the 17 sites. Any indicator with a score below zero was considered to indicate an aspect of vulnerability for a site. For example, Site 1 had all but one indicator below zero indicating a high level of vulnerability, whereas Site 16 had all but one indicator above the zero point, demonstrating low levels of vulnerability according to the available information. The 17 sites were ranked according to their current level of vulnerability.
In addition to the vulnerability profile, agency representatives on the Working Group provided data reviewing their agency’s current and future service capacity for each
89
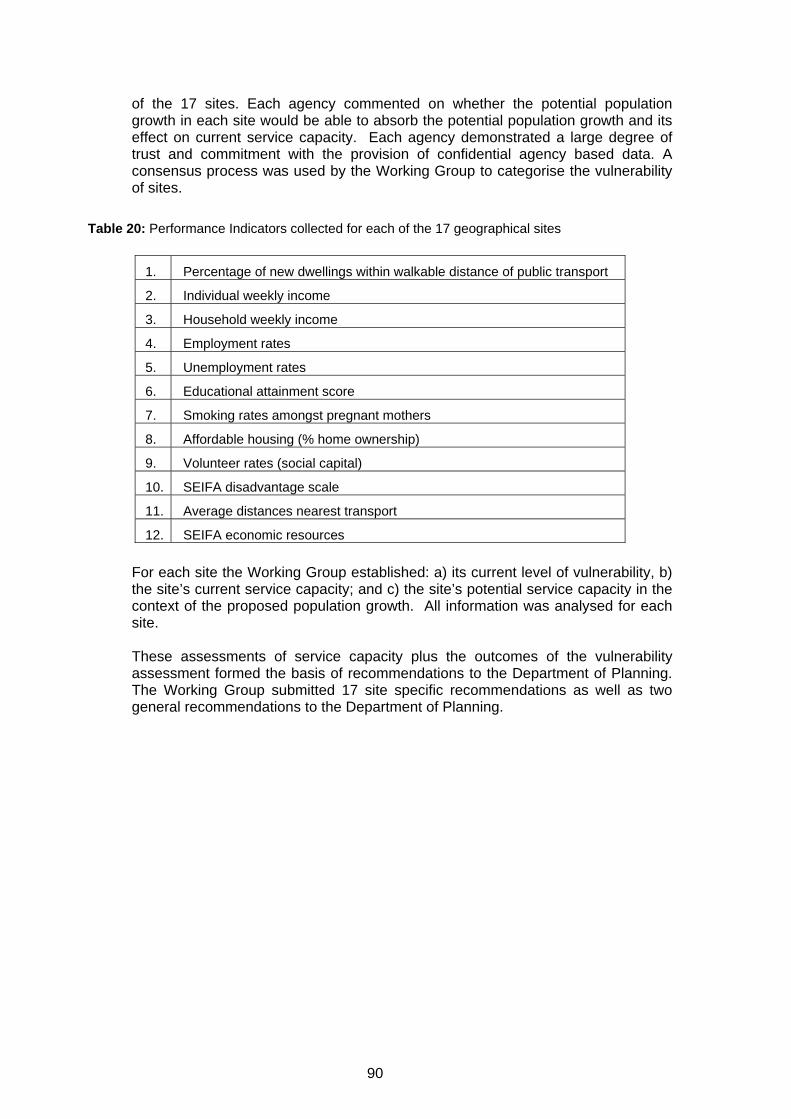
of the 17 sites. Each agency commented on whether the potential population growth in each site would be able to absorb the potential population growth and its effect on current service capacity. Each agency demonstrated a large degree of trust and commitment with the provision of confidential agency based data. A consensus process was used by the Working Group to categorise the vulnerability of sites.
Table 20: Performance Indicators collected for each of the 17 geographical sites
1. Percentage of new dwellings within walkable distance of public transport
2. Individual weekly income
3. Household weekly income
4. Employment rates
5. Unemployment rates
6. Educational attainment score
7. Smoking rates amongst pregnant mothers
8. Affordable housing (% home ownership)
9. Volunteer rates (social capital)
10. SEIFA disadvantage scale
11. Average distances nearest transport
12. SEIFA economic resources For each site the Working Group established: a) its current level of vulnerability, b) the site’s current service capacity; and c) the site’s potential service capacity in the context of the proposed population growth. All information was analysed for each site. These assessments of service capacity plus the outcomes of the vulnerability assessment formed the basis of recommendations to the Department of Planning. The Working Group submitted 17 site specific recommendations as well as two general recommendations to the Department of Planning.
90
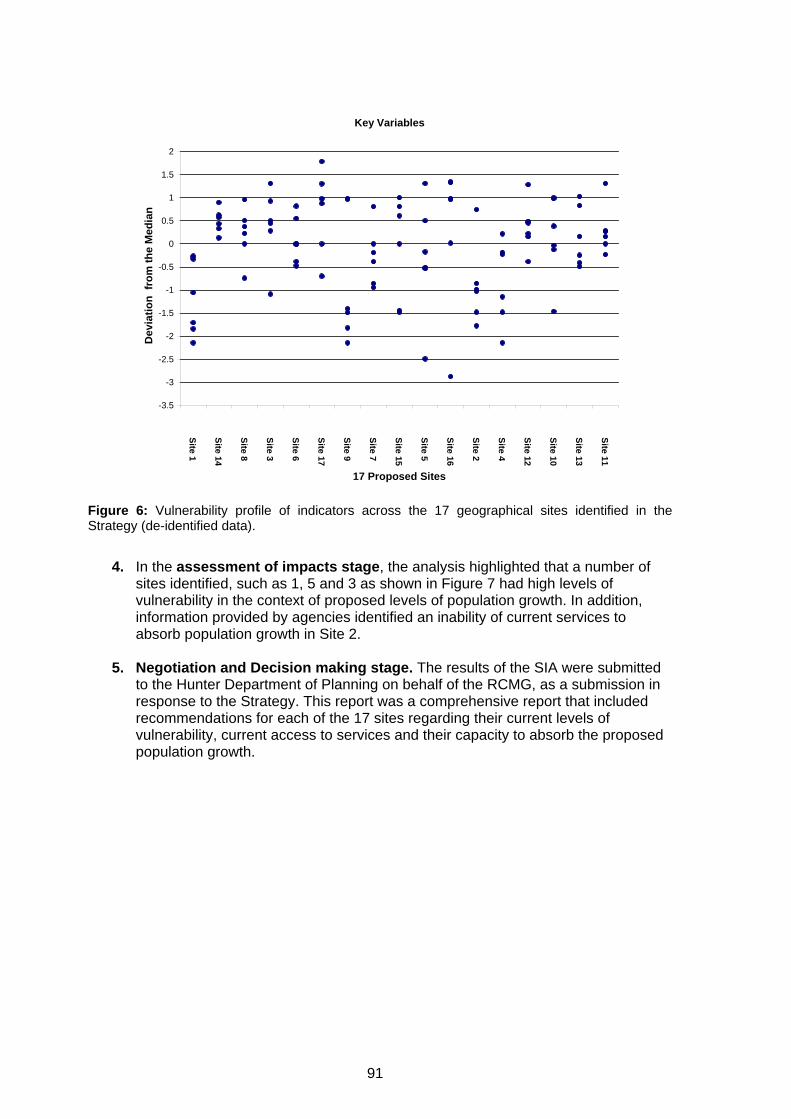
Key Variables
-3.5
-3
-2.5
-2
-1.5
-1
-0.5
0
0.5
1
1.5
2
Site 1
Site 14
Site 8
Site 3
Site 6
Site 17
Site 9
Site 7
Site 15
Site 5
Site 16
Site 2
Site 4
Site 12
Site 10
Site 13
Site 11
17 Proposed Sites
Dev
iatio
n fr
om th
e M
edia
n
Figure 6: Vulnerability profile of indicators across the 17 geographical sites identified in the Strategy (de-identified data).
4. In the assessment of impacts stage, the analysis highlighted that a number of
sites identified, such as 1, 5 and 3 as shown in Figure 7 had high levels of vulnerability in the context of proposed levels of population growth. In addition, information provided by agencies identified an inability of current services to absorb population growth in Site 2.
5. Negotiation and Decision making stage. The results of the SIA were submitted to the Hunter Department of Planning on behalf of the RCMG, as a submission in response to the Strategy. This report was a comprehensive report that included recommendations for each of the 17 sites regarding their current levels of vulnerability, current access to services and their capacity to absorb the proposed population growth.
91

Figure 7: Vulnerability levels compared to potential population growth for each site
6. Monitoring and Evaluation Stage. An evaluation occurred on the SIA process
and outcomes. The objectives for the evaluation of the SIA process were:
• to document and report on the SIA process; • to gauge perception of the SIA Process among Working Group members; • to assess the perceived usefulness of the SIA process overall; and • to provide recommendations for future SIA processes.
To ensure the objectives of the evaluation could be met, a mix of methodologies was used; a Working Group Survey and an analysis of SIA process documentation. At the end of the SIA process a survey was distributed to all members of the Working Group. The survey collected Working Group Members’ perceptions of the process, including: its perceived representativeness, effectiveness and usefulness. The survey data was collated and a review of all process documentation was also undertaken. As the LHRS is released, ongoing monitoring of the release of population growth sites will be undertaken to assess the impacts of these sites on levels of vulnerability and access to services by the Hunter RCMG.
92

6.6 Main Findings and Recommendations
6.6.1 Summary of Key Social Impacts A strategy of this magnitude has the potential to influence the wellbeing of the people of the region and the equitable distribution of resource and services across the region. The investigation of the 17 sites revealed particular sites to be currently more or less vulnerable, with variation of current and future capacities to absorb the population growth. For sites deemed highly vulnerable, such as sites 1, 2 and 9, it was recommended that if population growth was to occur within these sites, a review of, and additional services would be required. An example of potential services included:
• health – increase access to general practitioners; • transport – improved transport links; • education – additional schools; • review of sports facilities; • employment – improved access to employment zones, or employment zones
within the region; and • housing – increased access to affordable housing.
It was reinforced that in order to avoid further exacerbation of current levels of vulnerability in some sites, a review of services would need to be considered if population growth was to occur. Table 21 shows an example of a recommendation from a currently highly vulnerable site. Please note, as discussed in Chapter 4: Recommendations Report, the Working Group agreed that data in all public documents would be de-identified for reasons of confidentiality. See table 8 in chapter 4 for more details. Sites numbered Site 1 to Site 17 were sites proposed for population growth examined in the Strategy. These sites were the focus of the SIA. Sites referred to by letters, Site A through to Site RR, are existing areas not directly proposed for population growth in the Strategy. Table 21: Example of a recommendation from a high level vulnerability site
OVERALL RECOMMENDATIONS Site 1 has high levels of vulnerability. Based on current levels of service, to enable the proposed population growth Site 1 would require:
- improved transport links to Site 5 and Site A, especially to the employment zone at Site B;
- increased access to General Practitioners; - one additional primary school and one additional high school; - review of sport and recreation facilities.
Roads and public transport are key issues to be addressed to enable employment growth opportunities. It is also recommended that consolidation close to Site 1 should occur, rather than solely relying on Greenfield sites for growth.
93
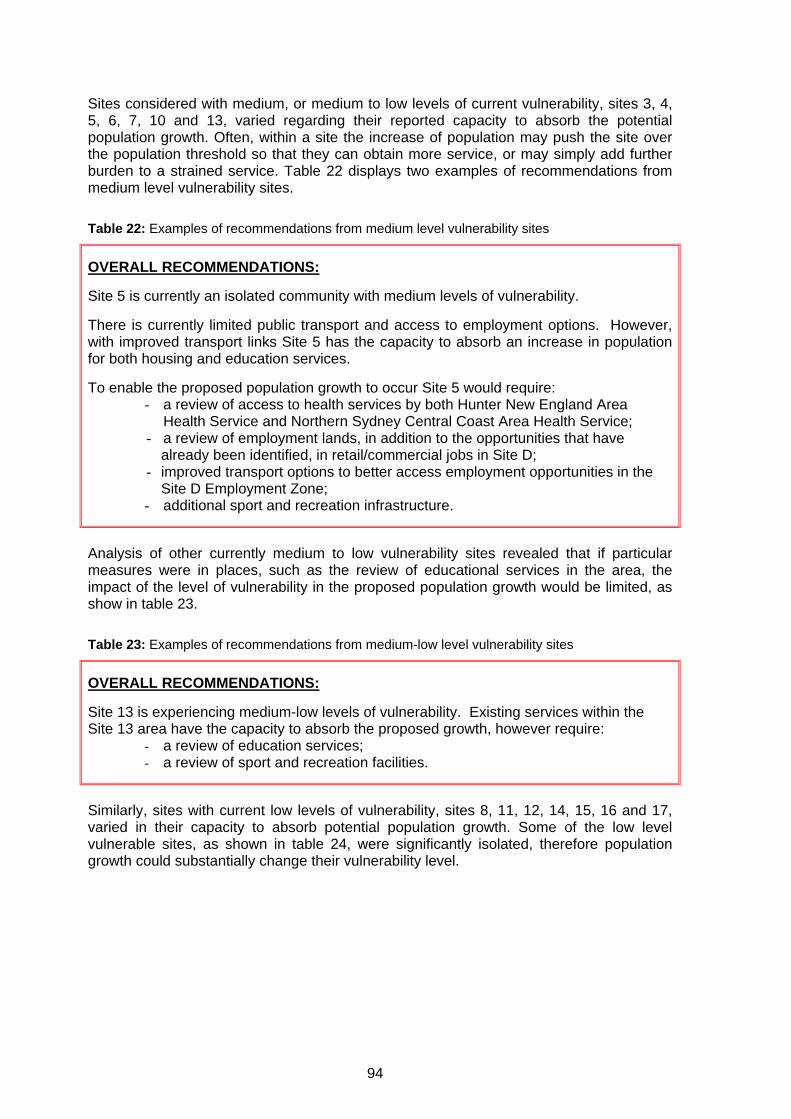
Sites considered with medium, or medium to low levels of current vulnerability, sites 3, 4, 5, 6, 7, 10 and 13, varied regarding their reported capacity to absorb the potential population growth. Often, within a site the increase of population may push the site over the population threshold so that they can obtain more service, or may simply add further burden to a strained service. Table 22 displays two examples of recommendations from medium level vulnerability sites. Table 22: Examples of recommendations from medium level vulnerability sites
OVERALL RECOMMENDATIONS: Site 5 is currently an isolated community with medium levels of vulnerability. There is currently limited public transport and access to employment options. However, with improved transport links Site 5 has the capacity to absorb an increase in population for both housing and education services. To enable the proposed population growth to occur Site 5 would require:
- a review of access to health services by both Hunter New England Area Health Service and Northern Sydney Central Coast Area Health Service;
- a review of employment lands, in addition to the opportunities that have already been identified, in retail/commercial jobs in Site D;
- improved transport options to better access employment opportunities in the Site D Employment Zone;
- additional sport and recreation infrastructure.
Analysis of other currently medium to low vulnerability sites revealed that if particular measures were in places, such as the review of educational services in the area, the impact of the level of vulnerability in the proposed population growth would be limited, as show in table 23. Table 23: Examples of recommendations from medium-low level vulnerability sites
OVERALL RECOMMENDATIONS: Site 13 is experiencing medium-low levels of vulnerability. Existing services within the Site 13 area have the capacity to absorb the proposed growth, however require:
- a review of education services; - a review of sport and recreation facilities.
Similarly, sites with current low levels of vulnerability, sites 8, 11, 12, 14, 15, 16 and 17, varied in their capacity to absorb potential population growth. Some of the low level vulnerable sites, as shown in table 24, were significantly isolated, therefore population growth could substantially change their vulnerability level.
94
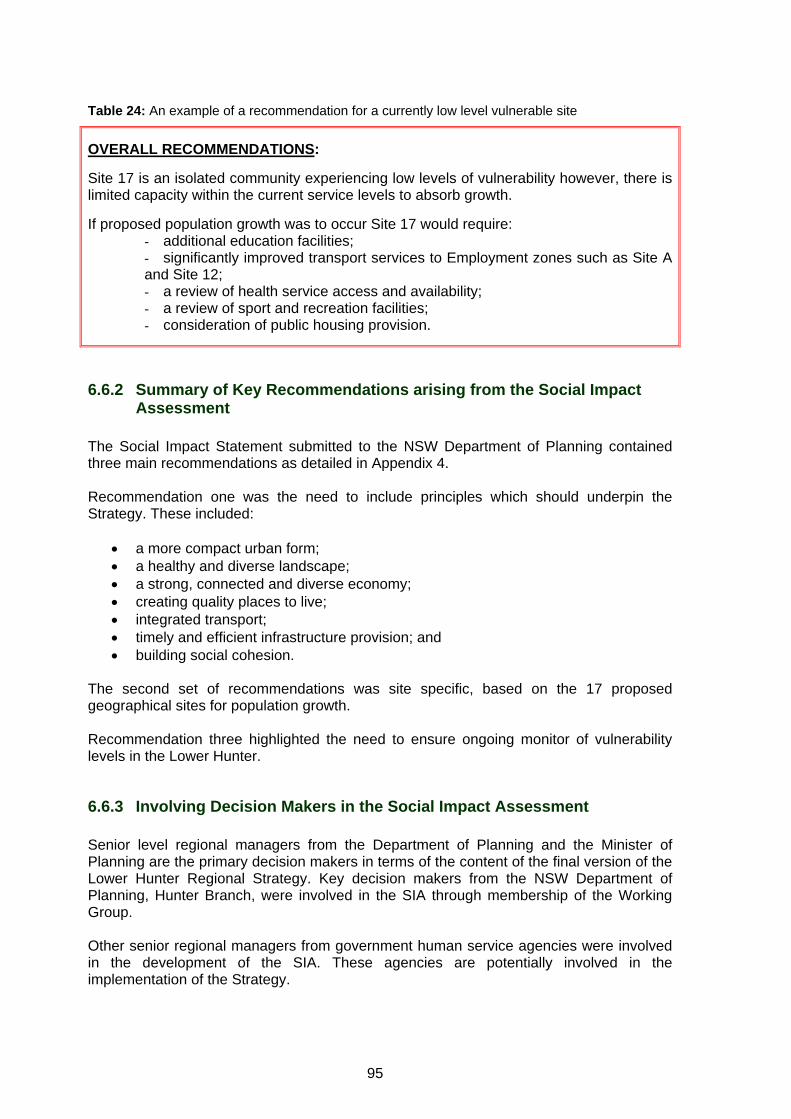
Table 24: An example of a recommendation for a currently low level vulnerable site
OVERALL RECOMMENDATIONS: Site 17 is an isolated community experiencing low levels of vulnerability however, there is limited capacity within the current service levels to absorb growth. If proposed population growth was to occur Site 17 would require:
- additional education facilities; - significantly improved transport services to Employment zones such as Site A and Site 12; - a review of health service access and availability; - a review of sport and recreation facilities; - consideration of public housing provision.
6.6.2 Summary of Key Recommendations arising from the Social Impact Assessment
The Social Impact Statement submitted to the NSW Department of Planning contained three main recommendations as detailed in Appendix 4. Recommendation one was the need to include principles which should underpin the Strategy. These included:
• a more compact urban form; • a healthy and diverse landscape; • a strong, connected and diverse economy; • creating quality places to live; • integrated transport; • timely and efficient infrastructure provision; and • building social cohesion.
The second set of recommendations was site specific, based on the 17 proposed geographical sites for population growth.
Recommendation three highlighted the need to ensure ongoing monitor of vulnerability levels in the Lower Hunter.
6.6.3 Involving Decision Makers in the Social Impact Assessment Senior level regional managers from the Department of Planning and the Minister of Planning are the primary decision makers in terms of the content of the final version of the Lower Hunter Regional Strategy. Key decision makers from the NSW Department of Planning, Hunter Branch, were involved in the SIA through membership of the Working Group. Other senior regional managers from government human service agencies were involved in the development of the SIA. These agencies are potentially involved in the implementation of the Strategy.
95

6.6.4 Encouraging Decision Makers to act on Recommendations Representatives from the Department of Planning were actively involved in each stage of the SIA, in particular during the recommendation stage. Department of Planning representatives were present at the recommendations meeting, and although they explicitly requested not to be part of the formulation of the content of the recommendations, they were able to inform the Working Group as to what type of recommendations would be in the jurisdiction of the NSW Department of Planning – Hunter Branch. This allowed the Working Group to ensure that recommendations made to the Department of Planning were not only appropriate, but that the Department of Planning had the authority to act on the recommendations.
96
6.7 Key Learning’s
6.7.1 Overall Learning’s Know your time frame and be pragmatic Limited time is an obvious hurdle in any project. The most important step is, before beginning, take the time to think about what can and cannot be achieved within the timeframe. It is about being realistic about the time and resources that you have and making a judgement about what can be accomplished. This means that you must know your timeframes prior to beginning the impact assessment. Deadlines are also essential. Ideally, deadlines should be fixed and unchangeable. Without deadlines an impact assessment can be blown out of proportion. Having external rigid deadlines was a bonus in disguise for our project. Having a deadline decreased the chance of procrastination and pushed the team to make pragmatic decisions from the evidence available. The impact assessment cannot make the decisions for you, at some point a judgement is needed. This is a challenge especially when you want to do a thorough job and gather as much ‘evidence’ as possible. Unfortunately, impact assessments are not conducted within sterile environments, some restrictions are inevitable. For example, some part of the proposal may need to be removed from the impact assessment, possibly being considered in another process, or search limits on data or literature may need to be put in place. These restrictions need to be highlighted during the scoping stage. This is why the scoping stage is very important as it can define the boundaries of your impact assessment. Use existing resources Identify and use existing resources. There are many people who have previously completed impact assessments, many articles documenting previous impact assessments and agencies willing to support people wishing to complete impact assessments, for example CHETRE. A possible approach to identifying these resources could be to develop an asset registry of resources during the early phases of the impact assessment. The asset registry could also be used to document the strength of team members in the project and other external resources. A Social Impact Assessment by any other name Whether calling your project a SIA or a Health Impact Assessment may appear a minor issue, however, language can often enhance or hinder collaborations, especially when working with a number of disciplines. It is important to define key terms in order to ensure that everyone is on the same page; otherwise there is the potential for people to follow different interpretation, potentially resulting in the need to repeat work. Also, limiting the use of impact assessment ‘jargon’ may also be appropriate to encourage communication. Nevertheless, keep in mind that collaborative work can provide an ideal opportunity to learn other disciplines approaches and use of language.
97

Allow time for reflection When completing an impact assessment for the first time, allow time to discuss your reflections of the process with Project Team members. This can alleviate some of the uncertainty with undertaking a new process. Regular team meetings could contain a time for reflection. Documenting these reflections can also be very useful especially when reporting on the completed impact assessment. Honesty is the best policy If this is the first time you have completed an impact assessment, be honest, particularly with the working group. Early in the project, explain to the working group that it is a learning process for everyone and that asking questions will help everyone involved. It is one tool in the tool box Impact assessments are a tool which can guide and support decision making. It is not a process which will remove all judgements. It will not have all the answers, nor will it always reveal a perfect solution to a problem. Decisions are needed and trade offs calculated. If you believe that impact assessments will be an objective process that emits an answer, you will be disappointed. In saying this, it is a terrific tool which encourages decision makers to explicitly state why one decision was made over another. It is as much a project of partnerships as it is outcomes The collaboration of agencies and the momentum that the impact assessment produced has lead to further work by the Hunter RCMG. The impact assessment was a vehicle for creating and strengthening partnerships across state government agencies. Think big The Lower Hunter Regional Strategy is a large scale planning document. Conducting a macro level impact assessment posed challenges, in that we not only had to focus on issues higher than the community or neighbourhood level, but focus on many geographical sites and the agencies that service the various areas. Evidence can be more than just numbers Be open to the idea that evidence can be more than randomised control trials. In particular, local knowledge should be acknowledged as a valuable source of evidence.
98
6.7.2 Key Learning’s – Considerations at the beginning of the Process At the beginning of the process ensure that you have considered the following. Project Team, Management, Communication and Responsibilities Ensure you know who is in the project team and management. Inconsistent membership of project staff at the start of the project team created unnecessary challenges. Also, make sure you have clear lines of communications, clear roles and responsibilities particularly for the project team. This is particularly crucial if two agencies are co-facilitating the process. Questions for consideration are: who can the working group contact; who will collect the information; who will take minutes of each meeting; and who will be responsible for documenting the process. It is also vital that there are guidelines on how the project team and working group is to come to an agreement and what principles will underpin the impact assessment. An impact assessment can not make decisions for the group. At this stage it is also important to decide and document who will own the information collected. In our impact assessment, confidentiality issues were raised which required publicly released information to be de-identified Support from the Working Group Do you have full support from your Working Group? How are you going to reinforce what is expected from agencies? During our SIA there were varied levels of participation from agencies. It is critical to not only have full support from the Working Group, but also a mutual understanding of what is required from each agency.
Who are you writing for? One aim of an impact assessment is to influence decision makers. Things to consider are; who are you writing the recommendations for? Who are you trying to influence? What might the recommendations look like? Know the best way of conveying recommendations to the decision-makers. Think about what is the simplest and most effective way of communicating this information. Within our impact assessment, we were fortunate to have a representative from the Department of Planning on the Working Group as this agency would potentially review the recommendations proposed. Including the Department of Planning in the process lead to a greater insight to what sort of recommendations would be appropriate for the Department of Planning, otherwise there was the potential to produce good information that was not in any form the Department of Planning could act upon. It would have been a challenge to make recommendations without direction of how the submission would be used. Although Planning did not comment on the content of the recommendations they did advise on the type, specificity and format of recommendations. Think about Evaluation NOW Plan your evaluation. Decide how you are going to evaluate the process, the outcomes and the impact.
99
Resources Be aware that impact assessments can be resource intensive. Be prepared to allocate the necessary resources and staff to the project. Explore what resources and staffing time are available within your own organisation. Document the process There are many different ways an impact assessment can be conducted. It is important to complete both the screening and scoping stages in cooperation with the working group and project team, to ensure that people are on the same page. Also, producing a screening and scoping document is helpful, not only to record decisions about how to proceed but can provide a useful starting point when writing the recommendations report. Is an impact assessment appropriate? The screening stage is important as it should answer the question, “Is an impact assessment required?” Although our project was artificial in the sense that we had obtained approval to conduct an impact assessment under the guidance of CHETRE, this question is still important because impact assessments should not be conducted simply for the sake of completing one. There should be a clear rationale for conducting an impact assessment which needs to be explicitly stated and documented during the screening stage.
6.7.3 Key Learning’s – Considerations throughout the Process Meetings Regular face-to-face Working Group and Project Team meetings are important. We held a Working Group meeting at each stage of the impact assessment. Most meetings ran for two hours, with the exception of the recommendation meeting, which ran for five hours. Although five hours seemed quite daunting, it worked really well as topics were able to be discussed and decisions made during the meeting. Ideally, try and arrange meetings so that most of the working group can attend. If members are unable to attend ensure that they are kept up-to-date with the content of meetings and ensure, where possible, that they are involved in the decision making process. It is important to note that our Working Group was formed from a pre-existing group which was of benefit to the process as members had previously worked with one another. So if you are establishing a new group it might be a good idea to have a ‘get to know you’ meeting, possibly during the screening or pre-screening stage. Maintain and follow up relationships As previously discussed, regular face-to-face meetings with Working Group and Project Team members is vital. In addition, it is important to distribute other important documents and information to the Working Group and Project Team regularly to encourage communication. Such documents can include; screening and scoping documents, agenda and minutes of meetings. Also, providing ‘brief’ informal updates via email to the Working Group can provide an opportunity for Working Group members to ask questions and discuss ideas.
100
6.8 Conclusion The SIA on the Strategy was a worthwhile process in that it:
• promoted the exploration of key determinants of health and social issues to be integrated in policy in a top-down approach;
• enabled the identification of both potential positve and negatives impacts of a policy;
• established a conduit for communication between agencies; • established a pathway that will be used on an ongoing basis to consider ongoing
levels of vulnerability within a large geographical area; and • offered an opportunity for decision makers to examine and ensure that choices
they make today do not comprimise people’s wellbeing in the future and do not increase levels of inequity.
101

102

References
Reference List
(1) Harris E, Simpson S. NSW Health Impact Assessment Project, Phase 1 Report. Sydney: Centre for Health Equity Training Research and Evaluation, University of NSW; 2003.
(2) Centre for Health Equity Training RaE. HIA Connect: Building Capacity to Undertake Health Impact Assessment. http://chetre.med.unsw.edu.au/hia/index.htm; 2003.
(3) Szirom T, Lasater Z, Hyde J, Moore C. Working Together, Integrated Governance. Paper for the Institute of Public Administration, Australia.; 2001.
(4) Department of Infrastructure PaNR. Lower Hunter Regional Strategy Context Paper. 2004.
(5) Becker HA. Social Impact Assessment. European Journal of Operational Research 2001;128:311-21.
(6) Simpson S, Harris E, Harris E, Harris-Roxas B. Health Impact Assessment: an introduction to the what, why and how. Health Promotion Journal of Australia 2004;15(2):150-5.
(7) Mindell J, Joffe M. A glossary for health impact assessment. J Epidemiol Community Health 2003;57:647-51.
(8) Ison E. Resource for Health Impact Assessment: Volume one, the main resource. National Health Service; 2000.
(9) Mahoney M, Simpson S, Harris E, Aldrich R, Stewart Williams J. Equity-focused Health Impact Assessment Framework. The Australasian Collaboration for Health Equity Impact Assessment (ACHEIA); 2004.
(10) Taylor L, Blair-Stevens C. Introducing Health Impact Assessment (HIA): Information for the decision-making process. 2002.
(11) Dannenberg A, Jackson R, Frumkin H, Schieber R, Pratt M, Kockhtitzky C, et al. The Impact of Community Design and Land-use Choices on Public Health: a scientific research agenda. American Journal of Public Health 2003;93(9):1500-8.
(12) Cox G, Miers S. Social Impact Assessment for Local Governments. A handbook for Councillors, Town Planners and Social Planners. Local Government and Shires Association.; 1995.
(13) Cave B, Curtis S. Health Impact Assessment for Regeneration Projects. Volume 1: a practical guide. East London and the City Health Action Zone; 2001.
(14) NSW Department of Planning. Draft Lower Hunter Regional Strategy 2006-2031. 2005.
(15) New South Wales Department of Local Government. Local Council Boundaries. New South Wales Department of Local Government 2005 Available from: URL:
103
http://www.dlg.nsw.gov.au/dlg/dlghome/dlg_Regions.asp?region=HT®iontype=1
(16) Frumkin H, Frank L, Jackson R. Urban Sprawl and Public Health: Designing, planning and building for health communities. 2004.
(17) Health Promotion Division of the National Assembly for Wales. Developing Health Impact Assessment in Wales. Health Promotion Division of the National Assembly for Wales; 1999.
(18) SCOTT-SAMUEL A, Birley M, Ardern K. The Merseyside Guidelines for Health Impact Assessment. 2001. International Health Impact Assessment Consortium. Ref Type: Generic
(19) Public Health Advisory Committee. A Guide to Health Impact Assessment: A policy tool for New Zealand. 2nd Edition. 2005.
(20) Statistics New Zealand. Sustainable Development: Social Cohesion. Statistics New Zealand 2005 Available from: URL: http://www.stats.govt.nz/analytical-reports/monitoring-progress/social-cohesion/default.htm
(21) Vishanskaya O, Strider V, Mitchell J, Cass Y, Davidson M. Four Steps Towards Equity: A Tool for Health Promotion Practice. Sydney, Australia: South East Health; 2003.
(22) Signal L. Tackling health inequalities through health promotion action. Health Promotion Forum of New Zealand Newsletter 2002;56(10).
(23) World Health Organization European Centre for Health Policy. Health Impact Assessment: main concepts and suggested approaches. Geneva: World Health Organization (WHO); 1999.
(24) European Centre for Health Policy. Health Impact Assessment: Main concepts and suggested approaches. Gothenburg Consensus Paper. Brussels: ECHP & World Health Organization, Regional Office for Europe, Copenhagen.; 1999.
(25) World Health Organization. Health Impact Assessment Toolkits for Cities: document 2 - training module. 2005.
(26) Mahoney M, Potter JL. What is health impact assessment and what can it learn from EIA? Environmental Impact Assessment Review 2004;24:131-4.
(27) Taylor L, Gowman N, Quigley R. Evaluating Health Impact Assessment. 2003.
(28) Bond A, Cashmore M, Cobb D, Lovell A, Taylor L. Evaluation in impact assessment areas other than HIA: Summary Report. Health Development Agency; 2005.
104
Appendix
Appendix 1 – Developmental Site Application
Developmental Health Impact Assessment Sites Application 2005 sites
Hunter New England Area Health Service
1. A description of the proposal (new/revised policy, program or major development) to be assessed using HIA.
It is proposed that HIA will be used to assess the Lower Hunter Regional Strategy being produced by the Department of Infrastructure, Planning and Natural Resources (DIPNR). The Lower Hunter Regional Strategy is a major policy that will guide and strategically direct how development in the region will be managed on a sustainable basis based on a potential population increase of up to 280,000 people, over the next twenty five years. The Lower Hunter Regional Strategy encompasses the local government areas of Newcastle, Lake Macquarie, Port Stephens, Maitland and Cessnock. Newcastle is the largest ‘city’ in NSW outside metropolitan Sydney and the sixth largest urban area in Australia, thus, the Lower Hunter Regional Strategy has the potential to maximise the positive health and social benefits and minimise the negative impacts of the work of the non-health sector in the region. The Lower Hunter Regional Strategy will provide vision about the type of region people want to live in and leadership in addressing the challenges faced by continued growth and development. The Strategy plans to reconcile development needs with the resources available, protect and enhance the physical and natural assets of the region, identify opportunities to strengthen the regional economy and seek to maintain or improve the quality of life and social well being of the community. The Strategy will define and protect green space, define an urban footprint around which choices for housing, employment and transport can be created and coordinate state government infrastructure and investment decisions to support the settlement pattern. The Regional Strategy will provide a regional context and overarching framework for local government in the development of local strategic plans and local environmental plans. It will also guide priorities for investment by the State Government in transport infrastructure, capital works and service delivery. A draft of the Lower Hunter Regional Strategy is to be submitted to the Director General of DIPNR by the end of June 2005 and will be available for public exhibition and comment in the third quarter of 2005. 2. Will the HIA be prospective? The Lower Hunter Regional Strategy will be available in draft form in June/July and there is an opportunity to conduct a prospective HIA with recommendations and feedback to influence the final Strategy. 3. Provide a brief outline of how you think the HIA will be conducted. It is anticipated that, given the timeframe for public exhibition and the broad nature of the Lower Hunter Regional Strategy, the HIA will be rapid. Beginning in July/August 2005. The HIA will be overseen by a Project Steering Committee including representatives from DIPNR, HNEAHS and representatives of the Hunter RCMG Human Services Regional Officers Group – Department of Education, Department of Housing, Department of Community Services and Premiers Department. This committee will be responsible for planning the HIA and setting the terms of reference for the assessment team. A working group/assessment team made up of the HNEAHS senior staff (Director: Population Health, Planning & Performance, Director: Population Health, Service Director:
105

Health Surveilance, a Statistician and a Health Promotion Program Manager) and DIPNR staff will be convened to undertake the work required to ensure the HIA is completed. The HIA will explore the distribution of potential social and health impacts of the Lower Hunter Regional Strategy. Equity will also be considered from a health and social pespective, therefore a broad definition of health will be used.
It is anticipated that the project will work through the standard HIA steps of: • Scoping: will be conducted by the Project Steering Committee to set the terms of
reference and define how the HIA will be conducted. • Identifying and assessing potential health impacts: this will be done by the working
group/assessment team and will include community profiling, data collection and analysis and qauntification of the evidence.
• Negotiation and decision making: will be done as a partnership between the Project Steering Committee and DIPNR
• Evaluation and monitoring: this will include process evaluation and assessment of ammendments to and the actual health impacts of the Lower Hunter Regional Strategy.
4. What is(are) the expected outcome(s) of the health impact assessment?
The key outcomes of the HIA are expected to be: • Improved knowledge, understanding and capacity of HNEAHS and DIPNR to use HIA • A working relationship established with key HIA stakeholders in NSW (CHETRE and
other AHS’s) • Amendment of the Lower Hunter Regional Strategy to reduce the negative and
enhance the positive health impacts. This will have to be done with a thorough understanding of the political, economic and other contexts in which the Strategy is being written and produced
• A better undertanding of the potential health and social impacts of the implemenation of the Lower Hunter Regional Strategy. This will enable all organistaions involved in the HIA process to better anticipate, prepare and plan for, and manage the impacts as they are realised over time.
• A better undertanding for HNEAHS of the regional planning processes and a greater capacity to work with local planning agencies (local government, DIPNR etc) in the future.
• A greater capacity for HNEAHS to conduct effective HIA on other plans and proposals in the future
• A local forum/workshop conducted to introduce the concept of HIA to other potential partners (eg local councils, RCMG members).
• A plan/strategy developed to take HNEAHS forward in its use of HIA to improve the health of the population in the future
5. Briefly describe the resources that will be made available for the HIA (both in-kind
and actual resources). The following resources will be made available by HNEAHS: • The time of senior population health staff (Director: Population Health, Planning &
Performance, Director: Population Health, Service Director: Health Surveilance) to plan and oversee the project.
• The time of a Health Promotion Project Manager to manage the day-to-day implementation of the project, attend training etc. (1 FTE).
• The time of a project Officer to support the Health Promotion Project Manager (0.4 FTE)
• The time of a Statistician to conduct data analysis, mapping etc. (0.2 FTE) It is also anticipated that DIPNR and other members of the Hunter RCMG Human Services Regional Officers Group will devote significant staffing and data resources to this project.
106

Appendix 2 – Draft Lower Hunter Region Strategy
107

108

109

110

111

112
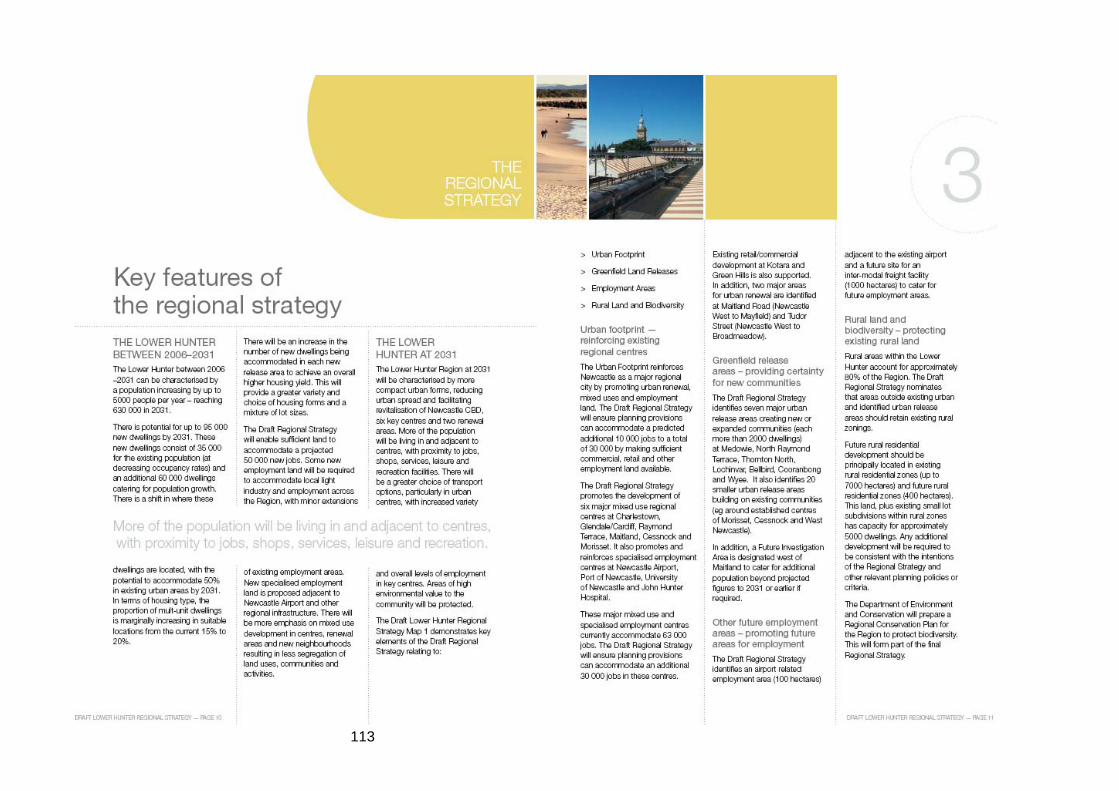
113

114

115

116

117

118
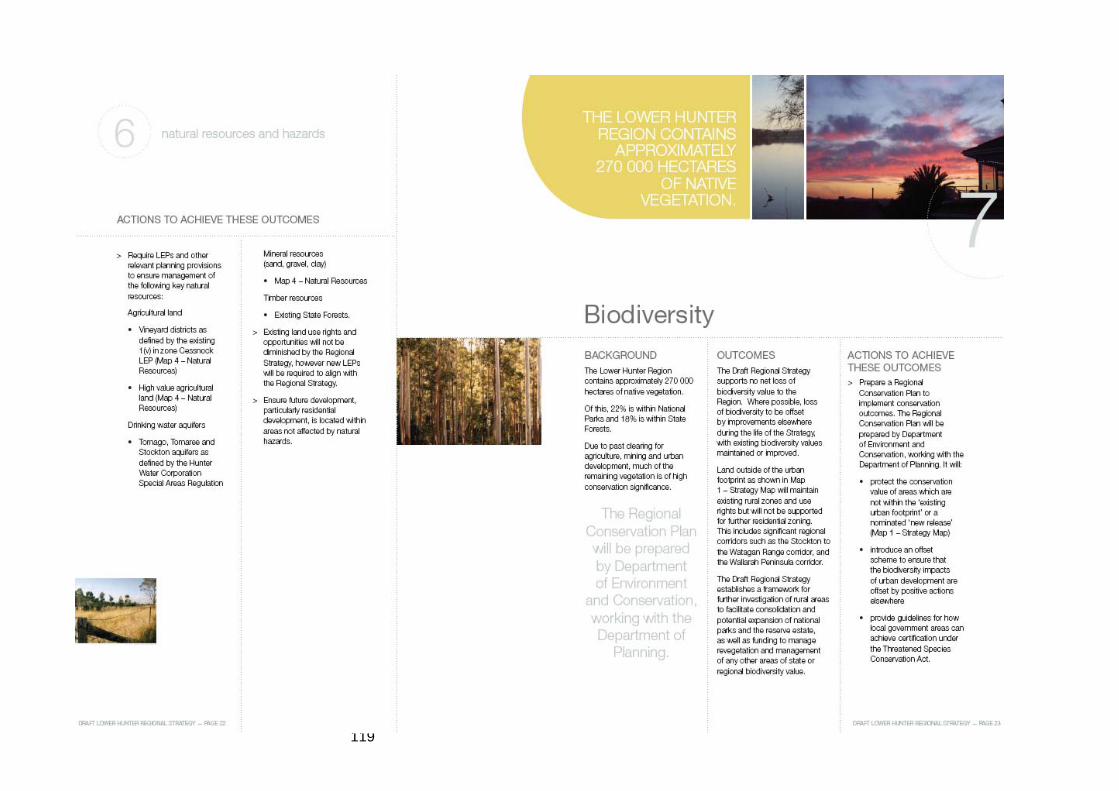
119

120

121

122

Appendix 3a –Lower Hunter Region Map
123

124

Appendix 3b –Lower Hunter Region Housing Map
125

126

Appendix 3c –Lower Hunter Region Employment Map
127

128
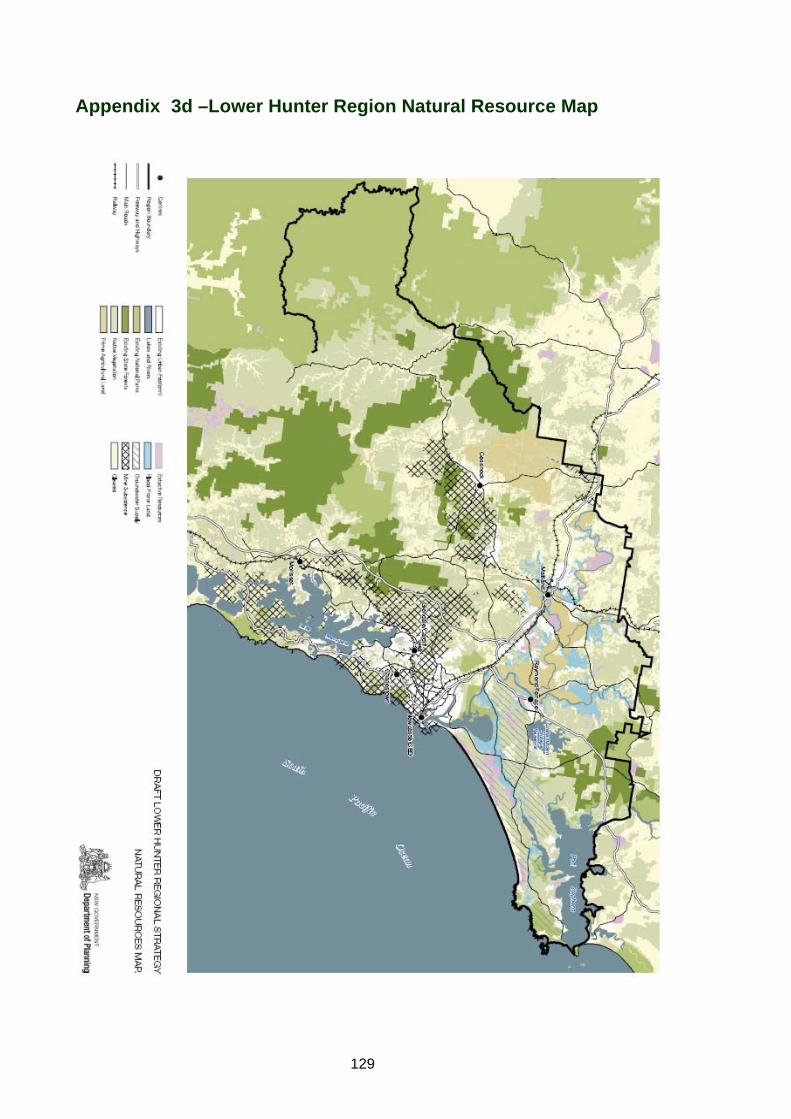
Appendix 3d –Lower Hunter Region Natural Resource Map
129

130

Appendix 4 – Social Impact Statement Link to: D:\Appendix 4_Social Impact Statement_deidentified.pdf
131

132

Appendix 5 – Evaluation Survey
Lower Hunter Regional Strategy - Social Impact Assessment
Evaluation Questionnaire Hunter New England Population Health, on behalf of the Hunter branch of the Premier’s Department, is currently undertaking an evaluation of the Lower Hunter Regional Strategy Social Impact Assessment (SIA) that has occurred over the last few months. In order to help us document and report on how the SIA process went, we are interested in obtaining your feedback on the process. We have therefore sent a copy of the questionnaire to all Steering Group members and ask that you please fill out the questionnaire. We will not be recording nor reporting any individual responses. Questionnaire Instructions: Please use the tab button on your computer or your computer mouse to move from one question to the next. Simply type in your comments for those questions asking for comments, and for the remaining questions, please click the boxes to mark them with a cross as appropriate. Once you have completed the questionnaire, please save it and email it to the following address: [email protected] If you prefer that your responses remain anonymous, please print out your completed questionnaire and mail it back to: Milly Licata, Hunter New England Population Health, Locked Bag 10, WALLSEND NSW 2287. Please email or mail your completed questionnaire back to us no later than 31 January 2006. If you have any questions regarding this survey please phone Milly Licata at Hunter New England Population Health on 49246474.
133
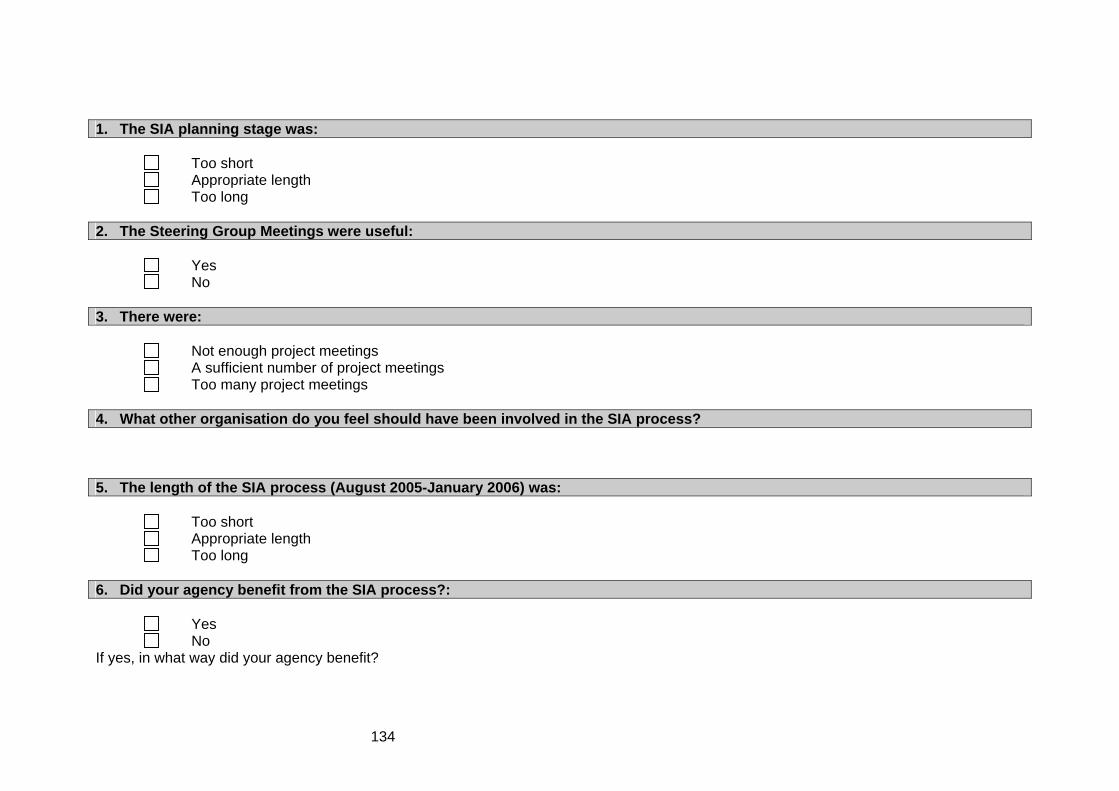
1. The SIA planning stage was: Too short Appropriate length Too long 2. The Steering Group Meetings were useful: Yes No 3. There were: Not enough project meetings A sufficient number of project meetings Too many project meetings 4. What other organisation do you feel should have been involved in the SIA process? 5. The length of the SIA process (August 2005-January 2006) was: Too short Appropriate length Too long 6. Did your agency benefit from the SIA process?: Yes No If yes, in what way did your agency benefit?
134
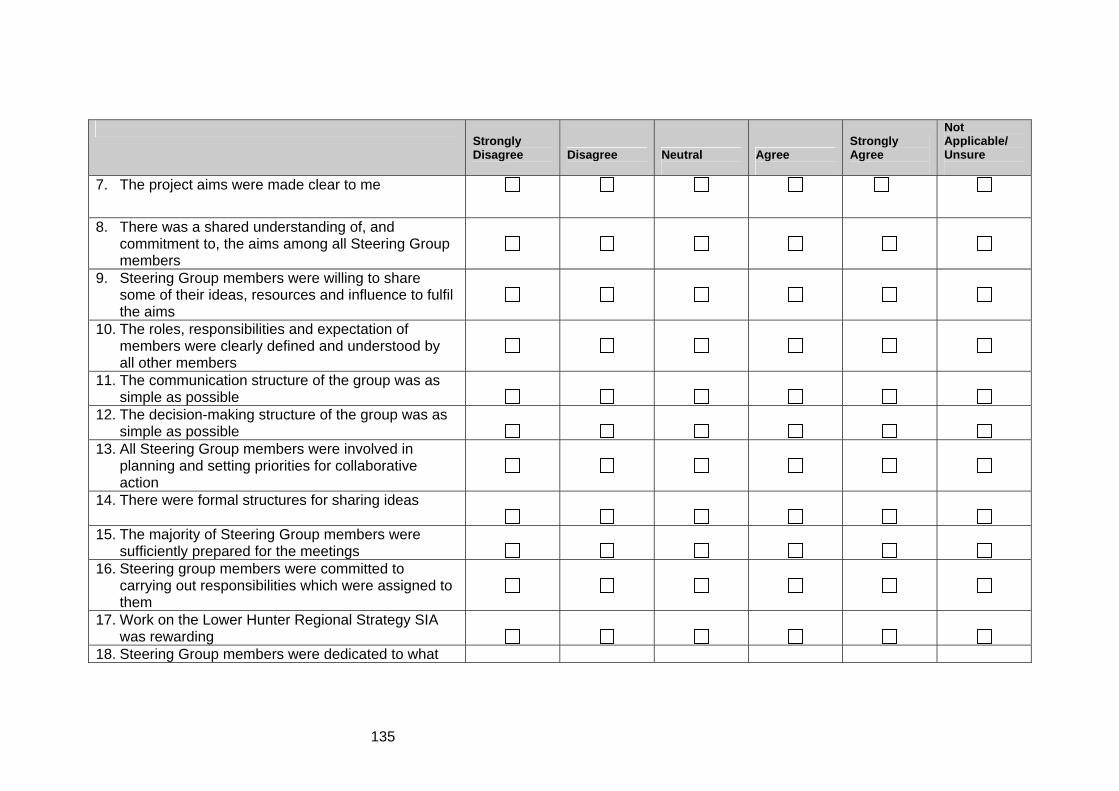
Strongly Disagree
Disagree
Neutral
Agree
Strongly Agree
Not Applicable/ Unsure
7. The project aims were made clear to me
8. There was a shared understanding of, and commitment to, the aims among all Steering Group members
9. Steering Group members were willing to share some of their ideas, resources and influence to fulfil the aims
10. The roles, responsibilities and expectation of members were clearly defined and understood by all other members
11. The communication structure of the group was as simple as possible
12. The decision-making structure of the group was as simple as possible
13. All Steering Group members were involved in planning and setting priorities for collaborative action
14. There were formal structures for sharing ideas
15. The majority of Steering Group members were sufficiently prepared for the meetings
16. Steering group members were committed to carrying out responsibilities which were assigned to them
17. Work on the Lower Hunter Regional Strategy SIA was rewarding
18. Steering Group members were dedicated to what
135

Strongly Disagree
Disagree
Neutral
Agree
Strongly Agree
Not Applicable/ Unsure
the Group was trying to achieve 19. Steering Group members did not have enough
opportunity to ask questions at meetings
20. Steering Group members felt free to disagree with
one another in meetings
21. Meetings began on time and concluded on time
22. Time spent in meetings was used efficiently
23. Decisions were made by group discussion and
consensus
24. There was sufficient time to share ideas with other
agencies
25. The project met my agency’s needs
26. The requirements asked of my agency were
appropriate
27. Discussions and information generated from
Steering Group members were captured well
28. I felt that my agency’s views were included in the
SIA process
29. Processes were in place to enable Steering Group
members to comment on the SIA findings and recommendations report
136

30. Please provide comments on the following aspects of the SIA Process
a) Screening stage:
b) Scoping stage:
c) Indicators stage:
d) Recommendations stage:
31. What two things could be improved for future SIA?: a) b) 32. What were two strengths of the SIA process?:
137
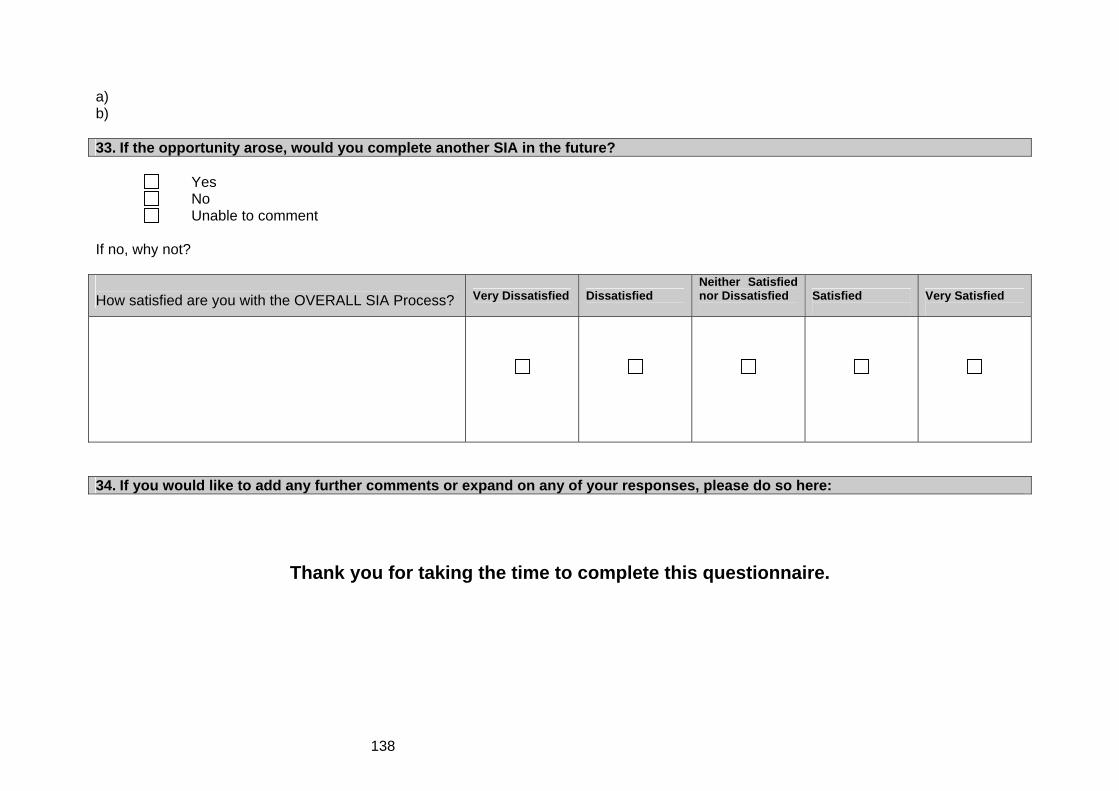
a) b) 33. If the opportunity arose, would you complete another SIA in the future? Yes No Unable to comment If no, why not? How satisfied are you with the OVERALL SIA Process? Very Dissatisfied
Dissatisfied
Neither Satisfied nor Dissatisfied
Satisfied
Very Satisfied
34. If you would like to add any further comments or expand on any of your responses, please do so here:
Thank you for taking the time to complete this questionnaire.
138
List of Tables Table 1: Potential Impacts from the Lower Hunter Regional Strategy - Housing...............18 Table 2: Potential Impacts from the Lower Hunter Regional Strategy - Employment........20 Table 3: Potential Impacts from the Lower Hunter Regional Strategy – Environment.......21 Table 4: Anticipated staff time allocations to the Social Impact Assessment project.........22 Table 5: Agencies involved in the Working Group .............................................................31 Table 6: Reviewed Staff Allocations ..................................................................................32 Table 7: Social Impact Assessment Working Group Terms of Reference.........................33 Table 8: Legend for data....................................................................................................43 Table 9: Table of contents of the Social Impact Statement ...............................................46 Table 10: Standardised aggregated vulnerability scores for the 17 geographical locations
....................................................................................................................................48 Table 11: Content of the Working Group meetings............................................................71 Table 12: Attendance at Working Group meetings ............................................................72 Table 13: Feedback on participation during the Social Impact Assessment Working Group
Meetings, as reported by Working Group members ...................................................73 Table 14: Feedback on communication and decision making processes, as reported by
Working Group members............................................................................................73 Table 15: Feedback on the Working Group, as reported by Working Group members.....74 Table 16: Information provided during Social Impact Assessment process ......................74 Table 17: Feedback on the overall Social Impact Assessment process............................78 Table 18: Proposed and actual hours of Project Team......................................................85 Table 19: Type of tasks completed by Project Team members.........................................86 Table 20: Performance Indicators collected for each of the 17 geographical sites............90 Table 21: Example of a recommendation from a high level vulnerability site ....................93 Table 22: Examples of recommendations from medium level vulnerability sites...............94 Table 23: Examples of recommendations from medium-low level vulnerability sites ........94 Table 24: An example of a recommendation for a currently low level vulnerable site .......95
139

140

List of Figures Figure 1: The Hunter Region. Insert - Lower Hunter Region15...........................................10 Figure 2: Lower Hunter Regional Strategy Housing Map. Modified from the Strategy. .....36 Figure 3: Comparison of Australian Bureau of Statistics and agency indicators across the
17 geographical locations ...........................................................................................47 Figure 4: Comparison of six key Australian Bureau of Statistics and agency indicators
across the 17 geographical locations .........................................................................48 Figure 5: Matrix comparing standardised vulnerability data on projected population
increases for each site................................................................................................49 Figure 6: Vulnerability profile of indicators across the 17 geographical sites identified in
the Strategy (de-identified data). ................................................................................91 Figure 7: Vulnerability levels compared to potential population growth for each site ........92
141

142

143