a sopac desktop study of ocean-based, renewable energy
TRANSCRIPT

A SOPAC Desktop Study of
Ocean-Based RenewAble eneRgy TeChnOlOgieS
SOPAC Miscellaneous Report 701
A technical publication produced by the SOPAC Community Lifelines Programme

SOPAC Miscellaneous Report 701
Ivan KrishnaCompiler
First edition
October 2009
Information presented in this publication has been sourced mainly from the internet and from publications produced by the International Energy Agency (IEA).
The compiler would like to thank the following for reviewing and contributing to this publication:
• Dr.LuisVega• AnthonyDerrickofITPower,UK• GuillaumeDréauofSociétédeRechercheduPacifique(SRP),NewCaledonia• ProfessorYoung-HoLeeofKoreaMaritimeUniversity,Korea• ProfessorChulH.(Joe)JoofInhaUniversity,Korea• LukeGowingandGarryVenusofArgoEnvironmentalLtd,NewZealand
PacificIslandsAppliedGeoscienceCommission(SOPAC),Fiji
• PaulFairbairn –ManagerCommunityLifelinesProgramme• RupeniMario –SeniorEnergyAdviser• ArietaGonelevu –SeniorEnergyProjectOfficer• FrankVukikimoala –EnergyProjectOfficer• KoinEtuati –EnergyProjectOfficer• ReshikaSingh –EnergyResourceEconomist• AtishmaVandanaLal –EnergySupportOfficer• Mereseini(Lala)Bukarau –SeniorAdviserTechnicalPublications• SaileshKumarSen –GraphicArtsOfficer
CoverPhotoSource:HTTP://WALLPAPERS.FREE-REVIEW.NET/42__BIG_WAVE.HTMBackCoverPhoto:RajSingh
Acknowledgements

AtechnicalpublicationproducedbytheSOPACCommunityLifelinesProgramme
ASOPACDesktopStudyof
Ocean-Based
Renewable Energy Technologies
SOPAC Miscellaneous Report 701
Ivan KrishnaCompiler
First edition
October 2009

SOPA
C M
isce
llane
ous
Rep
ort 7
01A SOPAC Desktop Study of Ocean-based-Renewable energy Technologies
4
A SOPAC Desktop Study of Ocean-based-Renewable energy Technologies A SOPAC Desktop Study of Ocean-based-Renewable energy Technologies
ACP eU member states in Africa, Caribbean and PacificADb Asian Development bankASTM American Standards and Measurements bureauAwS Archimedes wave Swing CDM Clean Development MechanismCwP Cold water PipeCiRAD Centre de co-opération internationale en Recherche Agronomique de DéveloppementCAD$ Canadian DollarsCO2 Carbon Dioxide DOe (USA) Department Of energy - USADeCM Direct energy Conversion MethodDTi Department of Trade and industry ePC electric Power Corporation, SamoaePA environmental Protection Agencyen european normeU european UnioneST early Stage TechnologieseMeC european Marine energy Centre FRP Fibreglass Reinforced PlasticFJ$ Fiji Dollar gDP gross Domestic ProductgeF global environmental Facilityghg greenhouse gas ieA international energy AgencyiMF international Monetary Fund kVA Kilo Volt Ampere, a measure of apparent powerkw Kilo watt, a measure of real power lFPM longitudinal Flux Permanent Magnet MJ Mega JouleMw Mega wattMST Multi-Stage TurbineMhD Magnetohydrodynamic nelhA natural energy laboratory of hawaii AuthorityniOT national institute of Ocean TechnologynaReC new and Renewable energy CentrenRel national Renewable energy laboratory OTeC Ocean Thermal energy ConversionCC-OTeC Closed Cycle OTeCOC-OTeC Open Cycle OTeCOwC Oscillating water column PiC Pacific island CountryPiePSAP Pacific island energy Policy and Strategic Action PlanPiFS Pacific island Forum SecretariatPiReP Pacific island Renewable energy ProjectPRO Pressure Retarded OsmosisPng Papua new guineaPTO Power Take-Off MechanismPM Permanent Magnet ReM Regional energy Officials MeetingReD Reversed electro DialysisRiTe Roosevelt island Tidal energy SeRi Solar energy Research instituteSOPAC Secretariat of the Pacific Applied geoscience CommissionSRP Société de Recherche du PacifiqueSPC Secretariat of the Pacific CommunitySPR Syncwave Power ResonatorSwelS Syncwave energy latching System SSg Seawave Slot-Cone generatorSARA Scientific Applications & Research AssociatesS.p.A Società per Azioni TFPM Transverse Flux Permanent Magnet UK United KingdomUnCTAD United nations Conference on Trade And DevelopmentUnDP United nations Development ProgrammeUn United nationsUnelCO Vanuatu’s Power UtilityUSP University of the South PacificUSA United States of AmericaUS$ United States Dollar VAT Value Added Tax weC wave energy Converterwb world bank
ListofAcronyms

A SOPAC Desktop Study of Ocean-based-Renewable energy Technologies
SOPA
C M
isce
llane
ous
Rep
ort 7
01
A SOPAC Desktop Study of Ocean-based-Renewable energy Technologies A SOPAC Desktop Study of Ocean-based-Renewable energy Technologies
5
Table of Contents
executive Summary.........................................................................................................................................................................................9
1. introduction...................................................................................................................................................................................................... 10
2. Ocean Thermal energy Conversion Technology.................................................................................... 11 2.1 introduction.................................................................................................................................................................................................................................................................... 11 2.2 background and history of OTeC ............................................................................................................................................................................................. 11 2.3 Technology Types.............................................................................................................................................................................................................................................. 13 2.3.1 Closed-Cycle OTeC..................................................................................................................................................................................................................... 13 2.3.1.1 Kalina and Uehara Cycles................................................................................................................................................................... 15 2.3.2 Open-Cycle OTeC........................................................................................................................................................................................................................ 17 2.3.3 hybrid OTeC System................................................................................................................................................................................................................. 19 2.4 Plant Design and location..................................................................................................................................................................................................................... 19 2.5 Other Uses of OTeC Technology................................................................................................................................................................................................. 21 2.5.1 Air Conditioning................................................................................................................................................................................................................................. 21 2.5.2 Chilled-soil Agriculture............................................................................................................................................................................................................. 21 2.5.3 Aquaculture............................................................................................................................................................................................................................................. 21 2.5.4 Desalination............................................................................................................................................................................................................................................ 22 2.5.5 hydrogen Production............................................................................................................................................................................................................... 22 2.5.6 Mineral extraction.......................................................................................................................................................................................................................... 22 2.6 limitations of OTeC Technologies............................................................................................................................................................................................. 22 2.6.1 Technical Challenges............................................................................................................................................................................................................... 22 2.6.2 engineering Challenges....................................................................................................................................................................................................... 24 2.6.3 Disadvantages of OTeC........................................................................................................................................................................................................ 24 2.6.4 OTeC and the environment............................................................................................................................................................................................ 25 2.6.5 economic Considerations and Market Potential.............................................................................................................................. 27 2.7 Discussion...................................................................................................................................................................................................................................................................... 28
3. wave energy Technology.......................................................................................................................................................... 30 3.1 introduction and background............................................................................................................................................................................................................ 30 3.1.1 hydrodynamics................................................................................................................................................................................................................................. 34 3.2 Technology Types............................................................................................................................................................................................................................................... 35 3.2.1 Oscillating bodies.......................................................................................................................................................................................................................... 36 3.2.1.1 Pelamis wave Power................................................................................................................................................................................... 36 3.2.1.2 AwS Ocean energy....................................................................................................................................................................................... 38 3.2.1.3 Fred Olsen’s FO3............................................................................................................................................................................................... 39 3.2.1.4 wavebob....................................................................................................................................................................................................................... 40 3.2.1.5 Finavera Renewables AquabuOy............................................................................................................................................ 40 3.2.1.6 wave energy Technologies (weT engen).................................................................................................................. 42 3.2.1.7 CeTO................................................................................................................................................................................................................................... 43 3.2.1.8 wave Star energy............................................................................................................................................................................................. 44 3.2.1.9 Seabased..................................................................................................................................................................................................................... 45 3.2.1.10 bioPower Systems (biowAVe)......................................................................................................................................................... 46 3.2.1.11 Aquamarine Power (Oyster)................................................................................................................................................................ 47

SOPA
C M
isce
llane
ous
Rep
ort 7
01A SOPAC Desktop Study of Ocean-based-Renewable energy Technologies
6
A SOPAC Desktop Study of Ocean-based-Renewable energy Technologies A SOPAC Desktop Study of Ocean-based-Renewable energy Technologies
3.2.1.12 Trident energy....................................................................................................................................................................................................... 48 3.2.1.13 Ocean navitas...................................................................................................................................................................................................... 48 3.2.1.14 Syncwave Systems....................................................................................................................................................................................... 49 3.2.2 Oscillating water Column................................................................................................................................................................................................... 50 3.2.2.1 wavegen....................................................................................................................................................................................................................... 51 3.2.2.2 Oceanlinx...................................................................................................................................................................................................................... 51 3.2.2.3 Offshore wave energy (Owel)..................................................................................................................................................... 52 3.2.2.4 Orecon............................................................................................................................................................................................................................. 53 3.2.3 Overtopping Devices................................................................................................................................................................................................................ 53 3.2.3.1 wave Dragon.......................................................................................................................................................................................................... 53 3.2.3.2 Seawave Slot-Cone generator (SSg)................................................................................................................................... 55 3.3 Secondary Technologies.......................................................................................................................................................................................................................... 55 3.3.1 Power Take-Off Methods..................................................................................................................................................................................................... 55 3.3.1.1 hydraulic System............................................................................................................................................................................................... 56 3.3.1.2 linear generator................................................................................................................................................................................................. 56 3.3.1.3 Magnetohydrodynamic generator.......................................................................................................................................... 57 3.4 wave Power Potential in Pacific island Countries................................................................................................................................................. 58 3.5 Discussion...................................................................................................................................................................................................................................................................... 59
4. Tidal energy Technology............................................................................................................................................................ 60 4.1 background.................................................................................................................................................................................................................................................................. 60 4.2 Technology Types.............................................................................................................................................................................................................................................. 61 4.2.1 Tidal barrage........................................................................................................................................................................................................................................ 61 4.2.1.1 Offshore Tidal lagoons, Tidal electric, UK................................................................................................................... 63 4.2.1.2 Tidal Delay, woodshed Technologies Pty ltd, Australia........................................................................... 63 4.2.1.3 Two-basin barrage, UnAM engineering institute, Mexico.................................................................... 63 4.2.1.4 environment implications of Tidal barrage................................................................................................................. 64 4.2.1.5 Cost effectiveness of Tidal barrages.................................................................................................................................... 65 4.2.2 Tidal Stream........................................................................................................................................................................................................................................... 65 4.2.2.1 SeaFlow and Seagen, Marine Current Technologies, UK.................................................................. 66 4.2.2.2 Verdant Power, USA....................................................................................................................................................................................... 68 4.2.2.3 hammerfest Strom AS, norway.................................................................................................................................................... 69 4.2.2.4 Underwater electric Kite, UeK Systems, US............................................................................................................... 69 4.2.2.5 Clean Current, Canada............................................................................................................................................................................. 70 4.2.2.6 Tidel, Soil Machine Dynamics hydrovision, UK.................................................................................................... 71 4.2.2.7 Open-Centre Turbine, Openhydro, ireland.................................................................................................................. 71 4.2.2.8 gorlov helical Turbine, gCK Technology, US......................................................................................................... 72 4.2.2.9 enermar Kobold Turbine, Ponte Di Archimede international S.p.A., italy...................................................................................................................................................................................................................... 72 4.2.2.10 wanxiang Vertical Turbines, China......................................................................................................................................... 73 4.2.2.11 Pulse Tidal PS100 energy Converter, UK...................................................................................................................... 73 4.3 Case Study: Tide-energy Project near the Mouth of the Amazon................................................................................................ 75 4.4 Discussion...................................................................................................................................................................................................................................................................... 78
5. Salinity gradient Technology................................................................................................................................................. 79 5.1 Reversed electro Dialysis (ReD)...................................................................................................................................................................................................... 79 5.2 Pressure Retarded Osmosis (PRO)............................................................................................................................................................................................. 80 5.3 Discussion...................................................................................................................................................................................................................................................................... 82
6. Conclusion and Recommendations.......................................................................................................................... 83 7. bibliography.................................................................................................................................................................................................... 84
Appendix A: economics for OTeC in Marshall islands............................................................................................................................................. 87
Appendix b: Ocean Technologies Session of the ReM & PeMM 2009, 22nd April 2009, nuku’alofa, Tonga.................................................................................................................................................................................................................... 88

A SOPAC Desktop Study of Ocean-based-Renewable energy Technologies
SOPA
C M
isce
llane
ous
Rep
ort 7
01
A SOPAC Desktop Study of Ocean-based-Renewable energy Technologies A SOPAC Desktop Study of Ocean-based-Renewable energy Technologies
7
Figure 2.1: The open-cycle OTeC at Keahole Point, hawaii island...................................................................................................................... 12Figure 2.2: Closed Rankine cycle OTeC flow diagram........................................................................................................................................................... 13Figure 2.3: T-S diagram of a typical Rankine Cycle operating between pressures of 0.06 bar and 50 bar.................................................................................................................................................................................................................................. 14Figure 2.4: evolution of the Rankin cycle to the Uehara Cycle................................................................................................................................... 16Figure 2.5: Diagram of the Uehara Cycle.................................................................................................................................................................................................... 17Figure 2.6: Open cycle OTeC flow diagram........................................................................................................................................................................................... 18Figure 2.7: hybrid OTeC system.............................................................................................................................................................................................................................. 19Figure 2.8: Map of suitable sites for OTeC............................................................................................................................................................................................... 20Figure 2.9: Artist's impression of an OTeC system........................................................................................................................................................................ 29
Figure 3.1: wave generation.......................................................................................................................................................................................................................................... 30Figure 3.2: Approximate global distribution of wave power levels......................................................................................................................... 31Figure 3.3: illustration of the wave nomenclature shown on Table 3.1............................................................................................................ 32Figure 3.4: illustration of how wave period and amplitude affect the wave power density............................................... 32Figure 3.5: Power per meter of wave front................................................................................................................................................................................................. 33Figure 3.6: Types of wave energy converters........................................................................................................................................................................................ 35Figure 3.7: Pelamis attenuator..................................................................................................................................................................................................................................... 37Figure 3.8: Archimedes wave-swing energy system by AwS Ocean energy...................................................................................... 38Figure 3.9: Fred Olsen’s FO3......................................................................................................................................................................................................................................... 39Figure 3.10: The wavebob................................................................................................................................................................................................................................................... 40Figure 3.11: Diagram of the AquabuOy’s operation....................................................................................................................................................................... 41Figure 3.12: Diagram of the weT engen........................................................................................................................................................................................................ 42Figure 3.13: weT engen prototype at Sandy Cove, nova Scotia................................................................................................................................ 42Figure 3.14: The CeTO i prototype in Fremantle, Australia.................................................................................................................................................... 43Figure 3.15: CeTO ii wave energy converter.............................................................................................................................................................................................. 44Figure 3.16: wave Star prototype at nissum bredning, Denmark............................................................................................................................... 45Figure 3.17: Diagram of the direct drive linear generator........................................................................................................................................................ 45Figure 3.18: biowAVe model being tested in a wave tank.................................................................................................................................................. 46Figure 3.19: Full-scale Oyster............................................................................................................................................................................................................................................ 47Figure 3.20: Oyster wave energy conversion system.................................................................................................................................................................... 47Figure 3.21: DeCM wave tank trials......................................................................................................................................................................................................................... 48Figure 3.22: Trident’s 20 kw prototype................................................................................................................................................................................................................ 48Figure 3.23: Aegir Dynamos’ operational diagram and full-scale device......................................................................................................... 49Figure 3.24: Syncwave Power Resonator prototype “Charlotte”..................................................................................................................................... 49Figure 3.25: Diagram of the liMPeT....................................................................................................................................................................................................................... 51Figure 3.26: Oceanlinx’s OwC........................................................................................................................................................................................................................................ 52Figure 3.27: grampus model in wave tank tests.................................................................................................................................................................................. 53Figure 3.28: wave Dragon diagram and prototype.......................................................................................................................................................................... 54Figure 3.29: Ramp used in the wave Dragon......................................................................................................................................................................................... 54Figure 3.30: Artist's impression of the Seawave Slot-Cone generator................................................................................................................... 55Figure 3.31: TFPM machine with flux concentration and stationary magnets.......................................................................................... 57Figure 3.32: 100 Kw laboratory prototype MweC system during testing at SARA in March 2007............................. 58 Figure 4.1: barrage in la Rance at high tide......................................................................................................................................................................................... 63Figure 4.2: barrage in la Rance at low tide............................................................................................................................................................................................ 64Figure 4.3: The Seagen rotors can be raised above the surface for maintenance..................................................................... 66Figure 4.4: Seagen’s predecessor, the 300 kw ‘SeaFlow’ turbine off the north coast of Devon................................ 67Figure 4.5: Verdant Power Free Flow Turbines at RiTe Project, new york City.................................................................................... 68Figure 4.6: hammerfest Strom’s prototype being deployed............................................................................................................................................ 69Figure 4.7: Underwater electric Kite prototype..................................................................................................................................................................................... 69
ListofFigures

SOPA
C M
isce
llane
ous
Rep
ort 7
01A SOPAC Desktop Study of Ocean-based-Renewable energy Technologies
8
Figure 4.8: Clean Current’s prototype deployment........................................................................................................................................................................ 70Figure 4.9: Diagram of Clean Current's prototype........................................................................................................................................................................... 70Figure 4.10: Tidel prototype................................................................................................................................................................................................................................................. 71Figure 4.11: Open hydro turbine at the test site................................................................................................................................................................................... 71Figure 4.12: gorlov helical turbine............................................................................................................................................................................................................................ 72Figure 4.13: Kobold turbine................................................................................................................................................................................................................................................. 73Figure 4.14: Pulse Tidal’s 100 kw humber prototype system........................................................................................................................................... 74Figure 4.15: Comparison between using hydrofoils versus turbines..................................................................................................................... 74Figure 4.16: Rural artisans assembled, installed, and operate this 6-blade gorlov helical turbine............................ 75Figure 4.17: Managing tidal flow with two jetties, a duct, and a gate..................................................................................................................... 76Figure 4.18: Automotive alternator............................................................................................................................................................................................................................. 77Figure 4.19: Pulley, 1.08 m in diameter and belt.................................................................................................................................................................................. 77Figure 4.20: 6-blade gorlov helical turbine.................................................................................................................................................................................................. 77 Figure 5.1: Diagram of Reverse electro dialysis................................................................................................................................................................................. 79Figure 5.2: Diagram of the PRO process..................................................................................................................................................................................................... 81
ListofTables
Table 2.1: Comparison of required seawater for OTeC plant..................................................................................................................................... 17Table 2.2: The net benefits............................................................................................................................................................................................................................................ 28Table 3.1: wave nomenclature for calculating wave power......................................................................................................................................... 31Table 3.2: Development status of oscillating bodies................................................................................................................................................................ 36Table 3.3: eMineT economic Analysis........................................................................................................................................................................................................ 37Table 3.4: Pelamis feasibility study, new Caledonia................................................................................................................................................................. 38Table 3.5: Development status of OwC technology................................................................................................................................................................ 50Table 3.6: Comparison of buoy and geOSAT Mean Significant wave height................................................................................. 59

A SOPAC Desktop Study of Ocean-based-Renewable energy Technologies
SOPA
C M
isce
llane
ous
Rep
ort 7
01
Ocean based Renewable energy Technologies
9
Executive Summary
Atthe2009PacificEnergyMinisters'Meeting(PEMM)held inTonga,PacificIslandLeadersrecognised that energy security is an imperative for economic growth and human development. Pacificislandeconomiesarethemostvulnerableintheworldtorisingoilpricesandthereforethere is an urgent need to reduce this vulnerability through the use of renewable sources of energy.ThePacificOcean,thelargestoceanintheworldcouldbeoneoftherenewableenergysourcesforPacificIslandCountries.
Energyfromtheoceanscanbedividedintothreemaincategories,oceanthermal,waveenergyand tidal current energy. Apart from the above there is another category called salinity gradient which uses the known property of mixing freshwater with seawater to release energy. The challengeistoutilisethisenergy,sincetheenergyreleasedfromthemixingonlygivesaverysmall increase in the local temperature of the water. Two concepts for converting this energy into electricityinsteadofheathavebeenidentified,ReversedElectroDialysis(RED)andPressureRetarded Osmosis (PRO).
Ocean Thermal Energy Conversion or OTEC for short is a technology that utilises the heat energy stored in the ocean’s natural temperature gradient. In principle, OTEC utilises thedifference in temperaturebetween thewarm,surfaceseawaterand thecold,deepseawaterto drive a turbine that is connected to a generator which in turn produces electricity. Ideally for practicaloperation, it isdesirable that the temperaturedifferencebetween thewarmsurfacewaterand thecolddeepwaterbeat least20˚C. OTEC has potential in a limited number of PacificIslandCountries.
Harnessingenergyfromtidesusingtidalbarrageshasbyfarthelongesthistoryofsuccessfulgeneration of electricity from ocean resources. It represents an older and mature technology with apotentialfornegativeenvironmentalimpacts.InLaRance,France,a240MWtidalbarragehasbeeninoperationforover40years.Tidalstreamenergyrepresentsadifferentapproachtoextractingenergyfromtidesorothermarinecurrents.Ratherthanusingadamstructure,thedevicesareplaceddirectly“in-stream”andgenerateenergyfromtheflowofwater.SeaGenistheworld’sfirstlargescalecommercialtidalstreamgeneratorandgenerates1.2MWbetween18-20hoursaday.NewZealandiscurrentlyworkingtowardsthedevelopmentofaprojectontheKaiparaHarbourontheWestCoastnorthofAuckland.
A variety of technologies have been proposed to capture the energy from waves. Some of the more promising designs such as the Pelamis and the Archimedes wave swing are undergoing demonstrationtestingatcommercialscales.Whileallwaveenergytechnologiesareintendedtobeinstalledatornearthewater’ssurface,theydifferintheirorientationtothewaveswithwhichthey are interacting and in the manner in which they convert the energy of the waves into other energy forms.
Thisreporttracesthedevelopmentoftheaboveoceanenergyconversionmethods,alongwiththeirimpactontheenvironment,economicviability,sustainabilityandapplicabilitytothePacificregion.

SOPA
C M
isce
llane
ous
Rep
ort 7
01Ocean based Renewable energy Technologies
10
1. Introduction
Theworld’soceansholdanawesomeamountofpower,buteffectivewaystoharnessithavebeenelusive.Oceanscovermorethan70%ofPlanetEarth’ssurface,makingthemtheworld’slargest solar collectors. The sun’s heat warms the surface water a lot more than the deep ocean water,andthistemperaturedifferencecreatesthermalenergy.
The energy in ocean waves is a form of concentrated solar energy that is transferred through complexwind-waveinteractions.Theeffectsofearth’stemperaturevariationduetosolarheatingcombined with a multitude of atmospheric phenomena create global wind currents. These wind currentsareresponsibleforwavegeneration.Ontheotherhand,oceantidesarecyclicvariationsinseawaterelevationandflowvelocityareadirectresultoftheearth’smotionwithrespecttothemoon and the sun and the interaction of their gravitational forces. A number of factors relating to theearth’sgravitationalandrotationalforcescausethetideconditionstovarysignificantlyovertime. Tide conditions are more apparent in coastal areas where constrained channels increase thewaterflowandincreasetheenergydensity.Theformsofoceanrenewablesourcescanbebroadlycategorizedinto:(a)Tidal(b)Wave(c)MarineCurrent(d)TemperatureGradientand(e)SalinityGradient.
Ocean Tides: Potential energy associated with tides can be harnessed by building barrages or other formsof turbine-equipped construction across anestuary.
OceanWaves: Energy associated with ocean waves can be harnessed using modular types of technologies.
Marine Current: Kineticenergyassociatedwithtidal/marinecurrentscanbeharnessedusing modular systems.
TemperatureGradient: Thermal energy due to temperature gradient between sea surface and deep-water canbeharnessedusingdifferentocean thermalenergyconversion (OTEC) processes.
SalinityGradient: At the mouths of rivers where fresh water mixes with saltwater,energy associated with the salinity gradient can be harnessed using a pressure-retardedreverseosmosisprocessandassociatedconversiontechnologies.
The trials of various concepts and reported successes of several deployments in the ocean renewable energy sector, especially the fields of tidal current and wave energy conversiontechnologyhavegainedsignificantattentionthroughouttheworld.Manytechnologiesarealsobeingexploredforenergyusesotherthanelectricitygeneration,suchas,producingdrinkingwaterthroughdesalination,supplyingcompressedairforaquaculture,andhydrogenproductionby electrolysis.
Harnessingenergyfromtidesusingtidalbarrageshasbyfarthelongesthistoryofsuccessfulgeneration of electricity from ocean resources. It represents an older and mature technology with a potential for negative environmental impacts. In France, the La Rance Barrage hasbeeninoperationforover40yearswithacapacityof240MW.Otheroceanrenewableenergysources, such as salinity gradient offer further potential for extraction of renewable energy.While the resource potential is considerable, the development of systems for harnessingocean energy resources are mostly in the infancy stage with very few experiencing any kind of pre-commercialdeployment.

Ocean based Renewable energy Technologies
SOPA
C M
isce
llane
ous
Rep
ort 7
01
Ocean based Renewable energy Technologies
11
2.OceanThermalEnergyConversion Technology
2.1 IntroductionOcean Thermal energy Conversion or OTeC for short is a method for generating electricity that utilises the heat energy stored in the ocean’s natural temperature gradient. in principle, OTeC utilises the difference in temperature between the warm, surface seawater and the cold, deep seawater to drive a turbine that is connected to a generator which in turn produces electricity. ideally, for practical operation, it is always desirable that the temperature difference between the warm surface water and the cold deep water be at least 20°C. The temperature difference that exists between the surface and deep sea water throughout the tropical regions of the world is usually constant all year round.
OTeC operates on a reverse principle to refrigerators and air conditioners where an OTeC fluid with a low boiling point (e.g. ammonia) is used and turned into vapour by heating it up with warm sea water. The pressure of the expanding vapour turns a turbine and produces electricity. Cold sea water is then used to reliquefy the fluid. One important by product of these techniques is fresh water. This is also an indirect method of utilising solar energy. A large amount of solar energy is collected and stored in tropical oceans. The surface of the water acts as the collector for solar heat, while the upper layer of the sea constitutes infinite heat storage reservoir. Thus the heat contained in the ocean could be converted to electricity by utilising the temperature difference between the warm surface waters and the colder waters in the depths of about 20 – 750 m.
2.2 BackgroundandHistoryof OTEC [1]in 1881, Jacques Arsene d’Arsonval, a French physicist, proposed tapping the thermal energy of the ocean. it was d’Arsonval’s student, georges Claude who actually built the first OTeC plant at Matanzas bay, Cuba, in 1930. The system generated 22 kw of electricity using a low-pressure turbine. in 1935, Claude constructed another plant aboard a 10,000 tonnes cargo vessel moored off the coast of brazil. weather and waves destroyed both plants before they could become net power generators.
Then in 1956, French researchers designed a 3 Mw plant for Abidjan, Côte d’ivoire. The plant was never completed due to the large amounts of cheap oil that became available in the 1950s and competition from inexpensive hydroelectric power. in 1962, J. hilbert Anderson and James h. Anderson, Jr. started designing a cycle to accomplish what Claude had not. They focused on developing new, more efficient component designs. After working through some of the problems in Claude’s design they patented their new “closed cycle” design in 1967.

SOPA
C M
isce
llane
ous
Rep
ort 7
01A SOPAC Desktop Study of Ocean-based-Renewable energy Technologies
12
A SOPAC Desktop Study of Ocean-based-Renewable energy Technologies A SOPAC Desktop Study of Ocean-based-Renewable energy Technologies
The United States of America (USA) became involved in OTeC research in 1974, when the natural energy laboratory of hawai'i Authority (nelhA) was established at Keahole Point on the Kona coast of hawaii. The laboratory has now become one of the world’s leading test facilities for OTeC technology. hawai'i is often said to be the best location in the USA for OTeC, due to the warm surface water, excellent access to deep cold water and because hawai'i has the highest electricity costs in the USA. in 1979, the first 50 kw closed cycle OTeC demonstration plant went up at nelhA. Known as “Mini-OTeC,” the plant was mounted on a converted U.S. navy barge moored approximately 2 km off Keahole Point. The plant produced 52 kw of gross power and a net power of 15 kw.
Although Japan has no potential OTeC sites it has been a major contributor to the development of the technology, primarily for export to other countries. The Tokyo electric Power Company successfully built and deployed a 120 kw closed cycle OTeC plant on the island of nauru. The plant, which became operational on the 14th of October, 1981, produced about 120 kw of electricity; 90 kw was used to power the plant itself and the remaining electricity was used to power a school and several other places in nauru. This set a world record for power output from an OTeC system where the power was sent to a real power grid. This plant employed cold-water pipe laid on the sea bed to a depth of 580 meters. Freon was the working fluid, and a titanium shell-and-tube heat exchanger was used. The plant surpassed engineering expectations by producing 30 kw of net power during continuous operating tests. Unfortunately the plant was destroyed by a cyclone in 1984.
Figure 2.1: The open-cycle OTeC at Keahole Point, hawai'i island (Source: [1]).

A SOPAC Desktop Study of Ocean-based-Renewable energy Technologies
SOPA
C M
isce
llane
ous
Rep
ort 7
01
A SOPAC Desktop Study of Ocean-based-Renewable energy Technologies A SOPAC Desktop Study of Ocean-based-Renewable energy Technologies
13
india piloted a 1 Mw floating OTeC plant 30 km off shore from Tuticorin, South east of india. This was a result of collaborative work done between Saga University of Japan and the national institute of Ocean Technology (niOT) in india. niOT has also set up an island-based low temperature thermal desalination plant at Kavaratti, india, in 2005; and demonstrated an experimental barge-mounted desalination plant off the Chennai Coast, india, in 2007.
2.3 TechnologyTypesOTeC obtains the thermal energy associated with the temperature difference between the warm seawater in surface layer and the cold seawater at greater depth. when there is any thermal head, the heat should transfer from the higher temperature side to the lower temperature side naturally. it is the differential in temperature of the fluid that is used to create an increase in pressure in another. This increase in pressure is utilised to generate mechanical work which in turn generates electricity. The open-cycle, closed Rankine cycle, Kalina cycle and the Uehara cycle are some considerations for OTeC operation.
OTeC systems rely on the basic relationship between pressure, temperature and volume of a fluid, which is governed by the following equation known as the ideal gas law:-
where (P) is the absolute pressure of the gas, (V) is the volume of the gas, (n) is the amount of the gas usually represented in moles, (R) is the gas constant (which is 8.314472 JK-1mol-1 in Si units) and T is the absolute temperature.
2.3.1 Closed-CycleOTEC(CC-OTEC)The operation of a CC-OTeC plant mainly uses anhydrous ammonia as the working fluid. Figure 2.2 shows a simplified flow diagram of the CC-OTeC cycle.
PV =nRTPV/T=nRPV/T=constant
Warm
Surface Seawater
Turbine Generator
Condenser
Evaporator
Cold Seawater
Warm
Seawater Pump
Cold
Seawater Pump
Working
Fluid Pump
Figure 2.2: Closed rankine Cycle OTeC flow diagram (Source: [5]).

SOPA
C M
isce
llane
ous
Rep
ort 7
01A SOPAC Desktop Study of Ocean-based-Renewable energy Technologies
14
A SOPAC Desktop Study of Ocean-based-Renewable energy Technologies A SOPAC Desktop Study of Ocean-based-Renewable energy Technologies
The closed-cycle system uses a working fluid, such as ammonia, pumped around a closed loop, which has three components: a pump, turbine and heat exchanger (evaporator and condenser). in Figure 2.2 warm seawater passing through the evaporator converts the ammonia liquid 4 into high-pressure ammonia vapour at 5. The high-pressure vapour 1 is then fed into an expander where it passes through and rotates a turbine which is connected to a generator. Cold sea water passing through the condenser converts the ammonia vapour 2 from the turbine into liquid. The ammonia liquid 3 from the condenser is then pumped again into the evaporator.
CC-OTeC operates by following the Rankine cycle which is used by steam heat engines that are commonly found in power generation plants. The working fluid in a Rankine cycle follows a closed loop and is re-used constantly. The water vapour often seen billowing from power stations is generated by the cooling systems (not from the closed-loop Rankine power cycle) and represents the waste heat that could not be converted to useful work. note that steam is invisible until it comes in contact with cool, saturated air, at which point it condenses and forms the white billowy clouds, seen leaving cooling towers. in CC-OTeC, ammonia is usually the fluid of choice due to its low boiling point.
Box1:ProcessesoftheRankinecycle[2]
Figure 2.3: T-S diagram of a typical Rankine cycle operating between pressures of 0.06 bar and 50 bar (Source: [3])
Variables:
heat flow rate to or from the system (energy per unit time)
Mass flow rate (mass per unit time)
Mechanical power consumed by or provided to the system (energy per unit time)
Thermodynamic efficiency of the process (net power output per heat input, dimensionless)
isentropic efficiency of the compression (feed pump) and expansion (turbine) processes, dimensionless
Q.
W.
m.
therm
pump, turb

A SOPAC Desktop Study of Ocean-based-Renewable energy Technologies
SOPA
C M
isce
llane
ous
Rep
ort 7
01
A SOPAC Desktop Study of Ocean-based-Renewable energy Technologies A SOPAC Desktop Study of Ocean-based-Renewable energy Technologies
15
2.3.1.1 KalinaandUeharaCycles[3]looking back on the history of thermal cycle technology, every approach has been tried with the Rankine cycle, of which the theory was established by Rankine in 1851, but invented by watt in 1769. The Rankine cycle is based on using a singly composed thermal medium as the working fluid.
in 1985, Dr Kalina put forward a new cycle employing quite a different concept with an ammonia/water mixture as the heat medium. The new cycle was called the ‘Kalina cycle’ and attained significant improvement of cycle efficiency, which was a large jump up on previous known cycles; however, the efficiency varied depending upon conditions. For example under the condition of 28˚C warm water and 4˚C cold water, the expected thermal cycle efficiency of the conventional Rankine cycle is 3%, while 5% efficiency is expected by applying the Kalina cycle.
The “specific enthalpies” at indicated points on the T-S diagram
The final “specific enthalpy” of the fluid if the turbine was isentropic
The pressures before and after the compression process
There are four processes in the Rankine cycle, each changing the state of the working fluid. These states are identified by number in Figure 2.3.
Process1-2: The working fluid is pumped from low to high pressure, as the fluid is a liquid at this stage, the pump requires little input energy.
Process2-3: The high pressure liquid enters a boiler where it is heated at constant pressure by an external heat source to become a dry saturated vapour.
Process3-4: The dry saturated vapour expands through a turbine, generating power. This decreases the temperature and pressure of the vapour, and some condensation may occur.
Process4-1: The wet vapour then enters a condenser where it is condensed at a constant pressure and temperature to become a saturated liquid. The pressure and temperature of the condenser is fixed by the temperature of the cooling coils as the fluid is undergoing a phase-change.
based on a unit mass flow rate of ammonia vapour (kg per second), the CC–OTeC standard
h1,h2,h3,h4
h4s
p1, p2,

SOPA
C M
isce
llane
ous
Rep
ort 7
01A SOPAC Desktop Study of Ocean-based-Renewable energy Technologies
16
A SOPAC Desktop Study of Ocean-based-Renewable energy Technologies A SOPAC Desktop Study of Ocean-based-Renewable energy Technologies
in 1993, Uehara and ikegami conducted the parametric performance analysis of OTeC using the Kalina cycle and found that efficiency of the Kalina cycle became 5% when the inlet warm seawater temperature was 28˚C and the inlet cold seawater temperature was 4˚C. If they used the ammonia-water mixture as the working fluid of the Kalina cycle for OTeC, the performance of evaporator and condenser in the Kalina cycle was smaller than that of the conventional Rankine cycle using a pure fluid. especially, the performance of the condenser became considerably lower in value, a large amount of deep cold seawater and the surface area of condenser were required. in order to correct the defect of the Kalina cycle, Uehara and his colleague developed a new system in 1994, known as the Uehara cycle shown in Figure 2.5. The Kalina cycle had added a separator, a regenerator, and an absorber to improve the cycle efficiency. The Uehara cycle further adds a second turbine, a heater, and an after-condenser to improve its efficiency much more [4].
Figure 2.4: evolution of the Rankin Cycle to the Uehara Cycle (Source [3]).
Evaporator
Absorber
Separator Turbine 1
Turbine 2
Condenser After
Condenser
Heater
Regenerator
Circulation Pump
Circulation Pump
Cold Seawater
Pump
Warm Seawater
Pump
Rankin Cycle
Kalina Cycle
Uehara Cycle
There is however a consequence for employing a heat medium composed of a mixture in the thermal cycle which results in a considerable increase in load on the heat exchangers particularly the condenser. For the purpose of relieving condenser load, a new thermal cycle using ammonia/water mixture was invented, in 1994. The Uehara cycle assures theoretically higher efficiency than the Kalina cycle by lessening the load for the condenser by means of extraction of vapor from the turbine [3]. Figure 2.4 shows the evolution of the Rankin cycle to the Uehara cycle, where additional components as depicted by the different colours are added on with respect to each cycle.

A SOPAC Desktop Study of Ocean-based-Renewable energy Technologies
SOPA
C M
isce
llane
ous
Rep
ort 7
01
A SOPAC Desktop Study of Ocean-based-Renewable energy Technologies A SOPAC Desktop Study of Ocean-based-Renewable energy Technologies
17
Condition:Grossoutput100MWSurfacewatertemp.28˚CDepthwatertemp.4˚C
Conventional Rankine AdvancedUehara
warm surface seawater 200 m3/s 110 m3/s
Cold Depth seawater 200 m3/s 120 m3/s
2.3.2 Open-CycleOTEC(OC-OTEC)The open-cycle system is generally similar to the closed-cycle system and uses the same basic components. in principle OC-OTeC consists of the following main steps:
1. Flash evaporation of a fraction of the warm seawater by reduction of pressure below the saturation value corresponding to its temperature.
2. expansion of the vapour through a turbine to generate power.
3. heat transfer to the cold seawater thermal sink resulting in condensation of the working fluid.
4. Compression of the non-condensable gases (air released from the seawater streams at the low operating pressure) to pressures required to discharge them from the system. in the case of a surface condenser the condensate (desalinated water) must be compressed to pressures required to discharge it from the power generating system.
Figure 2.5: Diagram of the Uehara Cycle (Source [3]).
Table 2.1: Comparison of required seawater for OTeC plant [4]
Evaporator
Separator Turbine 1
Turbine 2
Condenser
After
Condenser
Heater Regenerator
Cold Seawater Pump
Warm Seawater
Pump
Circulation Pump
Absorber
Diffuser
Tank 1
Tank 2
Circulation Pump

SOPA
C M
isce
llane
ous
Rep
ort 7
01A SOPAC Desktop Study of Ocean-based-Renewable energy Technologies
18
A SOPAC Desktop Study of Ocean-based-Renewable energy Technologies A SOPAC Desktop Study of Ocean-based-Renewable energy Technologies
Figure 2.6: Open-cycle OTeC flow diagram (Source [6]).
The open-cycle system uses the warm seawater as the working fluid. in Figure 2.6 the warm seawater passing through the evaporator 1 is converted to steam 2 (0.5% of warm seawater entering the evaporator is converted to steam), which drives the turbine/generator. After leaving the turbine 3, the steam is cooled by the cold seawater to form desalinated water. The desalinated water is pure freshwater which can be used for domestic and commercial use.
Description of the flash evaporation process excerpted from [5]:
“Flash evaporation is a distinguishing feature of the OC-OTeC where by it involves complex heat and mass transfer processes which occurs when warm seawater undergoes a reduction in pressure by passing through a throttling valve or other throttling device. exposed to this low-pressure environment, water in the spray begins to boil. As in thermal desalination plants, the vapour produced is relatively pure steam. As steam is generated, it carries away with it its heat of vaporization. This energy comes from the liquid phase and results in a lowering of the liquid temperature and the cessation of boiling. Thus, as mentioned above, flash evaporation can be seen as a transfer of thermal energy from the bulk of the warm seawater to the small fraction of mass that is vaporized to become the working fluid. effluent from the low-pressure condenser must be returned to the environment. liquid can be pressurized to ambient conditions at the point of discharge by means of a pump or, if the elevation of the condenser is suitably high, it can be compressed hydrostatically. non-condensable gases, which include any residual water vapour, dissolved gases that have come out of solution, and air that may have leaked into the system, must be pressurised with a compressor. Although the primary role of the compressor is to discharge exhaust gases, it usually is perceived as the means to reduce pressure in the system below atmospheric. For a system that includes both the OC-OTeC heat engine and its environment, the cycle is closed and parallels the Rankine cycle.”
SOPA
C M
isce
llane
ous
Rep
ort 7
01A SOPAC Desktop Study of Ocean-based-Renewable energy Technologies
18
A SOPAC Desktop Study of Ocean-based-Renewable energy Technologies A SOPAC Desktop Study of Ocean-based-Renewable energy Technologies
Figure 2.6: Open-cycle OTeC flow diagram SOURCe
The open-cycle system uses the warm seawater as the working fluid. in Figure 2.6 the warm seawater passing through the evaporator 1 is converted to steam 2 (0.5% of warm seawater entering the evaporator is converted to steam), which drives the turbine/generator. After leaving the turbine 3, the steam is cooled by the cold seawater to form desalinated water. The desalinated water is pure freshwater which can be used for domestic and commercial use.
Description of the flash evaporation process excerpted from [5]:
“Flash evaporation is a distinguishing feature of the OC-OTeC where by it involves complex heat and mass transfer processes which occurs when warm seawater undergoes a reduction in pressure by passing through a throttling valve or other throttling device. exposed to this low-pressure environment, water in the spray begins to boil. As in thermal desalination plants, the vapour produced is relatively pure steam. As steam is generated, it carries away with it its heat of vaporization. This energy comes from the liquid phase and results in a lowering of the liquid temperature and the cessation of boiling. Thus, as mentioned above, flash evaporation can be seen as a transfer of thermal energy from the bulk of the warm seawater to the small fraction of mass that is vaporized to become the working fluid. effluent from the low-pressure condenser must be returned to the environment. liquid can be pressurized to ambient conditions at the point of discharge by means of a pump or, if the elevation of the condenser is suitably high, it can be compressed hydrostatically. non-condensable gases, which include any residual water vapour, dissolved gases that have come out of solution, and air that may have leaked into the system, must be pressurised with a compressor. Although the primary role of the compressor is to discharge exhaust gases, it usually is perceived as the means to reduce pressure in the system below atmospheric. For a system that includes both the OC-OTeC heat engine and its environment, the cycle is closed and parallels the Rankine cycle.”
Warm Surface Seawater
Turbine Generator
Condenser
Flash Evaporator
Cold Seawater
Warm Seawater Pump
Cold Seawater Pump
1
2
3
4
Throttling Device
Non- Condensable
gases
Desalinated Water
Evaporator
Separator Turbine 1
Turbine 2
Condenser
After
Condenser
Heater Regenerator
Cold Seawater Pump
Warm Seawater
Pump
Circulation Pump
Absorber
Diffuser
Tank 1
Tank 2
Circulation Pump

A SOPAC Desktop Study of Ocean-based-Renewable energy Technologies
SOPA
C M
isce
llane
ous
Rep
ort 7
01
A SOPAC Desktop Study of Ocean-based-Renewable energy Technologies A SOPAC Desktop Study of Ocean-based-Renewable energy Technologies
19
2.3.3 HybridOTECSystem
Figure 2.7: hybrid OTeC system (Source [6]).
The hybrid cycle shown in Figure 2.7 is an attempt to combine the best features of both the closed-cycle and open-cycle systems. in a hybrid OTeC system, warm seawater enters a vacuum chamber where it is flash evaporated into steam, similar to the open-cycle evaporation process. The steam vaporises the ammonia working fluid of a closed-cycle loop on the other side of an ammonia vaporiser. The vaporised fluid then drives a turbine to produce electricity. The steam condenses within the heat exchanger and provides desalinated water.
Although components to test the technology are widely available, no commercial-scale plants or even pilot plants connected to a grid exist. The most ambitious prototype to date was an indian research vessel that carried a 1 Mw OTeC plant in 2002. That effort, a collaboration with the Japanese company Xenesys inc. and Saga University in Japan, was unsuccessful due to a failure of the deep sea cold water pipe [6].
Alternatively hybrid OTeC could also be described as either closed-cycle or open-cycle OTeC, incorporated with other renewable energy technologies such as wind power, solar power, wave power or tidal power.
2.4 PlantDesignandLocationThe location of a commercial OTeC plant has to be in an environment that is stable enough for an efficient system operation. The temperature differential at the site has to be at least 20°C. generally the natural ocean thermal gradient necessary for OTeC operation is found between latitudes 20°n and 20°S.
Warm
Surface Seawater
Turbine
Generator
Condenser Flash
Evaporator
Cold Seawater
Warm
Seawater Pump
Cold
Seawater Pump
Throttling
Device
Non-
Condensable gases
Desalinated
Water
Working
Fluid Pump
Vacuum
Pump

SOPA
C M
isce
llane
ous
Rep
ort 7
01A SOPAC Desktop Study of Ocean-based-Renewable energy Technologies
20
A SOPAC Desktop Study of Ocean-based-Renewable energy Technologies A SOPAC Desktop Study of Ocean-based-Renewable energy Technologies
Figure 2.8: Map of suitable sites for OTeC (Source: [7])
The following summarises the availability of the ocean thermal resource throughout the world [5]:
1. Equatorial waters, defined as lying between 10˚N and 10˚S are adequate except for the west Coast of South America; significant seasonal temperature enhancement (e.g., with solar ponds) would be required on the west Coast of Southern Africa; moreover, deep water temperature is warmer by about 2˚C along the East Coast of Africa.
2. Tropical waters, defined as extending from the equatorial region boundary to, respectively, 20˚N and 20˚S, are adequate, except for the West Coasts of South America and of Southern Africa; moreover, seasonal upwelling phenomena would require significant temperature enhancement for the west Coast of northern Africa, the horn of Africa, and off the Arabian Peninsula. The physical factors affecting OTeC site selection, i.e., thermal resource and seafloor bathymetry, greatly restrict the number of desirable sites along the shoreline of major continents, unless some warm seawater temperature enhancement is possible. The best, land-based, OTeC sites consist of island locations. The severe constraint of a favourable bathymetric profile, for the practical implementation of land-based OTeC technologies, would be relaxed to a considerable extent with floating OTeC plants. The potential benefits of OTeC could only be recovered on a large scale through the development of an ambitious floating-plant program, following the initial experimental land-based OTeC phase.
There are many other points to be considered when evaluating potential OTeC sites, from logistics to socioeconomic and political factors. One argument in favour of OTeC lies in its renewable character where it may be seen as the means to provide remote and isolated communities with some degree of energy independence, and to offer them a potential for safe economic development. Paradoxically, such advantages are often accompanied by serious logistical problems during the plant construction and installation phases. if an island is under development, it is likely to lack the infrastructure desirable for this type of project, including harbours, airports, good roads and communication systems. Moreover, the population base should be compatible with the OTeC plant size with adequate personnel to operate the plant, and the electricity and desalinated water plant outputs should match local consumption in orders of magnitude. 1 to 10 Mw plants would generally suffice in most small Pacific islands, whereas in the case of populous and industrialised countries several of the largest feasible OTeC plants, up to 100 Mw, could be considered.

A SOPAC Desktop Study of Ocean-based-Renewable energy Technologies
SOPA
C M
isce
llane
ous
Rep
ort 7
01
A SOPAC Desktop Study of Ocean-based-Renewable energy Technologies A SOPAC Desktop Study of Ocean-based-Renewable energy Technologies
21
2.5 OtherUsesofOTECTechnology
Section2.5anditsfollowingsub-sectionsareexcerptedfromWikipedia[1]ction2.5anditsfollowingsub-sectionsareexcerptedfromWikipedia[1].
2.5.1 AirConditioningThe cold (5°C) seawater made available by an OTeC system creates an opportunity to provide large amounts of cooling to operations that are related to or close to the plant. The cold seawater delivered to an OTeC plant can be used in chilled-water coils to provide air-conditioning for buildings. it is estimated that a pipe 0.3 meters in diameter can deliver 0.08 cubic meters of water per second (4700 gallons per minute); if 6°C water is received through such a pipe, it could provide more than enough air-conditioning for a large building. if this system operates 8,000 hours per year and local electricity sells for 5¢-10¢ per kilowatt-hour, it would save $200,000-$400,000 in energy bills annually.
The interContinental Resort and Thalasso-Spa on the island of bora bora uses an OTeC system to air-condition its buildings. The system accomplishes this by passing cold seawater through a heat exchanger where it cools freshwater in a closed loop system. This cool freshwater is then pumped to buildings and is used for cooling directly with no conversion to electricity taking place.
2.5.2 Chilled-soilAgricultureOTeC technology also supports chilled-soil agriculture. when cold seawater flows through underground pipes, it chills the surrounding soil. The temperature difference between plant roots in the cool soil and plant leaves in the warm air allows many plants that evolved in temperate climates to be grown in the subtropics. The Common heritage Corporation, a former tenant at the natural energy laboratory in hawai'i and the holder of the patent on this process, maintained a demonstration garden with more than 100 different fruits and vegetables, many of which would not normally survive in hawai'i. no chilled-soil agriculture is presently being undertaken at the nelhA.
2.5.3 AquacultureAquaculture is the most well known by-product of OTeC. it is widely considered to be one of the most important ways to reduce the financial and energy costs of pumping large volumes of water from the deep ocean. Deep ocean water contains high concentrations of essential nutrients that are depleted in surface waters due to biological consumption. This "artificial upwelling" mimics the natural upwelling that is responsible for fertilising and supporting the world's largest marine ecosystems, and the largest densities of life on the planet.
Cold-water delicacies, such as salmon and lobster, thrive in the nutrient-rich, deep, seawater from the OTeC process. Microalgae such as Spirulina, a health food supplement, also can be cultivated in the nutrient-rich water. given the OTeC process uses cold, deep-ocean water and warm ocean water from the surface, it can be combined in various ratios to deliver seawater of a specific temperature conducive to maintaining an optimal environment for aquaculture. For example, Maine lobster could be grown in a tropical island environment in a temperature controlled mixture of cold and warm seawater. Seafood not indigenous to tropical waters can also be raised in pools created by OTeC-pumped water, such as Salmon, lobster, abalone, trout, oysters and clams. This extends the variety of fresh seafood products available for nearby markets. likewise, the low-cost refrigeration provided by the cold seawater can be used to upgrade or maintain the quality of indigenous fish, which tend to deteriorate quickly in warm tropical regions.

SOPA
C M
isce
llane
ous
Rep
ort 7
01A SOPAC Desktop Study of Ocean-based-Renewable energy Technologies
22
A SOPAC Desktop Study of Ocean-based-Renewable energy Technologies A SOPAC Desktop Study of Ocean-based-Renewable energy Technologies
2.5.4 DesalinationDesalinated water can be produced in open or hybrid-cycle plants using surface condensers. in a surface condenser, the spent steam is condensed by indirect contact with the cold seawater. This condensate is relatively free of impurities and can be collected and dispensed to local communities where supplies of natural freshwater for agriculture or drinking are limited. System analysis indicates that a 2 Mw plant could produce about 4,300 cubic meters of desalinated water each day.
2.5.5 HydrogenProductionhydrogen can be produced via electrolysis using electricity generated by the OTeC process. The steam generated can be used as a relatively pure medium for electrolysis with electrolyte compounds added to improve the overall efficiency. A 100 Mw-net plantship can be configured to yield 1,300 kg per hour of liquid hydrogen. Unfortunately, the production cost of liquid hydrogen delivered to the harbour would be equivalent to US$250 per barrel of crude oil. The main challenges include the cost of production, transportation, and distribution, relative to other energy sources and fuels. Considering the increasing price of petroleum products on world markets, costs for large-scale hydrogen production and distribution could be subject to change in a relatively small amount of time.
2.5.6 MineralExtractionAnother undeveloped opportunity is the potential to mine ocean water for its 57 elements contained in salts and other forms and dissolved in solution. in the past, most economic analyses concluded that mining the ocean for trace elements dissolved in solution would be unprofitable, in part because much energy is required to pump the large volume of water needed. More significantly, it is often very expensive to separate the minerals from seawater. generally this method is limited to minerals that occur in high concentrations, and can be extracted easily, such as magnesium; however, with OTeC plants supplying the pumped water, the remaining problem is the cost of the extraction process. The Japanese recently began investigating the concept of combining the extraction of uranium dissolved in seawater with wave-energy technology. They found developments in other technologies (especially materials sciences) were improving the viability of mineral extraction processes that employ ocean energy.
2.6 LimitationsofOTECTechnologiesThefollowingsub-sections2.6.1–2.6.4areexcerptedfrom[5]hefollowingsub-sections2.6.1–2.6.4areexcerptedfrom[5].
2.6.1 TechnicalChallengesThe performance of OTeC power generating cycles is assessed with the same elementary concepts of thermodynamics used for conventional steam power plants. The major difference arises from the large quantities of warm and cold seawater required for heat transfer processes, resulting in the consumption of 20 to 30% of the power generated by the turbine generator in the operation of pumps. The power required to pump seawater is determined accounting for the pipe-fluid frictional losses and in the case of the cold seawater, for the density head, i.e., gravitational energy due to the differences in density between the heavier (colder) water inside the pipe and the surrounding water column. The seawater temperature rise, due to frictional losses, is negligible for the designs presented herein.

A SOPAC Desktop Study of Ocean-based-Renewable energy Technologies
SOPA
C M
isce
llane
ous
Rep
ort 7
01
A SOPAC Desktop Study of Ocean-based-Renewable energy Technologies A SOPAC Desktop Study of Ocean-based-Renewable energy Technologies
23
The ideal energy conversion for 26°C and 4°C warm and cold seawaters is 8%. An actual OTeC plant will transfer heat irreversibly and produce entropy at various points in the cycle yielding an energy conversion of 3 to 4%. These values are small compared to efficiencies obtained for conventional power plants; however, OTeC uses a resource that is constantly renewed by the sun. Considering practical sizes for the cold water pipe OTeC is presently limited to sizes of no more than about 100 Mw. in the case of the open-cycle, due to the low-pressure steam, the turbine is presently limited to sizes of no more than 2.5 Mw. The thermal performance of CC-OTeC and OC-OTeC is comparable. Floating vessels approaching the dimensions of supertankers, housing factories operated with OTeC-generated electricity, or transmitting the electricity to shore via submarine power cables have been conceptualised. large diameter pipes suspended from these plantships extending to depths of 1,000 m are required to transport the deep ocean water to the heat exchangers onboard. The design and operation of these cold water pipes are major issues that have been resolved by researchers and engineers in the USA.
it has been determined that approximately 4 cubic meters per second of warm seawater and 2 cubic meters per second of cold seawater (ratio of 2:1), with a nominal temperature difference of 20°C, are required per Mw of exportable or net electricity (net = gross – in-house usage). To keep the water pumping losses at about 20 to 30% of the gross power, an average speed of less than 2 meters per second is considered for the seawater flowing through the pipes transporting the seawater resource to the OTeC power block. Therefore, a 100 Mw plant would use 400 cubic meters per second of 26°C water flowing through a 16 m inside diameter pipe extending to a depth of 20 m; and 200 cubic meters per second of 4°C water flowing through an 11 m diameter pipe extending to depths of 1,000 m. Using similar arguments, a 20 m diameter pipe is required for the mixed water return. To minimise the environmental impact due to the return of the processed water to the ocean (mostly changes in temperature), a discharge depth of 60 m is sufficient for most sites considered feasible, resulting in a pipe extending to depths of 60 m.
The amount of total world power that could be provided by OTeC must be balanced with the impact to the marine environment that might be caused by the relatively massive amounts of seawater required to operate OTeC plants. The discharge water from a 100 Mw plant would be equivalent to the nominal flow of the Colorado River into the Pacific Ocean (1/10 the Danube, or 1/30 the Mississippi, or 1/5 the nile into the Atlantic). The discharge flow from 60,000 Mw of OTeC plants would be equivalent to the combined discharge from all rivers flowing into the Atlantic and Pacific Oceans (361,000 cubic meters per second). Although river runoff composition is considerably different from the OTeC discharge, providing a significant amount of power to the world with OTeC might have an impact on the environment below the oceanic mixed layer and, therefore, could have long-term significance in the marine environment; however, numerous countries throughout the world could use OTeC as a component of their energy equation with relatively minimal environmental impact. Tropical and subtropical island sites could be made independent of conventional fuels for the production of electricity and desalinated water by using plants of appropriate size. The larger question of OTeC as a significant provider of power for the world cannot be assessed, beyond the experimental plant stage, until some operational and environmental impact data is made available through the construction and operation of the pre-commercial plant.

SOPA
C M
isce
llane
ous
Rep
ort 7
01A SOPAC Desktop Study of Ocean-based-Renewable energy Technologies
24
A SOPAC Desktop Study of Ocean-based-Renewable energy Technologies A SOPAC Desktop Study of Ocean-based-Renewable energy Technologies
2.6.2 EngineeringChallengesThe design and installation of a cost-effective pipe to transport large quantities of cold water to the surface (i.e., cold water pipe, CwP) presented an engineering challenge of significant magnitude complicated by a lack of evolutionary experience. This challenge was addressed by the USA with a programme relying on computer-aided analytical studies integrated with laboratory and at-sea tests. The greatest outcome achieved has been the design, fabrication, transportation, deployment and test at sea of an instrumented 2.4 m diameter, 120 m long, fibreglass reinforced plastic (FRP) sandwich construction pipe attached to a barge. The data obtained was used to validate the design technology developed for pipes suspended from floating OTeC plants. This type of pipe is recommended for floating OTeC plants. For land-based plants there is a validated design for high-density polyethylene pipes of diameter less than 1.6 m. in the case of larger diameter pipes offshore techniques used to deploy large segmented pipes made of steel, concrete or FRP are applicable. Pressurised pipes made of reinforced elastomeric fabrics (e.g., soft pipes), with pumps located at the cold water intake, seem to offer the most innovative alternative to conventional concepts; however, the operability of pumps in 800 m to 1,000 m of water over extended periods must be verified and the inspection, maintenance and repair constraints established before soft pipes can be used in practical designs.
Other components for OTeC floating plants that present engineering challenges are the position-keeping system and the attachment of the submarine power cable to the floating plant. Deep ocean-mooring systems, designed for water depths of more than 1,000 m, or dynamic positioning thrusters developed by the offshore industry can be used for position keeping. The warm water intake and the mixed return water also provide the momentum necessary to position the surface vessel. The offshore industry also provides the engineering and technological backgrounds required to design and install the riser for the submarine power cable.
The design of OTeC CwPs, mooring systems and the submarine power cable must take into consideration survivability loads as well as fatigue-induced loads. The first kind is based on extreme environmental phenomena, with a relatively long return period, that might result in ultimate strength failure; while the second kind might result in fatigue-induced failure through normal operations.
2.6.3 DisadvantagesofOTECOne of the main disadvantages of land-based OTeC plants is the need for a 3 km long cold water pipe to transport the large volumes of deep seawater required from a depth of about 1,000 m. The cost associated with the cold water pipe represents 75% of the costs of current plant designs. Studies show that OTeC plants smaller than 50 Mw cannot compete economically with other present energy alternatives. A 50 Mw plant will require 150 cubic meters per second of cold water resulting in the 3 km long cold water pipeline being at least 8 m in diameter.
Another disadvantage of a land-based plant would be the discharging of the cold and warm seawater. This may need to be carried out several hundred meters offshore so as to reach an appropriate depth before discharging the water to avoid any up dwelling impact on coastal fringes (i.e., fish, reef, etc). The arrangement also requires additional expense in the construction and maintenance.

A SOPAC Desktop Study of Ocean-based-Renewable energy Technologies
SOPA
C M
isce
llane
ous
Rep
ort 7
01
A SOPAC Desktop Study of Ocean-based-Renewable energy Technologies A SOPAC Desktop Study of Ocean-based-Renewable energy Technologies
25
To minimise construction costs of the cold water and discharge pipes, a floating OTeC plant could be an option; however, the costs associated with the maintenance and mooring facility of such a structure is significant. Further to the structural needs of the OTeC plant there is also energy required for pumping the seawater from depths of about 1,000 m.
2.6.4 OTECandtheEnvironmentOTeC offers one of the most benign power production technologies, since the handling of hazardous substances is limited to the working fluid (e.g., ammonia), and no noxious by-products are generated. OTeC requires drawing seawater from the mixed layer and the deep ocean and returning it to the mixed layer, close to the thermocline, which could be accomplished with minimal environmental impact. The carbon dioxide out-gassing from the seawater used for the operation of an OC-OTeC plant is less than 1% of the approximately 700 grams per kwh amount released by fuel oil plants. The value is even lower in the case of a CC-OTeC plant.
A sustained flow of cold, nutrient-rich, bacteria-free deep ocean water could cause sea surface temperature anomalies and bio-stimulation if resident times in the mixed layer and the euphotic zone, respectively, are long enough (i.e., upwelling). The euphotic zone is the upper layer of the ocean in which there is sufficient light for photosynthesis. This has been taken to mean the 1% light penetration depth (e.g., 120 m in hawai'ian waters). This is unduly conservative, because most biological activity requires radiation levels of at least 10% of the sea surface value. Since light intensity decreases exponentially with depth, the critical 10% light penetration depth corresponds to, for example, 60 m in hawai'ian waters. The analyses of specific OTeC designs indicate that mixed seawater returned at depths of 60 m results in a dilution coefficient of 4 (i.e., 1 part OTeC effluent is mixed with 3 parts of the ambient seawater) and equilibrium (neutral buoyancy) depths below the mixed layer throughout the year. This water return depth also provides the vertical separation, from the warm water intake at about 20 m, required to avoid recirculation into the plant. This value will vary as a function of ocean current conditions. it follows that the marine food web should be minimally affected and that persistent sea surface temperature anomalies should not be induced.
To have effective heat transfer it is necessary to protect the heat exchangers from bio-fouling. it has been determined that bio-fouling only occurs in OTeC heat exchangers exposed to surface seawater. Therefore, it is only necessary to protect the CC-OTeC evaporators. Chlorine has been proposed along with several mechanical means. Depending upon the type of evaporator, both chemical and mechanical means could be used. To protect marine life, the environmental Protection Agency (ePA) in the USA allows a maximum chlorine discharge of 0.5 mg a litre and an average of 0.1 mg a litre. CC-OTeC plants need to use chlorine at levels of less than 10% of the ePA limits. The power plant components will release small quantities of working fluid during operations. Marine discharges will depend on the working fluid, the biocides, the depth of intake and the discharge configuration chosen.
Other potentially significant concerns are related to the construction phase. These are similar to those associated with the construction of any power plant, shipbuilding and the construction of offshore platforms. what is unique to OTeC is the movement of seawater streams with flow rates comparable to those of rivers and the effect of passing such streams through the OTeC components before returning them to the ocean. The use of biocides and ammonia are similar to other human activities. if occupational health and safety regulations like those in effect in the USA are followed, working fluid and biocide (most probably anhydrous ammonia

SOPA
C M
isce
llane
ous
Rep
ort 7
01A SOPAC Desktop Study of Ocean-based-Renewable energy Technologies
26
A SOPAC Desktop Study of Ocean-based-Renewable energy Technologies A SOPAC Desktop Study of Ocean-based-Renewable energy Technologies
and chlorine) emissions from a plant should be too low to detect outside the plant sites. A major release of working fluid or biocide would be hazardous to plant workers, and potentially hazardous to the populace in surrounding areas, depending on their proximity. both ammonia and chlorine can damage the eyes, skin, and mucous membranes, and can inhibit respiration. Should an accident occur with either system, the risks are similar to those for other industrial applications involving these chemicals. Ammonia is used as a fertiliser and in ice skating rink refrigeration systems. Chlorine is used in municipal water treatment plants and in steam power plants. Chlorine can be generated in situ; therefore storage of large quantities of chlorine is not recommended.
Organisms impinged by an OTeC plant are caught on the screens protecting the intakes. impingement is fatal to the organism. An entrained organism is drawn into and passes through the plant. entrained organisms may be exposed to biocides, and temperature and pressure shock. entrained organisms may also be exposed to working fluid and trace constituents (trace metals and oil or grease). intakes should be designed to limit the inlet flow velocity to minimise entrainment and impingement. The inlets need to be tailored hydrodynamically so that withdrawal does not result in turbulence or recirculation zones in the immediate vicinity of the plant. Many, if not all, organisms impinged or entrained by the intake waters may be damaged or killed. Although experiments suggest that mortality rates for phytoplankton and zooplankton entrained by the warm-water intake may be less than 100%, in fact only a fraction of the phytoplankton crops from the surface may be killed by entrainment. Prudence suggests that for the purpose of assessment, 100% capture and 100% mortality upon capture should be assumed unless further evidence exists to the contrary. Metallic structural elements (e.g., heat exchangers, pump impellers, metallic piping) corroded or eroded by seawater will add trace elements to the effluent. it is difficult to predict whether metals released from a plant will affect local biota. Trace elements differ in their toxicity and resistance to corrosion. Few studies have been conducted of tropical and subtropical species. Furthermore, trace metals released by OTeC plants will be quickly diluted with great volumes of water passing through the plant; however, the sheer size of an OTeC plant circulation system suggests that the aggregate of trace constituents released from the plant or redistributed from natural sources could have long-term significance for some organisms.
OTeC plant construction and operation may affect commercial and recreational fishing. Fish will be attracted to the plant, potentially increasing fishing in the area. enhanced productivity due to redistribution of nutrients may improve fishing; however, the losses of inshore fish eggs and larvae, as well as juvenile fish, due to impingement and entrainment and to the discharge of biocides may reduce fish populations. The net effect of OTeC operation on aquatic life will depend on the balance achieved between these two effects. Through adequate planning and coordination with the local community, recreational assets near an OTeC site may be enhanced.
Other risks associated with the OTeC power system are the safety issues associated with steam electric power generation plants: electrical hazards, rotating machinery, use of compressed gases, heavy material-handling equipment, and shop and maintenance hazards. given the CC-OTeC power plant operates as a low-temperature, low-pressure Rankine cycle, it poses less hazard to operating personnel and the local population than conventional fossil-fuel plants. it is essential that all potentially significant concerns be examined and assessed for each site and design to assure that OTeC is an environmentally benign and safe alternative to conventional power generation. The consensus among researchers is that the potentially detrimental effects of OTeC plants on the environment can be avoided or mitigated by proper design.

A SOPAC Desktop Study of Ocean-based-Renewable energy Technologies
SOPA
C M
isce
llane
ous
Rep
ort 7
01
A SOPAC Desktop Study of Ocean-based-Renewable energy Technologies A SOPAC Desktop Study of Ocean-based-Renewable energy Technologies
27
2.6.5 EconomicConsiderationsandMarket Potential OTeC is capital intensive and the very first plants will most probably be small requiring substantial capital investment. given the relatively high cost of crude oil and of fossil fuel in general, the development of OTeC technologies is likely to be promoted by both government agencies and the private industry.
A scenario most applicable to the Pacific island Countries can be installing a 10 Mw land-based OC-OTeC plants which could be capable of producing cost competitive electricity and desalinated water. The following analysis is focused on Fiji with the hope of subsequent application across the Pacific as the Pacific island Countries have similar characteristics1. (also refer to Appendix A)
Assumptions for the Analysis
1. The economic lifetime of the OTeC system was estimated at 20 years.
2. The operations and maintenance cost is estimated at 1% of the initial capital cost.
3. The analysis is done in Fijian dollars.
4. The variables used in the analysis were:the value of carbon emission saved;•the value of desalinated water produced;•fuel cost savings; and •operations and maintenance cost.•
5. That out of the total value of desalinated water produced, the cost incurred in supplying these to the household is about 50%. This includes pipelines, labour cost and water treatment. Thus only 50% remains as the net gain.
6. The volume of water produced can be used to support the needs of a 100,000 population in developing communities.
7. Fuel price is based on the Fiji electricity Authority (FeA) charges for domestic purposes. The per kwh cost has remained quite constant over the years. The FeA charges its customers 21 cents per kwh of electricity used. Since the electricity charges haven’t varied much over the 5 years, the electricity revenue will be quite stable.
8. Fuel price increases by 1% every year as the expectations are that fuel prices will keep on increasing in the future. (http://www.highbeam.com/doc/1P2-16647301.html)
9. The water rates in Fiji have remained at 15 cents for water consumed below 50 cubic meters over the past decade; however, in the revised legislation in 1985, the rate was 9.2 cents per cubic meter. Therefore, a price of 15 cents per cubic meter is used to value the water produced so that the value is in current terms.
10. Minimal maintenance needs for the first five years, with maintenance and operation increasing at 2% thereafter.
11. The desalinated water will be further treated to meet the local standards and further infrastructure will be needed to integrate the water produced in Fiji’s existing drinking water network. This will involve costs of about 40% in the first year and in the following years, it would fall to 10% as the infrastructure will exist and the only cost will be to treat the water and other maintenance.
1 Some of the characteristics involve small size, small population, limited access to capital, and reliance on remittances.

SOPA
C M
isce
llane
ous
Rep
ort 7
01A SOPAC Desktop Study of Ocean-based-Renewable energy Technologies
28
A SOPAC Desktop Study of Ocean-based-Renewable energy Technologies A SOPAC Desktop Study of Ocean-based-Renewable energy Technologies
12. That the demand for water and electricity is stable.
13. Price of carbon was adopted from http://www.pointcarbon.com/productsandservices/carbon which was then converted to Fijian dollars using the current exchange rate.
14. 10 Mw of OTeC power will replace 10 Mw of fossil fuel power.
Table 2.2: The net benefits
Analysis Type NetProfit/Loss(FJ$)
FinancialAnalysis (243,100,405)
GrossMarginAnalysis 17,849,595
NetPresentValue
Economic Analysis (223,946,382)
OTeC can act as a hedge against any future increase in oil prices as the oil price has been rising over the past 5 years. in 2002, the crude oil price was US$22.81/bbl and increased to US$99.65/bbl in 2008 in nominal terms; however, large capital costs of OTeC and considering the current situation in the Pacific island Countries, OTeC is not suitable. On the basis of financial analysis, implementing OTeC in the Pacific would not be viable; however, gross margin analysis shows that it can be feasible to implement the plant in the Pacific. This however, would only be possible if some donor countries can fund this technology; which would probably be very difficult considering the current global financial crisis. Otherwise, the initial capital cost is quite high and simply unaffordable by countries in the Pacific. Thus, at the current stage, though huge potential exists for OTeC in the Pacific, Pacific island countries being financially constrained will not be able to afford an OTeC plant.
2.7 Discussionlike the introduction of any other new energy technology, the question of suitability, appropriateness and sustainability arises. “OTeC for the Pacific” is what many people will perhaps agree to, given its benefits of not only producing electricity but also desalinated water, nutrient-rich water for agriculture and cold water for cooling purposes but the benefits have to be weighed against the potential hazards to the marine environment which many Pacific islanders rely upon as a source of food, income and recreation.
with a few countries in the Pacific region identified as having the potential for OTeC plants, researchers should consider carefully the recommendations provided from feasibility studies that look at options to build a pilot/demonstration plant at these sites; so that the issues relating to the concerns and appropriateness might be fully answered. lessons learnt from the nauru plant (which operated for 10 months from October 1981) and current research results provide a basis on which to form a consensus on whether to build another plant in the region or not. The consideration to adopt OTeC into the Pacific region should be weighed carefully, and considered along with other renewable energy technologies available at this point. The right development parameters and a feasibility study including environmental impact assessment that are consistent and acceptable could ensure the development of a sustainable project in the not too distant future. nauru, with the only national OTeC 'experience' among PiCs under its belt, told the April 2009 PeMM meeting that it was not ruling out OTeC from its future energy generation needs. Another consideration would be whether OTeC eventually works out cheaper than the currently available renewable energy technologies such as solar photovoltaic, hydro power, biomass and wind.

A SOPAC Desktop Study of Ocean-based-Renewable energy Technologies
SOPA
C M
isce
llane
ous
Rep
ort 7
01
A SOPAC Desktop Study of Ocean-based-Renewable energy Technologies A SOPAC Desktop Study of Ocean-based-Renewable energy Technologies
29
The Pacific region can always sit back and wait for the right opportunity; however, while doing so, the region should be aware of the developments in the technology and what the resource-rich nations are doing with respect to renewables. The region should also consider improving its institutional structures for managing renewable energy technologies as deciding factors in the introduction of a technology is economic viability; whether the technologies are environmentally sound; and whether it would be sustainable in the region.
The Pacific small island states on their own will definitely not be able to adopt and sustain the sophisticated technologies of the type that OTeC is. The region would need assistance and guidance from its neighbouring developed nations when considering the introduction of OTeC technology.
Figure 2.9: Artist's impression of an OTeC system (Source: www.energyisland.com)

SOPA
C M
isce
llane
ous
Rep
ort 7
01A SOPAC Desktop Study of Ocean-based-Renewable energy Technologies
30
A SOPAC Desktop Study of Ocean-based-Renewable energy Technologies A SOPAC Desktop Study of Ocean-based-Renewable energy TechnologiesOcean based Renewable energy Technologies
3.WaveEnergy Technology
3.1 IntroductionandBackgroundOceanic waves are generally considered to be a concentrated form of solar energy. waves are produced by winds that are created by pressure differences in the earth’s atmosphere, the pressure differences are a product of differential solar heating. The energy transferred from wind to water is in the form of potential energy (mass of water in wave above sea level) and kinetic energy (movement of water molecules). The amount of energy transferred is dependent upon the wind speed, the amount of time that the wind is blowing and the distance over which the wind excites the waves, also known as “fetch”. The power potential for waves can be described as units of power per meter of wave crest length [8]
Figure 3.1: wave generation (Source: [9])
As oceanic waves approach shorelines, their power output generally decreases due to frictional losses to the seabed; however, the management of power-generating units would be easier and waves can be concentrated as they approach shorelines with adequate seabed formations.

A SOPAC Desktop Study of Ocean-based-Renewable energy Technologies
SOPA
C M
isce
llane
ous
Rep
ort 7
01
A SOPAC Desktop Study of Ocean-based-Renewable energy Technologies A SOPAC Desktop Study of Ocean-based-Renewable energy Technologies
31
Ocean based Renewable energy Technologies
3.WaveEnergy Technology
with the correct seabed formation close to shore, powerful wave “hotspots” can occur, which are ideal locations for near-shore applications. That said, even near-shore hotspots are only about one-third as powerful as the average deep-water locations which consist of depths greater than 40 m. Seasonal variation is also a factor when determining where the greatest wave power potential is situated.
it is known that wave power is more energy dense than wind power and produces power for a larger percentage of the year. Typical annual average values for good offshore locations can range between 20 and 70 kw per meter which occur mostly in moderate to high latitudes. Seasonal variations are in general considerably larger in the northern hemisphere than in the Southern hemisphere, which makes the southern coasts of South America, Africa and Australia particularly attractive for wave energy [10].
Figure 3.2: Approximate global distribution of wave power levels.(Source: T.w. Thorpe, “An Overview of wave energy Technologies: Status, Performance and Costs.”)
Table 3.1: wave nomenclature for calculating wave power (Source [11]).
3.0 WAVE ENERGY CALCULATIONS
“The utilization factor for wave power – the ratio of yearly energy production to the installed power of the equipment – is typically 2 times higher than that of wind power. That is whereas for example a wind power plant only delivers energy corresponding to full power during 25% of the time (i.e. 2,190 h out of the 8,760 h per year) a wave power plant is expected to deliver 50% (4,380 h/year).” [14]
While we know that wave power is more energy dense than wind power and produces power for
a larger percentage of the year, we still do not know how to calculate the power available from a
wave. This is important for the design process of a wave energy converter. First, the power and
forces acting on the device should be assessed, then the device may be sized for the desired
energy output. The next sections explain how to calculate the wave energy and power and how
to size point absorbers and oscillating water columns for a given power level. More information
on these wave energy converters can be found in section 5.
3.1 WAVE ENERGY AND POWER
The following analysis describes a wave’s energy and power characteristics. Table 1
complements Fig. 2’s depiction of the variables used in Section 3’s wave energy analysis with
units.
Table 1. Wave Nomenclature as used in Fig. 2 and Section 3
Variables
SWL mean seawater level (surface)
Edensity wave energy density [J/m2]
Ewavefront energy per meter wave front [J/m]
Pdensity wave power density [W/m2]
Pwavefront power per meter wave front [W/m]
h depth below SWL [m]
ω wave frequency [rad/sec]
λ (or L) wavelength [m] = gT2/(2π)
ρwater seawater density [1000 kg/m3]
J. Vining. University of Wisconsin Madison. Dec. 2005. Ocean Wave Energy Conversion. 4
g gravitational constant [9.81 m/s2]
A wave amplitude [m]
H wave height [m]
T wave period [s]
C celerity (wave front velocity) [m/s]
Fig. 2 Wave Nomenclature [19]
3.1.1 Energy and Power Density
The energy density of a wave, shown in equation 1, is the mean energy flux crossing a vertical
plane parallel to a wave’s crest. The energy per wave period is the wave’s power density.
Equation 2 shows how this can be found by dividing the energy density by the wave period [18,
19]. Fig. 3 illustrates how wave period and amplitude affect the power density.
Edensity = ρwatergH2/8 = ρwatergA2/2 (1)
Pdensity = Edensity/T = ρwatergH2/(8T) = ρwatergA2/(2T) (2)
J. Vining. University of Wisconsin Madison. Dec. 2005. Ocean Wave Energy Conversion. 5

SOPA
C M
isce
llane
ous
Rep
ort 7
01A SOPAC Desktop Study of Ocean-based-Renewable energy Technologies
32
A SOPAC Desktop Study of Ocean-based-Renewable energy Technologies A SOPAC Desktop Study of Ocean-based-Renewable energy Technologies
Figure 3.3: illustration of the wave nomenclature shown on Table 3.1 (Source: [11])
The energy density of a wave, shown in equation (1) below, is the mean energy flux crossing a vertical plane parallel to a wave’s crest. The energy per wave period is the wave’s power density. equation (2) shows how this can be found by dividing the energy density by the wave period.
Figure 3.4: illustration of how wave period and amplitude affect the power density (Source [11]).
zy
L
CH
SWL
h
= -hz
Ax
g gravitational constant [9.81 m/s2]
A wave amplitude [m]
H wave height [m]
T wave period [s]
C celerity (wave front velocity) [m/s]
Fig. 2 Wave Nomenclature [19]
3.1.1 Energy and Power Density
The energy density of a wave, shown in equation 1, is the mean energy flux crossing a vertical
plane parallel to a wave’s crest. The energy per wave period is the wave’s power density.
Equation 2 shows how this can be found by dividing the energy density by the wave period [18,
19]. Fig. 3 illustrates how wave period and amplitude affect the power density.
Edensity = ρwatergH2/8 = ρwatergA2/2 (1)
Pdensity = Edensity/T = ρwatergH2/(8T) = ρwatergA2/(2T) (2)
J. Vining. University of Wisconsin Madison. Dec. 2005. Ocean Wave Energy Conversion. 5

A SOPAC Desktop Study of Ocean-based-Renewable energy Technologies
SOPA
C M
isce
llane
ous
Rep
ort 7
01
A SOPAC Desktop Study of Ocean-based-Renewable energy Technologies A SOPAC Desktop Study of Ocean-based-Renewable energy Technologies
33
Figure 3.5: Power per meter of wave front (Source [11]).
A wave resource is typically described in terms of power per meter of wave front (or wave crest). This can be calculated by multiplying the energy density by the wave celerity (wave front velocity) as equation (3) demonstrates. Figure 3.5 characterises that an increase in the amplitude and period of a wave increases the power per meter of wave front.
To properly size an underwater wave energy converter, the wave power at the operating depth must be known. In general, the wave power below sea level decays exponentially by -2πd/λ where d is the depth below sea level. This property is valid for waves in water with depths greater than λ/2. equation (4) gives the relationship between depth and surface energy.
Fig. 3 Wave Power Density
3.1.2 Power Per Meter of Wave Front
A wave resource is typically described in terms of power per meter of wave front (or wave crest).
This can be calculated by multiplying the energy density by the wave celerity (wave front
velocity) as equation 3 demonstrates [19]. Fig. 4 characterizes an increase in the amplitude and
period of a wave increases the power per meter of wave front.
Pwavefront = C*Edensity = ρwaterg2H2/(16ω) = ρwaterg2A2/(4ω) (3)
J. Vining. University of Wisconsin Madison. Dec. 2005. Ocean Wave Energy Conversion. 6
Fig. 4 Power Per Meter of Wave Front
3.1.3 Energy at Varying Depths
To properly size an underwater wave energy converter, the wave power at the operating depth
must be known. In general, the wave power below sea level decays exponentially by -2πd/λ
where d is the depth below sea level. This property is valid for waves in water with depths
greater than λ/2. Equation 4 gives the relationship between depth and surface energy [1].
E(d) = E(d=SWL) * e-2πd/λ (4)
3.2 ENERGY CONVERSION IN POINT ABSORBER
The equations governing the float and tube type point absorber presented below are different yet
work on the same principle. As previously mentioned, more information on these wave energy
converters is presented in section 5.
J. Vining. University of Wisconsin Madison. Dec. 2005. Ocean Wave Energy Conversion. 7

SOPA
C M
isce
llane
ous
Rep
ort 7
01A SOPAC Desktop Study of Ocean-based-Renewable energy Technologies
34
A SOPAC Desktop Study of Ocean-based-Renewable energy Technologies A SOPAC Desktop Study of Ocean-based-Renewable energy Technologies
3.1.1 Hydrodynamics[10]hydrodynamics is the mathematical study of the forces, energy and pressure of liquid in motion. wave energy converters could benefit from previous studies on the, largely similar, dynamics of ships in wavy seas, which took place in the decades preceding the mid-1970s. The presence of a power take-off mechanism (PTO) and the requirements for maximising the extracted energy however are additional issues.
The first theoretical developments addressed the energy extraction from regular waves with a linear PTO. An additional assumption of the theory was small amplitude waves and motions. This allowed the linearisation of the governing equations and the use of frequency-domain analysis. Since, in practice, most converters are equipped with strongly non-linear mechanisms, a time-domain theory had to be developed. The time-domain model produces time-series and is the appropriate tool for active-control studies of converters in irregular waves; however it requires much more computing time as compared with the frequency-domain analysis.
large numbers of devices in arrays are required if wave energy is to provide a significant contribution to large electrical grids. The hydrodynamic interaction between devices in array is extremely complex and approximate methods have to be devised in practice, such as the multiple-scattering method, the plane-wave method and the point-absorber approximation.
The utilisation of wave energy involves a chain of energy conversion processes, each of which is characterised by its efficiency as well as the constraints it introduces, and involves control procedures. Particularly relevant is the hydrodynamic process of wave energy absorption. The early theoretical studies on oscillating-body and OwC converters revealed that, if the device is to be an efficient absorber, its own frequency of oscillation should match the frequency of the incoming waves, i.e. it should operate at near-resonance conditions. The amount of absorbed wave energy can be significantly increased by adequately controlling the PTO in order to achieve near-resonance. Phase control (including latching control) in real random waves is a difficult theoretical and practical problem that is far from having been satisfactorily solved.
in the development and design of a wave energy converter, the energy absorption may be studied theoretically numerically, or by testing a physical model in a wave basin or wave flume. The techniques to be applied are not very different from those in the hydrodynamics of ships in a wavy sea. numerical modelling is to be applied in the first stages of the plant design. The main limitations lie in its being unable to account for losses in water due to real (viscous) fluid effects (large eddy turbulence) and not being capable to model accurately, large amplitude water oscillations (non-linear waves).
Such effects are known to be important (they also occur in naval engineering and in off-shore structures, where more or less empirical corrections are currently applied). For these reasons, model tests (scales 1:80 to 1:10) are carried out in a wave basin when the final geometry of the plant is already well established. As the development of the wave energy converter progresses towards the prototype construction stage, the need for large-scale testing requires the use of very large laboratory facilities. This was the case, in europe, of the large wave tanks in Trondheim, norway, and nantes, France.
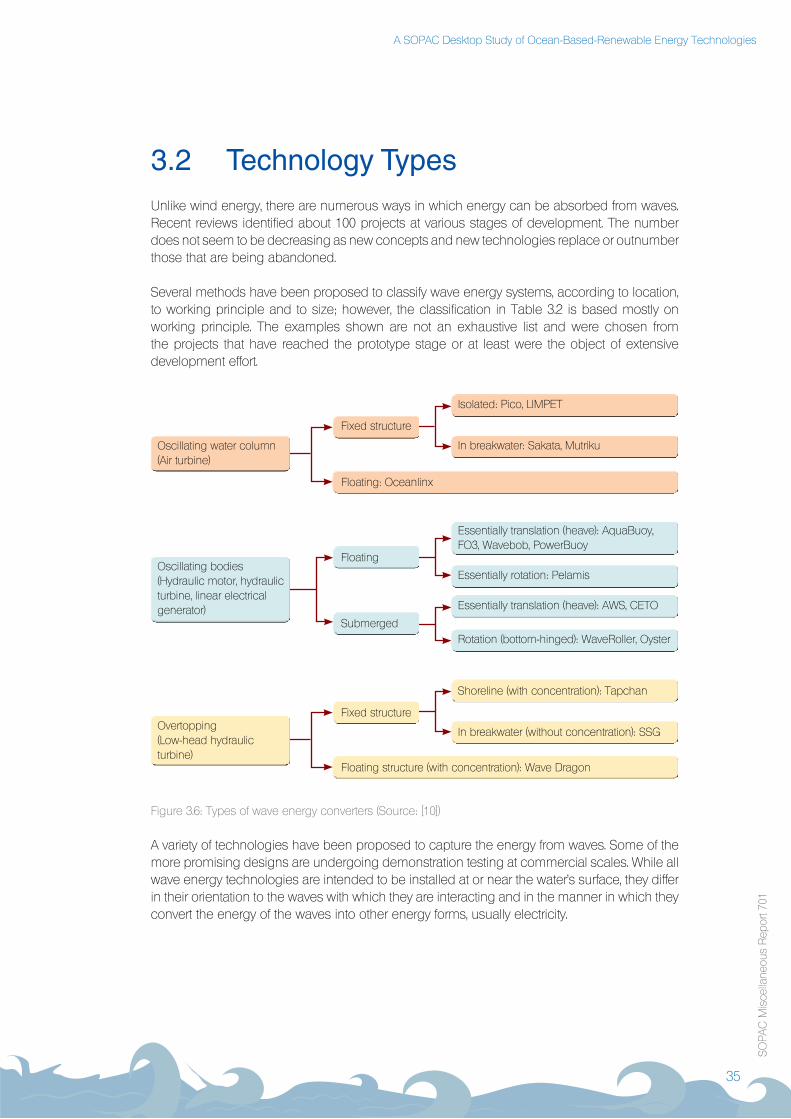
A SOPAC Desktop Study of Ocean-based-Renewable energy Technologies
SOPA
C M
isce
llane
ous
Rep
ort 7
01
A SOPAC Desktop Study of Ocean-based-Renewable energy Technologies A SOPAC Desktop Study of Ocean-based-Renewable energy Technologies
35
3.2 TechnologyTypesUnlike wind energy, there are numerous ways in which energy can be absorbed from waves. Recent reviews identified about 100 projects at various stages of development. The number does not seem to be decreasing as new concepts and new technologies replace or outnumber those that are being abandoned.
Several methods have been proposed to classify wave energy systems, according to location, to working principle and to size; however, the classification in Table 3.2 is based mostly on working principle. The examples shown are not an exhaustive list and were chosen from the projects that have reached the prototype stage or at least were the object of extensive development effort.
Figure 3.6: Types of wave energy converters (Source: [10])
A variety of technologies have been proposed to capture the energy from waves. Some of the more promising designs are undergoing demonstration testing at commercial scales. while all wave energy technologies are intended to be installed at or near the water's surface, they differ in their orientation to the waves with which they are interacting and in the manner in which they convert the energy of the waves into other energy forms, usually electricity.
Oscillating water column(Air turbine)
Oscillating bodies (hydraulic motor, hydraulic turbine, linear electrical generator)
Overtopping(low-head hydraulic turbine)
Fixed structure
Floating
Submerged
Fixed structure
isolated: Pico, liMPeT
Shoreline (with concentration): Tapchan
essentially rotation: Pelamis
essentially translation (heave): Aquabuoy, FO3, wavebob, Powerbuoy
essentially translation (heave): AwS, CeTO
Rotation (bottom-hinged): waveRoller, Oyster
in breakwater: Sakata, Mutriku
in breakwater (without concentration): SSg
Floating: Oceanlinx
Floating structure (with concentration): wave Dragon

SOPA
C M
isce
llane
ous
Rep
ort 7
01A SOPAC Desktop Study of Ocean-based-Renewable energy Technologies
36
A SOPAC Desktop Study of Ocean-based-Renewable energy Technologies A SOPAC Desktop Study of Ocean-based-Renewable energy Technologies
3.2.1 OscillatingBodiesOscillating bodies sometimes classified as third generation devices are basically offshore devices, either floating or more rarely fully submerged. They exploit the more powerful wave regimes available in deep water at depths greater than 40 m. Offshore wave energy converters are in general more complex compared with first-generation systems and consequently have more obstacles to overcome in the development process. Challenges with mooring, access for maintenance and the need for long underwater electrical cables, has hindered their development, and only in the last few years have some systems reached, or come close to, the full-scale demonstration stage [10].
Company Country Year Stage
Pelamis wave Power UK 1998 Commercial
AwS Ocean energy UK 2004 Pre-Commercial
Fred Olsen (FO3) norway 2004 (1848) Pre-Commercial
wavebob ireland 1999 Pre-Commercial
Finavera Renewables (Aquabuoy) Canada 2006 Pre-Commercial
wave energy Technologies Canada 2004 Pilot
Renewable energy holdings (CeTO) Australia 1999 Pilot
wave Star energy Denmark 2000 Pilot
Seabased Sweden 2003 Pilot
bioPower Systems Australia 2006 Pre-Pilot
Aquamarine Power (Oyster) UK 2007 Prototype
Ocean waveMaster UK 2002 Prototype
C-wave UK 2002 Prototype
Trident energy UK 2003 Prototype
Ocean navitas UK 2006 Prototype
Syncwave energy Canada 2004 Prototype
3.2.1.1 PelamisWavePowerThe Pelamis wave energy Converter is a semi-submerged, articulated structure composed of cylindrical sections linked by hinged joints as shown in Figure 3.7. The wave-induced motion of these joints is resisted by hydraulic rams, which pump high-pressure fluid through hydraulic motors via smoothing accumulators. The hydraulic motors drive electrical generators to produce electricity. Power from all the joints is fed down a single umbilical cable to a junction on the sea bed. Several devices can be connected together and linked to shore through a single seabed cable.
According to Pelamis wave Power, current production machines are approximately 180 m long, made up of 5 segments which are 3.5 m in diameter with 4 power conversion modules per machine. each machine is rated at 750 kw. The energy produced by Pelamis is dependent upon the conditions of the installation site. Depending on the wave resource, machines will on average produce 25-40% of the full rated output over the course of a year. each machine is said to be able to provide sufficient power to meet the annual electricity demand of approximately 500 homes.
Table 3.2: Development status of oscillating bodies [12]

A SOPAC Desktop Study of Ocean-based-Renewable energy Technologies
SOPA
C M
isce
llane
ous
Rep
ort 7
01
A SOPAC Desktop Study of Ocean-based-Renewable energy Technologies A SOPAC Desktop Study of Ocean-based-Renewable energy Technologies
37
Sea trials of a full-sized prototype measuring 120 m long, 3.5 m in diameter and rated at 750 kw took place in 2004. in September of 2008, a set of three Pelamis devices costing around US$11.5 million was deployed at Agucadoura (off the Portuguese northern coast), making it the first grid-connected wave farm in the world. The combined power generation of the three devices stood at 2.25 Mw, which is said to be powering 1,500 homes. in mid november, all three devices were disconnected from the grid and towed back to shore due to the global financial crisis affecting investors [13].
Figure 3.7: Pelamis attenuator (Source: www.pelamiswave.com)
The Pelamis technology was evaluated using the eMinenT tool against a reference technology being an enercon e53 wind turbine. The eMinenT tool assess the performance and market potential of early stage technologies (eST) in a pre-defined energy chain, under national conditions, in terms of financial, energy and environmental criteria [14]. The Orkney islands in Scotland were chosen as the test site from the eMinenT database to perform the simulations.
Parameter Pelamis WindTurbine
Total investment for single end user (euro) 2,125.00 8,410.00
Total depreciation for single end user (euro/yr) 141.70 560.00
Total maintenance for single end use (euro/yr) 21.25 126.10
Total costs for single end user (euro/yr) 162.90 696.00
Specific cost (euro/Mwh delivered) 36.50 156.00
number of households served by one unit 477.00 164.00
Operational costs of eST (euro/yr) 21.25 135.40
number of consumers in Orkney islands 8,982.00 8,982.00
Total number of eST that can be sold in this sector 18.00 54.00
At the 2009 Regional energy Officials' Meeting (ReM) that was held in Tonga, a new Caledonian based company called the Société de Recherche du Pacifique (SRP) presented a feasibility study which was conducted in 2007 on the Pelamis in new Caledonia and is summarised in Table 3.4.
Table 3.3: eMineT economic analysis [15]

SOPA
C M
isce
llane
ous
Rep
ort 7
01A SOPAC Desktop Study of Ocean-based-Renewable energy Technologies
38
A SOPAC Desktop Study of Ocean-based-Renewable energy Technologies A SOPAC Desktop Study of Ocean-based-Renewable energy Technologies
PelamisFeasibilityStudyNewCaledonia(NC)
location east of Maré
number of machines 1 Pelamis 750 kw
Average output 190 kw
Annual potential production 1.7 gwh (constraint at1.4 gwh due to the nC grid)
break-even selling price € 0.24/kwh
Offer from the utility eneRCAl € 0.20/kwh still under review
Policy for wave energy So far negotiation direct with Utility (avoided cost basis)
but renewable policies to be implemented
Current production source 100% Diesel generation
French and nC grant Up to 70% of the total cost
3.2.1.2 AWSOceanEnergyThe Archimedes wave-Swing (AwS) energy system is a cylinder shaped buoy, moored to the seabed. Passing waves move an air-filled upper casing against a lower-fixed cylinder, with up and down movement converted into electricity. As a wave crest approaches, the water pressure on the top of the cylinder increases and the upper part or 'floater' compresses the gas within the cylinder to balance the pressures. The reverse happens as the wave trough passes and the cylinder expands. The relative movement between the floater and the lower part or silo is converted to electricity by means of a hydraulic system and motor-generator set.
The power-absorption concept has been proven at full-scale in 2004 via a pilot plant that was installed off the coast of Portugal. Detailed engineering for a 250 kw optimised pre-commercial demonstrator is now underway [16].
Figure 3.8: Archimedes wave-Swing energy system by AwS Ocean energy(Source: http://www.membrana.ru/articles/technic/2007/06/22/180100.html)
Table 3.4: Pelamis feasibility study, new Caledonia.
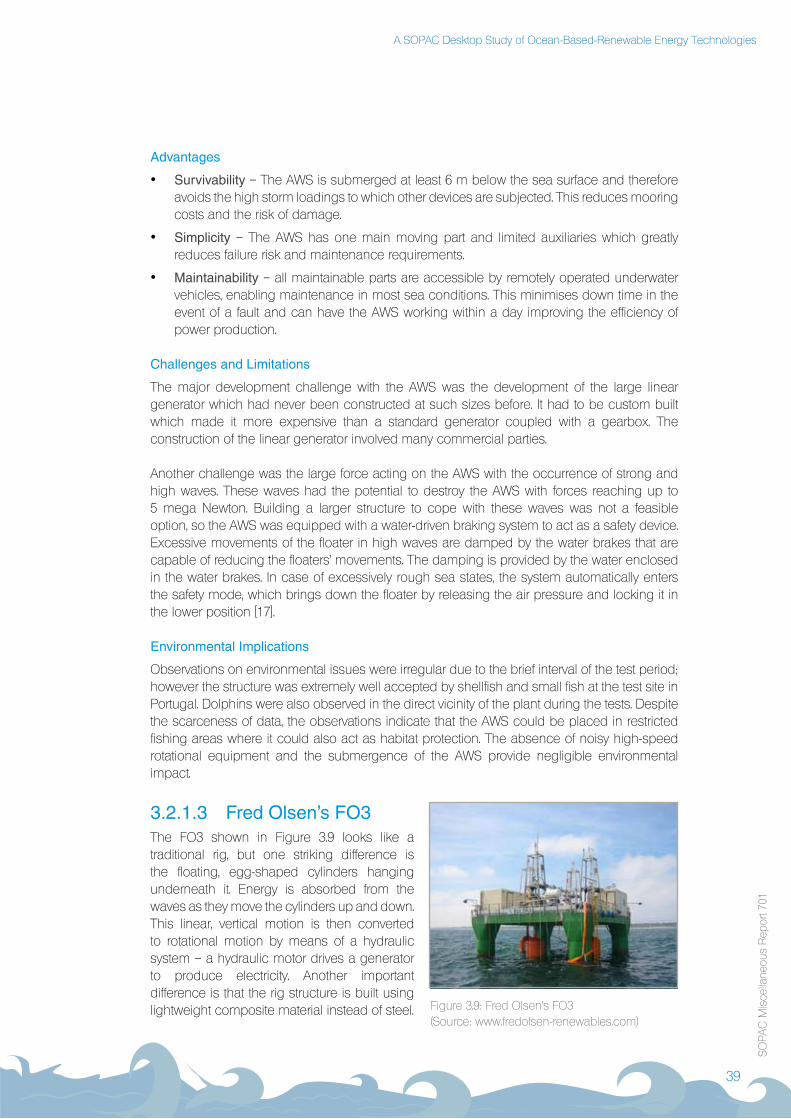
A SOPAC Desktop Study of Ocean-based-Renewable energy Technologies
SOPA
C M
isce
llane
ous
Rep
ort 7
01
A SOPAC Desktop Study of Ocean-based-Renewable energy Technologies A SOPAC Desktop Study of Ocean-based-Renewable energy Technologies
39
Advantages
Survivability• – The AwS is submerged at least 6 m below the sea surface and therefore avoids the high storm loadings to which other devices are subjected. This reduces mooring costs and the risk of damage.
Simplicity• – The AwS has one main moving part and limited auxiliaries which greatly reduces failure risk and maintenance requirements.
Maintainability• – all maintainable parts are accessible by remotely operated underwater vehicles, enabling maintenance in most sea conditions. This minimises down time in the event of a fault and can have the AwS working within a day improving the efficiency of power production.
ChallengesandLimitations
The major development challenge with the AwS was the development of the large linear generator which had never been constructed at such sizes before. it had to be custom built which made it more expensive than a standard generator coupled with a gearbox. The construction of the linear generator involved many commercial parties.
Another challenge was the large force acting on the AwS with the occurrence of strong and high waves. These waves had the potential to destroy the AwS with forces reaching up to 5 mega newton. building a larger structure to cope with these waves was not a feasible option, so the AwS was equipped with a water-driven braking system to act as a safety device. excessive movements of the floater in high waves are damped by the water brakes that are capable of reducing the floaters’ movements. The damping is provided by the water enclosed in the water brakes. in case of excessively rough sea states, the system automatically enters the safety mode, which brings down the floater by releasing the air pressure and locking it in the lower position [17].
Environmental Implications
Observations on environmental issues were irregular due to the brief interval of the test period; however the structure was extremely well accepted by shellfish and small fish at the test site in Portugal. Dolphins were also observed in the direct vicinity of the plant during the tests. Despite the scarceness of data, the observations indicate that the AwS could be placed in restricted fishing areas where it could also act as habitat protection. The absence of noisy high-speed rotational equipment and the submergence of the AwS provide negligible environmental impact.
3.2.1.3 FredOlsen’sFO3The FO3 shown in Figure 3.9 looks like a traditional rig, but one striking difference is the floating, egg-shaped cylinders hanging underneath it. energy is absorbed from the waves as they move the cylinders up and down. This linear, vertical motion is then converted to rotational motion by means of a hydraulic system – a hydraulic motor drives a generator to produce electricity. Another important difference is that the rig structure is built using lightweight composite material instead of steel.
Figure 3.9: Fred Olsen’s FO3(Source: www.fredolsen-renewables.com)
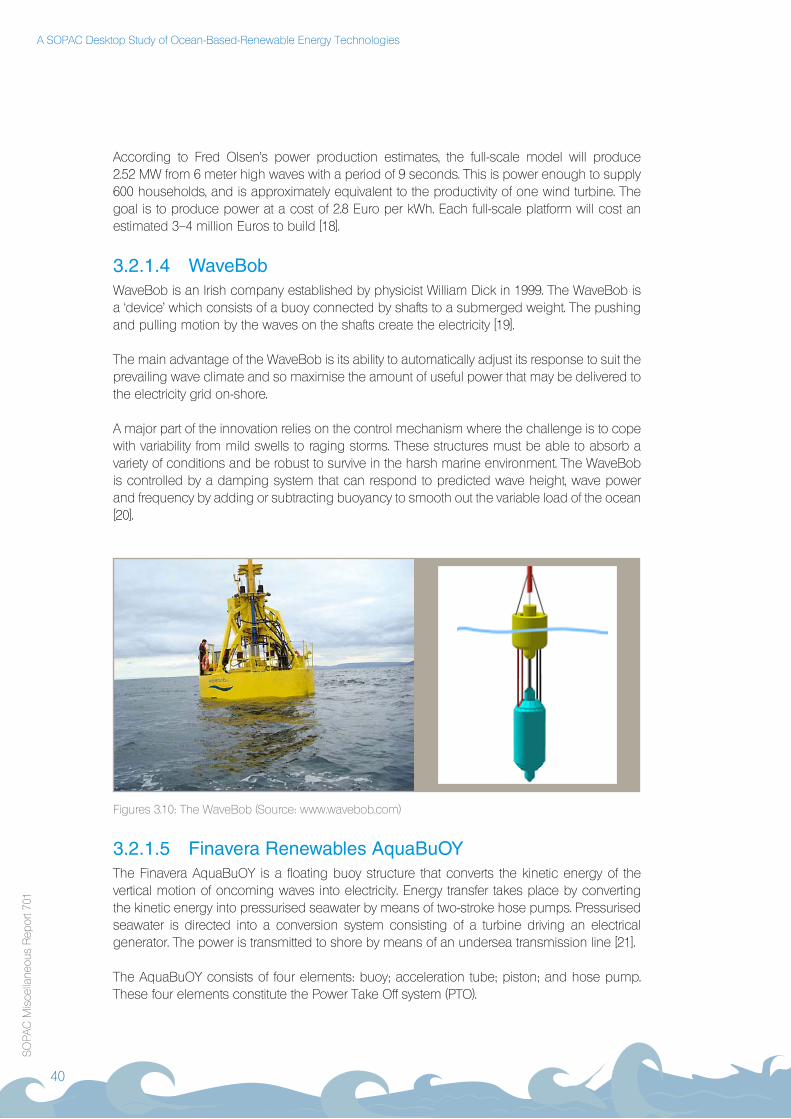
SOPA
C M
isce
llane
ous
Rep
ort 7
01A SOPAC Desktop Study of Ocean-based-Renewable energy Technologies
40
A SOPAC Desktop Study of Ocean-based-Renewable energy Technologies A SOPAC Desktop Study of Ocean-based-Renewable energy Technologies
According to Fred Olsen’s power production estimates, the full-scale model will produce 2.52 Mw from 6 meter high waves with a period of 9 seconds. This is power enough to supply 600 households, and is approximately equivalent to the productivity of one wind turbine. The goal is to produce power at a cost of 2.8 euro per kwh. each full-scale platform will cost an estimated 3–4 million euros to build [18].
3.2.1.4 WaveBobwavebob is an irish company established by physicist william Dick in 1999. The wavebob is a ‘device' which consists of a buoy connected by shafts to a submerged weight. The pushing and pulling motion by the waves on the shafts create the electricity [19].
The main advantage of the wavebob is its ability to automatically adjust its response to suit the prevailing wave climate and so maximise the amount of useful power that may be delivered to the electricity grid on-shore.
A major part of the innovation relies on the control mechanism where the challenge is to cope with variability from mild swells to raging storms. These structures must be able to absorb a variety of conditions and be robust to survive in the harsh marine environment. The wavebob is controlled by a damping system that can respond to predicted wave height, wave power and frequency by adding or subtracting buoyancy to smooth out the variable load of the ocean [20].
Figures 3.10: The wavebob (Source: www.wavebob.com)
3.2.1.5 FinaveraRenewablesAquaBuOYThe Finavera AquabuOy is a floating buoy structure that converts the kinetic energy of the vertical motion of oncoming waves into electricity. energy transfer takes place by converting the kinetic energy into pressurised seawater by means of two-stroke hose pumps. Pressurised seawater is directed into a conversion system consisting of a turbine driving an electrical generator. The power is transmitted to shore by means of an undersea transmission line [21].
The AquabuOy consists of four elements: buoy; acceleration tube; piston; and hose pump. These four elements constitute the Power Take Off system (PTO).

A SOPAC Desktop Study of Ocean-based-Renewable energy Technologies
SOPA
C M
isce
llane
ous
Rep
ort 7
01
A SOPAC Desktop Study of Ocean-based-Renewable energy Technologies A SOPAC Desktop Study of Ocean-based-Renewable energy Technologies
41
The acceleration tube is a vertical, hollow cylinder rigidly mounted under the body of the buoy. The tube is open at both ends to allow unimpeded entry and exit of seawater in either direction. Positioned at the midpoint of the acceleration tube is the piston, a broad, neutrally buoyant disk. when the buoy is at rest, the piston is held at the midpoint by the balanced tension of two hose pumps that are attached to opposite sides of the piston and extend to the top and bottom of the acceleration tube, respectively [21].
The hose-pump is a steel reinforced rubber hose whose internal volume is reduced when the hose is stretched, thereby acting as a pump. The pressurised seawater is subsequently expelled into a high-pressure accumulator, and in turn fed to a turbine which drives a generator. generated electricity is brought to shore via a standard submarine cable.
Figure 3.11: Diagram of the AquabuOy’s operation (Source: http://www.greencarcongress.com/2007/12/pge-and-finaver.html)
AquabuOy prototype 2.0 which was situated off the United States west coast sank to the bottom in about 50 m of water (27th October, 2008). The failure of a bilge pump was said to be the cause, just a day before the AquabuOy was scheduled to be removed. The collection of operational data was fortunately successful. The salvage crew managed to remove the anchor, mooring lines, tackle and other related paraphernalia, but had to leave the US$2 million piece of equipment resting on the ocean floor until favourable weather conditions permitted its retrieval [22].

SOPA
C M
isce
llane
ous
Rep
ort 7
01A SOPAC Desktop Study of Ocean-based-Renewable energy Technologies
42
A SOPAC Desktop Study of Ocean-based-Renewable energy Technologies A SOPAC Desktop Study of Ocean-based-Renewable energy Technologies
3.2.1.6 WaveEnergyTechnologies(WETEnGen)The main feature of the weT engen is its Smart Float which travels along a rigid spar at an incline of 45 degrees. The spar is moored at a single point of contact which allows the device to be fully compliant on all three axes. This has been successfully demonstrated in both sea trials as well as in many tests conducted at the Canadian national Research Council’s indoor wave tank facilities in Ottawa and St. Johns, newfoundland. The device has a unique design and motion that automatically adjusts itself to capture the strongest wave energy in water depths ranging from 50 meters to many hundreds of meters. The design is also said to be able to withstand storms and rough seas. A 20 kw prototype is being tested at Sandy Cove, nova Scotia, which is approximately 5 meters x 5 meters on top and about 4.5 meters in depth. According to weT, the cost of electricity from a 1 Mw weT engen farm would be CAD$0.09/kwh [23].
Figure 3.12: Diagram of the weT engen (Source: www.waveenergytech.com)
Figure 3.13: weT engen prototype at Sandy Cove, nova Scotia (Source: www.waveenergytech.com)
Float
Spar
Power ConversionMechanism
intertial Reaction Point Mooringscheme under development

A SOPAC Desktop Study of Ocean-based-Renewable energy Technologies
SOPA
C M
isce
llane
ous
Rep
ort 7
01
A SOPAC Desktop Study of Ocean-based-Renewable energy Technologies A SOPAC Desktop Study of Ocean-based-Renewable energy Technologies
43
3.2.1.7 CETOThe original idea behind CeTO was to harvest the high density of energy from waves with a low-cost mass-produced device, while also simplifying the associated infrastructure by pumping pressurised sea water ashore, rather than electricity. This has the additional benefit of allowing onshore based desalination depending on the deployment area.
CeTO i (Figure 3.14) was designed to utilise water pressure from waves travelling overhead to move a large diaphragm in an immersed chamber. The diaphragm in turn drives a lever pivoted between 2 pumps, giving a pressure stroke in one of the pumps with the diaphragm either rising or falling. The pumps take seawater from outside the submerged chamber and it is fed ashore through a piped system [24].
As with CeTO i, CeTO ii (Figure 3.15) is a seabed mounted device. The size and mass, however, have been reduced considerably to save on manufacturing costs. Rather than using water column pressure CeTO ii uses a submerged buoyant spherical actuator which moves with the subsurface water in a cyclical and elliptical manner. This motion is used to pull the pump in one direction on the pressure stroke and allows the suction stroke to occur under gravity. each actuator operates a single pump. Similar to CeTO i, high pressure water is collected from an array of pumps and fed ashore via a pipe work system for extraction of energy or desalination of water [24].
Throughout 2008, the performance of the pilot scale CeTO ii unit based at Fremantle, western Australia, was tested in a range of sea and swell conditions. The results confirmed excellent correlation between predicted and measured performance. Additionally, excellent results were achieved in predicting pump output based on incident wave heights and periods. Carnegie Corporation limited, which owns the CeTO technology has secured funding of AUD$12.5 million from the Australian state government’s low emissions energy Development (leeD) fund. The commercial demonstration project which will be called CeTO iii is planned to be a 50 Mw peak installed wave energy plant that has the potential to save 240,000 tonnes of carbon dioxide emissions a year [26].
Figure 3.14: The CeTO i prototype in Fremantle, Australia (Source: [25])

SOPA
C M
isce
llane
ous
Rep
ort 7
01A SOPAC Desktop Study of Ocean-based-Renewable energy Technologies
44
A SOPAC Desktop Study of Ocean-based-Renewable energy Technologies A SOPAC Desktop Study of Ocean-based-Renewable energy Technologies
3.2.1.8 WaveStarEnergyThe wave Star as shown in Figure 3.16 is a multi-point absorber equipped with 20 hemisphere-shaped floats which are partially submerged in the water. The floats are each positioned at the base of their own hydraulic cylinder. when a float is raised, a piston in the cylinder presses oil into the machine’s common transmission system with a pressure of up to 200 bar. The pressure drives a hydraulic motor, which in turn drives a generator producing electricity [27].
in the event of a storm the floats are lifted to a safe position using a sensor on the seabed ahead of the machine which measures the waves and ensures that the storm security system is automatically activated. The floats can also be set in the safe position via the internet.
The pilot scale machine being tested at nissum bredning, Denmark, has 40 hemisphere-shaped floats, each with a diameter of 1 m powering a 5.5 kw generator. The pilot scale machine has 16,000 hours of operational experience standing at a depth of 2 m and has withstood 12 storms to date [28].
The wave Star is able to generate electricity from very small waves, with the pilot scale machine only needing 10 cm high waves to produce electricity. Calculations and tests show that the wave machine produces energy around 90% of the time, and that it will run on maximum power 30% of the time [28]. in July of 2008, wave Star received USD$4.25 million in support from the Danish energy Development & Demonstration Programme (eUDP) to construct a 500 kw version of the machine.
Figure 3.15: CeTO ii wave energy converter (Source: www.ceto.com.au)

A SOPAC Desktop Study of Ocean-based-Renewable energy Technologies
SOPA
C M
isce
llane
ous
Rep
ort 7
01
A SOPAC Desktop Study of Ocean-based-Renewable energy Technologies A SOPAC Desktop Study of Ocean-based-Renewable energy Technologies
45
Figure 3.16: wave Star prototype at nissum bredning, Denmark (Source: www.wavestarenergy.com)
3.2.1.9 SeabasedSeabased's wave power technology utilises a unique directly driven permanent magnet linear generator. The generator is specially designed to take advantage of the slow movement of the waves that is transferred to it by a buoy on the ocean surface. The buoy action is transferred directly to the generator with no intermediate mechanical gearing since the generator is optimised to output high power even at slow speeds. The movement of the waves causes the translator (corresponding to the turning rotor of a conventional generator) to move up and down within the stator, thus converting the kinetic energy of the wave to electric energy. Powerful neodymium-iron-boron magnets are mounted on the translator to create an alternating magnetic field which penetrates the stator windings. The stroke length of the translator is limited by end stops at top and bottom. The encapsulated generators are to be anchored to the seabed using a concrete foundation [29], refer to Figure 3.17.
Figure 3.17: Diagram of the direct drive linear generator (Source: www.seabased.com)

SOPA
C M
isce
llane
ous
Rep
ort 7
01A SOPAC Desktop Study of Ocean-based-Renewable energy Technologies
46
A SOPAC Desktop Study of Ocean-based-Renewable energy Technologies A SOPAC Desktop Study of Ocean-based-Renewable energy Technologies
Directly driven systems have a low level of complexity at the mechanical end, but create new demands on the electrical components. The generated electric current from the individual power plants varies both in frequency and amplitude. in order to convert the electricity to a perfect 50/60 hz alternating current, the generating plants are connected to a low Voltage Marine Substation (lVMS) which rectifies, inverts and transforms the variable alternating current received. in larger wave energy parks, groups of lVMS are connected to a Medium Voltage Marine Substation (MVMS). This substation further transforms the voltage so that the electricity can be transmitted over long distances to the onshore electrical grid. The marine substations are fitted with concrete foundations and their placement on the seabed protects them from physical damage [29].
The technology is currently being tested for performance and endurance in the rough wave climate of Runde island, norway. The installation consists of two Seabased wave power devices, under-water switchgear and a sub-sea cable connecting the 40 kw generators to the 22 kV grid. The wave power system was deployed in April 2009 and is expected to be in operation for the next 2-3 years [30].
3.2.1.10BioPowerSystems(bioWAVE)The biowAVe system mimics the swaying motion of sea plants found on the ocean bed. The system consists of three buoyant blades which are constantly oscillating to the motion of the sea. As they sway in the tide, electricity is generated. in extreme wave conditions the biowAVe automatically ceases operating and assumes a safe position lying flat against the seabed [31].
Two 250 kw pilot projects are being developed for King and Flinders islands, Tasmania. bioPower Systems is collaborating with hydro Tasmania to deploy and test a 25 m biowAVe unit at King island and a 20 m unit at Flinders island. both units are expected to be connected to the islands' power distribution grid. The pilot projects are scheduled to be operational during 2009 [31].
Figure 3.18: biowAVe model being tested in a wave tank (Source: www.biopowersystems.com)

A SOPAC Desktop Study of Ocean-based-Renewable energy Technologies
SOPA
C M
isce
llane
ous
Rep
ort 7
01
A SOPAC Desktop Study of Ocean-based-Renewable energy Technologies A SOPAC Desktop Study of Ocean-based-Renewable energy Technologies
47
3.2.1.11AquamarinePower(Oyster)The Oyster consists of an oscillator fitted with pistons and fixed to the near shore seabed at depths of 10-12 m. each passing wave activates the oscillator, pumping high-pressure water through a sub-sea pipeline to the shore where it is converted to electricity using conventional hydro-electric generators [32].
Aquamarine was able to validate the Oyster’s power generation predictions with their commercial demonstrator at the new and Renewable energy Centre (naReC) near newcastle, england. The output from a single pumping cylinder delivered more than 170 kw of electricity proving that a full-scale device, with two pumping cylinders, will deliver well in excess of the modelled output of 350 kw. The testing period spanned 2 months (March-April 2009), enabling the company to optimise the system settings, test different components with respect to performance and fatigue and obtain operational experience while producing the predicted quantities of electricity [33]. More tests are scheduled for 2009.
Figure 3.20: Oyster wave energy conversion system (Source: www.aquamarinepower.com)
Figure 3.19: Full-scale Oyster (Source: www.aquamarinepower.com)

SOPA
C M
isce
llane
ous
Rep
ort 7
01A SOPAC Desktop Study of Ocean-based-Renewable energy Technologies
48
A SOPAC Desktop Study of Ocean-based-Renewable energy Technologies A SOPAC Desktop Study of Ocean-based-Renewable energy Technologies
3.2.1.12 TridentEnergyTrident energy has developed the Direct energy Conversion Method (DeCM) which consists of only one principal moving part. The system works by using floats, placed in the sea, to generate electricity through the patented linear generators designed by Trident energy. no hydraulic equipment or air compression is required [34].
Figure 3.21: DeCM wave tank trials (Source: www.tridentenergy.co.uk)
The DeCM is said to be able to use the full spectrum of wave heights, wavelengths and wave directions. Maintenance is said to be minimal as the only moving part is the float\girder combination and is confined purely to the servicing of the tube guide rollers and occasional float repair. in storm conditions, a self-protect mechanism automatically retracts the float into a protective chamber. This is done by switching the generators into motor mode and operating the machinery in reverse [34].
Trident energy confirmed the DeCM as a viable solution after 15 months of research and development in 2005. The results were independently verified by Professor John Chaplin of Southampton University. The company commenced an offshore test project in April 2007 which ended in July of 2007. The results obtained from the tests provided all of the necessary data to validate the design of Trident energy’s offshore test platform. Currently, Trident is planning to deploy a 20 kw device (Figure 3.22) 8 km off the east coast of england where it is expected to generate electricity for at least six months. This deployment is expected to take place later in 2009 [35].
3.2.1.13OceanNavitasOcean navitas’ technology is called the Aegir Dynamo shown in Figure 3.23. it is housed in a sealed central column which remains in a relatively stationary position while a buoyancy float transfers the motion of waves via a shaft to it. The Aegir Dynamo converts both the upward motion of the waves and the downward motion of gravity into singular direction rotational energy at an efficiency of 96.5%. This rotational energy is then transferred to a standard permanent magnet alternator that is commonly used in wind turbines [36].
Figure 3.22: Trident’s 20 kw prototype (Source: [35])

A SOPAC Desktop Study of Ocean-based-Renewable energy Technologies
SOPA
C M
isce
llane
ous
Rep
ort 7
01
A SOPAC Desktop Study of Ocean-based-Renewable energy Technologies A SOPAC Desktop Study of Ocean-based-Renewable energy Technologies
49
The technology has been designed for deployment in two formats, one for off-grid shore-based applications to service isolated coastal communities, and one for offshore buoy formats to generate commercial levels of electrical energy in farms. Tests have confirmed the company's prediction that it converts 96.5% of captured wave energy into electricity, and with a conversion module weighing only 1.5 tonnes, generates over 30 kwh of electricity from waves of only 1.2 meters in height [37]. As of December 2008, Ocean nativas is seeking investment to facilitate the construction of sea trial devices for both a 45 kw shore-based design for isolated coastal communities and a 200 kw buoy for commercial power generation [37].
3.2.1.14SyncWaveSystemsThe Syncwave Power Resonator (SPR) is a surface penetrating, slack-moored, self-reacting, and tuneable phase-lag point absorber. it is comprised of two floats and a controller deployed in deep waters offshore. Under the regular stimulation of ocean swell the floats naturally heave out of phase due to differences in their physical properties.
Figure 3.23: Aegir Dynamos’ operational diagram and full-scale device (Source: [37])
Figure 3.24: Syncwave Power Resonator prototype "Charlotte" (Source: http://www.marinuspower.com/pages/proj_Syncwave.html)

SOPA
C M
isce
llane
ous
Rep
ort 7
01A SOPAC Desktop Study of Ocean-based-Renewable energy Technologies
50
A SOPAC Desktop Study of Ocean-based-Renewable energy Technologies A SOPAC Desktop Study of Ocean-based-Renewable energy Technologies
The Syncwave energy latching System (SwelS) controller optimises their relative motion in the full range of wave conditions, and limits Syncwave to safe operating modes in extreme seas. The key difference with competing technologies is the company's view of the wave resource as a propagating energy field-like a radio wave. Syncwave Systems designed SwelS to force Syncwave to resonate with the dominant frequency of the wave spectrum like an antenna tunes to a radio signal. This delivers consistent energy to the power take-off, which is converted to electricity and sent to shore by an undersea cable. SwelS tracks changes in sea state and wave frequency over time, and constantly applies corrections to keep the system maximally productive [38].
The SPR is scheduled to be demonstrated in 2011 off the west Coast of Vancouver island, Canada. Syncwave Systems has now raised approximately 60% of the total funds required to complete its demonstration project including a recent US$1.6 million grant from the Province of british Columbia's iCe Fund in April 2009. it has also received US$2.2 million in a grant awarded earlier in 2009 from the government of Canada, and a US$1 million pledge of in-kind contribution from Cianbro Corporation [39].
3.2.2 OscillatingWaterColumnThe Oscillating water Column (OwC) operates much like a wind turbine using the principle of wave induced air pressurisation. The device entraps air in a fixed-volume chamber, into which waves rise and fall. with each rising wave, air is expelled through a port in the chamber and the passing air turns a turbine. As the wave recedes, air is sucked back into the chamber and, with the correct turbine configuration, the turbine continues to rotate. Air will flow into the housing during a wave trough and will flow out of the housing during a wave crest. The wells Turbine* was designed for this type of application and is used in most OwC devices today [11].
early devices were based on enclosed concrete chambers built over the surf zone and entrapping incoming waves; however, these chambers need to be extremely robust to withstand not only daily operational stresses but also exceptional circumstances, such as ‘100-year storms’. The first device, built in the 1980s on the southern coast of norway, was destroyed within a year of commissioning [40].
Constructing OwC plants of significant size is quite expensive; however, integrating the OwC plant structure into a breakwater has several advantages. The construction costs are shared and the operations of the wave energy plant become much easier. This has been done successfully for the first time in the harbour of Sakata, Japan (in 1990), where one of the foundations making up the breakwater had a special shape to accommodate the OwC as well as the mechanical and electrical equipment for power generation. The option of the “breakwater OwC” was adopted in the 750 kw OwC plant planned to be installed in the head of a new breakwater in the mouth of the Douro River (northern Portugal) and also in the newly built breakwater at Mutriku Port, in northern Spain [10].
Company Country Year Stage
wavegen U.K 1990 Commercial
Oceanlinx Australia 1997 Commercial
Offshore wave energy (Owel) U.K 2001 Prototype
Orecon U.K 2002 Prototype
Table 3.5: Development status of OwC technology [12]
* The wells Turbine was developed by Prof. Alan wells of Queen's University belfast in the late 1980s. it is able to keep its sense of rotation in spite of the changing direction of the air stream in an OwC; this is due to the blades having a symmetrical airfoil.

A SOPAC Desktop Study of Ocean-based-Renewable energy Technologies
SOPA
C M
isce
llane
ous
Rep
ort 7
01
A SOPAC Desktop Study of Ocean-based-Renewable energy Technologies A SOPAC Desktop Study of Ocean-based-Renewable energy Technologies
51
3.2.2.1 WaveGen wavegen is a Scottish company, which has developed an oscillating water column device that is built into the face of a cliff on the island of islay, off western Scotland. The device, called liMPeT, was the world's first grid-connected commercial-scale wave energy plant. The plant was commissioned in november 2000 and comprises a large concrete structure, which traps the water rising in a breaking wave. The oscillating water column that is created within the chamber causes the air above it to be alternately blown out and sucked back, driving A wells Turbine. A wells Turbine has the unusual property of rotating in the same direction, regardless of the air current direction. The turbine drives a 500 kw generator, which contributes to the island’s electricity supply.
One of the major problems with shoreline-based OwCs is their construction, which must necessarily take place on rocky shores exposed to wind and waves. To protect the liMPeT from the extreme forces of nature, the unit was built back from the coastline with the removal of an embankment [41].
Figure 3.25: Diagram of the liMPeT (Source: www.wavegen.co.uk)
3.2.2.2 OceanlinxOceanlinx has produced a new type of oscillating water column. The system uses a parabolic wall, which focuses wave energy into the column. initial testing has been facilitated through a grant of AUD$750,000 from the Australian greenhouse Office's Renewable energy Commercialisation Program, for the construction of a 300 kw wave power generator on the breakwater at Port Kembla, Australia. The ocean trial of the device began on 26th October, 2005. A proportion of the power generated was used to produce desalinated water on-board the device. The power measurements indicated that the device performed better than previously predicted from wave tank, wind tunnel, and computational fluid dynamic (CFD) testing. in 2 m waves with periods of seven seconds, the results from the trial indicated the device produced 321 kw, compared with previous predictions of 268 kw. in October 2008, Oceanlinx received AUD$16 million from an investor syndicate comprising the new energy Fund, espírito Santo Ventures and emerald Technology Ventures to further develop their technology and to progress key projects [25].
Reinforced concrete capture set into chamber rock face.
Air is compressed and decompressed by the Oscillating water Column (OwC). This causes air to be forced out and then sucked back through the wells Turbine.
The wells Turbine rotates in the same direction regardless of the direction of the air flow, thus generating irrespective of upward or downward movement of the water column.

SOPA
C M
isce
llane
ous
Rep
ort 7
01A SOPAC Desktop Study of Ocean-based-Renewable energy Technologies
52
A SOPAC Desktop Study of Ocean-based-Renewable energy Technologies A SOPAC Desktop Study of Ocean-based-Renewable energy Technologies
The turbine used in an OwC is a key element in the device’s economic performance, and is considered by wave energy experts as a significant barrier to commercialising OwC. Previous attempts to address this have mostly resulted in turbines with varying degrees of efficiency. The Oceanlinx turbine; however, uses variable pitch blades which results in slower rotational speed and higher torque from the turbine. This improves efficiency and reliability, reducing the need for much maintenance.
The turbine uses a sensor system with a pressure transducer which measures the pressure exerted on the ocean floor by each wave as it approaches or as it enters the capture chamber. The transducer sends a voltage signal proportional to the pressure which identifies the height, duration and shape of each wave. The system is calibrated to prevent small-scale “noise” from activating it.
The signal from the transducer is sent to a programmable logic controller which adjusts various parameters in real time, such as the blade angle and turbine speed. These are calibrated in the algorithm based upon the particular conditions and energy content of the site at any particular point in time [42].
Figure 3.26: Oceanlinx’s OwC (Source: www.oceanlinx.com)
3.2.2.3 OffshoreWaveEnergy(OWEL)Owel based in the United Kingdom, is developing a floating OwC called the grampus and has completed a feasibility study financed through a DTi Smart Award followed by a 2-year initial Development Programme sponsored by the Carbon Trust. The initial study predicted that a full-scale grampus would produce commercially viable quantities of power from its robust yet simple construction technique [43].
Owel has now embarked on a new development phase to optimise the grampus’ performance. The research includes studying internal geometric configurations and investigating the grampus’ structural loadings and mooring requirements. The research is being funded by the United Kingdom’s South west Regional Development Agency (SwRDA) and contributions from shareholders. it is hoped that a more detailed understanding on performance and costs can be obtained so as to advance the next stage of development, which includes prototype construction and ocean testing [44].

A SOPAC Desktop Study of Ocean-based-Renewable energy Technologies
SOPA
C M
isce
llane
ous
Rep
ort 7
01
A SOPAC Desktop Study of Ocean-based-Renewable energy Technologies A SOPAC Desktop Study of Ocean-based-Renewable energy Technologies
53
Figure 3.27: grampus model in wave tank tests (Source: www.owel.co.uk)
3.2.2.4 OreconOrecon has developed a buoy-type wave energy converter with Multi Resonant Chambers which employs the simplicity of an OwC, but is said to be more efficient. The company’s mooring system has been designed with an artificial reef, which is expected to boost the marine population around the weC [45].
Orecon was established in 2002 by nicola harper and Fraser Johnson who formed the company as a result of their postgraduate project at the University of Plymouth, UK. Until early 2008, Orecon’s founders were struggling through lack of investment. now with US$24 million in venture capital from Advent Ventures, Venrock, wellington Partners and northzone Ventures, it is moving ahead rapidly to manufacture a full-scale 1.5 Mw prototype [46].
3.2.3 OvertoppingDevicesThe overtopping wave energy converter works in much the same way a hydroelectric dam works. Reservoirs are filled by incoming waves to levels above the average surrounding ocean. The water is then released, and gravity causes it to fall back toward the ocean surface. The energy of the falling water is used to turn hydro turbines. The turbines are coupled to generators which produce electricity. The overtopping weC can be placed on the shoreline or near shore but are more commonly placed at a near shore location. As with the OwC, the overtopping weC may be slack moored or fixedly moored to the ocean bottom, and the issues associated with these mooring options are the same as with the OwC. it should be noted that overtopping wave energy converters are not as common as OwC [11].
3.2.3.1 WaveDragonThe wave Dragon is essentially an overtopping device where oncoming waves surge up a ramp and overtop into the reservoir. energy is extracted as this water passes through a series of low-head hydro turbines back down to the sea. There are additionally two wings, hinged to the platform, which reflect the waves towards the ramp to improve the performance.
The wave Dragon is of very simple construction and has only the turbines as the moving parts, which is useful for operating offshore under extreme forces and fouling. The wave Dragon is moored in relatively deep water to take advantage of the ocean waves before they lose energy as they reach the coastal area. The device is designed to stay as stationary as possible. The first prototype was deployed in nissum bredning, Denmark. The 237 tonne prototype was towed to the test site in March 2003 and was tested continuously until January 2005 [47].

SOPA
C M
isce
llane
ous
Rep
ort 7
01A SOPAC Desktop Study of Ocean-based-Renewable energy Technologies
54
A SOPAC Desktop Study of Ocean-based-Renewable energy Technologies A SOPAC Desktop Study of Ocean-based-Renewable energy Technologies
Some of the results obtained from the prototype testing include the following:
20,000 hours of operation which has verified wave Dragon's wave energy absorption •performance.
The turbine/PM generator/frequency converter system performance has been also •verified.
The redesign of the joint between the main platform and wave reflector: Due to a number •of de-attachments of the wave reflectors during storms these joints have been modified.
Control system algorithms have been optimised based on the real sea experiences.•Almost all subsystems (remote control, frequency converters etc.) have subsequently been •improved.
Operating and maintenance experience from running the turbines in an offshore •environment has led to a number of modifications on the turbines.
Figure 3.28: wave Dragon diagram and prototype (Source: www.wavedragon.net)
The wave Dragon's ramp can be compared to a beach; however, it is very short and relatively steep to minimise the energy loss that every wave faces when reaching a beach. A wave approaching a beach changes its geometry. The special elliptical shape of the ramp optimises this effect, and model testing has shown that overtopping increases significantly. The wave Dragon is designed to be sited offshore at more than 20 to 30 meters depth to produce between 4 to 11 Mw, depending on wave activity [25].
Figure 3.29: Ramp used in the wave Dragon (Source: www.wavedragon.net)

A SOPAC Desktop Study of Ocean-based-Renewable energy Technologies
SOPA
C M
isce
llane
ous
Rep
ort 7
01
A SOPAC Desktop Study of Ocean-based-Renewable energy Technologies A SOPAC Desktop Study of Ocean-based-Renewable energy Technologies
55
3.2.3.2 SeawaveSlot-ConeGenerator(SSG)wAVeenergy was established in April 2004 to develop the Seawave Slot-Cone generator (SSg) concept. The SSg concept is based on the wave overtopping principle utilising multiple reservoirs placed on top of each other. The potential energy of the incoming wave will be stored in the reservoirs before running through turbines and generating electricity. The patented multi-reservoir concept ensures that all the different height of waves are utilised for energy production, resulting in a high degree of efficiency [48].
Currently wAVeenergy is trying to develop a multi-stage water turbine (MST) which can utilise different heights of water head on a common turbine wheel. The multi-stage technology will minimise the number of start/stop sequence on the turbine even if only one reservoir is supplying water to the turbine, resulting in a high degree of utilisation. The MST project commenced in January 2005 and is in co-operation with the norwegian University of Science and Technology (nTnU). The Project is supported by the Renergi programme of the norwegian Research Council [49].
Figure 3.30: Artist's impression of the Seawave Slot-Cone generator (Source: www.waveenergy.no)
3.3 SecondaryTechnologies[11]
3.3.1 PowerTake-OffMethodsDesigners face the task of selecting a power take-off method to convert the linear motion of a point absorber to electrical energy. The conversion method must take into account that the linear forces transferred to the point absorber can exceed 1 Mega newton with velocities of 2.2 m/s [10]. Typically, this conversion process involves some intermediary to convert linear motion to the rotary motion needed to run a conventional electric generator. The most popular and widely used intermediary is a hydraulic system. Conversely, linear generators or magnetohydrodynamic generators can directly convert the point absorber’s linear motion to electrical energy. There is no consensus on which method is best, and each has its pros and cons based on the designer’s criteria.

SOPA
C M
isce
llane
ous
Rep
ort 7
01A SOPAC Desktop Study of Ocean-based-Renewable energy Technologies
56
A SOPAC Desktop Study of Ocean-based-Renewable energy Technologies A SOPAC Desktop Study of Ocean-based-Renewable energy Technologies
3.3.1.1 HydraulicSystemThe hydraulic system in a point absorber consists of a piston, a hydraulic pump, and a hydraulic motor. The linear wave motion acts to move the piston up and down which pumps pressurised hydraulic fluid through the hydraulic pump. The pump then feeds the hydraulic motor. This motor creates the rotary motion needed to drive a standard electric generator, and by coupling the hydraulic motor to a generator, the conversion process is complete.
hydraulic systems have advantages and disadvantages. The hydraulic power take-off method is mechanically inefficient because the conversion process is indirect. losses occur during pumping and turning of the hydraulic motor in addition to the losses present in the generator and inverter. Another problem is the many moving parts of a hydraulic system. More moving parts means more maintenance issues and the weC should be as maintenance-free as possible since access for maintenance will be difficult. Although not all of the hydraulics-based point absorbers use oil as the hydraulic fluid (some use seawater), it should be well noted that a broken seal or valve could leak oil. Also, hydraulic systems are designed to work at speeds lower than those experienced by a weC which are typically on the order of 2 m/s.
Some companies prefer hydraulics over direct drive systems. A central reason is that hydraulic systems have a proven track record and most engineers are well versed in their use as opposed to direct drives. Furthermore, hydraulic systems are usually less expensive to design and build than direct drives.
3.3.1.2 LinearGeneratorlinear generators are like conventional rotary generators in that they convert mechanical energy to electrical energy; however, the rotor in a linear generator is usually referred to as a ‘translator’. in this application it moves up and down as opposed to the rotational motion of a traditional generator’s rotor. The benefit of the linear generator is that it directly converts wave motion into electricity rather than relying on gearboxes and hydraulics as intermediaries. Thus, it has fewer moving parts and is more efficient than a hydraulic system. The drawback to using a linear generator is that it must be specially tailored to fit the specifications of a weC and so is not something that can be bought off-the-shelf like a hydraulics-based system. This makes using linear generators a more expensive option. nevertheless, costs can be minimised through mass production.
There has been a lot of activity surrounding linear generators for weC applications in the past few years. The main difficulty has been identifying the best suited linear generator for its corresponding application. The different types of linear generators are listed below:
Permanent magnet (PM) synchronous;•induction;•Switched reluctance;•longitudinal flux PM (lFPM); and•Transverse flux PM (TFPM).•
For a weC application, there are several criteria that differentiate these machines from each other. One of the more important criteria is the amount of shear stress that the machine can provide to offset the high forces at low speeds experienced by direct drives in weCs, and by virtue of design, a physically large machine is needed. The reciprocating force of a machine is coupled to its size, which should be minimised while providing the necessary force. Other comparative criteria include cost, efficiency, and durability.

A SOPAC Desktop Study of Ocean-based-Renewable energy Technologies
SOPA
C M
isce
llane
ous
Rep
ort 7
01
A SOPAC Desktop Study of Ocean-based-Renewable energy Technologies A SOPAC Desktop Study of Ocean-based-Renewable energy Technologies
57
Out of all the machines listed, the TFPM pictured in Figure 3.31 is considered the most suitable for the direct drive of a point absorber [10]. it has the best efficiency and is also the smallest because of its high shear stress density. The PM synchronous machine may also be considered as an alternative to the TFPM, but the TFPM is considerably more efficient. while a TFPM is costly, it is still slightly cheaper than the PM synchronous.
Figure 3.31: TFPM machine with flux concentration and stationary magnets (Source: [4])
Despite the advantages of using TFPMs in point absorbers, they have a few setbacks that will need further research consideration. As mentioned, the TFPM supplies more shear stress than the other machines listed, with levels ranging from 20 to 40 kn/m2, and so can provide 1 Mn of reactionary force. The problem with providing so much shear stress by means of neodymium-iron-boron permanent magnets is the substantial attractive forces between the stator and translator. The bearings suffer dangerous loads as a result and thus become a maintenance concern. To balance the attractive forces between the stator and translator, a double-sided stator may be used as opposed to a single-sided stator where the windings are placed on one side [10]. Despite better balance with a double-sided stator, deviations in the air gap still occur with the consequence of severe bearing loads.
3.3.1.3 MagnetohydrodynamicGeneratorThe magnetohydrodynamic (MhD) generator is also a direct drive mechanical/electrical converter. The MhD generator works on the principle that flowing seawater can conduct electric current in the presence of a strong magnetic field. Over passing waves induce seawater to flow through a hollow tube with flared inlet and outlet sections which boost water velocity by means of the bernoulli principle. electromagnets or other mechanisms such as super conductors generate a magnetic field perpendicular to the flow of water. The strong magnetic field stimulates an electric current in the passing seawater which is collected by electrodes placed in the tube. This conversion method is highly desirable due to the lack of moving parts.
Scientific Applications & Research Associates (SARA) has developed a 100 kw prototype MhD generator which it claims will cut the costs of wave energy conversion (weC) systems by a factor of three [50].
stator flux concentrator
stator coil
stator PM
translator core
NSN
SN

SOPA
C M
isce
llane
ous
Rep
ort 7
01A SOPAC Desktop Study of Ocean-based-Renewable energy Technologies
58
A SOPAC Desktop Study of Ocean-based-Renewable energy Technologies A SOPAC Desktop Study of Ocean-based-Renewable energy Technologies
3.4 WavePowerPotentialinPacific Island Countries [51]wave resources in the Pacific are less powerful compared to northern europe; however they are non-seasonal and continuous through the year, much more than in europe. Following developments in the technology for harnessing of wave energy in europe, considerable interest was generated in the South Pacific region with respect to utilising this renewable energy source as an alternative to expensive imported fossil fuels. Subsequent to a number of feasibility studies, it was realised that sufficient data needed for the technical evaluation of the wave energy potential of the region was missing.
The first comprehensive study of the wave climate of the South west Pacific, encompassing Vanuatu, Tuvalu, Fiji, Samoa, western Kiribati, Tonga and the Cook islands, was therefore initiated to map the wave energy resource of the region from 1989 to 1994. long-term wave measurements were made at six carefully chosen locations close to the shores of each of these island groups, except Kiribati. The locations were chosen with via a combination of factors including local energy requirements and infrastructure with the possibility of future wave power extraction in mind and the exposure of the site to ocean waves.
The wave measurements, which must be considered as site specific, were combined with precision satellite altimeter wave height and wind speed measurements, which were available across the region, to describe the spatial and temporal variability of ocean waves and winds. Satellite wind data and long-term wind data from the islands and also around new Zealand were used for interpretative purposes. Further, short-term directional wave measurements were made at three locations in offshore undisturbed iocations as ground truth for assessing the accuracy of global numerical wave model data for the region.
The degree of exposure to the wave energy present offshore in undisturbed waters can be quantified by comparing the long-term mean significant wave height from the buoy measurements with the geOSAT altimeter mean significant wave height, the latter being derived from the ocean area around the measurement site rather than a fixed point and thus represents the undisturbed wave climate.
Figure 3.32: 100 Kw laboratory prototype MweC system during testing at SARA in March 2007 (Source: [50])

A SOPAC Desktop Study of Ocean-based-Renewable energy Technologies
SOPA
C M
isce
llane
ous
Rep
ort 7
01
A SOPAC Desktop Study of Ocean-based-Renewable energy Technologies A SOPAC Desktop Study of Ocean-based-Renewable energy Technologies
59
Table 3.6: Comparison of buoy and geOSAT Mean Significant wave height [51]
LocationMeanHeightaboveSea
Level(Buoy)MeanHeightaboveSeaLevel(GEOSAT)
Tongatapu, Tonga 1.8 m 2.4 m
Samoa 1.8 m 2.3 m
Funafuti, Tuvalu 1.8 m 2.0 m
efate, Vanuatu 1.8 m 2.2 m
Rarotonga, Cook islands 2.2 m 2.6 m
Kandavu, Fiji 2.1 m 2.3 m
The study concluded according to the data in Table 3.6 that these areas have a rich wave energy climate and exhibit relatively small inter-seasonal changes which hold great potential for wave power applications. nearer the coasts, wave energy is still reasonably high, but seasonality is somewhat stronger due to island sheltering and seasonal changes in the dominant wind direction.
3.5 DiscussionUnlike the case of wind energy, the present situation shows a wide variety of wave energy systems, at several stages of development, competing against each other, without it being clear which types will be the final winners.
in general, the development, from concept to commercial stage, has been found to be a difficult, slow and expensive process. Although substantial progress has been achieved in the theoretical and numerical modelling of wave energy converters and of their energy conversion chain, model testing is a time-consuming and considerably expensive task but is still essential. in almost every system, optimal wave energy absorption involves some kind of resonance, which implies that the geometry and size of the structure are linked to wavelength. For these reasons, if pilot plants are to be tested in the open ocean, they must be full-sized structures. it is difficult for wave energy technology to follow what was done in the wind turbine industry where relatively small machines where developed first, and were subsequently scaled up to larger sizes and capacity as the market developed. The high costs of constructing, deploying, maintaining and testing large prototypes, under sometimes very harsh environmental conditions, has hindered the development of wave energy systems; in most cases, such operations were possible only with substantial financial support.
Unit costs of produced electrical energy claimed by technology development teams are frequently unreliable. At the present stage of technological development and for the systems that are closer to commercial stage, it is widely acknowledged that the costs are about three times larger than those of energy generated from the onshore wind. it is not surprising that the deployment of full-sized prototypes under open-ocean conditions has been taking (or is planned to take) place in coastal areas of countries where specially generous feed-in tariffs are in force, and/or where government supported infrastructures (especially cable connections) are available for testing.
it also should be mentioned that factors affecting Pacific island Countries will differ from those countries that are involved with the development of wave energy conversion. The Pacific being prone to cyclonic activity as well as being made up of small grids pose a real challenge for designing wave energy systems.

SOPA
C M
isce
llane
ous
Rep
ort 7
01A SOPAC Desktop Study of Ocean-based-Renewable energy Technologies
60
A SOPAC Desktop Study of Ocean-based-Renewable energy Technologies A SOPAC Desktop Study of Ocean-based-Renewable energy TechnologiesOcean based Renewable energy Technologies
4.TidalEnergy Technology
4.1 BackgroundTidal energy is generated by the relative motion of the earth, Sun and the Moon, which interact via gravitational forces. The Moon exerts more than twice the gravitational force on the tides as the Sun due to it being much closer to the earth. As a result, the tide closely follows the moon during its rotation around the earth, creating diurnal2 tide and ebb3 cycles at any particular ocean surface. The amplitude or height of the tide wave is very small in the open ocean where it measures several centimeters in the centre of the wave distributed over hundreds of kilometers; however, the tide can increase dramatically when it reaches continental shelves, bringing huge masses of water into narrow bays and river estuaries along a coastline. For instance, the tides in the bay of Fundy in Canada are the greatest in the world, with amplitude between 16 and 17 meters near shore. high tides close to these figures can be observed at many other sites around the world, such as the bristol Channel in england, the Kimberly coast of Australia, and the Okhotsk Sea of Russia.
The magnitude of tides changes during each lunar month. Spring tides occur when the tide generating forces of the Sun and the Moon are acting in the same directions. in this situation, the lunar tide is superimposed on to the solar tide. Some coastlines, particularly estuaries, accentuate this effect creating tidal ranges of up to 17 m. neap tides occur when the tide generating forces of the sun and the moon are acting at right angles to each other.
The vertical water movements associated with the rise and fall of the tides are accompanied by roughly horizontal water motions termed tidal currents. it has therefore to be distinguished between tidal range energy, the potential energy of a tide, and tidal current energy, the kinetic energy of the water particles in a tide. Tidal currents have the same periodicities as the vertical oscillations, being thus predictable, but tend to follow an elliptical path and do not normally involve a simple to-and-fro-motion. where tidal currents are channelled through constraining topography, such as straits between islands, very high water particle velocities can occur. These relatively rapid tidal currents typically have peak velocities during spring tides in the region of 2 to 3 m/s or more.
Tidal movement causes a continual loss of mechanical energy in the earth–Moon system due to pumping of water through the natural restrictions around coastlines, and due to viscous dissipation at the seabed and in turbulence. This loss of energy has caused the rotation of the earth to slow in the 4.5 billion years since formation. During the last 620 million years the period of rotation has increased from 21.9 hours to the 24 hours we see now; in this period the earth has lost 17% of its rotational energy. while tidal power may take additional energy from the system, increasing the rate of slowdown this is negligible because the effect would only be noticeable over millions of years [52].
2 Diurnal tide - high and low tides that occur only once a day at intervals of 24 hours3 ebb cycles - the movement of the tide out to sea

A SOPAC Desktop Study of Ocean-based-Renewable energy Technologies
SOPA
C M
isce
llane
ous
Rep
ort 7
01
A SOPAC Desktop Study of Ocean-based-Renewable energy Technologies A SOPAC Desktop Study of Ocean-based-Renewable energy Technologies
61
Ocean based Renewable energy Technologies
4.TidalEnergy Technology
4.2 TechnologyTypesTidal power can be classified into two main types:
1) Tidal stream systems make use of the kinetic energy of moving water to power turbines, in a similar way to windmills that use moving air. This method is gaining in popularity because of the lower cost and lower ecological impact compared to barrages.
2) barrages make use of the potential energy in the difference in height (or head) between high and low tides. barrages are essentially dams across the full width of a tidal estuary, and suffer from very high civil infrastructure costs, a worldwide shortage of viable sites, and environmental issues.
Tidal lagoons, are similar to barrages, but can be constructed as self-contained •structures, not fully across an estuary, and are claimed to incur much lower cost and impact overall. Furthermore they can be configured to generate electricity continuously which is not the case with barrages.
Modern advances in turbine technology may eventually see large amounts of power generated from the ocean, especially tidal currents using the tidal stream designs but also from the major thermal current systems such as the gulf Stream, which is covered by the more general term marine current power. Tidal stream turbines may be arrayed in high-velocity areas where natural tidal current flows are concentrated such as the west and east coasts of Canada, the Strait of gibraltar, the bosporus, and numerous sites in Southeast Asia and Australia. Such flows occur almost anywhere where there are entrances to bays and rivers, or between land masses where water currents are concentrated.
4.2.1 TidalBarrageA barrage consists of a number of large concrete caissons built from one side of the water to the other, together with some form of embankment where the barrage is connected to land. The barrage contains turbines (usually in the deepest water), sluice gates and ship locks to facilitate the transfer of ships. A barrage will maximise its energy in locations with a large basin area and maximal difference between high and low tide. The power generated is proportionate to the square of the tidal range and also to the area of the reservoir. A tidal range of at least 7 m is required for economical operation and for sufficient head of water for the turbines.
Ebb generation: The basin is filled through the sluices until high tide. Then the sluice gates are closed. (At this stage there may be "Pumping" to raise the level further). The turbine gates are kept closed until the sea level falls to create sufficient head across the barrage, and then are opened so that the turbines generate until the head is again low. Then the sluices are opened, turbines disconnected and the basin is filled again. The cycle repeats itself. ebb generation (also known as outflow generation) takes its name from the fact that generation occurs as the tide changes tidal direction.
Floodgeneration:The basin is filled through the turbines, which generate at tide flood. This is generally much less efficient than ebb generation, because the volume contained in the upper half of the basin (which is where ebb generation operates) is greater than the volume of the lower half (filled first during flood generation). Therefore the available level difference between the basin side and the sea side of the barrage reduces more quickly than it would in ebb generation. Rivers flowing into the basin may further reduce the energy potential, instead of enhancing it as in ebb generation.

SOPA
C M
isce
llane
ous
Rep
ort 7
01A SOPAC Desktop Study of Ocean-based-Renewable energy Technologies
62
A SOPAC Desktop Study of Ocean-based-Renewable energy Technologies A SOPAC Desktop Study of Ocean-based-Renewable energy Technologies
Pumping: Turbines are able to be powered in reverse by excess energy in the grid to increase the water level in the basin at high tide (for ebb generation). This energy is more than returned during generation, because power output is strongly related to the head. if water is raised 2 ft (0.61 cm) by pumping on a high tide of 10 ft (3.05 m), this will have been raised by 12 ft (3.71 m) at low tide. The cost of a 2 ft rise is returned by the benefits of a 12 ft rise. This is since the correlation between the potential energy is not a linear relationship, rather, is related by the square of the tidal height variation [52].
A 240 Mw tidal barrage has been successfully operated at la Rance without major incident or mechanical breakdown, on the northern coast of brittany, France. it was first commissioned in 1966 after six years of construction using coffer dams. There are 24 bulb turbines, each rated at 10 Mw, have a diameter of 5.3 m and are capable of operating on both ebb and flood tides. The power station generates an average of 68 Mw accounting to an annual output of around 600 gwh. The la Rance barrage has six sluice gates and a lifting road bridge over a lock. The tidal range averages 8 m and reaches up to 13.5 m. The initial capital cost of 620 million Francs has long since been recovered, and the cost of electricity production is now below 0.02 euro per kwh [53].
The other operational barrage of any real scale is the Annapolis Royal tidal plant, which has operated in Canada’s bay of Fundy since 1984 and uses a single 18 Mw Stratflo turbine of 7.6 m in diameter. The Stratflo turbines are more compact than the bulb turbine for a similar output but are only designed for one way (ebb) generation.
in China, where there are seven tidal plants which have a total combined capacity of over 5 Mw. The largest being the 3.2 Mw Jiangxia plant currently using five bulb turbines which averages 11 gwh per year. Additional tidal barrage plants were constructed in baishakou and haishan, providing up to 640 kw and 150 kw, respectively. in Kislaya guba, Russia, a tidal barrage was built in 1968 to take advantage of a natural 50 m wide channel between Ura bay and the sea. A floating power plant was built and then towed into position, where it was sunk to close off the channel. The plant contained a reversible bulb turbine/generator that uses an “asynchronous synchronous generator” (possibly a synchronous generator run at variable speeds whose output is then put through power electronics to synchronise it to the grid). Unfortunately, due to the small tidal range present at the site (2.3 m), the plant has a rated capacity of only 0.4 Mw [54].
in 1994, the Korean government built a 12.7 km barrage across an estuary near Ansan, Korea, with the goal of reclaiming an area of the sea for agriculture and a freshwater reservoir; however, industrial use of the new lake combined with the low amount of freshwater recharge resulted in substantial pollution. in 2001, holes were added to the barrage to reconnect the lake with the sea. The new plan for the site calls for the creation of a tidal barrage type generation plant, whose large amount of inflow/discharge is expected to substantially improve the water quality in lake Sihwa. Construction is now underway on 254 Mw of generators for the tidal barrage, which will make the Sihwa barrage the largest tidal barrage (passing la Rance) in the world once it is completed in the near future. The plant is based on a one-way, ebb tide generation, allowing it to generate power twice per day. Further sites for tidal barrages in Korea are under consideration. The Sihwa Tidal barrage plant is expected to start operation in 2009 [54].

A SOPAC Desktop Study of Ocean-based-Renewable energy Technologies
SOPA
C M
isce
llane
ous
Rep
ort 7
01
A SOPAC Desktop Study of Ocean-based-Renewable energy Technologies A SOPAC Desktop Study of Ocean-based-Renewable energy Technologies
63
4.2.1.1 OffshoreTidalLagoons,TidalElectric,UKRepresenting a new approach to tidal barrages, Tidal electric has developed a system based on an artificial offshore lagoon. The lagoon would be located in shallow water in an area with a suitably large tidal range. A lagoon system would be created there by an encircling wall made of concrete or rock fill, and would consist of either one large lagoon or multiple smaller ones. Several reversible, low-head turbines would be used to allow generation on both flood and ebb tides, and in the case of the multiple lagoon system, keeping each reservoir at different heights during the tidal cycle could allow for continuous power generation. The Tidal electric system does not require an estuary to be closed off, which should minimise the impact on the environment and other ocean users. The company has developed a proposal for a tidal lagoon at Swansea bay, UK.
4.2.1.2 TidalDelay,WoodshedTechnologiesPtyLtd,AustraliaThe Tidal Delay technology is designed for areas where an isthmus or bay has created a natural partially-closed tidal barrage. in such areas, the change in the level of water in the constrained area can lag the level of the sea, leading to a head difference between the two locations. The tidal delay system uses a pipe either passing over the isthmus (using the siphon effect) or an underground pipe running between the ocean and the constrained area. in both cases, the water would be run through a bi-directional turbine to generate power. Although the technology required is already well understood, the amount of power that can be generated and the feasibility of the system depends on both the length of pipe necessary and the tidal range available at the site [54].
4.2.1.3 Two-BasinBarrage,UNAMEngineeringInstitute, MexicoSeveral sites in the Mar de Corts region (between the baja Peninsula and mainland Mexico) have been identified as possible sites for tidal barrages due to their substantial tidal range. Over 3.4 gw (28.5 Twh/year) of possible barrage power has been identified in this region. Seeking to improve the power delivery characteristics, engineers at UnAM have developed a concept for a two-basin system requiring only a small barrage. The system would take advantage of the two naturally existing basins at Puerto Peasco that drain through a narrow inlet, and could provide up to 86 Mw of power [54].
Figure 4.1: barrage in la Rance at high tide(Source: http://phares.ac-rennes.fr/trotteurs2/article.php?sid=455)

SOPA
C M
isce
llane
ous
Rep
ort 7
01A SOPAC Desktop Study of Ocean-based-Renewable energy Technologies
64
A SOPAC Desktop Study of Ocean-based-Renewable energy Technologies A SOPAC Desktop Study of Ocean-based-Renewable energy Technologies
Figure 4.2: barrage in la Rance at low tide (Source: http://www.flickr.com/photos/londonlooks/252191517)
4.2.1.4 EnvironmentImplicationsofTidalBarrages[55]The la Rance barrage, in France, is a good example for studying the environmental effects of tidal barrages due to it being in operation for more than 40 years. The following changes from pre-barrage conditions have been recorded.
Sediments. • Fine sediments have accumulated in the deeper channel toward the head of the Rance estuary, presumably because the currents in that location are now weaker than pre-barrage. The occurrence of some fine sediment deposition in the shallow waters of the coastline towards the seaward end of the basin may be the result of reduced wave action in that area, together with such changes in water circulation near the barrage due to the layout and use of the openings along it. Apart from the need now for some maintenance dredging of the navigation channel towards the head of the estuary, the prevailing regime seems to be publicly acceptable.
InvertebrateFauna.• This resource in the basin in now more prolific and varied than in pre-barrage conditions; however seaward of the barrage has in some respects deteriorated. it is now observed that the basin has become a nursery whereas previously it was not productive to the same degree, and the ease of water exchange past the barrage ensures ready dispersal of invertebrates seaward. The basin has therefore become a source of feedstock for the outer estuary rather then vice versa.
Shorebirds.• Although the numbers and variety of shorebirds and waders have generally increased along the northern coast of France, greater increases have been recorded in the basin. The enhanced-with-barrage availability of feedstock is regarded as a primary reason for this, and it is also noted that the fact that because there is necessarily for operational reasons a time difference between the occurrences of high and low tides on each side of the barrage, the barrage has increased the time available per tide cycle for feeding on the adjacent intertidal zones.

A SOPAC Desktop Study of Ocean-based-Renewable energy Technologies
SOPA
C M
isce
llane
ous
Rep
ort 7
01
A SOPAC Desktop Study of Ocean-based-Renewable energy Technologies A SOPAC Desktop Study of Ocean-based-Renewable energy Technologies
65
Fisheries.• The fish fauna has developed to be much more abundant and diverse than in pre-barrage conditions, again reflecting the enhanced productivity of the modified substrates of the basin area. The species present include some which are known to pass through the barrage regularly and others which migrate annually. no separate provision exists for fish passage. Mortality is reported to be very low, as is recorded elsewhere for turbines of a similar type, size and speed located in river barrages.
The species present at Rance include cuttlefish, a species which is very delicate and easily damaged. Salmon have not been present for the perceived reasons that the waters of its feeder rivers are too warm and lack the gravel-based substrates which support spawning.
Macro-algae.• Production in the basin area is said to be similar to that recorded along the nearby open coast, where it is not a problem.
4.2.1.5 CostEffectivenessofTidalBarragesThe major factors in determining the cost effectiveness of a tidal power site are the size (length and height) of the barrage required, and the difference in height between high and low tide. These factors can be expressed in what is called a site's "gibrat" ratio. The gibrat ratio is the ratio of the length of the barrage in meters to the annual energy production in kilowatt hours. The smaller the gibrat site ratio, the more desirable the site. Some examples of gibrat ratios for tidal barrages are la Rance (France) at 0.36, Severn (england) at 0.87 and Passamaquoddy in the bay of Fundy (Canada) at 0.92 [56].
4.2.2 TidalStreamTidal stream energy represents a different approach to extracting energy from tides (or other marine currents). Rather than using a dam structure, the devices are placed directly “in-stream” and generate energy from the flow of water. There are a number of different technologies for extracting energy from marine currents, including horizontal and vertical-axis turbines, as well as others such as venturis and oscillating foils. Additionally, there is a variety of methods for fixing tidal current devices in place, including seabed anchoring via a gravity base or driven piles, as well as floating or semi-floating platforms fixed in place via mooring lines.
The energy available at a site is proportional to the cube of the current velocity at the site and to the cross-sectional area. This means that, in general, the power that can be generated by a turbine is roughly proportional to its area, and that achieving high power outputs is dependent on having high flow velocities. For this reason, tidal current systems are best suited to areas where narrow channels or other features generate high velocity (2 to 3 m/s or more) flows. The velocity of a tidal current, and thus its power, varies throughout the day in a pattern similar to the height of the tide.
Horizontal-axis turbines are perhaps the most common means of extracting power from marine currents and are somewhat similar in design to those used for wind power. Although there are a variety of approaches, including ducts, variable pitch blades and rim generators, all of these devices consist of a turbine with a horizontal-axis of rotation, aligned parallel to the current flow. These axial-flow turbines generally use a power take off mechanism involving a generator coupled to the turbine’s shaft, either directly or via a gearbox, to produce electricity.

SOPA
C M
isce
llane
ous
Rep
ort 7
01A SOPAC Desktop Study of Ocean-based-Renewable energy Technologies
66
A SOPAC Desktop Study of Ocean-based-Renewable energy Technologies A SOPAC Desktop Study of Ocean-based-Renewable energy Technologies
while the low speed of rotation of the turbines can make the use of a gearbox attractive, the difficulty of accessing devices for maintenance, especially those fixed on the seabed, can make the use of a gearbox problematic. The varying speed of tidal flows means that variable-speed generators are used in many designs, which require frequency conversion in order to be connected to the power grid.
The horizontal-axis devices are further split into two categories: Ducted and non-ducted, ducts can help steer and accelerate fluid flows through the device and increase the effective power capture.
Vertical-axis turbines have fallen out of use in the wind power industry; however, several ocean power companies are nevertheless developing designs for them. There are several different designs in use, with some incorporating variable pitch blades (either controlled or freely moving) or shaped ducts to direct or restrict fluid flows. All of them possess some of the same advantages; vertical-axis turbines work well with fluid flows from any direction, and due to their shape, can have a larger cross-sectional turbine area in shallow water than is possible with horizontal axis turbines.
4.2.2.1 SeaFlowandSeaGen,MarineCurrentTechnologies, UKThe SeaFlow Project involved a full-scale demonstration device installed in the bristol Channel, UK, with a rated power of 300 kw. The device shown in Figure 4.4 consisted of a 2-bladed, 11 m diameter variable-pitch rotor connected through a gearbox to an induction generator. The turbine was mounted on a movable assembly, which allowed it to be raised out of the water for maintenance. The assembly was attached to a single ‘monopile’ base that was then anchored to the seafloor. The initial device was not grid-connected, however it was able to reach the targeted peak power levels of 300 kw [54].
Following the success of SeaFlow, MCT designed and built the Seagen. Seagen as shown in Figure 4.3 is the world's first large-scale commercial tidal stream generator. it was installed in Strangford narrows between Strangford and Portaferry in northern ireland in April 2008 and was connected to the grid in July 2008. it generates 1.2 Mw for between 18 and 20 hours a day while the tides are forced in and out of Strangford lough through the narrows [57].
Strangford lough was chosen as the site for the world's first commercial tidal generator because it has a very fast tidal current, and at the same time is fairly sheltered from bad weather which could hinder the installation procedure. it is also a convenient place for an independent team of scientists to monitor the interaction of the system with the environment.
Figure 4.3: The Seagen rotors can be raised above the surface for maintenance. (Source: [57])

A SOPAC Desktop Study of Ocean-based-Renewable energy Technologies
SOPA
C M
isce
llane
ous
Rep
ort 7
01
A SOPAC Desktop Study of Ocean-based-Renewable energy Technologies A SOPAC Desktop Study of Ocean-based-Renewable energy Technologies
67
The Seagen generator weights 300 tonnes and consists of twin axial-flow rotors of 16 m in diameter, each driving a generator through a gearbox like a hydro electric or wind turbine. These turbines have a patented feature by which the rotor blades can be pitched through 180 degrees allowing them to operate in both ebb and flood tides. The power units of each system are mounted on arm-like extensions either side of a tubular steel monopole some 3 m in diameter and the arms with the power units can be raised above the surface for safe and easy maintenance access.
Seagen has been licensed to operate over a period of 5 years, during which there will be a comprehensive environmental monitoring programme to determine the precise impact on the marine environment.
During the commissioning of the system, a software error caused the blades of one of the turbines to be damaged. This resulted in the turbine operating at half power until november 2008 when a new blade was fitted. Due to the difficulty in sourcing replacements, Seagen was only fully commissioned in november 2008.
Figure 4.4: Seagen's predecessor, the 300 kw 'SeaFlow' turbine off the north coast of Devon (Source: [57])

SOPA
C M
isce
llane
ous
Rep
ort 7
01A SOPAC Desktop Study of Ocean-based-Renewable energy Technologies
68
A SOPAC Desktop Study of Ocean-based-Renewable energy Technologies A SOPAC Desktop Study of Ocean-based-Renewable energy Technologies
4.2.2.2 VerdantPower,USAVerdant Power has been testing its horizontal-axis Free Flow turbines in the east River of new york. initiated in 2002 Verdant Power’s Roosevelt island Tidal energy (RiTe) Project will test, demonstrate and deliver commercial electricity from Verdant Power’s Free Flow Kinetic hydropower System (tidal). The RiTe Project is a prime example of how the Free Flow System can be scaled for placement directly within a population center.
The seabed anchored turbines are 5 m in diameter, three-bladed and fixed-pitch, and use a small hydrofoil to align the turbine to the tidal flows. in november of 2008, Verdant Power achieved a major milestone by successfully completing the RiTe Project’s Phase 2 Demonstration, which began in 2006 with the installation of the company’s first full-scale Free Flow System turbine rated at 35 kw into the east River. Over this two-year period, Verdant Power operated six full-scale turbines in array at the RiTe Project, successfully demonstrating the Free Flow System [54].
in late September of 2008, Verdant Power retrofitted two of its tidal turbines with 5th-generation rotors and successfully re-installed the units in the east River. The two grid-connected 35 kw turbines are now delivering clean renewable energy to a gristedes supermarket and the RiOC Motorgate parking structure on Roosevelt island in new york City [58].
The company's new rotor assembly (blades and hub) was optimised for enhanced structural strength and was subjected to a testing regimen at the U.S. Department of energy's national Renewable energy laboratory (nRel), the nation's primary laboratory for renewable energy and energy efficiency research and development. The entire rotor assembly passed the tests successfully without incident.
in 2007, the 4th-generation rotors installed on these turbines experienced structural failures, though all other system components operated beyond expectations, with water-to-wire efficiencies of 30 to 40% and the delivery of over 45 Mwh of electricity [58].
Figure 4.5: Verdant Power Free Flow Turbines at RiTe Project, new york City (Source: www.verdantpower.com)
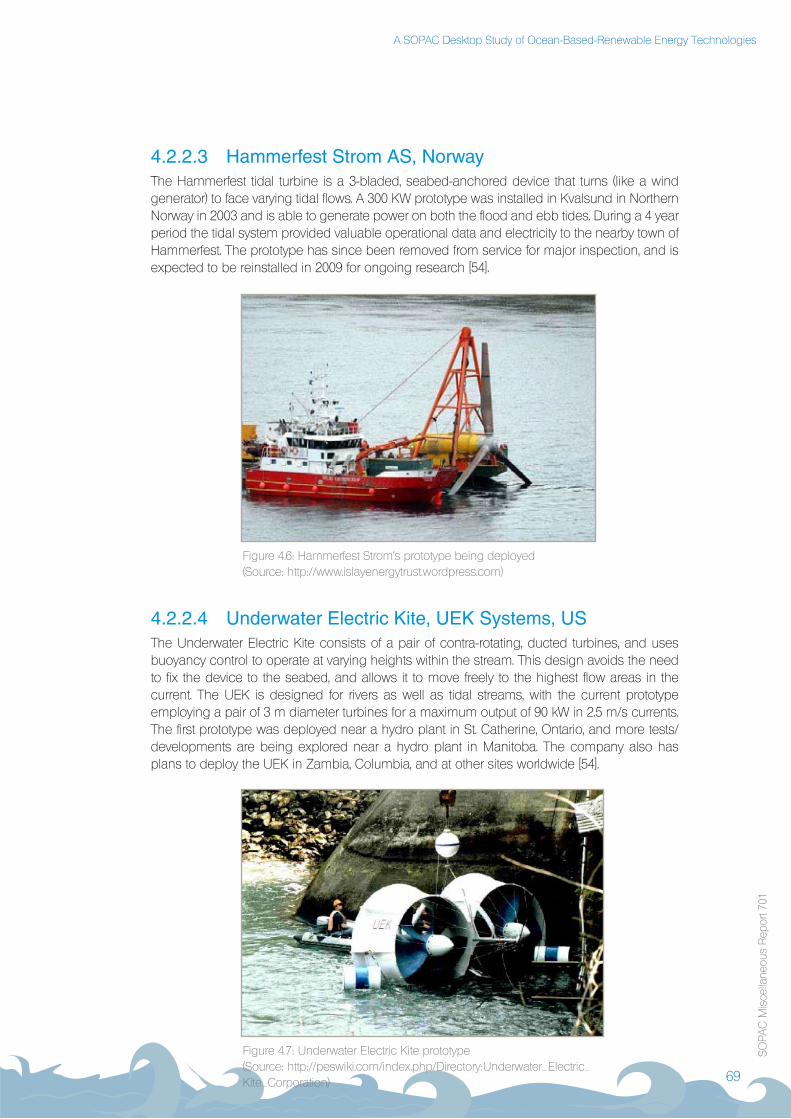
A SOPAC Desktop Study of Ocean-based-Renewable energy Technologies
SOPA
C M
isce
llane
ous
Rep
ort 7
01
A SOPAC Desktop Study of Ocean-based-Renewable energy Technologies A SOPAC Desktop Study of Ocean-based-Renewable energy Technologies
69
4.2.2.3 HammerfestStromAS,NorwayThe hammerfest tidal turbine is a 3-bladed, seabed-anchored device that turns (like a wind generator) to face varying tidal flows. A 300 Kw prototype was installed in Kvalsund in northern norway in 2003 and is able to generate power on both the flood and ebb tides. During a 4 year period the tidal system provided valuable operational data and electricity to the nearby town of hammerfest. The prototype has since been removed from service for major inspection, and is expected to be reinstalled in 2009 for ongoing research [54].
4.2.2.4 UnderwaterElectricKite,UEKSystems,USThe Underwater electric Kite consists of a pair of contra-rotating, ducted turbines, and uses buoyancy control to operate at varying heights within the stream. This design avoids the need to fix the device to the seabed, and allows it to move freely to the highest flow areas in the current. The UeK is designed for rivers as well as tidal streams, with the current prototype employing a pair of 3 m diameter turbines for a maximum output of 90 kw in 2.5 m/s currents. The first prototype was deployed near a hydro plant in St. Catherine, Ontario, and more tests/developments are being explored near a hydro plant in Manitoba. The company also has plans to deploy the UeK in Zambia, Columbia, and at other sites worldwide [54].
Figure 4.6: hammerfest Strom’s prototype being deployed (Source: http://www.islayenergytrust.wordpress.com)
Figure 4.7: Underwater electric Kite prototype (Source: http://peswiki.com/index.php/Directory:Underwater_electric_Kite_Corporation)

SOPA
C M
isce
llane
ous
Rep
ort 7
01A SOPAC Desktop Study of Ocean-based-Renewable energy Technologies
70
A SOPAC Desktop Study of Ocean-based-Renewable energy Technologies A SOPAC Desktop Study of Ocean-based-Renewable energy Technologies
4.2.2.5 CleanCurrent,CanadaThe Clean Current tidal turbine uses a ducted configuration, with a variable-speed permanent magnet generator rated at 65 kw. The generator is a rim-type permanent magnet generator, where the ends of each turbine blade form the rotor and the surrounding cowling forms the stator. The first prototype device was installed at the research facility at Race Rocks, british Columbia, where a combined renewable energy system incorporating the turbine, 7 kw of solar power, and a battery storage system were used for replacing diesel generation at the off-grid location. in May 2007, the prototype was extracted for inspection and modification. The initial water lubricated bearing system on the prototype didn’t perform to expectations and was redesigned and replaced before the prototype was re-deployed in June of 2008 [54].
Figure 4.8: Clean Current’s prototype deployment (Source: www.cleancurrent.com)
Figure 4.9: Diagram of Clean Current's prototype (Source: www.cleancurrent.com)
Blade
Hole
Rotor
Generator HousingAugmenter Duct
Guide Vane

A SOPAC Desktop Study of Ocean-based-Renewable energy Technologies
SOPA
C M
isce
llane
ous
Rep
ort 7
01
A SOPAC Desktop Study of Ocean-based-Renewable energy Technologies A SOPAC Desktop Study of Ocean-based-Renewable energy Technologies
71
4.2.2.6 TidEl,SoilMachineDynamicsHydrovision,UKThe Tidel device uses a pair of fixed-pitch turbines mounted on a central boom. it is partially buoyant and anchored to the seafloor via mooring lines, allowing it to float at any depth and rotate to face any direction. The arbitrary positioning of the device allow it to be placed in the middle of a channel, avoiding problems with cavitations that can occur near the surface while also removing the need for extensive mountings to be built on the seafloor. This design also allows the device to be placed in the highest flow areas of a channel, and to be floated to the surface for performing maintenance. The full-size device will use a pair of three-bladed, 15 m diameter turbines to generate up to 1 Mw of power, and will use a rectifier-inverter for providing stable output. Thus far, a 1:10 scale device has been built and tested, and development of a full-size prototype is underway [54].
4.2.2.7 Open-CentreTurbine,OpenHydro,IrelandThe Openhydro tidal turbine is an open-centre, rim-generator style tidal turbine, similar to the Clean Current Turbine, at least from the perspective of machine design. The 6 m diameter turbine uses high solidity blades and is mounted on a twin pile structure that can raise and lower the turbine into/out of the water for testing and maintenance. Commercial devices would be permanently anchored to the seafloor. The company conducted 18 months of rigorous testing at the european Marine energy Centre (eMeC) off the coast of Scotland at Orkney, and its 250 kw turbine prototype was successfully connected to the UK power grid in 2008. Openhydro has purchased Florida hydro, a company that was developing a similar open-centre turbine and which had conducted tests of a 5.6 kw prototype. Openhydro has secured funding for a second turbine in the same location, and has plans to install a turbine in bay of Fundy, nova Scotia, Canada, as well [54].
Figure 4.10: Tidel prototype (Source: http://www.reuk.co.uk/Tidel-Tidal-Turbines.htm)
Figure 4.11: Openhydro turbine at the test site (Source: www.openhydro.com)

SOPA
C M
isce
llane
ous
Rep
ort 7
01A SOPAC Desktop Study of Ocean-based-Renewable energy Technologies
72
A SOPAC Desktop Study of Ocean-based-Renewable energy Technologies A SOPAC Desktop Study of Ocean-based-Renewable energy Technologies
4.2.2.8 GorlovHelicalTurbine,GCKTechnology,USThe gorlov turbine is a vertical axis turbine, which uses blades that are twisted into a helix shape, rather than the straight blades typically employed by other vertical axis turbines. The helical shape reduces the amount of vibrations that can otherwise occur in vertical turbines and allows the turbine to capture up to 35% of the energy of the water flowing through it. extensive prototype tests have occurred, including a test in Amesbury, Massachusetts, that was performed in 2004 in partnership with Verdant Power. During the test, a small turbine generated up to 0.8 kw in currents of 1.5 m/s. Testing has also occurred in South Korea, where in 2002 a pair of turbines was deployed in Uldomok Strait. Following the successful tests, the Korean Ocean R&D institute began work on a 1 Mw plant based on a larger turbine and a pair of generators. gCK Technology has also deployed small turbines in Maine, new york, and brazil. The turbine in Maine generates up to 5 kw and is grid-connected, and the one in brazil is used to provide power for a remote community [54]. The brazil experience is a good example to apply to Pacific island countries that have large rivers.
4.2.2.9 EnermarKoboldTurbine,PonteDiArchimede InternationalS.p.A.,ItalyThe Kobold Turbine is a vertical axis turbine suspended from a floating buoy. The prototype, installed in the Strait of Messina, italy, uses three blades with a 6 m diameter turbine, generating up to 25 kw from currents of 2.0 m/s. The turbine has been operating since 2001, and since 2005 has been supplying power to the local grid. A rectifier-inverter is used to provide a stable electrical output, and the overall turbine and power system have been enhanced with a fully automatic control system. Further development is occurring towards an improved device, and projects to provide power to island nations such indonesia, Malaysia and Philippines [54].
Figure 4.12: gorlov helical turbine (Source: http://www.etfoundation.org/assets/images/dcp1engTurbine.jpg)

A SOPAC Desktop Study of Ocean-based-Renewable energy Technologies
SOPA
C M
isce
llane
ous
Rep
ort 7
01
A SOPAC Desktop Study of Ocean-based-Renewable energy Technologies A SOPAC Desktop Study of Ocean-based-Renewable energy Technologies
73
Figure 4.13: Kobold turbine (Source: www.pontediarchimede.com)
4.2.2.10WanxiangVerticalTurbines,ChinaTwo significant tidal turbine prototypes have been created in China. The wanxiang-1, with a 70 kw capacity, consisted of two vertical axis turbines mounted on a small floating barge. Operational for several years, the barge produced between 5 and 20 kw of power in 2-2.5 m/s currents. The wanxiang-2 uses gravity-based anchoring to sit on the seabed, with the generators and electronics mounted above the waterline. it employs two vertical-axis turbines, and has a rated capacity of 40 kw. no performance data is available for the second device [54].
4.2.2.11PulseTidalPS100EnergyConverter,UK[59]The Pulse Tidal technology is based on twin hydrofoils positioned across the tidal flow. Moving water pushes the foils either up or down according to the angle of the foil in the water. The vertical forces act in the same way that air moving over a wing provides lift. A conventional generator above the water surface is driven by the foils moving below the surface.
The PS100 was commissioned in August of 2009 and is the culmination of 10 years of development by inventor Marc Paish who is Pulse’s chief technology officer. The 100 kw humber prototype system uses tidal streams to oscillate horizontal blades rather than extracting energy in the same way as a wind turbine through rotary blades. This mode of operation is the key to the device’s unique access to shallow water and has so far shown that it can harness enough energy to power 70 homes.
The device is connected to the UK’s national grid through nearby industrial plant Millennium inorganic Chemicals and is also by ethernet through neighbouring resin manufacturing company Cray Valley. The wireless ethernet link means that the device can be operated and monitored remotely via the internet, ensuring that as much information as possible can be gathered from this prototype and fed into the design of the next generation of devices.

SOPA
C M
isce
llane
ous
Rep
ort 7
01A SOPAC Desktop Study of Ocean-based-Renewable energy Technologies
74
A SOPAC Desktop Study of Ocean-based-Renewable energy Technologies A SOPAC Desktop Study of Ocean-based-Renewable energy Technologies
Figure 4.14: Pulse Tidal’s 100 kw humber prototype system (Source: [59])
Figure 4.15: Comparison between using hydrofoils versus turbines (Source: http://www.pulsegeneration.co.uk)

A SOPAC Desktop Study of Ocean-based-Renewable energy Technologies
SOPA
C M
isce
llane
ous
Rep
ort 7
01
A SOPAC Desktop Study of Ocean-based-Renewable energy Technologies A SOPAC Desktop Study of Ocean-based-Renewable energy Technologies
75
4.3 CaseStudy:Tide-EnergyProject neartheMouthoftheAmazon[60]Theprojectgoal:usetidalenergytogenerateelectricityThis project has developed technology to generate electricity on a small scale using tidal energy. it will enable rural residents near the mouth of the Amazon to meet energy needs in a way that is environmentally sound, decentralised, and economical.
Tidalenergy:clean,renewable,andprovenThe advantages of the tide as a non-polluting and sustainable energy resource are clear. but it may be difficult to capture that energy at sea or on a coast. Conditions near the mouth of the Amazon do, however, offer that possibility. This is proven by the use of tidal energy to power more than 30 sugar cane mills in the region in the past. in fact, this project began by studying their traditional technology. As it will be shown, with modern technology there is no doubt that it is practical and efficient to capture tidal energy under the same natural conditions.
Arequirement:decentralisedtechnologyMore than 100,000 rural residents live dispersed in the area where the tide-powered mills were located. They have no possibility of receiving centrally generated electricity, because power lines are uneconomical to reach them. Only decentralised technology can meet their demand. Currently, the options available to them are solar panels and diesel generators. Tide energy offers them an economical option, one that can be installed at less than half the cost of solar panels and operates much more cheaply than diesel generators.
Figure 4.16: Rural artisans assembled, installed, and operate this 6-blade gorlov helical turbine (Source: [60])

SOPA
C M
isce
llane
ous
Rep
ort 7
01A SOPAC Desktop Study of Ocean-based-Renewable energy Technologies
76
A SOPAC Desktop Study of Ocean-based-Renewable energy Technologies A SOPAC Desktop Study of Ocean-based-Renewable energy Technologies
An important breakthrough: the helical turbine The technology uses jetties to force the flow of tidewater through a duct and run a helical-blade turbine. This turbine is about 50% more efficient in free flow than conventional, straight blade versions and, when operating in a duct, may attain an efficiency of nearly 70%. This innovative design has been developed and tested by Professor Alexander gorlov of northeastern University, who is a consultant to the project.
Implementation:thefieldstation
Location:The field station was built on Combu island near the mouth of the Amazon. it is located in a rural community about one half-hour by boat from belém, the largest city in the region.
Site and tide: The station sits near the mouth of a closed tidal basin that fills and empties twice a day. The range of the tide is from 1.5 to 3.5 m, depending on the phase of the moon and season of the year. given of the immense discharge of the Amazon, the tidewater there is fresh and year round.
Jettiesandduct: The man in Figure 4.17 is standing on one of the two jetties that extend from the banks of the stream and force the flow of tidewater, both rising and falling, through a duct built on the streambed. Posts and screens at both ends of the duct protect the helical turbine mounted in it from debris.
Gateandhead: in addition to managing tidal flow by forcing it through the duct, the duct itself can be closed with a gate. This is done at low and high tide to briefly delay the flow into or out of the stream and hasten the development of a low head of water. when the head is sufficient for the turbine to operate effectively, the gate is opened.
Figure 4.17: Managing tidal flow with two jetties, a duct, and a gate (Source: [60])

A SOPAC Desktop Study of Ocean-based-Renewable energy Technologies
SOPA
C M
isce
llane
ous
Rep
ort 7
01
A SOPAC Desktop Study of Ocean-based-Renewable energy Technologies A SOPAC Desktop Study of Ocean-based-Renewable energy Technologies
77
Environmental impact: The environmental impact of this technology is minimal. Although the tidal flow is managed, the stream still fills at high tide and empties completely at low tide, as it would under natural conditions. Shrimp and small fish pass unharmed through the screens and turbine, and larger fish can move through passages built in the jetties, so natural conditions are also maintained for aquatic life.
Generatingequipment:thehelicalturbine,transmission,andgenerator Configuration: A helical turbine (bottom) rotates on a shaft that joins it to a pulley (middle). The pulley turns an alternator (right) by means of a belt. The alternator charges batteries to store the energy captured, as is usual with other intermittent sources such as solar and wind when used off the grid. All of the equipment in this system was manufactured or purchased locally, except for the helical turbine blades themselves.
Figure 4.19: Pulley, 1.08 m in diameter and belt (Source: [60])
Operation: This shows a 6-blade gorlov helical Turbine, mounted in a duct opened for viewing. The turbine is 1.12 m in diameter and 0.83 m in height. normally, it operates while completely submerged. The helical turbine is self-starting and smooth running. Also, it rotates in the same direction regardless of the direction of the flow of water, so it can capture energy from both rising and falling tides.
Theresult:accessible,affordabletechnologyThis technology was developed in close collaboration with local technicians, workshops and rural artisans. As a result, it is accessible to rural residents. About 90% of a tide-powered generating station can be built using locally available labour, material and equipment. The technically refined helical turbine blades are the only outside components.
Figure 4.18: Automotive alternator (Source: [60])
Figure 4.20: 6-blade gorlov helical turbine (Source: [60])

SOPA
C M
isce
llane
ous
Rep
ort 7
01A SOPAC Desktop Study of Ocean-based-Renewable energy Technologies
78
A SOPAC Desktop Study of Ocean-based-Renewable energy Technologies A SOPAC Desktop Study of Ocean-based-Renewable energy Technologies
Moreover, for local residents this technology is affordable. The cost of the structures and equipment for an individual tide-powered generating station is roughly that of a small diesel powered boat, which thousands of people in the region already own.
Expectedoutcome:manystations,manyowners,manyjobsif this technology proves viable in the pilot phase, it is expected that hundreds of small, tide-powered generating stations will be built near the mouth of the Amazon and elsewhere along the adjacent Atlantic coast. At those stations, rural residents would charge inexpensive automotive batteries for community and household use, as some already do in towns.
because the technology is accessible, affordable, and inherently small-scale, these stations can be built, owned, and operated by hundreds of rural residents, who would use the energy for themselves and offer battery charging service to their neighbors.
Moreover, the construction of tide-powered generating stations may be hastened by technical and financial assistance from private electric concessionaires. Concessionaires would do this to help meet their deadlines under law 10438, which requires them to make electric power available to all brazilians.
In sum: the regional impactTide energy technology will have broad, positive impact in the region. it uses a clean, renewable energy resource. it offers a viable, economical alternative to diesel generation, which harms the environment, and to solar panels, which are imported. Moreover, because this technology is largely indigenous, the construction and operation of tide-powered generating stations will foster small businesses and skilled labour to build and service them and create income for their owners.
4.4 DiscussionTidal energy technology and the associated industry are still in their infancy. Some people believe that the current status of the technology is comparable with that of the emerging wind energy development in the 1980s; however, given the availability of favourable regulatory regimes, the progress should be much faster than that of wind. The most important issue for the technology is to prove itself within the operating environment. There is now an urgent need to have operational experience in the sea. This experience is paramount as it gives confidence to investors, power utilities and governments in the viability of the technology. in addition, technology developers and stakeholders will need to establish a robust supply chain for design and manufacture, transport to site and appropriate installation vessels.
The viability of the technology will depend, in the long term on operational reliability of the devices, their maintenance and operating costs, permitting and consent for projects, availability of grid infrastructure and most importantly the availability of finance. There are, however, many drivers that are likely to play a major role in assisting the development and the roll out of tidal technology. These initiatives are mostly related to new energy and climate change legislation in many countries, the prevalence of feed-in tariffs in many eU countries, the change in policy in the USA, the requirements for energy security and fulfilling internationally negotiated carbon reductions.
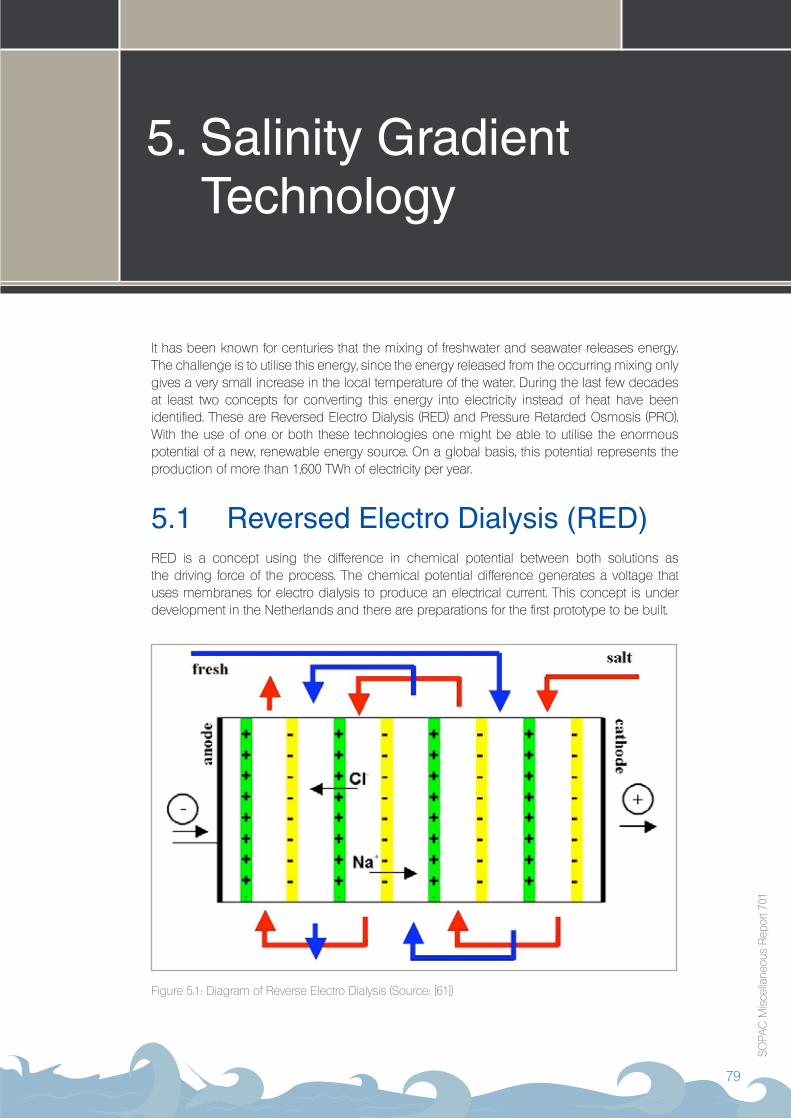
A SOPAC Desktop Study of Ocean-based-Renewable energy Technologies
SOPA
C M
isce
llane
ous
Rep
ort 7
01
A SOPAC Desktop Study of Ocean-based-Renewable energy Technologies A SOPAC Desktop Study of Ocean-based-Renewable energy Technologies
79
Ocean based Renewable energy Technologies
5.SalinityGradientTechnology
it has been known for centuries that the mixing of freshwater and seawater releases energy. The challenge is to utilise this energy, since the energy released from the occurring mixing only gives a very small increase in the local temperature of the water. During the last few decades at least two concepts for converting this energy into electricity instead of heat have been identified. These are Reversed electro Dialysis (ReD) and Pressure Retarded Osmosis (PRO). with the use of one or both these technologies one might be able to utilise the enormous potential of a new, renewable energy source. On a global basis, this potential represents the production of more than 1,600 Twh of electricity per year.
5.1 ReversedElectroDialysis(RED)ReD is a concept using the difference in chemical potential between both solutions as the driving force of the process. The chemical potential difference generates a voltage that uses membranes for electro dialysis to produce an electrical current. This concept is under development in the netherlands and there are preparations for the first prototype to be built.
Figure 5.1: Diagram of Reverse electro Dialysis (Source: [61])

SOPA
C M
isce
llane
ous
Rep
ort 7
01A SOPAC Desktop Study of Ocean-based-Renewable energy Technologies
80
A SOPAC Desktop Study of Ocean-based-Renewable energy Technologies A SOPAC Desktop Study of Ocean-based-Renewable energy Technologies
it requires two types of membranes, namely one that is selectively permeable for positive ions and one that is selectively permeable for negative ions, see Figure 5.1. Seawater separated from freshwater between two such membranes will lose both positive ions and negative ions. This charge separation produces a potential difference that can be utilised directly as electrical energy. The voltage obtained depends on the number of membranes in the stack, the absolute temperature and the ratio of the concentrations of the solutions, the internal resistance and the electrode properties.
This electrochemical cell is also called a “dialytic battery” because it is derived from the technology currently used to desalinate blood by haemodialysis. This is achieved by passing blood between two types of membranes, each selectively permeable to positive or negative ions. On the other side of the membranes is water. Applying a voltage difference across this system drives ions out of the blood. electrodialysis is also used to produce freshwater from brackish water.
The processes of dialysis and reverse dialysis are based on the same principle as the complementary action of an electrical engine and a dynamo. This means that a desalination plant based on electrodialysis, where an external voltage is applied, could also be used as an energy generator in reverse electrodialysis mode. The principle was first described by R. Plattle in nature 1954. experimental results were obtained in America and israel in the seventies. KeMA in the netherlands revived the investigation in 2002 under the brand name “blue energy”, focusing on the production of cheap membranes using the “electrical Modification” method. KeMA won the Dutch innovation Award for 2004 in the category “energy and environment” for blue energy. The name “blue” was chosen by KeMA in order to differentiate it from “black” coal-fired power generation, “brown coal” for lignite-fired power generation, and “white coal” for the water of hydropower generation, and to associate it with the blue colour of the ocean. blue energy is a part of the general class of renewable energy or “green energy” without the disadvantage of the unpredictable intermittent character of most forms of green energy [62].
5.2 PressureRetardedOsmosisin the Pressure Retarded Osmosis (PRO) process, water with no or low salt gradient is fed into the plant (grayish) and filtered before entering the membrane modules. Such modules could contain spiral wound or hollow fibre membranes. in the module, 80–90% of the water with low salt gradient is transferred by osmosis across the membrane into the pressurised salty water (bluish). The osmotic process increases the volumetric flow of high pressure water and is the key energy transfer in the power production process. This requires membranes with particularly high water flux and excellent salt retention properties. in the module it is diluted by the water received from the less salty side of the membrane. The volumetric feed of salty water is about twice that of the freshwater.
The diluted and now brackish water (dark blue) from the membrane module is split in two flows. while 1/3 of the brackish water is fed though the turbine to generate power, 2/3 is returned and energy is recycled in the pressure exchanger to add pressure to the feed of salty water. Optimal operating pressures are in the range of 11–15 bars, equivalent to a water head of 100–145 m in a hydropower plant, enabling the generation of 1 Mw from a flow rate of 1 cubic meter per second of freshwater. The freshwater feed operates at ambient pressure [63].

A SOPAC Desktop Study of Ocean-based-Renewable energy Technologies
SOPA
C M
isce
llane
ous
Rep
ort 7
01
A SOPAC Desktop Study of Ocean-based-Renewable energy Technologies A SOPAC Desktop Study of Ocean-based-Renewable energy Technologies
81
Statkraft, a north european power producer and a company with a strong hydropower tradition, has engaged in the research and development of osmotic power and enabling technologies since 1997. Today, Statkraft, with its international membrane research and development partners, is the main active technology developer globally and hence an osmotic power knowledge hub. it has made achievements in terms of new and more energy efficient membrane technology during the last few years. Commercially available reverse osmosis membranes only produce modest efficiencies of less than 0.1 watt per square meter when utilised in the PRO process. Statkraft therefore developed a special PRO membrane which has an improved membrane performance of about 4 watt per square meter.
Statkraft has also assessed the environmental optimisation and pre-environmental impact of an osmotic power plant located at a river outlet and has not found any serious obstacles. A combination of river flow regulatory compliance and careful engineering of the intake and outlet of brackish water would reduce the impact on the river environment to a minimum. The operation and maintenance of an osmotic power plant would be similar to that of a regular water treatment plant, for which the impact on the local environment is well documented. Statkraft has gone a step further and developed a way to backwash the PRO membranes which is considered to be more environmentally friendly compared to the use of cleaning chemicals currently being used in water treatment today [63].
Figure 5.2: Diagram of the PRO process (Source: www.statkraft.com)

SOPA
C M
isce
llane
ous
Rep
ort
A SOPAC Desktop Study of Ocean-based-Renewable energy Technologies
82
5.3 DiscussionThe two membrane processes for energy production based on salinity gradients, pressure-retarded osmosis and reverse electrodialysis, differ in the factors described below:
in PRO, 99% of the mass of seawater has to pass the membrane. in ReD only 1% of the •mass, the salt content of seawater, has to pass the two membranes.
in PRO, deterioration of the membranes by fouling has to be treated by chemicals •potentially less friendly to the environment; however, heavy ions present in seawater can be accumulated in the ion exchange membranes of ReD. At the end of the life of the ReD membranes they should be treated as chemical waste.
More development funds are spent on PRO membranes, resulting in low-priced membranes, •which can be of short-term benefit for the application. For ReD, a longer development time of low-priced membranes is to be expected or some technical breakthrough has to accelerate this development process.
in PRO, the pressure differences, 20-25 bar for seawater and freshwater put severe •requirements on the mechanical strength and leakage of the membrane stack. On the other hand, in ReD the pumping action of the water streams through the tiny channels between the membranes in the stack cannot be ignored. This also requires some mechanical strength of the membranes, although leakages are less detrimental in ReD. For reducing pump energy losses, more emphasis should be placed on the spacing design in the membrane stack of ReD.
in PRO, pressure or high, mechanical energy, should be converted into electrical energy by •the application of generators. For ReD, the electrodes supply an electrical output directly.
PRO seems to be more appropriate for highly concentrated salt streams such as brines •than ReD. On the basis of a recent evaluation study, ReD performs better for a mixture of seawater and freshwater.

A SOPAC Desktop Study of Ocean-based-Renewable energy Technologies
SOPA
C M
isce
llane
ous
Rep
ort 7
01
Ocean based Renewable energy Technologies
83
Ocean based Renewable energy Technologies
6.ConclusionandRecommendations
From the three main ocean energy conversion systems it can be seen that wave power holds the most potential for Pacific Island Countries. This is also reflected in the research and technology development being done with a majority of companies focusing on wave power. Like the introduction of any other new energy technology, the question of suitability, appropriateness and sustainability arises. “OTEC for the Pacific” is what many people will perhaps agreed to, given its benefits of not only producing electricity but also desalinated water, nutrient-rich water for agriculture and cold water for cooling purposes but the benefits have to be weighed against the potential hazards to the marine environment which many Pacific islanders rely upon as a source of food, income and recreation.
Lessons learnt from the Nauru plant (which operated for 10 months from October 1981) and current research results provide a basis on which to form a consensus on whether to build another plant in the region or not. The consideration to adopt OTEC into the Pacific region may at this point lack the right development parameters and a feasibility study including environmental impact assessment that are consistent and acceptable that could lead to the development of a sustainable project in the not too distant future. OTEC should be considered alongside the currently available renewable energy technologies such as solar photovoltaic, hydro power, biomass and wind, although the same potential for all these technologies may not be readily available or accessible in all countries. Unlike the case of wind energy, the present state of research shows a wide variety of wave energy systems, at several stages of development. In general, the development, from concept to commercial stage, has been found to be a difficult, slow and expensive process. Although substantial progress has been achieved in wave energy technology; it is however difficult to simulate what was done in the wind turbine industry where relatively small machines were developed first, and were subsequently scaled up to larger sizes and capacity as the market developed. The high cost of constructing, deploying, maintaining and testing large prototypes, under sometimes very harsh environmental conditions, has hindered the development of wave energy systems; in most cases, such operations were possible only with substantial financial support.
Wave resource studies conducted in six Pacific Island Countries showed potential for wave power generation; however the capacity and expertise to adopt and sustain the wave energy conversion technologies is presently limited. The region needs assistance and guidance from its neighbouring developed nations to help initiate and provide technical support with these technologies. Tidal energy technology is still emerging rather like wind energy development in the 1980s; however, given the availability of favourable regulatory regimes, the progress should be much faster than that of wind. The most important issue for tidal technology is to prove itself within the operating environment, hence the urgency to have operational experience at sea.
The Pacific region can always sit back and wait for the right opportunity, however, while doing so, the region should be aware of the ongoing developments in ocean energy conversion technology. The region should also encourage more collaboration with countries involved with the development of ocean energy conversion technologies to facilitate more rapid technology transfer into the region and to help improve and build technical capacity within the region for operating renewable ocean-based technologies.

SOPA
C M
isce
llane
ous
Rep
ort 7
01Ocean based Renewable energy Technologies
84
Ocean based Renewable energy Technologies
7.Bibliography
[1] wikipedia website (2009): http://en.wikipedia.org/wiki/Ocean_thermal_energy_conversion
[2] wikipedia website (2009): http://en.wikipedia.org/wiki/Rankine_cycle
[3] Kobayashi. h, Jitsuhara. S, Dr. Uehara. h, Dr; “The Present Status and Features of OTeC and Recent Aspects of Thermal energy Conversion Technologies”.
[4] “Uehara Cycle”; www.opotec.jp/english/uehara_cycle.html
[5] Vega, l.A. (2003), “Ocean Thermal energy Conversion Primer”, Marine Technology Society Journal, Vol. 6, no. 4, winter 2002/2003, pp. 25-35.
[6] Patel. S; “A new wave: Ocean power”; Power Magazine, http://www.powermag.com/renewables/hydro/A-new-wave-Ocean-power_176_p4.html.
[7] “Ocean Thermal energy Conversion”; http://knol.google.com/k/arun-kumar-reddy-kothapally/ocean-thermal-energy-conversion/2s9w7n3adoa4y/5#
[8] bioletti, R. and Potter, i; “Offshore Alternative energy generation”; Carbon & energy Management Alberta Research Council edmonton, Alberta, T6n 1e4, Canada.
[9] “hydroelectric generation from Ocean waves, Tides & Currents and from Free-Flowing Rivers”; FeRC Technical Conference.
[10] 2008 Annual Report, international energy Agency implementing Agreement on Ocean energy Systems.
[11] Vining, J; “Ocean wave energy Conversion”; eCe 699: Advanced independent Study Report, electrical and Computer engineering Department University of wisconsin – Madison, December 2005.
[12] englander, D. and bradford, T; “Forecasting the Future of Ocean Power”; executive Summary.
[13] blum, P; “Portugal’s wave and wind energy Projects Dwindling”; international herald Tribune, March 15, 2009; Retrieved from: http://mendocoastcurrent.wordpress.com/2009/03/16/portugals-wave-and-wind-energy-projects-dwindling/
[14] Segurado, R., Pereira, S., Pipio, A., Alves, l; “Comparison between eMinenT and other energy technology assessment tools”; http://www.sciencedirect.com/science?_ob=ArticleURl&_udi=b6VFX-4VPCVF91&_user=10&_rdoc=1&_fmt=&_orig=search&_sort=d&view=c&_acct=C000050221&_version=1&_urlVersion=0&_userid=10&md5=8cab9b9c28f55768bf011ac600e2bfb9.
[15] Perry, S., Kleme�, J., Bulatov, I; “A New Emerging Technology – Pelamis Demonstration of the Assessment by the eMinenT Tool” The University of Manchester, lisbon, Portugal, 2-3 March 2009.
[16] “Archimedes waveswing”; http://www.awsocean.com/archimedes_waveswing.aspx?Site=1

Ocean based Renewable energy Technologies
SOPA
C M
isce
llane
ous
Rep
ort 7
01
A SOPAC Desktop Study of Ocean-based-Renewable energy Technologies
85
Ocean based Renewable energy Technologies
7.Bibliography [17] Mill, A; “Archimedes wave Swing evaluation of Test Procedures & Results from Deployment in Portugal 2004”; The european Marine energy Center.
[18] leirbukt, A. and Tubaas, P; “A wave of renewable energy”; Abb Review 3/2006.
[19] wavebob website (2009): http://www.wavebob.com/about_us/
[20] wikipedia website (2009): http://en.wikipedia.org/wiki/wavebob
[21] “The AquabuOy”; http://www.finavera.com/en/wavetech/advantages
[22] “Sunken buoy rescue under way”; http://www.newportnewstimes.com/articles/2008/07/25/news/news01.txt
[23] Muhawi, D; “wave energy Technologies”; http://www.ecoworld.com/blog/editor/muhawi/2008/02/20/wave-energy-technologies/
[24] Mckay, T., lomax, C., Denny, M., Cook, D; “Technical Appraisal of the CeTO wave Power generation Devices”.
[25] “wave”; http://www.rise.org.au/info/Tech/wave/index.html.
[26] “CeTO Technology”; http://www.ceto.com.au/ceto-technology/what-is-ceto.php
[27] “how wave Star works”; http://www.wavestarenergy.com
[28] “wave Star energy gets DKK 20m in development support”; http://www.investindk.com/visnyhed.asp?artikeliD=20020
[29] Seabased website (2009); www.seabased.com
[30] “Deployment of wave energy converters in norway”; http://www.rundecentre.no/english/wave-energy-deployment.htm
[31] “biowAVe”; http://www.biopowersystems.com/technologies.php
[32] Aquamarine website (2009); www.aquamarinepower.com
[33] “Oyster wave energy System Produces electricity”; http://www.renewableenergyworld.com/rea/news/article/2009/04/aquamarines-oyster-system-delivers-commercial-electricity
[34] Trident energy website (2009): http://www.tridentenergy.co.uk/technology
[35] “Trident energy prepares to deploy wave power machine in Suffolk”; http://www.newenergyfocus.com/do/ecco.py/view_item?listid=1&listcatid=119&listitemid=2570
[36] Ocean navitas website (2009); http://www.oceannavitas.com/technology.html
[37] “Ocean navitas confirms conversion”; http://social.waveenergytoday.com/content/ocean-navitas-confirms-conversion
[38] “Syncwave launches $15 m project demonstrating low cost of wave energy”; http://www.bymnews.com/new/index2.php?option=com_content&do_pdf=1&id=37893
[39] “Syncwave Receives CAn $2M grant from bC“; http://www.renewableenergyworld.com/rea/news/article/2009/04/syncwave-receives-can-2m-grant-from-british-columbia
[40] “Marine energy: Summary of Current Developments and Outlook for new Zealand”; Power Projects limited, 18 May 2005.
[41] “Feasibility of Developing wave Power as a Renewable energy Resource for hawai'i”; Department of business, economic Development, and Tourism, January 2002.

SOPA
C M
isce
llane
ous
Rep
ort 7
01A SOPAC Desktop Study of Ocean-based-Renewable energy Technologies
86
[42] “The Denniss-Auld Turbine”; http://www.oceanlinx.com/works.asp
[43] Owel website (2009); http://owel.co.uk
[44] “U.K Company refines wave energy converter”; hRw magazine, March 2009, page 48.
[45] Orecon website (2009); www.orecon.com/en/the-technology
[46] “OReCon raises $24m”; The engineer Online; http://www.theengineer.co.uk/Articles/305041/OReCon+raises+24m.htm
[47] “Prototype testing in Denmark”; http://www.wavedragon.net/index.php?option=com_content&task=view&id=12&itemid=14
[48] “The Seawave Slot-Cone generator (SSg) concept”; http://www.waveenergy.no/workingPrinciple.htm
[49] “MST Project”; http://www.waveenergy.no/MSTProject.htm
[50] “MhD wave energy Conversion (MweC)”; http://www.sara.com/RAe/ocean_wave.html
[51] barstow, S. F. and haug, O; “The wave Climate of the South west Pacific”; SOPAC Technical Report 206.
[52] wikipedia website (2009): http://en.wikipedia.org/wiki/Tidal_power
[53] “la Rance Tidal Power Plant”; http://www.reuk.co.uk/la-Rance-Tidal-Power-Plant.htm
[54] Khan, J and bhuyan, g.S; “Ocean energy: global Technology Development Status”; ieA-OeS Document no.: T0104.
[55] Shaw ,T.l; “la Rance Tidal Power barrage ecological Observations relevant to a Severn barrage Project”; Shawater limited
[56] “Tidal energy”; http://www.oceanenergycouncil.com/index.php/Tidal-energy/Tidal-energy.html
[57] wikipedia website (2009): http://en.wikipedia.org/wiki/Seagen
[58] “Verdant Power turbines retrofitted with new rotors to delivering energy from nyC's east River”; http://www.oceanenergycouncil.com/index.php/Tidal-energy-news/Verdant-Power-turbines-retrofitted-with-new-rotors-to-delivering-energy-from-nyC-s-east-River.html
[59] “Power Produced by the Pulse Stream 100 Tidal energy Converter”; Press Release August 2009, iT Power.
[60] Anderson, S; “The Tide-energy Project near the Mouth of the Amazon: Applying helical turbine technology at a small scale for rural communities”; May 2006.
[61] Ferreira, F; “Reverse electrodialysis”; http://www.leonardo-energy.org/23-reverse-electrodialysis.
[62] Van den ende, e & groeman, F; “blue energy briefing Paper”; KeMA Consulting October 2007.
[63] Skilhagen, S. e, Dugstad, J. e, Aaberg, R.J; “Osmotic power - power production based on the osmotic pressure difference between waters with varying salt gradients”; Statkraft Development AS, lilleakerveien 6, no-0216 Oslo, norway.
[64] Vega, l.A. “OTeC economics”, Presentation at energy Ocean Conference, August 2007, Turtle bay Resort, Oahu, hawai'i.
[65] “Proceedings of the Pacific energy Ministers' Meeting and Regional energy Officials' Meeting, 20-24 April, 2009". A CROP energy working group Report. SOPAC Joint Contribution Report 200.

A SOPAC Desktop Study of Ocean-based-Renewable energy Technologies
SOPA
C M
isce
llane
ous
Rep
ort 7
01
Ocean based Renewable energy Technologies
87
Ocean based Renewable energy TechnologiesOcean based Renewable energy Technologies
Appendix AEconomics for OTEC in Marshall Islands[64]
Vega (2007) did an analysis of the unit cost of electricity produced by OTeC plants in Marshall islands. The formula provided in box A1 was used to determine the unit cost of producing electricity
Cost of electricity (May’ 05-June’ 06)10 Mw capacity (diesel gensets)
COe ($/kwh): [0.16 + 0.05] = 0.21 [Fuel + OMR&R]
According to Vega, the U.S navy was willing to issue a Power-Purchase-Agreement if only the cost of electricity was reduced by at least 10% (0.9 x 0.21 = 0.19 $/kwh); however, considering the situation at that time and the cost associated in producing electricity, the 10% reduction was not feasible with a 10 Mw OTeC plant.
On the other hand, in hawai'i a 100 Mw OTeC Plant which is stationed 10 km offshore delivers:
800 million kwh/year to the electrical grid; and•32 million-gallons-per-day (MgD) of water.•
Using the same formula (box A1), he found out that an OTeC 50 Mw was cost competitive in hawai'i. Vega admitted that providing an updated assessment for a 100 Mw plant would be encouraging but it would be very difficult to obtain financing for such a large plant.
BoxA1:CostofElectricityProduction
COe ($/kwh) = CC + OMR & R + Fuel (for OTeC is zero) {+ Profit – environment Credit}
CC = Capital Cost Amortization (n.b. much higher for OTeC) OMR & R = Operations + Maintenance + Repair + Replacement

SOPA
C M
isce
llane
ous
Rep
ort 7
01A SOPAC Desktop Study of Ocean-based-Renewable energy Technologies
88
A SOPAC Desktop Study of Ocean-based-Renewable energy Technologies A SOPAC Desktop Study of Ocean-based-Renewable energy TechnologiesOcean based Renewable energy TechnologiesOcean based Renewable energy Technologies
AppendixBOcean Technologies Session of the REM&PEMM2009[65]
IntroductionThe Chair of the Ocean Session, Mr Rupeni Mario (SOPAC) called the session to order and presented the working procedure for the session. he also welcomed participants to the session particularly the presenters and introduced the facilitator, Dr Ajal Kumar of the University of the South Pacific.
Dr Ajal Kumar (USP) introduced the session and the four presenters highlighting that Pacific island Countries (PiCs) have a good understanding of the proven and well-established technologies such as wind, solar, hydro and biomass. Ocean-based renewable energy technologies are a new area and the session would focus on some of the technologies that have been commercialised or are near commercialisation. The presenters were introduced as follows:
AnthonyDerrick Managing Director of iT Power based in UK has had experience working in the Pacific when he was doing a consultancy on an eU-Un paper “energy as a Tool for Sustainable Development for Small island States”. At the inception phase he was Programme Manager for the ReP-5 Project.
BarbaraVlaeminck Director of SRP. SRP is a limited private company based in new Caledonia set up in 2005 and has done some preliminary studies in the Pacific in terms of wave energy. it was a privately-funded company initially and established in 1982 with six permanent staff mostly engineers and with aim of delivering services and project of new technologies aiming at a sustainable development.
GarryVenusandLukeGowing
Directors of Argo environmental limited, new Zealand. The Argo environmental limited is an environmental consultant focusing on environmental and resource projects. Agro environmental has a 20-year history of energy development; in hydro and geothermal and in the last 5 years started working on marine energy generation starting off from the Kaipara project but looking at others.
Andrea Athanas Senior Programme Officer, energy, ecosystems and livelihoods business and biodiversity, the world Conservation Union (iUCn).
The presentations by the above resource people are attached to this summary record.

A SOPAC Desktop Study of Ocean-based-Renewable energy Technologies
SOPA
C M
isce
llane
ous
Rep
ort 7
01
A SOPAC Desktop Study of Ocean-based-Renewable energy Technologies A SOPAC Desktop Study of Ocean-based-Renewable energy Technologies
89
Ocean based Renewable energy TechnologiesOcean based Renewable energy Technologies
PLENARYDISCUSSIONQuestions1–DoPacificIslandCountrieshaverelevanttemperaturegradient or enough tidal power to generate energy from the ocean?
IT Power reported that there are some temperature differentials in the ocean as well as tidal current around the Pacific but still not as great as in other areas of the world. The question always comes down to the economics and whether an appropriate technology is available at the present time. The technology is not yet there but potentially in the future the technologies are economical given the recent renewed interest to invest in OTeC. There is potential for wave and tidal power but several years away. let the UK and eU countries spend their money now to get the costs down through their installations and then have a fix on the economics and looks at its relevance to the Pacific situations.
The northern hemisphere focus such as UK is predominantly focused on high yield areas with massive tidal current for 15 Mw tidal generations. but it is worth considering the PiCs for local situations such as soft lagoon with reasonable current, not massive high current where there is a possibility of deploying small-scale generation project such as the system used in river situations so it is basically local solution to a local problem. There may be a possibility of putting together a combination that looks at generating relatively low level of electricity which could be disproportionately available at local scale.
wave resources in the Pacific are less powerful compared to the northern europe, but at least the Pacific region have non-seasonal waves that is regular that does match quite well with the energy consumption. Promoting the advantages of wave energy such as reducing the use of land maybe useful.
Republic of Marshall Islands raised a concern on the human resource issues. There are a lot of things that the Pacific need to use which are proven technology and the concern was diversion [of scarce] resources. The Pacific could lose or spend the money to prove things therefore it may be prudent to maintain watching briefs on the technologies while the larger countries who could, do spend the money to prove things before the smaller PiCs get involved. The other issue is to get technologies that are small and economic. The impacts of the new technologies on human resources and capacity building within utilities would be similar to the wind turbine into grids technology; implying that similar issues would be associated with marine turbines therefore translating into diversion of resources.
WorldBank highlighted the large number of feasibility studies and the efforts that have gone into them; i.e. the hydrology and bathymetry studies for a marine energy feasibility study, which comparable to efforts that go into a hydro feasibility study.
SRP highlighted that full feasibility studies on wave technologies (seabed nature and bathymetry) can cost as much as a million euro for a complete feasibility study. generally data collection can be done by countries and become available for project developers. wave resources measurements can cost up to 107,000 euro.
IT Power confirmed the similarity in the levels of required effort for hydro feasibility and marine energy feasibility studies.

SOPA
C M
isce
llane
ous
Rep
ort 7
01A SOPAC Desktop Study of Ocean-based-Renewable energy Technologies
90
A SOPAC Desktop Study of Ocean-based-Renewable energy Technologies A SOPAC Desktop Study of Ocean-based-Renewable energy Technologies
IUCN pointed out that one of the major sources of revenue for the island countries is tourism so maybe a way forward is to put in place regulatory measures that these technologies do not in any way impact the tourism aspects. As shown in the new Zealand presentation where the placement of big wave instruments/machines in a place of scenic beauty took away some value, so if these machines are going to be considered for the Pacific; it was advised that some regulatory measures should be considered beforehand.
AgroNewZealand completely agreed and that this was the whole key to proper planning and addressing all environmental impacts in the process. it was important that there were procedures in place so potential developers would be very clear on what the expectations were.
IUCN offered that there was the role of stakeholders’ engagement in the eiA and consultation process. Those who would potentially be impacted by the development, e.g. tourism industries, fisheries and local communities should be involved in the process. Robust eiA practices can help ensure that energy installations are compatible within and in fact benefit local communities.
UNELCO made a general point that the promotion of renewable energy had been thoroughly discussed during the meeting so far. he thought that officials needed to convince certain key people that energy installations like wind turbines were beautiful. The choice was between burning diesel fuel and looking at wind turbines and he suggested that officials needed to be more convincing about arguing that energy installations were beautiful because they brought energy and he was certainly going to do his bit along those lines in Vanuatu.
Question 2 –With the ocean-based technologies heading into thePacific;havethesesametechnologiesbeenthroughtheexperienceof cyclones?
IT Power answered that in the United Kingdom and Scotland offshore climate are often extreme sometimes, there are devices that suffered dramatically from under-estimating the power of the waves but these things are designable. One consideration is that some of the devices are underwater and were therefore to some extent shielded from extreme waves.
SRP reported with respect to the Pelamis machines they were familiar with, that there were two risks: (1) the wind; and (2) the wave that would be created by the cyclone. The wind does not have too much of an impact as only a small part of the machine is above water; but the wave could be damaging. what is done when doing the complete study is to also look at the climatology of the wave during the extreme weather event, like the cyclone. For example in new Caledonia, a potential 21 m wave height was calculated and therefore the machine has been designed for a 29 m wave height. So far the most extreme wave experienced was in the vicinity of 12 m so the machine can theoretically survive a worse event.
Nauru commented that they had not forgotten about the alternative OTeC technology since the last OTeC in nauru (31 kw capacity). The nauru installation unfortunately did not last long due to a disaster. The system was only feeding into the grid at the time it was established. nauru has not forgotten about the OTeC technology as an alternative option for electricity supply, even after their experience with OTeC. nauru stressed their continued interest in OTeC and welcomed discussions. They also welcomed presenters and developmental partners that may be interested in the challenge of lending nauru a hand to re-assess and pursue this option.

A SOPAC Desktop Study of Ocean-based-Renewable energy Technologies
SOPA
C M
isce
llane
ous
Rep
ort 7
01
A SOPAC Desktop Study of Ocean-based-Renewable energy Technologies A SOPAC Desktop Study of Ocean-based-Renewable energy Technologies
91
SRP used the opportunity to rephrase a question posed during their presentation. would one of the development partners capable in the sense of rules and criteria to elect some funds? would partners be attracted to funding the feasibility studies that need to be undertaken and/or at what stage should developers contact potential donors and how should developers move forward on how studies could be funded?
Question3–GivenNauru’sOTECexperienceand themechanicalsystemspresented,which is themoreappropriate for thePICsandwhy?
IT Power offered that it would take different applications for different countries; and it is still unclear on which technology would enjoy success in each area. iT Power recommended that officials keep up to date with the technologies by looking at international energy agencies and social energy groups’ quarterly newsletter on ocean energy to get a feel for what other technologies might be coming on board.
The OTeC for example, has a fantastic long term potential when looking from the resource perspective. OTeC works but to date the economics are not proven so the question is when would a commercial product be available that would be reliable? it is difficult to say what would be the best option in the long term and therefore repeated the recommendation that countries maintain a watching brief on those technologies through organisations like the international energy Agency; and he noted that there was conference on ocean energy coming up soon in new Zealand as well – while at the same time feasibility studies would help to identify which particular technologies are most appropriate.
Al Binger from CCCCC earlier presented along with colleagues from SPReP some very detailed numbers on the costing of OTeC systems. For those really interested in OTeC, there is a 30-kw working plant at Kyushu at Saga University situated in imari [Japan] which has been operational now for more than 5 years; so there is enough data available to basically make the projections as to what the cost is.
The big unknown in OTeC is the bathymetry; and estimates have that 40% of the cost is in the pipeline; so you have the option of whether you base the plant offshore in which case you look at an oil rigging type of structures or you basically bring the three water pipes onshore. his view was that the idea of OTeC being somewhere in the future is really not so accurate anymore. OTeC is not a new technology; and when new renewable energy technology is discussed OTeC is there like in this instance, like doing a OTeC a big favour. The first paper on OTeC was written in 1881 but the problem with OTeC and the nature of the resource is that it is basically confined to tropical oceans and where the bathymetry is very fast so that there are no long pipelines. So for groups of countries who are interested in OTeC he thought that the countries needed to make it happen for themselves; and he suggested a small consortium of island states that have a vested interest to actually push the donors to help. with what is about to happen with climate change, OTeC is a wonderful adaptation technology because if the loss of aquifers and freshwater supply occurs due to sea-level rise this could be one way one could actually change the economics.

SOPA
C M
isce
llane
ous
Rep
ort 7
01A SOPAC Desktop Study of Ocean-based-Renewable energy Technologies
92
A SOPAC Desktop Study of Ocean-based-Renewable energy Technologies A SOPAC Desktop Study of Ocean-based-Renewable energy Technologies
looking at the cost to desalinate a litre of salt water in terms of energy versus having it produced by OTeC as a by-product, it is notably orders of magnitude cheaper. A look at the end products –the exhaust water comes out at about 12 to 14 degrees Celsius which is ideal for mariculture. he advised that when looking at the technology not to base the economics on the energy alone but to look at what it contributes to the sustainable development of an island state. Most that do understand OTeC don’t view it as an energy technology but rather as a sustainable development technology; and in that context makes OTeC very different from the other ocean energies. he emphasised that maybe the issue for small island states was how to collectively work together to advance the knowledge and disseminate the information so that it became a part of the renewable energy menu.
European Commission provided a donor’s viewpoint on their work in the Pacific and other regions. The european Commission was trying its best to ensure they disseminated only proven technologies in renewable energy; and that they actually work on the ground in these countries. They found it to be quite difficult and challenging to have these working. Apart from ReTs, they see great potential in terms of energy efficiency both in the supply side and demand side. These activities also need funding and funding is limited whether through grant or loan financing. what can be best for the region is to let the western countries develop these technologies, make them suitable for the region and look at them in the future.
According to the speaker, the presentations heard were rather conservative in terms of what was actually happening. he had attended various conferences in Scotland that were held every two years and presenters are right on the other end of the scale in terms of where the industry is. it was quite possible that there was technology that was applicable for local applications here that are already around, apart from small-scale in-river generation applications. The difficulty is that the Pacific could not wait for the european countries turbine developers to finish as they are looking at higher yields environment that are not typical of the Pacific; hence there was a gap and a need to focus on the lower-yield technologies.
UNDP concurred with the view from the eU. he advised a focus on reliable and proven technologies that work in the Pacific countries. he informed the meeting that the Tokelau national energy Policy has concluded that it would focus on technologies that have worked for at least five years in the PiCs or in a similar setting and they would not consider any other technologies; this was a good guiding principle. Proven commercial off-the-shelf technology was probably the best option.
Question4–Isittooearlytodeveloparoadmapforthisoceanrenewable technology or should the PICs concentrate on whatever proven technology and forget about OTEC?
IUCN counselled that during the preparatory work that environmental considerations be a reasonable first step at the time of site assessments so that when the technology were in line for implementation the developers and those receiving the technology were ahead of the game in the more practical sense.
PapuaNewGuinea commented that the maintenance of the technology was also to be a prime consideration before introducing any technology into a country. in the late 1970s, there were technologies brought into countries, e.g. the charcoal gasifier – there was no interest in the project to sustain the technologies and the major problem was the lack of maintenance and interest in maintaining the system.

A SOPAC Desktop Study of Ocean-based-Renewable energy Technologies
SOPA
C M
isce
llane
ous
Rep
ort 7
01
A SOPAC Desktop Study of Ocean-based-Renewable energy Technologies A SOPAC Desktop Study of Ocean-based-Renewable energy Technologies
93
Nauru responded to earlier suggestions for pursuing technologies that are proven now. in the unique case of nauru they needed to explore every option applicable and did not wish to be limited; so that they fully explored the opportunity to achieve their renewable energy targets.
Tuvalu suggested that given the difficulties with introducing new technologies into the PiCs that training be undertaken within PiCs to develop the ability to do their own feasibility studies rather than spending millions; so that when developers came into countries, data required was available and probably by that time the technology would be viable.
WorldBanknoted what other donor colleagues have mentioned in general about aiming to use commercial technologies because as sometimes these new technologies may add up to the complexity of the current technologies. The type of technology applicable in the north was not going to work in the South and if PiCs were to wait for appropriate and proven technologies, this might take fifteen years of waiting.
The proposal from Al binger that SiDs should get together and build a lobby group demanding that there is a need for development of ocean technology that was appropriate and worked in the small island environment. world bank was not committing but was certain there would be sources of financing that could be interested to take this on if there was a strong enough lobby for it. So the idea of getting together and making the case for work to start on appropriate technology that was feasible for this part of the world was better than just waiting for something to happen.
SRP offered that identifying the devices and undertaking the resource assessment studies could be done in parallel.
IT Power pointed out that the eC was supporting technology development indirectly in europe; however most of the money was going into larger units. Many technologies under development are modular, so 1-2 Mw (small) tidal current units for shallow water have also been developed and are being developed, although to a lesser extent than the larger units.
Argo New Zealand observed that the environmental lead up time in terms of getting resources information and other environmental stakeholders’ views also takes time so that the technology evaluation and adaptation should also run in parallel in general with environmental considerations.
IUCN recommended establishing the kind of ownership and regulatory frameworks to provide a mechanism for incentive for maintenance of the equipment. Also, the regulatory framework should ensure that the seabed ownership issues are addressed and put in place.
Republic of the Marshall islands commented that when the countries should club together and that perhaps resources and finance should be brought forward so that may be needed in the coming future.
AlBinger advised about some new technology developed by google that can scan lots of bathymetry. he had started looking at the bathymetry collected by this technology; at close to 1000 meters would mean a lot of the information that would be needed would be available. he said it was a lot cheaper to fly around and use sonar to map the bathymetry. he prompted that maybe SOPAC or SPC or one of the agencies in the Pacific who has resource assessment in their portfolio to look at providing good information. Fiji, he said, had developed some OTeC sites so there seemed to be some information already available to work with.

SOPA
C M
isce
llane
ous
Rep
ort 7
01A SOPAC Desktop Study of Ocean-based-Renewable energy Technologies
94
SOPAC informed the meeting that SOPAC does do these assessments through its Ocean and islands Programme. A good portion of Pacific shallow-water bathymetry has been collected and so this information is available.
IUCNmentioned that google also has the conservation priority areas indicated, particularly for the marine environment so that it was possible to overlay the information and determine where you can avoid environmental impacts.
Question6–OTEChasbeenexperienced inNaurubut the islandresource needs assessment after the accident that stopped operations andwhywastheinstallationnotrehabilitated?Whatwillbethefateofdoingasimilarproject?
IT Power pointed out that this fell under the need for feasibility studies and resource assessments being worth doing.
AlBinger informed the meeting that the original project in nauru was developed by Kyosu electric Utility in southern Japan and was based on the open cycle, which was not the most efficient system so when the cold water pipe broke it was its second failure; and it was decided that it was not sensible to try to re-habilitate it using the open cycle as other efficient cycles have been developed. Also, Kyosu just lost interest in the project.
SUMMINGUPBYTHEFACILITATOR(AjalKumarofUSP)
it seems clear that OTeC is still being refined and while it is being refined PiCs need to develop their human resources so that when the technology is introduced the manpower is ready and able to implement. The appropriateness of the technology depends on where it would be placed. A 7-Mw OTeC system is operational in Canada; however for small island countries' economies, geographic isolation, and costs of small-sized installations are challenges that need to be overcome. in terms of resource assessment, the Pacific will need time to assess resources. SiDS also need to collaborate to identify suitable technologies and do a collective proposal. Finally that some work has already been undertaken by SOPAC in terms of resource assessment, which data can be accessed beginning at the SOPAC website.
The session closed with a cocktail hosted by iT Power

A SOPAC Desktop Study of Ocean-based-Renewable energy Technologies
SOPA
C M
isce
llane
ous
Rep
ort
95

96