a spreadsheet model for using web service data
TRANSCRIPT
A Spreadsheet Model for Using Web Service Data
Kerry Shih-Ping Chang Human-Computer Interaction Institute
Carnegie Mellon University Pittsburgh, PA, USA
Brad A. Myers Human-Computer Interaction Institute
Carnegie Mellon University Pittsburgh, PA, USA
Abstract— Web services offer a more reliable and efficient
way to access online data than scraping web pages. However, web service data are often in complex hierarchical structures that make it difficult for people to extract the desired parts or to per-form any further data manipulation without writing a significant amount of surprisingly intricate code. In this paper, we present Gneiss, a tool that extends the familiar spreadsheet metaphor to support working with data returned from web services. Gneiss allows users to extract the desired fields in web service data using drag-and-drop, and refine the results through spreadsheet for-mulas, along with sorting and filtering the data. Hierarchical da-ta are stored as nested tables in the spreadsheet and can be flat-tened for future operations. Data flow is two-way between the spreadsheet and the web services, enabling people to easily make a new request by modifying spreadsheet cells. In addition, using the dependency between spreadsheet cells, our tool is able to create parallel-running data extractions based on the user’s se-quential demonstration. We use a set of examples to demonstrate our tool’s ability to create fast and reusable data extraction and manipulation programs that work with complex web service da-ta.
Keywords—spreadsheet; mashup; end-user programming
I. INTRODUCTION The Internet is full of data. While many data are presented
in the form of web pages, more and more data sources now provide web services that allow data to be retrieved using web APIs. Compared with scraping web pages, web services offer a more efficient and reliable way to access online data, as they do not rely on parsing web page layouts that might change fre-quently. Many data sources also support more sophisticated searches, and return more detailed data in their web services than on their websites. As RESTful web services have now be-come the mainstream1, web APIs are often accessed through URLs that are designed to be human-readable [1] and can be directly used in a web browser. The availability and variety of web services make them good resources for people who want to collect online data and perform custom data manipulations such as combining or comparing data.
However, working with web service data remains difficult for many people as web services often return large and com-plex hierarchical structures (see Figure 1). While it is common for people to collect data from multiple sources in daily tasks, working with data from multiple web services requires stitch-
1 According to ProgramambleWeb (http://www.programmableweb.com/apis), there are over eleven thousand web APIs on the Internet, and 70% of them are REST APIs.
ing together multiple web APIs, extracting desired parts from the returned data, and then performing further data operations. This usually requires people to write a significant amount of surprisingly intricate code that deals with asynchronous net-work calls which may fail to return, often requiring complex and sometimes nested call-backs [2]. Research has found that the majority of web API users are tech-savvy developers, and even they encounter many programing difficulties when trying to integrate multiple web services [3]. Data flow language tools such as Yahoo Pipes [4] and Microsoft PopFly [5] can let people wire up web services without writing conventional code, but studies have found that the dataflow concept is often difficult for people to comprehend [6], [7], and these tools have not been particularly popular or successful with end-users.
In this paper, we present Gneiss2, a new tool that extends the spreadsheet model to work with structured web service data. We chose to leverage the spreadsheet metaphor because it is popular with end-user programmers and familiar to many people [8]. Spreadsheet tools provide many formulas for data manipulation and are commonly used to work with data. What
2 Gneiss (pronounced the same as “nice”) is a kind of rock. Here it stands for Gathering Novel End-user Internet Services using Spreadsheets.
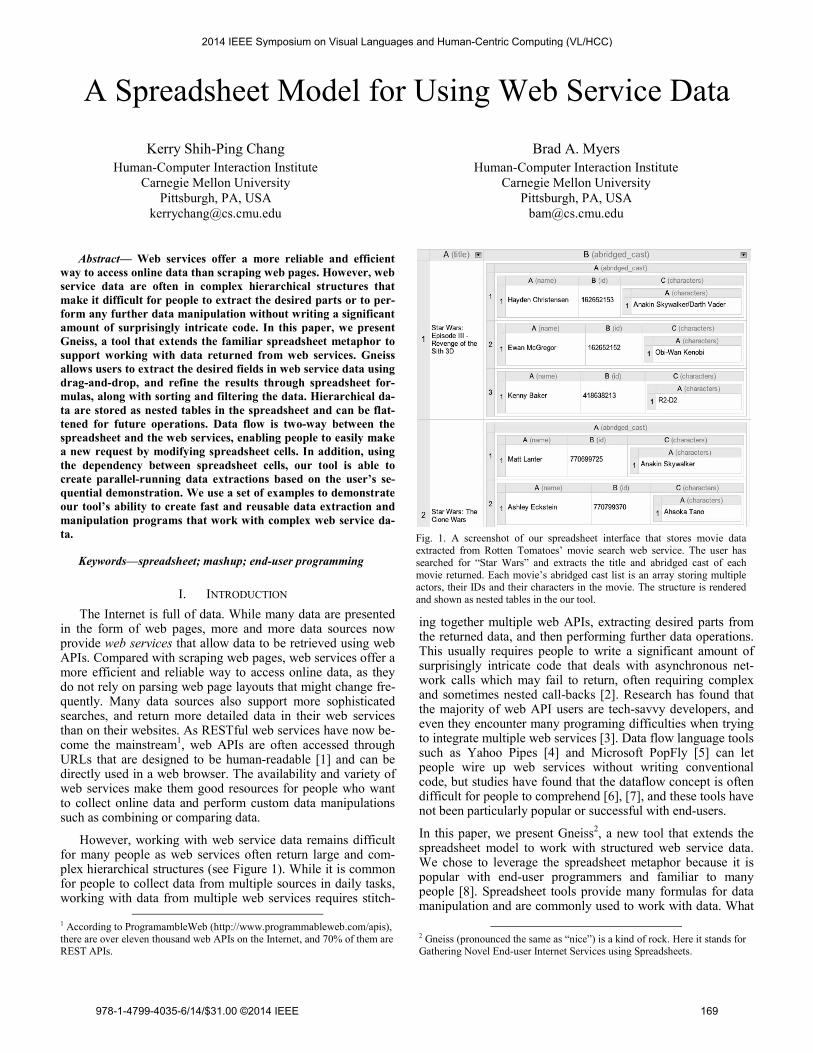
Fig. 1. A screenshot of our spreadsheet interface that stores movie data extracted from Rotten Tomatoes’ movie search web service. The user has searched for “Star Wars” and extracts the title and abridged cast of each movie returned. Each movie’s abridged cast list is an array storing multiple actors, their IDs and their characters in the movie. The structure is rendered and shown as nested tables in the our tool.
2014 IEEE Symposium on Visual Languages and Human-Centric Computing (VL/HCC)
978-1-4799-4035-6/14/$31.00 ©2014 IEEE 169
current spreadsheet tools do not support well are interacting with web services and handling structured data. While some spreadsheet tools support getting web service data using for-mulas [9], [10] or built-in dialog boxes [11], they require people to write code to program the formulas or to extract de-sired fields from the return data. They also do not preserve the structure of the extracted data and can only store a flattened string in a table cell.
To address these problems, we closely integrate web services with spreadsheets in our tool. Gneiss (Figure 2) includes a source panel that shows web service data and a spreadsheet in-terface for working with the data. Data extraction is performed by selecting the desired fields in the hierarchical display on the left, dragging and dropping them to the top cell of a column, and then the system automatically populates the rest of the cells in the column with the corresponding data from the other returned items. To further refine the extracted results, the user can apply sorting and filtering on the dynamic web services da-ta. Our tool saves the structure of the extracted data and presents the results as nested tables. We extend the spreadsheet language to let users easily refer to the value of any cell in the nested tables, and allow the structure to be flattened through formulas for future operations. Data flow is two-way between the source panel and the spreadsheet interface, so the user can link parameters in the Web API call to spreadsheet cells using the spreadsheet language, creating easily modifiable and reusa-ble data extraction programs. In addition, the spreadsheet me-taphor allows our system to calculate the dependencies among the cells and the web APIs to construct parallel-running data extractions based on the user’s sequential demonstration. Combining all these features together, our work contributes a novel spreadsheet model for using dynamic, structured web service data. We evaluate our tool with a series of examples to demonstrate its ability to create fast and reusable data extrac-tion and manipulation programs.
In the rest of the paper, we first survey related work. We then describe Gneiss in detail and present the demonstrative exam-ples. We conclude the paper with future work.
II. RELATED WORK The related work comes from a number of areas, including
mashups, spreadsheet tools and end-user programming. We use this section to motivate our work as well as showing how our system makes a unique contribution by providing novel ways to use web services through a spreadsheet interface.
Prior systems have tried different approaches to help end-users use web service data. d.mix [12] lets users copy web ser-vice calls from pre-annotated web pages to use in personal ma-shups. Marmite [13] uses a data flow approach to let users create mashups and has several built-in web services with which users can interact using form widgets. DataPalette [14] also uses built-in web services and focuses on helping users merge similar data from multiple sources. Commercial spread-sheet tools such as Microsoft Excel [9] and Google Spread-sheet [10] support formulas or macros that access web services. An unsolved issue in all of these systems is that although they successfully hide the complexity of using web service data from end-users, adding a new web service to these systems re-
quires writing a significant amount of conventional code that is almost impossible for end-users to do. End-users also cannot select which data to extract from the entire return document because this is preselected by the developers when program-ming the web service into the tool. While there are tools that provide more general widgets to fetch data from a given URL (such as OpenRefine [11] and Yahoo Pipes [4]), in these tools to extract the desired parts from the returned data still requires people to write code using XPath-like languages [15], which are not necessarily intuitive for end-users.
In contrast, Gneiss support using data from any RESTful web service that returns data in JSON format, and allows users to demonstrate how to extract the desired data through drag-and-drop. Furthermore, all the prior tools mentioned above omit structures in the extracted data and often show them as flattened strings. In contrast, Gneiss maintains the structure of the data using nested tables and provides a new formula that flattens the data structure to allow the data to be further mani-pulated using regular spreadsheet methods.
Many prior tools focused on algorithms to extract data from web pages. Most of them use the structure of the web page and heuristics generated from the characteristics of the page. For example, Sifter [16] extracts search items on a web page using the HTML structure and scrapes subsequent web pages by ex-amining hyperlinks (such as “Next page”) and URL parame-ters. Vispedia [17] extracts Wikipedia infoboxes using the table structure and uses the hyperlinks in an infobox to retrieve re-lated topics. There are also commercial web scrapers, such as Scraper [18], a Chrome plugin for scraping similar items in web pages, and ScraperWiki [19], a commercial product that specifically targets scraping Twitter and tabular data. Gneiss is essentially different from these systems as it focuses on using web service data after it is returned. However, we believe that many of the features in Gneiss could be extended to use data that has been extracted from web pages as well, such as the ability to apply sorting and filtering to the resulting dynamic data, and allowing two-way data flow between the source and the spreadsheet. We discuss this further at the end of this paper.
Some other tools focus on interaction techniques for ex-tracting web page data. They also use the page structure to identify related items, and determine the data to be extracted based on the user’s demonstration. Karma [20] allows users to extract data from a web page by dragging the first item to a ta-ble and then the system populates the rest of the rows. It also allows the user to simultaneously edit multiple similar cells by example, such as to reformat all phone number cells at once. Gneiss makes different contributions as it handles structured web service data and support two-way data flow between the source and the spreadsheet table. Vegemite [21] lets users ex-tract data by copying and pasting data from web pages to a ta-ble. It further records the user’s activities in the browser such as entering, copying and pasting text, and pressing buttons, to generate step-by-step scripts to reuse in the future. Different from Vegemite, Gneiss uses the spreadsheet metaphor instead of recording user scripts to support two-way data flow, and is able to infer parallel-running data extraction programs instead of generating sequential scripts.
170

Some prior tools also use the spreadsheet metaphor to assist end-users in creating mashups, but they use very different ap-proaches than Gneiss. For example, SpreadATOR [22] allows users to annotate a web data source by constructing a data model that specifies possible fields to use later. From the spreadsheet the user can select a field of a data model to view using formulas. Gneiss takes a different approach of letting us-ers extract web service data by demonstrating desired fields di-rectly from the returned data through drag-and-drop without the need for any predefined data models. Gneiss also supports two-way data flow between the spreadsheet and the web data source, whereas in SpreadATOR, data flow is only one-way from the data source to the spreadsheet. Baglietto et al. [23] de-scribe a framework that allows users to create mashups by link-ing multiple spreadsheets. Gneiss has a different focus, which is extending the spreadsheet metaphor to enable using and ma-nipulating data from multiple web sources.
Another category of related work is research tools that ex-tend the spreadsheet metaphor to support other kinds of end-user programming. For example, Forms/3 [8] is a spreadsheet programming language that allows the user to define objects using custom forms that contain cells that store constants and formulas. Forms/3 supports structured cells that hold other cells and matrixes. Also using structured cells to assist pro-gramming, Jones et al. [24] extends regular spreadsheet cells to store vectors. To our knowledge, none of the prior spreadsheet programming tools deals with web data sources, which is the main focus of our work.
III. USAGE SCENARIO Here we describe a scenario where Alice, a college student,
is using Gneiss to create a spreadsheet program that uses a res-taurant web service to look for the highest rated restaurants and then uses a direction web service to calculate the driving dura-tion from her school to the restaurant. The final resulting spreadsheet looks like Figure 2. We use this scenario to give an overview of how someone could use our tool to create a reusa-ble, parallel-running data extraction program that uses multiple web services. Later we will explain our tool in detail.
Figure 2 shows the screenshot of Gneiss. At the left is a source panel that displays raw data returned from a web ser-vice. At the right is a spreadsheet interface. To start finding restaurants, Alice enters Yelp’s restaurant search API into the URL textbox (Figure 2 at 1). The return data are shown below the textbox (Figure 2 at 2). Alice then binds the value of a cell A1 in the spreadsheet to the value of the parameter “term” in the API, which is the query term. To do so, she changes the value of “term” to {{A1}} (see Figure 2 at 1). Now every time that A1 changes, a new restaurant search request is sent using A1’s value as the query string, and the source panel up-dates to show the latest return data.
Alice does a few tests and makes sure this part works cor-rectly by trying different search strings. She then starts to ex-tract the fields she wants. Alice first wants to use the name of each restaurant. She clicks on the “name” field of the first res-taurant. The field gets highlighted with a blue background. She then drags the field and drops it on cell B1 in the spreadsheet. The tool automatically extracts the names of all restaurants and
Fig. 2. A screenshot of Gneiss showing the spreadsheet program created in the usage scenario (Section III). At the left is a source panel that shows raw data returned from a web service. (1) is the URL textbox where the user enters a web API. Note that the value of the cell A1 has been used as the search term. (2) is the returned data. (3) is the spreadsheet interface where the user can store desired fields extracted from the raw web service data and do manipulation. (4) If the extracted data have structure, they are shown in nested tables. The final results, the driving time from Alice’s school to the resturant, are shown in column F at (5).
171
put them in column B, and a grey text appears next to column B’s label to show the field name from where the data was ex-tracted (Figure 2 at 3). Alice extracts the rating, reviews and address of each restaurant in the same way. The API returns multiple reviews for a restaurant. Alice selects the text_excerpts of the reviews of the first restaurant and drops them on cell D1. The tool populates the rest of the cells in the column and shows the reviews in nested tables (Figure 2 at 4).
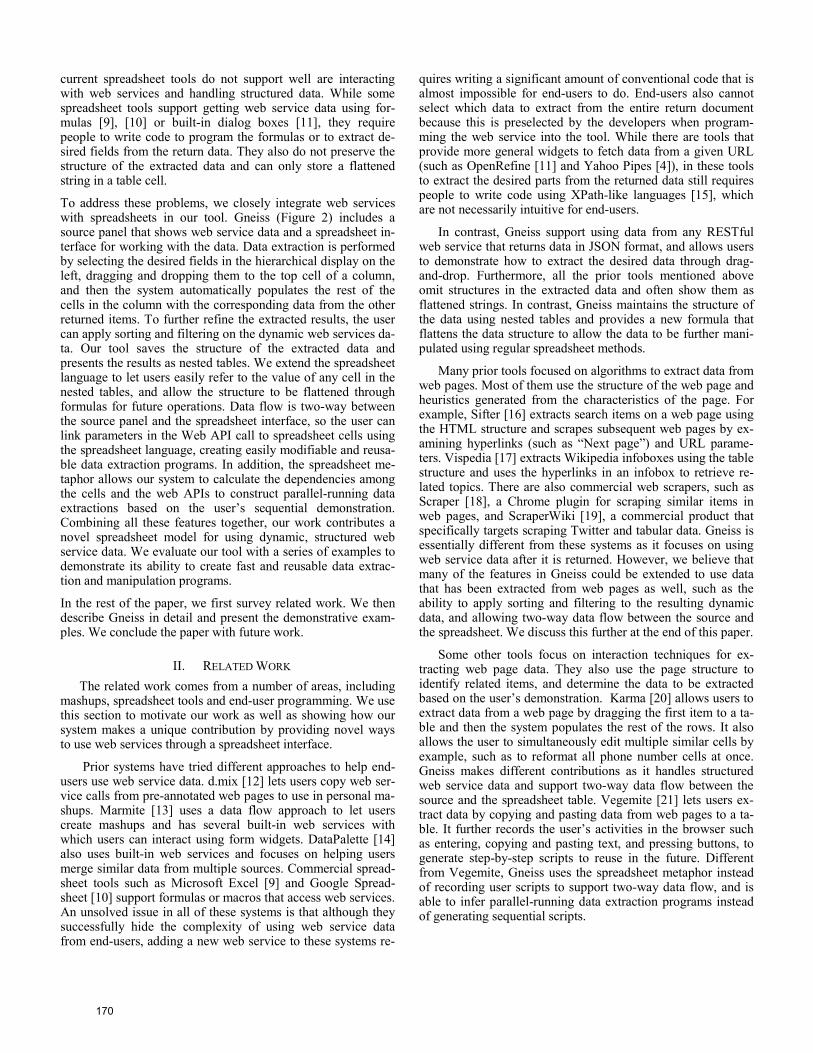
Alice only wants the top 3 rated restaurants. To do so, she clicks on the arrow button at the top of column C, the column that stores the ratings, to bring up a dialog box that lets her sort and filter the extracted data (Figure 3). She sorts the column descending and filters to show only the first three items.
The last step is to use a direction web service to calculate the time from Alice’s school to the restaurant. Alice enters Google’s direction API in the URL bar, and she binds the value of parameter “origin” and “destination” of the API to the value of cell A2, which has the address of her school, and E1, the ad-dress of the first restaurant. The API returns the time, and she drags-and-drops it into cell F1, while F2 and F3 stay empty. To send two more direction requests using the other two restau-rants’ addresses as destinations to fill in F2 and F3, Alice se-lects F1 and moves the mouse to its bottom-right corner. The mouse becomes a “plus” sign for the familiar “auto-fill” com-mand. She presses the mouse and drags down to F3 to fill in F2 and F3 with the time-to-destination of the two other restaurants (Figure 2 at 5).
Alice has now finished her data extraction program that uses Yelp’s and Google’s web services to find top-rated restau-rants and the driving time from her school to the restaurants! She can easily look for another type of restaurant by changing A1, or instead view the time-to-destination from her house to the restaurant by changing A2. The spreadsheet will update to show the results based on the latest values in A1 and A2. While the direction requests can only be sent after the restaurant
search request returns so all the addresses are filled in, among the direction requests there are no dependencies. Therefore, the three direction requests are sent in parallel to speed up the per-formance. Alice saves the spreadsheet she just created. The next time when she needs to do another restaurant query, she only has to load the spreadsheet back into the tool.
IV. KEY FEATURES In this section we describe the key features in Gneiss de-
signed to assist people in using web service data. We omit de-scribing the regular spreadsheet features since they are not the contributions of this work.
A. Selecting and extracting desired data In Gneiss, raw data returned from web services are shown
in the “source panel” at the left of the interface. When the user hovers the mouse over each field in the returned document, the field is highlighted with a light blue background, and its cor-responding path [25] is shown (below the URL textbox in Fig-ure 2 at 1, with a yellow background). The user selects a de-sired field by directly clicking it. In Gneiss, the user always se-lects the the first field and puts it in the top spreadsheet cell. The system will collect similar fields in other items if the “po-pulate the column with similar items” checkbox (Figure 2 at 2) is checked. For example, in the usage scenario, to create a col-umn where each cell in the column has a restaurant name, the user only needs to select one restaurant name and drag it to the top of a column. With the “populate the column” checkbox checked, the system fills in the rest of the column with the oth-er restaurant names. Gneiss also allows users to put multiple fields into a spreadsheet cell. For example, in the scenario, Alice has put all reviews of a restaurant in a spreadsheet cell. To do so, she can select multiple fields from the source panel by pressing control and clicking on the text_excerpt fields. Al-ternatively, she can also click on the path generated by the sys-tem (in the yellow area below Figure 2 at 1) to edit it to include multiple fields. For example, in the scenario, Alice can either select all the review text of the first restaurant by pressing con-trol and left clicking, or select the first review of the first res-taurant and edit the path from businesses[0].re-views[0].text_excerpt to instead be business-es[0].reviews[*].text_excerpt. All selected fields will be highlighted and the user can move them to the spread-sheet together using drag-and-drop.
When the user drags some web service data to a column, the column gets reserved to only show those data. Empty cells are greyed out to show that they are not available for manual edits (see Figure 2). Since the web service data come in dy-namically, we adopted this design to avoid the situation where the user’s data gets accidentally erased if the new web service data is longer than the first demonstration. For example, in the scenario, the number of restaurants returned from the web ser-vice might be different each time based on different query terms. The user can select a column and choose to clear all contents to start over. Users are free to type anywhere in col-umns that just contain user-typed data, like column A.
In order to view the raw return data of any extracted cell, the user only needs to right click on the cell and choose “view
Fig. 3. Pressing the arrow icon at the top of each column brings up a dialog box that allows the user to apply sorting and filtering to that column. Data extracted from the same source (in neighboring columns) are sorted and filtered together and are highlighted with a purple background. The column from which the dialog box is opened is highlighted with a purple border.
172
source”. The corresponding web API will be put back in the source panel and the raw return data that was used to populate that cell will be shown. So for example, in the scenario, after Alice finishes extracting data from Google directions, she can right click on any restaurant cell and choose “view source” to reopen the raw restaurant search data returned from Yelp, and she could then do more edits or extract other fields.
B. Sorting and filtering The regular sorting and filtering in Microsoft Excel or
Google Spreadsheets only sorts and filters the current data in a column and do not apply to future edits. For example, after sorting a column in alphabetical order, adding new values to the column does not reorder the cells. In contrast, in Gneiss once sorting and filtering are applied to a column, they are ex-ecuted every time when the data in the column change. This al-lows the user to apply selection rules to the dynamic web ser-vice data using sorting and filtering and enhances the reusabili-ty of the resulted data extraction program. For example, in the scenario, Alice gets the top-rated restaurants by sorting the rat-ing field in descending order and filtering to show the top three items. The sorting and filtering will execute every time when she makes a new query and a new list of restaurants comes in.
To apply sorting and filtering to a column, the user clicks on the arrow icon at the bottom-right corner of the column title (see Figure 3). A dialog box will appear to let the user specify how they want the column to be sorted and filtered. Currently our system supports sorting ascending and descending, and fil-tering by the number of items, or by the cell’s values. The user can also specify to remove duplicates. The other columns ex-tracted from the same source will be sorted and filtered togeth-er. Our system shows which ones these are to the user by hig-hlighting all of the affected columns using a purple back-ground, with the column to which the dialog box belongs hav-ing a purple border.
C. Working with structures If the user selects multiple fields or an object that contains
multiple fields in the source panel and drags the data to the spreadsheet, the data will be shown in nested tables, rendered according to the structure of the data (see Figure 1 and Figure 2 at 4). For example, in Figure 1, column B stores the abridged cast of each movie. The abridged cast for each movie is an ar-
ray, and each item in the array has three fields: the actor name, his ID in the movie database, and an array that stores all cha-racters he plays in the movie. The nested table is rendered to reflect this structure. We extend the common spreadsheet cell representation to let the user refer to any cell in the nested ta-ble, using the syntax cell.childCell. For example, to re-fer to the cell with value “Ewan McGregor” in Figure 1, the user enters B1.A2.A1. Similarly, in Figure 2 at 4, to refer to the third review of the second restaurant, the user would enter D2.A3. As in many other spreadsheet tools, instead of manual-ly typing the cell name, the user can also click on the desired cell and let the system insert the appropriate cell name for her, so she does not have to count the columns and rows if the structure gets too complicated.
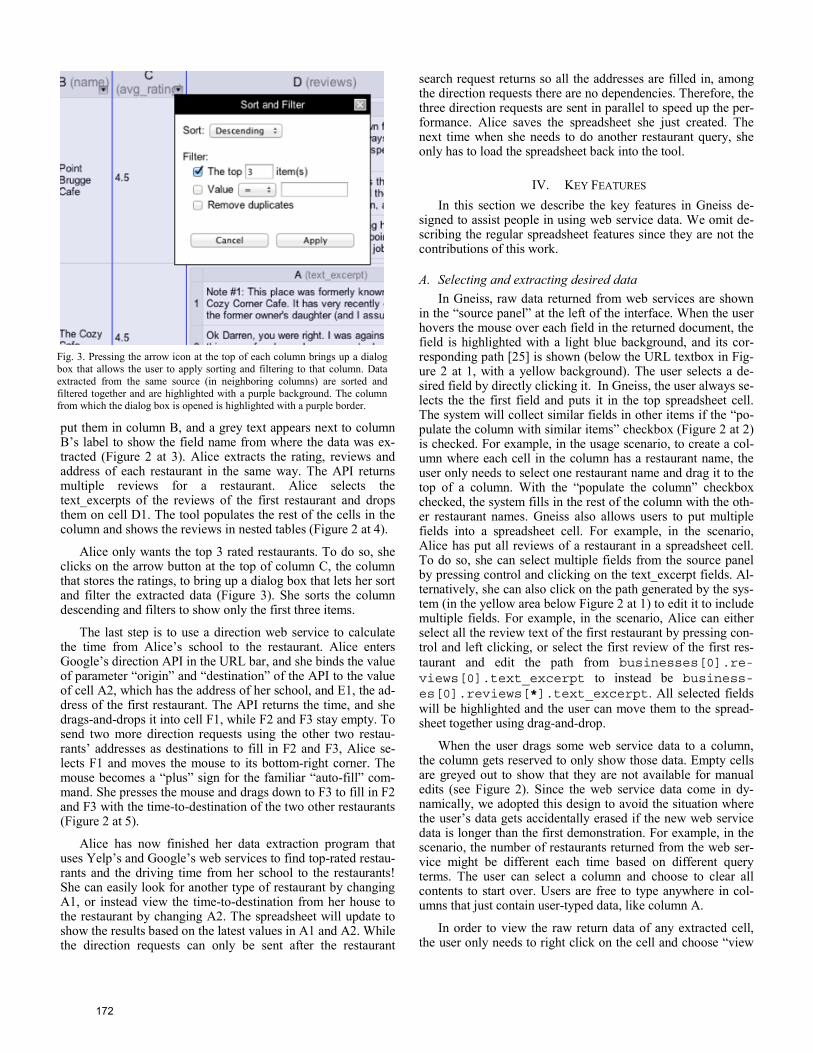
To assist the user in further manipulating the data in the nested tables, our tool provides a “flatten” formula that flattens a nested table column and stores all values in a column. To use the flatten formula the user can enter =flatten(column-Name) in the top cell of a column, and then our tool will au-tomatically fill the cells below with the appropriate data. The syntax for columnName is similar to referring to a cell in a nested table, which is column.childColumn. Using Figure 1 for example, suppose the user wants to create a new column that stores all actors in all Star Wars movies returned from the web service. She picks an empty column C, and enters =flatten(B.A.A) into cell C1 (B.A.A is the column that stores the actor names in each abridged cast of each movie). The flatten function populates column C with a flattened list of actor names. The user can then apply filtering to the column to remove duplicate names and get a clean list (see Figure 4). The flatten formula currently flattens only the first level items of the given column. It does not flatten children structures if the given column contains any. For example, in Figure 1 if the user enters =flatten(B.A)into cell C1, the system will fill in each cell in column C a nested table with three columns (name, id and character). In the future, we could add a “deep flatten” formula that flattens the structure all the way down.
D. “Auto-filling” cells with web service data “Auto-fill” (also called “fill down”) is a common feature in
spreadsheet tools where the user selects one or multiple cells and drags them to fill in additional cells. In Gneiss, when the user selects and drags a cell whose value comes from a web API that uses values of other cells in the same row, as the user drags it down, the system will replace these cells in the web API with the corresponding cells in the new row. For example, in the scenario, cell F1’s value comes from the direction API that uses the value of cell A2 and E1 as the value of the origin and destination parameter (Figure 2 at 5). When the user se-lects F1, the system recognizes that E1 is in the same row as F1. When the user drags down to rows 2 and 3, the system rep-laces E1’s value in the web API with E2’s and E3’s values, sending the required API requests, and extracting data using the same path to fill in F2 and F3. By default, our tool does not replace A2’s value in the web API with A3 and A4 because A2 is not in the same row as the selected cell E1. If the user wants A2’s value to also be replaced by the rest of the cells in column A, she can manually compose a second cell using another di-rection API call that uses the value of A3 and E2, and extracts
Fig. 4. The “flatten” formula populates a column with all cells in a nestedcolumn. In this example, the user creates a flattened list of lead actors in allStar Wars movies, using the first column in the abridged cast column inFigure 1.
173

the data to F2. Then, if she selects both F1 and F2 and drags, the system will recognize the pattern in the selected cells and apply it to fill in the new cells. This is the same way that Excel and other spreadsheets work now – if the auto-fill pattern is not apparent from a single cell, users can provide two cells to demonstrate the pattern.
E. Displaying images in cells and refreshing data Some web services let the user retrieve images. There are
two major ways for web services to return an image. One way is returning a text document that contains a URL to the image or some IDs that can be used to compose a URL to the image. The other way is directly returning the image itself. In other words, the web API URL is the “source” of the image. Our tool allows the user to view an actual image in a spreadsheet cell, by right clicking on the cell that contains a URL to an image and choosing “view as an image”. The system will then create an image object in the cell whose source is the URL. Note that this feature only changes how the cell is displayed. It does not change its actual value, which is still the URL. The user can double click on an image cell to edit the URL if she wants. If the URL needs to be constructed from the returned web service values, conventional spreadsheet formulas like “concatenate” could be used.
Our tool also provides a feature to let the user periodically refresh all data in the spreadsheet. The user can do so by going to the “Edit” menu in the menu bar (Figure 2 at the top), select-ing “Edit spreadsheet refresh timer”, and entering the time pe-riod in a dialog box. This would be useful if the data that was extracted from web services are time-sensitive, such as current stock prices or the weather.
F. Two-way data flow and parallel-running programs As described in the usage scenario, the user can easily re-
place any part of the web API URL in the source panel with the value of a cell in the spreadsheet, using the syntax {{cell-Name}}. This allows data in the spreadsheet to be sent to a web service. As we showed in the scenario, this data can either be constant (like A1) or computed based on other cells (like E1). As described earlier, data from a web service can be ex-tracted and stored in the spreadsheet through drag-and-drop. Together, these two features enable the data to flow two-ways between our tool and the web service. If a spreadsheet cell like B1 stores data coming from a web API that uses another spreadsheet cell A1’s value, every time that A1’s value changes, an API call will be made to update B1’s value as well. This makes the data extraction program created in Gneiss easi-ly reusable, as the user can make a new request to a web ser-vice and view the extracted data by simply editing spreadsheet cells, as demonstrated in the scenario.
While the user’s demonstration and manipulation of cells is always performed sequentially, the spreadsheet metaphor al-lows our tool to construct a parallel-running program using the dependencies among the spreadsheet cells. Cells that do not have any dependencies on each other can be computed inde-pendently in parallel. This could make a big improvement on performance, especially when extracting a large amount of da-ta. For example, if the user wants to collect data using 50 on-
line shopping web services to compare prices, she can easily create a spreadsheet program that sends 50 web API requests in parallel, and get the data within seconds. This is in contrast to web scraping programs like Vegemite [21], that not only can only execute sequentially in the same order as when the user demonstrated them, but must insert fairly long delays into the program (for example, 10 seconds in the example in [21]) in hopes that this will be long enough to make sure the web pages have finished loading. Since our tool uses web services, we know when the call has completed, and no extra delays are re-quired.
G. Error Handling and maintenance A web service call could sometimes fail due to various rea-
sons such as scheduled maintenance, change of protocols, a bad Internet connection, or even a bug in the user’s specifica-tion of the URL. Gneiss is robust in handling this, as it will fill the error cells with a special “error” value and propagate this value to all dependent cells when it receives a HTTP error when accessing the web service. The user can easily see the er-rors in the spreadsheet and trace back to the origin using con-ventional spreadsheet mechanisms. Our system’s ability to ex-ecute programs in parallel also allows other parts of the pro-gram that do not depend on the error cells to run as usual. For example, if the user creates a spreadsheet that searches a prod-uct on 10 different web services and the request to one of them fails, the user will see an error from that web service but still will get data from the other 9. Debugging is also easier in our tool because the user can see all the values in the spreadsheet and see them changing at run time, unlike in other program-ming languages, such as Yahoo Pipes, where data are typically hidden unless the user looks for them.
As described in the scenario, the user can save the spread-sheet program and load it back to the tool next time when she needs to perform similar queries. Reusing a spreadsheet pro-gram is easy as the user can edit a spreadsheet into another one and reuse appropriate parts. For example, in our scenario, if Yelp stops supporting its web service after the spreadsheet program is created, the user could use another web service to search for restaurants (such as Google Places) and replace the restaurant columns in the same spreadsheet with appropriate fields from the new data source, without having to modify the location part.
H. Limitations Gneiss has a number of limitations. First, it currently sup-
ports only RESTful web services that return JSON data or im-ages. It does not support web services using other protocols, such as SOAP, or returning other kinds of data formats, such as XML and CSV. However, we believe that all the key features of our tool, such as extracting data by drag-and-drop, representing data structures with nested tables, dynamic sorting and filtering, and inferring a parallel-running program based on cell dependencies, should still be able to be applied to these kinds of web services with minor changes in the source panel to accommodate the differences. Similarly, it could be ex-tended to support data extracted by scraping web pages without changing the other parts. Second, our tool currently does not support sorting and filtering columns that contain nested tables.
174

One possible solution is to enable sorting and filtering nested tables on the “leaf nodes”. Using Figure 1 for example, it does not make sense to sort the movies by the abridged cast, but it might be reasonable to sort the items in each abridged cast by the actor name. We plan to add this feature in the future. Third, many search APIs limit the number of return values in a single return document, usually controlled by a parameter in the API. To access additional results, the user needs to ask for the “next page” of this query, usually controlled by another parameter. Our tool currently does not have a way to automatically ask for the next set of results, so the user would need to change the pa-rameters manually. Finally, in Gneiss we did not focus on help-ing users understand how to use a web API. This potentially limits our target users to people who already have some basic knowledge about web APIs, such as being able to understand the JSON format and the API documentation in order to know what the parameters are. Our prior work, Spinel [26], has pro-vided an architecture that enables new web services to be add-ed to an application as plugins. Spinel includes an end-user tool that lets people create a plugin following the instructions of the application developer without writing any code. In the future, we leverage this idea to provide a few popular web APIs as built-ins that can be configured using graphical widgets (such as in [13]) and use Spinel to allow end-users create plugins that would display such widgets for a new web API to be used in Gneiss.
I. Implementation The entire Gneiss system is implemented as a web applica-
tion in HTML, CSS and JavaScript. We use ConstraintJS [2] to maintain the spreadsheet dependencies. Each cell’s value is bonded to a constraint object, which can return either a con-stant or a value computed using some other constraints. When the value of a constraint changes, ConstraintJS invalidates all other constraints that use it and forces them to recalculate. The constraint object of a cell that comes from web service data is a function getWebData(apiUrl, path), which returns da-ta extracted from apiUrl using path. If apiUrl contains constraints based on other cells, ConstraintJS makes sure that the function gets run each time that any of these constraints changes its value. Recently loaded web service data are cached to improve performance.
V. DEMONSTRATIVE EXAMPLES We further use a series of examples to demonstrate our
tool’s ability to create spreadsheet programs that use web ser-vices in a variety of ways.
A. City trip planner with a map A common activity when a person plans to visit a new city
is to search for all attractions in the city, pick the ones he is in-terested in, and plot them on a map. We will create a mashup that does this using a search interface that has a check box next to each return item for the user to select what he wants, and a map showing only the checked items. While many prior end-user mashup tools let people search for locations and plot them on a map using some built-in web services, none of the tools to our knowledge allows people to create such a flexible applica-tion that handles user selections and only shows the selected
items on the map, without requiring the user to change the pro-gram every time when making a new query. We will show that a user, with some knowledge of regular spreadsheet formulas, can create such a data extraction program using Gneiss.
The user starts by using Google’s Place Search API to get a list of attractions. She changes the value of the query parameter in the API to {{A1}} to bind it to cell A1. From the return da-ta, she drags the name, rating, latitude and longitude field to columns B to E. She decides to make column F the “input col-umn” – if she likes a place and wants to plot it on the map, she enters a shorthand label for the place in that place’s row in col-umn F. Otherwise she leaves the cell blank.
The user then uses Google’s Static Map API, which, given a list of geo-coordinates, will return an image of a map with markers marking the locations. The user also wants to send a list of labels to be used on the markers. To add a marker given a pair of geo-coordinates and a label, the user needs to append
&markers=label:labelValue|latitude,longitude
at the end of the API. To do so, the user uses the following regular spreadsheet formula in cell G1: =IF(ISBLANK(F1), “”, CONCATENATE(“&markers=label:”,
F1, “|”, D1, “,”, E1))
where D1 and E1 stores the latitude and longitude of the first item. What this formula does is to first see if F1 is blank. If it is, return nothing. Otherwise, return the concatenated string. She selects G1 and drags to auto-fill other cells in column G.
Now the user gets all the “markers” strings she needs to com-pose the whole web API. She uses the CONCATENATE function again in H1 to combine the constant part of the URL with eve-rything in column G. Now, H1 holds a complete web API URL that returns an image of a map with the makers specified. The final step is to select H1, right click and choose to “view as an image”. The web API URL becomes an actual map image that has markers showing locations of the places that the user se-lects.
The created spreadsheet program is highly reusable. The user can search for another type of place by editing cell A1, or add or remove a place from the map by entering or deleting contents in its corresponding cell in column F. None of these requires the user to change any programming logic in the spreadsheet. The user could easily share this city trip planner spreadsheet with her friends, with a little explanations about what the columns are and how to use them.
B. Real-time weather report Gneiss’ ability to refresh the spreadsheet data periodically
allows the user to create dynamic spreadsheet contents that change in real-time. For example, the user can create a spread-sheet that extracts data from a weather web service, such as Open Weather Map. The user can use the regular spreadsheet formula NOW() to get the current time and send it to the web service to get the current weather. After that, the user can set the spreadsheet to refresh its data every 30 minutes, to keep its contents up to date.
175

C. Co-author finder Using a research paper API such as Mendeley, Gneiss is
able to let the user create a data extraction program that searches all papers written by a person in the last 5 years and generate a list of co-authors of that person (a similar use case was described in a prior mashup paper [27]). To do so, the user first sends the API request and binds the value of the query pa-rameter to a spreadsheet cell where she enters a person name. The user then drags the title, year, publication venue and au-thors of all papers to the spreadsheet, and filters the data to on-ly show papers published after 2009. For each paper, the “au-thors” field is an array that contains a list of authors. The user uses the flatten formula to flatten all the “authors” arrays and put the values in an empty column. Finally, the user filters the flattened author columns to remove duplicate names and get a clean list. If the user wants, she can further use the co-author list to find more related papers by sending another web API request using the co-authors’ names.
VI. CONCLUSION AND FUTURE WORK We have presented a novel spreadsheet model for using
web service data. It allows the user to extract web service data through demonstration by drag-and-drop, and supports run-time sorting and filtering of the data to help the user refine the results. The user can store structured data as nested tables in the spreadsheet and manipulate the data using formulas. The spreadsheet metaphor allows the user to easily bind cells to pa-rameters in a web API to enable two-way data flow. Based on the dependency between spreadsheet cells created by the user, our tool can generate parallel-running code to speed up perfor-mance. We demonstrated our tool’s ability using a serious of examples throughout the paper. For future work, besides the various extensions already mentioned in the paper, we would like to support handling streaming data in the spreadsheets, such as streaming web APIs or sensor data from mobile devic-es. This will include designing new spreadsheet features that assist the user in working with continuous, time-series data. Also, we would like to further extend the spreadsheet metaphor to let the user create interactive web interfaces that present and visualize the resulting spreadsheet data.
ACKNOWLEDGEMENTS This research was funded in part by the NSF under grants
IIS-1116724 and IIS-1314356. Any opinions, findings and conclusions or recommendations expressed in this material are those of the authors and do not necessarily reflect those of the NSF.
REFERENCES [1] R. T. Fielding and R. N. Taylor, “Principled Design of the Modern Web
Architecture,” ACM Trans. Internet Technol., vol. 2, no. 2, pp. 115–150, May 2002.
[2] S. Oney, B. Myers, and J. Brandt, “ConstraintJS: Programming Interactive Behaviors for the Web by Integrating Constraints and States,” in Proceedings of the 25th Annual ACM Symposium on User Interface Software and Technology, 2012, pp. 229–238.
[3] N. Zang, M. B. Rosson, and V. Nasser, “Mashups: who? what? why?,” in CHI ’08 Extended Abstracts on Human Factors in Computing Systems, 2008, pp. 3171–3176.
[4] “Yahoo Pipes.” [Online]. Available: http://pipes.yahoo.com/. [5] “Microsoft PopFly.” [Online]. Available: http://popfly.ms/. [6] J. Cao, K. Rector, T. H. Park, S. D. Fleming, M. Burnett, and S.
Wiedenbeck, “A Debugging Perspective on End-User Mashup Programming,” in Visual Languages and Human-Centric Computing (VL/HCC), 2010 IEEE Symposium on, 2010, pp. 149–156.
[7] S. K. Kuttal, “Variation support for end users,” in Visual Languages and Human-Centric Computing (VL/HCC), 2013 IEEE Symposium on, 2013, pp. 183–184.
[8] M. Burnett, J. Atwood, R. Walpole Djang, J. Reichwein, H. Gottfried, and S. Yang, “Forms/3: A First-order Visual Language to Explore the Boundaries of the Spreadsheet Paradigm,” J. Funct. Program., vol. 11, no. 2, pp. 155–206, Mar. 2001.
[9] “Microsoft Excel.” [Online]. Available: http://office.microsoft.com/en-us/excel/.
[10] “Google Spreadsheet.” [Online]. Available: https://drive.google.com/. [11] “OpenRefine.” [Online]. Available: http://openrefine.org/. [12] B. Hartmann, L. Wu, K. Collins, and S. R. Klemmer, “Programming by
a sample: rapidly creating web applications with d.mix,” in Proceedings of the 20th annual ACM symposium on User interface software and technology, 2007, pp. 241–250.
[13] J. Wong and J. I. Hong, “Making mashups with marmite: towards end-user programming for the web,” in Proceedings of the SIGCHI Conference on Human Factors in Computing Systems, 2007, pp. 1435–1444.
[14] M. Van Kleek, D. A. Smith, H. S. Packer, J. Skinner, and N. R. Shadbolt, “Carpe; Data: Supporting Serendipitous Data Integration in Personal Information Management,” in Proceedings of the SIGCHI Conference on Human Factors in Computing Systems, 2013, pp. 2339–2348.
[15] “XPath.” [Online]. Available: http://www.w3.org/TR/xpath/. [16] D. F. Huynh, R. C. Miller, and D. R. Karger, “Enabling Web Browsers
to Augment Web Sites’ Filtering and Sorting Functionalities,” in Proceedings of the 19th Annual ACM Symposium on User Interface Software and Technology, 2006, pp. 125–134.
[17] B. Chan, L. Wu, J. Talbot, M. Cammarano, and P. Hanrahan, “Vispedia: Interactive Visual Exploration of Wikipedia Data via Search-Based Integration,” IEEE Trans. Vis. Comput. Graph., vol. 14, no. 6, pp. 1213–1220, Nov. 2008.
[18] D. Heaton, “Scraper,” 2010. [Online]. Available: http://mnmldave.github.io/scraper/.
[19] “ScraperWiki,” 2014. [Online]. Available: https://scraperwiki.com/. [20] R. Tuchinda, P. Szekely, and C. A. Knoblock, “Building Mashups by
example,” in Proceedings of the 13th international conference on Intelligent user interfaces, 2008, pp. 139–148.
[21] J. Lin, J. Wong, J. Nichols, A. Cypher, and T. A. Lau, “End-user programming of mashups with vegemite,” in Proceedings of the 14th international conference on Intelligent user interfaces, 2009, pp. 97–106.
[22] W. Kongdenfha, B. Benatallah, J. Vayssière, R. Saint-Paul, and F. Casati, “Rapid Development of Spreadsheet-based Web Mashups,” in Proceedings of the 18th International Conference on World Wide Web, 2009, pp. 851–860.
[23] P. Baglietto, F. Cosso, M. Fornasa, S. Mangiante, M. Maresca, A. Parodi, and M. Stecca, “Always-on Distributed Spreadsheet Mashups,” in Proceedings of the 3rd and 4th International Workshop on Web APIs and Services Mashups, 2010, pp. 8:1–8:8.
[24] S. P. Jones, A. Blackwell, and M. Burnett, “A User-centred Approach to Functions in Excel,” in Proceedings of the Eighth ACM SIGPLAN International Conference on Functional Programming, 2003, pp. 165–176.
[25] “JSONPath - XPath for JSON.” [Online]. Available: goessner.net/articles/JsonPath/.
[26] K. S.-P. Chang, B. A. Myers, G. Cahill, S. Simanta, E. Morris, and G. Lewis, “A Plug-in Architecture for Connecting to New Data Sources on Mobile Devices,” in IEEE Symposium on Visual Languages and Human-Centric Computing, 2013, pp. 51–58.
[27] S. Gardiner, A. Tomasic, J. Zimmerman, R. Aziz, and K. Rivard, “Mixer: Mixed-initiative Data Retrieval and Integration by Example,” in Proceedings of the 13th IFIP TC 13 International Conference on Human-computer Interaction - Volume Part I, 2011, pp. 426–443.
176