a star and gas surface density correlation within nearby molecular
TRANSCRIPT

A Star and Gas Surface Density Correlation within Nearby Molecular Clouds
Rob Gutermuth
Five College Astronomy Dept. Fellow in Research & Teaching
Smith College & UMass Amherst
MonR2 Giant Molecular Cloud
3.6 micron4.5 micron8.0 micron

4.5 micron8.0 micron24 micron
W40 Serpens South
Judy Pipher, University of RochesterTom Megeath, University of ToledoPhil Myers, Harvard-Smithsonian Center for AstrophysicsLori Allen, National Optical Astronomy ObservatoryGiovanni Fazio, Harvard-Smithsonian Center for Astrophysics
Tom Allen, University of ToledoErin Allgaier, University of ToledoNate Bastian, University of ExeterEli Bressert, University of ExeterCharlie Yergatian, UMass
IRAC Instrument Team (Galactic Science)Gould Belt Legacy Survey (PI: L. Allen)Cores 2 Disks (c2d) Legacy Survey (PI: N. Evans)
& Gould BeltLegacy Survey

A Few Terms Explained...
YSO – Young Stellar Object, inferred from excess IR emission relative to a single temperature blackbody.
Class II YSO – Pre-main sequence star with a protoplanetary disk.Typical disk lifetime is ~2 Myr (e.g. Hernandez et al. 2007)
Class I YSO – Protostar with a thick disk and ~spherical cold envelope; high and variable mass accretion rate; precursor to Class II.
Typical protostar phase lasts ~0.5 Myr (e.g. Evans et al. 2009)
N(CII) / N(CI) – A qualitative age indicator for a YSO population. Larger N(CII) / N(CI) implies older YSOs, on average.
Cep OB3 Giant Molecular Cloud
3.6 micron4.5 micron8.0 micron

Most Local Star Formation is Clustered, But Not Dense
Megeath et al. in prep.
Lada & Lada 2003
Gutermuth et al. 2009
Bressert et al. in prep.
Nearly all star formation within 500 pc! Over 7000 YSOs!
Incomplete

Red: > 100 pc-2 Blue: 10 - 100 pc-2 Green: 1 - 10 pc-2
Surface Density Maps of Infrared-Excess Sources
Nearby clusters are not spherical, but often elongated and clumpy.
Allen et al.2007

Stars Form in Molecular Clouds?! You Don't Say!
0.5 pc3.6 micron5.8 micron24 micron
Av=5,7,9,...
Cep C cluster; Gutermuth et al. 2009
Near-IR Extinction

Av=5,7,9,... (6Σ th nearest neighbor)
The obvious statement isn't strong enough... In 1-2 Myr old clusters,star and gas surface densities are correlated locally on scales >0.3 pc!
Stars Form in Molecular Clouds?! You Don't Say!
Class IClass II
N(CII)/N(CI) = 92/22 = 4.2Age ~ 2 Myr
Cep C cluster; Gutermuth et al. 2009

Mon R2
grayscale = near-IR extinctionIR-excess YSOs = red dots20+ member groups10-19 member groups
5 pcN(CII)/N(CI) = 788/185 = 4.3Age ~ 2 Myr

10 100
2000
200
20
2
0.2
Σ(Y
SO
s) (
Msu
n / p
c2 )
Σ(gas) (Msun / pc2)
A Correlation Between Star and Gas Surface Density in MonR2!
YSO surface densities:- 11th nearest neighbor- Each YSO ~ 0.5 Msun
Gas surface densities:- Near-IR reddening maps
1 Av ~ 15 Msun / pc2
Uniform baseline removed
Class I YSOs in redClass II YSOs in gray
Diagonal shading:- Lower Av limit on left- Lower YSO surface density
limit on bottom (AGN)
Power law fit in greenAlpha = 2.5

10 100
2000
200
20
2
0.2
Σ(Y
SO
s) (
Msu
n / p
c2 )
Σ(gas) (Msun / pc2)
A Correlation Between Star and Gas Surface Density in Ophiuchus!
YSO surface densities:- 11th nearest neighbor- Each YSO ~ 0.5 Msun
Gas surface densities:- Near-IR reddening maps
1 Av ~ 15 Msun / pc2
Uniform baseline removed
Class I YSOs in redClass II YSOs in gray
Diagonal shading:- Lower Av limit on left- Lower YSO surface density
limit on bottom (AGN)
Power law fit in blueAlpha = 1.8
Ophiuchus

10 100
2000
200
20
2
0.2Σ(Y
SO
s) (
Msu
n / p
c2 )
Σ(gas) (Msun / pc2)
Oph, Perseus, Serpens; YSOs and Av maps: c2d delivery productsNorth America Nebula; YSOs: Guieu et al. 2009; Av map: GutermuthSmall/Low density clouds consistent! (Chameleon, Lupus, Taurus)
A Correlation Between Star and Gas Surface Density in Eight Clouds!
Class I YSOs in redClass II YSOs in gray

10 100
2000
200
20
2
0.2
Σ(Y
SO
s) (
Msu
n / p
c2 )
Σ(gas) (Msun / pc2)
Deviations from the Correlation: Local Evolutionary Differences?
Class II YSOs in grayClass I YSOs in red
N(CII) / N(CI) is consistentlyLOW for Gas Poor
N(CII) / N(CI) is consistentlyHIGH for YSO Poor
YSO poor(Gas rich?)
Gas poor(YSO rich?)

Gas Poor (YSO Rich?): Cep OB3b Cluster
T. Allen et al., in review; see also Getman et al. 2009 on Cep B / Cep OB3b east
Known OB starshave strong effect on gas!
3.6 micron5.8 micron24 micron

YSO Poor (Gas Rich?): Serpens South Filaments
3.6 micron4.5 micron8.0 micron
8.0 micron
Gutermuth et al. 2008
Gould Belt Legacy Survey – PI Lori Allen Class IClass II
Lots of dense gas, but few YSOs!
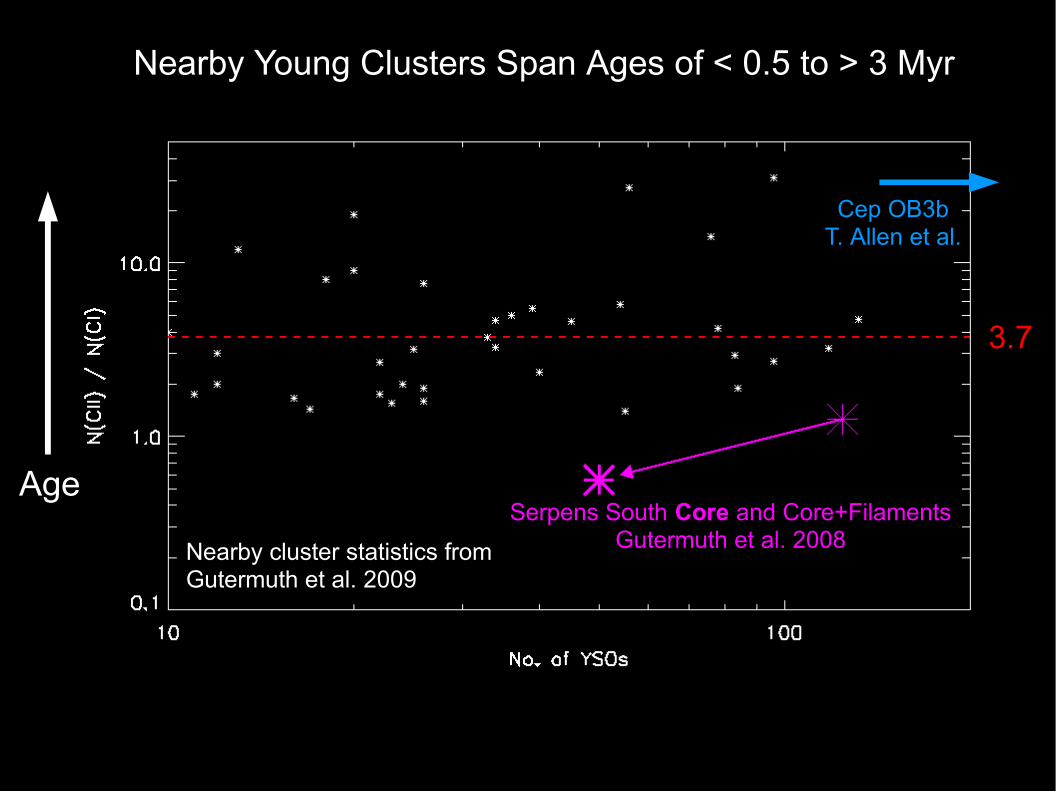
Nearby cluster statistics fromGutermuth et al. 2009
Serpens South Core and Core+FilamentsGutermuth et al. 2008
3.7
Cep OB3bT. Allen et al.
Nearby Young Clusters Span Ages of < 0.5 to > 3 Myr
Age

-5 -4 -3 -2 -1Log {Σ(YSOs) / Σ2(gas)}
Class II histograms in blackClass I histograms in redExpected Class II to Class I contamination in green
Σ(YSOs) / Σ2(gas) by Class, by Cloud

MonR2Cep OB3
Star-Gas Evolution Maps
High Σ(YSOs) / Σ2(gas)Low Σ(YSOs) / Σ2(gas)log{Σ(YSOs) / Σ2(gas)} ~ -3.3
MonR2 is largely colorless! Cep OB3 is “motley”, but embedded clusters
are colorless!
Cep ACep C
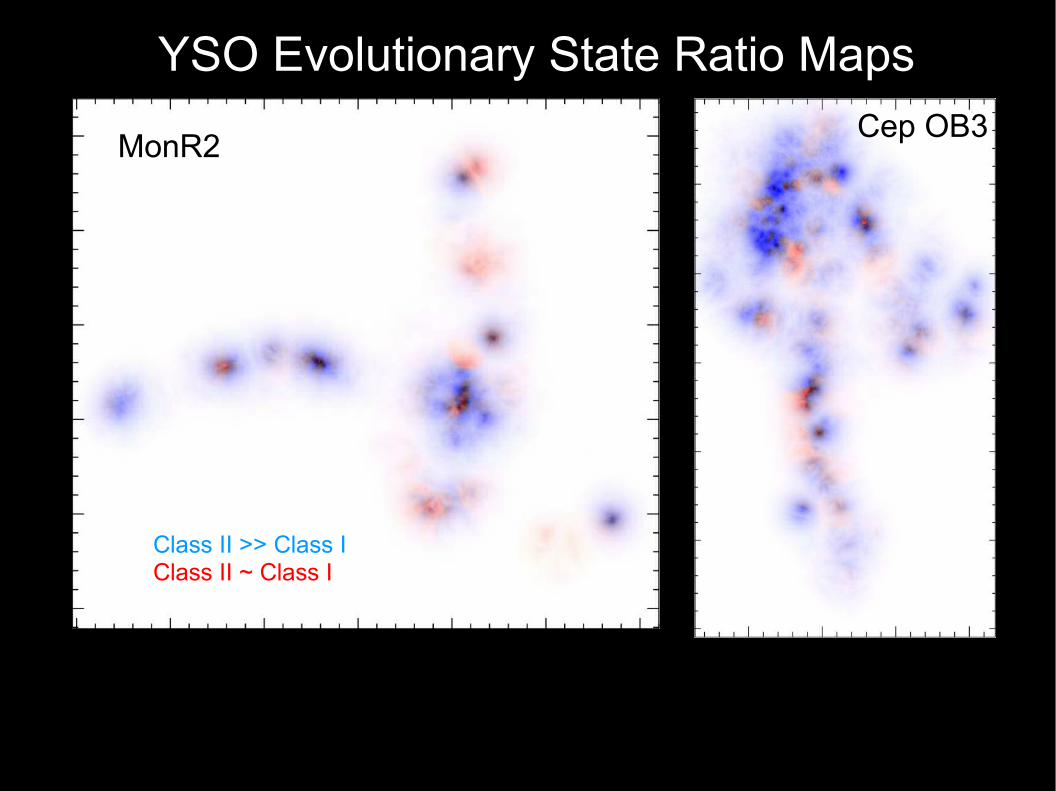
MonR2Cep OB3
YSO Evolutionary State Ratio Maps
Class II >> Class IClass II ~ Class I
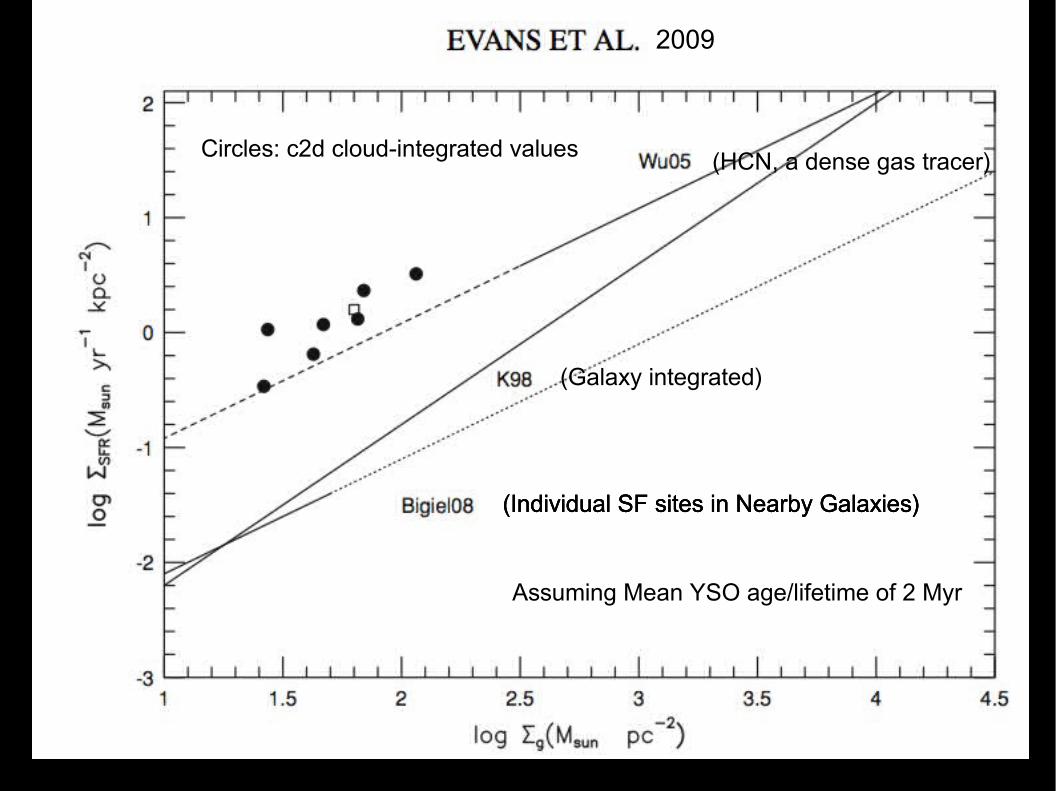
2009
Assuming Mean YSO age/lifetime of 2 Myr
Circles: c2d cloud-integrated values (HCN, a dense gas tracer)
(Individual SF sites in Nearby Galaxies)(Individual SF sites in Nearby Galaxies)(Individual SF sites in Nearby Galaxies)
(Galaxy integrated)

2009
Assuming Mean YSO age/lifetime of 2 Myr
This workα ~ 2
0.3-2 pc scales
Modulated Sheet Jeans Fragmentation: Myers 2009
(HCN, a dense gas tracer)
(Individual SF sites in Nearby Galaxies)(Individual SF sites in Nearby Galaxies)(Individual SF sites in Nearby Galaxies)
(Galaxy integrated)

My apologies for the ad hoc presentation; this was inspiredby yesterday's excellent SF Law breakout session!
Σ(large scale) = Integral ( Σ(small scale) * dA ) / A
We can measure the area distribution function of Σ(small scale)!
You are entering the Speculation Zone!!

Area distributions of Surface Densities in MonR2
Cloud scale integration moves SF law index from ~2 to ~1.3.

2009
Assuming Mean YSO age/lifetime of 2 Myr
This workα ~ 2
0.3-2 pc scales
Modulated Sheet Jeans Fragmentation: Myers 2009
(HCN, a dense gas tracer)
(Individual SF sites in Nearby Galaxies)(Individual SF sites in Nearby Galaxies)(Individual SF sites in Nearby Galaxies)
(Galaxy integrated)

Most stars form in clusters, but clusters are usually not dense (~60 stars / pc2).
Clear and consistent YSO and gassurface density correlation in >8 nearby clouds: ~ α 2
Preliminary “evolution analysis” suggests most clouds are heterogeneous (young, “old”, in-between).
Extremely preliminary examination of area distributions of small scale surface densities suggest cloud scaleSF law index as low as ~ 1.3α
MonR2 Giant Molecular Cloud
3.6 micron4.5 micron8.0 micron
Conclusions
Check out Amanda Heiderman's poster!