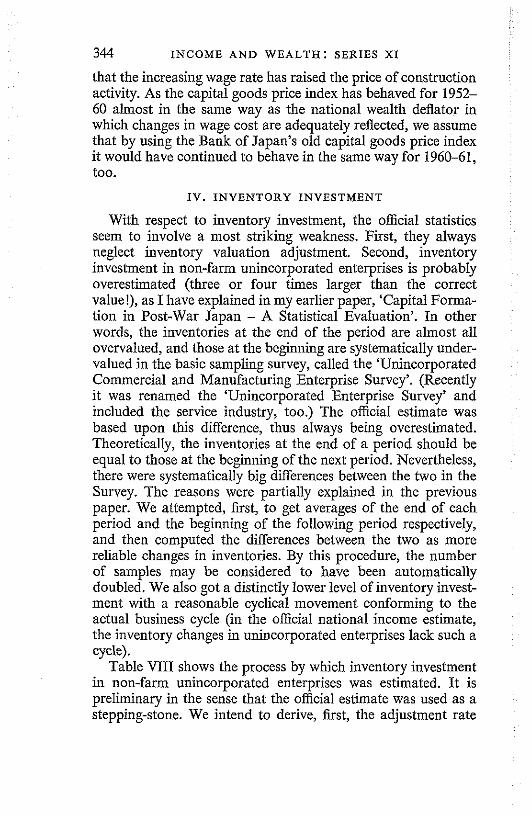
a statistical evaluation of the rate of … · a statistical evaluation of the rate of growth of...
TRANSCRIPT
A STATISTICAL EVALUATION OF THE RATE O F GROWTH O F NATIONAL INCOME I N .
POSTWAR JAPAN1
by Miyohei Shinohara
I. INTRODUCTION
AFTER the Second World War many countries showed growth rates which were much higher than those in the prewar period. These included, apart from the socialist countries, Japan, West Germany, Italy, France, Greece, Taiwan, etc. The mainspring of these high growth rates may be partly due to the rehabilitation effect; countries which experienced a deep trough in their pro- duction in the immediate postwar years would have naturally experienced a relatively rapid recovery. However, in the case of Japan, even after the prewar peak was surpassed in per capita real income, it has not experienced a period of retardation in the growth rate. Instead, what has ensued has been an upsurge iu the k e d investment of private enterprise, the extent of which Japan never before experienced. According to official national income statistics, private 6xed investment (excluding residential construction) increased from 777.4 billion yen to 4,050.4 billion yen for 1955-61, about a five-fold increase in only six years. Such an unprecedented increase in fixed investment brought about an annual real G.N.P. growth rate of about 10 per cent.
We have already dealt with the causes of the high rate of growth in Japan in other books and artic1es.a Although it is impossible to repeat it all here, we may list some of the important factors in the high rate of growth particularly in the postwar period as follows: (1) The rehabilitation effect mentioned already. (2) The extraordinary investment boom (particularly from 1955 on) in parallel with the rapid introduction of foreign technology. (3) The still abundant supply of labour in the dual economy, and the higher rate of growth of the labour force as well
'I benefited from discussions with Simon Kuznets, Colin Clark, Satoru Yoshuie, and Phyllis Deane in amending my paper submitted to the Eighth Conference of the International Association for Income and Wealth, 1963.
M. Shinohara, Growtlr artd Cycles in flze Japanese Economy, Kinokuniya, Tokyo, 1962, and Factors bz Japarz's Econon~ic Growth, Ministry of Foreign Affairs of Japan, 1962, written by the author and reviewed by the members of the Institute of Statistical Research, Tokyo.
332
MIYOHEI S H I N O H A R A 333
as the much higher rate of its migration from the rural to the urban sector than in the prewar period. (4) The existence of the relatively undervalued exchange rate, which has promoted the export growth rate. (5) The highly reduced proportion of post- war military expenditures, which has shifted some resources to private investment. (6) The existence of a financial structure in which even the commercial banks have given a tremendous amount of long-term loans quite liberally, particularly to the big enterprises. The so-called 'over-loan' of the central bank, in combination with this financial structure, has given a strong impetus to optimistic investment behaviour by entrepreneurs. (7) The higher saving ratio (even of urban workers) as compared with other countries.
These, of course, do not exhaust all of the causes. However, in this article, we shall concentrate on a statistical re-examina- tion of the growth rate computed from official national income statistics, i.e. our problem is to ascertain to what extent the extraordinary rate of growth was due to statistical upward biases. These biases will be broken down further into those in the estimates of the national income components and those in their deflators.
This kind of test is extremely difticult to make, for in order to examine the growth rate, we must be familiar with the detailed processes by which the national income estimates are derived as well as with the merits and the defects of the basic statistical materials from which the national income is estimated. How- ever, even if such a re-examination were possible, it would require a very extensive study, so in this article we will restrict ourselves to a test of the expenditure side of the account only. In other words, we will re-examine, first, the estimates of private consumption expenditure, gross h e d capital formation, changes in inventories, the current purchases of goods and services by the Government, and exports and imports of goods and services. Second, we will pass on to a reconsideration of existing price deflators by which each of these components is reduced to real terms. We shall make no attempt here to probe the income side of the account.
Postwar national income statistics can be divided roughly into two time periods, 1946-50 and 1951-61, from the point of view of statistical reliability. National income estimates for the period before 1950 involve immense weaknesses, for the statistical
334 INCOME AND WEALTH: SERIES X I
discrepancies between the expenditure and income sides of the national income statistics are quite considerable,l and some price deflators particularly with respect to fixed investment did not sufficiently reflect the existence of black market prices in the earlier postwar period. On the other hand, in the period after 1951, national income estimates can be assumed to be much more reliable, for the statistical discrepancies were reduced to a minimum, and price deflators became more dependable due to the stabilization of domestic prices. Therefore, the period we shall attempt to examine will be restricted to the period 1951-61. For this period, we have already two inter-industry tables for 1951 and 1955. Censuses or other large-scale surveys became available in various fields. The basic statistical materials, there- fore, can be used with greater confidence.
The Economic Planning Agency is now going to reconstruct and re-estimate the national income of Japan. Therefore, my article purports to throw light merely on a direction in which the revision should be oriented, although my personal estimates included here are all preliminary and will need perforce an elaborate reconstruction in themselves.
11. PRIVATE CONSUMPTION EXPENDITURE
Before going into an examination of the national income growth rate, it is necessaxy for us to take up each component of the G.N.P. The first is private consumption expenditure. In this case as well as in other components there are two problems, i.e. the level and the growth rate. Even if the levels, say in 1951 and 1961, are underestimated by 10 per cent respectively, this would not affect the growth rate for 1951-61. However, we will be concerned here, above all, with the level of private consumption expenditure.
A glance at the estimates for consumption expenditure in the official national income statistics gives rise to the doubt that the proportion of clothing expenditures to total consumption is too low. The reason is as follows: In 1961 its ratio is 8.6 per cent, whereas it is 12.8 per cent for that year, according to the urban worker's family budget survey conducted by the Statistics Bureau of the Prime Minister's Office. Furthermore, it is listed
1 M. Shinohara, 'Capital Formation in Post-War Japan - a Statistical Evalua- tion', submitted to the First Asian Conference of Incomc and Wealth, held in Hongkong in 1960.
MIYOHEI SHINOHARA 335
as 11.3 per cent in the 1961 fiscal year, according to the Farm Household Economy Survey conducted by the Ministry of Agriculture and Forestry. In other words, the clothing expendi- ture ratio seems a bit underestimated in the national income statistics in the light of these sample surveys, even after some differences in the definition of consumption (e.g. inclusion or exclusion of imputed rent) are taken into consideration. Con- sequently, we must first consider why such a discrepancy arose.1
Table I shows that, in the 1955 inter-industry table, clothing expenditure amounts to 776.4 billion yen. The difference between the two is very wide. I have attempted to estimate some parts of the consumption expenditure by the commodity flow method and also by the retail sales method, and the results which are shown in Table I are very close to that of the input-output table. The commodity flow method starts from the census of manufactures, adjusting the freight and mark-up as well as imports and exports, thus giving the final value of consumption at the point of final purchase. The retail sales method, in this case, uses the wholesalers' sales in the census of distribution as a base, adjusting the margins and freights up to the stage of retail sale, and deducting costs which do not reach the final domestic consumers (e.g. foreign trade, producers' buying, etc.). Theoret- ically, theretail sales method should start from the retailers' sales, but in Japan the statistical coverage of theretail sector is not good even in the census, and the census of diskibution seems to cover only 70-80 per cent of that sector. This is why we have started from the wholesalers' stage.
TABLE I
Estinlates of clotlring expenditure it1 1955 Unit: biilion yen
(a) Input-output table 7764 (6) Commodity flow method (M. Shinohara) 7352 (c) Retail sales method (M. Shinohara) 7596 (d ) Official national income estimate 403 7
Note: The estimate (a), based on the input-output table, has been adjusted to purchaser's price, by making the necessary additions to the producer's price in the origlnal table.
'This point was taken up in the Report of the Consumption-Investment Sub-committee included in the 'Report of the Consultative Committee on the Revision of the National Economic Accounts', 1962. The author was a member of the draftingcommitteeof thesub-Committee.
336 INCOME AND WEALTH: SERIES XI
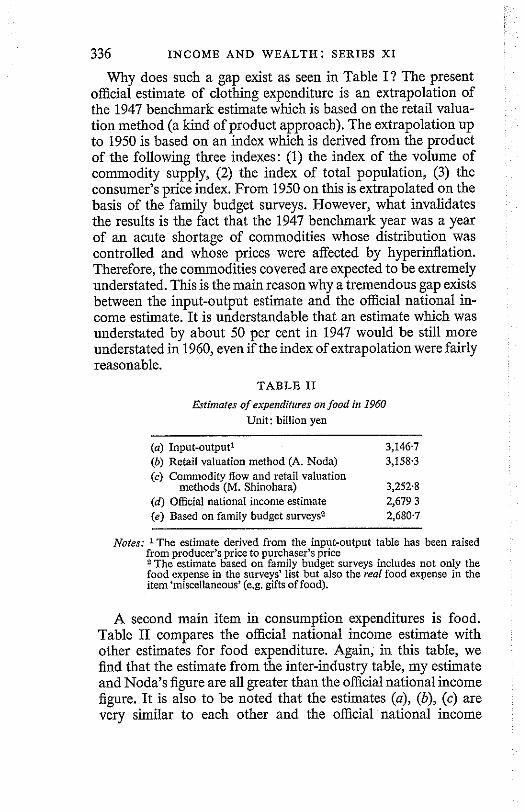
Why does such a gap exist as seen in Table I ? The present official estimate of clothing expenditure is an extrapolation of the 1947 benchmark estimate which is based on the retail valua- tion method (a kind of product approach). The extrapolation up to 1950 is based on an index which is derived from the product of the following three indexes: (1) the index of the volume of commodity supply, (2) the index of total population, (3) the consumer's price index. From 1950 on this is extrapolated on the basis of the family budget surveys. However, what invalidates the results is the fact that the 1947 benchmark year was a year of an acute shortage of commodities whose distribution was controlled and whose prices were affected by hyperinflation. Therefore, the commodities covered are expected to be extremely understated. This is the main reason why a tremendous gap exists between the input-output estimate and the official national in- come estimate. It is understandable that an estimate which was understated by about 50 per cent in 1947 would be still more understated in 1960, even if the index of extrapolation were fairly reasonable.
TABLE I1
Ertinzotes of expenditures on food in 1960 Unit: billion yen
(a) Input-output' 3,146.7 (b) Retad valuation method (A. Noda) 3,158.3 (c) Commodity Row and retail valuation
methods (M. Shinohara) 3,252 8 (d) Official national income estimate 2,679 3 (e) Based on family budget surveys2 2,680 7
Notes: 'The estimate derived from the inout-outout table has been raised from ~roducer's rice to purchaser's ljrice
A second main item in consumption expenditures is food. Table I1 compares the official national income estimate with other estimates for food expenditure. Again, in this table, we find that the estimate from the inter-industry table, my estimate and Noda's figure are all greater than the official national income figure. I t is also to be noted that the estimates (a), (b), (c) are very similar to each other and the official national income
MIYOHEI SHINOHARA 337
figure is almost equal, by chance, to an estimate based on the family budget surveys. On the one hand, the reason why (a), (b), (c) are similar is very clear, for the three employ almost the same statistical method and materials, and the similarity of the three can be a reasonable check on the correctness of the computation. On the other hand, the similarity of (d) and (e) is not a necessary coincidence, for the food expense estimate in the official national income is based on an extrapolation from the benchmark esti- mate of 1950 by the retail valuation method. However, first, the retail valuation estimate in 1950 was not at that time completely free of the postwar chaos in the distributive process. Second, the family budget survey method does not adequately include the food expenditures made outside the household, for this would be omitted from the housewife's book-keeping if it were spent by the head of the household. Since the level of the official estimate (d) is by chance equal to (e) as based on the family budget surveys, this comment is also applicable to the official national income estimate. Third, if computed from the food expense in the family budget survey for urban worker house- holds, the caloric intake per person per day would be around 1,600 calories, according to Mr. Seiki Nakayama's computation, while the National Nutrition Survey conducted by the Ministry of Public Welfare suggests that the national average of caloric intake is around 2,000 calories. This indicates a considerable underestimation in the food expenditure estimates based on the family budget surveys. Fourth, it is a widely prevailing custom for companies to spend large amounts of money in entertaining guests, and for employees to partake in such entertainment. If these company entertainment expenditures amount to a con- siderable figure, the estimate based on the family budget surveys as well as the official national income estimate (since it is virtu- ally the same amount) may be an underestimation. To some extent a company's entertainment expenses should be treated as an expenditure on intermediate products. But, if the national income is a barometer of economic welfare, such an expense cannot be neglected in the estimate of food expenditures.
There are many other problems in relation to other items, e.g. medical care, transportation and communication, rent, etc., but the items of food and clothing are most important. We have briefly explained the problems with respect to levels underlying the present national income estimate relating to these two items
I.W. XI-z
338 INCOME AND WEALTH: SERIES XI
of consumption expenditures. However, the 'level' problem is one thing and the 'growth rate' evaluation is another thing. As we have said already, if the levels of two years compared with each other are equally underestimated, it may not affect the rate of growth.
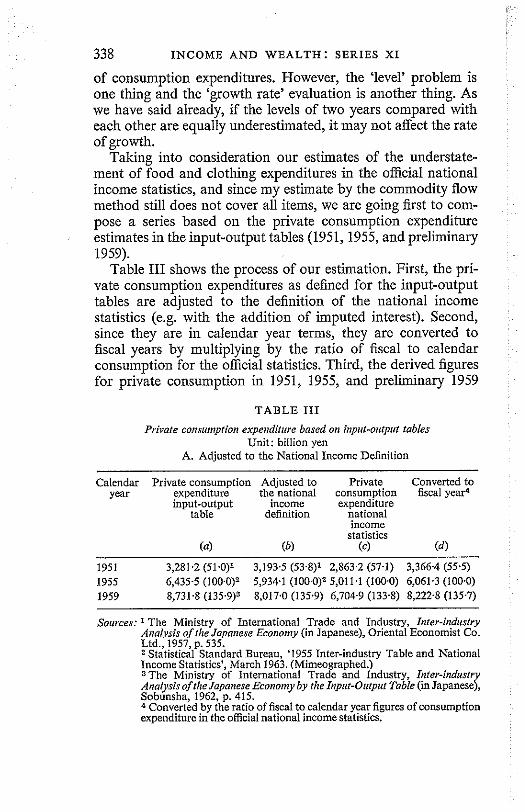
Taking into consideration our estimates of the understate- ment of food and clothing expenditures in the official national income statistics, and since my estimate by the commodity flow method still does not cover all items, we are going first to com- pose a series based on the private consumption expenditure estimates in the input-output tables (1951,1955, and preliminary 1959).
Table I11 shows the process of our estimation. First, the pri- vate consumption expenditures as defined for the input-output tables are adjusted to the definition of the national income statistics (e.g. with the addition of imputed interest). Second, since they are in calendar year terms, they are converted to fiscal years by multiplying by the ratio of fiscal to calendar consumption for the official statistics. Third, the derived figures for private consumption in 1951, 1955, and preliminary 1959
TABLE 111
Private cor~sutnption experrditrrre based on inpl~t-outprrf tables Unit: billion yen
A. Adjusted to the National Income Definition
Calendar Private consumption Adjusted to Private Converted to year expenditure the national consumption fiscal year4
input-output income expenditure table definition national
income statistics
(a) (b) (4 (4 1951 3,281.2 (51.0)' 3,193.5 (53.8)' 2,863.2 (57.1) 3,366.4 (55.5) 1955 6,4353 ( 1 0 0 ~ 0 ) ~ , 9 3 4 ~ 1 (100.0)" 5,011.1 (100.0) 6,061.3 (100~0) 1959 8,731.8 (135.9)3 8,017.0 (135.9) 6,704.9 (133.8) 8,222.8 (135.7)
Sources: 1 The Ministry of International Trade and Industry, Inter-industry Analysis ofthe Jopanese Ecor~onry (in Japanese), Oriental Economist Co. Ltd., 1957, p. 535. "tatistical Standard Bureau, '1955 Inter-industry Table and National Income Statistics', March 1963. (Mimeographed.) 3The Ministry of International Trade and Industry, Inter-industry Analysisof flze Japanese Econorny by the Input-Olitpul Table (in Japanese), Sobunsha, 1962, p. 415. 4 Converted by the ratio of fiscal to calendar year figures of consumption expenditure in the official national income statistics.
MIYOHEI SHINOHARA 339
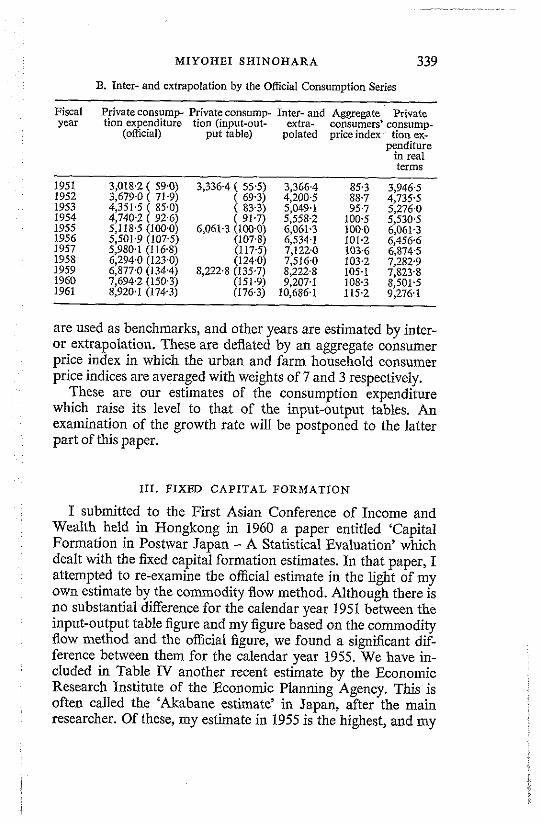
B. Inter- and extrapolation by the Official Consumption Series
Fiscal Private consump- Private consump- Inter- and Aggregate Private year lion expenditure tion (input-out- exlra- consumers' consump-
(official) put table) polated price index tion ex- penditure
in real terms
are used as benchmarks, and other years are estimated by inter- or extrapolation. These are deflated by an aggregate consumer price index in which the urban and farm household consumer price indices are averaged with weights of 7 and 3 respectively.
These are our estimates of the consumption expenditure which raise its level to that of the input-output tables. An examination of the growth rate will be postponed to the latter part of this paper.
111. FIXED CAPITAL FORMATION
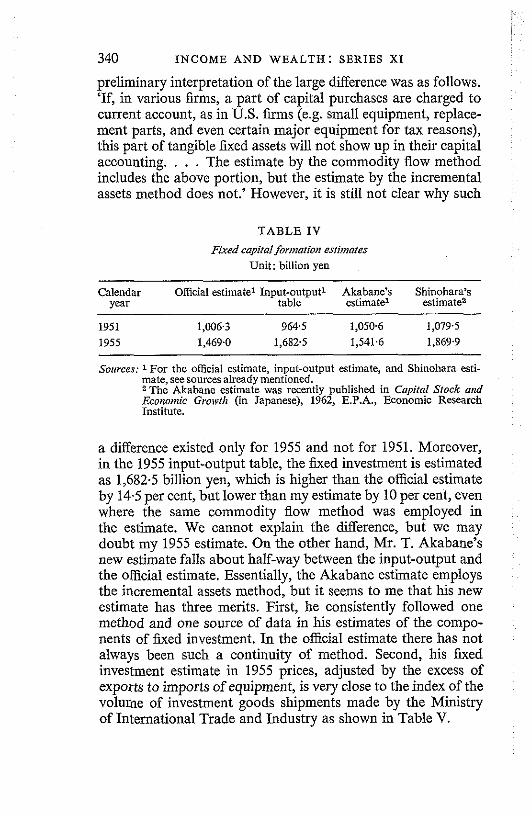
I submitted to the First Asian Conference of Income and Wealth held in Hongkong in 1960 a paper entitled 'Capital Formation in Postwar Japan - A Statistical Evaluation' which dealt with the fixed capital formation estimates. In that paper, I attempted to re-examine tbe official estimate in the light of my own estimate by the commodity flow method. Although there is no substantial difference for the calendar year 1951 between the input-output table figure and my figure based on the commodity flow method and the official figure, we found a significant dif- ference between them for the calendar year 1955. We have in- cluded in Table IV another recent estimate by the Economic Research Institute of the Economic Planning Agency. This is often called the 'Akabane estimate' in Japan, after the main researcher. Of these, my estimate in 1955 is the highest, and my
340 INCOhlE AND WEALTH : SERIES XI
preliminary interpretation of the large difference was as follows. 'If, in various firms, a part of capital purchases are charged to current account, as in U.S. k m s (e.g. small equipment, replace- ment parts, and even certain major equipment for tax reasons), this part of tangible fixed assets will not show up in their capital accounting. . . . The estimate by the commodity flow method includes the above portion, but the estimate by the incremental assets method does not.' However, it is still not clear why such
TABLE IV
Fixed capital for~nation estimates Unit: billion yen
Calendar Official estimate' Input-output1 Akabane's Shinohara's year table estimate1 estimate2
Sources: 1 For the official estimate, input-output estimate, and Shinohara esti- mate, see sources already mentioned. T h e Akabane estimate was recently published in Capital Stock and Economic Growflt (in Japanese), 1962, E.P.A., Economic Research Institute.
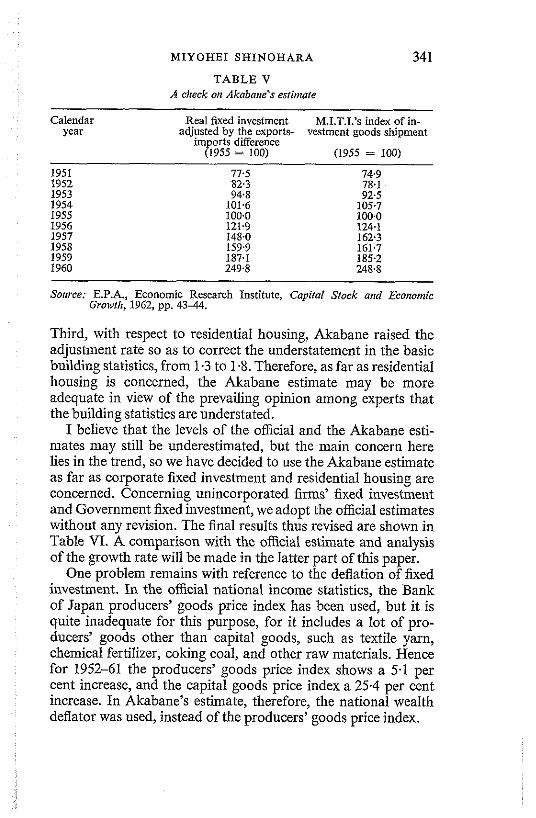
a difference existed only for 1955 and not for 1951. Moreover, in the 1955 input-output table, the bed investment is estimated as 1,682.5 billion yen, which is higher than the official estimate by 14.5 per cent, but lower than my estimate by 10 per cent, even where the same commodity flow method was employed in the estimate. We cannot explain the difference, but we may doubt my 1955 estimate. On the other hand, Mr. T. Akabane's new estimate falls about half-way between the input-output and the official estimate. Essentially, the Akabane estimate employs the incremental assets method, but it seems to me that his new estimate has three merits. First, he consistently followed one method and one source of data in his estimates of the compo- nents of ?&xed investment. In the official estimate there has not always been such a continuity of method. Second, his fixed investment estimate in 1955 prices, adjusted by the excess of exports to imports of equipment, is very close to the index of the volume of investment goods shipments made by the Ministry of International Trade and Industry as shown in Table V.
MIYOHEI SHINOHARA 341
TABLE V A clreck on Akabane's esfin~afe
Calendar Real fixed investment M.I.T.I.'s index of in- year adjusted by the exports- vestment goods shipment
imports difference (1955 = 100) (1955 = 100)
1951 77.5 74.9 1952 82.3 78.1 1953 94.8 92.5 1954 101.6 105.7 1955 100~0 100.0 1956 121.9 124.1 1957 148.0 162.3 1958 159.9 161.7 1959 187.1 185.2 1960 249.8 248.8
Sorirce: E.P.A., Economic Research Institute, Capital Sfock and Ecm~omic Groivtt~, 1962, pp. 4344.
Third, with respect to residential housing, Akabane raised the adjustment rate so as to correct the understatement in the basic building statistics, from 1.3 to 1.8. Therefore, as far as residential housing is concerned, the Akabane estimate may be more adequate in view of the prevailing opinion among experts that the building statistics are understated.
I believe that the levels of the official and the Akabane esti- mates may still be underestimated, but the main concern here lies in the trend, so we have decided to use the Akabane estimate as far as corporate fixed investment and residential housing are concerned. Concerning unincorporated firms' fixed investment and Government fixed investment, we adopt the official estimates without any revision. The final results thus revised are shown in Table VI. A comparison with the official estimate and analysis of the growth rate will be made in the latter part of this paper.
One problem remains with reference to the deflation of fixed investment. In the official national income statistics, the Bank of Japan producers' goods price index has been used, but it is quite inadequate for this purpose, for it includes a lot of pro- ducers' goods other than capital goods, such as textile yarn, chemical fertilizer, coking coal, and other raw materials. Hence for 1952-61 the producers' goods price index shows a 5.1 per cent increase, and the capital goods price index a 25.4 per cent increase. In Akabane's estimate, therefore, the national wealth deflator was used, instead of the producers' goods price index.
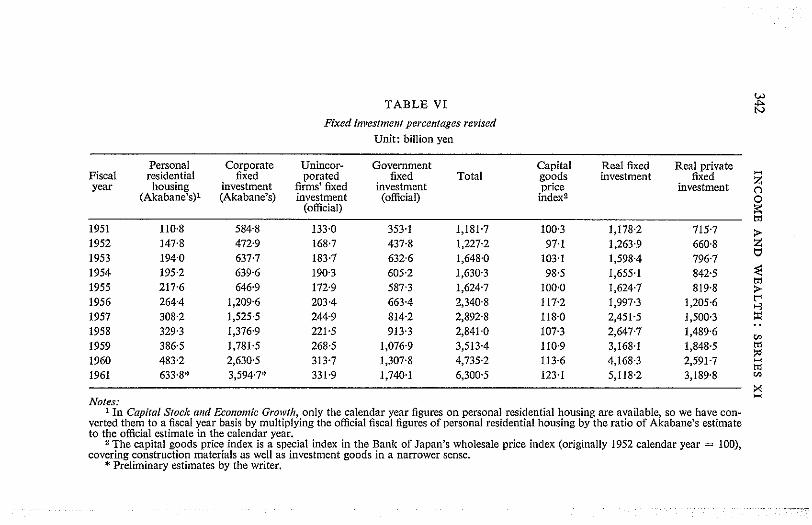
TABLE VI
Fixed invesrmenr percenroges revised Unit: billion yen
Personal Corporate Unincor- Government Capital Real fixed Real private Fiscal residential fixed porated fixed Total goods investment fixed year housing investment firms' fixed investment price z
investment 0 (Akabane's)' (Akabane's) investment (official) index2
(official) Z
7 ,
w Notes:
1 In Capital Stock and Eco,zo~,tic Gro~vtlr, only the calendar year figures on personal residential housing are available, so we have con- verted them to a fiscal year basis by multiplying the official fiscal figures of personal residential housing by the ratio of Akabane's estimate to the official estimate in the calendar year.
The capital goods price index is a special index in the Bank of Japan's wholesale price index (originally 1952 calendar year = IW), covering construction materials as well as investment goods in a narrower sense.
*Preliminary estimates by the writer.
MIYOHEI SHINOHARA 343
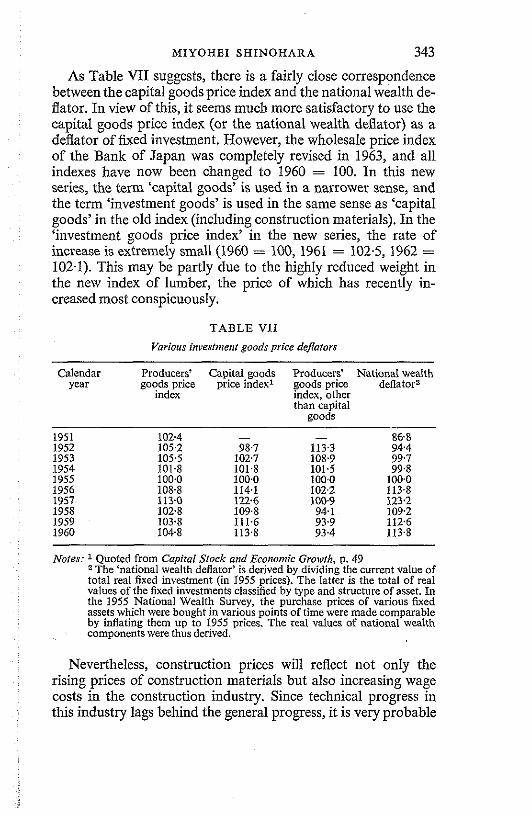
As Table VII suggests, there is a fairly close correspondence between the capital goods price index and the national wealth de- flator. In view of this, it seems much more satisfactory to use the capital goods price index (or the national wealth deflator) as a deflator of fixed investment. However, the wholesale price index of the Bank of Japan was completely revised in 1963, and all indexes have now been changed to 1960 = 100. In this new series, the term 'capital goods' is used in a narrower sense, and the term 'investment goods' is used in the same sense as 'capital goods' in the old index (including construction materials). In the 'investment goods price index' in the new series, the rate of increase is extremely small (1960 = 100, 1961 = 102.5, 1962 = 102.1). This may be partly due to the highly reduced weight in the new index of lumber, the price of which has recently in- creased most conspicuously.
T A B L E VII
Various invesfritenf goods price deflators
Calendar Producers' Capital goods Producers' National wealth year goods price price index1 goods price deflator2
index index, other than capital
aoods
Notes: I Quoted from Capital Sfock andEconomic Grorvfh, p. 49 -The 'national wealth deflator' is derived by dividing the current value of total real fixed investment (in 1955 prices). The latter is the total of real values of the fixed Investments classified by type and structure of asset. In the 1955 National Wealth Survey, the purchase prices of various fixed assets which were bought in various points of time were made comparable by d a t i n g them up to 1955 prices. The real values of national wealth components were thus derived.
Nevertheless, construction prices will reflect not only the rising prices of construction materials but also increasing wage costs in the construction industry. Since technical progress in this industry lags behind the general progress, it is very probable
344 INCOME AND WEALTH: SERIES XI
that the increasing wage rate has raised the price of construction activity. As the capital goods price index has behaved for 1952- 60 almost in the same way as the national wealth deflator in which changes in wage cost are adequately reflected, we assume that by using the Bank of Japan's old capital goods price index it would have continued to behave in the same way for 1960-61, too.
I V . INVENTORY INVESTMENT
With respect to inventory investment, the official statistics seem to involve a most striking weakness. First, they always neglect inventory valuation adjustment. Second, inventory investment in non-farm unincorporated enterprises is probably overestimated (three or four times larger than the correct value!), as I have explained in my earlier paper, 'Capital Forma- tion in Post-War Japan - A Statistical Evaluation'. In other words, the inventories at the end of the period are almost all overvalued, and those at the beginning are systematically under- valued in the basic sampling survey, called the 'Unincorporated Commercial and Manufacturing Enterprise Survey'. (Recently it was renamed the 'Unincorporated Enterprise Survey' and included the service industry, too.) The official estimate was based upon this difference, thus always being overestimated. Theoretically, the inventories at the end of a period should be equal to those at the beginning of the next period. Nevertheless, there were systematically big differences between the two in the Survey. The reasons were partially explained in the previous paper. We attempted, first, to get averages of the end of each period and the beginning of the following period respectively, and then computed the differences between the two as more reliable changes in inventories. By this procedure, the number of samples may be considered to have been automatically doubled. We also got a distinctly lower level of inventory invest- ment with a reasonable cyclical movement conforming to the actual business cycle (in the official national income estimate, the inventory changes in unincorporated enterprises lack such a cycle).
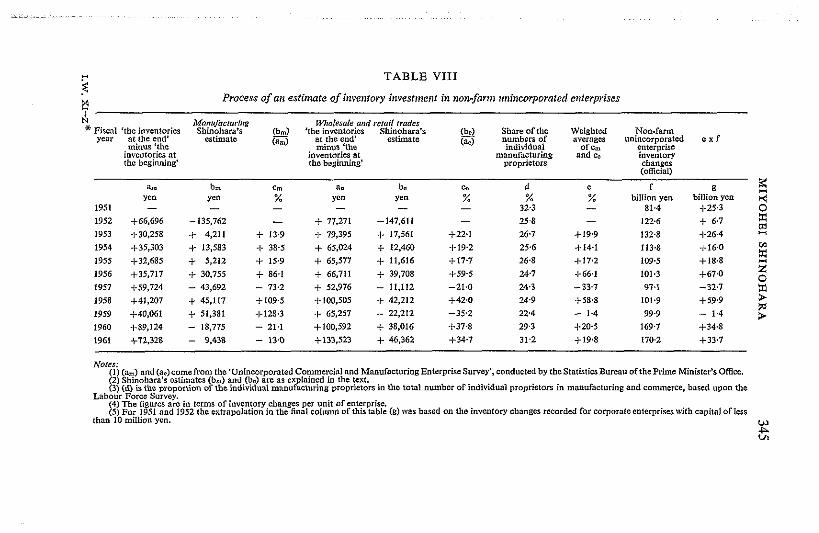
Table VIII shows the process by which inventory investment in non-farm unincorporated enterprises was estimated. It is preliminary in the sense that the official estimate was used as a stepping-stone. We intend to derive, first, the adjustment rate
- TABLE VIII 3
Process o f a n estimate of inverttory invest,net!f in non-farm ~rnincorporoted enterprises q &4 Mon8floceri,zg Wliaie111e ond reroii rrodcs * Fiscal 'the inventories Shinohara'~ (b.) 'tho inventories Shinohora3 (b.) Share ofths Weighted Non-farm
year af,the end' eslimal~ ( s t the end' ~slimalo numbccr of averages unincorporated o x f mtmus 'the minus 'the individual of cm enterprise
imvcnfories at inveotocies at manura$tvrine a d co inventory tho beginning' the bogmning' D ~ O P ~ C ~ D I S chhng~s
,",s":",, ," ..... "., arn bm Crn 8. be Ec d f 8 z
ycn Yen % yon yen % % % billion yen billion yen 2 1951 - - - - - - 32.3 - 81.4 +25.3 0
Note*: (1) (a,) and (a3cainefram thc'Uoincorporaled Commercial and Manufacturing EnterpdreSurvcy', conducted by thcStrtistiesBureru ofthe Prime Minister's Office. (2) Shinohrm'r crtlqrtes (bm) and (b3 are nr cxplalngd io the !$if. (3) ((d) is the proportion of the individual maufaclunng propnetor8 in tho total number of individual propristois in manufacturing and commerce, brssd upon the
Lobour Force survey.
t 4) The ligures arc in terms of invan!ary,chmga per unit of entcrprire. 5) For 1951 a d 1952 the utrapalatlon m fhc final columnof fhisfrbie(g)!var bassd on the inventory changes recorded for corporatscnterprisu with crpilaloflrrr
than 10 million ycn. w P
346 INCOME AND WEALTH: SERIES XI
which would eliminate the upward bias in the official estimate. This rate is estimated in Table VIII, by comparing the iu- ventory difference between the end and beginning of each period with my own estimate with respect to the inventory investment (adjusted by inventory valuation). Multiplying the official estimate by this ratio, we obtain the inventory invest- ment in non-farm unincorporated enterprises. However, for the years before 1952, we have decided to extrapolate it on the basis of the inventory changes in the lowest group (less than 10 million yen of capital) of corporate enterprises.
Corporate inventory investment is estimated, after inventory valuation adjustment, from the quarterly report of the Corpo- rate Enterprise Survey, without introducing any adjustment as to the exclusion of firms with a capital of less than 2 million yen from the quarterly report, for it seems to be of a trivial amount.
The Government inventory changes do not include those of the local government corporations since they are included with Government k e d investment. However, it is impossible to break them down here, and we used the official estimate without modification. Inventory changes for individual farm proprietors are also quoted from the official national income statistics, for in view of the extreme weakness in the basic data no improve- ment can be expected from an attempt at revision.
Consequently, the main improvement in our series lies in the revision of the inventory investment of non-farm unincorpo- rated enterprises.
V . GOVERNMENT CONSUMPTION OF GOODS A N D SERVICES
As far as the current value series is concerned, we do not intend to introduce any modification in the official estimate of Government current purchases of goods and services. However the official series in real terms adopts the aggregate consumer price index as a deflator. This seems unsatisfactory, for the real value of Government consumption of 'services' would be the volume of Government services themselves, so the compensation of Government employees should be deflated by their salary index.1 It is only the Government current purchases of goods that should be deflated by a commodity price index.
' I owe this point to 2 discussion with Sliigelo Tsuru 3s well as to .Milton G~lbcrt, Co~,cpararhe Nario!ml Producn a,zdP~ice Lelr lr , 1958.
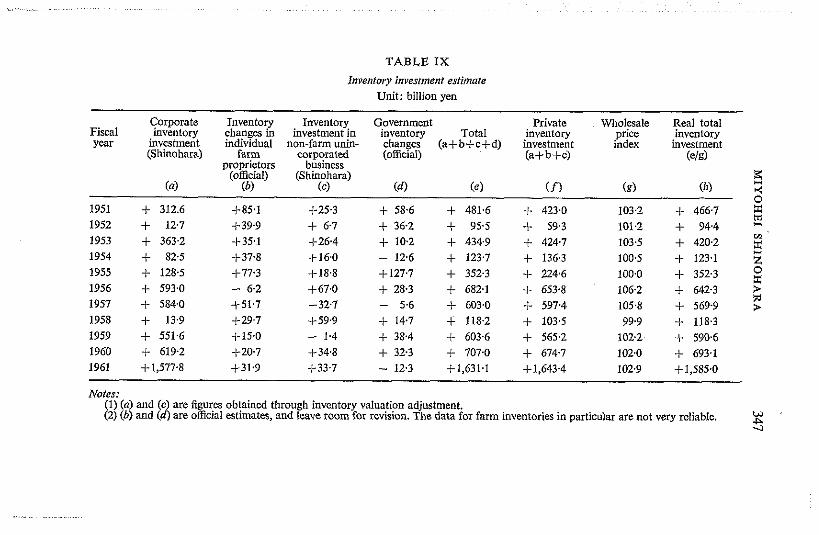
TABLE IX
Inventory investment estimate Unit: billion yen
Fiscal Year
Corporate inventory
investment (Shinohara)
(a)
Inventory changes in individual
farm proprietors
(official) (b)
Inventory investment in
non-farm i~nin- carporated
business (Shinohara)
(c)
Government inventory changes (official)
(d)
Total (a+b+c+d)
(e)
Private inventory
investment (a+b+c)
( f >
Wholesale prrce index
(e)
Real total inventory investment
(e/s)
(1,)
1951 + 312.6 +85,1 +25.3 + 58.6 + 481.6 + 423.0 103.2 + 466.7 1952 + 12.7 +39.9 + 6.7 + 36.2 4 95.5 + 59.3 101.2 + 94.4 - 1953 + 363.2 +35,1 +26,4 + 10.2 + 434.9 + 424.7 103.5 + 420.2
V1
1954 + 82.5 +374 + 16.0 - 126 + 123.7 + 136.3 100.5 + 123.1 z z 1955 + 128.5 1-77.3 + 18.8 +127.7 + 352.3 + 224.6 100.0 +352 .3 8 1956 + 593.0 - 6.2 +67.0 + 28.3 + 682.1 + 653.8 106.2 + 642.3 F 1957 f 584.0 451.7 -32.7 - 5.6 + 603.0 + 597.4 105.8 + 569.9 w
P 1958 + 13.9 1-29.7 +59.9 + 14.7 + 118.2 + 103.5 99.9 + 118.3 1959 + 551.6 1-15.0 - 1.4 + 38.4 + 603.6 + 565.2 102.2 + 590.6 1960 + 619.2 1-20.7 +344 + 32.3 + 707.0 + 674.7 102.0 + 693.1 1961 +1,577.8 +31.9 +33.7 - 123 +1,631,1 +1,643.4 102.9 +1,585,0
Notes: (1) (a) and (c) are figures obtained through inventory valuation adjustment.
W (2) (b) and (dl are official estimates, and leave room for revision. The data for farm inventories in particular are not very reliable. -4
348 INCOME AND WEALTH: SERIES XI
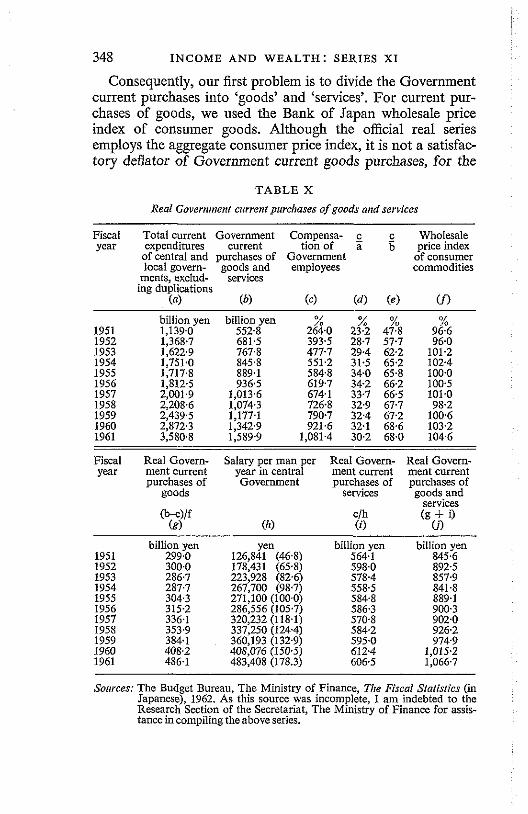
Consequently, our first problem is to divide the Government current purchases into 'goods' and 'services'. For current pur- chases of goods, we used the Bank of Japan wholesale price index of consumer goods. Although the official real series employs the aggregate consumer price index, it is not a satisfac- tory deflator of Government current goods purchases, for the
TABLE X
Real Govern,nenf current purchases of goods and services
Fiscal Total current Government Comoensa- c c Wholesale year expenditures current tion of ii 6 price index
of central and purchases of Government of consumer local govern- goods and employees commodities
ments. exclnd- servlces ing duplications
(a) (b) ( 4 ( 4 (el U) billion yen 1,139.0 1,368.7 1,622.9 1,751.0 1,717.8 1,812.5 2,001.9 2,208.6 2,4393 2,872.3 3,580.8
billion yen 552.8 681.5 767.8
Fiscal Real Govern- Salary per man per Real Govern- Real Govern- year ment current year in central ment current ment current
purchases of Government purchases of purchases of roods services roods and -
services c/h (9 + i) (i) Ci)
billion yen 299.0 300.0 286.7 2877 304.3 315.2 336.1 353.9 384.1 408.2 486.1
billion yen 564.1 598.0 578.4 558.5 584.8 586.3 570.8 584.2 595.0 612.4 606.5
billion yen 845.6 892.5 857.9 841.8 889.1 900.3 902.0 926.2 974.9
1,015.2 1,066.7
Soirvces: The Budget Bureau, The Ministry of Finance, Tlre Fiscal Sfafisfies (in Japanese), 1962. As this source was incomplete, I am indebted to the Research Section of the Secretariat, The Ministry of Finance for assis- tance in compiling the above series.
MIYOHEI SHINOHARA 349
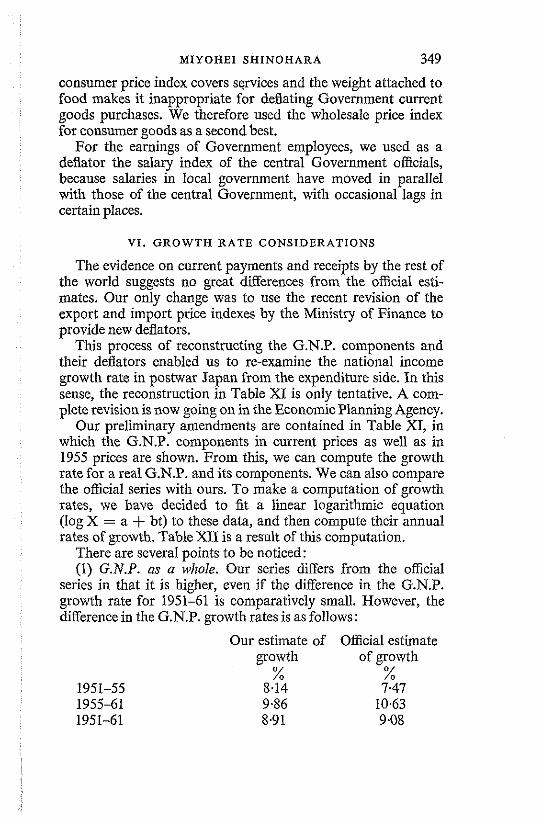
consumer price index covers services and the weight attached to food makes it inappropriate for deflating Government current goods purchases. We therefore used the wholesale price index for consumer goods as a second best.
For the earnings of Government employees, we used as a deflator the salary index of the central Government officials, because salaries in local government have moved in parallel with those of the central Government, with occasional lags in certain places.
VI . GROWTH RATE CONSIDERATIONS
The evidence on current payments and receipts by the rest of the world suggests no great differences from the official esti- mates. Our only change was to use the recent revision of the export and import price indexes by the Ministry of Finance to provide new deflators.
This process of reconstructing the G.N.P. components and their deflators enabled us to re-examine the national income growth rate in postwar Japan from the expenditure side. In this sense, the reconstruction in Table XI is only tentative. A com- plete revision is now going on in the Economic Planning Agency.
Our preliminary amendments are contained in Table XI, in which the G.N.P. components in current prices as well as in 1955 prices are shown. From this, we can compute the growth rate for a real G.N.P. and its components. We can also compare the official series with ours. To make a computation of growth rates, we have decided to fit a linear logarithmic equation (log X = a + bt) to these data, and then compute their annual rates of growth. Table XII is a result of this computation.
There are several points to be noticed: (1) G.N.P. as a wlrole. Our series differs from the official
series in that it is higher, even if the difference in the G.N.P. growth rate for 1951-61 is comparatively small. However, the difference in the G.N.P. growth rates is as follows:
Our estimate of Official estimate growth of growth
% % 1951-55 8.14 7.47 1955-61 9.86 10.63 1951-61 8.91 9.08
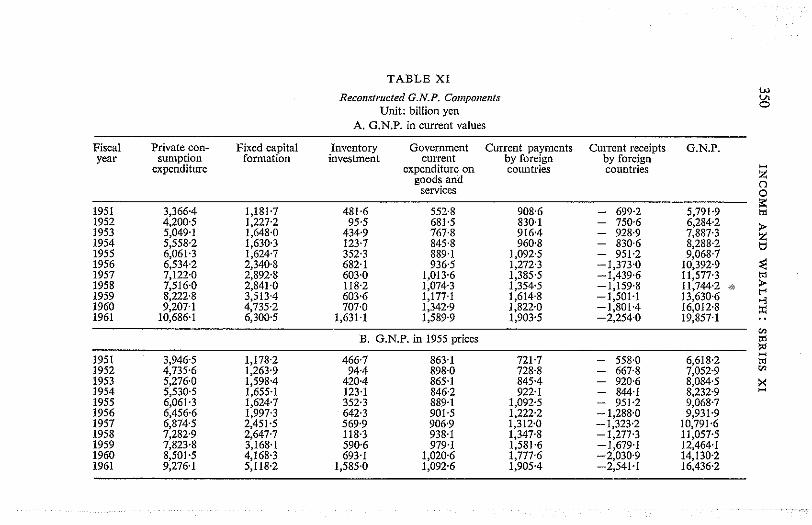
TABLE XI
Reconslrrteted G.N.P. Con?por~errls Unit: billion yen
A. G.N.P. in current values
Fiscal Private con- Elxed capital Inventory Government Current payments Current receipts G.N.P. year sumption formation investment current by foreign by foreign
expenditure expenddure on countries countries goods and 2
servrces g
B. G.N.P. in 1955 prices
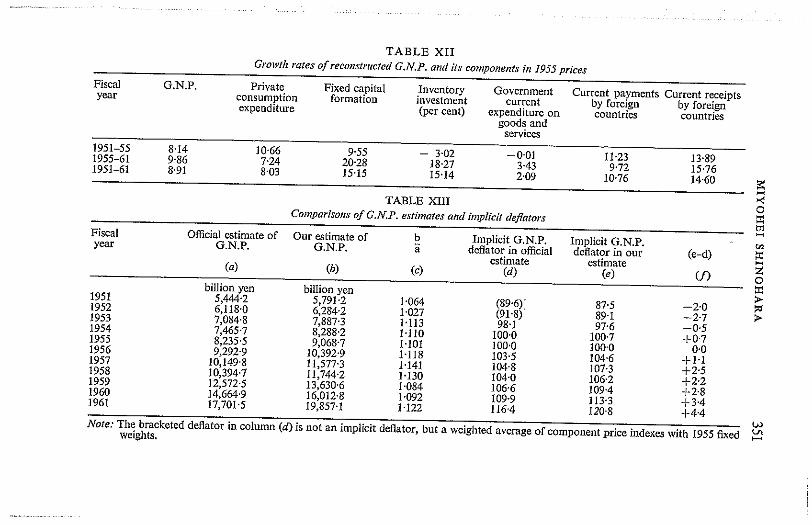
TABLE XI1
352 I N C O M E AND WEALTH: SERIES X I
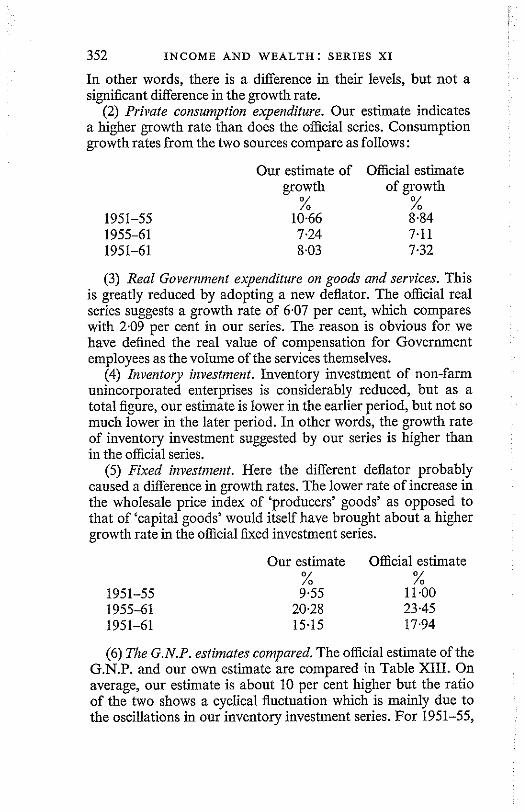
In other words, there is a difference in their levels, but not a significant difference in the growth rate.
(2) Private consumption expenditure. Our estimate indicates a higher growth rate than does the official series. Consumption growth rates from the two sources compare as follows:
Our estimate of Official estimate growth of growth
0 , 0 ,
(3) Real Government expenditure on goods and services. This is greatly reduced by adopting a new deflator. The official real series suggests a growth rate of 6.07 per cent, which compares with 2.09 per cent in our series. The reason is obvious for we have dehed the real value of compensation for Goverment employees as the volume of the services themselves.
(4) Inventory investment. Inventory investment of non-farm unincorporated enterprises is considerably reduced, but as a total figure, our estimate is lower in the earlier period, but not so much lower in the later period. In other words, the growth rate of inventory investment suggested by our series is higher than in the official series.
(5) Fixed investment. Here the different deflator probably caused a difference in growth rates. The lower rate of increase in the wholesale price index of 'producers' goods' as opposed to that of 'capital goods' would itself have brought about a higher growth rate in the official fixed investment series.
Our estimate Official estimate 0 , o/
(6) Tlze G.N.P. estimates compared. The official estimate of the G.N.P. and our own estimate are compared in Table XIII. On average, our estimate is about 10 per cent higher but the ratio of the two shows a cyclical fluctuation which is mainly due to the oscillations in our inventory investment series. For 1951-55,
MIYOHEI SHINOHARA 353
this ratio rises from 1.064 to 1.101, while for 1955-61 it is almost constant (1.101-1.222). This may partly explain why the G.N.P. growth rate in our estimate is higher for 1951-5, but not for 1955-6. For the implicit G.N.P. deflator, our estimate indicates a steeper rise, and this explains why the real G.N.P. growth rate in our series is lower than in the official series, although the rate of increase in money G.N.P. is higher in ours.
(7) Industrialproduction. The growth rate of industrial pro- duction is 11.55 per cent for 1951-5,1541 per cent for 1955-61, and 13.91 per cent for 1951-61 (based on calendar year figures). It is not surprising to find such a very high industrial growth associated with a G.N.P. growth rate approaching 9 per cent.
VII . C O N C L U S I O N
Our statistical evaluation of the postwar growth rate of the Japanese economy as reflected in nationalincome statistics is not perfect in the sense that we have focused attention only on the expenditure side of the G.N.P. However, we can arrive at a few conclusions.
(1) There seems to be a consistent undervaluation of private consumption expenditure in the official estimate, but its upward revision has also raised the consumption growth rate to some extent.
(2) There is a tremendous overvaluation of inventory invest- ment in non-farm unincorporated enterprises. Its statistical improvement has entailed a reduction of total inventory invest- ment, particularly in the earlier period, revealing more fiuctua- tions in inventory investment.
(3) The trend of the fixed investment deflator in the official estimate is relatively flat, owing to the inclusion of various raw material items in the composition of the producers' goods price index. However, restricting it to capital goods has raised its trend so that in real terms the investment series shows a lower rate of growth.
(4) The most drastic change has appeared in the series of real Government current expenditures for goods and services. By applying a salary index of Government officials as a deflator of compensations for Government officials, the growth rate of Government current expenditure undergoes a very noticeable reduction.
354 INCOME AND W E A L T H : SERIES XI
(5) On the whole, our G.N.P. implicit deflator shows a steeper rise than the official figure, and this more than cancels the higher money value of the G.N.P. in our estimate.
(6) In spite of the remarkable change in the composition of the nominal and the real G.N.P. in our estimate, the G.N.P. growth rate is stillvery high, approaching 9 per cent.
(7) Although these conclusions still leave some room for further examination, particularly on the income side, it is beyond doubt that the extremely high rate of growth in Japan in recent years was not a mere statistical illusion, judging by the evidence of the input-output tables and the very brisk activity in industrial production.
Of course, we cannot anticipate a continuation of this extra- ordinary rate of growth that we experienced in the 1955-61 period. First, in 1955, the proportion of private fked investment in G.N.P. (9.5 per cent) was relatively low compared with the high growth potential for 1955-61, so we encountered an un- precedented investment boom, but the private fked investment ratio in 1961 reached the high ratio of 22.9 per cent, which will not continue to rise, even if we assume a similar growth potential for G.N.P. in the coming period. Second, since around 1959, we have experienced an increasing labour shortage as well as the narrowing wage differential between the big and small enter- prises. The consumer price index has tended to increase from 1959 very clearly. This is an indication that sooner or later the growth rate will be obliged to slow down. Third, the heavy industry ratio in manufacturing (in terms of value added) has amounted to 60 per cent in 1960 which is among the highest in the capitalist world, so the heavy industrialization would not be expected to proceed beyond this ratio. Fourth, although the wide gap in technology between Japan and the advanced coun- tries has been the background of the investment boom from 1955 on, the rate of introduction of foreign technology would be slower as the gap narrows. However, though we may expect some retardation of our growth rate, Japan's economic growth potential still seems to be higher than that of western countries for some time to come, for some of the long-run factors of a high rate of growth will remain.