a status report regarding industry implementation … a status...a status report regarding industry...
TRANSCRIPT
NUREG-1342
A Status Report RegardingIndustry Implementation ofSafety Parameter Display Systems
U.S. Nuclear RegulatoryCommissionOffice of Nuclear Reactor Regulation
G. W. Lapinsky, Jr., R. J. Eckenrode, P. C. Goodman, R. P. Correia
AVAILABILITY NOTICE
Availability of Reference Materials Cited in NRC Publications
Most documents cited in NRC publications will be available from one of the followingsources:
1. The NRC Public Document Room, 2120 L Street, NW, Lower Level, Washington, DC20555
2. The Superintendent of Documents, U.S. Government Printing Office, P.O. Box 37082,
Washington, DC 20013-7082
3. The National Technical Information Service, Springfield, VA 22161
Although the listing that follows represents the majority of documents cited in NRC publica-tions, it is not intended to be exhaustive.
Referenced documents available for inspection and copying for a fee from the NRC PublicDocument Room include NRC correspondence and internal NRC memoranda; NRC Office ofInspection and Enforcement bulletins, circulars, information notices, inspection and investi-gation notices; Licensee Event Reports; vendor reports and correspondence; Commissionpapers; and applicant and licensee documents and correspondence.
The following documents in the NUREG series are available for purchase from the GPO SalesProgram: formal NRC staff and contractor reports, NRC-sponsored conference proceed-ings, and NRC booklets and brochures. Also available are Regulatory Guides, NRC regula-tions in the Code of Federal Regulations, and Nuclear Regulatory Commission Issuances.
Documents available from the National Technical Information Service include NUREG seriesreports and technical reports prepared by other federal agencies and reports prepared bythe Atomic Energy Commission, forerunner agency to the Nuclear Regulatory Commission.
Documents available from public and special technical libraries include all open literatureitems, such as books, journal and periodical articles, and transactions. Federal Registernotices, federal and state legislation, and congressional reports can usually be obtainedfrom these libraries.
Documents such as theses, dissertations, foreign reports and translations, and non-NRCconference proceedings are available for purchase from the organization sponsoring thepublication cited.
Single copies of NRC draft reports are available free, to the extent of supply, upon writtenrequest to the Office of Information Resources Management, Distribution Section, U.S.Nuclear Regulatory Commission, Washington, DC 20555.
Copies of industry codes and standards used in a substantive manner in the NRC regulatoryprocess are maintained at the NRC Library, 7920 Norfolk Avenue, Bethesda, Maryland, andare available there for reference use by the public. Codes and standards are usually copy-righted and may be purchased from the originating organization or, if they are AmericanNational Standards, from the American National Standards Institute, 1430 Broadway,New York, NY 10018.
NUREG-1342
A Status Report RegardingIndustry Implementation ofSafety Parameter Display Systems
Manuscript Completed: December 1988
Date Published: April 1989
G. W. Lapinsky, Jr., R. J. Eckenrode, P. C. Goodman, R. P. Correia
Division of Licensee Performance and Quality EvaluationOffice of Nuclear Reactor RegulationU.S. Nuclear Regulatory CommissionWashington, DC 20555
,pR REOG,
÷o°& %

ABSTRACT
This report provides a summary of the results of the U.S. Nuclear RegulatoryCommission staff's review of installed safety parameter display systems (SPDS)at 57 nuclear units. The staff describes its rationale and practice ferdetermining acceptability of some of the methods for satisfying the variousrequirements for SPDS as well as some methods that the staff has not accepted.
The staff's discussion of identified strengths and weaknesses should aidlicensees in solving some of the problems they may be experiencing with theirSPDS.
iii

CONTENTS
LPagae
ABSTRACT ....................................................... iii
ACKNOWLEDGMENT ................................................ vii
I. INTRODUCTION ......................................... ..... 1
II. DISCUSSION ............................................ ... 2
III. EXAMPLES OF SPDS FEATURES OBSERVED-IN! PAST REVIEWS ........ 3
III.A RAPID, RELIABLE, CONCISE DISPLAY ................... 3
III.A.1 Concise Display ........................... 3
lII.A.2 Rapid Response ............................ 4
III.A.3 Reliability ............................... 6
III.A.3.a Data Validity .................. 8
I1I.A.3.b Reliability/Availability ........ 12
III.A.4 Conditions When SPDS Should Be Operational. 13
III.B CONVENIENT LOCATION AND CONTINUOUS DISPLAY ......... 13
III.B.1 Convenient Location ....................... 14
III.B.2 Continuous Display ........................ 14
III.C ISOLATION FROM SAFETY SYSTEMS AND PROCEDURES AND
TRAINING .......................................... 14
III.C.1 Isolation from Safety Systems ............. 15
III.C.2 Procedures and Training ................... 18
I11.D SELECTION OF INFORMATION FOR DISPLAY ............... 19
III.D.1 Selection of Informationi for Display ...... 19
III.D.2 Prompt Implementation ..................... 20
III.E HUMAN FACTORS ANM SPDS DISPLAYS .................... 20
V
CONTENTS (cont)
Page
III.F MINIMUM-PLANT PARAMETERS FOR DISPLAY ............ ... 21
III.F.1 Acceptable Parameters for PWRs ........... 26
III.F.1.a Reactivity Control ............ 26
III.F.1.b Core Cooling and Heat Removal. 27
III.F.1.c RCS Integrity ................. 28
III.F.1.d Radioactivity Cortrol .... ...... 28
III.F.l.e Containment Conditions ........ 29
III.F.2 Acceptable Parameters for BWRs ........... 30
III.F.2.a Reactivity Control ............ 30
III.F.2.b Core Cooling and Heat Removal . 30
III.F.2.c Pressure Vessel Integrity ..... 31
III.F.2.d Radioactivity Control ......... 31
III.F.2.e Containment Conditions ........ 32
IV. DEFINITIONS OF AN OPERATIONAL SPUS ....................... 32
V. SUMMARY .................................................. 33
PEFERENCFS ..................................................... 34
BIBLIOGRAPHY ................................................... 35
v i
ACKNOWLEDGMENT
This report was prepared by the U.S. Nuclear Regulatory Commission (NRC),Division of Licensee Performance and OuIality Evaludtion, Human FactorsAssessment Branch with assistance from Science Applications InternationalCorporation (SAiC) and Comex Corporation. The NRC Human Factors AssessmentBranch specifically acknowledges the efforts of Joseph DeBor of SAIC andGary Bethke ot Comex Corporation in developir;q this report.
vii


I. INTRODUCTION
Beginning with the TMI Action Plan, NUREG-0660 (Ref. 1), NPC has issuea severalregulatory and review guidance documents relevant to the requirement for alllicensees and applicants to install a safety parameter display system (SPDS).Documents issued included the following:
* NUREG-0737, Clarification of TMI Action Plan Requirements (Ref. 2)o NUREG-0696, Functional Criteria for Emergency Response Facilities (Ref. 3)o NUREG-0835, Human Factors Acceptance Criteria for the Safety Parameter
Display System, Draft Report for Comment (Ref. 4).
On December 17, 1982, Generic Letter No. 82-33 transmitted Supplement 1 toNUREG-0737 (Ref. 5) to all licensees and applicants. Supplement I condensedexisting NRC guidance regarding emergency response capability into onedocument. The SPDS, TMI Action Plan Item I.D.2, was one of the five itemsaddressed in Supplement 1 to NUREG-0737.
When Supplement 1 to NUREG-0737 was issued, the staff recognized that the actionplan items regarding emergency response capability were far-reaching conceptswith a high degree of interrelationship. Also at that time, some licenseesindicated that their Commission-approved schedules -,or implementing these re-quirements could not possibly be met. Therefore, in Supplement 1, the stafftock a less prescriptive approach to applying its requirements. First, therequirements were stated as general guidance that would not alter or replaceprevious guidance, but would put it in perspective by identifying the elementsthat the staft believes essential to upgrading emergency response capability.Second, because the requirements were described in a guidance document (Supple-ment 1 to 11UPEG-0737) and were actually imposed as requirements by other, plant-specific regulatory mechanisms, such as commission confirmatory orders orlicense conditions, all licensees and applicants had the opportunity to negotiatereasonable, achievable, plant-specific schedules.
Because the staff believed that the SPDS could provide significant safetyimprovement to nuclear power plant control rooms in a relatively short time,licensees and applicants were urged to install a system without undue delay.Further, the NRC allowed licensees and applicants to install the systemswithout prior approval to ensure that the NRC review process would notdelay SPDS implementation. However, licensees and applicants were given theoption of pre-implementation review and approval if they so desired.
On December 26, 1984, the NRC "Standard Review Plan" (SRP), NUREG-0800 (Ref. 6),was revised to incorporate Section 18.2, "Safety Parameter Display System," andAppendix A to SRP Section 18.2, "Human Factors Review Guidelines for the SafetyParameter Display System." This revision described the acceptance criteria,review procedures, and applicable guidance for NRC staff to use in reviewing SPDS.
1
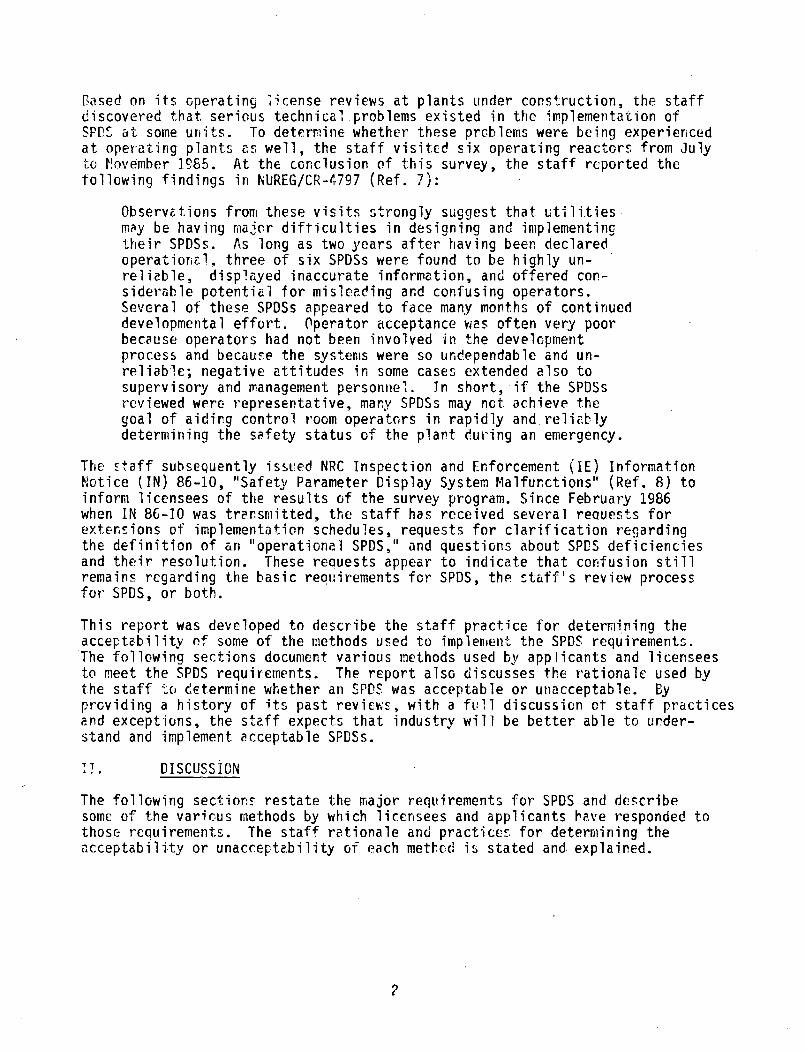
Pased on its operating license reviews at plants under construction, the staffdiscovered that serious technical problems existed in the implementation ofSPDS at some units. To determine whether these problems were being experiencedat operating plants as well, the staff visited six operating reactors from Julyto November 1985. At the conclusion of this survey, the staff reported thefollowing findings in NUREG/CR-4797 (Ref. 7):
Observations from these visits strongly suggest that utilitiesmay be having major difticulties in designing and implementingtheir SPDSs. As long as two years after having been declaredoperational, three of six SPDSs were found to be highly un-reliable, displayed inaccurate information, and offered con-siderable potential for misleading and confusing operators.Several of these SPDSs appeared to face many months of continueddevelopmental effort. Operator acceptance was often very poorbecause operators had not been involved in the developmentprocess and because the systems were so undependable and un-reliable; negative attitudes in some cases extended also tosupervisory and management personnel. in short, if the SPDSsreviewed were representative, many SPDSs may not achieve thegoal of aiding control room operators in rapidly and reliablydetermining the safety status of the plant during an emergency.
The staff subsequently issued NRC Inspection and Enforcement (IE) InformationNotice (IN) 86-10, "Safety Parameter Display System Malfunctions" (Ref. 8) toinform licensees of the results of the survey program. Since February 1986when IN 86-10 was transmitted, the staff has received several requests forextensions of implementation schedules, requests for clarification regardingthe definition of an "operational SPDS," and questions about SPDS deficienciesand their resolution. These requests appear to indicate that confusion stillremains regarding the basic requirements for SPDS, the staff's review processfor SPDS, or both.
This report was developed to describe the staff practice for determining theacceptability of some of the methods used to implement the SPDS requirements.The following sections document various methods used by applicants and licenseesto meet the SPDS requirements. The report also discusses the rationale used bythe staff to eetermine whether an SPDS was acceptable or unacceptable. Byproviding a history of its past reviews, with a full discussion ot staff practicesand exceptions, the staff expects that industry will be better able to under-stand and implement acceptable SPDSs.
Ii. DISCUSSION
The following sections restate the major requirements for SPDS and describesome of the various methods by which licensees and applicants have responded tothose requirements. The staff rationale and practices for determining theacceptability or unacceptability of each method is stated and explained.
Wher a licensee's or applicant's method for satisfying a requirement wasunacceptable, the staff rationale and practice is fully explained, includingthe underlying basis for the requirement and associated regulatory guidance.The discussion of staff practices sometimes necessitates the definition ofterms, general principles, and assumiptions. When this is the case, these itemshave been highlighted by underscoring or as notes within the text.
Ill. EXAMPLES OF SPDS FEATURES OBSERVED IN PAST REVIEWS
III.A. RAPID, RELIABLE, CONCISE DISPLAY
The SPDS should provide a concise display cf criticalplant variables to the control room operators to aid themin rapidly and reliably determining the safety status ofthe plant. Although the SPDS will be cperated during normaloperations as well as during abnormal conditions, theprincipal purpose and function of tile SPDS is to aid thecontrol room personnel during abnormal and emergency condi-tions in determining the safety status of the plant and inassessing whether abnormal conditions warrant correctiveaction by (control room) operators to avoid a degraded core.This can be particularly important during anticipatedtransients and the initial phase of an accident. (NUREG-0737, Supplement 1, Section 4.1.a)
This requirement is interpreted by the staff as ccntaining five essentialelements or concepts:
o concise displayo critical plant variablesc rapid responseo reliableo conditions when SPOS should be operational
These elements are discussed below, except for the concept of critical plant
variables that is discussed in Section IIJ.F of this report.
III.A.1. Concise Display
Of the units reviewed thus far, 37 acceptably satisfied this requirement.Twenty-six units did so by providing a single display of critical variables ona cathode-ray tube (CRT) device. Others provided two CRT displays in a side-by-side configuration, usually with plant process variables on one screen andradioactivity control variables on the other. The staff round this methodacceptable contingent on the full set of SPDS variables being "continuouslydisplayed" (see III.B.2 for acceptable n'ethods of providing continuousdisplay).
Twventy units provided a single CRT display augmented by conventional controlroom instruments. The statf accepted this method only in those cases in whichit was impractical to include the data from the conventional display on the CRTdisplay because it was not part of the computer data base; the conventional
display was easily readable from the SPDS user's position; the parameterdisplayed on the conventional display was defined as part of the SPDS parameterset; and, a commitment was made to preserve the visual relationship of the SPDSand the conventional display.
In several cases the actual words or values on the conventional display couldnot be read from the SPDS user's position. However, in some of these cases thestaff found this situation acceptable because the information being transmittedwas a simple status, e.g., or/off light, or open/close light and the displaywas enhanced by either pattern-recognition or location highlighting. In a fewcases the staff did not accept the mixed mode display concept. In one systemthe conventionally displayed information was required to be read but could notbe, end it was not amenable to pattern recognition. In the others, the conven-tional display was not in the SPDS operator's field of view and would necessitatea change of the operator's position to be read.
The basis for the requirement for a concise display stems from the lack ofcentralized display capability in the TMI-2 control room. Control room person-nel could not easily develop an overview of plant conditions in the TMI-2 controlroom because the available displays were widely dispersed and provided component-level information. This situation hampered decision-making because it did notfacilitate the comparison of variables or the integration of various symptomswithin the same timeframe. At the same time it induced some unproductive be-haviors such as fixation on a limited set of plant variables, and undue attentionto irrelevant plant anomalies while safety functions were in jeopardy. There-fore, the staff found unacceptable any SPDS that made it necessary for the userto leave the SPDS to gather information necessary to assess the status of thecritical safety functions, or otherwise caused the operator to turn attentionaway from the primary SPDS location.
III.A.2. Rapid Response
Note: The staff assumes that in order for a control room operator todetermine the safety status of the plant rapidly, five conditions should exist:
(1) information presented should represent current plant conditions, i.e.,real-time data,
(2) Information should be sampled at a rate that assures that no meaningfuldata, or trends in that data, will be missed, i.e. the sampl rate shouldbe sufficient to assure that data is of appropriate resolution;
(3) Information should be updated on the display often enough to assure thatchanges in plant status will not be masked or lost by the passage of time,i.e, update rate should be consistent with, and sufficient to represent,expected variations in plant safety parameters;
(4) Information should be rapidly accessible to the operator, i.e, asstemresponse times of about 2 to 3 seconds and no greater than about 1-?econdsmaximum;
4
(51 information should be in a simple, easy-to-understand format that can berapidly comprehended.
Many of the SPDSs reviewed by the staff satisfied this requirement by installingsystems that provide real-time data that is sampled and updated at meaningfulrates. Acceptable sampling rates were judged in the context of required res-olution, e.g, reactor coolant system (RCS) pressure requires data resolution interms of seconds while certain radiation levels need (or can only) be sampledevery 30 seconds, 60 seconds, or several minutes. In its reviews, the staffurged licensees and applicants to minimize differences between sampling rate andupdate rate so that operators would not be misled, e.g., a variable that isupdated on the display screen every 2 seconds but is sampled only once a minutewill appear to be stable, when it may in fact be increasing or decreasing. Thestaff exercised flexibility in applying these principles during reviews, depend-ing on the instrumentaticn available and the variable being measured.
Acceptable systems provided data that was consistent with conventional controlroom instruments. They also provided simple displays that allowed immediaterecognition of normal, abnormal, and emergency conditions. System responsetimes to operator commands were 10 seconds or less, from the initial keystrokeor cursor movement to updated screen.
Note: Good human engineering practice prescribes that system response time torequests for graphic output, such as typical SPDS displays, should be no greaterthan about 10 seconds. When system response time exceeds 15 seconds, the operatorshould be provided vrith feedback that there will be a delay in servicing theuser's request or command.
Overall, these characteristics yielded systems with which an operator can seea current, accurate overview of the plant in ten seconds or less. Most of theseare enhanced by summary status indicators or pattern-recognition aids thatallow operators to see at a glance whether any plant safety function isabnorrra 1.
A few systems did not display real-time data for at least some of the SPDSvariables. Because the SPDS is intended to coordinate a variety of widelydistributed control room instruments into one concise aisplay, real-time ornear real-time data is necessary to provide the operator with an overview ofthe plant that is the equivalent of and is consistent with the control roominstruments it represents.
Some systems were found deficient because sampling rates were too slow. Otherswere deficient because sampling rates could be changed without the knowledgeof the operators. In cases where the sample rate was too slow, it was thestaff's judgement that significant changes in plant state could be masked andoperators could be misled. In cases where the sampling rates could be changed,the operators were generally not aware that the sample rates were variable andcould be changed--they assumed that all data was being sampled at a rate equalto the display update rate. Because there were no mechanisms in place forcontrolling changes in sample rates and operators were unaware of thiscapeaility, these changes presented some risk that operators would be misled orconfused by the SPPS if the sampling rates were changed.
5
Eleven units had systems that the staff found to be unacceptably slow indisplaying changes in plant safety status. Several of these were found to beunacceptable because the Fystem did not update datc automatically. Rather,these systems would take a "snapshot" of plant conditions when requested to dosc by a user. This feature was found to he unacceptable because (1) the datadisplayed is quickly outdated; (2) it may not be a representative sample ofplant conditions; (3) discrimination of trends nscessitates the operatcor doingsuccessive iterations of manual updates; &rd (4) in some systems, there is arisk that an old disple.y screen could be mistaV.c for new data.
Some systems were unacceptable because the response to operator commandrs wasunpredictably variable and slow. Generally, these were systems in which SPDSshared time with other functions or which were overloaded. The unacceptablyslow response times ranged from about 30 second!: to several minutes. Usuallythese systems would also vary in response times such that operators never knewvwhether the system had accepted a corimanid and was executing it or had missedthe command, ignored the conmmand, or crashed completely. in some systerms thisled operators to try, to key in the command acain which would "lock up" thekeyboard and disable the system for minutes or hours.
Some systeris were deficient in net allowing operators rapid access to data. Suchsystems were cenerally "command-driven," requiring that the user remember or lookup an alphanumeric command and key it in. These systems were found to be unac-ceptable if a trained operator could not quickly call up an SPDS display. Thereviewers found a syste" unacceptable if operators had to consult point identifierdirectories and could not find correct entries. Cr if they had frequent mis-keyingerrors that resulted in long response times.
III.A.3 Reliability
Note: The staff defines reliability at the system level. Therefore, acceptablesystems are those that are reliable in terms ot hardware, software, and operatorperformance. Reliability, as defined here, includes two general concepts:(1) reliability--the degree to which the system will repeatedly produce the sameresults under identical conditions over time arc! (2) validity--the degree to whichthe systemr, will produce correct and accurate results that the user will believe,i.e., rely on. Of the 57 units reviewed thus far, 12 have installed systems thatwere considered adequately reliable.
From the hardware point-of-view, these systems are characterized by the use ofbackup storage and automatic restart capaLilities, uninterruptable power supplies(UPS), independent and redundant hardware for critical parts of the system, onsite or near-site maintenance support, and adequate inventories of spare parts.
Regarding software reliability, these systems were developed using verificationand validation (V&V) methodology eqiuivalent to that described *in NSAC-39, "Ver-ification and Validation for Safety Parameter Display Systems" (Ref. 9). Thismethodology provides some assurance that the SPDS software has been adequatelydesigned, implemented, an6 tested.
6
From the operator performance perspective, the reliability of these acceptablesystems was tested by some form of "man-in-the-loop" test program in whichtrained operators used the system during emergency event scenarios. Operatorswere trained in SPDS operation prior to declaring the SPDS operational in thecontrol room. The perception of operators interviewed at these plants is thatthe SPDS is as reliable as (or more reliable than) any other instrument in thecontrol room. Generally, operators at these plants use SPDS routinely and oila daily basis.
Note: The term "operator" as used in this document refers to "SPDS operator"or user; those users arc defined by each licensee and may include ShiftSupervisors, STAs, and emergency response facility personnel as well ascontrol room operators.
Peliable systems also provided some method of data validation. Minimally, they allprovided at least a comparison of redundant sensor readings for consistency, andrange-checks to identify failed instruments. Most also provided other methodssuch as coincident logic schemes, and analytical algorithms to shift setpointsduring mode changes. These characteristics yielded systems with estimated ormeasured computer availabilities of grcater than 99 percent, and that operatorswere reasonably confident that it could be relied upon to display plant datacorrectly.
Many systems were found to be unreliatle, suffering from frequent failuresranging from keyboard "lock-up" to total system crash. Although these systemscontained some of the characteristics of acceptable systems, such as multipleprocessors and UPS, they also contained design flaws that allowed single failuresof hardware or software to take the system down frequently and/or for longperiods of time. Nine systems displayed inaccurate or incorrect informationthat could mislead operators. False alarms were also common. These problemsundermined operator confidence in relying on the SPDS. In fact at several plants,operators were instructed not to use SPDS at all. In general, these systemswere not designed using an acceptable V&V program. At several plants, the SPDSwas declared operational and installed in the control room before development ofthe design was complete and before operators were adequately trained. Under thesecircumstances, operators learned to mistrust the SPDS. In many cases, "man-in-the-loop" testing was not done prior to declaring the SPDS operational. Mostplants with unreliable systems had inadequate maintenance and softwarE qualitycontrol programs as well.
These systems were unacceptable either because they were so unreliable thatoperators did not use them--thus, they did not provide aid to the operator asrequired by Supplement 2 to NUREG-0737 or because they provided inaccurate orfalse information that could mislead operators, thus posing a serious safetyquestion. In instances where the staff found SPDSs that had inaccurate or falseinformation, licensees were instructed to shut the system oft to preventcperators from using bad data that might lead to unsafe operation of thefacility.
-I
Although no SPDS was judged unacceptable based solely on shortcomings in itsV&V program, it was apparent tc the staff that those plants that did notimplement a good V&V program concurrent with their design process were usuallyplagued by single-failure flaws in the hardware configuration, significantsoftware errors, and poor acceptance by operators. High reliability should bebuilt into a system by means of VQV methodology, good software maintenance, andestablishee cquality assurance policies. Test programs alone cannot assure that asystem will provide reliable information under the full scope of emergencyconditions, nor can one-time test programs address the viability of a systemover time if uncontrolled or undocumented modifications are possible.
Because there is no single measure of system reliability, the staff's judgmenthas been based on three general measures in combination: (1) estimated ormeasured computer availability (eoual to or greater than 99 percent), (2)observed inaccuracies and false alarms during an NRC audit, and (3) operatorsurvey results. The last two of these have been givcn the most weight becausethey reflect the reliability of the final product, the data being displayed,rather than reflecting the reliability of the tools being used to process andgenerate the final product. No SPDS has been found unacceptable based on onlyone of these measures. Each is used as a confirmation of the others.
Because data validity and system reliability have such a great impact on theusability of SPDS, examples of specific problems are included below to providefurther insights to licensees and applicants for avoiding common pitfalls.
III.A.3.a. Data Validity
Lack of Data Validation
Some systers failed to -incorporate data validation techniques of any kind.These systems did not fulfill the requirement to provide a reliable display andin effect, complicated the operator's task of recognizing challenges to plantsafety. Lack of data validation places the burden of identifying valid readingson the operator. Little benefit is gained from placing unvalidated readings ofloop temperatures, for example, or a computer screen in addition to the controlboards. in some cases, the operator was presented with averages of unvalidatedinputs. In these cases, the averaging process may even mask a failed input fromthe operator, thus the operator will be misled by incorrect information. Forexample, in a PWR with three reactor cooling system pressure transmitters, oneof which is failed high, system pressure would have to be below 1100 psi beforean SPDS average of unvalidated inputs would indicate a concern. Furthermore,the input of unvalidated values to algorithms that determine critical safetyfunction status can produce incorrect status indications.
Errors in Single Numerical Computer Points
Most SPDS systems have at least a few data points that do not agree with theanalog or digital data that is displayed on the control room boards. in almostevery case, this situation can be avoided. The most common of these errors aredescribed below.
8
Some SPDS flow indications are continuously invalid or incorrect during normaloperations. This destroys the credibility of SPDS as a tool to be used andtrusted to display plant safety information. For example, during normal poweror hot standby operation of the plant, numerous systems are not operating or arein a standby mode. Examples of these systems include containment spray,auxiliary or emergency feedwater, safety injection systems, diesel generators,and wide range containment sump level monitors. Flow and pressure instrumentsassociated with these systems should indicate zero flow and low or atmosphericpressure when the systems are in standby. Because of electronics drift, themillivolt or milliamp signal equivalent to these zero conditions is not anabsolute, fixed value. In addition, some systems in standby actually developpressures slightly less than atmospheric or less than the calibrated static head.Because most SPDS systems use a fixed value as the zero range-check validationpoint, when instrument output falls slightly below this value, the point isfalsely indicated either as invalid or as a negative flow value. This problemhas been eliminated by some system designers by lowering the range-check setpoint value slightly and by allowing a small range of near-zero values to beinterpreted as zero.
Most SPDSs have at least a few problems with digital computer points (e.g.,two-state signals, such as open-shut and on-off). The problem is manifestedby displays that erroneously indicate open valves as being shut, running pumpsas being off, etc. These problems are apparently caused by the systemsincorrectly interpreting the voltage at which the input changes state.
Occasional problems are caused by wide range instruments being used as inputsto computer points having a very low setpoint for an alarm. A good exampleot this problem is the typical alarm associated with increasing containmentpressure. These alarms are typically set at values from about 1.0 to 2.5 psig(depending on reactor type). The control room alarm (annunciator) is usuallydriven by a narrow range pressure instrument with a typical range of - 5.0 to+10.0 psig. In many instances, these narrow-range instruments are not used asinputs to the SPDS; only wide-range instruments with ranges of -5.0 to +60.0psig are input. The wide-range instruments often have the same full scalesignal voltage change as do the narrow-range instruments. Therefore, a minorvoltage change on the wide-range instrument may equate with a pressure changeof 2 or 3 psig, thereby causing spurious pressure alarms on SPDS. When the widerange instrument is read in the control room, within the accuracy of the scale,it will appear to be reading zero, while the SPDS computer point is swingingfrom -2.0 to +2.0 psig.
Some computer points fluctuate wildly because of signal lead ground loops andcurrent drain problems. These problems appear on the non-lE side of theelectrical isolators.
Errors in Averages and Other Processed Data
SPDS computer points fall into two distinct categories: discrete and processed(or composed). Discrete computer points use a single analog or digitalinstrument as an input while processed points are computed within the SPDScomputer or an associated computer using a combination of inputs from severalsensors. Most SPDS systems perform a simple maximum-minimum range check tovalidate discrete points. Composed points can have a variety of redundant
9
sensor algorithmns applied to ensure their validity. Some SPDS systems usecomposed points, such as averages of several like sensors, but apply no valida-tion checks to these composed points beyond the simple range-checks applied tothe discrete points. A simple example of a composed and validated computerpoint is as follows:
Four reactor pressure instrument inputs to an SPDS are first range-checkedas discrete points. All of the inputs that pass the range check are thencompared with each other. Those falling outside of a predetermined standarddeviation of the average of the points are rejected. The remaining pointsare then re-averaged to provide the composed and validated point.
When adequate data validation techniques are not applied, SPPS performance
suffers. Typical problems identified by the staff are described below.
" Using a single, auctioneered highest core exit temperature (CET) as theinput to an algorithm may cause the resultant value to be inaccurate ifany single CLT fails high.
o Using the raw input from differential-pressure reactor vessel levelinstrumentation systems may cause erroneous level readings as the plantpressure and coolant pump combination change.
o Using simple averages of several, unvalidated loop temperatures andpressures causes the composed points to read in error when any one of theinputs fail.
Other problems arise when composed points, made up of inputs from more than oneloop or section of a system, are used where a discrete or single loop pointwould be more appropriate:
0 Cases have been observed where a T-cold composed poi-nt, consisting of the
average of the T-cold inputs from all 4 loops of a PWR, was used in apressurized thermal shock (PTS) detection algorithm. The EmergencyOperating Procedures (EOP) and PTS limits were based on evaluating eachloop separately, with the coldest loop being of concern. It a composedpoint is to be used in this algorithm, the auctioneered coldest value wouldbe more appropriate.
The use of an average BWR suppression pool (SP) temperature as an input toan algorithm which is used to monitor for the hottest point in the SP islikewise, not appropriate.
The staff also noted cases where inappropriate parameters were used bycomposed point algorithms. An example is the composed point algorithm usedto calculate reactor pressure vessel (RPV) level at several BWRs. At theseplants, this algorithm averaged the readings of all level instruments withoutregard for the conditions for which the instruments were calibrated. Theselevel measurements were made using a differential pressure method. Todetermine level from a differential pressure measurement, the density of thefluid being measured must be known. Then level is the differential pressuredivided by the density. Since the temperature of reactor coolant is muchdifferent during normal operation than it is during shutdown, coolant density
10
is different as well. Therefore, many coolant system levels are measured withtwo sets of instruments: one set calibrated for operating conditions and theother calibrated for shutdown conditions. Measurements from these two sets ofinstruments should not be combined unless some adjustment is made for the factthat they are calibrated for different coolant densities.
Inadequate identification of Data Quality
Most SPDS systems use one of several techniques for indicating suspect or poordata points. These methods includE color changes, backlighting, flashing,superscript and subscript characters, and replacement of numerical data withcharacters such as asterisks (*****). The following problems have beenobserved with these techniques:
Several SPDS systems reviewed allow CRT terminal operators to manually replacereal input data with other values. This procedure was judged satisfactory ifthe inserted data could be somehow highlighted or designated as being aninserted value and if the number of personnel having system security codesallowing such action was limited and administratively controlled.
However, on some SPDS systems the fact that data had been manually entered inplace of real input data was not detectable by any visual cue and could be doneby anyone, without the knowledge of the operators, from any terminal attachedto the host computer (in some cases, from as far away as a corporate officelocated miles from the site).
In some cases, data which fails a validation check is highlighted with the samevisual cue as data points that have exceeded an alarm setpoint. Rapid discrimin-ation of visual cues is impossible when these cues have more than one meaning,i.e., "invalid data" and "parameter outside of normal range."
Removal of Data Points Known to Be Invalid
Quite often some of the analog instruments used as inputs to the SPDS will beout of service because of hardware failure or surveillances in progress. Unlessan SPDS has a very good validation scheme for each parameter, there is a needto be able to take computer points out of scan easily. On many systems, theprocess of taking failed points out of scan is quite easy. One process, forexample, involves the completion of a short approval form ard a few keystrokesby system maintenance personnel. However, there are systems in which taking apoint out of scan is nearly impossible.
In some systems, the data points are coded in assembly language rather thanbeing resident on a disc file or table. In order to remove a point from scan,the computer system personnel must shut down the entire system and performassembly language programming. Because this method is more complex, some failedcomputer points could still be resident in the system and indicate bad data formonths after the problem with the instrument has been corrected.
11
A few systems operate with the SPDS program on computer chips. In order to takea point out-of-scan or to make any other modification to the system, new chipsare required. This process can again take several months, during which time thesystem displays inaccurate data to the operators.
Algorithm Errors
Some systems displayed inaccurate information, false alarms, or both because ofproblems with programming algorithms. This was complicated in a few cases,because the SPDS operators did not fully understand the algorithms that drivecertain displays. Examples are provided below.
Some reactivity control algorithms that are intended to be anticipated-transient-without-scram (ATWS) indicators do not use any input from the reactor protectionsystem or trip breakers. Because of this, the top level displays are continuouslyalarmed falsely anytime reactor power is above about 3 to 5 percent. The alarmswould work as ATWS indicators following a trip, but may be ignored by theoperators since they have grown accustomed to seeing the false alarm duringnormal plant operations.
One SPDS reviewed did not actuate any of the top level safety function alarmalgorithms until after a trip occurred. The operators were unaware of this andbelieved the system to be very reliable since they had never observed anyalarms during normal power operation.
Some PWR SPDS system algorithms use a makeup-letdown flow mismatch to detect aleak or break in the reactor coolant system (loss-of-coolant accident [LOCA]).Because programmers did not take into account the portion of coolant divertedfcr RCS pump seals and for coolant lost via normal minor identified leakage, theLOCA alarm was continuously illuminated.
III.A.3.b. Reliability/Availability
SPDS System "Lockups" and "Re-Boots"
About 30 percent of the SPDS systems reviewed to date have demonstrated frequentsystem "lockups" under both normal and heavy usage. To be assured that suchproblems do not occur in an operational environment, systems could be testedat full expected loading, with all available terminals in use. Oncedeveloped, a system load test procedure can be run at any time. The systemcould also be tested in conjunction with the annual emergency exercise or duringa planned plant trip (scram).
The source of observed system lockups fall into about four categories and aresomewhat equally distributed. These categories are:
" software problems in the graphics terminal(s)o host computcr software problems (in particular the display driver portions)o CPU communications bus data errors" errors and lack of capacity on remote terminal communications links
12
Lockups are most frequently initiated by one of the following reasons oractivities:
o Heavy system loading during multiple terminal or peripheral use, such asoccurs following a reactor trip.
o The lack of display feedback messages such as "WAIT - PROCESSING" causescasual systems users to continue to input commands while system is processingprevious commands.
o Lack of user training or complexity of commands causes keyboard entryerrors resulting in system lockup. The problem of user training seemsworse at sitcs where the SPDS is served by the same host computer as theemergency response facility (ERF) data systems. ERF users may only use thesystems a few times per year.
These kinds of problems with system reliability and data validity reduce thecredibility of the SPDS. The basis of the requirement for high reliability isthe need for operators to believe data. If they doubt the accuracy, thecorrectness, or the timeliness of data, operators will look elsewhere forinformation. If this happens often enough, the operators will begin to ignorethe SPDS because it increases the data-gathering workload rather than decreasingit.
For the SPDS to be effective, it must aid operators in rapidly and reliablydetermining a plant's safety status. Those systems that the staff has foundto be unacceptable do not provide such aid, and may, in fact, mislead orconfuse operators.
III.A.4 Conditions When SPDS Should Be Operational
Of the 57 SPDSs evaluated, all adequately satisfied the requirement to installan SPDS that is designed to operate during normal, abnormal, and emergencyconditions.
The staff's initial guidance (NUREG-0835, Draft Report; NUREG-0696) regardingthe conditions under which an SPDS should be operational called for the SPDSto be available during all plant modes. In Supplement 1 to NUREG-0737, thestaff reduced the acceptable operating scope of the SPDS to "normal operations,abnormal and emergency conditions," i.e., all modes above cold shutdown. Someplants have also elected to include the cold shutdown and refueling mode as part ofthe SPDS' scope. The staff finds this to be a desirable extension of the SPDSscope of application.
III.B. CONVENIENT LOCATION AND CONTINUOUS DISPLAY
Each operating reactor shall be provided with a Safety ParameterDisplay System that is located convenient to the control roomoperators. This system will continuously display informationfrom which the plant safety status can be readily and reliablyassessed by control room personnel who are responsible for theavoidance of degraded and damaged core events (NUREG-0737,Supplement 1, Section 4.1.b).
13
This requirement contains two additional elements that were not discussed inthe preceding section:
o convenient locationo continuous display.
III.B.l Convenient Location
The term "operator" is defined here in the broad sense of SPDS operator oruser. The staff's only strict requirements with regard to convenience havebeen that the SPDS be in the centrol room and that -it be convenient to thelicensee defined user(s), e.g., reactor, operators, senior reactor operators,shift technical advisor, shift supervisor. A corollary principle is that theSPDS should not interfere with control room cperations, e.g., interfere withphysical or visual access to other control room instruments.
Only 17 units failed to satisfy this requirement. An extreme example was aSPDS CRT that was suspended from the ceiling of the control room, too far fromthe floor to be read by anyone in the control room. This display was obviouslynot convenient to any user.
III.B.2 Continuous Display
A continuous display is needed for an effective SPDS because it affords theoperator almost immediate access to the most important information about plantsafety. Acceptable SPDS systems had this information displayed continuously.Operators did not need to search among various displays or page through irrele-vant information to get a current overview of plant safety status or to beaware that plant statuF was changing. Plant safety status informatior shouldalways be displayed in the control room, not hidden among rows of instrumentsor buried under "pages" of CRT displays. The staff makes the distinction thatinformation that is "continuously available for display" is not the equivalentof a continuous display.
Twenty-one of the 57 SPDS reviewed satisfied this requirement by eitherproviding a dedicated, single display of plant variables, or by providing ahierarchy of display "pages" on a single CRT with perceptual cues to alert theuser to changes in the safety status of the plant. The remainder were found tobe unacceptable because they provided neither a continuous display of variablesnor an alerting mechanism, such as safety function status indicators.
III.C Isolation From Safety Systems and Procedures and Training
The control room instrumnritation required (see GeneralDesign Criteria 13 and 19 of Appendix A to 10 CFR 50)provides the operators with the information necessaryfor safe reactor operation under normal, transient, andaccident conditions. The SPDS is used in addition tothe basic components and serves to aid and augment thesecomponents. Thus, requirements applicabie to controlroom instrumentation are not needed for this augmentation
14
(e.g., GDC 2, 3, 4 in Appendix A; 10 CFR Part 100; single-failure requirements). The SPDS need not be qualified tomeet Class 1E requirements. The SPDS shall be suitablyisolated from electrical or electronic interference withequipment and sensors that areAin use for safety systems.The SPDS need not be seismically qualified, and additionalseismically qualified indication is not required for thesole purpose of being a backup for SPDS. Procedures whichdescribe the timely and correct safety status assessmentwhen the SPDS is and is not available, will be developedby the licensee in parallel with the SPDS. Furthermore,operators should be trained to respond to accident condi-tions both with and without the SPDS available (NUREG-0737,Supplement 1., Section 4.1.c)
This requirement contains two additional elements not yet discussed:
o isolation from safety systemso procedures and training
III.C.1 Isolation from Safety Systems
In order to protect safety systems from electrical and electronic interference,the SPDS must be isolated from equipment and sensors that are used in safetysystems. Examples of acceptable isolation devices and relevant test conditionsare listed in Table 1.
The following table lists isolation devices used in the SPDS systemswhich have been reviewed and approved by the staff. As noted in the list, themaximum credible fault (MCF) testing varied from plant to plant even for the sameisolators. Therefore, care must be taken to assure that in any future applica-tions of these devices, licensees verify that the plant-specific applicationdoes not exceed the capability of the device. Post of the referenced reportsand qualification tests are proprietary and are therefore unavailable forrelease from NRC. Other devices have been tested but must have the testresults submitted to the NRC for review and approval.
Note: relays with contact-to-coil isolation have been approved for severalappTications; systems utilizing fiber optic cable have not been required toperform maximum credible fault tests because of the inherent isolation charac-teristics of the cable.
15
0
Table 1. Isolation Devices
Manufacturer/Supplier Maximum Credible Fault Test and/orApplicable Topical Reports
ACROMAG Series 700MODELs 712-L,H; 722-TL-Y
Analog Devices, Series 289
Computer Products Inc
E-MAX, Digital and Analog
Energy Inc; MODELs 156, 159, 1622,993Analog 00798;Digital 01026-17
Fischer and Porter, 50EK1000
Foxboro, M 66B-CO I/I, M 66G-OW E/I
Foxbcro N-2AO-2VI, Spec 200
GA Tech, RM-80
General ElectricERIS, GEMAC-550GEMAC-550
Hewlett Packard
Honeywell, HFM 5000-U3
INTRONIC 1A-184
Kan-an Science Co.
Motorola
Potter Brumfield, MDR
Reliance Electric Co, ISOMATE
Rochester Inst. Sys, 4400 SERIES
MCF 120VAC@15A
MCF 120VAC@15AMCF 120VAC@30A
Optical Fiber
MCF 120VAC@20A
MCF 480VAC@10A, MCF 120VAC@20A,MCF 140VDC@1OA
MCF 120VAC@30A
WCAP 7508-L
MCF 140VAC@20A, MCF 140VDC@20A
GA E-255-1333
Optical Fiber, NEDE 30284P,MCF 120VAC@20A
MCF 120VAC@30A
Optical Fiber
MCF 120VAC@30A
MCF 120VAC@30A
Optical Fiber
See GE-ERIS
MCF 120VAC@30A, 125VDC@70A
MCF 140VDC@5A, 120VAC@20AMCF 24VDC@3A, 130VAC@50AMCF 140VDC#50A, 132VAC@50A
16
Table 1. (cont.)
Manufacturer/Suppl ier Maximum Credible Fault Test and/orApplicable Topical Reports
RIS SC-326
Robertshaw 572-C2
Simmonds Precision
Struthers Dunn Inc, CX-3016 NECX-3918 NEDX-3917 NE
Technology For Energy Corp (TEC),SYSTEM 2200, TEC 156 Analog
TEC 159 Optical
TEC 980 Analog
TEC 981 Optical
Validyne, MUX MC370AD-QZ
Westinghouse 7100
Westinghouse 7300
WestinghouseNuclear Instrumentation System
Westinghouse Core Cooling-Monitor System
Westinghouse RVLIS IsolatorMODEL 2343D63G02 Opto-Coupler
Westinghouse, PSMS/PERMS
MCF 120VAC@20A
MCF 120VAC@20A
MCF 120VAC@20A
MCF 132VDC@500A, 528VAC@200UACX-3918 Qualified by Comparison withCX-3916
MCF 120VAC@20AMCF 130VAC@50A
MCF 120VAC@20A
MCF 120VAC@20A
MCF 120VAC@20A
Optical Fiber
WCAP 7824, 7819
WCAP 8892A
WCAP 7506-L, 9011, 7819
WCAP 10621
MCF 240VAC@20A, 140VDC@20A
MCF 580VAC@20A, MCF 25OVDC@20A
17
III.C.2 Procedures and Training
In general, the requirement to develop procedures ard training for safetystatus assessment and accident response with or without SPDS was addressed bylicensees and applicants in their upgrading programs for emergency operatingprocedures (NUREG-C737, Item I.C.1). These programs introduced function-oriented procedures into the control room. The basic premise of the function-oriented concept is that critical safety functions should be constantly monitoredand maintained during an emergency response. Inherent in the concept,therefore, is the delineation of tasks describing the timely and correct safetystatus assessment and accident response. Most plants do not specify in theemergency procedures which instruments to use for accident response. Someplants include notes and cautions in their procedures to limit the use ofcertain instruments, including SPDS, during certain transients and accidents.
Twenty-one units acceptably satisfied the requirement to provide procedures andtraining for safety status assessment and accident response with or withoutSPDS. They did so by (1) providing upgraded emergency operating procedures(EOPs) that contain safety status assessment tasks, (2) training operators howto use SPDS (e.g., during simulator or requalification training), (3) trainingoperators how to carry out accident responses both with and without SPDS, and(4) providing an SPDS users' manual in the control room for easy reference.
The remaining plants did not acceptably satisfy this requirement. At manyplants training deficiencies were identified during operator interviews and SPDSdemonstrations when SPDS-trained users made obvious errors and showed confusionor misunderstanding. These deficiencies were of sufficient magnitude todiminish the effectiveness of the SPDS or to increase the potential for operatorerror. For example, at one plant a primary user of the SPDS believed that acertain color code denoted that there were not enough valid inputs to ascertainthe status of a safety function. In fact, the meaning of the color code in thissystem was "critical safety function in jeopardy." The failure of users tounderstand such basic SPDS functions and operation provided primary evidence ofpoor or infrequent training. No system was found unacceptable based on theperformance or the assertions of only one user--evidence was confirmedthrough multiple interviewees/users and through a review of the details ofthe training program itself.
Deficiencies were found at a few units because the licensee did not provide anSPDS users' manual in the control room. These were plants in which interviewees/users showed some confusion concerning operation of the SPDS that could have beenresolved if an easy-to-use reference manual had been available in or near thecontrol room.
The requirement for having procedures and training for accident response bothwith and without SPDS evolved from the staff's concern that, because of theSPDS's convenience and usefulness, operators could become over-reliant on theSPDS. The SPDS is intended as an aid to operators, to be used ir addition toexisting control room instrumentation, and should, generally, not be used inplace of existing instrumentation. An excepticn is when the SPDS displaysprocessed information that is not available elsewhere -- in any case,operators should not take action based on the SPDS alone.
18
III.D. SELECTIONl OF INFORMATION FOR DISPLAY
There is a wide range of useful information that canbe provided by various SPDS. This information isreflected in such staff documents as VUREG-Ob9N, NUREG-0835, and Regulatory Guide 1.97. Prompt implementationof an SPDS can provide an important contribution to plantsafety. The selection of specific information that shouldbe provided for a particular plant shall be based onengineering judgment of individual plant licensees, takinginto account the importance of prompt implementation(NUREG-0737, Supplement 1, Section 4.1.d.)
This requirement includes two essential elements:
o selection of information for displayo prompt implementation.
III.D.1 Selection of Information for Display
As indicated in Supplement 1 to NUREG-0737, licensees should define the contentof SPDS displays. Two restrictions to this general principle were applied:(1) the minimum acceptable set of information must be sufficient to representthe status of plant safety functions (this item is discussed in detail inSection III.F below), and (2) the information set must not be so large thatmeaningfulness, accessibility, or other human factors are negatively affected.
Most plants acceptably satisfied this requirement by providing evidence thatthe design of the content of SPDS displays was reasonable, systematic, andbased on credible analyses. Typically, acceptable programs included thefollowing elements:
o a definition of system requirements and the needs of defined users
o coordination with tasks identified in the systems/task analysisperformed during the development of upgraded EOPs and/or performanceof the detailed control room design review (DCRDR)
0 consideration of any new instrumentation needs identified during the
implementation of Regulatory Guide 1.97
o coordination with the content of training programs
o consideration of user preferences.
Seventeen SPDS designs were judged unacceptable because of the information that.was selected for display. The most common deficiency was omissions in theinformation set, i.e., insufficient information to adequately represent plantsafety status (see III.F below for further details). A few suffered from theopposite problem--information overload. These latter systems provided toomuch information in relation to the presentation format, e.g., too manyvariables on a single primary display led to readability problems, or too many"pages" of information with a poorly designed access system caused operators tobecome "lost" in a maze of irrelevant displays.
19
The basic intent that underlies this requirement is that licensees are bestqualified to judge what critical information needs to be gathered together intothe concise display called SPDS. However, the staff defined the basic plantsafety functions that should be represented in a minimally effective SPDS.
III.D.2 Prompt Implementation
Thus far, the staff has not rejected any reasonable implementation schedule forSPDS. In order to allow licensees to implement promptly, the staff's reviewand approval process was not placed in the critical path. Unless requested todo so by the licensee, the staff does not review and approve an SPDS prior toits implementation. The staff has given as much early guidance as possible tolicensees, but the SPDS review is generally a post-implementation evaluation.The staff has also attempted to expedite the implementation process by relaxingsome of its earlier positions on SPDS. For example, the requirement for Class1E qualification or a Class 1E backup was deleted in favor of simply requiringa highly reliable system. Also, the staff's review regarding selection ofparameters was tempered by the consideration that the staff would not requireadditional information that would necessitate the installation of new sensorsand instrumentation loops, but rather would limit its requirements to existinginstrumentation. In these and other ways, the staff has tried to accommodatelicensees in the prompt implementation of SPDS.
Although no plant has specifically been cited for delays in implementation, therecord of the industry is not good on this point. By the staff's estimate,approximately 75 percent of all plants still do not have a fully operationalSPDS in their control rooms, more than 5 years after the issuance of GenericLetter 82-33 which called for prompt implementation of SPDS.
III.E HUMAN FACTORS AND SPDS DISPLAYS
The SPDS display shall be designed to incorporate acceptedhuman factors principles so that the displayed informationcan be readily perceived and comprehended by SPDS users(NUREG-0737, Supplement 1, Section 4.1.e).
This requirement is rooted in the human factors problems that contributed tothe accident at TMI-2. The staff, through this requirement emphasized the needto incorporate good human factors principles in the design of equipment ratherthan attempting to backfit the principles in a superficial way. Properlydesigned systems incorporated the needs and limitations of users into thedesign from the very start of the design process. This resulted in systems thatdo the job, are easy to use and understand, do not cause confusion, frustration,or errors, and that users can rely on when making critical decisions during anemergency.
Of the 57 units reviewed, only 12 have fully satisfied this requirement. Staffreview of this requirement included an evaluation of the design process andportions of the verification and validation (V&V) program, as well as an auditof the SPDS displays, interfaces, and environment.
20
Plants that satisfied the requirement to-incorporate human factors principlesinto their SPDS design did so by providing evidence that user needs wereidentified during the initial design phases, that specifications and acceptancecriteria for optimizing the display and control interfaces were established,that operators were involved in the design process either as members of thedesign team or as reviewers, and that the V&V program included appropriatehuman factors reviews and "man-in-the-loop" testing. The effectiveness of theseprogrammatic efforts was confirmed by the staff through an audit of the SPDS inits operating environment. Those systems that were found to have few and minorhuman factors discrepancies satisfied this requirement. Guidance and informationin this area can be found in NUREG-0700, "Guidelines for Control Room DesignReviews", (Ref. 10) and NUREG-0800, Chapter 18.2 "Standard Review Plan, SafetyParameter Display System; Appendix A-Human Factors Review Guidelines forSafety Parameter Display System," (Ref. 6).
Systems found unacceptable regarding this requirement often suffered fromdeficiencies in the SPDS interface that were not the result of random over-sight. These systems lacked proper design input from human factors specialistsand operators. Standards, specifications, and acceptance criteria for humanfactors considerations, such as system response time, operator feedback,control room standards and conventions, and operator preferences were generallynot established and, therefore, not incorporated into the design. More oftenthan not, these systems were not subjected to "man-in-the-loop" testing andoperator acceptance was poor.
Numerical magnitudes of SPDS parameters and time-history plots should be displayedto resolutions useable by the operator. One time-history plot the staffreviewed could resolve data only to a value equivalent to the height of a CRTcharacter resulting in very poor trend plot resolution. For example, reactorpressure vessel (RPV) pressure could only be resolved to 125 psi from the trendplot. Thus, one to 125 psi appeared as 125 psi, and 126 psi appeared as 250 psi.
Another case was reviewed in which the ordinate divisions of all trend plotswere established automatically by dividing the full range by three. Thus,percentage plots appeared as 0, 33.33, 66.67, 100%. An Auxiliary Feedwatersystem (AFW) flow plot appeared as 0, 3333.32, 1.67E+05, 2.50E+05 gallons perhour. Not only is it difficult to estimate volume between the major graduationsbut the two decimal point accuracy just adds useless visual "noise" to thedisplay.
III.F. MINIMUM PLANT PARAMETERS FOR DISPLAY
The minimum information to be provided shall be sufficientto provide information to plant operators about:
(i) Reactivity Control(ii) Reactor Core Cooling and Heat Removal from
the Primary System(iii) Reactor Coolant System Integrity(iv) Radioactivity Control(v) Containment Conditions
21
The specific rarameters to be displayed shall be determinedby the licensee (NUREG-0737, Supplement 1, Section 4.1.f).
Of the 57 units reviewed, 25 were found to have a sufficient set of SPDSparameters to monitor the five defined safety functions.
The tables that follow show sample variable sets for PWIRs and BWRs which havebeen found acceptable.
While the samples illustrate sets of variables which have been found acceptable,SPDS systems contain inputs from many additional variables. There have alsobeen numerous alternatives and substitute variables approved for SPDS systems.Staff evaluations of the parameters selected for SPDS systems have beenconducted on a plant-specific basis, and take into consideration plantdesign, Emergency Operating Procedures (EOPs), Emergency Plan ImplementingProcedures (EPIPs), and status of NRC approval of R.G. 1.97 variables.
Examples are provided below for some of the more frequently approvedalternatives to the sample variables.
Pressurized Water Reactors
Hot leg temperature (T-hot) is included in Table 2 as an acceptable parameterbecause, when combined with other variables, it provides an indication of theviability of natural circulation. Other variables that acceptably satisfy thesame functional requirement are: loop delta temperature, core exit temperatureand T-average.
Emergency core cooling system (ECCS) recirculation flow (e.g., residual heatremoval (RHR) or decay heat removal (DHR) system flow) is desirable as anindication of removal of heat from the primary coolant system and containment.Where RHR (DHR) flow was not available, combinations of the following para-meters have been approved: RHR (DHR) pump run status, delta T across RHR (DHR)heat exchangers, delta T across service water systems supplying the RHR heatexchangers, and RHR (DHR) service water system flow. The combination must beadequate to monitor, with a degree of confidence, the adequacy of heat removalfrom the primary system when the steam generators are not available for thispurpose.
Containment sump level is a desirable indicator for the onset of a coolantsystem leak or break. In the absence of sump level, parameters such as thefollowing have been approved: sump high level alarm, sump pump run time, sumppump flow totalizer, sump pump run status. in order to be satisfactory, thetypes of substitutes listed should have an alarm function on the top leveldisplay (e.g., excessive sump pump run time).
22
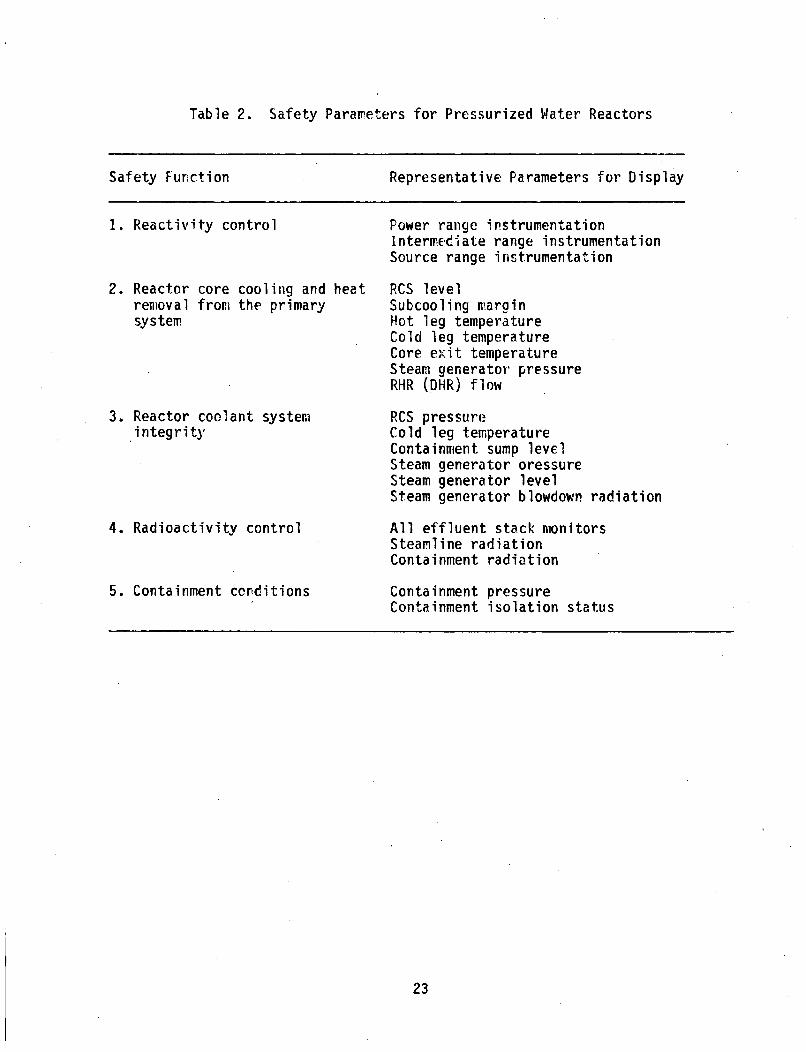
Table 2. Safety Parameters for Pressurized Water Reactors
Safety Function Representative Parameters for Display
1. Reactivity control
2. Reactor core cooling and heatremoval from the primarysystem
3. Reactor coolant systemintegrity
4. Radioactivity control
5. Containment conditions
Power range instrumentationIntermediate range instrumentationSource range instrumentation
RCS levelSubcooling marginHot leg temperatureCold leg temperatureCore exit temperatureSteam generator pressureRHR (DHR) flow
RCS pressureCold leg temperatureContainment sump levelSteam generator oressureSteam generator levelSteam generator blowdown radiation
All effluent stack monitorsSteamline radiationContainment radiation
Containment pressureContainment isolation status
23
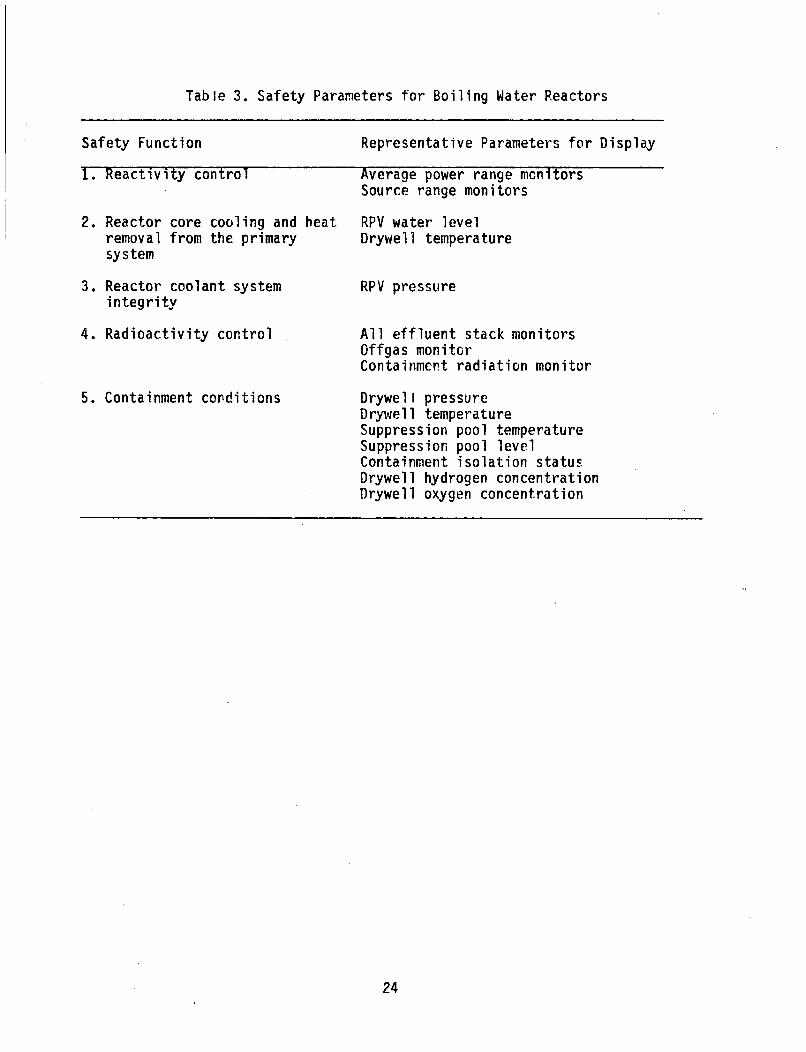
Table 3. Safety Parameters for Boiling Water Reactors
Safety Function Representative Parameters for Display
1. Reactivity control
2. Reactor core cooling and heatremoval from the primarysystem
3. Reactor coolant systemintegrity
4. Radioactivity control
5. Containment conditions
Average power range monitorsSource range monitors
RPV water levelDrywell temperature
RPV pressure
All effluent stack monitorsOffgas monitorContainment radiation monitor
Drywell pressureDrywell temperatureSuppression pool temperatureSuppression pool levelContainment isolation statusDrywell hydrogen concentrationDrywell oxygen concentration
24
The radioactivity control safety function of SPDS should include all majormonitored effluent pathways points (stacks and vents) which are potentialrelease points for fuel gap activity. Separate ventilation exhausts for areassuch as hot machine shops and radwaste need not be included. Computed releaserates (Ci/sec, UCi/sec, etc.) are the desirable SPDS top level variable, butrelease concentrations and raw monitor readings (CPM, MR/HR, etc.) areacceptable (i.e., not using a flow rate input).
Because the main steam line (or steam generator) radiation monitors on PWRsare usually located upstream of the main steam isolation valves (MSIVS), theycan be used both to assess radioactivity within the secondary system when theMSIVs are closed, and to monitor releases to the environment through theatmospheric dump and safety valves. In a few cases main steam line monitoringwas not available. In those cases the staff accepted less preferred methodsof satisfying this aspect of the radioactivity control sefety function.
Containment hydrogen concentration is also a desirable parameter for SPDS.However, in the rare instances where NRC has previously approved an off-linehydrogen monitoring system in a safety evaluation report (SER) under RegulatoryGuide 1.97 review, the SPDS reviewers have found these systems acceptable forSPDS use.
Boiling Water Reactors
Guidance for the input of radioactive material effluent points are essentiallythe same for BWRs as those discussed above for PWRs. BWRs that have incorporateda secondary containmert control guideline in their EOPs frequently use severalreactor building area radiation monitors (ARMs) and process radiation monitors(PRMs) as inputs to the SPDS top level displays. These inputs provide earlyindication of problems outside the drywell (containment).
Because BWR safety relief valves (SRVs) exit the main steam lines upstream ofthe MSIVs and the MSL radiation monitors, and because they discharge to thesuppression pool or torus, BWR MSL radiation moritors are a desirable, but notmandatory, input to SPDS.
Drywell (containment) hydrogen and oxygen concentrations are both desirableinputs to the SPDS. However, with most BWR drywells now being rendered inertwith nitrogen, oxygen concentration becomes the more important parameter.lherefore, in some cases, BWRs v:ith inert drywells are not required to usehydrogen concentration as an input to SPDS, but are required to use oxygenconcentration.
A close review of Tables 2 and 3 reveals that intermediate range nuclearinstrumentation (NIs) is listed for PWRs, but not for BWRs. A staff survey oflicensee computer systems input, showed that 61 percent of the reactor sites hadnot included intermediate range instrumentatior on their computer systems. Theintermediate range parameter is desirable, but the difficulty of programming therarge switch position input to create a meaningful parameter overrides the bene-fit of using the intermediate range. Only 2 or 3 reactor sites have a computersystem which has been programmed to make real use of intermediate range NI data.
25
PWRs and BWRs
One desirable method for monitoring containment or drywell isolation valvestatus is to employ an algorithm which uses both the isolation demand signalsand the valve position indications. This allows a rapid assessment ofboth the demand for an isolation and the successful completion of valvere-alignment. For some SPDS systems, where only the isolation demand signalshave been used, NRC has approvcd the systemr it containment isolation valveposition is readily available to the SPDS operator on a nearby control board.The use of control board indication to supplement SPDS in this case has onlybeen approved where the control toard display was in a the direct field of viewof the SPDS operator, was confined to one area of the control board, and wherestatus could be determined at a glance. Some licensees have rewired isolationstatus matrices to make all of the status lights (including spare tiles)operate together (e.g., all lighted) upon a successful isolation, therebyproviding the necessary visual conciseness.
The sample parameter list shows only nuclear instrument (NI) computer pointsunder the reactivity control safety function. Although some licensees haveused only NIls in their reactivity control alcerithms, most have used otherinputs such as scram (or trip) breaker position, reactor protection system(RPS) trip status, rodposition indication, and coolant boration level inaddition to the NIs, to create an algorithm which serves as both an ATWSindicator and a loss of shutdown margin indicator. Only NI inputs arerequired, but the greater sophistication of using additional inputs is adesirable enhancement.
There have been a few other plant-specific approvals of acceptable substitutesand omissions of parameters, but the examples provided above cover the mostcommon cases.
The staff has found that the SPDS parameter selection was inadequate at 29units. The most common reason was the omission of variables representing theheat removal, radioactivity control, and containment conditions safety functions,e.g. containment isolation status, radiation variables, containment hydrogen andoxygen concentration, and RHR (DHR) flow.
Sections III.F.1 and III.F.2 below provide a summary of the rationale used bythe staff it, rast reviews to determine what variables constituted a sufficientset of SPDS paraMeters. The variables are described in ta6ular form in Tables 2and 3. As the basis to determine what set of SPDs parameters were adequate,the staff considered the emergency procedures guidance developed by owners'groups and vendors, as well as other industry guidance documents, such as"Guidelines for an Effective Safety Parameter Display System ImplementationProgram" (Ref. 11) and NSAC/21, "Fundamental Safety Parameter Set for BoilingWater Reactors" (Ref. 12).
iII.F.l Acceptable Parameters for PWRs
III.F.l.a. Reactivity Control
The rate of change in neutron production (neutron flux) is a fundamentalneutronics parameter for assessing the status of plant reactivity control.
Neutron flux can be directly monitored by control roor instrumentation for theentire range (0-].00%+) of reactor power. In a PWR, this range is typicallyrepresented with three monitors: the source range monitor, the intermediaterange monitor, and the power range monitor.
Other parameters (e.g., rcd-in position indicators, reactor trip indicators,borononeters) may provide useful information; however, they are less directindicators of the overall status of the reactivity control function in thatthey may provide information that is inconclusive or possibly misleading.
III.F.l.b. Core Cooling and Heat Removal
There is no one measured parameter that directly indicates the status of thecore cooling and heat rerc:val safety function. Instead, several indicatorsare cited which when used in conjunction, do provide a strong inference of thestatus of core cooling removal for the broad spectrum of scenarios and conditions.
The first of these parameters is subcooling. During subcooled heat removal,this variable provides a direct verification of the viability of core coolingas well as some quantification of the core cooling n-argin. Subcooling is usedin the emergency guidelines as a key criterion to determine the status of thecore cooling function. RCS level is an indicator of primary system inventory,a necessary heat transfer medium for core cooling and heat removal. It is usedin the guidelines to monitor for an -inadequate core cooling (ICC) condition.Core exit temperature is an important indicator because it is used to determinethe viability of the natural circulation mode of heat removal. Together withRCS pressure, core exit temperature is also an input to the subcouling monitcr.
Core exit temperature is a key parameter used in emergency guidelines to monitortor the Prset of ICC conditions. Hot leq temperature and cold leg temperatureare key indicators used in determining the viability of natural circulation asa mode of heat removal. For certain subcooled conditions, these parameters mayindicate natural circulation status when core exit temperature may not. Inthis case, the hot and cold leg temperatures would be relied upon to ensureadequate natural circulation (petr PWR guidelines). Steam generator level is anindicator of the availability and proper control of the secondary system heatsink for the heat removal critical safety function. SG pressure is a keyindicator of the viability and integrity of the secondary system. Steamgenerator (or steamline) pressure is also an indicator used in emergencyguidelines to determine the viability of natural circulation as a mode of heatremoval (not applicable to combustion engineering (CE) plants). RHR (DHR) flowis a key indicator to determine the viability of the heat removal system usedwhen the secordary system is not the principal heat removing system (i.e., largeLOCA, ECCS; normal shutdown RHR). Other parameters may be considered, such asRCS average temperature and feedwater flow. These parameters, however, are notconsidered as versatile over a spectrum of plant conditions, as direct anindication of status of the function being monitored, and/or necessary sincethe paraemeters suggested above provide the same rapid functional information.
27
III.F.1.c. PCS Integrity
Perhaps the single most informative parameter to be monitored in a PWR is RCSpressure. Its RCS integrity applications are: (1) it is a principal indicatorof RCS integrity, and (2) it is a key parameter used for brittle fractureconsiderations. In conjunction with RCS pressure, cold leg temperature is alsoa key parameter for brittle fracture considerations. Containment sump level isa key indicator to identify a LOCA-type breach of RCS integrity, particularlyfor smaller leaks during which RCS pressure may not be changing. It also is anindicator of the viability of the ECCS recirculation mode of heat removal.Steam generator status (some combination of pressure, level, radiation) is akey (and usually the most rapid) indicator of a steam generator tube ruturetype breach of RCS integrity.
Parameters contributing to this status indication are also proposed as key
monitors of other critical safety functions.
III.F.1.d. Radioactivity Control
Three variables are generally considered acceptable for the monitoring cf radio-activity control for SPDS: stack monitors, steamline monitors, and containmentmonitors. These three monitors allow a rapid assessment of radiation statusfor the most likely radioactive release paths.
For PWRs, radiation can be released directly to the atmosphere through twopaths. One is through stacks, which are monitored by stack monitors, ard theother is through the mair steam safety valves, which is monitored by the steamline monitor. The stack monitors are normally used during power operation tomeasure fission products (such as iodine, cesium and the noble gases), whichmay be vented to the atmosphere. These monitors will also measure the radia-tion released to the atmosphere during an accident if the containment is notisolated.
The steam line monitor also measures radiation releases to the atmosphere whenthe main steam safety valves are open during plant transients and on turbinetrip. The steam line monitor is also important in measuring the radioactivityon the secondary side during a steam generator tube rupture if it is locatedupstream of the atmospheric dump valves and safety valves.
The containment monitor is essential for measuring the radioactivity in thecontainment atmosphere, especially when the containment is isolated followingan accident. If for any reason containment integrity is breached, an estimateof the offsite doses can be made based on containment radiation readings. Themonitor can also provide an indicator of the amount of fuel damage to thereactor core.
Other available radiation monitors may be used but are not considered essentialto SFDS. These secondary considerations include vital control area monitors,such as the control room, to which access may be necessary after an accident.Monitoring primary coolant radioactivity levels is presently performed bysampling and analysis in the sampling room. The continuous activity monitors
28
presently available are of limited value because of their isolation on contain-ment isolation signal. Although the post-accident sampling system eventuallyprovides a representative sample for evaluation, direct, continuous monitoringis not presently part of the SPDS design. Such a new PWR design requirementis considered outside the scope of the current SPDS review.
III.F.l.e. Containment Conditions
The following three key parameters should be monitored by the SPDS to provide arapid assessment of containment conditions:
U Containment pressure,° Containment isolation, ando Containment hydrogen concentration.
Containment pressure is a direct indication that containment integrity may bethreatened by overpressurization. Also, as the containment pressure increases,it provides the driving force that can cause the containment environment toescape to the atmosphere through leaks in the containment structure.
For the more likely accident scenarios that cause the containment pressure toincrease, the containment environment is at saturated conditions. hence, ifthe containment pressure is known, the containment temperature can be determined:therefore, it would not be necessary to measure containment temperature. Forthie few less probable accident scenarios in which the containment pressureincreases but the containment environment is superheated, the superheatedconditions only exist until the containment sprays are activated (shortly afterthe start of the accident). Because of the short period during the containmentenvironment is superheated, there is little need to know the amount of superheatin the containrient environment by monitoring the containment temperature. Equallyimportant, generic emergency technical guidelines do not require operator actionsbased upon a rapid assessment of containment superheating.
A primary function of the containment is to prevent release of radioactive gasesand particulates to the environment. By monitoring the demand signal and actualstatus of all isolation valves, there is assurance that when demanded, the knownprocess systems pathways penetrating containment have been secured. Also, bymonitoring the status of all isolation valves, the containment purge and/or ventsystem's supply and exhaust line valves w ill also be monitored. Hence, a separatedisplay of the status of these valves on the SPDS is not a requirement.
Containment hydrogen concentration is a key parameter to monitor forcontainment combustible gas control. For some accident scenarios, hydrogen canbe produced and released to the containment. Combustion of large amounts ofsuch hydrogen has the potential for causing the containment structure to fail.The monitoring of the oxygen concentration is not necessary for large drycoiitainments since these containments have an oxygen-rich atmosphere duringnormal operations.
29
III.F.2 Acceptable Parameters for BWRs
III.F.2.a. Reactivity Control
The rate of change in neutron production (neutron flux) is a fundamentalneutronics parameter for monitoring the status of the plant reactivity control.The average power range monitors (APRMs) and source source range monitors(SRMs) represent the principal SPDS neutron flux indicators for reactivitycontrol. APRMs calculate the neutron flux and provide a single power levelrepresenting the average value for all core regions. The plant TechnicalSpecifications require the APRM to be operable during all modes of operatiorexcept cold shutdown. SRMs are necessary to monitor the reactivity statusduring shutdown and startup.
Other parameters considered for reactivity control were control rod positionor control rod status lights ("all in"). Control rod position indication isuseful but of limited value since an indication of partial insertion wculdleave the power level indeterminate. For some plants, identification of thecontrol rod insertion level is an involved procedure requiring the use of acomputer console to call up rod bank positions. One specific exception tothis is an SPDS which incorporates a scram event status target light on theSPDS display. This was reviewed and accepted by the staff as a substitute forthe SRMs based on the condition that the scram status is continuously monitoredand receives input from the SRMs.
Boiling water reactors presently use a standby liquid control system (SLCS) tcinject boron into the reactor coolant system. Its purpose is to shut down thereactor and maintain shutdown in the event the control rod drive system isinoperable. Unlike PWRs, BWRs do not contain boron under normal operatingconditions, and boronometers are not part of the BWR design. The injection ofboron would be sufficiently identified through the APRM instrumentation alreadypart of the SPDS. Since boronometer instrumentation is not part of the BWRdesign, we consider such a new design requirement to be outside the scope ofSPDS reviews.
III.F.2.b. Core Cooling and Heat Removal
The primary parameter for indicating of core cooling is reactor pressurevessel water level. General Electric (GE) analyses show that it is unlikelythat fuel damage will occur as long as the core is two-thirds covered. Also,the Emergency Procedure Guidelines (EPG) are keyed to important operatoractions at various water levels. A knowledge of total core flow, althoughuseful information, is not considered an essential parameter for a rapidassessment of core cooling and heat renroval safety function since an adequatewater level is sufficient for this purpose. Also, the EPGs do not address coreflow as a key indicator, which is consistent with this conclusion.
Heat removal monitoring under conditions other than emergency conditions(e.g., shutdown cooling) is provided by variables associated with the shutdowncooling mode of the residual heat removal system (RHR). Also, for containmentcooling and low pressure coolant injection (LPCI) modes of the RHR, water iscirculated from the suppression pool through the RHR heat exchangers to the spray
headers and the reactor pressure vessel back to the suppression pool. Since thesuppression pool provides a heat sink when the main condenser is isolated, thesuppression pool temperatures and water level should be monitored to indicatet-e status of heat removal capability.
Consideration was aiven to the status of the core spray systetil flow as aparameter for the heat removal safety function. Either the low pressure spraysystem or, high pressure spray system are capable of automatically providingadequate core cooling to prevent fuel damage. However, since the EPGs havekeyed operator actions to vessel water level (such actions as verification ofsystem actuation), it is water level that still remains the essential corecooling indicator. Although ECCS injection status is important as follow-upverification of a response to a rapid initial determination of inadequate waterlevel, the first assessment of a potential core cooling problem through waterlevel serves the purpose of SPDS.
IIi.F.2.c. Pressure Vessel Integrity
Reactor pressure vessel pressure is a fundamental parameter for monitoringreactor coolant system integrity since a sudden decrease could be indicative ofa breach of the coolant system. Increasing reactor pressure could indicate aloss of adequate heat removal, and a subsequent challenge to RCS integrity.(Drywell Pressure is considered of secondary interest relative to vesselintegrity: an increase in drywell pressure results from a coolant system break.However, since drywell pressure is a fundamental parameter for containmentintegrity, it was included as part of the SPDS.)
III.F.2.d. Radioactivity Cortrol
Three radioactivity monitors are considered essential for the radioactivitycontrol safety function. The station vent stack monitor is important since itmeasures noble gas radiation and allows for decay of the short-lived nitrogen16 isotope. The vent stack release rate is also an important parameter used inthe generic EPCs. A containment activity monitor is essential since it providesthe status under containment isolation conditions (station vent stack monitor isunavailable). An off-gas post-treatment effluent monitor also measures noblegas activity and is considered essential if it represents a separate effluentpoint from the station vent stack monitor. Like the station vent stack monitor,it is not continuously available following containment isolation.
Other useful monitors may be proposed but are riot considered essential forSPDS. The monitors selected should measure delayed activity to avoid N-16interference (7-sec half life). The performance of ionization chambers makesthem least preferred for this application; therefore, the HVAC (exhaust)monitors are not considered essential for SPDS. The main steam line monitor isa gamma ion chamber which measures N-16 and is riot considered essential forSPDS. The standby gas treatment monitor, located between the HVAC monitors endthe plant stack vent, is considered a secondary parameter (riot essential forSPDS). Monitoring the radioactivity reator vessel water level is presentlyperformed by sampline frorp the recirculatior Fystem loops and analysis in thesample room. The continuous sampling system activity monitors presently usedare not usetul following isolation. Although the post-accident sampling systemeventually provides a representative sample for evaluation, direct, continuousmonitoring is not presently part of the SPDS design. Such a new BWR designrequirement is considered outside the scope of the current SPDF review.
31
III.F.2.e. Containment Conditions
Several essential parameters are fundamental to the containment conditionssafety function. Drywell pressure is considered a primary variable for statusindication since a rise in drywell pressure eventually results in a reactortrip and is the primary threat to containment integrity. Other primaryvariables related to containtment integrity are monitored to determine thestatus of the suppression pool heat absorption capability and containmentenvironmental conditions. These are drywell temperature, suppression pooltemperature, suppression pool water level, and containment temnperature (MarkIII only). In addition, hydrogen* and oxygen monitors should be included onthe SPDS to ronitor the potential for hydrogen deflagration. Containmentisolation valve status is also a primary indicator of a potential release path,provides necessary assurance that these paths are closed, and is thereforeconsidered essential for SPDS parameter display.
IV. DEFINITIONI OF AN OPERATIONAL SPDS
In the staff's past reviews, controversy has occasionally a:isen over the staff'sinterpretation of orders or license conditions that require the licensee orapplicant to have a fully operational/operable/operating/functional SPDS in-stalled in the control room by a certain, negotiated date. Although differentterms were used to define the concept of operability, the staff's intEnt is thatthe control room be provided with a safety parameter display as required bySupplement 1 to NUREG-0737. The staff has considered an SPDS operational, if itis described as follows:
" Has been fully tested, installed, accepted, and turned over to plantoperations for use.
o Provided the defined function of SPDS, i.e., display the minimuminformation sufficient to allow operators to assess plant safety status;specifically, display sufficient information to monitor the five safetyfunctions defined in Supplement 1 to NUREG-0737.
" Provided valid, reliable information in a continuous display.
" Functions as a system that includes clearly written procedures for
its use and operators that have been fully trained to operate andinterpret its displays.
The staff discovered several SPDSs that had been declared operational, butwere in fact, so unreliable that operators would nut or could not use them.Generally, these systems were not fully tested and were undergoing significantde-bugging and modification. These systems also exhibited chronic system-wideor functional failures, often without adequate warning to alert operators thatthe SPDS displays were invalid, inaccurate, or outdated. These problems werecompounded by lack of adequate operator training regarding SPDS.
* not necessary for inerted containments
32
The staff's practice to determine whether ar SPDS is operational has been that,if operators cannot routinely use the SPDS to determine the status of all fivesafety functions, for whatever reason, it is not operational. For example, ifthere is not enough valid information being displayed (as defined by thelicensee's list of approved SPDS parameters) to allow operators to assess oneor more of the safety functions (as defined in Supplement 1 to NUREG-0737,Section 4.1.f), the SPDS is not operational.
Unreliable hardware and software, and lack of adequate training are commonreasons that SPDSs do not function properly even after being declared operational.The staff practice generally has not challenged licensees' claims that theirSPDS is operational unless the SPDS has chronic reliability problems, the opera-tors are poorly trained or not trained at all, and the SPDS is providing invalidinformation for significant periods of time (i.e., lornger than necessary fornormal maintenance or software programming work orders to be executed).
In summary, the staff finds acceptable an SPDS that fully provides its requiredfunction as evidenced by the ability of operators to determine the status of allfive safety functions identified in Supplement 1 to NUREG-0737.
V. SUMMARY
The staff has provided examples of SPDS features and characteristics thatacceptably satisfy the requirements for an SPDS. Definitions, assumptions,and general prirciples that are basic to staff practice during evaluations ofSPDS were also provided. This discussion should clarify some of the confusionthat surrounds implementation of the requirements for the SPDS, and provide acommon conceptual framework for the post-implementation reviews, audits, andinspections that lie ahead. The SPDS is an important initiative in theindustry's effort to improve emergency response. The purpose of this report isto communicate to the industry acceptable ways of implementing the SPDS require-ments so that deficient systems may be improved as necessary, that systems stillunder development may be optimized, and that the regulatory review process maybe streamlined by providing licensees with sufficient information to forewarnthem of likely problem areas.
33
REFERENCES
1. U.S. Nuclear Regulatory Commission, "NRC Action Plan Developed as a Resultof the TMI-2 Accident," NUREG-0660, Vols. I and 2, May 1980.
2. U.S. Nuclear Regulatory Commission, "Clarification of TMI Action PlanRequirements," NUREG-0737, November 1980.
3. U.S. Nuclear Regulatory Commission, "Functional Criteria for EmergencyResponse Facilities," NUREG-0696, December 1980.
4. U.S. Nuclear Regulatory Commission, Human Factors Acceptance Criteria forthe Safety Parameter Display System," NUREG-0835 (Draft Report forComment), October 1981.
5. U.S. Nuclear Regulatory Commission, "Clarification of TMI Action PlanRequirements, Requirements for Emergency Response Capability," NUREG-0737Supplement 1, December 1982.
6. U.S. Nuclear Regulatory Commission, "Standard Review Plan, Chapter 18.2Safety Parameter Display System; Appendix A - Human Factors ReviewGuidelines for the Safety Parameter Display System," NUREG-0800, December1984.
7. U.S. Nuclear Regulatory Commission, "Progress Reviews of Six SafetyParameter Display Systems," NUREG/CR-4797, August 1986.
8. U.S. Nuclear Regulatory Commissiorn, "Safety Parameter Display SystemMalfunctions," IE Information Notice No. 86-10, February 1986.
9. Nuclear Safety Analysis Center, "Verification and Validation for SafetyParameter Display Systems," NSAC/39, December 1981.
10. U.S. Nuclear Regulatory Commission, "Guidelines for Control Room DesignReviews," NUREG-C700, September 1981.
11. Institute for Nuclear Power Operations, "Guidelines for an Effective SPDSImplementation Program," NUTAC, January 1983.
12. Nuclear Safety Analysis Center, "Fundamental Safety Parameter Set forEciling Water Reactors," NSAC/21, December 1980.
34
BIBLIOGRAPHY
IN 86-I1
NSAC/8
NSAC/1O
NSAC/21
NSAC/39
NSAC/55
NUREG-0585
NUREG-0660
NUREG-0696
NUREG-0737
NUREG-0737
NUREG-0800
NUREG-0814
NUREG/CR-4797
EPRI NP-2110
Nuclear Regulatory Commission, IF Information Notice Ne. 86-10:Safety Parameter Display System Malfunctions, February 1986.
Nuclear Safcty Analysis Center, Nuclear Plant Safety ParameterEvaluation by Event Tree Analysis, October 1980.
Nuclear Safety Analysis Center, Parameter Set for a NuclearPlant Safety Console, November 1980.
Nuclear Safety Analysis Center, Fundamental Safety ParameterSet for Boiling Water Reactors, December 1980.
Nuclear Safety Analysis Center, Verification and Validation forSafety Parameter Display Systems, December 1981.
Nuclear Safety Analysis Center, Safety Parameter Display Systemfor the Yankee Atomic Electric Company, August 1982.
Nuclear Regualtory Commission, TMI-2 Lessons L.earned Task ForceFinal Report, October 1979.
Nuclear Regulatory Commission, Action Plan Developed as a Resultof the TMI-2 Accident, May 1980.
Nuclear Regulatory Commission, Functional Criteria for EmergencyResponse Facilities, December 1980.
Nuclear Regulatory Commission, Clarification of TMI Action PlanRequirements, November 1980.
Nuclear Regulatory Commission, Supplement 1, Clarification of TMIAction Plan Requirements, Requirements for Emergency ResponseCapability, December 1982.
Nuclear Regulatory Commission, Standard Review Plan,. Chapter 18.2Safety Parameter Display System; Appendix A - Fuman FactorsReview Guidelines for the Safety Parameter Display'System (DraftNUREG-0835), November 1984.
Nuclear Regulatory Commission, Methodology for Evaluation ofErmergency Response Facilities (Draft for Comment. August 1981.
Nuclear Regulatory Commission, Progress Reviews of Six SafetyParameter Display Systems, August 1986.
Electric Power Research Institute, On-line Power Plant SignalValidation TechniquE Utilizing Parity-Space Representation andAnalytic Redundancy, November 1981.
35
EPRI
EPRI
NP-2239
iP-4566
EPRI NP-5066M
EPRI NP-3701
GA E-255-1333
GE NEDE-30284-P
WCAP-7506-L
WCAP-7508-L
WCAP-7819, Rev. I
WCAP-7819, Rev. 1-A
WCAP-7824
WCAP-8892A
WCAP-9011
WCAP-10621
Electric Power Research Institute, Evaluation of SafetyParameter Display Concepts, February 1982.
Electric Power Research Institute, Validation andIntegration of Critical PWR Signals for Safety ParameterDisplay Systems, May 1986.
Electric Power Research Institute, Validation of CriticalSignals for the Safety Parameter Display System, April 1987.
Electric Power Research Institute, Computer-GeneratedDisplay System Guidelines, Volumes 1 and 2,.September 1984.
General Atomic, Test Report on Electrical Testing ofIsolation Devices, Digital Radiation Monitoring System,May 1985.
General Electric, Emergency Response Information System,November 1983.
Westinghouse, Test Report, Nuclear Instrumentation SystemIsolation Amplifier, April 1975.
This document is rot publicly available because it containsproprietary information.
Westinghcuse, Topical Report, Test Report on IsolationAmplifiers, May 1975.
This document is not publicly available because it containsproprietary information.
Westinghouse, Test Report, Nuclear Instrumentation SystemIsolation Amplifier, January 1972.
Westinghouse, Test Report, Nuclear Instrumentation SystemIsolation Amplifier, April 1975.
Westinghouse, Isolation Tests Process InstrumentationIsolation Amplifier, December 1971.
Westinghouse, Westinghouse 7300 Series Process ControlSystem Noise Tests, June 1977.
Westinighouse, Test Reports of Isolation Amplifiers, Part 1,February 1969, Part 2, October 1986.
Westinghouse, Westinghouse Thermocouple/Core Cooling MonitorSystem Test, July 1984.
36
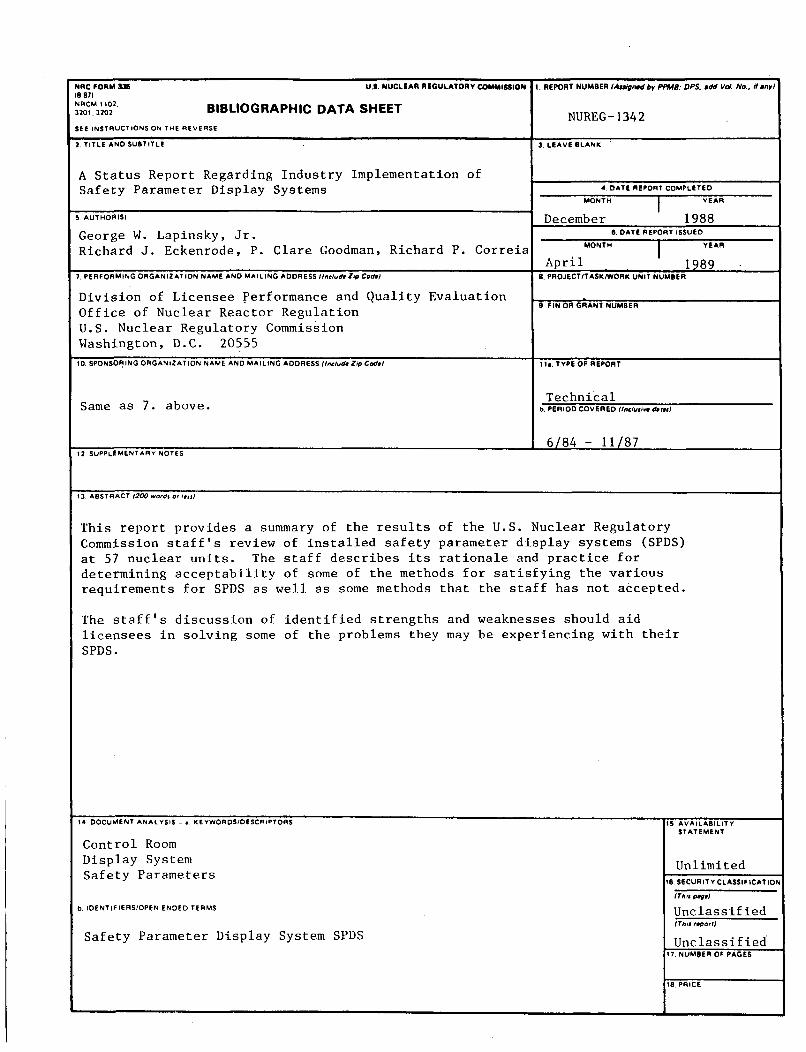
NRC FORM 335 U.S. NUCLEAR REGULATORY COMMISSION 1. REPORT NUMBER (Assigned by PPMB: DPS. add Vol. No., d anyl18-871NRCM32102. BIBLIOGRAPHIC DATA SHEET NUREG-1342
SEE INSTRUCTIONS ON THE REVERSE
2, TITLE AND SUBTITLE 3. LEAVE BLANK
A Status Report Regarding Industry Implementation ofSafety Parameter Display Systems 4 DATE REPORT COMPLETED
MONTH I YEAR
.AUTHOR SI December 1988
George W. Lapinsky, Jr. 6. DATE REPORT ISSUED
Richard J. Eckenrode, P. Clare Goodman, Richard P. Correia MONTH I YEAR
April , 19897. PERFORMING ORGANIZA1 ION NAME AND MAILING ADDRESS Ilnclude Zip Code) 8. PROJECT/TASK/WORK UNIT NUMBER
Division of Licensee Performance and Quality Evaluation _._FINORGRANTNUMBERB. PIN OR GRANT NUMBER
Office of Nuclear Reactor RegulationU.S. Nuclear Regulatory CommissionWashington, D.C. 20555
10. SPONSORING ORGANIZATION NAME AND MAILING ADDRESS (Include Zip Code) Ii.. TYPE OF REPORT
TechnicalSame as 7. above. b. PERIOD COVERED (Omlui" daa.)
6/84 - 11/8712 SUPPLEMENTARY NOTES
13. ABSTRACT (200 words or lesil
This report provides a summary of the results of the U.S. Nuclear RegulatoryCommission staff's review of installed safety parameter display systems (SPDS)at 57 nuclear units. The staff describes its rationale and practice fordetermining acceptability of some of the methods for satisfying the variousrequirements for SPDS as well as some methods that the staff has not accepted.
The staff's discussion of identified strengths and weaknesses should aidlicensees in solving some of the problems they may be experiencing with theirSPDS.
14 DOCUMENT ANALYSIS - .. KEYWORDS/DESCRIPTORS 1S. AVAILAa BILITYSTATEMENT
Control RoomDisplay System UnlimitedSafety Parameters
16 SECURITY CLASSIFICATION
ITS,. pa"e)b IDENTIF IERS/OPEN ENDED TERMS Unclassified
fTrog report)
Safety Parameter Display System SPDS Unclassified17. NUMBER OF PAGES
18 PRICE


UNITED STATESNUCLEAR REGULATORY COMMISSION
WASHINGTON, D.C. 20555
OFFICIAL BUSINESSPENALTY FOR PRIVATE USE, $300
SPECIAL FOURTH-CLASS RATEPOSTAGE b FEES PAID
USNRC
PERMIT No. G-67
Co
nCo
mC
Ioc
mm0
z
20zl0aCO
(j)