a straightforward approach -...
TRANSCRIPT

Annual Report & Financial Statements 2008
Provident Financial plc
A straightforward approach in turbulent times
Provident Financial plcColonnade Sunbridge RoadBradford BD1 2LQUnited Kingdom
Telephone: +44(0)1274 731111Fax: +44(0)1274 727300Email: [email protected]: www.providentfinancial.com
Company number 668987
Provident Financial plc Annual Report &
Financial Statements 2008
Who we areWith over two million customers, we serve more non-standard customers than anybody else in the UK. We offer home credit, credit cards and direct repayment loans to those on modest incomes.
Our historyWe’ve been providing small loans, issued in the home and collected weekly, since 1880. In 2003, we started a credit card business that now serves 404,000 customers and in 2007 we began offering larger loans repaid by direct debit.
our group highlights
What We do and hoW We do it
We are good at what we do because we have closer relationships with our customers than most other lenders. Provident agents visit our 1.8m home credit customers every week. Real Personal Finance customers have their own Personal Finance Manager with loans arranged in the home, and we speak to all our Vanquis Bank customers on the phone. This close contact gives us unparalleled insight into how to meet the credit needs of customers in the non-standard market.
Profit before tax
£128.8mEarnings per share
70.9pDividend
63.5p
+11.8%
+11.7%
(2007: 63.5p)

ContentsDIRECTORS’ REPORT: OvERvIEw
Who we are Outside flap
Our history Outside flap
Our group highlights Outside flap
What we do and how we do it Outside flap
Where we operate Inside flap
Our business at a glance Inside flap
Introduction 01
Chairman’s statement 02
Our straightforward approach – Market 04
– Funding 06
– Lending 08
– Repayments 10
DIRECTORS’ REPORT: BUSINESS REvIEw
Our strategy and key performance indicators 12
Chief Executive’s review 14
Group business review 17
Consumer Credit Division– Home credit 18
– Real Personal Finance 23
Vanquis Bank 26
Financial review 32
Risks 38
Corporate responsibility review 40
DIRECTORS’ REPORT: GOvERNaNCE
Our directors, officers and board committees 48
Governance 50
Key governance principles 56
DIRECTORS’ REmUNERaTION REPORT
Remuneration at a glance 63
Remuneration explained 64
Remuneration in detail 69
FINaNCIal STaTEmENTS
Consolidated income statement 74
Statements of recognised income and expense 74
Balance sheets 75
Cash flow statements 76
Statement of accounting policies 78
Financial and capital risk management 85
Notes to the financial statements 89
Independent auditors’ report 133
Information for shareholders 134
Our business at a glanceThe Consumer Credit Division, comprising our home credit and Real Personal Finance (RPF) businesses, is the largest part of our group. Vanquis Bank, our credit card business, was established in 2003 and is growing steadily.
Home credit and direct repayment loans
BrandVanquis Bank
Number of Vanquis Bank customers
404,000
ProductVisa credit card with lower credit limits
Average customer balance
£540
CONSUmER CREDIT DIvISION
vaNQUIS BaNK
Split of customer numbers by business
01 – Consumer Credit Division 1,762,000
02 – Vanquis Bank 404,000
Visit our report online:www.providentfinancial.com/ar2008
UK and Ireland
Where we operateOur head office is based in Bradford, where it has been for the last 129 years. Our Consumer Credit Division has branches in every major town and city in the UK, as well as in rural areas. The home credit business lends to around one in 20 households in both urban and rural locations. Vanquis Bank’s offices are located in London and Chatham.
Home credit agents
11,500Number of employees
3,400
whERE wE aRE
01
02
BrandsProvident Personal Credit Greenwood Personal Credit Real Personal Finance
Number of Consumer Credit Division customers
1.8mAverage customer satisfaction rating
95%
ProductsSmall cash loans Pre-loaded Visa cardsShopping vouchersLarger loansDirect repayment loans
Typical home credit loan
£400Average RPF loan
£1,800
Number of UK non-standard credit customers
10mNumber of home credit regions
34
Number of RPF Personal Finance Managers
58Number of home credit branches
356Cautionary statementAll statements other than statements of historical fact included in this document, including, with limitation, those regarding the financial condition, results, operations and business of Provident Financial plc and its strategy, plans and objectives and the markets in which it operates, are forward-looking statements. Such forward-looking statements which reflect the directors’ assumptions made on the basis of information available to them at this time, involve known and unknown risks, uncertainties and other important factors which could cause the actual results, performance or achievements of Provident Financial plc or the markets in which it operates to be materially different from future results, performance or achievements expressed or implied by such forward-looking statements. Nothing in the document shall be regarded as a profit forecast and its directors accept no liability to third parties in respect of this report save as would arise under English law. In particular, section 463 of the Companies Act 2006 limits the liability of the directors of Provident Financial plc so that their liability is solely to Provident Financial plc.
Paper and print specification This report has been printed on Era Silk and Naturalis Recycled. Era and Naturalis have been independently certified according to the requirements of the FSC (Forest Stewardship Council). Both paper stocks contain 50% recycled fibre and both manufacturing mills are accredited with ISO 14001.
This report is printed by an FSC and ISO 14001 certified printer using vegetable oil-based inks and an alcohol free (0% IPA) process. The carbon footprint of this publication was calculated and carbon credits bought to offset and make this publication completely Carbon Neutral. These carbon credits are invested in projects around the world that save equivalent amounts of CO2.
Designed and produced by salterbaxterPrinted by CTDPhotography by George Brooks

Annual Report & Financial Statements 2008 Provident Financial plc
01D
IRECTO
RS’ R
EPOR
T : OVER
VIEWIntroduction
Our business has performed well for over 100 years – even during the most turbulent times. This strength stems from a straightforward approach which follows four fundamental principles:
…knowing our market andadopting the right strategy,PAge 04
…creating a funding model that makes sense through good times and bad,PAge 06
…maintaining a personalapproach to lending, basedon one-to-one relationships,PAge 08
…and helping our customersmake repayments, by understanding their needs.PAge 10

02
Annual Report & Financial Statements 2008 Provident Financial plc
DIR
ECTOR
S’ REPO
RT : O
VERVIEW
Chairman’s statement
A straightforward approach delivering strong performance
Provident Financial’s straightforward approach to lending, with a strong focus on customer affordability, has proved over a long period of time to be a sound formula in addressing the UK non-standard credit market. The strength of the lending model combined with a strong funding position and good management, has seen the group make excellent progress during 2008 in pursuing its strategy to consolidate its position as the UK’s leading non-standard lender.
Summary of group resultsThe group has delivered excellent results for 2008, despite a turbulent year for the economy. Customer numbers have grown in line with our internal plans, whilst arrears and impairment levels have remained stable throughout the year. Profit before tax from continuing operations was up 11.8% to £128.8m (2007: £115.2m), including a first full year profit before tax from Vanquis Bank of £8.0m (2007: loss of £0.9m). Adjusted earnings per share were up 11.7% to 70.9p (2007: 63.5p).
Although the group’s businesses have a number of features which make them more resilient than other lenders through difficult economic conditions, this strong performance is also the result of decisive management actions. In particular, the group has adopted an increasingly cautious approach to new lending for almost two years against the backdrop of rising inflation eroding consumers’ incomes and management’s view that the economy would experience a marked deterioration. These actions have maintained credit quality as evidenced by the stable arrears profile, delivered an appropriate
balance between growth and collections capacity as well as reinforcing the group’s responsible lending policy.
The businesses continue to benefit from the ongoing investment in credit management, new marketing and distribution channels and technology. During 2008, a new core accounting platform, an enhanced agent commission scheme, and further refinements to the credit scorecard were all rolled-out across the home credit branch network. Vanquis Bank moved to larger premises and also completed a major upgrade to its IT platform, positioning the business for further growth. These major changes were completed ahead of plan and leave both businesses with a clear focus on collections and arrears management during the early part of 2009.
The final dividend is maintained at 38.1p per share (2007: 38.1p) reflecting the company’s policy set out at the time of the demerger to at least maintain a full year payment of 63.5p per share whilst moving to a target payout ratio of 80% of post-tax profit in the medium-term.
The group has a strong balance sheet and has recently strengthened its funding position through the successful extension of £213.2m of bank facilities maturing in March 2010 by 12 months. It has committed facilities of £1.1bn which provide headroom of over £250m with no scheduled maturities during 2009.
Market conditionsThe UK non-standard lending market in which Provident Financial participates became increasingly under-served during 2008. Many near-prime and non-standard unsecured lenders and credit card issuers have heavily constrained their lending or have withdrawn from this market altogether. Whilst these favourable competitive conditions present a significant opportunity for Provident Financial by increasing demand for its products, a more
John van KuffelerChairman
Annual Report & Financial Statements 2008 Provident Financial plc
03D
IRECTO
RS’ R
EPOR
T : OVER
VIEWChairman’s statement – continued
“ The businesses continue to benefit from the continuing investment in credit management, new marketing and distribution channels and technology.”
important influence on the group’s lending decisions during 2008 was the sustained pressure from price inflation on UK households with below average incomes and the broader deterioration in the economy.
The impact of inflation on essential household items such as food, fuel and utility bills over the past two years has been more pronounced for Provident Financial customers than for most UK consumers. This pressure, together with management’s view that the broader economy would experience a marked deterioration, has resulted in the group maintaining a cautious approach to lending since the middle of 2007 as evidenced by the progressive tightening of underwriting to maintain the quality of its receivables portfolios. This greater selectivity has resulted in an increased proportion of applicants being declined in both businesses. A cautious approach to growth will be maintained through 2009.
Whilst the outlook for inflation now appears to be easing, the prolonged effect of the utility price increases from 2008, combined with the certain rise in unemployment during 2009, continues to place pressure on household budgets. However, the group’s businesses have a number of inherent strengths which lessen the impact of the current environment on arrears and impairment in comparison to other lenders.
Firstly, the vast majority of the group’s customers have limited access to other forms of credit, which means that they have not typically developed significant levels of personal indebtedness. For example, only around 12% of home credit customers and a quarter of Vanquis Bank customers have mortgages. This means that these customers are better able to afford their repayments despite volatility in their income.
Secondly, the small-sum, short-term nature of the group’s home credit loans means that the vast majority of loans have been written by agents, face-to-face, within the last six months
based on an up to date knowledge of customers’ household income. That income often arises from a number of different sources which provides a degree of resilience, particularly during difficult economic times, and the weekly home collection visit ensures the agents’ knowledge is kept up to date.
Finally, Vanquis Bank, which is a central underwriter using a highly bespoke credit scorecard, rechecks its customers’ external credit data every month, even if a customer’s account is fully up to date. This allows emerging signs of credit stress to be detected early and proactively managed, including reducing undrawn credit lines where appropriate. In contrast with mainstream card issuers, Vanquis Bank also maintains sufficient call centre resource to allow it to contact all customers who fall into arrears immediately, so as to identify issues quickly and return accounts to order as soon as possible before arrears escalate.
Outlook Provident Financial continues to experience significant demand for its products from an increasingly under-served non-standard credit market. The group’s increasingly cautious approach to lending over a period of nearly two years has been fundamental to maintaining an appropriate balance between growth, credit quality and collections capacity and will continue through 2009 in order to deliver another year of high quality growth.
John van KuffelerChairman3 March 2009
Group revenue
£751.2mAverage receivables
£890.2m

04
Annual Report & Financial Statements 2008 Provident Financial plc
Market
“ I see all of my customers every week so I know what their circumstances are. This means that I can lend the amount that’s right for them.”
Debra CarterHome credit agent, Birmingham
Home credit customer satisfaction rate
95%Percentage of home credit customers who would recommend Provident to a friend
83%Year home credit business established
1880
Knowing our marketand adopting the right strategy
DIR
ECTOR
S’ REPO
RT : O
VERVIEW

Annual Report & Financial Statements 2008 Provident Financial plc
05
Make clear strategic choicesSince the demerger of our international business, we have focused solely on the UK non-standard credit market which comprises over ten million customers.
Know your marketThe agents we engage live in the communities we serve and see our customers every week. We have conducted market research with our customers over many years to make sure we understand their needs and can react quickly when those needs change or new opportunities arise.
Tailor your offer Our products are specifically designed to meet closely the needs of non-standard customers, with high levels of flexibility and personal service delivered at prices that offer good value for money and produce high levels of customer satisfaction.
Adapt to changes in your environmentWe continue to modernise our business and take the opportunities presented by the current environment to serve more customers in our target market and to recruit the very best management talent.
Use what you have learnedHaving operated in our market for 129 years, we have accumulated knowledge of a depth and clarity that has served us well under a wide range of changing conditions.
Dan Lockwood Job title: Senior Marketing Analyst, Consumer Credit Divisionexpert in: generating customer growthDan uses detailed analysis of the customer base to develop strategic marketing campaigns.
With over two million customers, Provident Financial already has more non-standard customers in the UK than any other lender. We have designed products to meet the particular needs of non-standard customers, with high levels of customer service and affordable repayments. We have been doing this since 1880 and have earned high levels of customer satisfaction.
We aim to grow from this strong position by building on our existing businesses and strengths, and by taking full advantage of changes in the market and competitive environment. And we will extend what we do to meet the needs of more of the people in our target market.
Michael HutkoJob title: Commercial Director, Vanquis Bankexpert in: planning and strategyWith over 15 years’ experience in the industry, Michael is responsible for identifying strategies for growth.
DIR
ECTOR
S’ REPO
RT : O
VERVIEW

06
Annual Report & Financial Statements 2008 Provident Financial plc
Funding
A prudent approach to funding and a flexible lending model ensure we are well placed to endure economic storms.
Headroom on committed funding facilities
£251mAverage length of home credit loan
61 weeksAmount of surplus capital
£55m
A funding model that makes sensethrough good times and bad
DIR
ECTOR
S’ REPO
RT : O
VERVIEW

Annual Report & Financial Statements 2008 Provident Financial plc
07
Devise a robust funding modelOur funding model has been designed to meet the needs of the particular type of business we are in and to provide us with secure, well-priced funding without undue fluctuation in supply or price.
Borrow long, lend shortOur funding model is an exercise in prudence. We borrow money from banks over periods of around three years on average, and lend money to customers over around a year on average. This means we can adapt our lending to customers in good time to meet any changed circumstances in the external funding environment.
Arrange headroom to cover opportunity or riskAt any time, we have arranged funds far in excess of those we require to meet our planned growth. This means we are more likely to be able to continue growing if funds become restricted for any reason or if demand for our products rises faster than we had expected. At the end of 2008, we had £251m of funds arranged in excess of our requirements.
Carry appropriate levels of capitalProvident Financial is carrying surplus capital of approximately £55m at present which provides both a margin of safety in the current difficult times and an in-built ability to expand the business at a faster rate than currently planned if the right opportunity presented itself.
Have a wide range of funding optionsIn normal times, the wider the range of sources of finance available to a company the better. In the current troubled times this is especially true. Within the Provident Financial group, Vanquis Bank has a banking licence and although we currently have no plans to raise funding through retail deposits, this is an additional option open to us. If we were to consider this option, we would analyse the costs, terms and other issues with this type of funding before deciding whether to include it within our funding mix and at what level.
In the current, volatile economic environment, how businesses fund themselves has proved to be one of the greatest discriminators between success and failure. Our prudent and straightforward approach to treasury management has meant that we have been able to continue to pursue our strategy and planned growth despite the crisis in global credit markets.
Stuart CaldwellJob title: group Treasurer and Head of Investor Relationsexpert in: fundingStuart secures the debt capital which funds the business and manages the associated market risks.
DIR
ECTOR
S’ REPO
RT : O
VERVIEW

08
Annual Report & Financial Statements 2008 Provident Financial plc
Lending
“ I know every one of my customers personally, as did my father and grandfather who both acted as agents for Provident.”
Lorraine ReillyHome credit agent, Glasgow
Typical home credit loan amount
£400Average Real Personal Finance loan amount
£1,800Percentage of women agents
71%
A personalapproach to lendingbased on one-to-one relationships
DIR
ECTOR
S’ REPO
RT : O
VERVIEW

09
Decide who you are going to lend toThrough 129 years of experience of home credit customers and over five years of data on Vanquis Bank customers, we are well placed to decide to whom we will lend – and to whom we will not lend – in our target market. We currently turn down around 60% of home credit applicants and around 80% of Vanquis Bank applicants.
Small loans over a short termEach of the group’s businesses grants small loans to customers over relatively short terms. Our home credit business grants loans of typically £400 over about a year. Real Personal Finance’s average loan is around £1,800 over an average of between two and three years. And Vanquis Bank’s average credit card balance is around £540.
Face-to-face interviews with customersHome credit customers have their loans arranged with an agent in their home and they are also visited each week by an agent. A Personal Finance Manager arranges a Real Personal Finance loan with the customer, in the customer’s home. This provides us with a much higher level of confidence than the remote loan arrangement procedures used by most other lenders.
Telephone interviews with customersWe aim to speak on the telephone with every new Vanquis Bank customer prior to activating their credit card account. This provides us with a final check against fraud before authorising use of the card and lets us see if the customer would like any other service right at the beginning of our relationship with them. We also keep up regular telephone contact with customers to make sure any issues are resolved quickly.
Backed up by credit bureau dataAll new Real Personal Finance and Vanquis Bank customers undergo a credit bureau check prior to being taken on. We then use this credit bureau data to create credit scores for customers that effectively differentiate between them, allowing us to accept or reject them and decide how much to advance at any particular time.
Steve HigginsJob title: Personal Finance Manager, Real Personal Financeexpert in: developing customer relationshipsSteve visits his customers at home to discuss and underwrite their loans.
Our home credit agents get to know each of their customers well during their weekly home visits.
No other lender takes the personal approach to lending as seriously as Provident Financial. In these days of impersonal, remote contact – often internet-based – both the group and our customers benefit from more personal, face-to-face or telephone interaction.
DIR
ECTOR
S’ REPO
RT : O
VERVIEW
Provident Financial plcAnnual Report & Financial Statements 2008

10
Annual Report & Financial Statements 2008 Provident Financial plc
Repayments
DIR
ECTOR
S’ REPO
RT : O
VERVIEW
Total number of agent visits per year
90mTypical Vanquis Bank repayment level
4.5%Vanquis Bank maximum credit limit
£2,500“ My customers know
that I’m there to help if they have any difficulties with their repayments.”
Rachel SimmsHome credit agent, Doncaster
“ The weekly payment routine helps me to budget and manage my finances.”
Nicola HarrisHome credit customer, Doncaster
Helpingcustomers makerepaymentsby understanding their needs

Annual Report & Financial Statements 2008 Provident Financial plc
11D
IRECTO
RS’ R
EPOR
T : OVER
VIEW
Weekly home visitsThe home credit service includes a weekly visit from a local agent to customers’ homes to collect repayments. This routine helps customers to keep their account in order and means they do not need to worry about not having the money in their bank account on a particular date with the consequent danger of incurring default charges.
Missing occasional repaymentsHome credit customers who are experiencing financial difficulties can miss repayments or make reduced repayments for a while at no extra cost whatsoever to them. Vanquis Bank and Real Personal Finance customers who sign up for our Repayment Option Plan can miss one repayment every six months. Allowing customers to miss occasional repayments within the terms and conditions of their credit agreement helps retain them as customers in the longer term.
Repayments tailored to customers’ circumstancesVanquis Bank sets a higher minimum repayment level of 4.5% on its standard credit card compared with most other credit card providers who set minimum repayments of 2% to 3%. This enables customers to pay off their balance more quickly than they otherwise would have done.
Flexibility of payment frequency and methodVanquis Bank customers can choose to make payments fortnightly or monthly and can pay by a variety of means: by direct debit, by cash, by cheque over the counter at a bank or post office, or by debit card over the phone or by post.
High levels of personal contactHome credit customers see their agent every week and Vanquis Bank keeps an ongoing dialogue with its customers by telephone so that any difficulties can be identified early, discussed with the customer and actions agreed.
Our approach to getting loans repaid is designed to minimise impairment and help customers at the same time. From our long experience of lending to customers in the non-standard credit market, we know that those on modest incomes have particular needs. They will want to make small, manageable repayments. They may wish to make payments weekly, fortnightly or monthly. They may find it helpful to have someone call at their home to collect their repayments. And they may occasionally want to miss repayments or make reduced repayments at no extra cost to them whatsoever. As much as we are able, we design our products to address these needs.
Anna EppsJob title: Projects & IT Coordinator, Vanquis Bankexpert in: managing IT facilities Anna is responsible for maintaining the IT systems at our Chatham call centre that enable our customers to keep in regular contact with us.
DIR
ECTOR
S’ REPO
RT : O
VERVIEW

12
DIR
ECTOR
S’ REPO
RT : B
USIN
ESS REVIEW
Annual Report & Financial Statements 2008 Provident Financial plc
Our strategy and KPIs
Growth of higher return businesses in the UK and Ireland non-standard market
• Growandmoderniseour home credit business.
• BringVanquisBankuptofulloperational scale, generating significant returns.
• Extendourproductofferings to cover more of our chosen market.
Customer numbers The number of customers that each division has a current relationship with.
Return on equity Profit after tax divided by average equity. Equity is stated after deducting the group’s pension asset (net of deferred tax), the fair value of derivative financial instruments (net of deferred tax) and the proposed final dividend.
Customer numbers up 10.2% to 2.17m (2007: 1.97m).ROE increased to 46% in 2008 (2007: 41%).• ConsumerCreditDivisioncustomergrowthof6.8%in2008,continuing
turnaround established during 2006.• Roll-outoftheFocusfieldsystemandthenewcommissionschemeinhome
credit during 2008.• IncreasedinvestmentinRealPersonalFinancewiththemarkettestrolledout
to 50 locations.• VanquisBankachievedaplannedprofitof£8.0min2008(2007:lossof£0.9m) andgrewreceivablesto£205.4m(2007:£143.1m).
• RelocationofVanquisBank’scallcentretoanewstateoftheartfacility in Chatham which will accommodate a doubling of the size of the business.
•Continuetogrowcustomersinhome credit at a rate consistent with maintaining an appropriate balance between growth, credit quality and operational capacity.
•CompletemarkettestofRealPersonalFinancein mid-2009 and determine scale and pace of further roll-out.
•ContinuetogrowVanquisBanktowardsitsmedium-term objective of 500,000 customers, receivables of £300m and a post-tax ROE of 30% whilst maintaining a cautious approach to granting credit.
Generating shareholder returns
• Generatesustainablegrowth in profits and dividends generating returns in excess of the group’s weighted average cost of capital.
Total Shareholder Return (TSR) The increase in the value of the group’s shares together with any dividend returns made to shareholders. TSR is measured over a cumulative period since demerger to a maximum cumulative period of three years.
Earnings per share Profit after tax divided by the weighted average number of shares in issue, excluding own shares held.
Dividend per share Total dividends for the year, including the interim dividend paid and the proposed final dividend, divided by the number of shares in issue, excluding own shares held.
TSR of +0.7% since demerger compared with -44.1% for the FTSE 250 over the same period.EPS up 11.7% to 70.9p (2007: 63.5p).Dividend per share maintained at 63.5p (2007: 63.5p).
• Continuethecommitmentmadeatthetimeofdemerger to at least maintain the dividend per share at 63.5p.
Secure funding and capital structure
• Maintainsufficientequityandborrowing facilities to sustain the group’s operations and fund growth over at least the next 12 months.
Gearing Borrowings(basedoncontractedratesofexchange)dividedbyequity. Equity is stated after deducting the group’s pension asset (net of deferred tax) and the fair value of derivative financial instruments (net of deferred tax) in line with the group’s banking covenants.
Borrowings headroom Total committed borrowing facilities less actual borrowings.
Gearing of 3.2 times (2007: 2.7 times) compared to the banking covenant of 6.0 times.Headroom on borrowing facilities of £251.2m as at 31 December 2008.• RegulatorycapitalcomfortablyinexcessoftheFSA’sinterimcapitalguidance.• MaintainedaFitchratingofBBB+.• Surpluscapitalofapproximately£55m.
• Aimtomaintaincommittedborrowing facilities which provide funding headroom for at least the following 12 months.
• Maintaincapitalandgearingatprudentlevels.
Acting responsibly in our relationships with customers and making a positive contribution to the communities served by the group’s businesses
• Earnhighlevelsofcustomersatisfaction.
• Investinthecommunitiesinwhich our customers and agents live and in which our staff work.
• Putinplaceasystemtomanage corporate responsibility(CR).
• Meetorexceedregulatoryrequirements on fairness and responsible lending.
• Followourvaluesinthetreatment of our stakeholders.
Customer satisfaction The percentage of customers surveyed who are satisfied with the service they have been offered.
Investment in the community The amount of money invested in support of community programmes (basedontheLondonBenchmarkingGroup’s(LBG)guidelines)anddonated for charitable purposes.
Customer satisfaction of 95% for home credit (2007: 94%) and 86% for Vanquis Bank (2007: 84%).Invested £797,000 in various programmes during 2008 to benefit the communities we serve (2007: £854,000*).• DevelopedCRgovernanceandmanagementprocessestomanagegroup-wide
CR performance.• EstablishedaresponsiblelendinggrouptoensurethattheConsumerCredit
Division and Vanquis Bank operate at, or above, the standards expected by the regulatory frameworks which relate to the responsible lending agenda.
• Followingconsultationwithourpeople,finalisedandarticulatedthecorevaluesthat underpin the Provident Financial group.
* Restatedtoexclude£126,000ofitemsnolongerincludedwithinLBGcriteria.
• Maintainorimprovecustomer satisfaction levels.
• Increasethegroup’sinvestmentin the communities we serve.
• Fullyembedthegroup’scorevaluesintothebehaviour of the organisation and our people.
Our strategy and KPIsThe group’s objective is to be the leading non-standard lender of choice in the UK and Ireland and it has developed a clear strategy to achieve this.
In order to assess performance against its strategic objectives, the group uses a number of key performance indicators (KPIs). These comprise both financial and non-financial measures. Whilst these KPIs are helpful
in measuring the group’s performance, it should be stressed that they are not exhaustive and that many additional performance measures are also used to monitor performance and progress against objectives.
The group’s strategic aims, together with the KPIs used to assess performance, are set out below:
Strategic aim Our strategy KPI and description Performance in 2008 Plans for 2009

13D
IRECTO
RS’ R
EPOR
T : BU
SINESS R
EVIEW
Annual Report & Financial Statements 2008 Provident Financial plc
Our strategy and KPIs – continued
Growth of higher return businesses in the UK and Ireland non-standard market
• Growandmoderniseour home credit business.
• BringVanquisBankuptofulloperational scale, generating significant returns.
• Extendourproductofferings to cover more of our chosen market.
Customer numbers The number of customers that each division has a current relationship with.
Return on equity Profit after tax divided by average equity. Equity is stated after deducting the group’s pension asset (net of deferred tax), the fair value of derivative financial instruments (net of deferred tax) and the proposed final dividend.
Customer numbers up 10.2% to 2.17m (2007: 1.97m).ROE increased to 46% in 2008 (2007: 41%).• ConsumerCreditDivisioncustomergrowthof6.8%in2008,continuing
turnaround established during 2006.• Roll-outoftheFocusfieldsystemandthenewcommissionschemeinhome
credit during 2008.• IncreasedinvestmentinRealPersonalFinancewiththemarkettestrolledout
to 50 locations.• VanquisBankachievedaplannedprofitof£8.0min2008(2007:lossof£0.9m) andgrewreceivablesto£205.4m(2007:£143.1m).
• RelocationofVanquisBank’scallcentretoanewstateoftheartfacility in Chatham which will accommodate a doubling of the size of the business.
•Continuetogrowcustomersinhome credit at a rate consistent with maintaining an appropriate balance between growth, credit quality and operational capacity.
•CompletemarkettestofRealPersonalFinancein mid-2009 and determine scale and pace of further roll-out.
•ContinuetogrowVanquisBanktowardsitsmedium-term objective of 500,000 customers, receivables of £300m and a post-tax ROE of 30% whilst maintaining a cautious approach to granting credit.
Generating shareholder returns
• Generatesustainablegrowth in profits and dividends generating returns in excess of the group’s weighted average cost of capital.
Total Shareholder Return (TSR) The increase in the value of the group’s shares together with any dividend returns made to shareholders. TSR is measured over a cumulative period since demerger to a maximum cumulative period of three years.
Earnings per share Profit after tax divided by the weighted average number of shares in issue, excluding own shares held.
Dividend per share Total dividends for the year, including the interim dividend paid and the proposed final dividend, divided by the number of shares in issue, excluding own shares held.
TSR of +0.7% since demerger compared with -44.1% for the FTSE 250 over the same period.EPS up 11.7% to 70.9p (2007: 63.5p).Dividend per share maintained at 63.5p (2007: 63.5p).
• Continuethecommitmentmadeatthetimeofdemerger to at least maintain the dividend per share at 63.5p.
Secure funding and capital structure
• Maintainsufficientequityandborrowing facilities to sustain the group’s operations and fund growth over at least the next 12 months.
Gearing Borrowings(basedoncontractedratesofexchange)dividedbyequity. Equity is stated after deducting the group’s pension asset (net of deferred tax) and the fair value of derivative financial instruments (net of deferred tax) in line with the group’s banking covenants.
Borrowings headroom Total committed borrowing facilities less actual borrowings.
Gearing of 3.2 times (2007: 2.7 times) compared to the banking covenant of 6.0 times.Headroom on borrowing facilities of £251.2m as at 31 December 2008.• RegulatorycapitalcomfortablyinexcessoftheFSA’sinterimcapitalguidance.• MaintainedaFitchratingofBBB+.• Surpluscapitalofapproximately£55m.
• Aimtomaintaincommittedborrowing facilities which provide funding headroom for at least the following 12 months.
• Maintaincapitalandgearingatprudentlevels.
Acting responsibly in our relationships with customers and making a positive contribution to the communities served by the group’s businesses
• Earnhighlevelsofcustomersatisfaction.
• Investinthecommunitiesinwhich our customers and agents live and in which our staff work.
• Putinplaceasystemtomanage corporate responsibility(CR).
• Meetorexceedregulatoryrequirements on fairness and responsible lending.
• Followourvaluesinthetreatment of our stakeholders.
Customer satisfaction The percentage of customers surveyed who are satisfied with the service they have been offered.
Investment in the community The amount of money invested in support of community programmes (basedontheLondonBenchmarkingGroup’s(LBG)guidelines)anddonated for charitable purposes.
Customer satisfaction of 95% for home credit (2007: 94%) and 86% for Vanquis Bank (2007: 84%).Invested £797,000 in various programmes during 2008 to benefit the communities we serve (2007: £854,000*).• DevelopedCRgovernanceandmanagementprocessestomanagegroup-wide
CR performance.• EstablishedaresponsiblelendinggrouptoensurethattheConsumerCredit
Division and Vanquis Bank operate at, or above, the standards expected by the regulatory frameworks which relate to the responsible lending agenda.
• Followingconsultationwithourpeople,finalisedandarticulatedthecorevaluesthat underpin the Provident Financial group.
* Restatedtoexclude£126,000ofitemsnolongerincludedwithinLBGcriteria.
• Maintainorimprovecustomer satisfaction levels.
• Increasethegroup’sinvestmentin the communities we serve.
• Fullyembedthegroup’scorevaluesintothebehaviour of the organisation and our people.
Strategic aim Our strategy KPI and description Performance in 2008 Plans for 2009

14
DIR
ECTOR
S’ REPO
RT : B
USIN
ESS REVIEW
Annual Report & Financial Statements 2008 Provident Financial plc
Chief Executive’s review
Peter CrookChief Executive
In the last annual report I said that although no one could know precisely where major world economic events stemming from the ‘credit crunch’ would lead, there were several key factors that should have given our stakeholders confidence that Provident Financial was unlikely to be adversely affected in 2008.
Since that time, the world economic situation has become significantly worse. We are pleased to report that as we predicted, the group has not been adversely impacted by the worsening financial situation during 2008.
It is worth reiterating why we have not been affected by these events to the same extent that other financial companies have. We adopt a straightforward approach to our business. We do not have the type of complex financial products that are difficult, even for those in the industry, to understand; rather, we lend very small amounts to ordinary people. Impairment of our loan book may be higher than those
lending in the prime credit market but it is less volatile and so easier to price for the risk it presents. We are not spread throughout the world with all the extra risks that presents; rather, we trade solely in the UK and Ireland – a market we know well, having operated in the UK since 1880. And we borrow and lend in the most prudent way – by borrowing long and lending short.
This straightforward approach, combined with effective management throughout the group, has proved to be the right formula for these turbulent times. Our results for 2008 would be good in any year but in a year which has seen unprecedented upheaval we are particularly pleased. The chart to the right shows the Total Shareholder Return (TSR) for FTSe 250 companies in 2008. You can see that Provident Financial has produced a positive TSR since demerger compared with a sharp fall in the TSR of the FTSe 250.
Of course, as the economic crisis deepens, we may not remain totally unaffected. Rising unemployment and the increased level of impairment that may follow in its wake is a particular issue for credit companies so we are actively working to ensure impairment is kept at an appropriate level.
Achieving sustainable financial growth in an unpredictable market

15D
IRECTO
RS’ R
EPOR
T : BU
SINESS R
EVIEW
Annual Report & Financial Statements 2008 Provident Financial plc
Chief Executive’s review – continued
Our core values
Fair We are fair and reasonable in our dealings with stakeholders.
Responsible We conduct our business dealings responsibly and ensure that we have a positive impact on the environment and communities we serve.
Accessible We provide our customers with access to products which meet their needs.
Straightforward We are straightforward, open and honest in all our dealings.
Progressive We anticipate and respond to the challenges of a changing world.
Total number of employees
3,400Increase in Consumer Credit Division customer numbers
6.8%
“ Our values will help us to run our business in a sustainable, responsible way, to the benefit of all our stakeholders and be a source of pride for our employees.”
Provident Financial FTSE 250
Apr 08Jan 08Nov 07Sep 07Jul 07 Jun 08 Aug 08 Oct 08 Dec 08
TSR
(rel
ativ
e to
FTS
E 25
0 re
base
d to
100
)
0
20
40
60
80
100
120

16
DIR
ECTOR
S’ REPO
RT : B
USIN
ESS REVIEW
Annual Report & Financial Statements 2008 Provident Financial plc
Our strategyOur aim is to be the leading non-standard lender of choice in the UK and Ireland, generating good returns to reward shareholders and to fund growth. At present, the best returns come from organic growth which is where our energies are being applied.
Our strategy to achieve this growth is to expand and modernise our home credit business, to scale up our credit card business to achieve significant profitability, and to develop new products in the non-standard credit market to extend our reach.
We have a prudent approach to the financial management and funding of the business.
Society quite properly expects the highest standards in every area of a company’s operation and so we have formalised and articulated the values that have underpinned our business for many years, and by which we will operate and expect to be judged. These values help drive our commitment to corporate responsibility including high levels of customer satisfaction and investment in the local communities in which our customers and agents live and our staff work.
We made good progress against our strategy in 2008.
Our home credit business continued to grow and major steps were taken to modernise the business with the introduction of new computer systems and further refinement of marketing techniques.
We increased our investment in Real Personal Finance which is extending our reach in the ten million strong non-standard credit market through its unsecured direct repayment credit products.
And we made further progress in bringing Vanquis Bank firmly into profit and up to operational scale by relocating to a new state of the art call centre in Chatham.
These are significant achievements, particularly when combined with prudent financial management and a strong commitment to corporate responsibility. A more detailed report on our progress against our strategy can be found in the reports on the individual businesses.
Our objective is to be the UK and Ireland’s leading lender in the ten million strong non-standard credit market. This means having strong market positions in each of our businesses, operating in a sustainable fashion, being a highly regarded corporate citizen, and having high customer satisfaction ratings.
Peter CrookChief executive 3 March 2009
Consumer Credit Division year end receivables
£852.1mIncrease in Vanquis Bank customer numbers
27.8%
“Our objective is to be the UK and Ireland’s leading lender in the ten million strong non-standard credit market.”
Chief Executive’s review – continued

DIR
ECTOR
S’ REPO
RT : B
USIN
ESS REVIEW
Annual Report & Financial Statements 2008 Provident Financial plc
Split of business divisions by year end receivables
Consumer Credit Division 80%01 £852.1m
Vanquis Bank 20%02 £205.4m
Group business review
Group business review
2008 2007 Change Group results £m £m £m
Consumer Credit Division 126.1 123.5 2.6
Vanquis Bank 8.0 (0.9) 8.9
Yes Car Credit (2.9) (2.9) –
Central:
– costs (5.5) (6.5) 1.0
– interest receivable 3.1 2.0 1.1
Total central (2.4) (4.5) 2.1
Profit before tax from continuing operations 128.8 115.2 13.6
01
02
17

18
DIR
ECTOR
S’ REPO
RT : B
USIN
ESS REVIEW
Annual Report & Financial Statements 2008 Provident Financial plc
Consumer Credit Division: Home credit
Consumer Credit Division
Consumer Credit Division overview
Managing DirectorChris gillespie
BrandsProvident Personal Creditgreenwood Personal CreditReal Personal Finance
Divisional strategy •Broadentheproductmix•Increasethenumber
of customers •Increasereceivables•Continuetomodernise
the business
Highlights from 2008 •6.8%increaseincustomer
numbers•Stableimpairmentat30.4%
of revenue•RealPersonalFinancemarket
test progressing well
Home creditHome credit is Provident Financial’s longest running business stretching back to the company’s foundation in 1880. It is the largest home credit business in the UK and Ireland. Every week, 11,500 local agents visit 1.8millioncustomers(around onein20UKhouseholds)toissueloans and collect repayments. Even after 129 years, the business continues to flourish and fill an important space in the UK non-standard credit market.
The business succeeds by offering simple, transparent financial services to customers on average or below-average incomes, some of whom may find it difficult to obtain or manage other forms of credit. The service is popular for very clear reasons: it’s personal, friendly and flexible, and is well-suited to the needs of its customers.
How home credit worksProvident is the UK and Ireland’s leading community-based lender operating through the Provident Personal Credit and greenwood Personal Credit brands which share a national network of over 350 administrative offices. Provident and greenwood provide small, unsecured loans, typically for sums of between £100 and £500. These are delivered to the customer’s home by self-employed agents who then call every week to collect repayments. Unlike other forms of lending, home credit includes all the costs up front. There are no extra charges whatsoever, even if a customer misses a payment. For those managing on a tight budget, it’s important to know that the amount to be repaid is fixed at the start and will never go up.
86% of our customers consider our products to offer them good value for money.
Another advantage of home credit is the part played by the agent. Agents are paid commission on what they collect, not what they lend, so they have every reason not to lend more than their customers can afford to repay. That’s good for the customer and a valuable check on impairment for the business. The agent’s weekly visit is not only convenient for the customer but acts as a useful reminder to put the money aside for the repayment too. If customers get into difficulty, they know they’ll get a sympathetic response from their agent. The home credit product is one that customers trust and positively want to use – which helps to explain why our customer satisfaction rates are consistently high. 95% of customers say they are satisfied with the Provident home credit service, and the vast majority say they would recommend Provident to family or friends.
The market and economic environmentThere are over ten million non-standard credit consumers in the UK, of which the home credit industry serves up to three million. Provident Financial has 1.8 million home credit customers.
The picture is changing, however. The tightening of lending criteria in response to the global scarcity of credit and increasing impairment has meant that mainstream lenders are not advancing credit to those at the margins of their lending models – many of whom would have been more suited to high service level, home credit lending in any case. This presents an opportunity for Provident to win back some of the customers it has lost to the mainstream lenders over recent years. As a result, combined with the changes we have made to the business, after several years of gradual decline, home credit customer numbers have started to grow: up 2.1% in 2006, 5.3% in 2007 and 6.8% in 2008.
The continuing tightening of lending criteria by mainstream credit providers is leading to a growing non-standard market in the UK and presents a growing opportunity for home credit.

19D
IRECTO
RS’ R
EPOR
T : BU
SINESS R
EVIEW
Annual Report & Financial Statements 2008 Provident Financial plc
Percentage of customers who use their loans to buy clothes
10%
Percentage of customers who use their loans to pay for family holidays
21%Home credit agents
11,500Home credit customers
1.8m
Ben, Katie and Megan play with a Christmas present
Home credit products at a glance
Product Main features
Provident Personal CreditGreenwood Personal Credit
Small cash loans arranged at the customer’s home with an agent who then calls weekly to collect repayments.
Pre-loaded Visa cards A home credit loan loaded onto a Visa card which customers can use to shop online or over the telephone.
Shopping vouchers Pre-paid vouchers which can be redeemed at a number of high street retail outlets.
Home credit strategyThe home credit business’s strategy is to deliver profitable growth through product and channel innovation, better collection performance, and new ways of working enabled by technology and people development.
Key activities in 2008PeopleAfter a significant number of new appointments to key positions in 2008, the core management team is now fully operational and working to deliver the strategy. A new people development programme was started in the first quarter of 2008 with the objective of more closely aligning the behaviour of managers with the business strategy. The programme includes leadership development, identifying and recruiting talented managers and developing their careers accordingly, pay systems that properly reward top performers, and performance reviews for all managers. The programme has proved extremely successful with significant improvements in management effectiveness and motivation.
Pricing for riskA range of factors determine how we price our products. We continually monitor our prices in relation to those of our competitors in the UK non-standard credit market to ensure we remain competitive. Over the past decade we have also surveyed our customers four times every year to understand their views on the value for money we offer, amongst other things. We also keep a very close eye on trends in levels of impairment and economic conditions such as unemployment to ensure that we reflect these risks appropriately in our pricing.
During 2008, the interest rates, fees and charges on credit cards, unsecured and secured loans and overdrafts increased markedly. Macro-economic conditions began to deteriorate and the downwards trend in unemployment began to reverse. Our customers told us that we were still offering good value for money with our products and their satisfaction ratings remained high.
Taking all this into account, in September and November small price rises were made on some

20
DIR
ECTOR
S’ REPO
RT : B
USIN
ESS REVIEW
Annual Report & Financial Statements 2008 Provident Financial plc
Consumer Credit Division: Home credit – continued
of our home credit products to bring them back into line with the rest of our products and reflect the level of risk in the marketplace. The effect of these increases was to raise the price of our most popular product by 3%, bringing our typical APR to 189.2%. All of our home credit products remain highly competitive in the marketplace and are below the rates of the majority of our competitors. Our customers can find a comparison of the price of home-collected and other small cash loans available in their local area at www.lenderscompared.org.uk, an independent price comparison website.
Making good credit decisionsTo support agents in their lending decisions, the business has continued to refine its credit scoring to help decide whether to accept new customers or extend further credit to existing ones. The revised systems led to our declining 60% of new customer applications in 2008 (55% in 2007) – a number of which we would have accepted previously. As well as filtering out the higher risks, the system can also help agents to spot the good payers earlier in the relationship, providing opportunities to offer more credit sooner, when that’s appropriate for the customer.
Core accounting systemA new core accounting and processing system that helps run the business effectively was fully implemented in September, three months ahead of schedule. The new system, called Focus, gives us a platform from which we can launch a series of business improvements, including the new commission scheme for agents which was implemented in November, better management information, better record keeping, the development and implementation of new products, improving collections performance and building better customer relationships.
Agent performanceA new commission scheme that encourages agents to take decisions that are in line with the business strategy was implemented throughout the business in November. The new scheme continues to pay agents in line with collections performance but further rewards them for developing a strong repayment discipline early in their relationship with a customer and for working closely with customers who fall into arrears. The scheme is also much simpler to understand and therefore makes it easier for
“ I like the fact that I always know where I am with my home credit payments and that I never have to worry about extra charges, even if I have to miss a payment.”
Carol LaineHome credit customer
Consumer Credit Division customers recruited via the internet
12.6%Home credit branches
356
Home credit agent, Lorraine, visits her customer, Carol, at her home in Wishaw, glasgow

21D
IRECTO
RS’ R
EPOR
T : BU
SINESS R
EVIEW
Annual Report & Financial Statements 2008 Provident Financial plc
Consumer Credit Division: Home credit – continued
In order to make our products desirable to as broad a range of customers as possible we are extending the range of ways customers can take their loans and make their repayments. Customers can choose to receive their loan in cash, as shopping vouchers, loaded onto a ready loaded Visa card (so that customers can use it over the phone or on the internet giving them, for example, access to online bargains) or directly into their bank account. Customers can already make payments in cash or by cheque and collecting repayments via debit cards and credit cards is being tested in a number of areas, as is taking repayment via the AllPay system at Post Offices and at PayPoint terminals in retailers.
A further development has been the establishment of Real Personal Finance, full details of which can be found on page 23.
RegulationApplying to the group’s home credit companiesThe Competition Commission Inquiry 2006The Competition Commission remedies are now in place. The independent website setting out price data went live in early autumn 2008 at www.lenderscompared.org.uk.
Ireland Consumer Protection Code for MoneylendersThe Financial Regulator in Ireland has published a new Consumer Protection Code that will apply to home credit traders. The Code includes new provisions on knowing the customer, suitability, complaint handling and consumer records.
general principles in the Code came into force on 1 January 2009. The more detailed provisions will come into effect in September 2009.
Home credit loans are often used to help cover ‘back to school’ costs such as uniforms, books and sports kit
Nicola wraps a Christmas present for her son Jensen
agents to maximise their earnings. Agents like the new scheme and it is delivering the expected improvements for the business.
Recruiting and retaining customersWe have relied traditionally on agents to recruit most of our new customers. Whilst agent recruitment of customers continues, the business is now making more and better use of other channels and is adopting other techniques, such as partnerships with mail order houses and finance companies, to take on customers whose credit applications have been declined. Our websites are now our most cost-effective channel for recruiting new customers. We have developed online links with retailers to provide credit to their customers and are using the internet more to advertise our products. The proportion of customers recruited via the internet increased to a record 12.6% in 2008.
22
DIR
ECTOR
S’ REPO
RT : B
USIN
ESS REVIEW
Annual Report & Financial Statements 2008 Provident Financial plc
“ Each Tuesday we have a detailed picture of the previous week’s performance which means we can make changes very quickly when necessary.”
Looking aheadIn 2009, the challenge facing the home credit business is to continue to grow whilst keeping a tight grip on impairment. There are significant opportunities in the market as mainstream lenders continue to restrict the flow of credit but there are also risks as unemployment rises and people cut back on expenditure. The issue is one of striking the right balance and throughout 2008 we have been discussing with our staff how best to strike this balance. We believe we now have in place the right systems and the right thinking to achieve this. We are prepared to see some rise in impairment as a trade-off for profitable growth but we will be watching the sales data carefully to make sure we continue to get it right. We benefit from getting excellent data back very quickly from our staff and home credit agents. each Tuesday we have a detailed picture of the previous week’s performance which means we can make changes very quickly when necessary.
Consumer Credit Division: Home credit – continued
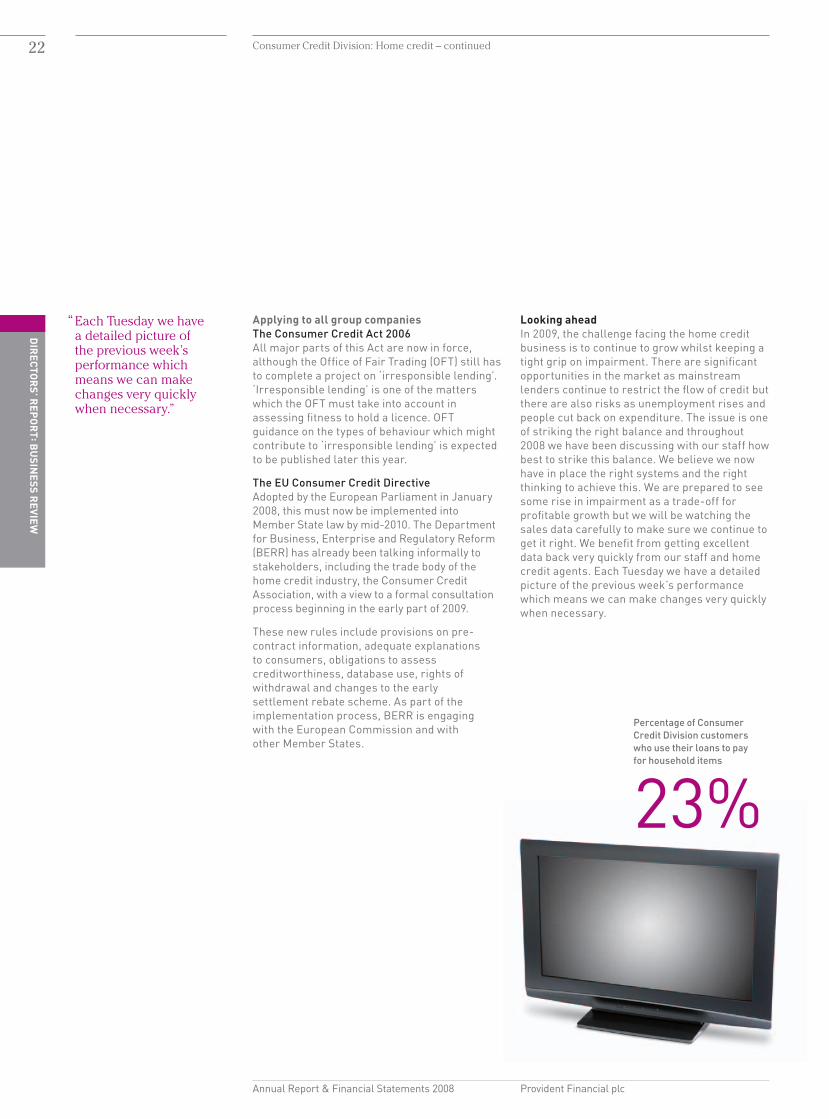
Percentage of Consumer Credit Division customers who use their loans to pay for household items
23%
Applying to all group companiesThe Consumer Credit Act 2006All major parts of this Act are now in force, although the Office of Fair Trading (OFT) still has to complete a project on ‘irresponsible lending’. ‘Irresponsible lending’ is one of the matters which the OFT must take into account in assessing fitness to hold a licence. OFT guidance on the types of behaviour which might contribute to ‘irresponsible lending’ is expected to be published later this year.
The EU Consumer Credit Directive Adopted by the european Parliament in January 2008, this must now be implemented into Member State law by mid-2010. The Department for Business, enterprise and Regulatory Reform (BeRR) has already been talking informally to stakeholders, including the trade body of the home credit industry, the Consumer Credit Association, with a view to a formal consultation process beginning in the early part of 2009.
These new rules include provisions on pre-contract information, adequate explanations to consumers, obligations to assess creditworthiness, database use, rights of withdrawal and changes to the early settlement rebate scheme. As part of the implementation process, BeRR is engaging with the european Commission and with other Member States.

23D
IRECTO
RS’ R
EPOR
T : BU
SINESS R
EVIEW
Annual Report & Financial Statements 2008 Provident Financial plc
Term of RPF loan
12 – 36 monthsRPF loan amounts
£750 – £6,000
Real Personal FinanceThe direct repayment, non-standard loans market continues to be under-supplied, with those already in the market reducing their presence and further tightening their lending criteria. RealPersonalFinance(RPF)hasbeen set up to test whether we can profitably extend our reach into this market.
RPF is a logical extension of the home credit model into a much larger market sector, adjacent to the weekly-collected home credit sector. It capitalises on the strengths of our home credit business, not least of which is conducting the initial assessment interview in the customer’s home, with payments collected through monthly direct debit. This model
gabriel’s mum, Jenny, used her RPF loan to buy a new kitchen
“ Our Personal Finance Manager was really helpful. He came to our house to talk things through with us and came up with a repayment plan to suit our budget.”
Jenny GoodsonReal Personal Finance customer
responds to customers’ preferences for personal contact, and the home visit also means that each customer’s circumstances can be individually assessed.
RPF offers larger loans than traditional weekly-collected home credit – from £750 to £6,000 with typical APRs of between 60% and 70%. It has been set up within the Consumer Credit Division so it can share the home credit business’s resources – in particular its 350-strong office network – thereby keeping overheads to a minimum. Personal Finance Managers (PFMs) work from the existing branch network and are part of the home credit area sales team. The PFM underwrites the loan at the customer’s home and also handles any early arrears. This differentiates us from competitors and allows us both to convert leads quickly and to make better informed decisions as to whether, and how much, to lend.
The strategy for RPF in 2008 was to test further the business model, to establish a larger, more stable management team and to test various customer recruitment channels.
Three features of Real Personal Finance loans
Face-to-face meetings A Personal Finance Manager visits each RPF customer at home to discuss and underwrite their loan.
Direct repayments Repayments are made monthly by direct debit.
Larger loan amounts RPF offers customers larger loans than home credit, from £750to£6,000.

24
DIR
ECTOR
S’ REPO
RT : B
USIN
ESS REVIEW
Annual Report & Financial Statements 2008 Provident Financial plc
Consumer Credit Division: Real Personal Finance – continued
Consumer Credit Division resultsThe Consumer Credit Division has performed well in 2008 with profit before tax rising by 2.1% to £126.1m (2007: £123.5m). Despite high levels of demand for home credit, the business has applied greater selectivity to accepting new customers and a cautious approach to re-serving existing customers in order to maintain an appropriate balance between the rate of customer growth, field collections capacity and the quality of the receivables book. This strategy has also reinforced the business’s responsible lending policy. As a consequence, growth in year end customer numbers of 6.8% was at a similar rate to that reported at the half-year.
Average receivables grew by 12.0%, of which 1.2% was attributable to Real Personal Finance, the market test of direct repayment loans, and 10.8% to home-collected credit. Receivables growth exceeded customer growth due to the growth in the number of higher quality, re-servable customers, and a focus on the development of existing customers. The issue of longer term loans contributed very little to overall growth because of the greater emphasis on shorter term products which, in difficult times, carry less risk and allow agents to reassess affordability more regularly.
Revenue growth of 10.4% was slightly lower than the rate of receivables growth. This is primarily a result of the anticipated impact from the implementation of the Competition Commission’s remedy to offer customers more generous early settlement rebates on new loans granted after 13 December 2007.
Impairment levels remained in line with plan throughout the year and at 30.4% of revenue were unchanged from the half-year. The increase from 29.7% at the end of 2007 reflects a small degree of strain from increased numbers of new customers who are inherently
Percentage of customers who use their loans to pay for special occasions
38%
Percentage of customers who use their loans to buy new furniture
5%
We have built a team of 58 PFMs (up from 33 at the end of 2007) managed by five Regional Managers and supported by experts in specialist areas – many of whom also support the home credit business. The team – many recruited externally and bringing considerable experience of this type of lending – is now very stable and is becoming increasingly effective as its experience of our lending model grows.
In 2007, new business came predominantly from home credit customers who had recently paid up their loan. In 2008, we expanded our two other sources of business. We have now established relationships with a number of credit brokers which are working well and providing around 25% of business. And we have developed our direct response activity. This takes two forms: direct mail activity to home credit customers who have not renewed their loan, and various forms of internet activity including leads from the RPF and other group company websites and leads from affiliate partners’ websites. Direct response activity now generates 35% of our business.
Looking aheadThe expansion of the business throughout 2008 has provided further evidence that we can build a profitable, large-scale remotely-collected credit business. In 2009, we will increase the size of the loan book from the existing 50 locations before expanding the business further. We will continue to test recruitment channels and the business model. We will also evaluate various core business systems which could be deployed as and when the business reaches operational scale.

25D
IRECTO
RS’ R
EPOR
T : BU
SINESS R
EVIEW
Annual Report & Financial Statements 2008 Provident Financial plc
Consumer Credit Division: Real Personal Finance – continued
cost base and grew in line with activity levels. Other costs increased at a higher rate as a result of the roll-out of the Focus accounting platform across the branch network, training and other costs relating to the implementation of the revised agent commission scheme, and the deployment of Real Personal Finance in 50 branch locations.
Real Personal Finance continues to perform in line with expectations. Its receivables book was £18m at the end of 2008 with credit quality developing as expected. The business will continue to grow the loan book from the current 50 locations and, as previously reported, the board will review the progress of the business during the second quarter of the year before setting the pace and scale of a national roll-out.
riskier than established customers. This stable performance has been delivered through a period of price inflation, which has adversely affected customers’ disposable incomes, and a weakening of the economy. It demonstrates the benefits of the consistently cautious approach to lending coupled with the investment in improved credit application and behavioural scoring systems over the past two years.
The environment is expected to remain difficult throughout 2009. Approximately 80 additional branch-based managers have been recruited throughout the field organisation in recent months to reinforce spans of control over collections and arrears management throughout the field organisation. Similarly, the area and regional management structures are receiving investment which includes creating 21 new branches to enhance effectiveness and add capacity.
Total costs rose faster than revenue, up 13.4% in line with internal plans. Agents’ commission represents approximately 40% of the divisional
Consumer Credit Division profit before tax
£126.1mConsumer Credit Division revenue
£651.8m
Year ended 31 December
2008 2007 Change Consumer Credit Division £m £m %
Customer numbers (‘000) 1,762 1,650 6.8
Average customer receivables 712.7 636.1 12.0
Revenue 651.8 590.5 10.4
Impairment (197.9) (175.3) (12.9)
Revenue less impairment 453.9 415.2 9.3
Impairment % revenue* 30.4% 29.7%
Costs (291.2) (256.7) (13.4)
Interest (36.6) (35.0) (4.6)
Profit before tax 126.1 123.5 2.1
* Impairment as a proportion of revenue for the 12 months ended 31 December.
26
DIR
ECTOR
S’ REPO
RT : B
USIN
ESS REVIEW
Annual Report & Financial Statements 2008 Provident Financial plc
Vanquis Bank
It is increasingly difficult to operate in the modern world without a credit card. Credit cards allow people to shop conveniently in the high street, by telephone or on the internet, to manage emergencies, and are useful when travelling abroad. However, many people – including those with little or no credit history, those who have had credit problems in the past but are now over them, and those on lower incomes – can find themselves excluded from this valuable facility.
Vanquis Bank is bringing the benefits of credit cards, in a responsible way, to people who can find themselves excluded by mainstream card issuers. Credit card limits are significantly lower than those of mainstream lenders and a high level of contact with customers helps them stay in control.
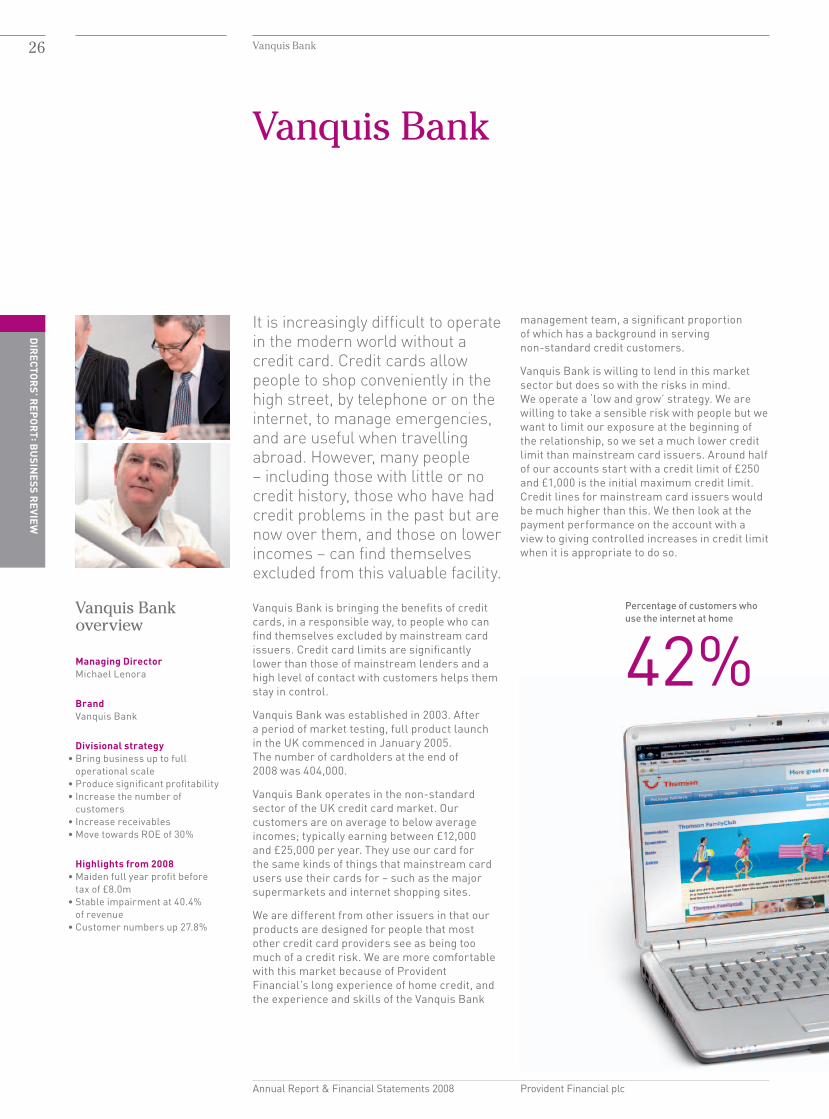
Vanquis Bank was established in 2003. After a period of market testing, full product launch in the UK commenced in January 2005. The number of cardholders at the end of 2008 was 404,000.
Vanquis Bank operates in the non-standard sector of the UK credit card market. Our customers are on average to below average incomes; typically earning between £12,000 and £25,000 per year. They use our card for the same kinds of things that mainstream card users use their cards for – such as the major supermarkets and internet shopping sites.
We are different from other issuers in that our products are designed for people that most other credit card providers see as being too much of a credit risk. We are more comfortable with this market because of Provident Financial’s long experience of home credit, and the experience and skills of the Vanquis Bank
management team, a significant proportion of which has a background in serving non-standard credit customers.
Vanquis Bank is willing to lend in this market sector but does so with the risks in mind. We operate a ‘low and grow’ strategy. We are willing to take a sensible risk with people but we want to limit our exposure at the beginning of the relationship, so we set a much lower credit limit than mainstream card issuers. Around half of our accounts start with a credit limit of £250 and £1,000 is the initial maximum credit limit. Credit lines for mainstream card issuers would be much higher than this. We then look at the payment performance on the account with a view to giving controlled increases in credit limit when it is appropriate to do so.
Percentage of customers who use the internet at home
42%
Vanquis Bank
Vanquis Bank overview
Managing DirectorMichael Lenora
BrandVanquis Bank
Divisional strategy •Bringbusinessuptofull
operational scale •Producesignificantprofitability•Increasethenumberof
customers•Increasereceivables•MovetowardsROEof30%
Highlights from 2008 •Maidenfullyearprofitbefore
tax of £8.0m•Stableimpairmentat40.4%
of revenue•Customernumbersup27.8%

27D
IRECTO
RS’ R
EPOR
T : BU
SINESS R
EVIEW
Annual Report & Financial Statements 2008 Provident Financial plc
Vanquis Bank – continued
Vanquis Bank is different from other lenders in that it maintains a high level of customer contact throughout the life of the account. During the application process, a customer will have a telephone interview with one of our customer support staff at our call centre in Chatham. They will also be contacted before their first payment is due, before we offer a credit limit increase, and at any time they appear to be struggling to make payments. Our customers also choose to contact us frequently to help keep in control of their account.
Two-thirds of our customers are taken on at our typical APR of 39.9%. We have higher default rates than the norm in the UK credit card market but our revenues are higher because our interest rates reflect that risk. Our default fees are in line with those of the mainstream credit card providers.
“ The low credit limit on my Vanquis Bank credit card suits me because it means I never have to worry about spending more than I can afford to repay.”
James WigglesworthVanquis Bank customer
emma and James use their Vanquis Bank credit card on the internet to buy furniture for their new flat

28
DIR
ECTOR
S’ REPO
RT : B
USIN
ESS REVIEW
Annual Report & Financial Statements 2008 Provident Financial plc
Vanquis Bank – continued
The marketThere are over ten million people in the UK in the non-standard credit market. Within that market we think somewhere between four and five million people are suited to our credit card product. Some of those customers are already with our direct competitors and some are with the mainstream credit card providers. With around 404,000 customers at present, we have well below 10% of the non-standard market. The nature of the credit market at present means that mainstream credit card providers may not feel able to continue serving some of their customers – who may have been better suited to our type of credit card in any case.
Vanquis Bank’s strategyVanquis Bank’s strategy is to bring the business up to an operational scale that will produce significant profitability. The business’s medium-term target is 500,000 customers, net receivables of £300m and a return on equity of 30%. At the year end, Vanquis Bank had 404,000 customers and receivables of £205.4m.
Key activities in 2008Vanquis Bank continues to perform well and made significant strides towards its growth and profitability targets in 2008.
Significant investment was made in our infrastructure in 2008. In August, the business moved to new, larger premises in Chatham which gives the business the operating capacity to support significant further growth. At the year end, Vanquis Bank had 340 staff at Chatham and a further 60 in London. The new premises are capable of servicing 750,000 customers.
In parallel with the move to new premises, the business took the opportunity to refresh the core technology that runs the business by installing new hardware and new, leading-edge software. This has allowed the business to manage all aspects of its system more efficiently and make even better credit decisions, while delivering better customer service. One particular improvement is the ability to derive better credit scores, effectively in real time, rather than on a historical basis as before.
Vanquis Bank profit before tax
£8.0mIncrease in Vanquis Bank average receivables
47.5%
The Vanquis Bank credit card enables customers to shop online or over the phone. Amazon is one of the most popular retailers amongst our customers.

29D
IRECTO
RS’ R
EPOR
T : BU
SINESS R
EVIEW
Annual Report & Financial Statements 2008 Provident Financial plc
Vanquis Bank – continued
The level of demand for a Vanquis Bank credit card remains high although we turn down around 80% of applicants. Customer recruitment channels continued to evolve in 2008 with 60% of customers coming from the internet, even with an 84% decline rate in this particular channel. In addition to direct mail activity, which is still a major source of business for us, we also formed a number of card-issuing partnerships with other organisations to generate new customers. These partnerships accounted for approximately 10% of our new accounts in 2008 compared with a negligible percentage in 2007. We also have a number of arrangements to consider applicants who have been declined by some of the mainstream credit card issuers which is another important source of business for us.
The Chatham call centre takes 160,000 calls a month and the aim is to talk to every customer as part of the application process – we are the only credit card company to do this. These initial calls do two things. They allow us to speak to the customer as part of the underwriting process which includes checking security details – this helps to reduce fraud. And it gives us the opportunity to see if the customer would
like to buy any of our ancillary products or services on the day their account is activated. There are two main products available at present.
One is our Repayment Option Plan which safeguards customers if they are made redundant and allows them to miss one payment in every six month period. From our experience in the home credit market we know that the flexibility to miss occasional repayments is particularly valued by customers in the non-standard market.
The other product is the offer to have some of their credit limit transferred to their bank account immediately. Some customers like this because they are able to buy goods effectively on day one of their relationship with us rather than having to wait until the process of providing cards and establishing security data is complete. The transfer to the customer’s bank account is free but interest is charged from the date of the bank transfer so we start earning revenue from the account at an earlier date.
“ I’ve never had a credit card before so I tend to speak to an adviser at Vanquis Bank most months. It helps me keep on top of things and make sure I don’t go over my balance.”
Janine PickeringVanquis Bank customer
Ava’s mum, Janine, makes a repayment over the telephone
30
DIR
ECTOR
S’ REPO
RT : B
USIN
ESS REVIEW
Annual Report & Financial Statements 2008 Provident Financial plc
Vanquis Bank – continued
Maintaining the quality of its loan book is extremely important to any credit card lender. With our business model, which serves the non-standard market, and the current economic environment, this is doubly important for us. We placed a greater emphasis in 2008 on ensuring that both new and existing customers’ cards were priced at a level that made an appropriate return for the risks being taken. This shift in focus, while subtle, has resulted in material changes to the proportion of applicants we are prepared to accept as customers, to the initial credit lines we are prepared to grant to new customers, and to the increases in credit lines we are prepared to grant to existing customers. These actions mean we are well positioned for the challenging trading environment in the months ahead.
We have made significant cost savings by renegotiating contracts with key suppliers of credit bureau data, account processing, internet sourcing, and direct mail print.
Looking aheadOur two main tasks in 2009 are to manage impairment and to continue to grow the business.
The systems we have in place provide us with good quality, timely management information which allows us to make any necessary changes to our loan book to keep impairment at acceptable levels. Without wishing to minimise the importance of this task, it is what our systems have been set up to do and it is what we have been doing on a continual basis since the business’s foundation.
Our other main task is to continue to grow the business. We will establish new card issuing partnerships and enter into new agreements to
Vanquis Bank customers
404,000Vanquis Bank revenue
£94.6m
consider applicants who have been declined by other card issuers. Our partnerships have helped us to achieve a record level of new accounts in 2008 and we expect this channel to continue to grow in importance in 2009.
We will seek to develop new products in order to add yet more new income streams and we will examine the acquisition of suitable credit card books in order to take advantage of our operational capacity headroom. This would result in the business achieving its full-scale operation sooner. With our banking licence, we also have the potential of deposit taking to fund further expansion.
ResultsVanquis Bank has made strong progress in 2008 towards its medium-term targets. The segment of the non-standard lending market in which the business operates has become increasingly under-served at a time of rising demand. Consequently, Vanquis Bank received nearly a million new credit applications during 2008. However, less than 20% of these were accepted, reflecting the group’s cautious approach to growth. The underwriting criteria for accepting new customers and the rate at which credit lines are increased to existing customers have been tightened progressively since the middle of 2007.
New customers continue to start on relatively low credit lines of typically £250, which increase gradually over time if the customer exhibits appropriate behaviours. This ‘low and grow’ approach resulted in customer receivables increasing at a faster rate than customer number growth, with average receivables rising by 47.5% to £177.5m (2007: £120.3m). Revenue grew at a similar rate as the yield on the loan book was maintained.

31D
IRECTO
RS’ R
EPOR
T : BU
SINESS R
EVIEW
Annual Report & Financial Statements 2008 Provident Financial plc
Vanquis Bank – continued
The profile of customer arrears has remained stable. The impairment charge, measured as a percentage of revenue, ended the year at 40.4% (2007: 39.7%). The enhancements made to the collection processes within the contact centre introduced during 2008, combined with a cautious approach to growing the business have produced this strong result.
The business continues to benefit from increased scale and operational leverage, with costs rising at a significantly lower rate than revenue. The full year cost increase of 18.7% comprised 15.7% in the first half increasing to 21.7% in the second half following the move to a larger contact centre in August 2008 and a major upgrade of the IT infrastructure.
During 2008, new agreements were negotiated with two of Vanquis Bank’s key operational partners which have reduced unit costs. These gains reflect the bank’s status as a profitable and growing business.
Overall, the business reported its first full year profit of £8.0m in 2008 (2007: loss of £0.9m). This represents a total improvement of £26.3m in its profitability over the last two years. Vanquis Bank remains on track to deliver a post-tax return on equity of 30% in the medium-term in line with previously issued guidance.
Year ended 31 December
2008 2007 Change Vanquis Bank £m £m %
Customer numbers (‘000) 404 316 27.8
Average customer receivables 177.5 120.3 47.5
Revenue 94.6 63.5 49.0
Impairment (38.2) (25.2) (51.6)
Revenue less impairment 56.4 38.3 47.3
Impairment % revenue* 40.4% 39.7%
Costs (39.4) (33.2) (18.7)
Interest (9.0) (6.0) (50.0)
Profit/(loss) before tax 8.0 (0.9) n/a
* Impairment as a proportion of revenue for the 12 months ended 31 December.

32
DIR
ECTOR
S’ REPO
RT : B
USIN
ESS REVIEW
Annual Report & Financial Statements 2008 Provident Financial plc
Andrew FisherFinance Director
Yes Car CreditThe collect-out of the Yes Car Credit receivables loan book continues to progress well. At the end of 2008, the receivables book stood at £5.8m, down from £33.3m at the end of 2007. As expected, the business incurred a loss before tax of £2.9m in the year (2007: loss of £2.9m).
The completion of the collect-out of the receivables book and the closure of the operation is expected towards the end of 2009.
Central costsCentral costs of £5.5m in 2008 were £1.0m lower than in 2007 following the demerger of International Personal Finance plc in July 2007.
Central interest receivable was £3.1m in the year (2007: £2.0m), reflecting the surplus capital currently held by the group.
TaxationThe effective tax rate for the year was 28.5% (2007: 29.9%), in line with the UK corporation tax rate which reduced from 30.0% to 28.0% in April 2008. The future tax rate is expected to be in line with the statutory UK corporation tax rate of 28.0%.
Earnings per shareBasic earnings per share for the year were 70.9p (2007: 40.9p).
The demerger of the international business in July 2007 was accompanied by a one-for-two share consolidation. IFRS prescribes that the 2007 basic earnings per share is calculated using the weighted average number of shares after adjusting for the impact of the one-for-two share consolidation from the date of demerger, rather than restating the weighted average number of shares from the beginning of 2007. In order to provide a more comparable view of the performance of the group’s continuing operations, the directors have elected to disclose an adjusted earnings per share figure which adjusts the weighted average number of shares in 2007 as though the share consolidation had always been in place. In addition, the adjusted earnings per share restates central costs to £4.0m in 2007 to reflect the reduced cost of running the central corporate function following the demerger.
Adjusted basic earnings per share from the group’s continuing operations increased by 11.7% to 70.9p (2007: 63.5p), reflecting the profit growth in both of the group’s main businesses. Dividends were covered 1.1 times on this basis (2007: 1.0 times).
63.5p2007
58.5p2006
70.9p2008
Adjusted basic ePS from continuing operations
Total Shareholder Return (TSR)TSR is an important measure of performance for the group’s shareholders as it combines the increase in the value of the group’s shares with any dividend returns made to shareholders. This measure also forms one of the performance conditions within the Long-Term Incentive Scheme (LTIS) for directors and senior management.
Since the demerger in July 2007, the group has generated a TSR of 0.7% and significantly outperformed both the Financials sector and the FTSe 250.
-48.5%Financials
-44.1%FTSe 250
0.7%PFg
Total Shareholder Return
DividendsThe directors have recommended a full year dividend per share of 38.1p (2007: 38.1p). Total dividends per share, after taking account of the interim dividend per share of 25.4p (2007: 25.4p), amount to 63.5p per share (2007: 63.5p). Based on the year end share price this represents a dividend yield of 7.4% (2007: 7.6%).
Financial review
Financial review

33D
IRECTO
RS’ R
EPOR
T : BU
SINESS R
EVIEW
Annual Report & Financial Statements 2008 Provident Financial plc
Financial review – continued
ReceivablesReceivables ended the year at £1,063.3m (2007: £925.4m), up by £137.9m compared with 2007. Receivables in the Consumer Credit Division increased by £103.1m (13.8%) from £749.0m to £852.1m, primarily reflecting strong growth in customer numbers, which are up by 6.8% on 2007. At Vanquis Bank, growth in customer numbers of 27.8% together with credit line increases to good quality existing customers led to a £62.3m (43.5%) growth in receivables from £143.1m to £205.4m. Yes Car Credit receivables reduced from £33.3m to £5.8m as the collect-out of the receivables book continued to progress well.
709.92005
639.52004
793.12006
892.12007
1,057.52008
CCD and Vanquis Bank receivables (£m)
Pension assetOn 1 September 2008, the group merged its two defined benefit pension schemes into one scheme. The scheme has been substantially closed to new employees since 1 January 2003. New employees joining the group after this date are invited to join a stakeholder pension plan into which the company generally contributes 8% of members’ pensionable earnings, provided the employee contributes a minimum of 6%.
The group’s defined benefit pension asset stood at £50.9m at the end of 2008, compared with £61.5m at the end of 2007. The major movements can be analysed as follows: 2008 £m
Pension asset as at 31 December 2007 61.5Credit to the income statement 1.2employer contributions 5.3Actuarial loss (17.1)Pension asset as at 31 December 2008 50.9
Balance sheetThe group’s summary balance sheet is set out below: 2008 2007 Change £m £m £m
Receivables:Consumer Credit Division 852.1 749.0 103.1Vanquis Bank 205.4 143.1 62.3Yes Car Credit 5.8 33.3 (27.5)Total receivables 1,063.3 925.4 137.9
Pension asset 50.9 61.5 (10.6)Borrowings* (803.9) (670.9) (133.0)Other net liabilities (32.4) (20.1) (12.3)Net assets 277.9 295.9 (18.0)
* The fair value of derivative financial instruments which are used to hedge the foreign exchange rate risk on the group’s US private placement loan notes have been included within borrowings to state borrowings at their hedged exchange rate. In 2008, this reduces borrowings by £24.6m (2007: increases borrowings by £37.2m) with a corresponding movement in other net liabilities.
The group has a target ordinary shareholders’ capital to receivables ratio of 15%.
The group’s equity to receivables ratio, calculated to exclude the group’s pension asset, the fair value of derivative financial instruments held in the hedging reserve and after taking account of the proposed final dividend, was 19.1% at the year end (2007: 21.7%). After taking into account operational seasonality and the timing of dividend payments, this implies that the group holds surplus capital of some £55m (2007: £75m). In view of the high dividend payout ratio, the surplus will be retained to fund further growth opportunities and provide a sensible degree of strategic flexibility.
21.72007
17.32006
19.12008
equity to receivables (%)

34
DIR
ECTOR
S’ REPO
RT : B
USIN
ESS REVIEW
Annual Report & Financial Statements 2008 Provident Financial plc
The key assumptions used in determining the pension asset were as follows: 2008 2007
Discount rate 6.3% 5.7%Inflation 2.9% 3.4%Mortality assumptions: – Male retiring at 65 22 yrs 21 yrs– Female retiring at 65 25 yrs 24 yrs
The actuarial loss primarily reflects negative investment returns of around 11% caused by the sharp falls in equity values during the year. This impact has been partly offset by (i) an increase in corporate bond yields which are used to discount the value of the scheme liabilities, which increased from 5.7% at the end of 2007 to 6.3% at 31 December 2008 and (ii) a reduction in the inflation rate used to predict inflationary increases in pensions from 3.4% to 2.9%.
The scheme’s investment strategy is to maintain a balance of assets between equities and bonds in order to reduce the risk of volatility in investment returns.
The group continues to use the PA92 series of standard tables combined with the medium cohort improvement factors for projecting mortality. However, for the purposes of the mortality assessment as at 31 December 2008, all life expectancy assumptions have been increased by one year in recognition of the general practice in updating life expectancy
assumptions recently. Further details are set out in note 19 to the financial statements.
Borrowingsgroup borrowings at the end of 2008 were £828.5m compared with £633.7m at the end of 2007. These borrowings are stated using the year end exchange rate to translate the group’s US private placement loan notes rather than the rate hedged at the time of issue by cross currency swaps. After adjusting borrowings to reflect the hedged rate of exchange on the group’s US private placement loan notes, borrowings were £803.9m at the end of 2008 compared with £670.9m at the end of 2007. Borrowings have increased during the year in line with the increase in receivables in both the Consumer Credit Division and Vanquis Bank.
The group borrows mainly to provide loans to customers. The seasonal pattern of lending results in peak funding requirements in December each year. The group’s main sources of funding are committed term and revolving syndicated and bilateral bank facilities, US private placement loan notes and publicly traded subordinated loan notes.
At the end of 2008, the group had available borrowing facilities of £1,102.5m (2007: £1,200.4m), almost all of which were committed facilities. These facilities provided headroom of £251.2m as at 31 December 2008 (2007: £547.8m) and the average period to maturity was 3.0 years (2007: 3.6 years).
Financial review – continued
0
200
400
600
800
1,000
1,200
Dec 08 Jun 09 Dec 09 Jun 10 Jun 11Dec 10 Dec 11 Jun 12 Dec 12
Subordinated loan notes Syndicated and bilateral bank facilities Private placement loan notes
Committed borrowing facilities 2008*
*Adjusted to take account of the £213.2m one year extension of syndicated facilities which took place on 13 February 2009.
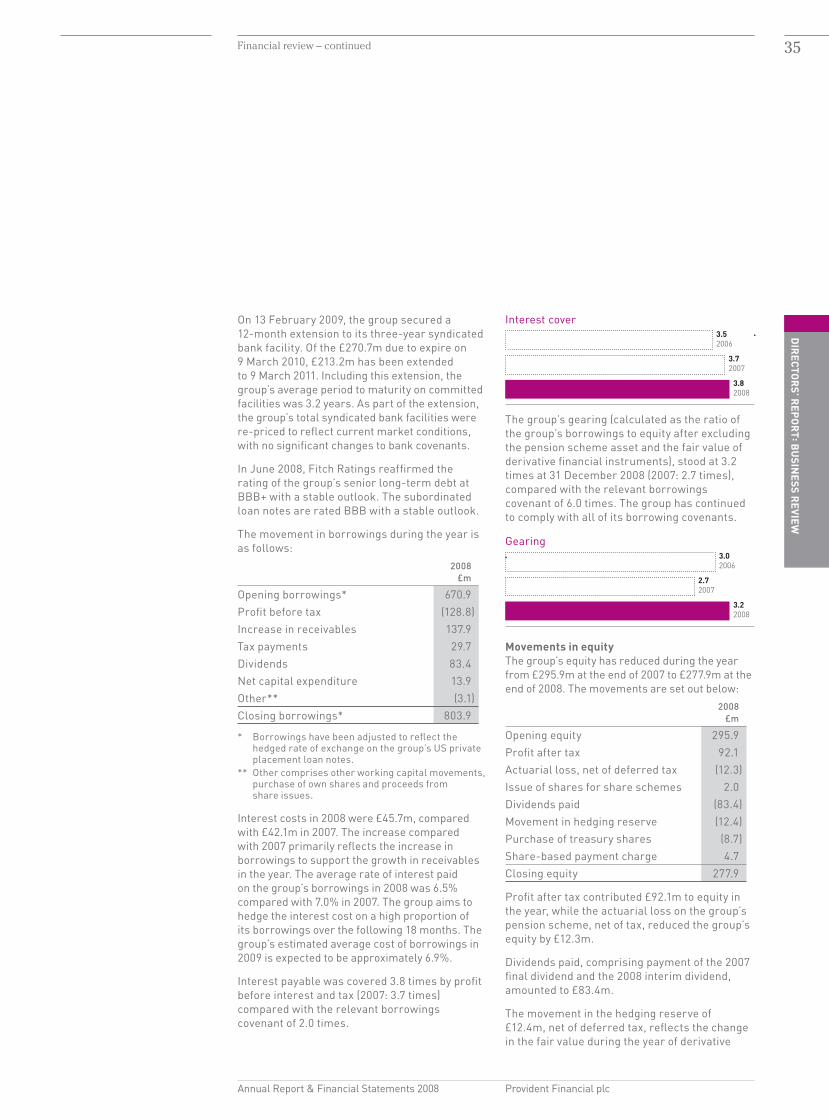
35D
IRECTO
RS’ R
EPOR
T : BU
SINESS R
EVIEW
Annual Report & Financial Statements 2008 Provident Financial plc
On 13 February 2009, the group secured a 12-month extension to its three-year syndicated bank facility. Of the £270.7m due to expire on 9 March 2010, £213.2m has been extended to 9 March 2011. Including this extension, the group’s average period to maturity on committed facilities was 3.2 years. As part of the extension, the group’s total syndicated bank facilities were re-priced to reflect current market conditions, with no significant changes to bank covenants.
In June 2008, Fitch Ratings reaffirmed the rating of the group’s senior long-term debt at BBB+ with a stable outlook. The subordinated loan notes are rated BBB with a stable outlook.
The movement in borrowings during the year is as follows: 2008 £m
Opening borrowings* 670.9Profit before tax (128.8)Increase in receivables 137.9Tax payments 29.7Dividends 83.4Net capital expenditure 13.9Other** (3.1)Closing borrowings* 803.9
* Borrowings have been adjusted to reflect the hedged rate of exchange on the group’s US private placement loan notes.
** Other comprises other working capital movements, purchase of own shares and proceeds from share issues.
Interest costs in 2008 were £45.7m, compared with £42.1m in 2007. The increase compared with 2007 primarily reflects the increase in borrowings to support the growth in receivables in the year. The average rate of interest paid on the group’s borrowings in 2008 was 6.5% compared with 7.0% in 2007. The group aims to hedge the interest cost on a high proportion of its borrowings over the following 18 months. The group’s estimated average cost of borrowings in 2009 is expected to be approximately 6.9%.
Interest payable was covered 3.8 times by profit before interest and tax (2007: 3.7 times) compared with the relevant borrowings covenant of 2.0 times.
Interest cover
3.72007
3.52006
3.82008
The group’s gearing (calculated as the ratio of the group’s borrowings to equity after excluding the pension scheme asset and the fair value of derivative financial instruments), stood at 3.2 times at 31 December 2008 (2007: 2.7 times), compared with the relevant borrowings covenant of 6.0 times. The group has continued to comply with all of its borrowing covenants.
gearing
2.72007
3.02006
3.22008
Movements in equityThe group’s equity has reduced during the year from £295.9m at the end of 2007 to £277.9m at the end of 2008. The movements are set out below: 2008 £m
Opening equity 295.9Profit after tax 92.1Actuarial loss, net of deferred tax (12.3)Issue of shares for share schemes 2.0Dividends paid (83.4)Movement in hedging reserve (12.4)Purchase of treasury shares (8.7)Share-based payment charge 4.7Closing equity 277.9
Profit after tax contributed £92.1m to equity in the year, while the actuarial loss on the group’s pension scheme, net of tax, reduced the group’s equity by £12.3m.
Dividends paid, comprising payment of the 2007 final dividend and the 2008 interim dividend, amounted to £83.4m.
The movement in the hedging reserve of £12.4m, net of deferred tax, reflects the change in the fair value during the year of derivative
Financial review – continued

36
DIR
ECTOR
S’ REPO
RT : B
USIN
ESS REVIEW
Annual Report & Financial Statements 2008 Provident Financial plc
Vanquis Bank absorbed £1.8m of capital during 2008 compared with £6.7m in 2007, as the growth of the business continued. Vanquis Bank is expected to generate sufficient profits in 2009 to fund the capital required to grow its receivables book.
Yes Car Credit generated capital of £0.8m in 2008 (2007: £15.6m) with the wind-down of the receivables book generating sufficient capital to cover operating losses. Central costs absorbed £0.6m of capital in 2008 compared with £2.8m in 2007.
Overall, the continuing group generated £70.4m of capital in the year (2007: £93.2m) which compares with the cost of the full year dividend in respect of 2008 of £83.5m (2007: £83.0m). The shortfall was in line with internal plans and has been funded by using part of the group’s surplus capital.
Accounting policiesThe group’s financial statements have been prepared in accordance with International Financial Reporting Standards (IFRS) as adopted by the eU. The group’s accounting policies are chosen by the directors to ensure that the financial statements present a true and fair view. All of the group’s accounting policies are compliant with the requirements of IFRS, interpretations issued by the International Financial Reporting Interpretations Committee and UK company law. The continued appropriateness of the accounting policies, and the methods of applying those policies in practice, is reviewed at least annually. The principal accounting policies, which are consistent with the prior year, are set out on pages 78 to 84.
Treasury policy and financial risk managementThe group is subject to a variety of financial risks including liquidity risk, interest rate risk, credit risk and, to a lesser extent, foreign exchange rate risk. The treasury policies of the group, which are approved annually by the board, are designed to reduce the group’s exposure to these risks through securing appropriate funding, careful monitoring of liquidity and ensuring that effective hedging is in place.
Our treasury policies ensure that the group’s borrowings are sufficient to meet business objectives; are sourced from high quality
financial instruments, predominantly interest rate swaps, which are used for hedging purposes. This treatment is in accordance with IAS 39, ‘Financial instruments: Recognition and measurement’. This reduction to equity will reverse in future periods as the derivative financial instruments mature.
The purchase of own shares of £8.7m represents the purchase of Provident Financial shares which are granted under the group’s share schemes. IFRS requires the cost of these shares to be deducted from equity.
The increase in the share-based payment reserve of £4.7m reflects the charge made to the income statement in the year in respect of the group’s various share schemes.
Capital generatedThe Consumer Credit Division is a highly capital generative business which allows the group to invest in the growth in Vanquis Bank and maintain a high dividend payout. The table below shows the capital generated by the group’s businesses after retaining the extra capital needed to support receivables growth in the business. This is the amount of capital available to pay dividends. 2008 2007 £m £m
Consumer Credit Division 72.0 87.1Vanquis Bank (1.8) (6.7)Yes Car Credit 0.8 15.6Central (0.6) (2.8)Net surplus capital before dividends 70.4 93.2
Capital generated is calculated as operating cash flows less net capital expenditure and tax paid after assuming that 85% of the growth in customer receivables is funded with debt.
The Consumer Credit Division generated £72.0m of capital in 2008 compared with £87.1m in 2007 and continues to be highly capital generative. The reduction of £15.1m in the capital generated in the year reflects the growth in the receivables book and the benefit to 2007 from lower tax payments as a consequence of funding the pension deficit in 2006.
Financial review – continued

37D
IRECTO
RS’ R
EPOR
T : BU
SINESS R
EVIEW
Annual Report & Financial Statements 2008 Provident Financial plc
counterparties; are limited to specific instruments; the exposure to any one counterparty or type of instrument is controlled; and the group’s exposure to interest rate and foreign exchange rate movements is maintained within set limits. The treasury function periodically enters into derivative transactions – principally interest rate swaps, cross-currency swaps and forward foreign exchange rate contracts. The purpose of these transactions is to manage the interest rate and foreign exchange rate risks arising from the group’s underlying business operations. No transactions of a speculative nature are undertaken and written options may only be used when matched by purchased options.
The group’s central treasury function manages the day-to-day treasury operations and application of the treasury policies for all of our businesses. The board delegates certain responsibilities to the treasury committee. The treasury committee, which is chaired by the Finance Director, is empowered to take decisions within that delegated authority. Treasury activities and compliance with the treasury policies are reported to the board on a regular basis and are subject to periodic independent reviews and audits, both internal and external.
Regulatory capitalVanquis Bank holds a banking licence and is therefore regulated by the Financial Services Authority (FSA). In its supervisory role, the FSA sets requirements relating to capital adequacy, liquidity management and large exposures.
The Consumer Credit Division (CCD) operates under a number of consumer credit licences granted by the Office of Fair Trading but is not regulated by the FSA. However, the Provident Financial group, incorporating both CCD and Vanquis Bank, is the subject of consolidated supervision by the FSA by virtue of Provident Financial plc being the parent company of Vanquis Bank. The FSA set requirements for the consolidated group in respect of capital adequacy and large exposures but not in respect of liquidity.
The group adopted the Capital Requirements Directive (CRD) on 1 January 2008. The CRD implements the supervisory framework set out in the Revised BASeL Accord (BASeL II). The CRD framework revises the calculation of
regulatory capital required to be held by firms and places more emphasis on the risks firms face and the risk management processes that they have in place.
The CRD requires the group and Vanquis Bank to conduct an Internal Capital Adequacy Assessment Process (ICAAP) on an annual basis. The key output of the ICAAP is a document which considers the risks faced by the group and the adequacy of internal controls in place, and ascertains the level of regulatory capital that should be held to cover these risks. The group’s first ICAAP was approved by the board and submitted to the FSA in the final quarter of 2007. The group and Vanquis Bank continue to operate under interim Individual Capital guidance (ICg) whilst the group’s ICAAP is being considered by the FSA.
The interim ICg set by the FSA is expressed as a percentage of the minimum Pillar I requirement for credit risk and operational risk calculated using predetermined formulas.
As at 31 December 2008, the regulatory capital held as a percentage of the minimum Pillar I requirement was 419% for the supervised group (2007: 480%) and 270% for Vanquis Bank (2007: 291%). These were comfortably in excess of the interim ICg set by the FSA.
The CRD requires the group to make annual Pillar III disclosures which sets out information on the group’s regulatory capital, risk exposures and risk management processes. A considerable amount of the information required by the Pillar III disclosures is included within the 2008 Annual Report & Financial Statements. However, the group’s full Pillar III disclosures can be separately found on the group’s website, www.providentfinancial.com.
Going concernThe directors have reviewed the group’s budgets, plans and cash flow forecasts for the year to 31 December 2009 and outline projections for the four subsequent years. Based on this review, they have a reasonable expectation that the group has adequate resources to continue to operate for the foreseeable future. For this reason, the directors continue to adopt the going concern basis in preparing the financial statements.
Financial review – continued

Annual Report & Financial Statements 2008 Provident Financial plc
Risks
The group has a rigorous risk management framework. This is designed to identify the risks that could adversely impact the delivery of the group’s strategic aims and to ensure that adequate controls and procedures are in place to mitigate the risks.
The group’s risks, together with the controls and procedures in place to mitigate the risks, are as follows:D
IRECTO
RS’ R
EPOR
T : BU
SINESS R
EVIEW
38
Risks
Risk Definition Controls and procedures
Credit risk The risk that the group will suffer loss in the event of a default by a customer or bank counterparty. A default occurs when the customer or bank fails to honour repayments as they fall due.
Customers• CCD and Vanquis Bank credit committees set policy and review credit performance.• CCD – home credit loans are underwritten face-to-face by agents in the customers’
home; agents maintain weekly contact with the customer and stay up to date with their circumstances; agents’ commission is based on collections not credit issued; application and behavioural scoring is used to assist agents’ underwriting; home credit issues short-term, small sum loans, typically of £400 repayable over one year; RPF loans are underwritten in the home with the use of external bureau data.
• Vanquis Bank – highly bespoke underwriting using full external bureau data; a telephone interview is conducted prior to issuing credit; initial credit limits are low (often £250); customers are re-scored regularly; an intensive call centre based operation focuses on collections.
• Comprehensive daily, weekly and monthly reporting on KPIs.
Bank counterparties• A board approved policy is in place for bank counterparties.• Transactions are only undertaken with high quality counterparties.• exposures to counterparties are linked to their credit rating and regulatory capital requirements.• See pages 85 to 86 for more commentary on credit risk.
Operational risk
The risk of loss resulting from inadequate or failed internal processes, people and systems.
IT systems• IT is managed in CCD and Vanquis Bank by experienced teams.• There are established disaster recovery procedures which are tested on a regular basis.• Dedicated project teams are used to manage change programmes.
Health and safety• Significant time and expenditure is invested in ensuring staff are safety conscious. • Assistance is given to agents to ensure that they are safety aware.• Induction sessions and regular updates are provided on safety awareness.• Safety awareness weeks form part of the annual calendar.
Fraud• Specialist departments are in place in each business to prevent, detect and monitor fraud.• There is regular reporting to divisional boards and the group audit committee.
Key person risk• effective recruitment, retention and succession planning strategies are in place.• The group has competitive remuneration and incentive structures.• effective training, development and communication is in place throughout the group.
Market risk The risk of loss due to adverse market movements caused by active trading positions taken in interest rates, foreign exchange markets, bonds and equities.
• The group’s policies do not permit it to undertake position taking or trading books of this type and therefore it does not do so.
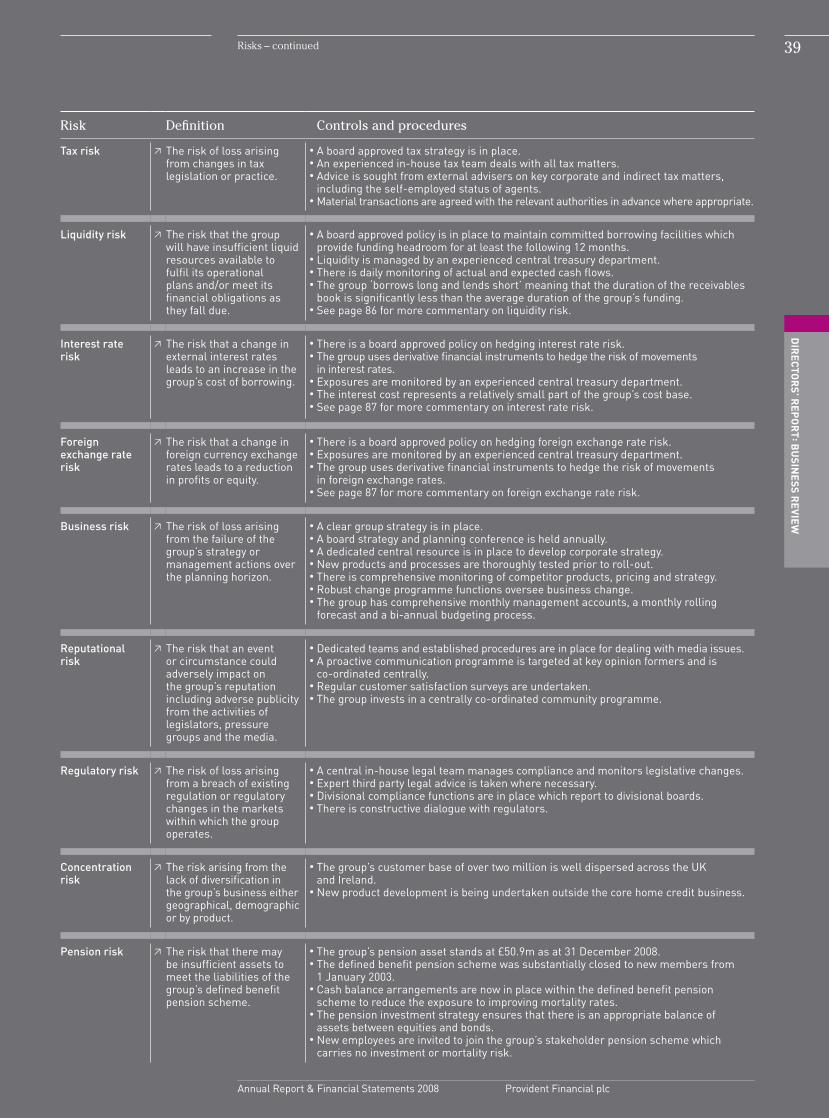
Annual Report & Financial Statements 2008 Provident Financial plc
Risks – continued 39D
IRECTO
RS’ R
EPOR
T : BU
SINESS R
EVIEW
Risk Definition Controls and procedures
Tax risk The risk of loss arising from changes in tax legislation or practice.
• A board approved tax strategy is in place.• An experienced in-house tax team deals with all tax matters.• Advice is sought from external advisers on key corporate and indirect tax matters,
including the self-employed status of agents.• Material transactions are agreed with the relevant authorities in advance where appropriate.
Liquidity risk The risk that the group will have insufficient liquid resources available to fulfil its operational plans and/or meet its financial obligations as they fall due.
• A board approved policy is in place to maintain committed borrowing facilities which provide funding headroom for at least the following 12 months.
• Liquidity is managed by an experienced central treasury department.• There is daily monitoring of actual and expected cash flows.• The group ‘borrows long and lends short’ meaning that the duration of the receivables
book is significantly less than the average duration of the group’s funding.• See page 86 for more commentary on liquidity risk.
Interest rate risk
The risk that a change in external interest rates leads to an increase in the group’s cost of borrowing.
• There is a board approved policy on hedging interest rate risk.• The group uses derivative financial instruments to hedge the risk of movements
in interest rates.• exposures are monitored by an experienced central treasury department.• The interest cost represents a relatively small part of the group’s cost base. • See page 87 for more commentary on interest rate risk.
Foreign exchange rate risk
The risk that a change in foreign currency exchange rates leads to a reduction in profits or equity.
• There is a board approved policy on hedging foreign exchange rate risk.• exposures are monitored by an experienced central treasury department.• The group uses derivative financial instruments to hedge the risk of movements
in foreign exchange rates.• See page 87 for more commentary on foreign exchange rate risk.
Business risk The risk of loss arising from the failure of the group’s strategy or management actions over the planning horizon.
• A clear group strategy is in place.• A board strategy and planning conference is held annually.• A dedicated central resource is in place to develop corporate strategy.• New products and processes are thoroughly tested prior to roll-out.• There is comprehensive monitoring of competitor products, pricing and strategy.• Robust change programme functions oversee business change.• The group has comprehensive monthly management accounts, a monthly rolling
forecast and a bi-annual budgeting process.
Reputational risk
The risk that an event or circumstance could adversely impact on the group’s reputation including adverse publicity from the activities of legislators, pressure groups and the media.
• Dedicated teams and established procedures are in place for dealing with media issues.• A proactive communication programme is targeted at key opinion formers and is
co-ordinated centrally.• Regular customer satisfaction surveys are undertaken.• The group invests in a centrally co-ordinated community programme.
Regulatory risk The risk of loss arising from a breach of existing regulation or regulatory changes in the markets within which the group operates.
• A central in-house legal team manages compliance and monitors legislative changes.• expert third party legal advice is taken where necessary.• Divisional compliance functions are in place which report to divisional boards.• There is constructive dialogue with regulators.
Concentration risk
The risk arising from the lack of diversification in the group’s business either geographical, demographic or by product.
• The group’s customer base of over two million is well dispersed across the UK and Ireland.
• New product development is being undertaken outside the core home credit business.
Pension risk The risk that there may be insufficient assets to meet the liabilities of the group’s defined benefit pension scheme.
• The group’s pension asset stands at £50.9m as at 31 December 2008.• The defined benefit pension scheme was substantially closed to new members from
1 January 2003.• Cash balance arrangements are now in place within the defined benefit pension
scheme to reduce the exposure to improving mortality rates.• The pension investment strategy ensures that there is an appropriate balance of
assets between equities and bonds. • New employees are invited to join the group’s stakeholder pension scheme which
carries no investment or mortality risk.

40
DIR
ECTOR
S’ REPO
RT : B
USIN
ESS REVIEW
Annual Report & Financial Statements 2008 Provident Financial plc
At a time when the world is experiencing an unprecedented economic downturn, and all the uncertainty that that brings with it, Provident Financial remains committed to delivering a corporateresponsibility(CR)programme which, as a core part of our overall business strategy, will enable us to understand and manage effectively the social, environmental and economic impact of our operations.
By continuing to embed CR within the fabric of our business, we can differentiate ourselves from other companies in our sector and secure a business advantage, deliver long-term value to our shareholders, and contribute to the sustainability of our businesses. It also provides us with the opportunity to achieve bottom-line benefits that will result from managing material environmental, social and governance (eSg) risks, reducing costs associated with energy use, reducing staff turnover and enhancing our reputation.
This section of the business review provides an overview of the Provident Financial CR programme and key activities for the 2008 calendar year. For a more comprehensive explanation of our programme, please refer to the CR section of our website at www.providentfinancial.com.
IntroductionOur CR programme is a cornerstone of what we do as a business. It enables us to maintain relationships with the people that matter to the business – whether they’re customers, employees, suppliers, local communities or investors. It helps ensure that we reduce our impacts on the environment, and take account of the social, environmental and ethical issues that relate to our supply chain and the workplace. From a customer perspective, our CR programme underlines our commitment to lend
responsibly and provide products which meet the needs of our customers. This in turn enables us to demonstrate that we are a sustainable, well-managed company.
Our approach to CR management is organised around the following six themes: governance and management, our customers, our people, our supply chain, community involvement, and the environment.
Governance and managementThe Provident Financial management committee oversees the group’s CR programme on behalf of the board. The committee comprises the executive directors of the Provident Financial board (ie the Chief executive, Finance Director and Managing Director of the Consumer Credit Division), the Managing Director of Vanquis Bank, Provident Financial’s Director of Corporate Affairs, Director of Corporate Strategy, and the Company Secretary and general Counsel. Since its formation in July 2007, one of the committee’s roles has been to ensure that our businesses manage the risks and respond to the opportunities which are presented by a group-wide issue such as CR.
Below the management committee are three key working groups which have been established to address the social, environmental and economic issues that are material to our operations, products and services.
Corporate responsibility – delivering long-term value to our stakeholders
Corporate responsibility review
COMMITMENT TO CRBUSI
NESS
STRATEGY
CR STRATEGY CR PROGRAMMES CR INITIATIVES
Provident Financial board
PF management committee
environmental working groups
Responsible lending group
CR working group
Consumer Credit Division environmental working group
Vanquis Bank environmental working group
Health & Safety
steering groups

41D
IRECTO
RS’ R
EPOR
T : BU
SINESS R
EVIEW
Annual Report & Financial Statements 2008 Provident Financial plc
These working groups feed into the Provident Financial board directly, or through the management committee.
The CR manager and community affairs manager, who are both based at Provident Financial’s Bradford headquarters, have overall responsibility for co-ordinating the management of the group’s CR programme. In addition, key personnel from across the group are represented on the groups described above which embeds CR within our operating divisions across all management levels.
Provident Financial’s group mission and values statement, which was developed following consultation in October 2008, also underlines our commitment to ensuring that our business activities are conducted in a responsible way. The values of being fair, responsible, accessible, straightforward and progressive provide the basis for understanding the aims and activities of our business. The values also shape what we do, how we do it, and provide a basis against which our performance can be assessed.
Sustainability assessmentIn order to provide our stakeholders with demonstrable evidence that we conduct our business in a responsible way, and with due consideration to the social, environmental and
• Theresponsiblelendinggroup–Thepurposeof this group is to put in place a framework to manage the issue of responsible lending for both operating divisions. The group is chaired by Chris gillespie, Managing Director of the Consumer Credit Division, and includes representation from the Consumer Credit Division, Vanquis Bank and the corporate office.
• Thecorporateresponsibilityworkinggroup– This group, which includes representation from the Consumer Credit Division, Vanquis Bank and the corporate office, exists to ensure that human resources and supply chain management issues are factored into Provident Financial’s CR programme. This will enable us to continue to address workplace issues such as diversity and improving the opportunities for our employees to get involved in our community projects, and our supply chain relationships.
• Environmentalworkinggroups–Thegroupsthat have been established within both the Consumer Credit Division and Vanquis Bank, and which include representation from facilities management, HR and IT functions, contribute to development and delivery of the Provident Financial environmental management programme.
Corporate responsibility review – continued
“At Provident Financial, CR governance is managed at the highest level. The executive directors have ultimate responsibility for CR activities and meet regularly to discuss them.”
Rob LawsonCorporate Responsibility Manager
The management committee meets to discuss CR issues

42
DIR
ECTOR
S’ REPO
RT : B
USIN
ESS REVIEW
Annual Report & Financial Statements 2008 Provident Financial plc
economic issues that are material to our activities, we remain committed to maintaining a presence on the world’s main sustainability indices. To this end, we continue to be included in the FTSe4good index and were selected as members of both the Dow Jones World Sustainability Index and Dow Jones STOXX Sustainability Index. We also responded to the Carbon Disclosure Project, which enables us to provide institutional investors, with a combined $57 trillion of assets under management, with information on how Provident Financial is managing the risks and opportunities presented by climate change.
We also continued to make an annual submission to the Business in the Community Corporate Responsibility index, which enables us to benchmark our CR management performance against that of our peers, other private and public sector participants and CR best practice. The results of our most recent submission to the index were announced in May 2008. Our performance on the overall CR index increased, with our score rising to 94.5%, up from 89.5% in the previous year. We attained strong scores on the community and environmental components of the index, which increased from 91% to 98% and 90% to 96% respectively. As a result of Provident Financial’s efforts, we were again recognised as one of the ‘Top 100 Companies that Count’ by the Sunday Times in its CR supplement on 25 May 2008.
Our customersOur customers are central to the success of Provident Financial. Our ability to become a sustainable financial services organisation depends on our ability to build and maintain long-term relationships with existing and new customers by providing well-suited products and outstanding service. As such, we recognise that we have a corporate responsibility to continue to deliver products which are well-suited to the needs of our customers by offering high levels of customer service in a personal, friendly and flexible manner.
Responsible lendingWith over two million customers, Provident Financial has the UK’s largest non-standard credit customer base. With many of these customers living on a modest income, it is important that the principle of responsible lending is at the heart of our business strategy. In practice, this means providing our customers with straightforward and clear information on our products and their charges so that they can make informed choices. It also means not lending customers more than they can afford and ensuring that they are not overstretched with their repayments.
To further underline our commitment to lending to customers in a responsible manner, we established a responsible lending group for our businesses in 2008. The principal objective of the group is to ensure that the Consumer Credit Division and Vanquis Bank operate at, or above, the standards expected by the regulatory frameworks which relate to the responsible lending agenda.
Home credit and Real Personal FinanceTo support the lending decisions made by agents and employees, the Consumer Credit Division uses a range of scoring systems and models. These systems and models, which have been designed to supplement the skills and expertise of our employees and agents, play an important role in enabling us to determine whether to accept new customers or to offer further credit to existing ones. Both the System enhanced Lending programme, which is used for our existing customers, and the Single View of Customer system, which is applied to customers that come to us direct, or via website, contact centre or agent referrals, generate credit scores which are used to inform our lending decisions and ensure we provide the right amount of credit to customers at an appropriate rate and time. These systems and models, for example, resulted in our home credit business turning down around 60% of customer applications in 2008. Throughout the year, we also engaged with our customers by providing a range of money saving tips, including those that relate to using energy at home in a more efficient manner.
Corporate responsibility review – continued

43D
IRECTO
RS’ R
EPOR
T : BU
SINESS R
EVIEW
Annual Report & Financial Statements 2008 Provident Financial plc
Vanquis BankVanquis Bank’s approach to lending is carried out with the intention of managing risk. The Bank operates a ‘low and grow’ strategy, which means that much lower credit limits are set for customers than that of other credit issuers – often £250. Customers’ card payment performance is then monitored on an ongoing basis with a view to giving a controlled increase in the credit limit when it is appropriate to do so. Our cautious approach to underwriting, both for new customer applications and for increases to existing customers’ credit lines, continued to be tightened during 2008, with over 80% of new customer applications being declined.
AgentsAt the heart of our home credit service are 11,500 self-employed agents who play a very important role in issuing credit to, and collecting repayments from, our customers. It is therefore important that all agents adhere to our credit control policies and deliver against our commitment to lend in a fair and responsible manner.
During 2008, we introduced a new commission scheme, which continues to reward agents on what they collect, not on what they lend. This means that agents have no reason to lend more than their customers can afford to repay. The new scheme aligns agents’ behaviour even more closely with the objectives of the company and, among other things, pays in line with collections performance, rewarding agents who are taking on customers who are able to meet their repayments. The scheme is much easier to understand and is clearer for agents to see what lending practices are required of them, and so act and be rewarded accordingly.
Our peopleWhen it comes to delivering our business objectives, we recognise that our employees are our single most important asset. With nearly 3,400 people across the UK and Ireland we are committed to providing them with a motivational and safe working environment.
TrainingTraining and development are an essential part of our CR commitment to our people and to the long-term success of our business. By providing opportunities to our staff to learn and improve their skills, our workforce becomes more able to offer a better service, we improve our reputation as an employer of choice, and our people can fulfil their potential. Throughout 2007 and 2008, both the Consumer Credit Division and Vanquis Bank introduced new systems which will improve the way that training is delivered to staff and is subsequently recorded. The learning management systems that have been implemented will enable all employees, whether they are in our branch offices or call centres, to access a range of role-related, computer-based training (CBT) modules that will be accessed through our intranets. Throughout the year, CBT modules were delivered to employees on a range of issues.
As part of our commitment to lend in a fair and responsible manner, and ensure full compliance with regulation, CBT modules were also delivered to agents on, in particular, personal safety, the changes to the Consumer Credit Act, and the FSA Treating Customers Fairly initiative.
During 2008, almost two million leaflets were sent to customers advising them of ways to save money and be more environmentally friendly
2m
Sarah takes part in a training session at the call centre in Chatham
Corporate responsibility review – continued

44
DIR
ECTOR
S’ REPO
RT : B
USIN
ESS REVIEW
Annual Report & Financial Statements 2008 Provident Financial plc
During 2008, we introduced a range of communication and consultative mechanisms across our businesses. These include monthly leadership briefings, team talk bulletins, intranet sites and employee newsletters. We also have a number of dialogue mechanisms in place to enable staff to raise and address issues of concern. Both the Consumer Credit Division and Vanquis Bank have employee forums which are made up of elected representatives and meet on a quarterly basis. They enable employees from across our business to make suggestions or raise concerns.
Our supply chainManagement of our supply chain plays an important role in enabling us to embed social, environmental and ethical considerations within our procurement processes. It also plays an integral role in enabling us to improve the efficiency of our business processes, to manage risks and to enhance further our reputation as a responsible company. Our responsible supply chain management policy underlines our commitment to upholding professional and responsible supplier relationships, our intention to adhere to the payment of suppliers according to their terms and conditions, and our responsibility to keep suppliers informed of our expectations.
We recognise, particularly in the current economic climate, that a critical issue for our suppliers, particularly small to medium-sized enterprises, is prompt payment in line with their terms and conditions. During 2008, we continued to assess whether we pay our suppliers of products and services in a prompt manner. Throughout the year, the average time taken to pay our suppliers across the entire Provident Financial group was 25 days. This continues to compare well with other UK organisations.
Community involvementProvident Financial’s mission is to be the leading non-standard lender in the UK, acting responsibly in all our relationships and playing a positive role in the communities we serve. This means we have a duty to ensure that we are a model corporate citizen and have positive impacts on the people within the communities in which we operate. There are two main strands to our community programme: providing
Managing equality and diversityWe realise that it is of strategic importance and benefit to Provident Financial to attract and retain a diverse workforce and ensure that equal opportunities underpin our recruitment, employment, training and remuneration practices. Having a diverse workforce will help to draw more customers from diverse communities, help us to understand better the needs of existing and future customers, improve productivity by enhancing job satisfaction, show us to be fully inclusive, and reduce exposure to risks associated with legislative compliance.
During 2008, a disability-awareness workshop was delivered to human resources managers in both the Consumer Credit Division and Vanquis Bank by the employers’ Forum on Disability. The focus of the training was to give managers an in-depth understanding of our employment obligations under the Disability Discrimination Act and guidance on its practical application.
Communication and engagementWith our workforce spread over a wide geographical area, it is imperative that we have good communication channels in place for our people. In addition, it is important that we make it possible for our people to contribute their comments and suggestions to help us improve our service to our stakeholders.
Home credit agent, Julie, goes through a computer package on responsible lending
Corporate responsibility review – continued

45D
IRECTO
RS’ R
EPOR
T : BU
SINESS R
EVIEW
Annual Report & Financial Statements 2008 Provident Financial plc
benefits to communities where our customers and agents live and our employees work through community partnerships, and working with the money advice sector on financial inclusion initiatives and financial literacy.
Spark, which started in 2006 following extensive stakeholder consultation, continues to be the main strand of the Provident Financial community involvement programme. This arts-based project is managed throughout the UK and Ireland in partnership with the West Yorkshire Playhouse, and delivered with seven other regional theatres and arts centres in Battersea, Birmingham, Bolton, Dublin, Dundee, edinburgh and Newport. The children who get involved in Spark generally have few chances to encounter the arts. Their schools are in the former education Action Zones or excellence In Cities scheme and, as such, are often in the most deprived parts of the UK and Ireland. each of the regional theatres works with a minimum of six schools in its local area, delivering a series of five-week courses of stimulating arts activities to children aged 7 to 11.
During 2008, more than 5,300 children from 52 schools participated in the Spark project. The overall result is that children from some of the
most underprivileged areas of the UK and Ireland are given the opportunity to use the arts to learn and develop, and at the same time, increase their confidence and self-esteem.
We also actively support, through financial contributions and other means, the delivery of a programme of advice and education by the money advice sector across the UK and Ireland. Throughout the year, this continued to involve supporting mainstream money advice organisations such as Citizens Advice, National Debtline and Money Advice Scotland, and working with more specialised providers, including Credit Action, Debt Cred and Christians Against Poverty.
Spark offers children the opportunity to take part in exciting arts activities
Head office employee graeme takes part in a Provident in the Community team challenge
Corporate responsibility review – continued

46
DIR
ECTOR
S’ REPO
RT : B
USIN
ESS REVIEW
Annual Report & Financial Statements 2008 Provident Financial plc
Also during 2008, we carried out initial research on the focus for our community involvement programme from 2010 onwards. The work involved consulting with residents in some of the communities we serve to understand the types of issues our community involvement activities should focus on in the future, and to identify potential community partners.
In 2009, we aim to develop a new, major strand to our community programme. We will work with community leaders in the local communities we serve to identify projects that will benefit each particular community. Our local management will then work with community organisations to deliver each project and provide leadership, manpower, expertise and funding. Our aim is to initiate projects throughout the UK and Ireland.
The environmentProvident Financial’s commitment to manage its impacts on the environment has become a central business issue and a core management activity. By ensuring that our operations, products and services are delivered in an environmentally responsible way, we can grow our business in a way that safeguards the environment.
We have had a group-wide environmental policy in place since 2000, with the focus on energy and resource consumption, and waste, water and transport use minimisation. Our environmental management system is a practical tool that enables our businesses and departments to understand their impact on the environment and manage these in a structured way. It also ensures compliance with environmental legislation which, along with the requirements of ISO 14001, is evaluated on an annual basis through an independent audit.
Assurance and audit processWe remain committed to subjecting our corporate responsibility programme to processes of independent audit and assurance. By doing this we can reassure stakeholders that our CR management systems, processes and procedures are well managed and in accordance with legislation and best practice. It also provides reassurance that our reports and any data we disclose are accurate, complete and material.
CR reportingThe commentary and data contained within our annual CR reports is independently assured by Corporate Citizenship, a specialist management consultancy advising corporations that seek to improve their economic, social and environmental performance. In forming an opinion and making comments about our CR reports, Corporate Citizenship has regard to:
• Theprinciplesofmateriality,completenessand responsiveness which underpin the international assurance standard AccountAbility 1000.
• Thereportingguidanceforcontentandprinciples for defining quality contained in the global Reporting Initiative’s g3 sustainability reporting guidelines.
Community assurance and environmental auditOur community involvement programme has been subject to an external assurance review since 2006. This process assesses our application of the London Benchmarking group (LBg) model and the effectiveness of the implementation of our community strategy. The LBg model is used as the basis for collecting and reporting our community involvement data. This work is also undertaken by Corporate Citizenship.
We’ve been working hard over the past seven years to significantly reduce our energy consumption
Corporate responsibility review – continued

47D
IRECTO
RS’ R
EPOR
T : BU
SINESS R
EVIEW
Annual Report & Financial Statements 2008 Provident Financial plc
Our environmental management system is also audited against the requirements of the international environmental standard ISO 14001. This audit work has been carried out by the consultancy firm SeQM since 2006.
Further informationOur annual corporate responsibility reports provide further information on our approach to CR management and the activities that underpin our programme. Our 2008 report will be available in print and online at www.providentfinancial.com in the summer of 2009. The report is designed to give our stakeholders an account of the way we manage the CR issues that are material to our activities.
If you have any queries or feedback on the CR information reported here or on our approach to CR management in general, please contact our CR manager at [email protected]
Total number of employee volunteering hours
2,283
Our employees 2008 2007 2006
employee turnover (%) 15.9 17.1 22.1
Women (overall) (%) 49 49 49
Women (management) (%) 29 27 24
ethnic minorities (%) 5.2 3.8 4.0
Our customers 2008 2007 2006
Home credit customer satisfaction (%) 95 94 93
Our suppliers 2008 2007 2006
Average creditor days 25 24 30
CR key performance indicators
Corporate responsibility review – continued

48
DIR
ECTOR
S’ REPO
RT : G
OvER
na
nCE
Annual Report & Financial Statements 2008 Provident Financial plc
Our directors, officers and board committees
Our directors, officers and board committees
01. Peter CrookChief Executive Age 45Qualified as a chartered accountant in 1988 having graduated in economics. Between 1990 and 1997 he held a number of different roles within Halifax plc. He then moved to Barclays plc, becoming UK Managing Director of Barclaycard in 2000 and Managing Director of UK Consumer Finance in 2004. He joined Provident Financial in September 2005 as Managing Director of the Consumer Credit Division and was appointed to the board in March 2006. He became Chief Executive in July 2007.
03. Chris GillespieManaging Director, Consumer Credit Division Age 46Joined Barclays in 1979, where he rose to hold a number of senior positions, including Director of Consumer Lending from 2000 to 2002, having qualified as a certified accountant in 1996. He then moved to HFC Bank as Group Director before joining Bradford & Bingley in 2005 as Group Lending Director. He joined Provident Financial in May 2007 as Managing Director of the Consumer Credit Division and was appointed to the board in July 2007. He is also a non-executive director of British Eventing Ltd.
02. Andrew FisherFinance Director Age 51Qualified as a chartered accountant in 1983 having graduated in economics and accounting. He joined Provident Financial in May 2006 as Finance Director and was appointed to the board. Prior to this appointment, he held the position of Finance Director at Premier Farnell plc for 11 years. He was previously a partner at Price Waterhouse.
04. John van Kuffelernon-executive Chairman Age 60Graduated with a degree in economics and qualified as a chartered accountant in 1973. He joined Provident Financial in 1991 as Chief Executive and was appointed Executive Chairman in 1997. He became non-executive Chairman in 2002. He is also non-executive Chairman of Hyperion Insurance Group Limited. He was formerly Chairman of Huveaux PLC.
03
02
04
01

49D
IRECTO
RS’ R
EPOR
T : GO
vERn
an
CE
Annual Report & Financial Statements 2008 Provident Financial plc
Our directors, officers and board committees – continued
05. John MaxwellSenior independent non-executive director Age 64Qualified as a chartered accountant in 1967. He joined the board of Provident Financial in 2000. He is a non-executive director of RSA Insurance Group PLC, London Finance and Investment Group PLC, Homeserve plc and the Royal Automobile Club Ltd.
07. Rob Anderson*
Independent non-executivedirector Age 50Graduated with a degree in business studies and joined Marks and Spencer Plc, where he spent 19 years, latterly as director of the childrenswear business unit. He joined Signet Group plc in 2000 and was appointed Chief Executive of Signet Jewelers Limited’s UK division in 2002.
*Appointed on 2 March 2009.
06. Robert HoughIndependent non-executive director Age 63Qualified as a solicitor in 1970 having graduated in law. He was appointed to the board of Provident Financial in February 2007. He was executive Deputy Chairman of Peel Holdings p.l.c. for 15 years until 2002. He is now non-executive Deputy Chairman of Peel Holdings (Management) Limited and Chairman of Peel Airports Limited. He is a non-executive director of Styles & Wood Group plc and the North West Development Agency and formerly Chairman of Cheshire Building Society.
08. Manjit WolstenholmeIndependent non-executivedirector Age 44After qualifying as a chartered accountant in 1988 with Price Waterhouse, she spent 13 years with Dresdner Kleinwort, latterly as co-head of investment banking. She was a partner at Gleacher Shacklock from 2004 to 2006 and is a non-executive director of Capital and Regional plc. She joined the board of Provident Financial in July 2007.
09. Ken MullenGeneral Counsel and Company Secretary Age 50Qualified as a lawyer in Scotland in 1983 having graduated in law. He joined Provident Financial in June 2007 from Hagemeyer (UK) Limited. He has been company secretary and legal counsel for a number of UK listed companies, including Premier Farnell plc, Silentnight Holdings plc and Whessoe plc.
audit committeeManjit Wolstenholme (Chair)Robert HoughJohn Maxwell
Executive committeePeter Crook (Chair)Andrew FisherChris Gillespie
05
08
06
09
nomination committeeJohn van Kuffeler (Chair)Peter CrookRobert HoughJohn MaxwellManjit Wolstenholme
Remuneration committeeJohn Maxwell (Chair)Robert HoughManjit Wolstenholme
Risk advisory committeeRobert Hough (Chair)Andrew FisherJohn MaxwellManjit Wolstenholme
07
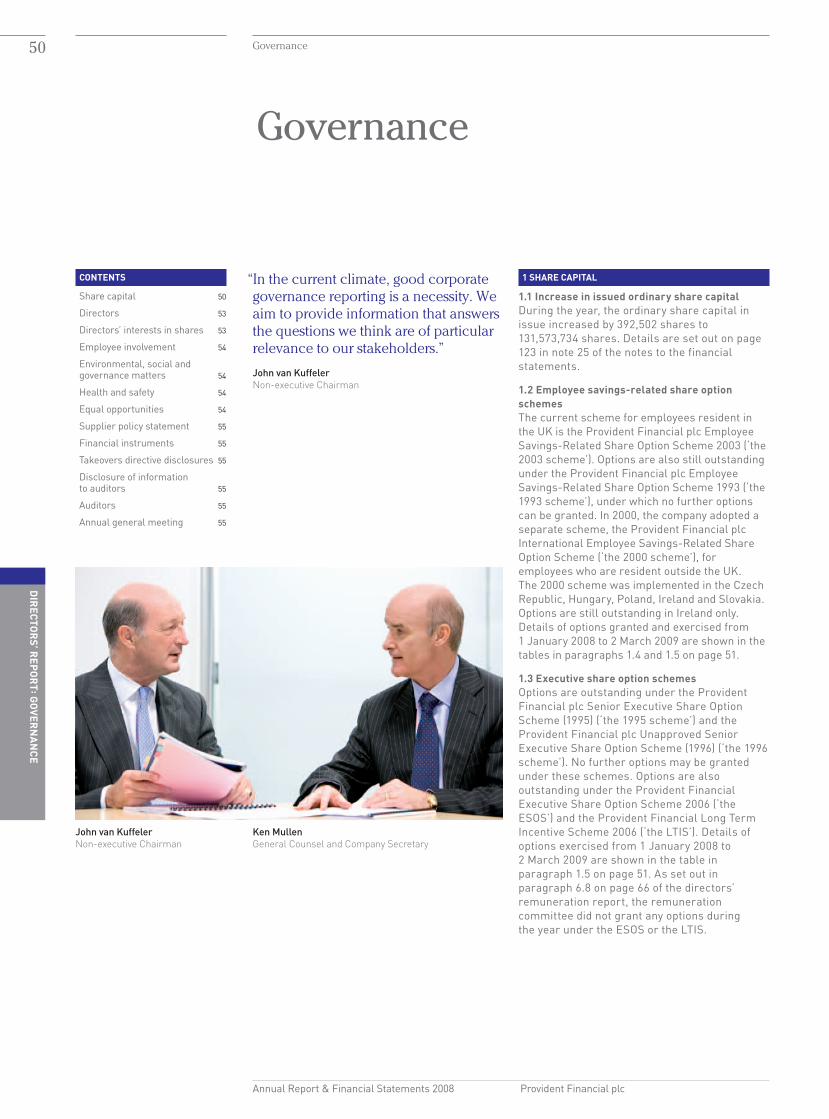
50
DIR
ECTOR
S’ REPO
RT : G
OvER
na
nCE
Annual Report & Financial Statements 2008 Provident Financial plc
Governance
“In the current climate, good corporate governance reporting is a necessity. We aim to provide information that answers the questions we think are of particular relevance to our stakeholders.”
John van KuffelerNon-executive Chairman
1 ShaRE CaPITal
1.1 Increase in issued ordinary share capitalDuring the year, the ordinary share capital in issue increased by 392,502 shares to 131,573,734 shares. Details are set out on page 123 in note 25 of the notes to the financial statements.
1.2 Employee savings-related share option schemesThe current scheme for employees resident in the UK is the Provident Financial plc Employee Savings-Related Share Option Scheme 2003 (‘the 2003 scheme’). Options are also still outstanding under the Provident Financial plc Employee Savings-Related Share Option Scheme 1993 (‘the 1993 scheme’), under which no further options can be granted. In 2000, the company adopted a separate scheme, the Provident Financial plc International Employee Savings-Related Share Option Scheme (‘the 2000 scheme’), for employees who are resident outside the UK. The 2000 scheme was implemented in the Czech Republic, Hungary, Poland, Ireland and Slovakia. Options are still outstanding in Ireland only. Details of options granted and exercised from 1 January 2008 to 2 March 2009 are shown in the tables in paragraphs 1.4 and 1.5 on page 51.
1.3 Executive share option schemesOptions are outstanding under the Provident Financial plc Senior Executive Share Option Scheme (1995) (‘the 1995 scheme’) and the Provident Financial plc Unapproved Senior Executive Share Option Scheme (1996) (‘the 1996 scheme’). No further options may be granted under these schemes. Options are also outstanding under the Provident Financial Executive Share Option Scheme 2006 (‘the ESOS’) and the Provident Financial Long Term Incentive Scheme 2006 (‘the LTIS’). Details of options exercised from 1 January 2008 to 2 March 2009 are shown in the table in paragraph 1.5 on page 51. As set out in paragraph 6.8 on page 66 of the directors’ remuneration report, the remuneration committee did not grant any options during the year under the ESOS or the LTIS.
COnTEnTS
Share capital 50
Directors 53
Directors’ interests in shares 53
Employee involvement 54
Environmental, social and governance matters 54
Health and safety 54
Equal opportunities 54
Supplier policy statement 55
Financial instruments 55
Takeovers directive disclosures 55
Disclosure of information to auditors 55
Auditors 55
Annual general meeting 55
John van KuffelerNon-executive Chairman
Ken MullenGeneral Counsel and Company Secretary
Governance
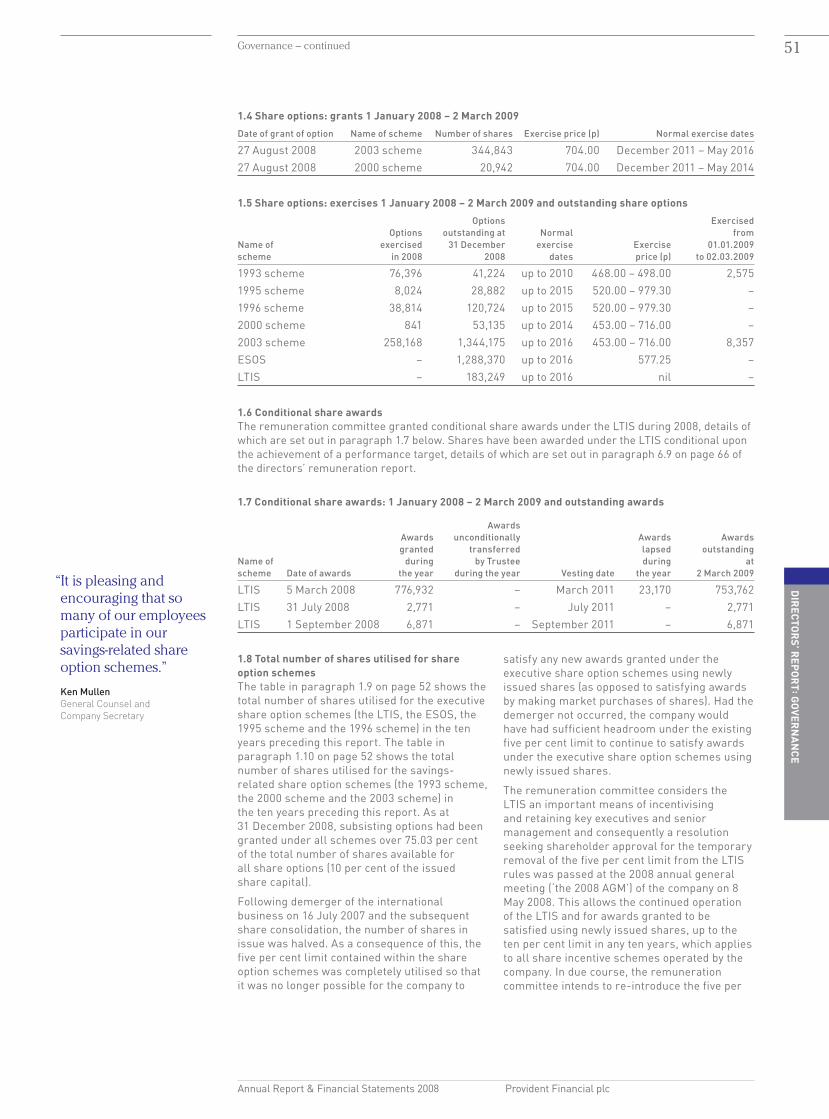
51D
IRECTO
RS’ R
EPOR
T : GO
vERn
an
CE
Annual Report & Financial Statements 2008 Provident Financial plc
Governance – continued
1.4 Share options: grants 1 January 2008 – 2 March 2009
Date of grant of option Name of scheme Number of shares Exercise price (p) Normal exercise dates
27 August 2008 2003 scheme 344,843 704.00 December 2011 – May 201627 August 2008 2000 scheme 20,942 704.00 December 2011 – May 2014
1.5 Share options: exercises 1 January 2008 – 2 March 2009 and outstanding share options
Options Exercised Options outstanding at Normal from Name of exercised 31 December exercise Exercise 01.01.2009 scheme in 2008 2008 dates price (p) to 02.03.2009
1993 scheme 76,396 41,224 up to 2010 468.00 – 498.00 2,5751995 scheme 8,024 28,882 up to 2015 520.00 – 979.30 –1996 scheme 38,814 120,724 up to 2015 520.00 – 979.30 –2000 scheme 841 53,135 up to 2014 453.00 – 716.00 –2003 scheme 258,168 1,344,175 up to 2016 453.00 – 716.00 8,357ESOS – 1,288,370 up to 2016 577.25 –LTIS – 183,249 up to 2016 nil –
1.6 Conditional share awardsThe remuneration committee granted conditional share awards under the LTIS during 2008, details of which are set out in paragraph 1.7 below. Shares have been awarded under the LTIS conditional upon the achievement of a performance target, details of which are set out in paragraph 6.9 on page 66 of the directors’ remuneration report.
1.7 Conditional share awards: 1 January 2008 – 2 March 2009 and outstanding awards
Awards Awards unconditionally Awards Awards granted transferred lapsed outstanding Name of during by Trustee during at scheme Date of awards the year during the year Vesting date the year 2 March 2009
LTIS 5 March 2008 776,932 – March 2011 23,170 753,762LTIS 31 July 2008 2,771 – July 2011 – 2,771LTIS 1 September 2008 6,871 – September 2011 – 6,871
1.8 Total number of shares utilised for share option schemesThe table in paragraph 1.9 on page 52 shows the total number of shares utilised for the executive share option schemes (the LTIS, the ESOS, the 1995 scheme and the 1996 scheme) in the ten years preceding this report. The table in paragraph 1.10 on page 52 shows the total number of shares utilised for the savings-related share option schemes (the 1993 scheme, the 2000 scheme and the 2003 scheme) in the ten years preceding this report. As at 31 December 2008, subsisting options had been granted under all schemes over 75.03 per cent of the total number of shares available for all share options (10 per cent of the issued share capital).
Following demerger of the international business on 16 July 2007 and the subsequent share consolidation, the number of shares in issue was halved. As a consequence of this, the five per cent limit contained within the share option schemes was completely utilised so that it was no longer possible for the company to
satisfy any new awards granted under the executive share option schemes using newly issued shares (as opposed to satisfying awards by making market purchases of shares). Had the demerger not occurred, the company would have had sufficient headroom under the existing five per cent limit to continue to satisfy awards under the executive share option schemes using newly issued shares.
The remuneration committee considers the LTIS an important means of incentivising and retaining key executives and senior management and consequently a resolution seeking shareholder approval for the temporary removal of the five per cent limit from the LTIS rules was passed at the 2008 annual general meeting (‘the 2008 AGM’) of the company on 8 May 2008. This allows the continued operation of the LTIS and for awards granted to be satisfied using newly issued shares, up to the ten per cent limit in any ten years, which applies to all share incentive schemes operated by the company. In due course, the remuneration committee intends to re-introduce the five per
“It is pleasing and encouraging that so many of our employees participate in our savings-related share option schemes.”
Ken MullenGeneral Counsel and Company Secretary

52
DIR
ECTOR
S’ REPO
RT : G
OvER
na
nCE
Annual Report & Financial Statements 2008 Provident Financial plc
Governance – continued
cent limit when the LTIS can be effectively operated in accordance with and subject to a five per cent anti-dilution limit. Information on the resolution was included in the shareholders’ circular and notice of the 2008 AGM.
1.9 Share option schemes: shares utilised for executive share option schemes
Number of Number of Number of options options options Year of grant granted exercised lapsed
1999 517,736 – 454,6582000 1,152,741 1,037,741 95,0002001 371,460 238,302 129,3002002 1,050,919 633,600 354,6492003 1,392,038 854,538 537,5002004 1,700,347 1,002,847 697,5002005 1,593,842 756,298 837,5442006 2,666,693 – 1,195,0742007 – – –2008 9,642* – –Total 10,455,418 4,523,326 4,301,225* Conditional share awards as referred to in paragraph
1.7 on page 51.
1.10 Share option schemes: shares utilised for savings-related share option schemes
Number of Number of Number of options options options Year of grant granted exercised lapsed
1999 651,837 28,750 623,0872000 658,813 14,138 644,6752001 1,527,966 817,926 704,1382002 854,043 485,437 333,2842003 643,990 287,005 337,9142004 848,975 392,634 307,6912005 535,464 235,916 200,0352006 552,987 17,183 128,4862007 402,514 726 39,9832008 365,785 – 4,678Total 7,042,374 2,279,715 3,323,971
1.11 The Provident Financial Qualifying Employee Share Ownership Trust (‘the QUEST’)The QUEST, a discretionary trust for the benefit of group directors and employees, was established to operate in conjunction with the 1993 scheme and the 2003 scheme. The trustee, Provident Financial Trustees Limited, is a subsidiary of the company. As at 31 December 2008 and 31 December 2007, the trustee held no ordinary shares in the company, and as a consequence, action was initiated to wind up the QUEST during 2008. Further details on the QUEST are set out on page 123 in note 25 of the notes to the financial statements.
1.12 Provident Financial plc 2007 Employee Benefit Trust (‘EBT’)The EBT, a discretionary trust for the benefit of group directors and employees, was established on 11 September 2007 and operates in conjunction with the LTIS. The trustee, Kleinwort Benson (Jersey) Trustees Limited is not a subsidiary of the company. The EBT has purchased shares in the market for the purpose of the LTIS and, following the passing of a resolution at the 2008 AGM, is now able to subscribe for the issue of new shares. The EBT will, at no time, hold more than 5 per cent of the issued share capital of the company. When the EBT purchases shares in the market, it is funded by loans from the company which are then used to acquire ordinary shares for the purposes of satisfying conditional share awards granted under the LTIS. For the purposes of the financial statements the EBT is consolidated into the company and group. As a consequence, the loans are eliminated and the cost of the shares acquired is deducted from equity as set out in note 28 on page 129 of the financial statements. On 4 March 2008 the company provided a loan of £6,500,000 to the EBT for the purposes of acquiring ordinary shares in the company and during the period 5 March to 6 March 2008 the EBT purchased 775,066 ordinary shares each at an average price of £8.31 per share to satisfy conditional share awards made under the LTIS on 5 March 2008. In order to satisfy the awards made under the LTIS on 31 July 2008 and 1 September 2008, the EBT subscribed for the issue of 9,642 new shares.
1.13 authority to purchase sharesAt the 2008 AGM, the shareholders authorised the company to purchase up to 13,122,630 of its ordinary shares up until the date of the next AGM or, if earlier, 7 May 2009. No shares were purchased pursuant to this authority. A further authority for the company to purchase its own shares will be sought from shareholders at the forthcoming AGM to be held on 6 May 2009.
1.14 Power to allot shares for cashAt the 2008 AGM, the shareholders authorised the directors to allot equity securities (as defined in section 94 of the Companies Act 1985) for cash up to an aggregate nominal amount of £1,359,981. A further authority for the directors to allot equity securities for cash will be sought from shareholders at the forthcoming AGM to be held on 6 May 2009.

53D
IRECTO
RS’ R
EPOR
T : GO
vERn
an
CE
Annual Report & Financial Statements 2008 Provident Financial plc
Governance – continued
1.15 Substantial shareholdingsOn the basis of the information available to the company as at 2 March 2009, the following investment managers (through segregated managed funds) have interests (though not necessarily beneficial ownership) in aggregate amounting to over 3% (5% for investment trusts and collective investment companies) in the issued ordinary share capital of the company:
Schroders plc 9.88%
Standard Life Investments Limited 7.64%
Prudential plc 7.37%
Invesco Limited 5.04%
Jupiter Asset Management Limited 5.02%
Marathon Asset Management LLP 4.89%
Legal & General Group Plc 4.01%
FIL Limited 3.78%
2 DIRECTORS
2.1 The directors of the company as at 31 December 2008 are listed in paragraph 3.1. They all served as directors throughout 2008 and up to the date of signing of the financial statements.
2.2 During the year no director had a material interest in any contract of significance to which the company or a subsidiary undertaking was a party.
2.3 The company’s articles of association (‘the articles’) permit it to indemnify directors of the company (or of any associated company) in accordance with the Companies Act 1985. The company may fund expenditure incurred by directors in defending proceedings against them. If such funding is by means of a loan, the director must repay the loan to the company if he/she is convicted of any criminal proceedings or judgement is given against him/her in any civil proceedings. The company may indemnify any director of the company or of any associated company against any liability. However, the company may not provide an indemnity against any liability incurred by the director to the company or to any associated company; against any liability incurred by the director to pay a criminal or regulatory penalty; or against any liability incurred by the director in defending criminal proceedings in which he/she is convicted, or in defending any civil proceedings brought by the company (or an associated company) in which judgement is given against him/her, or in connection with certain court applications under the Companies Act 1985. No indemnity was provided and no payments pursuant to these provisions were made in 2008 or at any time up to 2 March 2009.
3 DIRECTORS’ InTERESTS In ShaRES
3.1 The beneficial interests of the directors in the issued share capital of the company were as follows:
Number of shares
31 December 1 January 2008 2008
John van Kuffeler 9,000 9,000Peter Crook* 265,770 121,543Andrew Fisher* 198,027 84,907Chris Gillespie* 191,589 82,137Robert Hough 1,425 1,425John Maxwell 1,050 1,050Manjit Wolstenholme 5,663 5,663* These interests include conditional share awards
granted under the LTIS and awards under the PSP as detailed in paragraphs 9.2 and 10.1 on pages 70 and 71 of the directors’ remuneration report.
3.2 No director had any non-beneficial holdings at 31 December 2008 or at any time up until 2 March 2009.
3.3 The EBT operates in conjunction with the LTIS and the beneficial interest in shares is transferred from the EBT to directors and employees when conditional share awards are made. Full vesting of such shares is subject to the achievement of the performance target set out on page 66 in paragraph 6.9 of the directors’ remuneration report. As at 31 December 2008 the EBT held the non-beneficial interest in 1,507,849 shares in the company (2007: 723,141).
3.4 Details of options granted to and exercised by directors are set out on page 70 in paragraphs 8.1 and 9.1 of the directors’ remuneration report. Details of conditional share awards made to directors are set out on page 70 in paragraph 9.2 and details of awards under the PSP are set out on page 71 in paragraph 10.1 of the directors’ remuneration report.
3.5 There were no changes in the beneficial or non-beneficial interests of the directors between 1 January 2009 and 2 March 2009.
3.6 John Maxwell will be retiring from the board at the AGM on 6 May 2009. Rob Anderson was appointed to the board as a non-executive director on 2 March 2009. Subject to his appointment being approved by shareholders at the 2009 AGM, it is proposed that he will chair the risk advisory committee and will be a member of the audit committee, the nomination committee and the remuneration committee. Robert Hough will chair the remuneration committee and be appointed as the senior independent director from 6 May 2009.

54
DIR
ECTOR
S’ REPO
RT : G
OvER
na
nCE
Annual Report & Financial Statements 2008 Provident Financial plc
Governance – continued
4 EMPlOyEE InvOlvEMEnT
4.1 The company encourages employee involvement in the company’s activities and performance through operating company newsletters, regular management team briefings, staff meetings and conferences including trades union meetings in those companies which recognise unions. The company carries out employee engagement surveys on a regular basis.
4.2 The company operates three savings-related share option schemes (referred to on page 50 in paragraph 1.2), aimed at encouraging employees’ involvement and interest in the financial performance and success of the group through share ownership. 2,463 employees are currently saving to buy shares in the company under these schemes.
4.3 The group operates two pension schemes. Involvement in the group defined benefit pension scheme is achieved by the appointment of member nominated trustees and by regular newsletters and communications from the trustees to members. In addition, there is a website dedicated to pensions matters. The group also operates a stakeholder pension plan for employees who joined the group from 1 January 2003. Employees in this plan receive regular newsletters and have access to a dedicated website which provides information on their funds.
4.4 The company is fully committed to encouraging employees at all levels to study for relevant educational qualifications and to training employees at all levels in the group.
5 EnvIROnMEnTal, SOCIal anD GOvERnanCE MaTTERS
5.1 During the year, the company made donations for charitable purposes of £506,602 (2007: £566,723). The group invested a further £290,163 (2007: £413,531) in support of community programmes (based on the London Benchmarking Group’s guidelines). No political donations were made (2007: nil).
5.2 Details of the group’s corporate responsibility activities are set out on pages 40 to 47 of the directors’ report and on the company’s website.
5.3 The board takes regular account of the significance of environmental, social and governance (‘ESG’) matters to the businesses of the group. A corporate affairs activity report, which deals with relevant matters, is presented at each board meeting. A corporate responsibility report is presented to the board annually. Responsibility for this area rests with the Chief Executive, Peter Crook.
5.4 The group’s risk management processes, details of which are set out in paragraph 7 on page 60 and in paragraph 9 on pages 60 to 61 (internal control) of the key governance principles section of the directors’ report, enable the board to review and manage material risks arising from ESG matters. The board has identified and assessed the significant ESG risks
and considers that it has adequate information relating to them.
5.5 There are no specific remuneration incentives in the group based on ESG matters. However, the annual bonus scheme for executive directors comprises specific objectives, which include such matters where appropriate; details of this are set out on page 65 in paragraph 6.5 of the directors’ remuneration report. Details of training for directors are set out on page 58 in paragraph 2.16 of the key governance principles section of the directors’ report.
5.6 The group’s performance against stated corporate responsibility objectives and targets is subject to an annual process of external verification. The environmental management system is also subject to an annual independent audit against the requirements of ISO 14001. Working groups have been established within the divisions to co-ordinate the management of the company’s corporate responsibility performance. Finally, the annual corporate responsibility report is externally verified to confirm that the progress detailed in the report is accurate and that the information it contains is reliable and accurate.
6 hEalTh anD SaFETy
6.1 The group attaches great importance to the health and safety of its employees, to the agents it engages and other people who may be affected by its activities.
6.2 The board has approved a group-wide health and safety policy and a framework for health and safety. Each divisional board is responsible for the issue and implementation of its own health and safety policy in order to comply with the division’s day-to-day responsibility for health and safety. Health and safety is considered regularly at divisional board meetings and each divisional board produces a formal written report on compliance with the group-wide health and safety policy and framework for the Provident Financial plc board once a year in February.
6.3 An annual audit of the health and safety policies established by the Consumer Credit Division, in particular those relating to agent safety, is carried out by the company’s insurers American Insurance Group. The results of the 2008 audit showed an excellent level of compliance with the policies and made recommendations, which were subsequently actioned, for the roll-out of branch specific health and safety initiatives across the entire network of branches.
7 EQUal OPPORTUnITIES
The company is committed to equal opportunity in recruitment, promotion and employment and does not discriminate on the basis of age, gender, disability, religious belief, nationality, ethnic or racial origin, sexual orientation or marital status.

55D
IRECTO
RS’ R
EPOR
T : GO
vERn
an
CE
Annual Report & Financial Statements 2008 Provident Financial plc
Governance – continued
The company gives full and fair consideration to applications for employment from disabled persons where they have the appropriate skills and abilities. It is the policy of the group that the training, career development and promotion opportunities of disabled persons should, as far as possible, be identical to that of other employees.
In the event of an employee becoming disabled, every effort is made to ensure their employment with the group continues and employees are retrained where necessary to enable them to perform work identified as appropriate and tailored, where practicable, for their specific needs, aptitudes and abilities.
8 SUPPlIER POlICy STaTEMEnT
8.1 The company agrees terms and conditions for its business transactions with suppliers and payment is made in accordance with these, subject to the terms and conditions being met by the supplier.
8.2 The company acts as a holding company and had no trade creditors at 31 December 2008 or at 31 December 2007. The average number of days’ credit taken by the group during the year was 25 days (2007: 24 days).
9 FInanCIal InSTRUMEnTS
Details of the financial risk management objectives and policies of the group and the exposure of the group to credit risk, liquidity risk, interest rate risk and foreign exchange rate risk are included on pages 85 to 87 of the financial statements.
10 TakEOvERS DIRECTIvE DISClOSURES
10.1 Details of the company’s issued share capital are set out on page 123 in note 25 of the notes to the financial statements and details of significant shareholdings are set out on page 53 of this report. All of the company’s issued ordinary shares are fully paid up and rank equally in all respects and there are no special rights with regard to control of the company. The rights attached to them, in addition to those conferred on their holders by law, are set out in the company’s articles. There are no restrictions on the transfer of ordinary shares or on the exercise of voting rights attached to them, except (i) where the company has exercised its right to suspend their voting rights or to prohibit their transfer following the omission of their holder or any person interested in them to provide the company with information requested by it in accordance with Part 22 of the Companies Act 2006 or (ii) where their holder is precluded from exercising voting rights by the FSA’s listing rules or the City Code on Takeovers and Mergers.
10.2 Details of the QUEST and EBT, which are operated in accordance with the company’s employee share schemes, are set out in paragraphs 1.11 and 1.12 on page 52 of this
report. As at 1 January 2009, the QUEST did not hold any shares in the company and the EBT, which cannot hold more than 5% of the issued share capital of the company, may exercise or refrain from exercising any voting rights in its absolute discretion and is not obliged to exercise such voting rights in a manner requested by the employee beneficiaries.
10.3 Rules about the appointment and replacement of directors are set out in the articles and in paragraph 2.12 on page 57 of the key governance principles section of this report. The directors’ powers are conferred on them by UK legislation and by the articles. Changes to the articles must be approved by shareholders passing a special resolution.
10.4 Details of the authority of the company to issue shares and purchase shares of the company are set out in paragraphs 1.13 and 1.14 on page 52 of this report.
10.5 There are no agreements between any group company and any of its employees or any director of the company which provide for compensation to be paid to the employee or director for termination of employment or for loss of office as a consequence of a takeover of the company.
10.6 There are no significant agreements to which the company is a party that take effect, alter or terminate upon a change of control following a takeover bid for the company.
11 DISClOSURE OF InFORMaTIOn TO aUDITORS
In the case of each person who is a director at the date of this report, it is confirmed that, so far as the director is aware, there is no relevant audit information of which the company’s auditors are unaware; and he/she has taken all reasonable steps that ought to have been taken as a director in order to make himself/herself aware of any relevant audit information and to establish that the company’s auditors are aware of that information. This confirmation is given and should be interpreted in accordance with the provisions of section 234ZA(2) of the Companies Act 1985.
12 aUDITORS
A resolution to reappoint PricewaterhouseCoopers LLP as auditors to the company will be proposed at the forthcoming AGM.
13 annUal GEnERal MEETInG
The AGM will be held at 12.30pm on Wednesday 6 May 2009 at the Marriott Hollins Hall Hotel & Country Club, Hollins Hill, Baildon, Shipley, West Yorkshire BD17 7QW. The Notice of Meeting, together with an explanation of the items of business, will be contained in a circular to shareholders to be dated 23 March 2009.

56
DIR
ECTOR
S’ REPO
RT : G
OvER
na
nCE
Annual Report & Financial Statements 2008 Provident Financial plc
56 Key governance principles
1 InTRODUCTIOn
This section explains how the company has applied the main and supporting principles set out in Section 1 of the Combined Code published by the Financial Reporting Council in June 2006 (‘the 2006 Combined Code’), as amended in June 2008.
The statement of compliance is set out on page 62 in paragraph 13 of the directors’ report.
2 ThE BOaRD
Composition2.1 The board leads and controls the company. It currently comprises three executive directors, four non-executive directors and a Chairman. A.1 – Compliant
Division of responsibilities between the Chairman and the Chief Executive2.2 The board has previously approved a statement of the division of responsibilities between the Chairman and the Chief Executive. The Chairman is responsible for chairing the board meetings, and monitoring their effectiveness, and chairing the AGM and the nomination committee. He is also responsible for ensuring that an effective strategy is approved by the board and that an annual evaluation of the board is carried out. The Chief Executive is primarily responsible for implementing the company’s strategy, as well as being a focal point for communication with shareholders. All other responsibilities (other than those detailed above, those reserved to the board as a whole and the board committees) are the responsibility of the Chief Executive, who delegates appropriately. A.2.1 – Compliant
Chairman2.3 The Chairman was also Chairman of Huveaux PLC until 6 November 2008 and on 1 February 2009 he became Chairman of Hyperion Insurance Group Limited. This appointment involves no more than one day’s work per week. There have been no other material changes in his other commitments during the year or since the year end. A.4.3 – Compliant
non-executive directors2.4 Each of the non-executive directors has been formally determined by the board to be independent for the purposes of the Combined Code, as each was found to be free from any material business or other relationship with the company (either directly or as a partner, shareholder or officer of an organisation that has a relationship with the company). Accordingly, the board believes that there are no such relationships which could materially interfere with their independent judgement. A.3.1 – Compliant
2.5 Non-executive directors are currently appointed for fixed periods of three years, subject to appointment by shareholders. The initial three-year period may be extended for one further three-year period (and, in exceptional cases, further extended), subject to re-appointment by shareholders. Their letters of appointment may be inspected at the company’s registered office or can be obtained on request from the Company Secretary. A.4.4/A.7.2 – Compliant
2.6 John Maxwell has been appointed as the senior independent director. He is available to shareholders if they have concerns which contact through the normal channels of Chairman, Chief Executive or Finance Director has failed to resolve or for which such contact is inappropriate. John Maxwell will be retiring from the board at the AGM on 6 May 2009, and will be replaced by Robert Hough as the senior independent director on that date. A.3.3 – Compliant
Governance framework2.7 The board has a formal schedule of matters specifically reserved to it for decision, including corporate strategy, approval of budgets and financial results, new board appointments, proposals for dividend payments, the approval of all major transactions and authorisation of directors’ interests that conflict, or may conflict with the interests of the company. This schedule is reviewed on an annual basis and was last reviewed on 22 October 2008. There are five principal board committees. All committees have written terms of reference which are reviewed on
COnTEnTS
Introduction 56
The board 56
Report on the audit committee 58
Report on the nomination committee 59
Report on the remuneration committee 59
Report on the executive committee 59
Report on the risk advisory committee 60
Accountability 60
Internal control 60
Relations with shareholders 61
Directors’ responsibilities in relation to the financial statements 61
Disclosure and Transparency Rules statement 62
Statement of compliance with the Combined Code 62
Key governance principles

57D
IRECTO
RS’ R
EPOR
T : GO
vERn
an
CE
Annual Report & Financial Statements 2008 Provident Financial plc
57
an annual basis and were last updated on 22 October 2008. The terms of reference can be found on the company’s website or are available on request from the Company Secretary. In addition, the group has detailed corporate policies which set out authority levels within the group. Divisional boards are required to report on compliance with the corporate policies on an annual basis. A.1.1 – Compliant
Meetings2.8 The board normally has eight scheduled meetings a year, including an annual planning conference. A pack of board papers (including a detailed agenda) is sent to each director in the week before the board meeting so that he/she has sufficient time to review them. All directors are, therefore, able to bring independent judgement to bear on issues such as strategy, performance, resources and standards of conduct. Additional meetings are called when required and there is frequent contact between meetings, where necessary, to progress the company’s business. In 2008, the Chairman met with the non-executive directors without any executive director present. The non-executive directors met without the Chairman present to discuss the Chairman’s performance and the senior independent director discussed comments arising with the Chairman. A.1.3 – Compliant
Board meetings
Total number of board meetings in 2008 8John van Kuffeler (Chair) 8/8Peter Crook 8/8Andrew Fisher 8/8Chris Gillespie 8/8John Maxwell 8/8Robert Hough 8/8Manjit Wolstenholme 8/8
A.1.2 – Compliant
Company Secretary2.9 All directors are able to consult with the Company Secretary. The appointment and removal of the Company Secretary is a matter for the board. The Company Secretary is secretary to all the board committees. A.5.3 – Compliant
Independent advice2.10 There is a formal procedure by which any director may take independent professional advice relating to the performance of his/her duties at the company’s expense. A.5.2 – Compliant
Insurance2.11 The company has arranged appropriate Directors’ and Officers’ liability insurance in respect of legal action against directors. A.1.5 – Compliant
Re-appointment of directors2.12 Under the company’s articles, each director should retire, but may be re-appointed, at least at every third AGM as well as at the first AGM following appointment. Also, after nine years, a director must offer himself/herself for re-appointment annually. In 2008, biographical details of the directors submitted for re-appointment at the AGM were supplied in the shareholders’ circular and notice of the 2008 AGM. A.7.1 – Compliant
Policy on other board appointments2.13 The board’s policy on other directorships is designed to ensure that directors remain able to discharge their responsibilities to the company. This applies to the Chairman, executive directors and non-executive directors. The policy is set out in paragraphs 2.13.1 to 2.13.3 below. Any request for an exception to this policy is considered on its merits. A.4.4/A.4.5 – Compliant
2.13.1 As specified in the letters of appointment of the non-executive directors, any proposed appointment to the board of another company will require the prior approval of the board. A.4.4 – Compliant
2.13.2 In accordance with the Combined Code, an executive director will be permitted to hold one non-executive directorship (and to retain the fees from that appointment) provided that the board considers that this will not adversely affect his executive responsibilities. The board would not permit an executive director to take on the chairmanship of a FTSE 100 company. A.4.5 – Compliant
2.13.3 The company’s policy is that a non-executive director should have sufficient time to fulfil his/her duties to the company, including chairing a committee. The board will consider all requests for permission for other directorships carefully, having regard to the following principles. A non-executive director would not be expected to hold more than four other material non-executive directorships. If he/she holds an executive role in a FTSE 350 company, he/she would not be expected to hold more than two other material non-executive directorships. Only one FTSE 100 company, or two FTSE 350 companies, should be chaired at any given time. A.4.4 – Compliant
Performance evaluation2.14 In November 2008, the board completed the sixth evaluation of its performance and that of its committees and individual directors. The Chairman was primarily responsible for this evaluation and submitted a questionnaire to all directors. This contained questions on different aspects of the operation of the board and its
Key governance principles – continued

58
DIR
ECTOR
S’ REPO
RT : G
OvER
na
nCE
Annual Report & Financial Statements 2008 Provident Financial plc
committees and the performance of individual directors. The senior independent director was responsible for collating comments on the Chairman’s performance. A summary of the evaluation was presented to the board on 11 December 2008 which showed that the board, its committees and individual directors were working effectively. The results of the evaluation and proposals to take account of any matters arising were agreed. A.6.1 – Compliant
Conflicts of interest2.15 The company has procedures in place to enable the board to review and authorise conflict situations as appropriate. The board has fully complied with all the requirements of these procedures since 1 October 2008.
Training2.16 Appropriate training and briefing is provided to all directors on appointment to the board, taking into account their individual qualifications and experience. Ongoing training is arranged to suit their individual needs (including environmental, social and governance training as appropriate) and the Company Secretary, reporting to the Chairman, is responsible for identifying appropriate training courses for directors. Update sessions are arranged for the board as necessary. In May 2008, Eversheds LLP attended the board meeting to present an overview of the Companies Act 2006 and to give training on directors’ duties. A.5.1 – Compliant
3 REPORT On ThE aUDIT COMMITTEE
3.1 Meeting attendance: Audit committee meetings
Total number of meetings in 2008 3Manjit Wolstenholme (Chair) 3/3Robert Hough 3/3John Maxwell 3/3
C.3.1 – Compliant
3.2 The committee makes recommendations to the board, for the board to put to shareholders in general meeting, in relation to the appointment, re-appointment and removal of the auditors and approves their remuneration and terms of engagement. It reviews and monitors the independence and objectivity of the auditors and the effectiveness of the audit process, taking into consideration relevant UK professional and regulatory requirements. It develops and implements policy on the engagement of the auditors to supply non-audit services and reports to the board (identifying any matters in respect of which it considers that action or improvement is needed) and makes recommendations as to the steps to be taken. It monitors the integrity of the financial statements of the group and the formal
announcements relating to the group’s financial performance, reviewing significant financial reporting judgements contained in them. It also reviews the group’s internal and external whistleblowing policy and established an independent external confidential reporting line in 2008. The committee is also responsible for the annual review of the register of benefits offered to directors in accordance with the company’s code of practice on benefits. C.3.2/C.3.3/C.3.4 – Compliant
3.3 Manjit Wolstenholme took over the chair of the committee on her appointment to the board. She is a chartered accountant and is considered to have the recent and relevant financial experience required by the provisions of the Combined Code. The other members of the committee have a wide range of business and financial experience which is evidenced by their biographical summaries on page 49. C.3.1– Compliant
3.4 The group’s internal audit function was provided by Ernst & Young LLP (‘E&Y’) during 2008. From 1 January 2009, following the appointment of a Head of Audit & Risk, the internal audit function will be provided by an in-house team. The committee formally agrees the internal audit plan once a year and reviews regular reports on the activity of the internal audit function. As the internal audit function reports to the committee, this helps to ensure the function’s independence from group management and ensures that appropriate action is taken in response to audit findings. C.3.5 – Compliant
3.5 At the invitation of the committee, meetings are attended by both the internal and external auditors as required and by the Finance Director and the group Financial Controller.
3.6 At its February and September meetings the committee had a separate session with the group’s auditors PricewaterhouseCoopers LLP (‘PwC’) and the group’s internal auditors, E&Y, without any executive director or employee of the company or group being present. This gave members of the committee the opportunity to raise any issues, including any issues on the final or interim results of the group directly with PwC and E&Y. C.3.2 – Compliant
3.7 The committee is conscious of the need to ensure that the auditors are, and are perceived to be, independent and its work relating to this is summarised in paragraphs 3.7.1 to 3.7.5 below. C.3.2 – Compliant
3.7.1 PwC provide the committee with a letter of independence, which is regularly updated and considered by the committee. C.3.2 – Compliant
3.7.2 The committee has adopted a policy on the appointment of staff from the auditors to positions within the various group finance departments. It grades appointments into four categories and sets out the approvals required. Neither a partner of the audit firm who has
Key governance principles – continued

59D
IRECTO
RS’ R
EPOR
T : GO
vERn
an
CE
Annual Report & Financial Statements 2008 Provident Financial plc
acted as engagement partner, the quality review partner, other key audit partners or partners in the chain of command, nor a senior member of the audit engagement team, may be employed as group Finance Director, group Financial Controller or a divisional finance director. C.3.2 – Compliant
3.7.3 The company has a formal policy on the use of auditors for non-audit work. This policy is reviewed once a year. C.3.2 – Compliant
3.7.4 The main elements of the policy are as follows: The award of non-audit work to the auditors is managed in order to ensure that the auditors are able to conduct an independent audit and are perceived to be independent by the group’s shareholders and other stakeholders. The performance of non-audit work by the group’s auditors should be minimised and work should be awarded only when, by virtue of their knowledge, skills or experience, the auditors are clearly to be preferred over alternative suppliers. The group should maintain an active relationship with at least two other professional accounting advisers. The nature and cost of all non-audit work awarded to the group’s external auditors for the period since the last meeting and for the year to date is reported to each meeting of the audit committee, together with an explanation as to why the auditors were the preferred supplier. No information technology, remuneration, recruitment, valuation or general consultancy work may be awarded to the auditors without the prior approval of the chair of the audit committee, such approval to be given only in exceptional circumstances. The chair of the audit committee must approve in advance any single award of non-audit work with an aggregate cost of £250,000 or more. The auditors may not perform internal audit work. C.3.2 – Compliant
3.7.5 In 2008, the committee regularly considered a schedule of non-audit work carried out by PwC. Work carried out by PwC for the group in 2008 fell broadly into four categories: fees payable for the audit of the parent company and consolidated financial statements; audit of the company’s subsidiaries pursuant to legislation; other services pursuant to legislation and tax services. Fees paid to PwC in 2008 are set out on page 91 in note 4 of the notes to the financial statements. C.3.7 – Compliant
3.8 The committee has formally considered its effectiveness in 2008. The overall view was that the committee was working effectively. A.6.1 – Compliant
4 REPORT On ThE nOMInaTIOn COMMITTEE
4.1 Meeting attendance: Nomination committee meetings
Total number of meetings in 2008 1John van Kuffeler (Chair) 1/1Peter Crook 1/1Robert Hough 1/1John Maxwell 1/1Manjit Wolstenholme 1/1
4.2 The committee’s remit is to assist the board in the process of the selection and appointment of any new director and to recommend to the board the appointment of any new director. It keeps under review the structure, size and composition of the board. It considers and, if appropriate, recommends to the board the extension of the term of office of a non-executive director. It considers the succession plan annually and reports to the board that it has done so. There is a formal schedule of matters reserved to it for decision. A.4.1 – Compliant
4.3 At its meeting in February 2008, the committee carried out a rigorous review of the performance of John Maxwell and recommended a further extension to his term of office to 31 May 2009. A.7.2 – Compliant
4.4 The committee reviewed the structure and composition of the board in 2008 and initiated a search for a new non-executive director to replace John Maxwell, who has indicated his intention to retire from the board at the AGM on 6 May 2009. The committee reported formally to the board on the candidates identified by the search and recommended to the board the appointment of Rob Anderson as a non-executive director, subject to shareholder approval at the AGM on 6 May 2009. The committee prepared a description of the role and capabilities required for the appointment and managed the selection process with the help of an external search consultant. A.4.2/A.4.6 – Compliant
5 REPORT On ThE REMUnERaTIOn COMMITTEE
Full details of the composition and work of the remuneration committee are contained on page 64 in paragraph 5 of the directors’ remuneration report. B.1/B.2 – Compliant
6 REPORT On ThE ExECUTIvE COMMITTEE
The committee normally meets at least once a week, and more frequently as required, and deals with matters relating to the running of the group, other than those matters reserved to the board and those specifically assigned to the other committees. There is a formal schedule of matters reserved to it for decision.
Key governance principles – continued

60
DIR
ECTOR
S’ REPO
RT : G
OvER
na
nCE
Annual Report & Financial Statements 2008 Provident Financial plc
7 REPORT On ThE RISk aDvISORy COMMITTEE
7.1 Meeting attendance: Risk advisory committee meetings
Total number of meetings in 2008 1Robert Hough (Chair) 1/1Andrew Fisher 1/1John Maxwell 1/1Manjit Wolstenholme 1/1
7.2 The group’s risk management framework is overseen by the risk advisory committee on behalf of the board. The risk advisory committee is chaired by Robert Hough and comprises the Finance Director and the other non-executive directors. Its function is to keep under review the group’s risk management framework, and to report to the board on its work. It reviews the group’s risk registers, considers the most important risks facing the group. and is responsible for reviewing the group’s Internal Capital Adequacy Assessment Process (‘ICAAP’) prior to submission to the board.
The risk advisory committee delegates a number of responsibilities to the risk advisory group which comprises the executive directors, the Company Secretary, the group Financial Controller and the Head of Audit & Risk. The risk advisory group considers the extent and
nature of the risks facing the group, the extent and categories of risk which are acceptable to bear, the likelihood of the risk materialising, the group’s ability to mitigate any risk, and the costs of operating particular controls relative to the benefits obtained. It also reviews the risk registers prepared by the divisional risk committees twice a year, challenging and making changes where appropriate. It submits a schedule of key risks, divisional key risk registers and the ICAAP to the risk advisory committee for review. C.2.1 – Compliant
8 aCCOUnTaBIlITy
The board presents the company’s position and prospects in as clear a way as possible, both by means of the annual report and in circulars and reports to shareholders. These documents are posted on the company’s website at www.providentfinancial.com. Announcements made by the company to the London Stock Exchange are also posted on the company’s website.
9 InTERnal COnTROl
9.1 The board is responsible for the company’s system of internal control and for reviewing its effectiveness. The system is designed to manage, rather than eliminate, the risk of failure to achieve business objectives and any system can provide only reasonable and not
Key governance principles – continued
Board of directors
Bi-annual budget process
Corporate policy
manual
Risk advisory
committee
Audit committee
Monthly management
accounts
Committee
Process
Executive committee
Treasury committee
Divisional boards
Risk advisory
group
Internal audit

61D
IRECTO
RS’ R
EPOR
T : GO
vERn
an
CE
Annual Report & Financial Statements 2008 Provident Financial plc
absolute assurance against material misstatement or loss. C.2.1 – Compliant
9.2 The key elements of the internal control system, which have been established in accordance with the revised Guidance for Directors on the Combined Code, are set out in paragraphs 9.2.1 to 9.2.4 below. C.2 – Compliant
9.2.1 In December each year, the board approves detailed budgets and cash flow forecasts for the year ahead. It also approves outline projections for the subsequent four years. An update to the budget is performed in June each year. Actual performance against budget is monitored in detail within the group’s management accounts and this is supplemented with a rolling forecast of the full year outturn. The group’s management accounts form part of the board papers for each meeting. The company reports to shareholders on a half-yearly basis. C.2.1 – Compliant
9.2.2 The audit committee keeps under review the adequacy of internal controls (including financial, operational and compliance controls)in conjunction with the internal auditors and reports to the board regularly. An annual programme of work which targets and reports on higher risk areas is carried out by the internal auditors. The operation of internal financial controls is monitored by regular management reviews, including a procedure by which each division certifies compliance quarterly. C.2.1 – Compliant
9.2.3 The risk advisory committee considers the nature and extent of the risks facing the group, keeps them under review, reviews the framework to mitigate such risks, and notifies the board of changes in the status and control of risks. It reports to the board on a regular basis. In addition, the risk advisory group formally reviews the divisional risk registers twice a year. It reports to the risk advisory committee. C.2.1 – Compliant
9.2.4 The board requires the divisions to operate in accordance with its corporate policies and divisions are obliged to certify compliance on an annual basis. C.2.1 – Compliant
9.3 In accordance with the revised Guidance for Directors on the Combined Code, the board has reviewed the effectiveness of the group’s framework of internal controls during 2008. The process for identifying, evaluating and managing the significant risks faced by the group, as set out above, was in place throughout 2008 and up to 2 March 2009 and no significant failings or weaknesses were identified during this period. The board has also, whenever appropriate, ensured that necessary actions have been, or are being taken, to remedy significant failings or weaknesses identified from the review of the effectiveness of internal control. C.2.1 – Compliant
10 RElaTIOnS wITh ShaREhOlDERS
10.1 Members of the board meet with institutional shareholders on a regular basis. The Chairman is responsible for ensuring that appropriate channels of communication are established between directors and shareholders and ensuring that the views of the shareholders are made known to the board. An investor relations report is considered by the board at each meeting and independent reviews of shareholder views are commissioned. D.1.1/D.1.2 – Compliant
10.2 The company encourages private investors to attend the AGM. The chair of each of the board committees is available to answer questions from shareholders at the AGM and there is an opportunity for shareholders to ask questions on each resolution proposed. D.2.3 – Compliant
10.3 At the 2008 AGM, details of proxy votes cast on each resolution were made available to shareholders and other interested parties by means of an announcement to the London Stock Exchange and on the company’s website. D.2.2 – Compliant
10.4 At the 2008 AGM, the company proposed separate resolutions on substantially separate issues and will continue to do so. It is the company’s policy to give shareholders in excess of 20 working days’ notice of the AGM. D.2.1/D.2.4 – Compliant
10.5 The company introduced a dividend reinvestment plan during 2008, which enables all shareholders to elect to receive their dividends in shares should they wish to do so.
11 DIRECTORS’ RESPOnSIBIlITIES In RElaTIOn TO ThE FInanCIal STaTEMEnTS
11.1 The following statement, which should be read in conjunction with the independent auditors’ report on page 133, is made to distinguish for shareholders the respective responsibilities of the directors and of the auditors in relation to the financial statements. C.1.1 – Compliant
11.2 The directors are responsible for preparing the annual report, the directors’ remuneration report and the financial statements in accordance with applicable law and regulations.
11.3 The Companies Act 1985 (and the relevant provisions of the Companies Act 2006) require the directors to prepare financial statements for each financial year. The directors have prepared the financial statements in accordance with International Financial Reporting Standards (‘IFRS’), as adopted by the European Union. The financial statements are required to give a true and fair view of the state of affairs of the company and the group and of the profit or loss of the group for that period.
Key governance principles – continued

62
DIR
ECTOR
S’ REPO
RT : G
OvER
na
nCE
Annual Report & Financial Statements 2008 Provident Financial plc
11.4 In preparing those financial statements, the directors are required to (i) select suitable accounting policies and then apply them consistently; (ii) make judgements and estimates that are reasonable and prudent; (iii) state that the financial statements comply with IFRS as adopted by the European Union; (iv) prepare the financial statements on a going concern basis, unless it is inappropriate to presume that the group will continue in business, in which case there should be supporting assumptions or qualifications as necessary.
11.5 The directors are also required by the Disclosure and Transparency Rules of the Financial Services Authority to include a management report containing a fair review of the business and a description of the principal risks and uncertainties facing the group and company.
11.6 The directors are responsible for keeping proper accounting records that disclose with reasonable accuracy at any time the financial position of the company and group and to enable them to ensure that the financial statements and the directors’ remuneration report comply with the Companies Act 1985 (and the relevant provisions of the Companies Act 2006) and, as regards the group financial statements, Article 4 of the IAS Regulation. They are also responsible for safeguarding the assets of the company and the group and hence taking reasonable steps for the prevention and detection of fraud and other irregularities.
11.7 The Annual Report & Financial Statements 2008 will be published on the company’s website in addition to the normal paper version. The directors are responsible for the maintenance and integrity of the Provident Financial website. Legislation in the United Kingdom governing the preparation and dissemination of financial statements may differ from legislation in other jurisdictions.
12 DISClOSURE anD TRanSPaREnCy RUlES STaTEMEnT
Each of the directors, whose names and functions are set out on pages 48 to 49, confirms that, to the best of his/her knowledge and belief, the financial statements, prepared in accordance with IFRS as adopted by the EU, give a true and fair view of the assets, liabilities, financial position and profit of the group and company; and that the directors’ report contained in this Annual Report and Financial Statements 2008 includes a fair review of the development and performance of the business and the position of the company and group, together with a description of the principal risks and uncertainties it faces.
13 STaTEMEnT OF COMPlIanCE wITh ThE COMBInED CODE
The company complied with the main and supporting principles set out in Section 1 of the Combined Code on Corporate Governance 2006 throughout 2008. It also voluntarily complied with the Combined Code on Corporate Governance published in June 2008 during this period.
Approved by the board on 3 March 2009 and signed by order of the board.
Kenneth J Mullen General Counsel and Company Secretary 3 March 2009
Key governance principles – continued

63
Annual Report & Financial Statements 2008 Provident Financial plc
DIR
ECTOR
S’ REM
Un
ERaTIO
n R
EPOR
T
“ The company’s remuneration policy aims to be competitive, with appropriate elements linked to individual performance, in order to incentivise employees and align their interests with those of other shareholders.”
John MaxwellChairman of the remuneration committee
Directors’ remuneration report
REMUnERaTIOn aT a GlanCE
Remuneration components 2008 – fixed 63
Remuneration components 2008 – variable 63
Remuneration components 2008 – summary 63
REMUnERaTIOn ExPlaInED
Introduction 64
The remuneration committee 64
Remuneration policy 65
REMUnERaTIOn In DETaIl
Directors’ remuneration 69
Share option schemes 70
Long Term Incentive Scheme 70
Performance Share Plan 71
Pensions and life assurance 71
Directors’ service agreements 72
Audit 72
Directors’ remuneration report
1 REMUnERaTIOn COMPOnEnTS 2008 – FIxED £000
Increase in transfer value of Director’s name Salary Benefits pension benefits accrued Total
Peter Crook 510 64 156 730Andrew Fisher 375 59 113 547Chris Gillespie 360 55 108 523
2 REMUnERaTIOn COMPOnEnTS 2008 – vaRIaBlE
Annual bonus Deferred bonus Total Director’s name £000 £000 £000
Peter Crook 510 200 710Andrew Fisher 375 150 525Chris Gillespie 360 140 500
Director’s name Performance Share Plan awards* Conditional share awards
Peter Crook 24,539 basic 24,539 matching 95,149Andrew Fisher 21,579 basic 21,579 matching 69,962Chris Gillespie 21,144 basic 21,144 matching 67,164
* Based on the waiver of 50% of annual bonus awarded in respect of 2007.
3 REMUnERaTIOn COMPOnEnTS 2008 – SUMMaRy
Remuneration at a glance
Element Objective Value Performance targets
Base salary To recognise role and To reflect experience Not applicable responsibilities and market competitiveness
Benefits To provide benefits Cost of permanent health Not applicable commensurate insurance, private medical with role insurance, fully expensed car/cash alternative
annual bonus To link total cash reward Maximum 100% of Based on budgeted to achievement of company basic salary EPS (80%), personal and personal objectives objectives (20%)
Deferred To reward exceptional Between £140,000 Exceptional company bonus company performance and £200,000 performance during in 2008 (in shares) a world financial crisis
Pension To provide funding for Pension credit of 35% of Not applicable retirement salary per annum and life cover
Performance To link remuneration to Based on up to 50% of EPS relative to RPIshares the long-term interests annual bonus plus over a three-year of shareholders matching award period
Conditional To align management Up to 150% of TSR performance share performance with basic salary over a three-yearawards shareholders’ interests period

64
DIR
ECTOR
S’ REM
Un
ERaTIO
n R
EPOR
T
Annual Report & Financial Statements 2008 Provident Financial plc
01
03
04
02
01
03
04
02
01
03
04
02
4 InTRODUCTIOn
This directors’ remuneration report complies with Schedule 7A to the Companies Act 1985 (‘the Companies Act’) and the Listing Rules of the Financial Services Authority. The company also followed the requirements of the Combined Code on Corporate Governance 2006 (‘Combined Code’). This report will be subject to an advisory vote at the AGM of the company to be held on 6 May 2009.
5 ThE REMUnERaTIOn COMMITTEE
5.1 The remuneration committee consists of three non-executive directors, each of whom is, in the opinion of the board, independent. The attendance of each member at meetings of the remuneration committee is shown below and the terms of reference of the remuneration committee are available on the company’s website at www.providentfinancial.com.
Remuneration committee meetings
Total number of meetings in 2008 5John Maxwell (Chair) 5/5Robert Hough 5/5Manjit Wolstenholme 5/5
5.2 Pursuant to its terms of reference, the committee considers the framework of executive remuneration and makes recommendations to the board. It determines the specific remuneration packages and conditions of service
Executive remuneration (excluding pension)
Peter Crook01 Salary 40%02 Benefits 5%03 Annual bonus 40%04 Deferred bonus 15%
01 Salary 39%02 Benefits 6%03 Annual bonus 39%04 Deferred bonus 16%
01 Salary 39%02 Benefits 6%03 Annual bonus 39%04 Deferred bonus 16%
Andrew Fisher
Chris Gillespie
of the Chairman, the executive directors and the Company Secretary, including their service agreements. It also monitors the level and structure of the remuneration of the most senior management below board level within the company. No director is involved in determining his/her own remuneration.
5.3 The committee keeps itself fully informed of developments and best practice in the field of remuneration and it seeks advice from external advisers when it considers it appropriate. In 2008, the committee appointed Towers Perrin as remuneration consultant in place of Kepler Associates Limited (‘Kepler’) to advise on aspects of executive director and senior management pay. The committee considers them both to be independent as they do not provide any other services to the group. Towers Perrin has provided advice to the committee in 2008, as has Kepler. The committee has, in addition, been advised by Eversheds LLP (who have advised the company on various employment and commercial matters) on the operation of the company’s share schemes. In all cases the advisers were instructed by the secretary on behalf of the committee. The Chairman and Chief Executive of the company normally attend and speak at meetings of the committee (other than when their own remuneration or any matter relating to them is being considered). Ken Mullen, General Counsel and Company Secretary, is secretary to the committee and attended all the meetings of the committee in 2008. He also provided legal and technical support to the committee.
Directors’ remuneration report – continued
Proposed changes to remuneration components in 2009
Element Objective Value Performance targets
annual To link total cash Between 125% and 150% Based onbonus reward to of basic salary budgeted EPS achievement of (80%) and personal company and objectives (20%) personal objectives
Performance To link remuneration Based on up to EPS relative toShares to the long-term 50% of annual RPI over a interests of bonus, plus up three-year period shareholders to two matching awards
Conditional To align management Up to 200% of basic TSR and EPS growthshare awards performance with salary over a three-year shareholders’ interests period
Remuneration explained

65D
IRECTO
RS’ R
EMU
nER
aTIOn
REPO
RT
Annual Report & Financial Statements 2008 Provident Financial plc
Directors’ remuneration report – continued
6 REMUnERaTIOn POlICy
6.1 The committee considers it very important that there should be an appropriate proportion of fixed and variable pay. The remuneration policy operated by the committee during the year and, subject to ongoing review by the remuneration committee, to be applied for the following financial year and for future financial years, is based on the need to attract, reward, motivate and retain executive directors in a manner consistent with the long-term accumulation of value for shareholders and achievement of the company’s strategic objectives. The committee is also conscious of the need to avoid paying more than is reasonable for this purpose and therefore the policy of the committee is to pay remuneration at market levels, with a significant proportion subject to performance.
6.2 The executive directors’ remuneration consists of a basic salary, an annual cash bonus (subject to performance conditions) and other benefits including participation in the company’s pension scheme. Additionally, they may participate in a performance share plan (which necessitates the waiver of a minimum of 25% of the annual cash bonus), a long-term incentive scheme, both of which are subject to performance conditions, and an employee savings-related share option scheme which is not subject to performance conditions. In 2009, they will also receive a one-off exceptional bonus (which will be deferred and paid in the form of shares) in recognition of the company’s exceptional performance in 2008. The remuneration policy is designed to ensure that a significant proportion of the executive directors’ remuneration is linked to performance, through the operation of the annual cash bonus and the share incentive schemes. For 2008, variable remuneration accounts for over half of the fair value of executive remuneration (excluding pension).
6.3 The committee normally reviews the executive directors’ remuneration annually. This review takes into account individual performance, experience and market competitiveness. In December 2008, the committee reviewed the salaries and annual cash bonus entitlements of the executive directors. Market competitiveness was assessed against other UK listed financial services providers and companies of a similar size. As a result of this review, the committee agreed to increase the annual cash bonus entitlement of Peter Crook to a maximum of 150% of basic salary for 2009 (120% by reference to earnings per share and 30% by reference to achievement of personal objectives), and to a maximum of 125% of basic salary for Andrew Fisher and Chris Gillespie (100% by reference to earnings per share and divisional performance, where appropriate, and 25% by reference to the
achievement of personal objectives). The committee also set the following executive directors’ salaries effective from 1 January 2009:
Director’s name £
Peter Crook 610,000Andrew Fisher 435,000Chris Gillespie 420,000
In July 2008, the committee, having considered market data provided by Kepler, also reviewed the salary of the Chairman and increased it from £250,000 to £265,000.
6.4 The fees for the non-executive directors, other than the Chairman, are fixed by the board and are designed both to recognise the responsibilities of non-executive directors and to attract individuals with the necessary skills and experience to contribute to the future growth of the company. Their business expenses are also reimbursed by the company. In July 2008 the board, having reviewed market data, increased the fees of the non-executive directors to £50,000. In addition, the board agreed to pay an annual fee of £10,000 in respect of chairing a board committee. Full details of fees for non-executive directors in 2008, with 2007 comparative figures where relevant, are set out in the table of directors’ remuneration in paragraph 7.1 on page 69.
Cash bonuses6.5 An annual cash bonus is payable, subject to the satisfaction of performance conditions. The bonus is calculated as a percentage of salary. The purpose of the bonus scheme is to provide a meaningful cash incentive for executive directors which is clearly focused on improving the company’s performance and aligns, so far as is practicable, shareholder and executive director interests. The committee considers corporate performance on environmental, social and governance (‘ESG’) issues when setting the performance conditions for cash bonuses and will use its discretion to ensure that where appropriate, the management of ESG risks are reflected in the rewards granted to directors and senior management.
6.6 Executive directors are eligible for annual cash bonuses by reference to the company’s audited earnings per share (as defined in the bonus scheme) and divisional profits (where appropriate) which cannot exceed 80% of basic salary, and achievement of specific personal objectives, which cannot exceed 20% of basic salary. The bonus payable in respect of 2008 cannot exceed 100% of salary in total. In exceptional circumstances, the committee may make such adjustments to the calculation of earnings per share as it considers fair and reasonable. The committee carries out a detailed review of the computations involved and ensures that the rules are applied consistently. Furthermore, the independent auditors are

66
DIR
ECTOR
S’ REM
Un
ERaTIO
n R
EPOR
T
Annual Report & Financial Statements 2008 Provident Financial plc
asked to perform agreed-upon procedures on behalf of the committee on the calculations.
6.7 Bonuses do not form part of pensionable earnings.
Share Incentive schemes6.8 The grant of awards under share incentive schemes to executive directors and senior management is normally considered once in each year after the announcement of the company’s results in accordance with a formula determined by reference to salary. The company has three schemes: the Provident Financial Executive Share Option Scheme 2006 (‘the ESOS’), the Provident Financial Long Term Incentive Scheme 2006 (‘the LTIS’) and the Provident Financial Performance Share Plan (‘the PSP’). No further options can be granted under the Provident Financial plc Senior Executive Share Option Scheme (1995) (‘the 1995 scheme’) or the Provident Financial plc Unapproved Senior Executive Share Option Scheme (1996) (‘the 1996 scheme’). The committee reviewed the long-term incentives for the executive directors and senior management, and as a consequence, decided to simplify the share incentive schemes by ceasing to grant options and making conditional share awards to executive directors and senior management under the LTIS, in line with prevailing market practice and in recognition that conditional share awards provide greater alignment with shareholders’ interests.
lTIS6.9 For conditional share awards made in 2008, the committee set a performance target based on the company’s annualised TSR when measured against the annualised TSR of the FTSE 250 Index. The committee considered this to be an appropriate comparator group for Provident Financial given the company’s position in the FTSE 250 Index and its focus on the UK market. The index is market cap weighted which the committee felt was appropriate as vesting of awards will only occur if the company outperforms the broader stock market as a whole. In assessing whether the performance condition has been met the committee will rely on calculations of the company’s TSR and that of the FTSE 250 Index carried out on their behalf by Towers Perrin. In addition, for any shares to vest, the committee must satisfy itself that the company’s TSR performance was a genuine reflection of the underlying business performance of the company. The committee believed that the use of relative TSR as the sole measure was appropriate as it was an objective measure of the company’s success, provided for a fair measure of management performance and was strongly aligned with shareholders’ interests
as it recognised the high dividend yield and rating attributed by the market to the company’s earnings. For awards made in 2008, there will be no vesting if the company’s annualised TSR over a three-year performance period, is less than the annualised TSR of the FTSE 250 Index; 25% of an award will vest if the company’s annualised TSR is in line with that of the FTSE 250 Index, rising to full vesting if the company’s annualised TSR exceeds the annualised TSR of the FTSE 250 Index by 8.5%, measured on a multiplicative basis. Vesting is on a straight-line basis between these two levels. Participation is currently limited to executive directors, certain members of senior management and other employees by invitation. Annual awards are normally subject to a maximum of 150% of basic salary (200% of basic salary in exceptional circumstances). The committee intends to use its discretion, granted pursuant to the rules of the LTIS, to set an appropriate performance target under the LTIS for 2009 and in the future based on absolute TSR and real earnings per share growth. The committee, therefore, intends to set a performance target for 2009 and future awards whereby 50% of the award vests if the company’s average annual growth in earnings per share is equal to or greater than average annual growth in RPI plus 8% over a period of three consecutive years (12.5% of the award will vest if the company’s average annual growth in earnings per share over a period of three consecutive years is equal to average annual growth in RPI plus 3% with vesting on a straight-line basis in between these levels) and the remaining 50% of the award vests if the company’s absolute TSR is at least 15% on an annualised average basis over a period of three consecutive years (12.5% of the award will vest if the company’s absolute TSR is at least 10% on an annualised average basis over a period of three consecutive years, with vesting on a straight-line basis in between these two levels). In respect of conditional share awards to be granted pursuant to the LTIS in the future, the committee also intends, subject to shareholder approval at the AGM on 6 May 2009, to remove the discretion of the committee to grant conditional share awards pursuant to the LTIS in exceptional circumstances up to a maximum of 200% of a participant’s basic salary and simply increase the normal limit from a maximum of 150% to a maximum of 200% of a participant’s basic salary irrespective of whether there are exceptional circumstances.
Directors’ remuneration report – continued
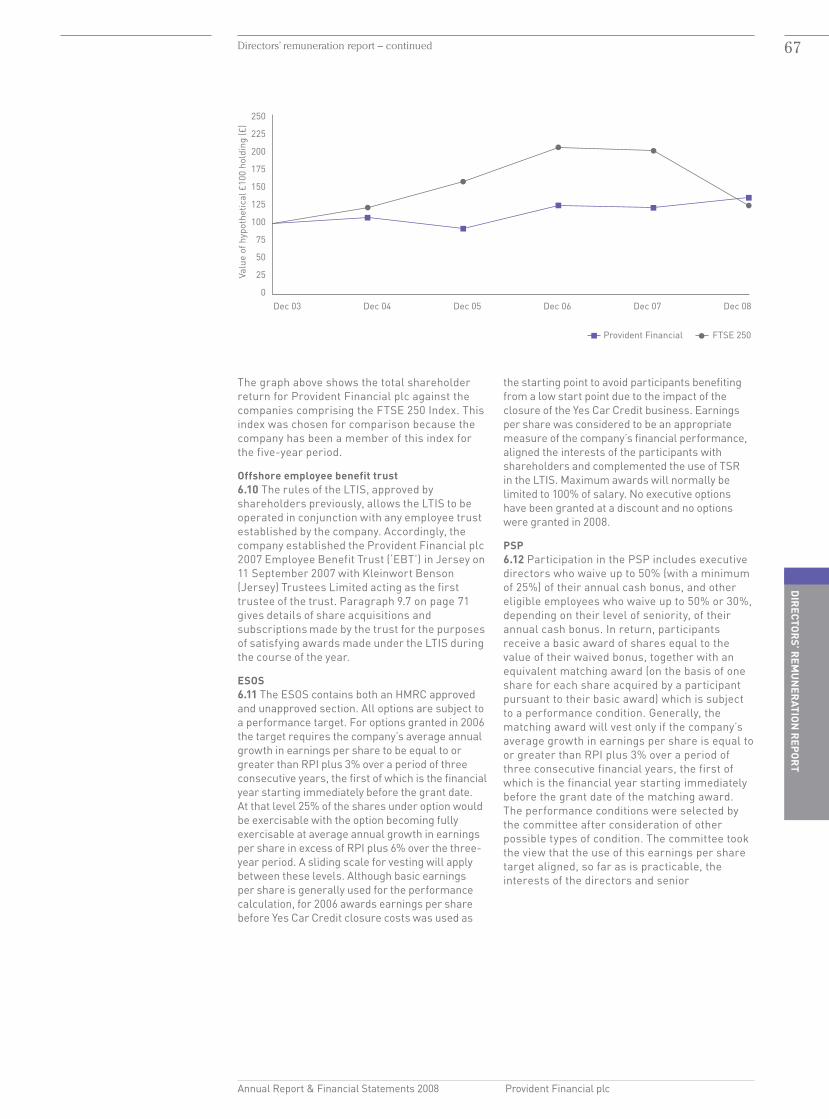
67D
IRECTO
RS’ R
EMU
nER
aTIOn
REPO
RT
Annual Report & Financial Statements 2008 Provident Financial plc
The graph above shows the total shareholder return for Provident Financial plc against the companies comprising the FTSE 250 Index. This index was chosen for comparison because the company has been a member of this index for the five-year period.
Offshore employee benefit trust6.10 The rules of the LTIS, approved by shareholders previously, allows the LTIS to be operated in conjunction with any employee trust established by the company. Accordingly, the company established the Provident Financial plc 2007 Employee Benefit Trust (‘EBT’) in Jersey on 11 September 2007 with Kleinwort Benson (Jersey) Trustees Limited acting as the first trustee of the trust. Paragraph 9.7 on page 71 gives details of share acquisitions and subscriptions made by the trust for the purposes of satisfying awards made under the LTIS during the course of the year.
ESOS6.11 The ESOS contains both an HMRC approved and unapproved section. All options are subject to a performance target. For options granted in 2006 the target requires the company’s average annual growth in earnings per share to be equal to or greater than RPI plus 3% over a period of three consecutive years, the first of which is the financial year starting immediately before the grant date. At that level 25% of the shares under option would be exercisable with the option becoming fully exercisable at average annual growth in earnings per share in excess of RPI plus 6% over the three-year period. A sliding scale for vesting will apply between these levels. Although basic earnings per share is generally used for the performance calculation, for 2006 awards earnings per share before Yes Car Credit closure costs was used as
the starting point to avoid participants benefiting from a low start point due to the impact of the closure of the Yes Car Credit business. Earnings per share was considered to be an appropriate measure of the company’s financial performance, aligned the interests of the participants with shareholders and complemented the use of TSR in the LTIS. Maximum awards will normally be limited to 100% of salary. No executive options have been granted at a discount and no options were granted in 2008.
PSP6.12 Participation in the PSP includes executive directors who waive up to 50% (with a minimum of 25%) of their annual cash bonus, and other eligible employees who waive up to 50% or 30%, depending on their level of seniority, of their annual cash bonus. In return, participants receive a basic award of shares equal to the value of their waived bonus, together with an equivalent matching award (on the basis of one share for each share acquired by a participant pursuant to their basic award) which is subject to a performance condition. Generally, the matching award will vest only if the company’s average growth in earnings per share is equal to or greater than RPI plus 3% over a period of three consecutive financial years, the first of which is the financial year starting immediately before the grant date of the matching award. The performance conditions were selected by the committee after consideration of other possible types of condition. The committee took the view that the use of this earnings per share target aligned, so far as is practicable, the interests of the directors and senior
Directors’ remuneration report – continued
Provident Financial FTSE 250
Dec 07Dec 06Dec 05Dec 04Dec 03 Dec 08
Valu
e of
hyp
othe
tical
£10
0 ho
ldin
g (£
)
0
25
50
75
100
125
150
175
200
225
250

68
DIR
ECTOR
S’ REM
Un
ERaTIO
n R
EPOR
T
Annual Report & Financial Statements 2008 Provident Financial plc
management with those of the shareholders. The committee intends, subject to shareholder approval at the AGM on 6 May 2009, to amend the rules of the PSP to allow the grant of matching awards on the basis of two shares for each share acquired by a participant pursuant to their basic award. Such awards will be subject to more stretching performance targets and will only vest in full if the company’s average annual growth in earnings per share is equal to or greater than RPI plus 7% over a period of three consecutive financial years. If the company’s average annual growth in earnings per share is equal to RPI plus 3% over a period of three consecutive financial years, then a matching award granted on a two-for-one basis (as described above) will only vest as to 50% of the shares subject to the award (which will be the equivalent of receiving a matching award on a one-for-one basis (as described above). A sliding scale of vesting (on a straight-line basis) will apply between these lower and upper targets.
Savings-Related Share Option Scheme6.13 The executive directors (together with other eligible group employees) may participate in the Provident Financial plc Employee Savings-Related Share Option Scheme (2003). Participants save a fixed sum each month for three or five years and may use these funds to purchase shares after three, five or seven years. The exercise price is fixed at up to 20% below the market value of the shares at the date directors and employees are invited to participate in the scheme. Up to £250 can be saved each month. This scheme does not contain performance conditions as it is an HMRC approved scheme designed for employees at all levels.
Other benefits6.14 The executive directors are provided with company-owned cars and fuel (or a cash alternative), long-term disability cover under the company’s permanent health insurance policy and medical cover for them and their immediate families. Benefits in kind are not pensionable.
Share ownership policy6.15 The company has a share ownership policy for executive directors which requires them to retain half of vested shares, net of tax and exercise costs, until a beneficial shareholding equivalent to one times annual salary has been met; in performing the calculation, post-tax embedded gains on vested unexercised share options may be included. The committee reviews the shareholdings of the executive directors in the light of this policy once a year.
Service agreements6.16 The current policy is for executive directors’ service agreements to provide for both the company and the director to give one year’s notice. No director has a service agreement containing a liquidated damages clause on termination. In the event of the termination of an agreement, it is the current policy to seek mitigation of loss by the director concerned and to aim to ensure that any payment made is the minimum which is commensurate with the company’s legal obligations.
Other directorships6.17 The company will normally permit an executive director to hold one non-executive directorship and to retain the fee from that appointment. However, any proposed appointment will require the approval of the board. In accordance with the Combined Code, the board would not permit an executive director to take on the chairmanship of a FTSE 100 company.
Senior management remuneration6.18 The committee considers the structure and level of pay for the most senior level of management within the group.
Detailed information6.19 Full details of salaries, bonus earnings and other benefits for 2008 (with 2007 comparative figures) for the executive directors and full details of the fees paid to non-executive directors are set out in the table of directors’ remuneration in paragraph 7.1 on page 69. Full details of share options are set out in the tables on page 70 in paragraphs 8.1 and 9.1. Full details of conditional share awards under the LTIS are set out in the table on page 70 in paragraph 9.2. Full details of awards under the PSP are set out in the table on page 71 in paragraph 10.1.
Directors’ remuneration report – continued

69D
IRECTO
RS’ R
EMU
nER
aTIOn
REPO
RT
Annual Report & Financial Statements 2008 Provident Financial plc
-100
-80
-60
-40
-20
0
+20
Prov
iden
t Fin
anci
alH
argr
eave
s La
nsdo
wn
Ches
nara
Rat
hbon
esPa
ypoi
ntAb
erde
enTe
non
IPF
FTSE
All
Shar
eCh
arle
s St
anle
ySc
hrod
ers
Inve
stec
Bre
win
Dol
phin
IG G
roup
Ren
sbur
g Sh
eppa
rds
Arbu
thno
tCl
ose
Bro
ther
sH
ansa
rdAs
hmor
eH
ende
rson
FTSE
All
Shar
e G
ener
al F
inM
an G
roup
Inte
rmed
iate
Cap
ital
ICAP
Mon
eysu
perm
arke
t.com
Pola
r Ca
pita
lLi
ontr
ust
Allia
nce
& L
eice
ster
F&C
Hel
phir
ePa
rago
nAC
P Ca
pita
lFa
irpo
int
Plus
Mar
kets
Tau
Capi
tal
Acci
dent
Exc
hang
eB
lueb
ayR
AB C
apita
lCh
arle
mag
neH
BO
SCa
ttle
sD
aven
ham
Loan
mak
ers
New
Sta
rN
orth
ern
Roc
kLo
ndon
Sco
ttis
h B
ank
Bra
dfor
d &
Bin
gley
Total shareholder return in 2008
Abso
lute
TSR
%
Remuneration in detail7 DIRECTORS’ REMUnERaTIOn
7.1 The aggregate directors’ emoluments during the year amounted to £3,604,000 (2007: £4,369,000) analysed as follows: Annual Deferred 2008 2007 Salary bonus* bonus Benefits Total Total Director’s name £000 £000 £000 £000 £000 £000
Executive directorsPeter Crook 510 510 200 64 1,284 1,166Andrew Fisher 375 375 150 59 959 1,075Chris Gillespie 360 360 140 55 915 561Total 1,245 1,245 490 178 3,158 2,802
Annual Deferred 2008 2007 Fees bonus* bonus Benefits Total Total Director’s name £000 £000 £000 £000 £000 £000
ChairmanJohn van Kuffeler 256 – – 29 285 365non-executive directorsJohn Maxwell 51 – – – 51 51Manjit Wolstenholme 57 – – 1 58 25Robert Hough 51 – – 1 52 41 159 – – 2 161 117Total 1,660 1,245 490 209 3,604 3,284
* The annual bonus represents the gross bonus payable to the directors in respect of 2008. Each director has agreed to waive 50% of this gross bonus in order to participate in the Provident Financial Performance Share Plan.
Directors’ remuneration report – continued
Deferred bonus7.2 Separate to the annual bonus arrangement, Peter Crook, Andrew Fisher and Chris Gillespie will receive an additional bonus in respect of the company’s performance during 2008 with a value of £200,000, £150,000 and £140,000 respectively. These bonuses will, however, be deferred until March 2012 and will take the form of an award of ordinary shares in the company which will be acquired by the trustee of the EBT, who will hold the legal title to the shares until they vest. These shares will only vest in the event that the director is still employed by the group in March 2012 (although the committee will have the discretion to allow a departing employee to retain some or all of these shares). The dividends payable on the shares subject to a deferred bonus award will be waived, but an amount equal to the dividends that would have been paid on these shares had the right to receive them not been waived will also be payable in cash or in the form of ordinary shares in March 2012. The committee believes that a
deferred bonus satisfied with shares in the company in the manner set out aligns the interests of the management with those of shareholders, recognises the company’s exceptional performance in 2008 and reflects the need for such performance to be sustained in the medium-term. In particular, the company’s relative performance has been extremely strong, in large part due to the sound judgement and decisions of the executive team. The company has significantly outperformed the majority of the companies in its published comparator group (which includes Cattles, Bradford & Bingley, Northern Rock, Alliance & Leicester, London Scottish Bank and Paragon). The company’s outstanding relative performance in 2008 is illustrated by the chart below. This shows that of the speciality and other finance sector covered by Numis Securities Limited, the company was the only company which delivered a positive return to shareholders in 2008.
Source: datastream, Numis Securities Limited

70
DIR
ECTOR
S’ REM
Un
ERaTIO
n R
EPOR
T
Annual Report & Financial Statements 2008 Provident Financial plc
9 lOnG TERM InCEnTIvE SChEME
9.1 Awards under the LTIS in 2006, which were granted as nil cost options, were as follows: Total Total Market awards awards price held at held at Exercise at date Normal Director’s name Date of award 01.01.2008 31.12.2008 price (p) of grant (p) exercisable dates
Peter Crook 01.06.2006 54,726 54,726 Nil 603 01.06.2009 – 31.05.2016Andrew Fisher 01.06.2006 47,263 47,263 Nil 603 01.06.2009 – 31.05.2016
9.2 Awards under the LTIS in 2007 and 2008, which were granted as conditional share awards, were as follows:
Total Awards Total Market awards granted awards price held at during the held at at date Director’s name Date of award 01.01.2008 year 31.12.2008 of grant (p) Vesting date
Peter Crook 12.09.2007 103,626 868.5 12.09.2010 05.03.2008 95,149 198,775 804 05.03.2011Andrew Fisher 12.09.2007 79,907 868.5 12.09.2010 05.03.2008 69,962 149,869 804 05.03.2011Chris Gillespie 12.09.2007 78,295 868.5 12.09.2010 05.03.2008 67,164 145,459 804 05.03.2011
8.2 Directors’ share options at 31 December 2008 are shown in the table in paragraph 8.1 above. Share options granted under the LTIS are shown separately in the table in paragraph 9.1 below.
8.3 The performance condition which applies to the exercise of executive share options granted in 2006 under the ESOS requires annual earnings per share growth to exceed RPI plus 3% averaged over a three-year period. At that level 25% of the shares under option would be exercisable with the option becoming fully exercisable at average annual growth in earnings per share in excess of RPI plus 6% over the three-year period. A sliding scale for vesting will apply between these levels.
8.4 The company’s highest paid director in 2008 was Peter Crook, whose emoluments amounted to £1,284,000 (2007: Peter Crook £1,166,000). His notional gain (representing the difference between the exercise price and the market price of the shares at the date of exercise) on the exercise of share options amounted to £nil (2007: Peter Crook £nil).
8.5 The aggregate notional gain (representing the difference between the exercise price and the market price of the shares at the date of exercise) made by all the directors on the exercise of share options during 2008 amounted to £nil (2007: £nil).
8.6 The mid-market closing price of the company’s shares on 31 December 2008 was 860p. The range during 2008 was 700p to 937.5p.
8.7 No consideration is payable on the grant of an option.
8.8 There were no changes in directors’ share options between 1 January 2009 and 2 March 2009.
8.9 None of the directors has notified the company of an interest in any other shares, transactions or arrangements which requires disclosure.
Directors’ remuneration report – continued
8 ShaRE OPTIOn SChEMES
8.1 Directors’ share options at 31 December 2008 were as follows: Range of normal Options Granted Exercised Options exercisable dates of held at in in held at Exercise options held at Director’s name 01.01.2008 2008 2008 31.12.2008 price (p) 31.12.2008
Peter Crook 114,330* – – 114,330 577.25 07.06.2009 – 06.06.2016 3,335** – – 3,335 491.00 01.12.2011 – 31.05.2012 117,665 – – 117,665Andrew Fisher 98,740* – – 98,740 577.25 07.06.2009 – 06.06.2016 1,340** – – 1,340 716.00 01.12.2010 – 31.05.2011 100,080 – 100,080Chris Gillespie – – – – – –Total 217,745 – – 217,745
* Granted under the Provident Financial Executive Share Option Scheme 2006** Granted under the Provident Financial plc Employee Savings-Related Share Option Scheme (2003)

71D
IRECTO
RS’ R
EMU
nER
aTIOn
REPO
RT
Annual Report & Financial Statements 2008 Provident Financial plc
9.3 No consideration is payable on the award of options or conditional shares.
9.4 There were no changes in directors’ options or conditional share awards between 1 January 2009 and 2 March 2009.
9.5 Details of conditional share awards outstanding on 31 December 2008 are shown in the table in paragraph 9.2.
9.6 None of the directors has notified the company of an interest in any other shares, transactions or arrangements which requires disclosure.
9.7 Kleinwort Benson (Jersey) Trustees Limited, as trustee of the EBT, purchased 775,066 ordinary shares during the period 5 March to 6 March 2008 and subscribed for 9,642 shares in August and September 2008 for the purpose of satisfying awards made pursuant to the LTIS. The trustee transferred the beneficial ownership (subject to the performance conditions set out in paragraph 6.9 on page 66) in 232,275 of the shares for no consideration to the executive directors on 8 April 2008. The trustee has entered into a dividend waiver in respect of all the shares it holds in the company at any time.
9.8 The executive directors have waived an entitlement to any dividend in respect of the conditional shares during the vesting period. To the extent an award vests at the end of the performance period additional ordinary shares in the company or a cash amount
equivalent to the dividends that would have been paid on the vested awards from the date of grant, will be paid to the executive directors when the award vests.
9.9 The 2006 options require the company’s TSR over a consecutive three-year performance period, when measured against a comparator group of companies, to be at least median (25% vesting), rising on a straight-line basis, with full vesting if the company’s TSR exceeds the TSR of the comparator group by 8.5%.
9.10 The 2007 and 2008 conditional share awards require the company’s annualised TSR over a consecutive three-year performance period, when measured against the annualised TSR of the FTSE 250 Index, to be at least median (25% vesting), rising on a straight-line basis, with full vesting if the company’s annualised TSR exceeds the annualised TSR of the FTSE 250 Index, by 8.5% on a multiplicative basis. No award will vest if the company’s annualised TSR is below the TSR of the FTSE 250 Index.
9.11 There has been no variation in the terms and conditions of the participants’ interests in the LTIS or the PSP (as referred to in paragraph 10 below) during the year. However, it is proposed to amend the terms of the LTIS and PSP during 2009 and details of the proposed amendments are included in the circular to shareholders dated 23 March 2009.
10 PERFORManCE ShaRE Plan
10.1 Awards held under the Provident Financial Performance Share Plan are as follows: Total Matching Total basic matching Basic awards awards awards awards Market price (number of (number (number (number of of each share shares) of shares) of shares) shares) when award Earliest Date held at held at held at held at was granted vesting Director’s name of grant 01.01.2008 01.01.2008 31.12.2008 31.12.2008 (p) date
Peter 09.03.2006 1,458 1,459 1,458* 1,459* 640 09.03.2009Crook 05.03.2008 – – 24,539 24,539 804 05.03.2011Andrew Fisher 05.03.2008 – – 21,579 21,579 804 05.03.2011Chris Gillespie 05.03.2008 – – 21,144 21,144 804 05.03.2011
* Awards were adjusted on 16 July 2007 following the demerger and the subsequent one-for-two share consolidation.
10.2 There are no further performance conditions attaching to the basic award. For awards granted in 2006 and 2008, the matching award will vest only if the company’s average annual growth in earnings per share is equal to or greater than RPI plus 3% over a period of three consecutive financial years, the first of which is the financial year starting immediately before the grant date of the matching award. Although basic earnings per share is generally used for the performance calculation, for 2006 awards earnings per share before Yes Car Credit closure costs was used as the starting point to avoid participants benefiting from a low start point due to the impact of the closure of the Yes Car Credit business.
10.3 The dividends payable on the basic and matching award shares are paid to the directors. The gross amounts received in 2008 were: Peter Crook £33,017 (2007: £2,026), Andrew Fisher £27,405 (2007: £nil), and Chris Gillespie £26,853 (2007: £nil). These figures have been included in the benefits column in the table of directors’ remuneration on page 69 in paragraph 7.1.
11 PEnSIOnS anD lIFE aSSURanCE
11.1 There are three directors (2007: three) for whom retirement benefits are accruing under the cash balance section of the Provident Financial Staff Pension Scheme (‘the pension scheme’). The pension scheme is a defined
Directors’ remuneration report – continued

72
DIR
ECTOR
S’ REM
Un
ERaTIO
n R
EPOR
T
Annual Report & Financial Statements 2008 Provident Financial plc
11.5 Details of the pension entitlements earned under the cash balance section of the pension scheme are set out below:
Transfer value of Increase Accrued pension benefits in transfer Age retirement account Increase in Director’s accrued value less as at 31 at 31 December retirement account* contribution at 31 December director’s December 2008 2007 2008 2007 2008 2007 2008 2007 contributions 2008 £000 £000 £000 £000 £000 £000 £000 £000 £000
Peter Crook 45 412 230 182 143 26 20 412 230 156Andrew Fisher 50 329 197 132 127 19 17 329 197 113Chris Gillespie 45 199 73 126 73 18 10 199 73 108
* Whilst the member is in service, the accrued cash balance retirement account will increase by the lower of RPI plus 1.5% and 6.5% until retirement. At retirement, up to 25% of this balance can be taken as a lump sum, with the remaining amount used to purchase an annuity.
12 DIRECTORS’ SERvICE aGREEMEnTS
12.1 John van Kuffeler is offering himself for re-appointment at the AGM to be held on 6 May 2009. Rob Anderson is offering himself for appointment at the AGM.
12.2 Details of the service agreement of each director with the company or letter of appointment, as relevant, are set out in paragraphs 12.2.1 to 12.2.4 below.
12.2.1 Peter Crook, Andrew Fisher and Chris Gillespie each has a service agreement which requires one year’s notice of termination to be given by the company and one year’s notice of termination to be given by the director. No notice of termination has been given by either the company or any of the directors and thus in each case the unexpired term is one year. Each service agreement terminates on the date of the director’s sixty-fifth birthday. There are no provisions for compensation payable upon early termination of any of the agreements. However, in the event that a director is not re-appointed at an AGM of the company, the agreement is automatically terminated and this is treated as a breach by the company. The dates of the service agreements are as follows: Peter Crook 27 April 2006 (amended by letter of variation on 1 February 2007); Andrew Fisher 1 January 2008 and Chris Gillespie 31 May 2007.
12.2.2 The Chairman, John van Kuffeler, has a service agreement dated 29 January 2002 (amended by letters of variation on 24 December 2003, 17 January 2007, 30 January 2007 and 4 July 2007) which requires one year’s notice of termination to be given by the company and six months’ notice of termination to be given by him.
No notice of termination has been given by either party and thus the unexpired term is one year.
12.2.3 Each of the non-executive directors has a letter of appointment. Each director is appointed for a fixed period of three years, subject to appointment by shareholders. The initial three-year period may be extended by one further three-year period (and, in exceptional cases, further extended) subject to re-appointment by shareholders. The dates of the letters of appointment and the unexpired terms are as follows: Robert Hough 18 October 2006 unexpired term: to 31 January 2010; John Maxwell 27 February 2008 unexpired term: to 31 May 2009; Manjit Wolstenholme 1 June 2007 unexpired term: to 31 July 2010; Rob Anderson 27 February 2009 unexpired term: to 30 March 2012.
12.2.4 In accordance with his letter of appointment, John Maxwell’s term of appointment will expire on 31 May 2009. He is not offering himself for re-appointment at the AGM to be held on 6 May 2009.
13 aUDIT
The elements of the directors’ remuneration (including pension entitlements and share options set out in paragraphs 7.1 and 8 to 11 of this report) which are required to be audited, have been audited in accordance with the Companies Act.
This report has been approved by the remuneration committee and the board and signed on its behalf.
John Maxwell Chairman, remuneration committee 3 March 2009
Directors’ remuneration report – continued
benefit scheme, with two sections: cash balance and final salary. Details of the cash balance section are set out in paragraph 11.2.
11.2 Peter Crook, Andrew Fisher and Chris Gillespie are members of the cash balance section of the pension scheme and are provided with a pension credit of 35% of their basic salary each year to a retirement account. Directors contribute at the rate of 5% of basic salary. Currently, the pension credit increases each year by the lower of the increase in the RPI plus 1.5% and 6.5%. At retirement up to 25% of the total value of the director’s retirement account can be taken as a lump sum, with the balance used to
purchase an annuity. If the director dies in service, a death benefit of six times salary plus the value of the retirement account is payable.
11.3 Details of the pension entitlements earned under the cash balance section of the pension scheme are set out in paragraph 11.5 below.
11.4 John van Kuffeler has a defined contribution personal pension arrangement. A life assurance benefit is also provided by the pension scheme. During 2008, the company contributed £29,900 (2007: £30,487) to his pension arrangements He is also eligible for a lump sum death benefit of four times salary at date of death.

Notes to the financial statements
Annual Report & Financial Statements 2008 Provident Financial plc
Financial statements
The group’s accounting policies are chosen by the directors to ensure that the financial statements present a true and fair view. All of the group’s accounting policies are consistent with the requirements of International Financial Reporting Standards, interpretations issued by the International Financial Reporting Interpretations Committee and UK company law.
Financial StatementS
Consolidated income statement 74
Statements of recognised income 74and expense
Balance sheets 75
Cash flow statements 76
Statement of accounting policies 78
Financial and capital risk management 85
Notes to the financial statements 89
Independent auditors’ report 133
Annual Report & Financial Statements 2008 Provident Financial plc
Fina
nc
ial Statem
entS
7373

74
Fina
nc
ial Statem
entS
Annual Report & Financial Statements 2008 Provident Financial plc
Consolidated income statement
Group 2008 2007 for the year ended 31 December Notes £m £m
CONTINUING OPERATIONSRevenue 1,2 751.2 669.2Finance costs 3 (45.7) (42.1)Operating costs (379.3) (342.4)Administrative expenses (197.4) (169.5)Total costs (622.4) (554.0)Profit before taxation 1,4 128.8 115.2Tax charge 5 (36.7) (34.5)Profit after taxation for the year from continuing operations 92.1 80.7
DISCONTINUED OPERATIONSProfit after taxation for the year from discontinued operations 6 – 57.7Profit for the year attributable to equity shareholders 27 92.1 138.4
Earnings per share from continuing operationsBasic 7 70.9p 40.9pDiluted 7 70.5p 40.5p
Earnings per share attributable to equity shareholdersBasic 7 70.9p 70.1pDiluted 7 70.5p 69.4p
Dividend per shareProposed final dividend 8 38.1p 38.1pTotal dividend in respect of the year 8 63.5p 63.5pPaid in the year* 8 63.5p 47.4p
* The total cost of dividends paid in the year was £83.4m (2007: £89.4m)
Statements of recognised income and expense
Group Company 2008 2007 2008 2007 for the year ended 31 December Notes £m £m £m £m
Profit for the year attributable to equity shareholders 27 92.1 138.4 70.7 136.7Cash flow hedges:– net fair value (losses)/gains 17 (17.3) 1.7 (19.7) 0.4– recycled and reported in profit for the year 17 – 2.8 – (1.3)Actuarial (losses)/gains on retirement benefit asset 19 (17.1) 46.3 (4.9) 5.1Tax credit/(charge) on items taken directly to equity 5 9.7 (15.2) 6.8 (1.3)Impact of change in UK tax rate 5 – 0.8 – 0.1Net (expense)/income recognised directly in equity 27 (24.7) 36.4 (17.8) 3.0Total recognised income for the year attributable to equity shareholders 27 67.4 174.8 52.9 139.7

75Fin
an
cia
l Statemen
tS
Annual Report & Financial Statements 2008 Provident Financial plc
Balance sheets
Group Company 2008 2007 2008 2007 as at 31 December Notes £m £m £m £m
ASSETSNon-current assetsGoodwill 11 3.1 3.1 – –Other intangible assets 12 17.1 12.6 – –Property, plant and equipment 13 28.6 28.7 3.7 3.6Investment in subsidiaries 14 – – 371.1 357.6Financial assets:– amounts receivable from customers 15 83.7 71.8 – –– derivative financial instruments 17 28.9 – – –– trade and other receivables 18 – – 438.0 438.0Retirement benefit asset 19 50.9 61.5 16.1 19.5Deferred tax assets 20 – – 1.3 – 212.3 177.7 830.2 818.7Current assetsFinancial assets:– amounts receivable from customers 15 979.6 853.6 – –– derivative financial instruments 17 – 0.7 – 0.7– cash and cash equivalents 21 19.5 23.4 0.5 0.8 – trade and other receivables 18 15.1 19.9 863.2 805.0 1,014.2 897.6 863.7 806.5 Total assets 1 1,226.5 1,075.3 1,693.9 1,625.2
LIABILITIESCurrent liabilitiesFinancial liabilities:– bank and other borrowings 22 (4.0) (41.0) (1.0) (41.0)– derivative financial instruments 17 (4.7) (12.5) (4.0) (12.5)– trade and other payables 23 (64.0) (70.1) (115.7) (166.0)Current tax liabilities (32.8) (29.9) (12.3) (13.2)Provisions 24 (0.8) (0.8) – – (106.3) (154.3) (133.0) (232.7)Non-current liabilitiesFinancial liabilities:– bank and other borrowings 22 (824.5) (592.7) (468.2) (273.8)– derivative financial instruments 17 (16.1) (24.3) (16.1) (4.6)– trade and other payables 23 – – (131.3) (131.3)Provisions 24 (1.2) (2.0) – –Deferred tax liabilities 20 (0.5) (6.1) – (5.0) (842.3) (625.1) (615.6) (414.7)Total liabilities 1 (948.6) (779.4) (748.6) (647.4)NET ASSETS 1 277.9 295.9 945.3 977.8
SHAREHOLDERS’ EQUITYCalled-up share capital 25 27.3 27.2 27.3 27.2Share premium account 27 134.6 132.7 134.6 132.7Other reserves 28 (16.3) 0.1 592.1 610.4Retained earnings 27 132.3 135.9 191.3 207.5TOTAL EQUITY 27 277.9 295.9 945.3 977.8
The financial statements on pages 74 to 132 were approved by the board of directors on 3 March 2009 and signed on its behalf by:
Peter Crook Andrew FisherChief Executive Finance Director

76
Fina
nc
ial Statem
entS
Annual Report & Financial Statements 2008 Provident Financial plc
Cash flow statements
Group Company 2008 2007 2008 2007 for the year ended 31 December Notes £m £m £m £m
Cash flows from continuing operationsCash generated from/(used in) continuing operations 40.9 141.9 (118.9) (64.0)Finance costs paid (44.1) (42.3) (31.6) (38.4)Finance income received – – 84.0 89.6Tax paid (29.7) (15.2) (10.9) –Net cash (used in)/generated from continuing operating activities (32.9) 84.4 (77.4) (12.8)Net cash used in discontinued operating activities 6 – (49.1) – –Net cash (used in)/generated from operating activities (32.9) 35.3 (77.4) (12.8)
Cash flows from investing activities in continuing operationsPurchases of intangible assets 12 (6.2) (3.0) – –Purchases of property, plant and equipment 13 (8.5) (10.1) (0.6) (0.3)Proceeds from disposal of property, plant and equipment 13 0.8 1.7 – 0.7Proceeds from disposal of investments – – – 154.1Additional investment in subsidiaries – – (10.5) (78.2)Dividends received – – 40.6 7.9Long-term loans repaid by subsidiaries – – – 3.5Net cash (used in)/generated from investing activities in continuing operations (13.9) (11.4) 29.5 87.7Net cash used in investing activities in discontinued operations 6 – (242.0) – –Net cash (used in)/generated from investing activities (13.9) (253.4) 29.5 87.7
Cash flows from financing activities in continuing operationsProceeds from borrowings 191.0 332.0 191.0 119.1Repayment of borrowings (51.8) (332.7) (45.5) (265.1)Dividends paid to company shareholders 8 (83.4) (89.4) (83.4) (89.4)Proceeds from issue of share capital 25 2.0 22.6 2.0 22.6Purchase of own shares 28 (8.7) (6.5) (8.7) (6.5)Proceeds from vesting of shares 28 – 2.1 – 2.1Repayment of loan from subsidiary undertaking – – – (5.5)Net cash generated from/(used in) financing activities in continuing operations 49.1 (71.9) 55.4 (222.7)Net cash used in financing activities in discontinued operations 6 – (126.9) – –Net cash generated from/(used in) financing activities 49.1 (198.8) 55.4 (222.7)Net increase/(decrease) in cash and cash equivalents in continuing operations 2.3 1.1 7.5 (147.8)Net decrease in cash and cash equivalents in discontinued operations 6 – (418.0) – –Net increase/(decrease) in cash and cash equivalents 2.3 (416.9) 7.5 (147.8)Cash and cash equivalents at beginning of year 14.6 431.6 (8.0) 139.8 Exchange losses on cash and cash equivalents – discontinued operations – (0.1) – –Cash and cash equivalents at end of year 16.9 14.6 (0.5) (8.0)
Cash and cash equivalents at end of year comprise:Cash at bank and in hand 21 19.5 23.4 0.5 0.8 Overdrafts – held in bank and other borrowings 22 (2.6) (8.8) (1.0) (8.8)Total cash and cash equivalents 16.9 14.6 (0.5) (8.0)

77Fin
an
cia
l Statemen
tS
Annual Report & Financial Statements 2008 Provident Financial plc
Cash flow statements – continued
Group Company 2008 2007 2008 2007 for the year ended 31 December Notes £m £m £m £m
Reconciliation of profit after taxation from continuing operations to cash generated from/(used in) continuing operations:Profit after taxation from continuing operations 92.1 80.7 70.7 136.7Adjusted for:
Tax charge 5 36.7 34.5 10.5 14.7Finance costs 3 45.7 42.1 32.8 37.2Finance income – – (84.0) (89.6)Dividends received – – (40.6) (7.9)Share-based payment charge 26 4.7 1.6 2.1 1.5Cash settlement of share-based payments – – – (0.9)Retirement benefit (credit)/charge 19 (1.2) 0.4 (0.4) (13.5)Amortisation of intangible assets 12 1.7 0.5 – –Depreciation of property, plant and equipment 13 7.5 5.6 0.4 0.3Loss/(profit) on disposal of property, plant and equipment 13 0.3 (0.1) 0.1 (0.3)Profit on disposal of investments – – – (110.9)Release of impairment in investments in subsidiaries 14 – – (0.4) (0.3)
Changes in operating assets and liabilities:Amounts receivable from customers (137.9) (23.7) – –Trade and other receivables 3.6 (2.1) (59.4) 89.3Trade and other payables (6.5) 4.5 (50.3) (119.6)Retirement benefit asset (5.3) (3.6) (1.1) (0.4)Derivative financial instruments 0.3 0.5 0.7 (0.3)Provisions (0.8) 1.0 – –
Cash generated from/(used in) continuing operations 40.9 141.9 (118.9) (64.0)

78
Fina
nc
ial Statem
entS
Annual Report & Financial Statements 2008 Provident Financial plc
Statement of accounting policies
Basis of preparationThe financial statements are prepared in accordance with International Financial Reporting Standards (IFRS) adopted for use in the European Union (EU), IFRIC interpretations and the Companies Act 1985/2006 applicable to companies reporting under IFRS. The financial statements have been prepared on a going concern basis under the historical cost convention, as modified by the revaluation of derivative financial instruments to fair value. In preparing the financial statements, the directors are required to use certain critical accounting estimates and are required to exercise judgement in the application of the group and company’s accounting policies. The group and company’s principal accounting policies under IFRS, which have been consistently applied to all the years presented unless otherwise stated, are set out below.
The following interpretations became mandatory for accounting periods beginning on or after 1 January 2008:
• IFRIC11,‘IFRS2–Groupandtreasurysharetransactions’(earlyadoptedintheyearended31December2006).
• IFRIC14,‘IAS19–Thelimitonadefinedbenefitasset,minimumfundingrequirementsandtheirinteraction’.Thisinterpretation provides guidance on assessing the limit in IAS 19 on the amount of surplus that can be recognised as an asset. The adoption of this standard does not have any impact on the valuation of the group and company pension asset, as the group and company has an unconditional right to a refund of the asset and it will be recovered in future years as a result of reduced contributions to the pension scheme.
The following interpretation became mandatory for accounting periods beginning on or after 1 January 2008, but is not relevant to the group’s operations:
• IFRIC12,‘Serviceconcessionarrangements’.
At the date of approval of these financial statements, the following standards and interpretations which have not been applied in these financial statements were in issue but were not yet effective. Adoption of these standards and interpretations is not expected to have a material impact on the group or company financial statements:
• IFRS8,‘Operatingsegments’(effectivefrom1January2009andendorsedbytheEUinDecember2007).ThisnewstandardreplacesIAS14,‘Segmentreporting’,andrequiresgroupstotakea‘managementapproach’tosegmentreporting.
• IAS1(revised),‘Presentationoffinancialstatements’(effectivefrom1January2009andendorsedbytheEUinDecember2008).Therevisedstandardrequires‘non-owner’changesinequitytobepresentedseparatelyfromownerchangesinequity,with all non-owner changes in equity to be shown in a performance statement.
• IFRS2(amendment),‘Share-basedpayment’(effectivefrom1January2009andendorsedbytheEUinDecember2008). This amendment clarifies the accounting treatment of vesting conditions and cancellations.
• IFRS3(revised),‘Businesscombinations’(effectivefrom1July2009,subjecttoendorsementbytheEU).Therevisedstandardcontains significant changes to the application of the acquisition method to business combinations which should be applied prospectively from 1 January 2010.
• IFRS5(amendment),‘Non-currentassetsheld-for-saleanddiscontinuedoperations’(andconsequentialamendmentsto IFRS1,‘First-timeadoption’)(effectivefrom1July2009,subjecttoendorsementbytheEU).Thisamendmentclarifiesthatallof a subsidiary’s assets and liabilities are classified as held-for-sale if a partial disposal sale plan results in loss of control.
• IAS23(amendment),‘Borrowingcosts’(effectivefrom1January2009,subjecttoendorsementbytheEU).Thedefinitionofborrowing costs has been amended so that interest expense is calculated using the effective interest method defined in IAS 39, ‘Financialinstruments:Recognitionandmeasurement’,eliminatingtheinconsistencybetweenIAS39andIAS23.
• IAS36(amendment),‘Impairmentofassets’(effectivefrom1January2009,subjecttoendorsementbytheEU).Thisamendment clarifies the disclosure requirements for impairment tests.
• IAS38(amendment),‘Intangibleassets’(effectivefrom1January2009,subjecttoendorsementbytheEU).Thisamendmentclarifies the treatment of prepayments for intangible assets.
• IAS19(amendment),‘Employeebenefits’(effectivefrom1January2009,subjecttoendorsementbytheEU).Thisamendmentmakes a number of changes to accounting for defined benefit schemes.
• IAS39(amendment),‘Financialinstruments:Recognitionandmeasurement’(effectivefrom1January2009,subjecttoendorsement by the EU). This amendment makes a number of changes to accounting for financial instruments.
• IAS1(amendment),‘Presentationoffinancialstatements’(effectivefrom1January2009,subjecttoendorsementbytheEU).This amendment clarifies the disclosure of held-for-trading assets and liabilities between current and non-current assets and liabilities.
• IAS38(amendment),‘Intangibleassets’(effectivefrom1January2009,subjecttoendorsementbytheEU).Thisamendmentdeletesthewordingthatstatesthatthereis‘rarely,ifever’supportforuseofamethodthatresultsinalowerrateofamortisation than the straight-line method.
• ThereareanumberofminoramendmentstoIFRS7,‘Financialinstruments:Disclosures’,IAS8,‘Accountingpolicies,changesinaccountingestimatesanderrors’,IAS10,‘Eventsafterthereportingperiod’,IAS18,‘Revenue’andIAS34,‘Interimfinancialreporting’, which are part of the IASB’s annual improvements project published in May 2008.

79Fin
an
cia
l Statemen
tS
Annual Report & Financial Statements 2008 Provident Financial plc
Statement of accounting policies – continued
Basis of preparation – continuedThe following interpretations and amendments to existing standards are in issue but are not yet effective, and are not considered relevant to the group’s operations:
• IFRS1(amendment),‘FirsttimeadoptionofIFRS’,andIAS27,‘Consolidatedandseparatefinancialstatements’.
• IAS16(amendment),‘Property,plantandequipment’(andconsequentialamendmenttoIAS7,‘Statementofcashflows’).
• IAS20(amendment),‘Accountingforgovernmentgrantsanddisclosureofgovernmentassistance’.
• IAS27(amendment)andIAS27(revised),‘Consolidatedandseparatefinancialstatements’.
• IAS28(amendment),‘Investmentinassociates’(andconsequentialamendmentstoIAS32,‘Financialinstruments:Presentation’andIFRS7,‘Financialinstruments:Disclosures’).
• IAS29(amendment),‘Financialreportinginhyperinflationaryeconomies’.
• IAS31(amendment),‘Interestsinjointventures’(andconsequentialamendmentstoIAS32,‘Financialinstruments:Recognitionandmeasurement’andIFRS7,‘Financialinstruments:Disclosures’).
• IAS32(amendment),‘Financialinstruments:Presentation’andIAS1(amendment),‘Presentationoffinancialstatements–Puttablefinancial instruments and obligations arising on liquidation’.
• IAS40(amendment),‘Investmentproperty’(andconsequentialamendmentstoIAS16,‘Property,plantandequipment’).
• IAS41(amendment),‘Agriculture’.
• IFRIC13,‘Customerloyaltyprogrammes’.
• IFRIC15,‘Agreementsforconstructionofrealestates’.
• IFRIC16,‘Hedgesofanetinvestmentinaforeignoperation’.
• IFRIC17,‘Transfersofnon-cashassetsfromowners’.
• IFRIC18,‘Transfersofassetsfromcustomers’.
Basis of consolidationThe consolidated income statement, statements of recognised income and expense, balance sheets, cash flow statements and notes to the financial statements include the financial statements of the company and its subsidiary undertakings drawn up from the date control passes to the group until the date control ceases.
Control is assumed to exist where more than 50% of the voting share capital is owned or where the group controls another entity either through the power to:
• governtheoperatingandfinancialpoliciesofthatentity;
• appointorremovethemajorityofthemembersoftheboardofthatentity;or
• castthemajorityofthevotesataboardmeetingofthatentity.
All intra-group transactions, balances and unrealised gains on transactions between group companies are eliminated on consolidation.
The accounting policies of the subsidiaries are consistent with the accounting policies of the group.
RevenueRevenue from continuing operations comprises interest income earned by the Consumer Credit Division and interest and fee income earned by Vanquis Bank. Revenue also includes the interest income earned by Yes Car Credit from the collect-out of the receivables that were held on closure of that business in December 2005.
Revenue from discontinued operations in 2007 comprises interest income earned by the international business prior to the demerger on 16 July 2007 and premiums written by the insurance business prior to its sale on 15 June 2007.
Revenue excludes value added tax and intra-group transactions.
Revenue recognitionWithin the Consumer Credit Division, revenue on customer receivables is recognised using an effective interest rate. The effective interest rate is calculated using estimated cash flows, being contractual payments adjusted for the impact of customers repaying early but excluding the anticipated impact of customers paying late or not paying at all. Directly attributable incremental issue costs are also taken into account in calculating the effective interest rate. Interest income continues to be accrued on impaired receivables using the original effective interest rate applied to the loan’s carrying value.
In respect of the credit card business of Vanquis Bank, interest is calculated on credit card advances to customers using the effective interest rate on the daily balance outstanding. Annual fees charged to customers’ credit card accounts are recognised as part of the effective interest rate. Penalty charges and other fees are recognised at the time the charges are made to customers on the basis that performance is complete.
For the remaining receivables relating to the car finance business of Yes Car Credit, finance income and insurance commission are treated as part of the yield on the financing arrangement and are recognised using the effective interest rate method.

80
Fina
nc
ial Statem
entS
Annual Report & Financial Statements 2008 Provident Financial plc
Statement of accounting policies – continued
Segmental reporting A business segment is a component of the group that is engaged in providing a group of related products and is subject to risks and returns that are different from those of other business segments. A geographical segment is a component of the group that operates within a particular economic environment and that is subject to risks and returns that are different from those of components operating in other economic environments. Following the demerger of the international business in 2007, the group operates in one geographic segment, the UK and Republic of Ireland. Accordingly, segmental reporting disclosures are all on a business segment basis.
Finance costsFinance costs comprise the interest on bank and other borrowings and, for the company, on intra-group loan arrangements, and are recognised on an effective interest rate basis.
Dividend incomeDividends are recognised in the income statement when the company’s right to receive payment is established.
Discontinued operationsDiscontinuedoperationsrepresentcomponentsofthegroupthathavebeendisposedofinaccordancewithIFRS5,‘Non-currentassetsheld-for-sale and discontinued operations’. The profit or loss after tax from discontinued operations is disclosed as a single line in the income statement beneath profit after tax from continuing operations. The cash flows from discontinued operations are also disclosed as a single line item in each category of the cash flow statement.
GoodwillAll acquisitions are accounted for using the purchase method of accounting.
Goodwill is an intangible asset and is measured as the excess of the fair value of the consideration over the fair value of the acquired identifiable assets, liabilities and contingent liabilities at the date of acquisition. Gains and losses on the disposal of a subsidiary include the carrying amount of goodwill relating to the subsidiary sold.
Goodwill is tested annually for impairment and is carried at cost less accumulated impairment losses. Impairment is tested by comparing the carrying value of the asset to the discounted expected future cash flows from the relevant business unit. Expected cash flows are derived from the group’s latest budget projections and the discount rate is based on the group’s weighted average cost of capital at the balance sheet date.
Goodwill arising on acquisitions prior to 1 January 1998 was eliminated against shareholders’ funds under UK GAAP and was not reinstated on transition to IFRS. On disposal of a business, any such goodwill relating to the business will not be taken into account in determining the profit or loss on disposal.
Other intangible assetsOther intangible assets, which comprise computer software development costs, are capitalised as intangible assets on the basis of the costs incurred to acquire or develop the specific software and bring it into use.
Directly attributable costs associated with the development of software that will generate future economic benefits are capitalised as part of the software intangible asset. Direct costs include the cost of software development employees and an appropriate portion of relevant directly attributable overheads.
Computer software is amortised on a straight-line basis over its estimated useful economic life which is generally estimated to be between five and ten years.
The residual values and economic lives of intangible assets are reviewed by management at each balance sheet date.
Foreign currency translationItems included in the financial statements of each of the group’s subsidiaries are measured using the currency of the primary economic environmentinwhichthesubsidiaryoperates(‘thefunctionalcurrency’).Allofthegroup’ssubsidiariesoperateprimarilyintheUKandRepublic of Ireland. The consolidated and company financial statements are presented in sterling, which is the company’s functional and presentational currency.
Transactions that are not denominated in a subsidiary’s functional currency are recorded at the rate of exchange ruling at the date of the transaction. Monetary assets and liabilities denominated in foreign currencies are translated into the relevant functional currency at the exchange rates ruling at the balance sheet date. Differences arising on translation are charged or credited to the income statement, except when deferred in equity as qualifying cash flow hedges or qualifying net investment hedges.

81Fin
an
cia
l Statemen
tS
Annual Report & Financial Statements 2008 Provident Financial plc
Statement of accounting policies – continued
Investments in subsidiariesInvestments in subsidiaries are stated at cost less, where appropriate, provisions for impairment.
Amounts receivable from customersAll customer receivables are initially recognised at the amount loaned to the customer plus directly attributable incremental issue costs. After initial recognition, customer receivables are subsequently measured at amortised cost. Amortised cost is the amount of the customer receivable at initial recognition less customer repayments, plus revenue earned calculated using the effective interest rate, less any deduction for impairment.
The group assesses whether there is objective evidence that customer receivables have been impaired at each balance sheet date. The principal criteria for determining whether there is objective evidence of impairment is delinquency in contractual payments.
Within the weekly home credit business of the Consumer Credit Division, objective evidence of impairment is based on the payment performance of loans in the previous 12 weeks as this is considered to be the most appropriate indicator of credit quality in the short-term cash loans business. Loans are deemed to be impaired when the cumulative amount of two or more contractual weekly payments have been missed in the previous 12-week period since only at this point do the expected future cash flows from loans deteriorate significantly. Loans with one missed weekly payment over the previous 12-week period are not deemed to be impaired. The amount of impairment loss is calculated on a portfolio basis by reference to arrears stages and is measured as the difference between the carrying value of the loans and the present value of estimated future cash flows discounted at the original effective interest rate. Subsequent cash flows are regularly compared to estimated cash flows to ensure that the estimates are sufficiently accurate for impairment provisioning purposes.
Within the monthly Vanquis Bank credit card business and the monthly unsecured direct repayment loans business of the Consumer Credit Division, customer balances are deemed to be impaired as soon as customers miss one monthly contractual payment. Impairment is calculated as the difference between the carrying value of receivables and the present value of estimated future cash flows discounted at the original effective interest rate. Estimated future cash flows are based on the historical performance of customer balances falling into different arrears stages and are regularly reassessed.
At Yes Car Credit, customer accounts are deemed to be impaired as soon as one monthly contractual payment has been missed. Impairment is calculated as the difference between the carrying value of the receivable and the present value of estimated future cash flows, discounted at the original effective interest rate. Estimated future cash flows on impaired loans include the expected proceeds from the disposal of the motor vehicle upon which finance was originally provided.
For the Consumer Credit Division and Yes Car Credit, impairment charges are deducted directly from the carrying value of receivables whilst in Vanquis Bank impairment is recorded through the use of an allowance account.
Impairment charges are charged to the income statement as part of operating costs.
Property, plant and equipmentProperty, plant and equipment is shown at cost less subsequent depreciation and impairment, except for land, which is shown at cost less impairment.
Cost represents invoiced cost plus any other costs that are directly attributable to the acquisition of the items. Repairs and maintenance costs are expensed as incurred.
Depreciation is calculated to write down assets to their estimated realisable value over their useful economic lives. The following are the principal bases used:
% Method
Land Nil –Freehold and long leasehold buildings 21⁄2 Straight-lineShort leasehold buildings Over the lease period Straight-lineEquipment (including computer hardware) 10 to 331⁄3 Straight-lineMotor vehicles 25 Reducing balance
The residual values and useful economic lives of all assets are reviewed, and adjusted if appropriate, at each balance sheet date. All items of property, plant and equipment, other than land, are tested for impairment whenever events or changes in circumstances indicate that the carrying value may not be recoverable. Land is subject to an annual impairment test. An impairment loss is recognised for the amount by which the asset’s carrying value exceeds the higher of the asset’s value in use or its fair value less costs to sell.
Gains and losses on disposal of property, plant and equipment are determined by comparing any proceeds with the carrying amount of the asset and are recognised within administrative expenses in the income statement.
LeasesLeases in which a significant portion of the risks and rewards of ownership are retained by the lessor are classified as operating leases. The leases entered into by the group and company are solely operating leases. Costs in respect of operating leases are charged to the income statement on a straight-line basis over the lease term.

82
Fina
nc
ial Statem
entS
Annual Report & Financial Statements 2008 Provident Financial plc
Statement of accounting policies – continued
Cash and cash equivalentsCash and cash equivalents comprise cash at bank and in hand. Bank overdrafts are presented in current liabilities to the extent that there is no right of offset with cash balances. For cash flow purposes, bank overdrafts are shown as part of cash and cash equivalents.
BorrowingsBorrowings are recognised initially at fair value, being their issue proceeds net of any transaction costs incurred. Borrowings aresubsequentlystatedatamortisedcost;anydifferencebetweenproceedsnetoftransactioncostsandtheredemptionvalue is recognised in the income statement over the expected life of the borrowings using the effective interest rate.
Where borrowings are the subject of a fair value hedge, changes in the fair value of the borrowing that are attributable to the hedged risk are recognised in the income statement and a corresponding adjustment made to the carrying value of borrowings.
Borrowings are classified as current liabilities unless the group or company has an unconditional right to defer settlement of the liability for at least 12 months after the balance sheet date.
Derivative financial instrumentsThe group and company use derivative financial instruments, principally interest rate swaps, cross-currency swaps and forward currency contracts, to manage the interest rate and foreign exchange rate risk arising from the group’s underlying business operations. No transactions of a speculative nature are undertaken.
AllderivativefinancialinstrumentsareassessedagainstthehedgeaccountingcriteriasetoutinIAS39,‘Financialinstruments:Recognition and measurement’. Derivatives that meet the hedge accounting requirements of IAS 39 are accordingly designated as either: hedges of the fair value of recognised assets, liabilities or firm commitments (fair value hedges) or hedges of highly probable forecast transactions (cash flow hedges).
Derivatives are initially recognised at their fair value on the date a derivative contract is entered into and are subsequently remeasured at each reporting date at their fair value. Where derivatives do not qualify for hedge accounting, movements in their fair value are recognised immediately within the income statement. Where hedge accounting criteria has been met, the resultant gain or loss on the derivative instrument is recognised as follows:
Fair value hedgesChanges in the fair value of derivatives that are designated and qualify as fair value hedges are recorded in the income statement as part of finance costs, together with any changes in the fair value of the hedged asset or liability that are attributable to the hedged risk.
cash flow hedgesThe effective portion of changes in the fair value of derivatives that are designated and qualify as cash flow hedges are recognised in equity. The gain or loss relating to the ineffective portion is recognised immediately in the income statement as part of finance costs. Amounts accumulated in equity are recognised in the income statement when the income or expense on the hedged item is recognised in the income statement.
Hedgeaccountingforbothfairvalueandcashflowhedgesisdiscontinuedwhen:
• itisevidentfromtestingthataderivativeisnot,orhasceasedtobe,highlyeffectiveasahedge;
• thederivativeexpires,orissold,terminatedorexercised;or
• theunderlyinghedgeditemmaturesorissoldorrepaid.
When a cash flow hedging instrument expires or is sold, or when a cash flow hedge no longer meets the criteria for hedge accounting, any cumulative gain or loss existing in equity at that time is transferred to the income statement in the period in which the transaction affects profit or loss. When a forecast transaction is no longer expected to occur, the cumulative gain or loss that was previously reported in equity is immediately transferred to the income statement.
The fair values of various derivative financial instruments used for hedging purposes are disclosed in note 17. Movements on the hedging reserve in shareholders’ equity are shown in note 28. The full fair value of a hedging derivative is classified as a non-current asset or liability when the remaining maturity of the hedged item is more than 12 months and as a current asset or liability when the remaining maturity of the hedged item is less than 12 months.
ProvisionsProvisions are recognised when the group or company has a present obligation as a result of a past event, and it is probable that the group or company will be required to settle that obligation. Provisions are measured at the directors’ best estimate of the expenditure required to settle the obligation at the balance sheet date, and are discounted to present value where the effect is material.
Dividends Dividend distributions to the company’s shareholders are recognised in the group and company financial statements as follows:
• Finaldividend:whenapprovedbythecompany’sshareholdersattheannualgeneralmeeting.
• Interimdividend:whenpaidbythecompany.

83Fin
an
cia
l Statemen
tS
Annual Report & Financial Statements 2008 Provident Financial plc
Retirement benefitsDefined benefit pension schemesThe charge/credit in the income statement in respect of defined benefit pension schemes comprises the actuarially assessed current service cost of working employees, together with the interest charge on pension liabilities offset by the expected return on pension scheme assets. All charges/credits are recognised within administrative expenses in the income statement.
The retirement benefit asset recognised in the balance sheet in respect of defined benefit pension schemes is the fair value of the schemes’ assets less the present value of the defined benefit obligation at the balance sheet date, together with adjustments for unrecognised past service costs.
The defined benefit obligation is calculated annually by independent actuaries using the projected unit credit method. The present value of the defined benefit obligation is determined by discounting the estimated future cash outflows using interest rates of high-quality corporate bonds that have terms to maturity approximating to the terms of the related pension liability.
Cumulative actuarial gains and losses arising from experience adjustments and changes in actuarial assumptions are recognised immediately in the statement of recognised income and expense.
Past service costs are recognised immediately in the income statement, unless changes to the pension schemes are conditional on the employees remaining in service for a specified period of time (the vesting period). In this case, past service costs are amortised on a straight-line basis over the vesting period.
Defined contribution schemesContributions to defined contribution pension schemes are charged to the income statement on an accruals basis.
Share-based paymentsThe company grants options under senior executive share option schemes (ESOS/SESO) and employee savings-related share option schemes (typically referred to as Save As You Earn schemes (SAYE)) and makes awards under the Performance Share Plan (PSP) and the Long-Term Incentive Scheme (LTIS). All of the schemes are equity-settled.
The cost of providing options and awards to group and company employees is charged to the income statement of the group and company over the vesting period of the related options and awards. The corresponding credit is made to a share-based payment reserve within equity. The grant by the company of options and awards over its equity instruments to the employees of subsidiary undertakings is treated as a capital contribution. The fair value of employee services received, measured by reference to the fair value at the date of grant or award, is recognised over the vesting period as an increase to investments in subsidiary undertakings, with a corresponding credit to equity.
The cost of options and awards is based on fair value. For ESOS/SESO, SAYE and PSP schemes, fair value is determined using a binomial option pricing model. The value of the charge is adjusted at each balance sheet date to reflect lapses and expected and actual levels of vesting, with a corresponding adjustment to the share-based payment reserve.
For the LTIS, fair value is determined using a Monte-Carlo option pricing model. The value of the charge is adjusted at each balance sheet date to reflect lapses. As the probability of the awards vesting is taken into account in the initial calculation of the fair value of the awards, no adjustment is made to reflect expected and actual levels of vesting.
The proceeds received net of any directly attributable transaction costs for share options vesting are credited to share capital and the share premium account when the options are exercised. A transfer is made from the share-based payment reserve to retained earnings on vesting or when options and awards lapse.
InaccordancewiththetransitionalprovisionsofIFRS2,‘Share-basedpayment’thegroupandcompanyhaveelectedtoapplyIFRS2 to grants, options and other equity instruments granted after 7 November 2002 and not vested at 1 January 2005.
TaxationThe tax charge represents the sum of current and deferred tax. Current tax is calculated based on taxable profit for the year using tax rates that have been enacted or substantially enacted by the balance sheet date. Taxable profit differs from profit before taxation as reported in the income statement because it excludes items of income or expense that are taxable or deductible in other years and it further excludes items that are never taxable or deductible.
Deferred tax is the tax expected to be payable or recoverable on differences between the carrying amounts of assets and liabilities in the financial statements and the corresponding tax bases used in the computation of taxable profit, and is accounted for using the balance sheet liability method.
Deferred tax is determined using tax rates (and laws) that have been enacted or substantially enacted by the balance sheet date and are expected to apply when the related deferred tax asset is realised or the deferred tax liability is settled.
Deferred tax is provided on temporary differences arising on investments in subsidiaries except where the timing of the reversal of the temporary difference is controlled by the group/company and it is probable that the temporary difference will not reverse in the future.
Deferred tax assets are recognised to the extent that it is probable that future taxable profit will be available against which the temporary differences can be utilised.
Statement of accounting policies – continued

84
Fina
nc
ial Statem
entS
Annual Report & Financial Statements 2008 Provident Financial plc
Statement of accounting policies – continued
Key assumptions and estimatesIn applying the accounting policies set out above, the group and company make significant estimates and assumptions that affect the reported amounts of assets and liabilities as follows:
amounts receivable from customers (£1,063.3m)The group reviews its portfolio of loans and receivables for impairment at each balance sheet date. For the purposes of assessing the impairment of customer loans and receivables, customers are categorised into arrears stages as this is considered to be the most reliable predictor of future payment performance. The group makes judgements to determine whether there is objective evidence which indicates that there has been an adverse effect on expected future cash flows. In the weekly home credit business, receivables are deemed to be impaired when the cumulative amount of two or more contractual weekly payments have been missed in the previous 12 weeks, since only at this point do the expected future cash flows from loans deteriorate significantly. In Vanquis Bank, the monthly unsecured direct repayment business of the Consumer Credit Division and Yes Car Credit, loans are deemed to be impaired when one contractual monthly payment has been missed. The level of impairment in all businesses is calculated using models which use historical payment performance to generate the estimated amount and timing of future cash flows from each arrears stage, and are regularly tested using subsequent cash collections to ensure they retain sufficient accuracy. The impairment models are regularly reviewedtotakeaccountofthecurrenteconomicenvironment,productmixandrecentcustomerpaymentperformance.However,onthe basis that the payment performance of customers could be different from the assumptions used in estimating future cash flows, a material adjustment to the carrying value of amounts receivable from customers may be required.
To the extent that the net present value of estimated future cash flows differs by +/- 1%, it is estimated that the amounts receivable from customers would be approximately £10.0m (2007: £9.0m) higher/lower.
tax (current tax liabilities £32.8m, deferred tax liabilities £0.5m)The tax treatment of certain items cannot be determined precisely until tax audits or enquiries have been completed by the tax authorities. In some instances, this can be some years after the item has first been reflected in the financial statements. The group recognises liabilities for anticipated tax audit and enquiry issues based on an assessment of the probability of such liabilities falling due. If the outcome of such audits is that the final liability is different to the amount originally estimated, such differences will be recognised in the period in which the tax audit or enquiry is determined. Any differences may necessitate a material adjustment to the level of tax balances held in the balance sheet.
If the probability assessment of uncertain tax liabilities was adjusted by +/- 5%, it is estimated that the group’s tax liabilities would be £1.7m (2007: £1.5m) higher/lower.
Retirement benefit asset (£50.9m)The principal assumptions used in the valuation of the retirement benefit asset as at 31 December 2008 are set out in note 19.
Thevaluationoftheretirementbenefitassetisdependentuponaseriesofassumptions;thekeyassumptionsbeingmortalityrates,thediscount rate applied to liabilities, investment returns, salary inflation, the rate of pension increase and the extent to which members take up the maximum tax free commutation on retirement.
Mortality estimates are based on standard mortality tables, adjusted where appropriate to reflect the group’s own experience. Discount rates are based on the market yields of high quality corporate bonds which have terms closely linked with the estimated term of the benefit obligation. The returns on fixed asset investments are set to market yields at the valuation date to ensure consistency with the asset valuation. The returns on UK and overseas equities are set by considering the long-term expected returns on these asset classes using a combination of historical performance analysis, the forward looking views of financial markets (as suggested by the yields available) and the views of investment organisations. The salary inflation and pension increase assumptions reflect the long-term expectations for both earnings and retail price inflation. The assumption as to how many members will take up the maximum tax free commutation on retirement is based on the scheme’s own experience of commutation levels.
A sensitivity analysis of key assumptions is provided in note 19.

85Fin
an
cia
l Statemen
tS
Annual Report & Financial Statements 2008 Provident Financial plc
Financial and capital risk management
Financial risk managementThe group’s activities expose it to a variety of financial risks, which can be categorised as credit risk, liquidity risk, interest rate risk and foreign exchange rate risk. The group is not subject to market risk as it does not take active trading positions in interest rates, foreign exchange markets or bonds and equities. The objective of the group’s risk management framework is to identify and assess the risks facing the group and to minimise the potential adverse effects of these risks on the group’s financial performance.
Financial risk management is overseen by the risk advisory committee and further detail on the group’s risk management framework is described on page 60.
(a) credit riskCredit risk is the risk that the group will suffer loss in the event of a default by a customer or a bank counterparty. A default occurs when the customer or bank fails to honour repayments as they fall due.
(i) amounts receivable from customersThe group’s maximum exposure to credit risk on amounts receivable from customers as at 31 December 2008 is the carrying value of amounts receivable from customers of £1,063.3m (2007: £925.4m).
Consumer Credit Division (CCD)Credit risk within CCD is managed by the CCD credit committee which meets at least every two months and is responsible for approving product criteria and pricing.
Credit risk is managed using a combination of lending policy criteria, credit scoring (including behavioural scoring), policy rules, individual lending approval limits, central underwriting, and a home visit to make a decision on applications for credit.
The loans offered by the weekly home credit business are short-term, typically a contractual period of around a year, with an average value of less than £400. The loans are underwritten in the home by an agent with emphasis placed on any previous lending experience with the customer and the home credit agent’s assessment of the credit risk based on a completed application form and the home visit. Once a loan has been made, the agent visits the customer weekly to collect the weekly payment. The agent is well placed to identify signs of strain on a customer’s income and can moderate lending accordingly. Equally, the regular contact and professional relationship that the agent has with the customer allows them to manage customers’ repayments effectively even when the household budget is tight. This can be in the form of taking part payments, allowing missed payments or restructuring the debt in order to maximise cash collections.
Agents are paid commission for what they collect and not for what they lend so their primary focus is on ensuring loans are affordable at the point of issue and then on collecting cash. Affordability is reassessed by the agent each time an existing customer is re-served, or not as the case may be. This normally takes place within 12 months of the previous loan because of the short-term nature of the product.
The underwriting of loans within the monthly unsecured direct repayment business, Real Personal Finance (RPF), is performed in the home by a Personal Finance Manager. The emphasis is placed on employment and residential history, credit bureau reports, bank statements, salary slips, disposable income calculations and the home visit. Average loans sizes are typically £1,800 repayable monthly via direct debit over a two-year period.
Arrears management within both home credit and RPF is a combination of central letters, central telephony, and field activity undertaken by field management. This will often involve a home visit to discuss the customer’s reasons for non-payment and to agree a resolution.
Vanquis BankCredit risk within Vanquis Bank is managed by the Vanquis Bank credit committee which meets at least quarterly and is responsible for ensuring that the approach to lending is within sound risk and financial parameters and that key metrics are reviewed to ensure compliance to policy.
A customer’s risk profile and credit line is evaluated at the point of application and at various times during the agreement. Internally generated scorecards based on historic payment patterns of customers are used to assess the applicant’s potential default risk and their ability to manage a specific credit line. For new customers, the scorecards incorporate data from the applicant, such as income and employment, and data from external credit bureaux. Initial credit limits are low, often £250. For existing customers, the scorecards also incorporate data on actual payment performance and product utilisation and take data from an external credit bureau each month to refresh customers’ payment performance position with other lenders. Credit lines can go up as well as down according to this point in time risk assessment.
Arrears management is a combination of central letters, inbound and outbound telephony and outsourced debt collection agency activities. Contact is made with the customer to discuss the reasons for non-payment and specific strategies are employed to support the customer in recovering to a good standing.
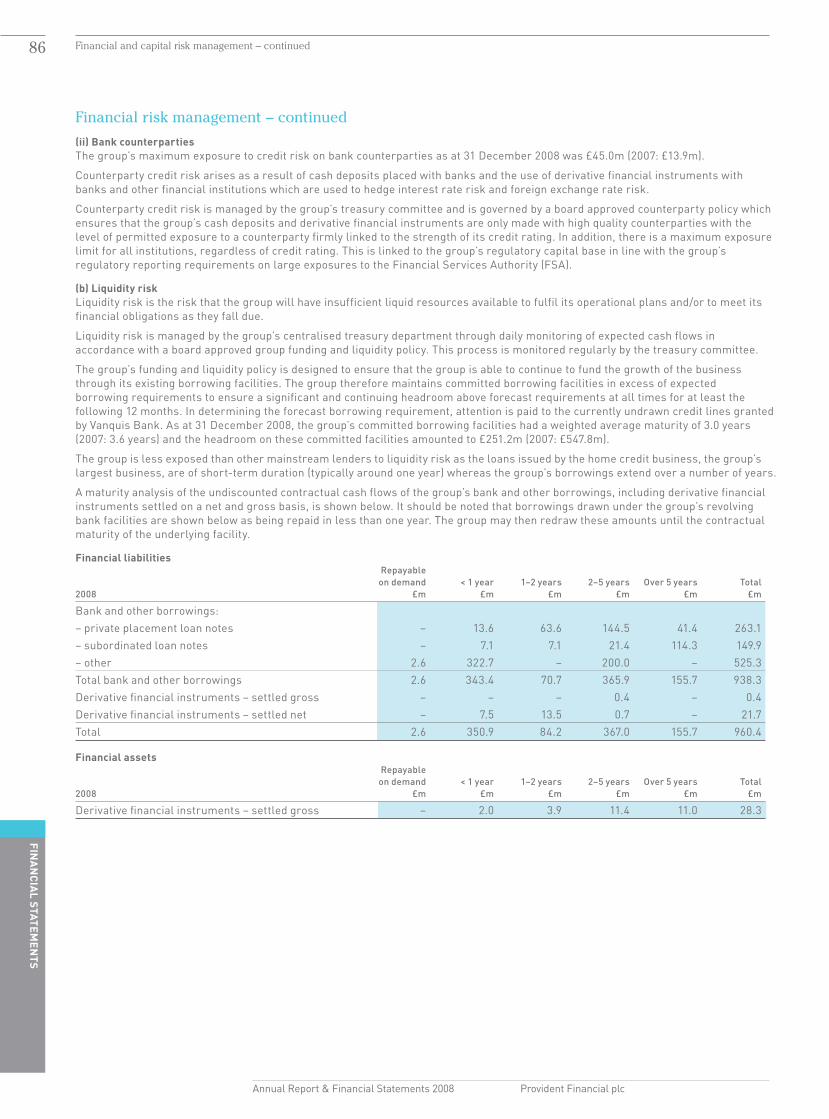
86
Fina
nc
ial Statem
entS
Annual Report & Financial Statements 2008 Provident Financial plc
Financial and capital risk management – continued
Financial risk management – continued
(ii) Bank counterpartiesThe group’s maximum exposure to credit risk on bank counterparties as at 31 December 2008 was £45.0m (2007: £13.9m).
Counterparty credit risk arises as a result of cash deposits placed with banks and the use of derivative financial instruments with banks and other financial institutions which are used to hedge interest rate risk and foreign exchange rate risk.
Counterparty credit risk is managed by the group’s treasury committee and is governed by a board approved counterparty policy which ensures that the group’s cash deposits and derivative financial instruments are only made with high quality counterparties with the level of permitted exposure to a counterparty firmly linked to the strength of its credit rating. In addition, there is a maximum exposure limit for all institutions, regardless of credit rating. This is linked to the group’s regulatory capital base in line with the group’s regulatory reporting requirements on large exposures to the Financial Services Authority (FSA).
(b) liquidity riskLiquidity risk is the risk that the group will have insufficient liquid resources available to fulfil its operational plans and/or to meet its financial obligations as they fall due.
Liquidity risk is managed by the group’s centralised treasury department through daily monitoring of expected cash flows in accordance with a board approved group funding and liquidity policy. This process is monitored regularly by the treasury committee.
The group’s funding and liquidity policy is designed to ensure that the group is able to continue to fund the growth of the business through its existing borrowing facilities. The group therefore maintains committed borrowing facilities in excess of expected borrowing requirements to ensure a significant and continuing headroom above forecast requirements at all times for at least the following 12 months. In determining the forecast borrowing requirement, attention is paid to the currently undrawn credit lines granted by Vanquis Bank. As at 31 December 2008, the group’s committed borrowing facilities had a weighted average maturity of 3.0 years (2007: 3.6 years) and the headroom on these committed facilities amounted to £251.2m (2007: £547.8m).
The group is less exposed than other mainstream lenders to liquidity risk as the loans issued by the home credit business, the group’s largest business, are of short-term duration (typically around one year) whereas the group’s borrowings extend over a number of years.
A maturity analysis of the undiscounted contractual cash flows of the group’s bank and other borrowings, including derivative financial instruments settled on a net and gross basis, is shown below. It should be noted that borrowings drawn under the group’s revolving bank facilities are shown below as being repaid in less than one year. The group may then redraw these amounts until the contractual maturity of the underlying facility.
Financial liabilities Repayable on demand < 1 year 1–2 years 2–5 years Over 5 years Total 2008 £m £m £m £m £m £m
Bank and other borrowings:– private placement loan notes – 13.6 63.6 144.5 41.4 263.1– subordinated loan notes – 7.1 7.1 21.4 114.3 149.9– other 2.6 322.7 – 200.0 – 525.3Total bank and other borrowings 2.6 343.4 70.7 365.9 155.7 938.3Derivative financial instruments – settled gross – – – 0.4 – 0.4Derivative financial instruments – settled net – 7.5 13.5 0.7 – 21.7Total 2.6 350.9 84.2 367.0 155.7 960.4
Financial assets Repayable on demand < 1 year 1–2 years 2–5 years Over 5 years Total 2008 £m £m £m £m £m £m
Derivative financial instruments – settled gross – 2.0 3.9 11.4 11.0 28.3

87Fin
an
cia
l Statemen
tS
Annual Report & Financial Statements 2008 Provident Financial plc
Financial and capital risk management – continued
Financial risk management – continued
Financial liabilities Repayable on demand < 1 year 1–2 years 2–5 years Over 5 years Total 2007 £m £m £m £m £m £m
Bank and other borrowings:– private placement loan notes – 58.7 10.9 143.8 93.2 306.6– subordinated loan notes – 7.1 7.1 21.4 121.4 157.0– other 8.8 127.5 1.5 200.0 – 337.8Total bank and other borrowings 8.8 193.3 19.5 365.2 214.6 801.4Derivative financial instruments – settled gross – 16.1 3.1 18.8 14.8 52.8Total 8.8 209.4 22.6 384.0 229.4 854.2
Financial assets Repayable on demand < 1 year 1–2 years 2–5 years Over 5 years Total 2007 £m £m £m £m £m £m
Derivative financial instruments – settled net – 0.7 0.8 0.2 – 1.7
(c) interest rate riskInterest rate risk is the risk of a change in external interest rates which leads to an increase in the group’s cost of borrowing.
The group’s interest cost is a relatively small part of the group’s cost base, representing only 7.3% (2007: 7.6%) of total costs for the year ended 31 December 2008.
The group’s exposure to movements in interest rates is managed monthly by the treasury committee and is governed by a board approved interest rate hedging policy which forms part of the group’s treasury policies.
The group seeks to limit the net exposure to changes in sterling interest rates. This is achieved through a combination of issuing fixed rate debt and by the use of derivative financial instruments such as interest rate swaps.
A 2% movement in the interest rate applied to borrowings during 2008 would not have had a material impact on the group’s profit before taxation as the group’s interest rate risk was substantially hedged.
(d) Foreign exchange rate riskForeign exchange rate risk is the risk of a change in foreign currency exchange rates leading to a reduction in profits or equity.
The group’s exposure to movements in foreign exchange rates is monitored monthly by the treasury committee and is governed by a board approved foreign exchange rate risk management policy which forms part of the group’s treasury policies.
The group’s exposures to foreign exchange rate risk arise solely from (i) the issuance of US dollar loan notes, which are fully hedged into sterling through the use of cross-currency swaps, and (ii) the home credit operations in the Republic of Ireland, which are hedged by matching euro denominated net assets with euro denominated borrowings as closely as practicable.
As at 31 December 2008, a 2% movement in the sterling to US dollar exchange rate would have led to a £4.2m (2007: £3.0m) movement in external borrowings with an opposite movement of £4.2m (2007: £3.0m) in the hedging reserve within equity. Due to the hedging arrangements in place, there would have been no impact on reported profits.
As at 31 December 2008, a 2% movement in the sterling to euro exchange rate would have led to a £1.0m (2007: £0.7m) movement in customer receivables with an opposite movement of £1.0m (2007: £0.7m) in external borrowings. Due to the natural hedging of matching euro denominated assets with euro denominated liabilities, there would have been no impact on reported profits or equity.
(e) market riskMarket risk is the risk of loss due to adverse market movements caused by active trading positions taken in interest rates, foreign exchange markets, bonds and equities.
The group’s policies do not permit it to undertake position taking or trading books of this type and therefore it does not do so. Accordingly, the group is not subject to market risk.

88
Fina
nc
ial Statem
entS
Annual Report & Financial Statements 2008 Provident Financial plc
Financial and capital risk management – continued
Capital risk managementThe group’s objective in respect of capital risk management is to maintain an efficient capital structure whilst satisfying the requirements of the group’s banking covenants, regulatory capital requirements and the requirements of Fitch Ratings, who provide the group’s external credit rating.
The group manages its capital base against two measures as described below:
(a) Ordinary shareholders’ capital to receivablesThe group has an internal target ratio of ordinary shareholders’ capital to receivables of 15%. This target has been set as the optimum ratio to ensure that the group’s capital risk management objective is met. For the purposes of this ratio, ordinary shareholders’ capital excludes the group’s pension asset, net of deferred tax, the fair value of derivative financial instruments being held for hedging purposes within the hedging reserve, and is stated after deducting proposed dividends. The group monitors ordinary shareholders’ capital to receivables on a monthly basis as part of the group’s management accounts and the ratio is forecast forward for five years as part of the group’s budgeting process. The level of surplus capital retained within the group is assessed by the board on an ongoing basis against the group’s strategic objectives and growth plans.
As at 31 December 2008, the group’s ordinary shareholders’ capital to receivables ratio was 19.1% (2007: 21.7%) as set out below: 2008 2007 Notes £m £m
Receivables 15 1,063.3 925.4Shareholders’ equity 27 277.9 295.9Proposed final dividend 8 (50.1) (50.0)Hedgingreserve(netofdeferredtax) 28 12.0 (0.4)Pension asset 19 (50.9) (61.5)Deferred tax on pension asset 14.3 17.2Ordinary shareholders’ capital 203.2 201.2Ordinary shareholders’ capital to receivables ratio 19.1% 21.7%
The reduction in the ordinary shareholders’ capital to receivables ratio compared to 2007 principally reflects the investment in the loan books of the Consumer Credit Division and Vanquis Bank. Based on the group’s target ratio of 15%, and after taking into account operational seasonality and the timing of dividend payments, this implies surplus capital of approximately £55m exists at 31 December 2008 (2007: £75m). The surplus capital is being retained to fund growth opportunities and provide a sensible degree of strategic flexibility.
(b) Regulatory capitalThe group is the subject of consolidated supervision by the FSA. As part of this supervision, the group is required to maintain a certain level of regulatory capital to mitigate against unexpected losses. Regulatory capital differs from the group’s equity base included in the balance sheet as it excludes items such as intangible assets and the group’s pension asset, but includes the group’s subordinated loan notes. Risk weighted assets principally comprise receivables and other assets of the group but exclude the group’s pension asset and intangible assets.
On 1 January 2008, the group made the transition from reporting under the old BASEL I regulatory framework to reporting under the new BASEL II framework. The group continues to operate under interim capital guidance set by the FSA prior to receiving final Internal Capital Guidance (ICG).
The treasury committee monitors the level of regulatory capital, and capital adequacy is reported to the board on a monthly basis in the group’s management accounts. The group regularly forecasts regulatory capital requirements as part of the budgeting and strategic planning process. The group is required to report twice annually to the FSA on the level of regulatory capital it holds. Under the BASEL II framework, the group is required to report its regulatory capital as a percentage of its Pillar I minimum capital requirement. As at 31 December 2008, the regulatory capital held by the group as a percentage of the Pillar I minimum capital requirement was 419% (2007: 480%) as set out below: 2008 2007 £m £m
Risk weighted assets 899.3 794.3Pillar I minimum capital requirement 79.4 69.7Tier 1 capital 232.8 234.2Tier 2 capital – subordinated loan 100.0 100.0Total regulatory capital 332.8 334.2Total regulatory capital as a percentage of Pillar I minimum capital requirement 419% 480%
The group’s total regulatory capital as a percentage of the Pillar I minimum capital requirement was comfortably in excess of the interim ICG set by the FSA.

Notes to the financial statements 89Fin
an
cia
l Statemen
tS
Annual Report & Financial Statements 2008 Provident Financial plc
1 Segmental reporting Profit/(loss) Revenue before taxation 2008 2007 2008 2007 Group £m £m £m £m
Continuing operationsConsumer Credit Division 651.8 590.5 126.1 123.5Vanquis Bank 94.6 63.5 8.0 (0.9)Yes Car Credit 4.8 15.2 (2.9) (2.9) 751.2 669.2 131.2 119.7Central: – costs – – (5.5) (6.5)– interest receivable – – 3.1 2.0Total central – – (2.4) (4.5)Total continuing operations 751.2 669.2 128.8 115.2
All of the above activities relate to continuing operations as defined in IFRS 5. Consistent with the treatment in prior years, the Yes Car Credit operation has been classified as part of continuing operations on the basis that revenue and impairment will continue to be generated from the loan book until it has been fully collected-out.
Revenue between business segments is not material.
All of the group’s continuing operations operate in the UK and Republic of Ireland. A geographic analysis of revenue and profit before taxation of the international business up until the demerger on 16 July 2007 is provided in note 6. Segment assets Segment liabilities Net assets/(liabilities) 2008 2007 2008 2007 2008 2007 Group £m £m £m £m £m £m
Continuing operationsConsumer Credit Division 949.7 852.9 (719.6) (643.3) 230.1 209.6Vanquis Bank 215.8 151.0 (175.0) (122.4) 40.8 28.6Yes Car Credit 6.0 35.8 (46.2) (77.7) (40.2) (41.9)Central 121.7 224.1 (74.5) (124.5) 47.2 99.6Total continuing operations 1,293.2 1,263.8 (1,015.3) (967.9) 277.9 295.9 Intra-group elimination (66.7) (188.5) 66.7 188.5 – –Total group 1,226.5 1,075.3 (948.6) (779.4) 277.9 295.9
Segment net assets are based on the statutory accounts of the companies forming the group’s business segments adjusted to assume repayment of intra-group balances and rebasing of the borrowings of the Consumer Credit Division to reflect a borrowings to receivables ratio of 80%. The impact of this is an increase in the notional allocation of group borrowings to the Consumer Credit Division of £66.7m (2007: £188.5m) and an increase in the notional cash allocated to central activities of the same amount. The intra-group elimination adjustment removes this notional allocation to state borrowings and cash on a consolidated group basis. Capital expenditure Depreciation Amortisation 2008 2007 2008 2007 2008 2007 Group £m £m £m £m £m £m
Continuing operationsConsumer Credit Division 12.0 12.4 6.4 4.5 1.4 0.2Vanquis Bank 2.1 0.4 0.7 0.8 0.3 0.3Yes Car Credit – – – – – –Central 0.6 0.3 0.4 0.3 – –Total continuing operations 14.7 13.1 7.5 5.6 1.7 0.5Discontinued operationsInternational – 9.9 – 4.3 – 1.6Insurance – 1.0 – 0.3 – 8.6Total discontinued operations – 10.9 – 4.6 – 10.2Total group 14.7 24.0 7.5 10.2 1.7 10.7
Capital expenditure in 2008 comprises expenditure on intangible assets of £6.2m (2007: £3.3m) and property, plant and equipment of £8.5m (2007: £20.7m).
The amortisation charge in 2007 included £8.1m in respect of the amortisation of deferred acquisition costs in the insurance business prior to its disposal on 15 June 2007. The charge in 2007 excluded a £1.4m impairment charge arising as a result of the demerger (see note 12).
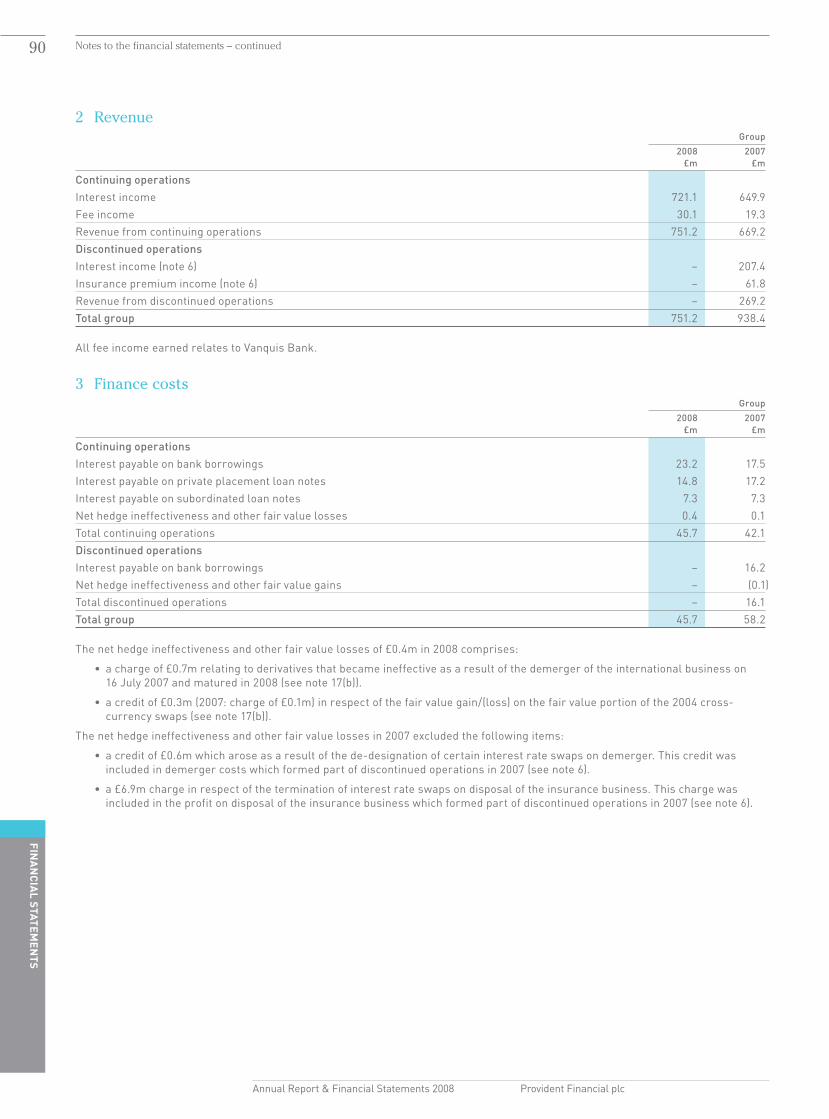
90
Fina
nc
ial Statem
entS
Annual Report & Financial Statements 2008 Provident Financial plc
Notes to the financial statements – continued
2 Revenue Group 2008 2007 £m £m
Continuing operationsInterest income 721.1 649.9Fee income 30.1 19.3Revenue from continuing operations 751.2 669.2Discontinued operationsInterest income (note 6) – 207.4Insurance premium income (note 6) – 61.8Revenue from discontinued operations – 269.2Total group 751.2 938.4
All fee income earned relates to Vanquis Bank.
3 Finance costs Group 2008 2007 £m £m
Continuing operationsInterest payable on bank borrowings 23.2 17.5Interest payable on private placement loan notes 14.8 17.2Interest payable on subordinated loan notes 7.3 7.3Net hedge ineffectiveness and other fair value losses 0.4 0.1Total continuing operations 45.7 42.1Discontinued operationsInterest payable on bank borrowings – 16.2Net hedge ineffectiveness and other fair value gains – (0.1)Total discontinued operations – 16.1Total group 45.7 58.2
The net hedge ineffectiveness and other fair value losses of £0.4m in 2008 comprises:
• achargeof£0.7mrelatingtoderivativesthatbecameineffectiveasaresultofthedemergeroftheinternationalbusinesson 16 July 2007 and matured in 2008 (see note 17(b)).
• acreditof£0.3m(2007:chargeof£0.1m)inrespectofthefairvaluegain/(loss)onthefairvalueportionofthe2004cross-currency swaps (see note 17(b)).
The net hedge ineffectiveness and other fair value losses in 2007 excluded the following items:
• acreditof£0.6mwhicharoseasaresultofthede-designationofcertaininterestrateswapsondemerger.Thiscreditwasincluded in demerger costs which formed part of discontinued operations in 2007 (see note 6).
• a£6.9mchargeinrespectoftheterminationofinterestrateswapsondisposaloftheinsurancebusiness.Thischargewasincluded in the profit on disposal of the insurance business which formed part of discontinued operations in 2007 (see note 6).

91Fin
an
cia
l Statemen
tS
Annual Report & Financial Statements 2008 Provident Financial plc
Notes to the financial statements – continued
4 Profit before taxation Group 2008 2007 £m £m
Profit before taxation from continuing operations is stated after charging/(crediting): Amortisation of other intangible assets: – computer software (note 12) 1.7 0.5Depreciation of property, plant and equipment (note 13) 7.5 5.6Loss/(profit) on disposal of property, plant and equipment (note 13) 0.3 (0.1)Operating lease rentals:– property 6.3 6.3Share-based payment charge (note 26) 4.7 1.6Retirement benefit (credit)/charge (note 19) (1.2) 0.4Impairment of amounts receivable from customers (note 15) 237.7 207.2Profit before taxation from discontinued operations is stated after charging/(crediting):Amortisation of other intangible assets: – computer software (note 12) – 2.1– insurance deferred acquisition costs – 8.1Depreciation of property, plant and equipment (note 13) – 4.6Profit on disposal of property, plant and equipment (note 13) – (0.4)Share-based payment charge (note 26) – 0.3Operating lease rentals:– property – 5.6Foreign exchange losses – 0.5Retirement benefit charge (note 19) – 0.1Impairment of amounts receivable from customers (note 15) – 46.0Gross cost of insurance claims – 49.3Reinsurance credit in respect of insurance claims – (13.0)
The items charged/(credited) to profit before taxation from discontinued operations in 2007 represented amounts charged/(credited) for the international business in the six and a half months prior to demerger and for the insurance business in the five and a half months prior to disposal. The above items were stated before taking into account costs associated with the demerger of the international business and the disposal of the insurance business. Further detail on these costs is set out in note 6. Group 2008 2007 £m £m
Auditors’ remunerationFees payable to the company’s auditor for the audit of parent company and consolidated financial statements 0.1 0.1Fees payable to the company’s auditor and its associates for other services:– audit of company’s subsidiaries pursuant to legislation 0.2 0.2– other services pursuant to legislation 0.1 1.6– tax services 0.1 0.1Total auditors’ remuneration 0.5 2.0
Other services pursuant to legislation provided by the company’s auditors in 2007 included £1.2m of fees in relation to the auditors acting as reporting accountants on the demerger of the international business. These costs were included in demerger costs (see note 6). In addition, £0.4m was paid to the company’s auditors in 2007 for vendor due diligence on the disposal of the insurance business. This cost was subsequently reimbursed by the purchaser.
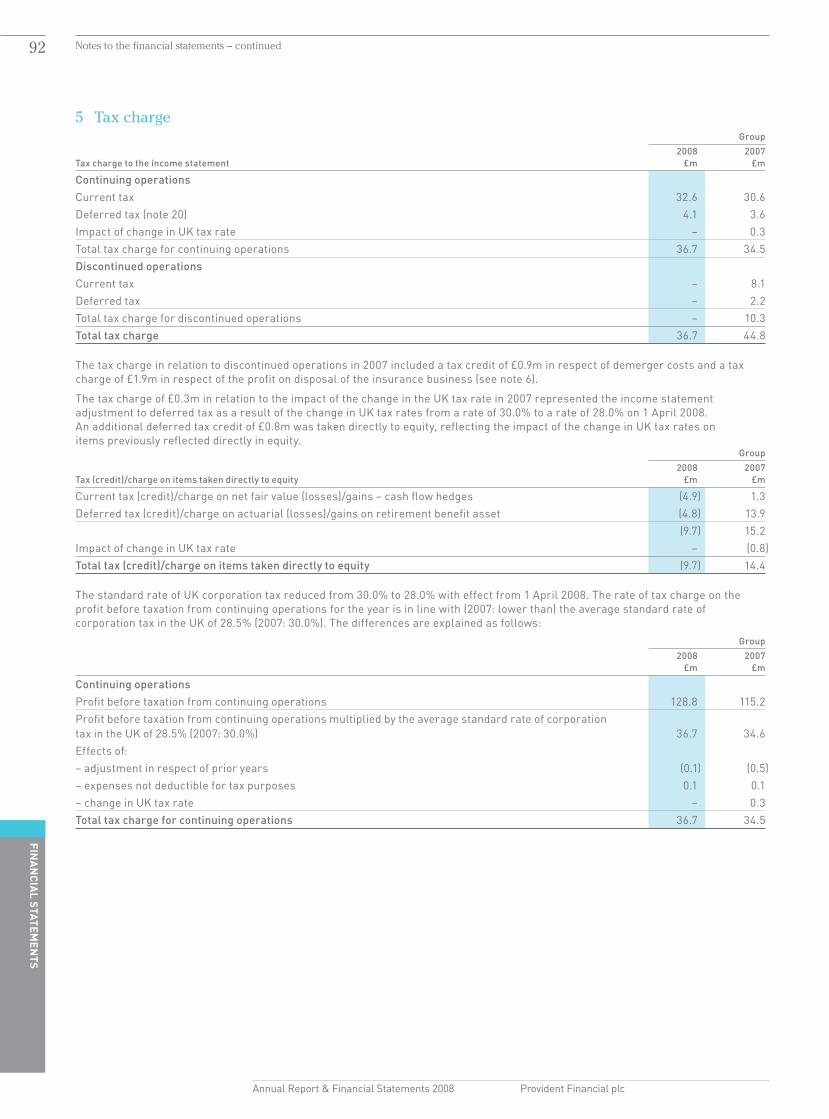
92
Fina
nc
ial Statem
entS
Annual Report & Financial Statements 2008 Provident Financial plc
Notes to the financial statements – continued
5 Tax charge Group 2008 2007 Tax charge to the income statement £m £m
Continuing operationsCurrent tax 32.6 30.6Deferred tax (note 20) 4.1 3.6Impact of change in UK tax rate – 0.3Total tax charge for continuing operations 36.7 34.5Discontinued operations Current tax – 8.1Deferred tax – 2.2Total tax charge for discontinued operations – 10.3Total tax charge 36.7 44.8
The tax charge in relation to discontinued operations in 2007 included a tax credit of £0.9m in respect of demerger costs and a tax charge of £1.9m in respect of the profit on disposal of the insurance business (see note 6).
The tax charge of £0.3m in relation to the impact of the change in the UK tax rate in 2007 represented the income statement adjustment to deferred tax as a result of the change in UK tax rates from a rate of 30.0% to a rate of 28.0% on 1 April 2008. An additional deferred tax credit of £0.8m was taken directly to equity, reflecting the impact of the change in UK tax rates on items previously reflected directly in equity. Group 2008 2007 Tax (credit)/charge on items taken directly to equity £m £m
Current tax (credit)/charge on net fair value (losses)/gains – cash flow hedges (4.9) 1.3 Deferred tax (credit)/charge on actuarial (losses)/gains on retirement benefit asset (4.8) 13.9 (9.7) 15.2Impact of change in UK tax rate – (0.8)Total tax (credit)/charge on items taken directly to equity (9.7) 14.4
The standard rate of UK corporation tax reduced from 30.0% to 28.0% with effect from 1 April 2008. The rate of tax charge on the profit before taxation from continuing operations for the year is in line with (2007: lower than) the average standard rate of corporation tax in the UK of 28.5% (2007: 30.0%). The differences are explained as follows: Group 2008 2007 £m £m
Continuing operationsProfit before taxation from continuing operations 128.8 115.2Profit before taxation from continuing operations multiplied by the average standard rate of corporation tax in the UK of 28.5% (2007: 30.0%) 36.7 34.6Effects of:– adjustment in respect of prior years (0.1) (0.5)– expenses not deductible for tax purposes 0.1 0.1– change in UK tax rate – 0.3Total tax charge for continuing operations 36.7 34.5

93Fin
an
cia
l Statemen
tS
Annual Report & Financial Statements 2008 Provident Financial plc
Notes to the financial statements – continued
6 Discontinued operations The demerger of the companies forming the international business was completed on 16 July 2007 and the disposal of the companies forming the insurance business was completed on 15 June 2007. Accordingly, these businesses have been presented as discontinued operations in accordance with IFRS 5.
The profit after taxation attributable to discontinued operations can be analysed as follows: Group 2008 2007 £m £m
Profit after taxation for the year from the trading activities of the international business – 13.4Demerger costs, net of tax credit – (31.3) – (17.9)Profit after taxation for the year from the trading activities of the insurance business – 8.2Profit after taxation on disposal of the insurance business – 67.4 – 75.6Profit after taxation for the year from discontinued operations – 57.7
The profit after taxation for the year from the trading activities of the international business can be analysed as follows: Group 2008 2007* £m £m
Revenue – 207.4Finance income – 3.8Total income – 211.2Finance costs – (16.1)Operating costs – (74.6)Administrative expenses – (101.4)Total costs – (192.1)Profit before taxation for the year from trading activities – 19.1Tax charge – (5.7)Profit after taxation for the year from trading activities – 13.4
* Represents six and a half months trading under the group’s ownership up until 16 July 2007.
The revenue and profit before taxation for the year from the trading activities of the international business can be further analysed into the following geographical segments: Profit/(loss) Revenue before taxation 2008 2007 2008 2007 Group £m £m £m £m
Central Europe – 187.1 – 34.5Mexico – 18.7 – (7.7)Romania – 1.6 – (2.0)UK and Republic of Ireland – – – (5.7)Total – 207.4 – 19.1
The net assets of the international business on demerger were £165.9m. As the divestment was accounted for as a demerger in the form of a dividend in specie, there was no gain or loss recognised in the income statement. There was no tax charge/credit arising as a result of the demerger.
No demerger costs arose in the year ended 31 December 2008. In 2007, demerger costs amounted to £31.3m comprising gross demerger costs of £32.2m less a tax credit of £0.9m.

94
Fina
nc
ial Statem
entS
Annual Report & Financial Statements 2008 Provident Financial plc
Notes to the financial statements – continued
6 Discontinued operations – continuedThe profit after taxation for the year from the trading activities of the insurance business can be analysed as follows: Group 2008 2007* £m £m
Revenue – 61.8Finance income – 7.4Total income – 69.2Operating costs – (49.0)Administrative expenses – (8.4)Total costs – (57.4)Profit before taxation for the year from trading activities – 11.8Tax charge – (3.6)Profit after taxation for the year from trading activities – 8.2
* Represents five and a half months trading under the group’s ownership up until 15 June 2007.
Included within operating costs in 2007 was a credit of £13.9m in respect of the release of provisions for prior year claims.
All of the above insurance activities relate to activities in the UK and Republic of Ireland.
The profit after taxation on disposal of the insurance business can be analysed as follows: Group 2007 £m
Sales proceeds 170.5Termination of interest rate swaps (note 17) (6.9)Section 75 pension contribution (note 19) (3.4)Disposal costs (8.1)Tax recovered from purchaser 2.0Net cash consideration 154.1Retirement benefit curtailment credit (note 19) 2.9Share-based payment charge (note 26) (0.6)Increase in retirement benefit asset following Section 75 pension contribution (note 19) 3.4Net assets on disposal (90.5)Profit before taxation on disposal of the insurance business 69.3Tax charge (1.9)Profit after taxation on disposal of the insurance business 67.4
The interest rate swaps were held to hedge the interest rate risk on the investment funds held by the insurance business. These swaps were terminated on disposal at a cost of £6.9m (see note 17).
The Section 75 pension contribution represented a reduction in consideration for the payment of £3.4m of pension contributions into the group’s defined benefit pension schemes by the insurance business following disposal. The group’s retirement benefit asset increased by a corresponding amount (see note 19).
Disposal costs of £8.1m comprised professional fees and the cost of bonuses for the senior management team of the insurance business.
The tax recovered from the purchaser of £2.0m represented an adjustment to the consideration to reflect tax relief obtained by the purchaser.
The retirement benefit curtailment credit of £2.9m arose as a result of the reduction in the group’s projected defined benefit obligation following the insurance business employees ceasing to be active members of the group’s pension schemes (see note 19).
The share-based payment charge of £0.6m represented the crystallisation of the share options of the insurance business management team as a result of the disposal (see note 26).
A deferred tax liability of £1.9m was recognised on the pension curtailment credit and the Section 75 pension contribution.
No tax liability arose on the disposal of the insurance business due to the availability of the Substantial Shareholdings Exemption.

95Fin
an
cia
l Statemen
tS
Annual Report & Financial Statements 2008 Provident Financial plc
Notes to the financial statements – continued
6 Discontinued operations – continuedThe cash flows from discontinued operations were as follows: Group 2008 2007 £m £m
Profit after taxation from discontinued operations – 57.7Adjusted for:
Tax charge – 10.3Finance costs – 16.1Finance income – (11.2)Share-based payment charge (note 26) – 6.6Cash settlement of share-based payments (note 28) – (3.8)Retirement benefit charge (note 19) – 0.1Amortisation of intangible assets (note 1) – 10.2Impairment of intangible assets (note 12) – 1.4Depreciation of property, plant and equipment (note 13) – 4.6Profit on disposal of property, plant and equipment (note 13) – (0.4)Profit on disposal of insurance business – (69.3)
Changes in operating assets and liabilities:Amounts receivable from customers – (24.3)Trade and other receivables – (4.1)Insurance assets – (23.4)Trade and other payables – 8.3Insurance accruals and deferred income – (6.8)Retirement benefit asset – (0.4)Derivative financial instruments – (1.0)
Cash used in discontinued operations – (29.4)Finance costs paid – (17.7)Finance income received – 13.2Tax paid – (15.2)Net cash used in discontinued operating activities – (49.1)Purchases of property, plant and equipment – (10.6)Proceeds from disposal of property, plant and equipment (note 13) – 2.6Purchases of intangible assets – (0.3)Proceeds from disposal of insurance business, net of cash and cash equivalents disposed of* – (189.0)Net cash demerged with international business – (44.7)Net cash used in investing activities in discontinued operations – (242.0)Proceeds from borrowings – 54.8Repayment of borrowings – (181.7)Net cash used in financing activities in discontinued operations – (126.9)Net decrease in cash and cash equivalents in discontinued operations – (418.0)
* The proceeds from the disposal of the insurance business, net of cash and cash equivalents disposed of, comprised net cash consideration received of £154.1m less cash and cash equivalents of £343.1m.

96
Fina
nc
ial Statem
entS
Annual Report & Financial Statements 2008 Provident Financial plc
Notes to the financial statements – continued
7 Earnings per shareBasic earnings per share (EPS) is calculated by dividing the earnings attributable to ordinary shareholders by the weighted average number of ordinary shares outstanding during the year, excluding own shares held, which are treated, for this purpose, as being cancelled.
For diluted EPS, the weighted average number of ordinary shares in issue is adjusted to assume conversion of all dilutive potential ordinary shares. For share options and awards, a calculation is performed to determine the number of shares that could have been acquired at fair value (determined as the average annual market share price of the company’s shares) based on the monetary value of the subscription rights attached to outstanding share options and awards. The number of shares calculated as above is compared with the number of shares that would have been issued assuming the exercise of the share options and awards.
Reconciliations of basic and diluted EPS for continuing operations, the total group and discontinued operations are set out below:
2008 2007 Weighted Weighted average average number Per share number Per share Earnings of shares amount Earnings of shares amount Group £m m pence £m m pence
EPS from continuing operationsShares in issue during the year 131.3 197.9 Own shares held (1.4) (0.4) Basic EPS from continuing operations 92.1 129.9 70.9 80.7 197.5 40.9Dilutive effect of share options and awards – 0.7 (0.4) – 1.8 (0.4)Diluted EPS from continuing operations 92.1 130.6 70.5 80.7 199.3 40.5
EPS attributable to equity shareholdersShares in issue during the year 131.3 197.9 Own shares held (1.4) (0.4) Basic EPS attributable to equity shareholders 92.1 129.9 70.9 138.4 197.5 70.1Dilutive effect of share options and awards – 0.7 (0.4) – 1.8 (0.7)Diluted EPS attributable to equity shareholders 92.1 130.6 70.5 138.4 199.3 69.4
EPS from discontinued operationsShares in issue during the year 131.3 197.9 Own shares held (1.4) (0.4) Basic EPS from discontinued operations – 129.9 – 57.7 197.5 29.2Dilutive effect of share options and awards – 0.7 – – 1.8 (0.3)Diluted EPS from discontinued operations – 130.6 – 57.7 199.3 28.9

97Fin
an
cia
l Statemen
tS
Annual Report & Financial Statements 2008 Provident Financial plc
Notes to the financial statements – continued
7 Earnings per share – continuedThe directors have elected to show an adjusted EPS from continuing operations after restating the weighted average number of shares in issue in 2007 to take account of the one-for-two share consolidation which accompanied the demerger of the international business on 16 July 2007. In addition, in order to show the EPS generated from the group’s underlying operations, the directors have elected to restate central costs from £6.5m to £4.0m in 2007 to reflect the assumed cost of running the central corporate function following demerger. A reconciliation of basic and diluted EPS from continuing operations to adjusted basic and diluted EPS from continuing operations is as follows:
2008 2007
Weighted Weighted average average number Per share number Per share Earnings of shares amount Earnings of shares amount Group £m m pence £m m pence
Basic EPS from continuing operations 92.1 129.9 70.9 80.7 197.5 40.9Share consolidation adjustment – – – – (67.6) 21.2Central costs adjustment, net of tax at 30% – – – 1.8 – 1.4Adjusted basic EPS from continuing operations 92.1 129.9 70.9 82.5 129.9 63.5
Diluted EPS from continuing operations 92.1 130.6 70.5 80.7 199.3 40.5Share consolidation adjustment – – – – (67.6) 20.8Central costs adjustment, net of tax at 30% – – – 1.8 – 1.3Adjusted diluted EPS from continuing operations 92.1 130.6 70.5 82.5 131.7 62.6
8 Dividends Group and company 2008 2007 £m £m
2006 final – 22.0p per share – 56.42007 interim – 25.4p per share – 33.02007 final – 38.1p per share 50.0 –2008 interim – 25.4p per share 33.4 –Dividends paid 83.4 89.4
The 2006 final dividend of 22.0p per share was based on the number of shares in issue prior to the one-for-two share consolidation which took place on 16 July 2007 in conjunction with the demerger of the international business. All subsequent dividends have been based on the shares in issue following the share consolidation.
The directors are recommending a final dividend in respect of the financial year ended 31 December 2008 of 38.1p per share which will amount to a dividend payment of £50.1m. If approved by the shareholders at the annual general meeting on 6 May 2009, this dividend will be paid on 19 June 2009 to shareholders who are on the register of members at 15 May 2009. This dividend is not reflected in the balance sheet as at 31 December 2008 as it is subject to shareholder approval.
9 Directors’ remunerationThe remuneration of the directors, who are the key management personnel of the group, is set out below in aggregate for each of the categoriesspecifiedinIAS24,‘Relatedpartydisclosures’.Furtherinformationinrespectofdirectors’remuneration,shareoptions and awards, pension contributions and pension entitlements is set out in the directors’ remuneration report on pages 63 to 72.
Group and company 2008 2007 £m £m
Short-term employee benefits 3.6 4.4Post-employment benefits 0.4 0.4Share-based payment charge 1.6 1.0*Total 5.6 5.8
* Included a £0.4m charge relating to accelerated share-based payment charges arising as a result of the demerger.
Short-term employee benefits comprise salary/fees, bonus and benefits earned in the year. Post-employment benefits represent the sum of (i) the increase in the transfer value of the accrued pension benefits (less directors’ contributions) for those directors who are membersofthegroup’sdefinedbenefitpensionscheme;and(ii)companycontributionsintopersonalpensionarrangementsforallother directors. The share-based payment charge is the proportion of the group’s share-based payment charge that relates to those options and awards granted to the directors.

98
Fina
nc
ial Statem
entS
Annual Report & Financial Statements 2008 Provident Financial plc
Notes to the financial statements – continued
10 Employee information(a) The average monthly number of persons employed by the group (including directors) was as follows: Group 2008 2007 Number Number
Continuing operationsConsumer Credit Division 2,959 2,719Vanquis Bank 358 319 Yes Car Credit 22 55 Central 45 53 Total continuing operations 3,384 3,146 Discontinued operationsInternational – 3,714Insurance – 192 Total discontinued operations – 3,906 Total group 3,384 7,052
Analysed as:Full-time 2,856 5,401 Part-time 528 1,651 Total group 3,384 7,052
(b) The average monthly number of persons employed by the company (including directors) was as follows: Company 2008 2007 Number Number
Total company 45 53

99Fin
an
cia
l Statemen
tS
Annual Report & Financial Statements 2008 Provident Financial plc
Notes to the financial statements – continued
10 Employee information – continued(c) Group employment costs – all employees (including directors) Group 2008 2007 £m £m
Continuing operationsAggregate gross wages and salaries paid to the group’s employees1 98.9 83.4Employers’ National Insurance contributions1 10.5 9.3Pension charge 0.4 1.8Share-based payment charge2 (note 26) 4.7 1.6Total continuing operations 114.5 96.1Discontinued operationsAggregate gross wages and salaries paid to the group’s employees1 – 45.2Employers’ National Insurance contributions1 – 11.4Pension charge3 – 0.3Share-based payment charge2 (note 26) – 0.3Total discontinued operations – 57.2Total group 114.5 153.31 In 2007, the amounts disclosed excluded demerger bonus costs of £4.0m plus employers’ National Insurance contributions of £0.5m. These amounts were
included as part of demerger costs (see note 6).2 In 2007, the amount disclosed excluded a one-off share-based payment charge of £6.3m arising on demerger of the international business which was
included as part of demerger costs (see note 6) and a £0.6m charge arising on disposal of the insurance business which was included as part of the profit on disposal of the insurance business (see note 6).
3 In 2007, the amount disclosed excluded a one-off pension curtailment credit of £2.9m arising on disposal of the insurance business. This amount was included as part of the profit on disposal of the insurance business (see note 6).
The pension charge comprises the group retirement benefit charge for defined benefit schemes, group contributions to the stakeholder pension plan and group contributions to personal pension arrangements.
(d) Company employment costs – all employees (including directors) Company 2008 2007 £m £m
Aggregate gross wages and salaries paid to the company’s employees 5.1 12.4Employers’ National Insurance contributions 0.6 1.8Pension credit (0.2) –Share-based payment charge 2.1 0.6Total company 7.6 14.8
The pension charge comprises the company retirement benefit credit for defined benefit schemes, company contributions to the stakeholder pension plan and company contributions to personal pension arrangements.

100
Fina
nc
ial Statem
entS
Annual Report & Financial Statements 2008 Provident Financial plc
Notes to the financial statements – continued
11 Goodwill Group 2008 2007 £m £m
CostAt 1 January and 31 December 94.1 94.1
Accumulated impairment lossesAt 1 January and 31 December 91.0 91.0
Net book value at 31 December 3.1 3.1
Goodwill comprises £91.0m relating to the acquisition in 2003 of the companies forming Yes Car Credit and £3.1m relating to the acquisition in 2001 of N&N Cheque Encashment Limited, the holding company of Cheque Exchange Limited, which forms part of the Consumer Credit Division. On 30 January 2009, Cheque Exchange Limited was sold for a total consideration of £3.0m (see note 32). There was no gain or loss on disposal and, therefore, the consideration received supports the carrying value of the goodwill as at 31 December 2008.
The goodwill in respect of Yes Car Credit was fully impaired following the announcement of the closure of the business in December 2005.
12 Other intangible assets Computer software 2008 2007 Group £m £m
CostAt 1 January 17.3 34.5Additions 6.2 3.3Disposal of insurance business – (6.3)Demerger of international business – (14.2)At 31 December 23.5 17.3
Accumulated amortisationAt 1 January 4.7 4.5 Charged to the income statement 1.7 2.6 Impairment – 1.4Disposal of insurance business – (2.2)Demerger of international business – (1.6)At 31 December 6.4 4.7
Net book value at 31 December 17.1 12.6
Net book value at 1 January 12.6 30.0
Additions of £6.2m in 2008 relate wholly to continuing operations. Additions in 2007 comprised £3.0m in respect of continuing operations and £0.3m in respect of discontinued operations.
The amortisation charged to the income statement of £1.7m in 2008 relates wholly to continuing operations and is included within administrative expenses. The amortisation charged to the income statement of £2.6m in 2007 comprised £0.5m in respect of continuing operations and £2.1m in respect of discontinued operations.
As a result of the demerger of the international business in 2007, certain internally developed computer software became redundant resulting in an impairment charge of £1.4m. This amount was included in demerger costs which formed part of discontinued operations (see note 6).

101Fin
an
cia
l Statemen
tS
Annual Report & Financial Statements 2008 Provident Financial plc
Notes to the financial statements – continued
13 Property, plant and equipment Freehold Leasehold land and land and Equipment buildings buildings and vehicles Total Group £m £m £m £m
CostAt 1 January 2008 4.2 0.9 61.0 66.1Additions – 0.1 8.4 8.5Disposals – (0.2) (2.2) (2.4)At 31 December 2008 4.2 0.8 67.2 72.2
Accumulated depreciationAt 1 January 2008 1.3 0.4 35.7 37.4Charged to the income statement 0.1 0.2 7.2 7.5Disposals – (0.1) (1.2) (1.3)At 31 December 2008 1.4 0.5 41.7 43.6
Net book value at 31 December 2008 2.8 0.3 25.5 28.6
Net book value at 1 January 2008 2.9 0.5 25.3 28.7
Additions, disposals and depreciation in 2008 relate wholly to continuing operations.
The loss on disposal of property, plant and equipment in 2008 amounted to £0.3m and represents proceeds received of £0.8m less the net book value of disposals of £1.1m and relates wholly to continuing operations. Freehold Leasehold land and land and Equipment buildings buildings and vehicles Total Group £m £m £m £m
CostAt 1 January 2007 6.4 0.8 106.2 113.4Exchange adjustments – – 0.4 0.4Additions – 0.1 20.6 20.7Disposals (0.1) – (7.2) (7.3)Disposal of insurance business (2.1) – (4.0) (6.1)Demerger of international business – – (55.0) (55.0)At 31 December 2007 4.2 0.9 61.0 66.1
Accumulated depreciationAt 1 January 2007 1.4 0.2 53.1 54.7Charged to the income statement 0.1 0.2 9.9 10.2Disposals (0.1) – (3.4) (3.5)Disposal of insurance business (0.1) – (3.0) (3.1)Demerger of international business – – (20.9) (20.9)At 31 December 2007 1.3 0.4 35.7 37.4
Net book value at 31 December 2007 2.9 0.5 25.3 28.7
Net book value at 1 January 2007 5.0 0.6 53.1 58.7
Additions in 2007 comprised £10.1m in respect of continuing operations and £10.6m in respect of discontinued operations.
The depreciation charged to the income statement in 2007 of £10.2m comprised £5.6m in respect of continuing operations and £4.6m in respect of discontinued operations.
The profit on disposal of property, plant and equipment in 2007 amounted to £0.5m and comprised £0.1m in respect of continuing operations and £0.4m in respect of discontinued operations, and represented proceeds received of £1.7m less the net book value of disposals of £1.6m for continuing operations and proceeds received of £2.6m less the net book value of disposals of £2.2m for discontinued operations.

102
Fina
nc
ial Statem
entS
Annual Report & Financial Statements 2008 Provident Financial plc
13 Property, plant and equipment – continued Freehold Leasehold land and land and Equipment buildings buildings and vehicles Total Company £m £m £m £m
CostAt 1 January 2008 4.2 0.2 2.1 6.5Additions – – 0.6 0.6Disposals – – (0.4) (0.4)At 31 December 2008 4.2 0.2 2.3 6.7
Accumulated depreciationAt 1 January 2008 1.3 0.1 1.5 2.9Charged to the income statement 0.1 – 0.3 0.4Disposals – – (0.3) (0.3)At 31 December 2008 1.4 0.1 1.5 3.0
Net book value at 31 December 2008 2.8 0.1 0.8 3.7
Net book value at 1 January 2008 2.9 0.1 0.6 3.6
The loss on disposal of property, plant and equipment in 2008 amounted to £0.1m (2007: profit of £0.3m). This represents cash received of £nil (2007: £0.7m) less the net book value of disposals of £0.1m (2007: £0.4m). Freehold Leasehold land and land and Equipment buildings buildings and vehicles Total Company £m £m £m £m
CostAt 1 January 2007 4.3 0.2 2.3 6.8Additions – – 0.3 0.3Disposals (0.1) – (0.5) (0.6)At 31 December 2007 4.2 0.2 2.1 6.5
Accumulated depreciationAt 1 January 2007 1.3 0.1 1.4 2.8Charged to the income statement 0.1 – 0.2 0.3Disposals (0.1) – (0.1) (0.2)At 31 December 2007 1.3 0.1 1.5 2.9
Net book value at 31 December 2007 2.9 0.1 0.6 3.6
Net book value at 1 January 2007 3.0 0.1 0.9 4.0
Notes to the financial statements – continued

103Fin
an
cia
l Statemen
tS
Annual Report & Financial Statements 2008 Provident Financial plc
14 Investment in subsidiaries Company 2008 2007 £m £m
CostAt 1 January 389.7 431.2Additions 13.1 78.8Disposals – (120.3)At 31 December 402.8 389.7
Accumulated impairment lossesAt 1 January 32.1 32.4Credited to the income statement (0.4) (0.3)At 31 December 31.7 32.1
Total cost less accumulated impairment losses at 31 December 371.1 357.6
Theadditionstoinvestmentsin2008representafurther£7.0minvestmentintheequityofVanquisBankLimited;£3.5minrespect ofthetransferofDirectAutoFinancialServicesLimitedandothernon-tradingsubsidiariesfromasubsidiaryundertaking;and £2.6m in respect of options and awards over Provident Financial plc shares which have been granted/awarded to employees of subsidiary companies.
Additionsin2007represented£70.0mofcapitalcontributionsintoProvidentInternationalHoldingsLimited,theintermediateholdingcompanyoftheinternationalbusiness,priortothedemergerofthatbusiness;furtherinvestmentsintheequityofHebbleInsuranceManagement Services Limited (£6.2m), Provident Insurance plc (£1.3m) and Yesinsurance Services Limited (£0.4m) prior to the disposal oftheinsurancebusiness;£0.3mfortheacquisitionofpreferencesharesinProvidentPersonalCreditLimited;and£0.6minrespectofoptions and awards over Provident Financial plc shares which were granted/awarded to employees of subsidiary companies.
There were no disposals of investments in 2008.
Disposals in 2007 represented a dividend in specie to effect the demerger of the international business on 16 July 2007 of £73.3m (seenote27);£45.7minrespectofthedisposalofthecompaniesformingtheinsurancebusiness;and£1.3minrespectofoptions and awards over Provident Financial plc shares which were granted/awarded to employees of subsidiary companies which had lapsed, been exercised or been released.
The impairment credit arising in 2008 represents the reversal of prior year impairment losses of £0.4m in respect of the companies forming the Yes Car Credit business (2007: £0.3m).
The directors consider the value of investments to be supported by their underlying assets.
The following are the subsidiary undertakings which, in the opinion of the directors, principally affect the profit or assets of the group. A full list of subsidiary undertakings will be annexed to the next annual return of the company to be filed with the Registrar of Companies. All subsidiaries are consolidated and are held by wholly-owned intermediate companies, except for those noted below, which are held directly by the company. Country of incorporation Class % or registration of capital holding
Consumer Credit Division Provident Financial Management Services Limited England Ordinary 100 *
Provident Personal Credit Limited England Ordinary 100 Greenwood Personal Credit Limited England Ordinary 100 Cheque Exchange Limited England Ordinary 100Vanquis Bank Vanquis Bank Limited England Ordinary 100 *
Yes Car Credit Direct Auto Financial Services Limited England Ordinary 100 *
Central Provident Investments plc England Ordinary 100 *
* Shares held directly.
Cheque Exchange Limited was sold on 30 January 2009 for a total consideration of £3.0m (see note 32). The consideration received supported the carrying value of the investment in the company’s balance sheet.
The above companies operate principally in their country of incorporation or registration.
Notes to the financial statements – continued

104
Fina
nc
ial Statem
entS
Annual Report & Financial Statements 2008 Provident Financial plc
15 Amounts receivable from customers
2008 2007 Due in Due in Due within more than Due within more than one year one year Total one year one year Total Group £m £m £m £m £m £m
Consumer Credit Division 768.4 83.7 852.1 687.4 61.6 749.0Vanquis Bank 205.4 – 205.4 143.1 – 143.1Yes Car Credit 5.8 – 5.8 23.1 10.2 33.3Total group 979.6 83.7 1,063.3 853.6 71.8 925.4
Amounts receivable from customers are held at amortised cost and are equal to the expected future cash flows receivable discounted at the effective interest rate. The average effective interest rate for the year ended 31 December 2008 was 100% for the Consumer Credit Division (2007: 99%), 38% for Vanquis Bank (2007: 38%) and 21% for Yes Car Credit (2007: 20%).
The average period to maturity of the amounts receivable from customers within the Consumer Credit Division is 6.5 months (2007: 6.2 months) and within Yes Car Credit is 4.1 months (2007: 8.5 months). Within Vanquis Bank, there is no fixed term for repayment of credit card loans other than a general requirement for customers to make a monthly minimum repayment towards their outstanding balance. For the majority of customers, this is the higher of £5 or 4.5% of their outstanding balance.
The fair value of amounts receivable from customers is approximately £1.3 billion (2007: £1.1 billion). Fair value has been derived by discounting expected future cash flows (net of collection costs) at the group’s weighted average cost of capital at the balance sheet date. This value approximates to market value.
The credit quality of amounts receivable from customers is as follows: Group 2008 2007 Credit quality of amounts receivable from customers £m £m
Neither past due nor impaired 504.7 412.6Past due but not impaired 113.8 111.9Impaired 444.8 400.9Total 1,063.3 925.4
Past due but not impaired balances all relate to home credit loans within the Consumer Credit Division. There are no accounts/loans within Vanquis Bank, Yes Car Credit and the unsecured direct repayment loans business of the Consumer Credit Division which are past due but not impaired. In the home credit business of the Consumer Credit Division, past due but not impaired balances relate to loanswhicharecontractuallyoverdue.However,contractuallyoverdueloansarenotdeemedtobeimpairedunlessthecustomerhasmissed two or more cumulative weekly payments in the previous 12-week period since only at this point do the expected future cash flows from loans deteriorate significantly.
Notes to the financial statements – continued

105Fin
an
cia
l Statemen
tS
Annual Report & Financial Statements 2008 Provident Financial plc
15 Amounts receivable from customers – continuedThe following table sets out the ageing analysis of past due but not impaired balances within the home credit business of the Consumer Credit Division based on contractual arrears since the inception of the loan: Group 2008 2007 Ageing analysis of past due but not impaired balances £m £m
One week overdue 65.4 71.9Two weeks overdue 23.4 22.9Three weeks or more overdue 25.0 17.1Past due but not impaired 113.8 111.9
The group holds collateral of £2.3m (2007: £9.1m) as security in respect of the Yes Car Credit amounts receivable from customers. In the event of default by the customer, the proceeds from disposal of the motor vehicle originally financed are used to offset amounts due from the customer.
Impairment in Vanquis Bank is deducted from the carrying value of amounts receivable from customers by the use of an allowance account. The movement in the allowance account during the year is as follows: Group 2008 2007 Vanquis Bank allowance account £m £m
At 1 January 19.9 15.3Charge for the year 38.2 25.2Amounts written off during the year (40.9) (29.9)Amounts recovered during the year 9.2 9.3At 31 December 26.4 19.9
Within the Consumer Credit Division and Yes Car Credit, impairments are deducted directly from amounts receivable from customers without the use of an allowance account.
The impairment charge in respect of amounts receivable from customers reflected within operating costs can be analysed as follows:
Group 2008 2007 Impairment charge on amounts receivable from customers £m £m
Continuing operationsConsumer Credit Division 197.9 175.3Vanquis Bank 38.2 25.2Yes Car Credit 1.6 6.7Total continuing operations 237.7 207.2Discontinued operationsInternational* – 46.0Total group 237.7 253.2
* The impairment charge for the international business in 2007 represented the impairment charge for the six and a half months trading under the group’s ownership until 16 July 2007.
Notes to the financial statements – continued

106
Fina
nc
ial Statem
entS
Annual Report & Financial Statements 2008 Provident Financial plc
15 Amounts receivable from customers – continuedInterest income recognised on amounts receivable from customers which have been impaired can be analysed as follows: Group 2008 2007 Interest income recognised on impaired amounts receivable from customers £m £m
Continuing operationsConsumer Credit Division 309.3 286.5Vanquis Bank 12.0 9.4 Yes Car Credit 0.9 3.1Total continuing operations 322.2 299.0Discontinued operationsInternational – 126.6Total group 322.2 425.6
The currency profile of amounts receivable from customers is as follows: Group 2008 2007 Currency profile of amounts receivable from customers £m £m
Sterling 1,011.7 890.6Euro 51.6 34.8Total group 1,063.3 925.4
Notes to the financial statements – continued
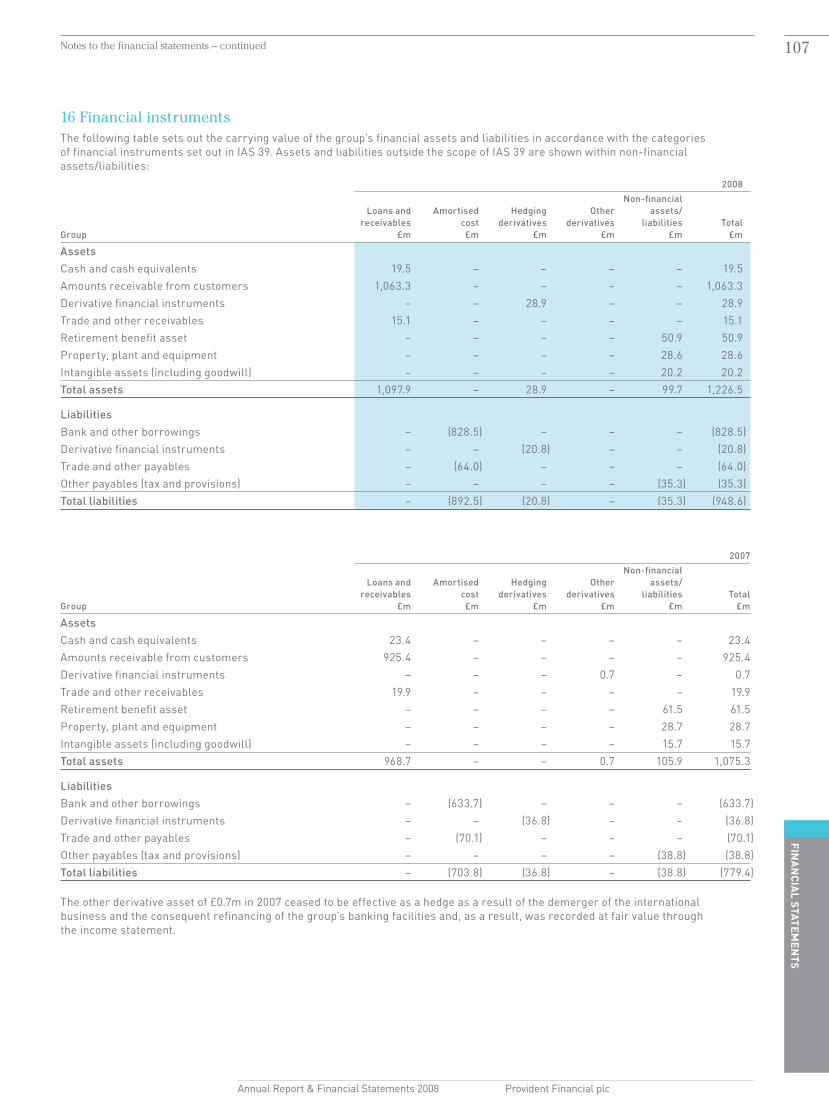
107Fin
an
cia
l Statemen
tS
Annual Report & Financial Statements 2008 Provident Financial plc
16 Financial instrumentsThe following table sets out the carrying value of the group’s financial assets and liabilities in accordance with the categories of financial instruments set out in IAS 39. Assets and liabilities outside the scope of IAS 39 are shown within non-financial assets/liabilities: 2008 Non-financial Loans and Amortised Hedging Other assets/ receivables cost derivatives derivatives liabilities Total Group £m £m £m £m £m £m
AssetsCash and cash equivalents 19.5 – – – – 19.5Amounts receivable from customers 1,063.3 – – – – 1,063.3Derivative financial instruments – – 28.9 – – 28.9Trade and other receivables 15.1 – – – – 15.1Retirement benefit asset – – – – 50.9 50.9Property, plant and equipment – – – – 28.6 28.6Intangible assets (including goodwill) – – – – 20.2 20.2Total assets 1,097.9 – 28.9 – 99.7 1,226.5
LiabilitiesBank and other borrowings – (828.5) – – – (828.5)Derivative financial instruments – – (20.8) – – (20.8)Trade and other payables – (64.0) – – – (64.0)Other payables (tax and provisions) – – – – (35.3) (35.3)Total liabilities – (892.5) (20.8) – (35.3) (948.6)
2007 Non-financial Loans and Amortised Hedging Other assets/ receivables cost derivatives derivatives liabilities Total Group £m £m £m £m £m £m
AssetsCash and cash equivalents 23.4 – – – – 23.4Amounts receivable from customers 925.4 – – – – 925.4Derivative financial instruments – – – 0.7 – 0.7Trade and other receivables 19.9 – – – – 19.9Retirement benefit asset – – – – 61.5 61.5Property, plant and equipment – – – – 28.7 28.7Intangible assets (including goodwill) – – – – 15.7 15.7Total assets 968.7 – – 0.7 105.9 1,075.3
LiabilitiesBank and other borrowings – (633.7) – – – (633.7)Derivative financial instruments – – (36.8) – – (36.8)Trade and other payables – (70.1) – – – (70.1)Other payables (tax and provisions) – – – – (38.8) (38.8)Total liabilities – (703.8) (36.8) – (38.8) (779.4)
The other derivative asset of £0.7m in 2007 ceased to be effective as a hedge as a result of the demerger of the international business and the consequent refinancing of the group’s banking facilities and, as a result, was recorded at fair value through the income statement.
Notes to the financial statements – continued

108
Fina
nc
ial Statem
entS
Annual Report & Financial Statements 2008 Provident Financial plc
16 Financial instruments – continuedThe following table sets out the carrying value of the company’s financial assets and liabilities in accordance with the categories of financial instruments set out in IAS 39: 2008 Non-financial Loans and Amortised Hedging Other assets/ receivables cost derivatives derivatives liabilities Total Company £m £m £m £m £m £m
AssetsCash and cash equivalents 0.5 – – – – 0.5Investments in subsidiaries – – – – 371.1 371.1Trade and other receivables 1,301.2 – – – – 1,301.2Retirement benefit asset – – – – 16.1 16.1Property, plant and equipment – – – – 3.7 3.7Other assets (tax) – – – – 1.3 1.3Total assets 1,301.7 – – – 392.2 1,693.9
LiabilitiesBank and other borrowings – (469.2) – – – (469.2)Derivative financial instruments – – (20.1) – – (20.1)Trade and other payables – (247.0) – – – (247.0)Other payables (tax) – – – – (12.3) (12.3)Total liabilities – (716.2) (20.1) – (12.3) (748.6)
2007 Non-financial Loans and Amortised Hedging Other assets/ receivables cost derivatives derivatives liabilities Total Company £m £m £m £m £m £m
AssetsCash and cash equivalents 0.8 – – – – 0.8Investments in subsidiaries – – – – 357.6 357.6Derivative financial instruments – – – 0.7 – 0.7Trade and other receivables 1,243.0 – – – – 1,243.0Retirement benefit asset – – – – 19.5 19.5Property, plant and equipment – – – – 3.6 3.6Total assets 1,243.8 – – 0.7 380.7 1,625.2
LiabilitiesBank and other borrowings – (314.8) – – – (314.8)Derivative financial instruments – – (17.1) – – (17.1)Trade and other payables – (297.3) – – – (297.3)Other payables (tax) – – – – (18.2) (18.2)Total liabilities – (612.1) (17.1) – (18.2) (647.4)
Notes to the financial statements – continued

109Fin
an
cia
l Statemen
tS
Annual Report & Financial Statements 2008 Provident Financial plc
17 Derivative financial instrumentsThe group uses derivative financial instruments to hedge the interest rate risk and foreign exchange rate risk on its borrowings. The group does not enter into speculative transactions or positions.
The contractual/notional amounts and the fair values of derivative financial instruments are set out below:
2008 2007 Contractual Contractual /notional /notional amount Assets Liabilities amount Assets Liabilities Group £m £m £m £m £m £m
Interest rate swaps 1,488.5 – (20.0) 100.1 0.7 –Cross-currency swaps 164.8 28.9 (0.1) 190.8 – (36.8)Foreign exchange contracts 5.5 – (0.7) 0.6 – –Total group 1,658.8 28.9 (20.8) 291.5 0.7 (36.8)
Analysed as – due within one year – (4.7) 0.7 (12.5) – due in more than one year 28.9 (16.1) – (24.3) 28.9 (20.8) 0.7 (36.8)
2008 2007 Contractual Contractual /notional /notional amount Assets Liabilities amount Assets Liabilities Company £m £m £m £m £m £m
Interest rate swaps 1,488.5 – (20.0) 100.1 0.7 –Cross-currency swaps 16.4 – (0.1) 61.5 – (17.1)Total group 1,504.9 – (20.1) 161.6 0.7 (17.1)
Analysed as – due within one year – (4.0) 0.7 (12.5) – due in more than one year – (16.1) – (4.6) – (20.1) 0.7 (17.1)
The fair value of derivative financial instruments has been calculated by discounting contractual future cash flows using relevant market interest rate yield curves and forward foreign exchange rates prevailing at the balance sheet date.
The derivative financial instruments above are all held for hedging purposes.
(a) Hedging reserve movementsThe (charge)/credit to the hedging reserve within equity as a result of the movement in the fair value of derivative financial instruments can be summarised as follows: Group
2008 2007 £m £m
Interest rate swaps (20.0) 2.92001 cross-currency swaps 0.3 0.42003 cross-currency swaps 1.7 1.32004 cross-currency swaps 1.4 (0.1)Foreign exchange contracts (0.7) –Net (charge)/credit to the hedging reserve (17.3) 4.5
The net credit to the group hedging reserve of £4.5m in 2007 included £2.8m of previously deferred losses which were recycled and reported in profit for the year. Company
2008 2007 £m £m
Interest rate swaps (20.0) (1.3)2001 cross-currency swaps 0.3 0.4Net charge to the hedging reserve (19.7) (0.9)
The net charge to the company hedging reserve of £0.9m in 2007 included £1.3m of previously deferred gains which were recycled and reported in profit for the year.
Notes to the financial statements – continued

110
Fina
nc
ial Statem
entS
Annual Report & Financial Statements 2008 Provident Financial plc
17 Derivative financial instruments – continued
(b) income statement chargesThe net charge to the income statement in the year in respect of the movement in the fair value of derivative financial instruments is as follows: Group
2008 2007 £m £m
Net fair value gain/(loss) on 2004 cross-currency swaps 0.3 (0.1)Movement in fair value of de-designated interest rate swaps (0.7) (6.3)Movement in fair value of foreign exchange put/sterling call options – 0.1Net charge to the income statement (0.4) (6.3)
The movement in the fair value of de-designated interest rate swaps of £6.3m in 2007 comprised:
• acreditof£0.6mwhicharoseasaresultofthede-designationofcertaininterestrateswapsondemerger.Thiscreditwasincluded in demerger costs which formed part of discontinued operations in 2007 (see note 6).
• a£6.9mchargeinrespectoftheterminationofinterestrateswapsondisposaloftheinsurancebusiness.Thischargewasincluded in the profit on disposal of the insurance business which formed part of discontinued operations in 2007 (see note 6).
Company
2008 2007 £m £m
Movement in fair value of de-designated interest rate swaps (0.7) –Net charge to the income statement (0.7) –
(c) interest rate swapsThe group and company use interest rate swaps in order to manage the interest rate risk on the group’s syndicated and bilateral bank borrowings. In the year ended 31 December 2008, the group entered into various interest rate swaps which have been designated and are effective under IAS 39 as cash flow hedges. A liability of £20.0m is held in the group and company balance sheet as at 31 December 2008 in respect of interest rate swaps (2007: asset of £0.7m). The movement in the fair value of interest rate swaps during the year amounted to a net loss of £20.7m, of which £20.0m has been recognised in the group and company’s hedging reserve within equity (2007: group – net gain of £2.9m, company – net loss of £1.3m).
The derivative asset of £0.7m as at 31 December 2007 ceased to be effective as a hedge as a result of the demerger of the international business and the consequent refinancing of the group’s banking facilities and, as a result, was measured at fair value through the income statement during 2008 (see note 3).
The weighted average interest rate and period to maturity of the interest rate swaps held by the group and company were as follows:
2008 2007 Weighted Weighted Weighted Range of average Weighted Range of average average interest period to average interest period to interest rate rates maturity interest rate rates maturity Group % % (years) % % (years)
Sterling 4.4 3.2–5.2 1.9 4.3 4.0–4.7 0.4Euro 3.8 3.8 0.6 2.9 2.7–3.4 0.5
2008 2007 Weighted Weighted Weighted Range of average Weighted Range of average average interest period to average interest period to interest rate rates maturity interest rate rates maturity Company % % (years) % % (years)
Sterling 4.4 3.2–5.2 1.9 4.3 4.0–4.7 0.4Euro 3.8 3.8 0.6 2.9 2.7–3.4 0.5
Notes to the financial statements – continued

111Fin
an
cia
l Statemen
tS
Annual Report & Financial Statements 2008 Provident Financial plc
17 Derivative financial instruments – continued
(d) cross-currency swapsThe group and company use cross-currency swaps in order to manage the interest rate and foreign exchange rate risk arising on the group’s US private placement loan notes issued in 2001, 2003 and 2004.
2001 and 2003 private placement loan notesThe group and company have put in place cross-currency swaps to swap the principal and fixed rate interest of the 2001 and 2003 US dollar private placement loan notes into fixed rate sterling liabilities. The maturity dates of the cross-currency swaps match the underlying loan notes (see note 22(d)). These swaps were designated and were effective under IAS 39 as cash flow hedges in the year ended 31 December 2008 and the fair value movements in the swaps and the corresponding exchange movements on the underlying loan notes have been deferred in the hedging reserve within equity.
The cross-currency swaps used to hedge the 2001 US dollar private placement loan notes have a weighted average interest rate of 7.6% (2007: 7.7%), a range of interest rates of 7.6% (2007: 7.6% to 7.7%) and a weighted average period to maturity of 2.4 years (2007: 1.2 years). The movement in the fair value of the swaps can be analysed as follows: Group and company
2008 2007 £m £m
Liability at 1 January (17.1) (16.9)Exchange rate movements 16.7 (0.6)Credited to the hedging reserve 0.3 0.4Liability at 31 December (0.1) (17.1)
The exchange rate movements reflect the movement in the year of the difference between the translation of the 2001 US dollar private placement loan notes at the year end exchange rate compared to the contracted rate. A corresponding entry is made to borrowings.
The amount charged to the hedging reserve reflects the difference between the movement in the fair value of the cross-currency swaps and the exchange rate movements described above.
The cross-currency swaps used to hedge the 2003 US dollar private placement loan notes have a weighted average interest rate of 6.7% (2007: 6.7%), a range of interest rates of 6.6% to 6.8% (2007: 6.6% to 6.8%) and a weighted average period to maturity of 3.2 years (2007: 4.2 years). The movement in the fair value of the swaps can be analysed as follows: Group
2008 2007 £m £m
Liability at 1 January (16.5) (17.0)Exchange rate movements 21.6 (0.8)Credited to the hedging reserve 1.7 1.3Asset/(liability) at 31 December 6.8 (16.5)
The exchange rate movements reflect the movement in the year of the difference between the translation of the 2003 US dollar private placement loan notes at the year end exchange rate compared to the contracted rate. A corresponding entry is made to borrowings.
The amount credited to the hedging reserve reflects the difference between the movement in the fair value of the cross-currency swaps and the exchange rate movements described above.
2004 private placement loan notesThe group has put in place cross-currency swaps to swap the principal and fixed rate interest of the US dollar private placement loan notes issued in 2004 into floating rate sterling interest liabilities. The maturity dates of the cross-currency swaps match the underlying loan notes (see note 22(d)).
The swaps comprise both cash flow hedges and fair value hedges. The cash flow hedge portion of the swaps were designated and were effective under IAS 39 as cash flow hedges in the year and the movements in the swaps and the exchange movements in the underlying loan notes have been deferred in the hedging reserve within equity.
The fair value hedge portion of the swaps were designated and were effective under IAS 39 as fair value hedges during the year. As a result, fair value movements in the swaps were charged/credited to the income statement with a corresponding entry made to the underlying loan notes within borrowings for the effective portion of the swaps, leaving a net charge/credit within the income statement reflecting the net fair value loss/gain on the fair value hedge in the year.
The swaps have a range of interest rates from LIBOR + 1.58% to LIBOR + 1.63% (2007: LIBOR + 1.58% to LIBOR + 1.63%) and a weighted average period to maturity of 4.7 years (2007: 5.7 years).
Notes to the financial statements – continued

112
Fina
nc
ial Statem
entS
Annual Report & Financial Statements 2008 Provident Financial plc
17 Derivative financial instruments – continuedThe movement in the fair value of the swaps can be analysed as follows: Group
2008 2007 £m £m
Liability at 1 January (3.2) (4.1)Exchange rate movements 23.6 1.1Credited/(charged) to the hedging reserve 1.4 (0.1)Net fair value gain/(loss) credited/(charged) to the income statement 0.3 (0.1)Asset/(liability) at 31 December 22.1 (3.2)
The exchange rate movements reflect the movement in the year of the difference between the translation of the 2004 US dollar private placement loan notes at the year end exchange rate compared to the contracted rate. A corresponding entry is made to borrowings.
The amount credited/(charged) to the hedging reserve reflects the difference between the movement in the fair value of the cash flow hedge portion of the cross-currency swaps and the cash flow hedge portion of the exchange rate movements described above.
The net fair value gain/(loss) credited/(charged) to the income statement reflects the difference between the movement in the fair value of the fair value hedge portion of the cross-currency swaps and the fair value hedge portion of the exchange rate movements described above.
(e) Foreign exchange contractsThe group uses foreign exchange contracts in order to manage the foreign exchange rate risk arising from the group’s operations in the Republic of Ireland. A liability of £0.7m is held in the group balance sheet as at 31 December 2008 in respect of foreign exchange contracts (2007: £nil).
The group’s foreign exchange contracts comprise forward foreign exchange contracts to buy sterling for a total notional amount of £5.5m (2007: £0.6m). These contracts have a range of maturity dates from 11 February 2009 to 11 November 2009. These contracts were designated and were effective under IAS 39 as cash flow hedges in the year and, accordingly, the movement in fair value of £0.7m has been charged to the hedging reserve within equity (2007: £nil).
Notes to the financial statements – continued

113Fin
an
cia
l Statemen
tS
Annual Report & Financial Statements 2008 Provident Financial plc
18 Trade and other receivables Company 2008 2007 Non-current assets £m £m
Amounts owed by group undertakings 438.0 438.0
There are no amounts past due and there is no impairment provision held against amounts owed by group undertakings due for repayment in more than one year (2007: £nil). The amounts owed by group undertakings are unsecured, due for repayment in more than one year and accrue interest at rates linked to LIBOR.
Group Company 2008 2007 2008 2007 Current assets £m £m £m £m
Trade receivables 0.6 0.9 – –Other receivables 2.5 6.1 – 2.9Amounts owed by group undertakings – – 860.8 797.2Prepayments and accrued income 12.0 12.9 2.4 4.9Total 15.1 19.9 863.2 805.0
There are no amounts past due in respect of trade and other receivables due in less than one year (2007: £nil). Within the company, an impairment provision of £126.8m (2007: £123.2m) is held against amounts owed by group undertakings due in less than one year representing the deficiency in the net assets of those group undertakings. The movement in the provision in the year of £3.6m (2007: £4.7m) has been charged to the income statement of the company.
Amounts owed by group undertakings are unsecured, repayable on demand and accrue interest at rates linked to LIBOR.
The maximum exposure to credit risk of trade and other receivables is the carrying value of each class of receivable set out above (2007: carrying value set out above). There is no collateral held in respect of trade and other receivables (2007: £nil). The fair value of trade and other receivables equates to their book value (2007: fair value equalled book value).
Notes to the financial statements – continued

114
Fina
nc
ial Statem
entS
Annual Report & Financial Statements 2008 Provident Financial plc
19 Retirement benefit asset
(a) Pension schemes – defined benefitThegrouphashistoricallyoperatedtwomajordefinedbenefitschemes;theProvidentFinancialSeniorPensionScheme(‘theseniorpensionscheme’)andtheProvidentFinancialStaffPensionScheme(‘thestaffpensionscheme’).On1September2008,theseniorpensionschemewasmergedintothestaffpensionscheme,andthegroupnowoperatesonemajordefinedbenefitscheme;thestaffpension scheme. The scheme covers 67% of employees with company-provided pension arrangements and is of the funded, defined benefit type providing retirement benefits based on final salary. Following a full group review of pension scheme arrangements, from 1 April 2006 members were provided with a choice of paying higher member contributions to continue accruing benefits based on final salary or paying a lower member contribution and accruing benefits based on a percentage of salary which would be revalued each year.
The most recent actuarial valuation of scheme assets and the present value of the defined benefit obligation was carried out as at 1 June2006byaqualifiedindependentactuary.ThevaluationusedforthepurposesofIAS19‘Employeebenefits’hasbeenbased on the results of this valuation which has been updated by the actuary to take account of the requirements of IAS 19 in order to assess the liabilities of the scheme as at the balance sheet date. Scheme assets are stated at fair value as at the balance sheet date.
The net retirement benefit asset recognised in the balance sheet of the group is as follows: Group 2008 2007 £m % £m %
Equities 177.7 43 249.5 54Corporate bonds 121.2 30 22.6 5Fixed interest gilts 38.2 9 34.8 7Index-linked gilts 51.0 12 53.8 12Cash and money market funds 22.6 6 105.0 22Total fair value of scheme assets 410.7 100 465.7 100Present value of funded defined benefit obligations (359.8) (404.2) Net retirement benefit asset recognised in the balance sheet 50.9 61.5
The net retirement benefit asset recognised in the balance sheet of the company is as follows: Company 2008 2007 £m % £m %
Equities 43.2 43 65.4 56Corporate bonds 29.5 30 6.1 5Fixed interest gilts 9.3 9 9.5 8Index-linked gilts 12.4 12 14.4 12Cash and money market funds 5.5 6 22.0 19Total fair value of scheme assets 99.9 100 117.4 100Present value of funded defined benefit obligations (83.8) (97.9) Net retirement benefit asset recognised in the balance sheet 16.1 19.5
The assets and liabilities of the group’s defined benefit pension scheme have been allocated between subsidiary companies on a pro-rata basis based upon the actual employer cash contributions made by each subsidiary company.
Notes to the financial statements – continued

115Fin
an
cia
l Statemen
tS
Annual Report & Financial Statements 2008 Provident Financial plc
19 Retirement benefit asset – continuedThe amounts recognised in the income statement were as follows: Group Company 2008 2007 2008 2007 £m £m £m £m
Current service cost (5.7) (6.7) (1.8) (1.0)Interest cost (22.9) (22.6) (7.3) (4.2)Expected return on scheme assets 29.8 28.8 9.5 5.4Net credit/(charge) before settlement and curtailment credits 1.2 (0.5) 0.4 0.2Settlement credit – – – 13.3Curtailment credit – 2.9 – –Net credit recognised in the income statement 1.2 2.4 0.4 13.5
The net credit recognised in the income statement of the group in 2008 of £1.2m has been included within administrative expenses and relates wholly to continuing operations. The net charge before curtailment credit of £0.5m in 2007 was included within administrative expenses and comprised £0.4m in respect of continuing operations and £0.1m in respect of discontinued operations.
Following the disposal of the insurance business on 15 June 2007, the relevant employees of that business ceased to be active members of the group’s pension schemes. Accordingly, their benefits were no longer linked to future salary increases and, therefore, the defined benefit obligation relating to them was less than that anticipated prior to the disposal. The reduction in the defined benefit obligation of £2.9m was recognised as a curtailment credit in the consolidated income statement in the year ended 31 December 2007. This amount was included within the profit on disposal of the insurance business (see note 6).
The settlement credit of £13.3m in the company in 2007 related to the reallocation of the group’s retirement benefit asset on disposal of the insurance business. As noted on page 114, the assets and liabilities of the group’s pension schemes are allocated between subsidiary companies on a pro-rata basis based upon the actual employer cash contributions made by each subsidiary company. Following the disposal of the insurance business, the company retained the pension liabilities relating to those employees. Accordingly, the assets and liabilities previously allocated to the insurance business were transferred to the company. The settlement credit reflects the net retirement benefit asset transferred.
Movements in the fair value of scheme assets were as follows: Group Company 2008 2007 2008 2007 £m £m £m £m
Fair value of scheme assets at 1 January 465.7 467.9 117.4 60.0Expected return on scheme assets 29.8 28.8 9.5 5.4 Actuarial (losses)/gains on scheme assets (78.9) 0.1 (24.5) (3.9) Reallocation of pension assets on disposal of insurance business – – – 57.2Section 75 contribution on disposal of insurance business – 3.4 – –Assets relating to international business on demerger – (31.3) – – Contributions by the group/company 5.3 4.0 1.1 0.4 Contributions paid by scheme participants 2.5 3.0 0.8 0.3 Net benefits paid out (13.7) (10.2) (4.4) (2.0)Fair value of scheme assets at 31 December 410.7 465.7 99.9 117.4
The Section 75 contribution on disposal of the insurance business of £3.4m in 2007 was the statutory pension debt arising as a result of the insurance business ceasing to participate in the group’s pension schemes following sale. It was calculated in accordance with Section 75 of the Pensions Act 1995.
The net retirement benefit asset relating to the demerged international business of £3.5m was removed from the group’s balance sheet as part of the dividend in specie in 2007. The net retirement benefit asset comprised £31.3m of scheme assets and £27.8m of defined benefit obligation.
The expected contributions to the defined benefit pension scheme in the year ending 31 December 2009 are £7.9m.
Notes to the financial statements – continued

116
Fina
nc
ial Statem
entS
Annual Report & Financial Statements 2008 Provident Financial plc
19 Retirement benefit asset – continuedMovements in the present value of the defined benefit obligation were as follows: Group Company 2008 2007 2008 2007 £m £m £m £m
Defined benefit obligation at 1 January (404.2) (459.0) (97.9) (59.5)Current service cost (5.7) (6.7) (1.8) (1.0)Interest cost (22.9) (22.6) (7.3) (4.2) Curtailment credit – 2.9 – –Reallocation of pension liabilities on disposal of insurance business – – – (43.9)Liabilities relating to international business on demerger – 27.8 – – Contributions paid by scheme participants (2.5) (3.0) (0.8) (0.3)Actuarial gains on scheme liabilities 61.8 46.2 19.6 9.0Net benefits paid out 13.7 10.2 4.4 2.0 Defined benefit obligation at 31 December (359.8) (404.2) (83.8) (97.9)
The principal actuarial assumptions used at the balance sheet date were as follows: Group and company 2008 2007 % %
Price inflation 2.90 3.40 Rate of increase in pensionable salaries 4.20 4.97 Rate of increase to pensions in payment 2.90 3.40 Discount rate 6.30 5.70 Long-term rate of return – equities 8.15 7.85 – bonds 6.00 4.70 – fixed interest gilts 3.80 4.50 – index-linked gilts 3.80 4.25 – cash and money market funds 3.80 5.90 – overall (weighted average) 6.33 6.59
The expected return on plan assets is determined by considering the expected returns available on the assets underlying the current investment policy. Expected yields on fixed interest investments are based on gross redemption yields as at the balance sheet date. Expected returns on equity investments reflect long-term real rates of return historically experienced.
IAS 19 requires that the discount rate should be determined by reference to market yields at the balance sheet date on high quality corporate bonds and that the term of the instruments chosen should be consistent with the estimated term of the defined benefit obligations. In the UK, this is usually interpreted to mean the yield on AA-rated corporate bonds of an appropriate term. A movement of 0.1% in the discount rate would increase or decrease the retirement benefit asset by approximately £8m (2007: £10m).
The mortality assumptions used in the valuation of the defined benefit pension scheme are based on the mortality experience of insured pension schemes and allow for future improvements in life expectancy. The group continues to use the PA92 series of standard tablescombinedwiththemediumcohortimprovementfactorsforprojectingmortality.However,forthepurposesofthemortalityassessment as at 31 December 2008, all life expectancy assumptions have been increased by one year in recognition of general practice in updating life expectancy recently. In more simple terms, it is now assumed that members who retire in the future at age 65 will live on average for a further 22 years if they are male (2007: 21 years) and for a further 25 years if they are female (2007: 24 years). If assumed life expectancies had been one year greater for the scheme, the retirement benefit asset would have reduced by approximately £10m (2007: £11m).
Notes to the financial statements – continued

117Fin
an
cia
l Statemen
tS
Annual Report & Financial Statements 2008 Provident Financial plc
19 Retirement benefit asset – continuedThe actual return on scheme assets compared to the expected return is as follows: Group Company 2008 2007 2008 2007 £m £m £m £m
Expected return on scheme assets 29.8 28.8 9.5 5.4Actuarial (losses)/gains on scheme assets (78.9) 0.1 (24.5) (3.9)Actual return on scheme assets (49.1) 28.9 (15.0) 1.5
Actuarial gains and losses are recognised through the statement of recognised income and expense (SORIE) in the period in which they occur.
An analysis of the amounts recognised in the SORIE is as follows: Group Company 2008 2007 2008 2007 £m £m £m £m
Actuarial (losses)/gains on scheme assets (78.9) 0.1 (24.5) (3.9) Actuarial gains on scheme liabilities 61.8 46.2 19.6 9.0Total (loss)/gain recognised in the SORIE in the year (17.1) 46.3 (4.9) 5.1
Cumulative amount of losses recognised in the SORIE (25.5) (8.4) (9.0) (4.1)
The history of the net retirement benefit asset/(liability) recognised in the balance sheet and experience adjustments for the group is as follows: Group 2008 2007 2006 2005 2004 £m £m £m £m £m
Fair value of scheme assets 410.7 465.7 467.9 331.1 231.4Present value of funded defined benefit obligation (359.8) (404.2) (459.0) (436.7) (361.2)Net retirement benefit asset/(liability) recognised in the balance sheet 50.9 61.5 8.9 (105.6) (129.8)Experience (losses)/gains on scheme assets– amount (£m) (78.9) 0.1 7.1 30.3 7.1– percentage of scheme assets (%) (19.2) – 1.5 9.2 3.1Experience losses on scheme liabilities – amount (£m) – (0.5) (12.8) – (14.0)– percentage of scheme liabilities (%) – (0.1) (2.8) – (3.9)
The history of the net retirement benefit asset/(liability) recognised in the balance sheet and experience adjustments for the company is as follows: Company 2008 2007 2006 2005 2004 £m £m £m £m £m
Fair value of scheme assets 99.9 117.4 60.0 41.9 29.5Present value of funded defined benefit obligation (83.8) (97.9) (59.5) (56.6) (48.5)Net retirement benefit asset/(liability) recognised in the balance sheet 16.1 19.5 0.5 (14.7) (19.0)Experience (losses)/gains on scheme assets– amount (£m) (24.5) (3.9) 0.9 4.1 1.1– percentage of scheme assets (%) (24.5) (3.3) 1.5 9.8 3.7Experience losses on scheme liabilities – amount (£m) – (0.1) (1.9) – (2.2)– percentage of scheme liabilities (%) – (0.1) (3.2) – (4.5)
(b) Pension schemes – defined contributionFor new employees joining the group after 1 January 2003, a stakeholder pension plan was introduced into which group companies contribute 8% of pensionable earnings of the member provided that the member contributes a minimum of 6% of pensionable earnings. The assets of the scheme are held separately from those of the group and company. The pension charge in the consolidated income statement represents contributions payable by the group in respect of the plan and amounted to £1.5m for the year ended 31 December 2008 (2007: £1.2m). Contributions made by the company amounted to £0.1m (2007: £0.1m). No contributions were payable to the fund at the year end (2007: £nil).
The group contributed £0.1m to personal pension plans in the year (2007: £0.1m).
Notes to the financial statements – continued
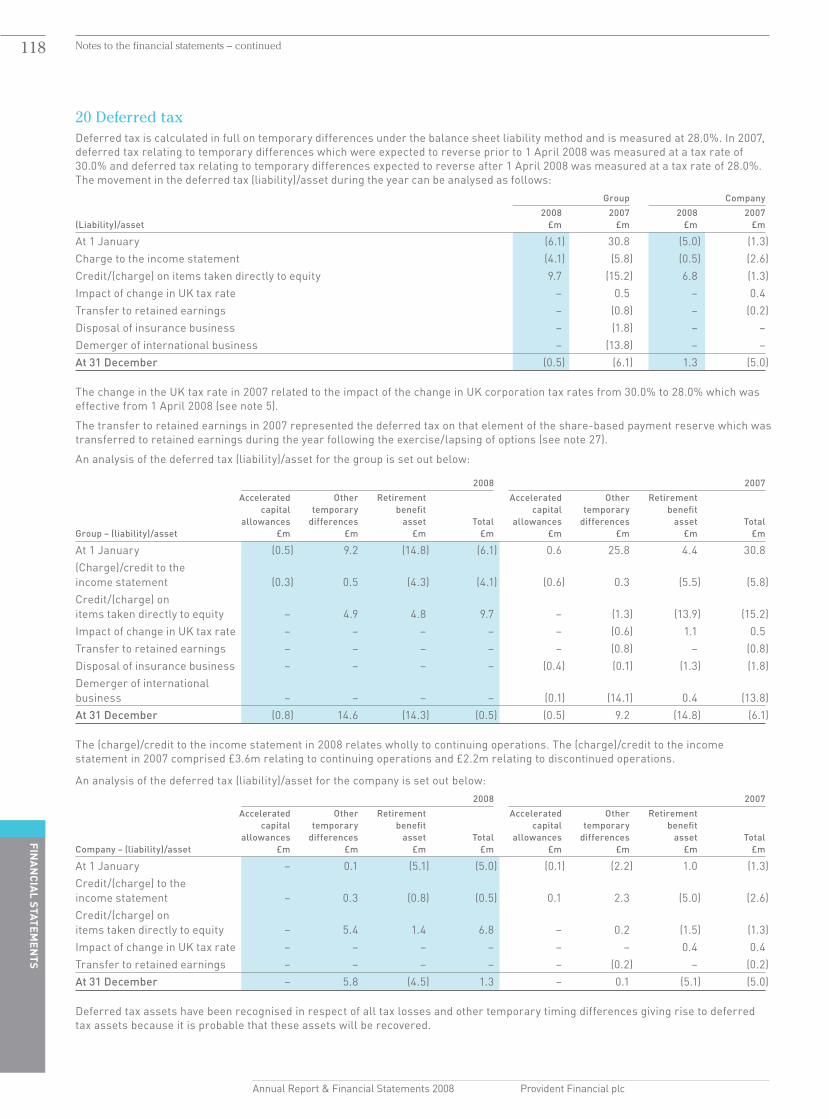
118
Fina
nc
ial Statem
entS
Annual Report & Financial Statements 2008 Provident Financial plc
20 Deferred tax Deferred tax is calculated in full on temporary differences under the balance sheet liability method and is measured at 28.0%. In 2007, deferred tax relating to temporary differences which were expected to reverse prior to 1 April 2008 was measured at a tax rate of 30.0% and deferred tax relating to temporary differences expected to reverse after 1 April 2008 was measured at a tax rate of 28.0%. The movement in the deferred tax (liability)/asset during the year can be analysed as follows: Group Company 2008 2007 2008 2007 (Liability)/asset £m £m £m £m
At 1 January (6.1) 30.8 (5.0) (1.3)Charge to the income statement (4.1) (5.8) (0.5) (2.6)Credit/(charge) on items taken directly to equity 9.7 (15.2) 6.8 (1.3)Impact of change in UK tax rate – 0.5 – 0.4Transfer to retained earnings – (0.8) – (0.2)Disposal of insurance business – (1.8) – –Demerger of international business – (13.8) – –At 31 December (0.5) (6.1) 1.3 (5.0)
The change in the UK tax rate in 2007 related to the impact of the change in UK corporation tax rates from 30.0% to 28.0% which was effective from 1 April 2008 (see note 5).
The transfer to retained earnings in 2007 represented the deferred tax on that element of the share-based payment reserve which was transferred to retained earnings during the year following the exercise/lapsing of options (see note 27).
An analysis of the deferred tax (liability)/asset for the group is set out below:
2008 2007 Accelerated Other Retirement Accelerated Other Retirement capital temporary benefit capital temporary benefit allowances differences asset Total allowances differences asset TotalGroup – (liability)/asset £m £m £m £m £m £m £m £m
At 1 January (0.5) 9.2 (14.8) (6.1) 0.6 25.8 4.4 30.8(Charge)/credit to the income statement (0.3) 0.5 (4.3) (4.1) (0.6) 0.3 (5.5) (5.8)Credit/(charge) on items taken directly to equity – 4.9 4.8 9.7 – (1.3) (13.9) (15.2)Impact of change in UK tax rate – – – – – (0.6) 1.1 0.5Transfer to retained earnings – – – – – (0.8) – (0.8)Disposal of insurance business – – – – (0.4) (0.1) (1.3) (1.8)Demerger of international business – – – – (0.1) (14.1) 0.4 (13.8)At 31 December (0.8) 14.6 (14.3) (0.5) (0.5) 9.2 (14.8) (6.1)
The (charge)/credit to the income statement in 2008 relates wholly to continuing operations. The (charge)/credit to the income statement in 2007 comprised £3.6m relating to continuing operations and £2.2m relating to discontinued operations.
An analysis of the deferred tax (liability)/asset for the company is set out below: 2008 2007 Accelerated Other Retirement Accelerated Other Retirement capital temporary benefit capital temporary benefit allowances differences asset Total allowances differences asset TotalCompany – (liability)/asset £m £m £m £m £m £m £m £m
At 1 January – 0.1 (5.1) (5.0) (0.1) (2.2) 1.0 (1.3)Credit/(charge) to the income statement – 0.3 (0.8) (0.5) 0.1 2.3 (5.0) (2.6)Credit/(charge) on items taken directly to equity – 5.4 1.4 6.8 – 0.2 (1.5) (1.3)Impact of change in UK tax rate – – – – – – 0.4 0.4Transfer to retained earnings – – – – – (0.2) – (0.2)At 31 December – 5.8 (4.5) 1.3 – 0.1 (5.1) (5.0)
Deferred tax assets have been recognised in respect of all tax losses and other temporary timing differences giving rise to deferred tax assets because it is probable that these assets will be recovered.
Notes to the financial statements – continued
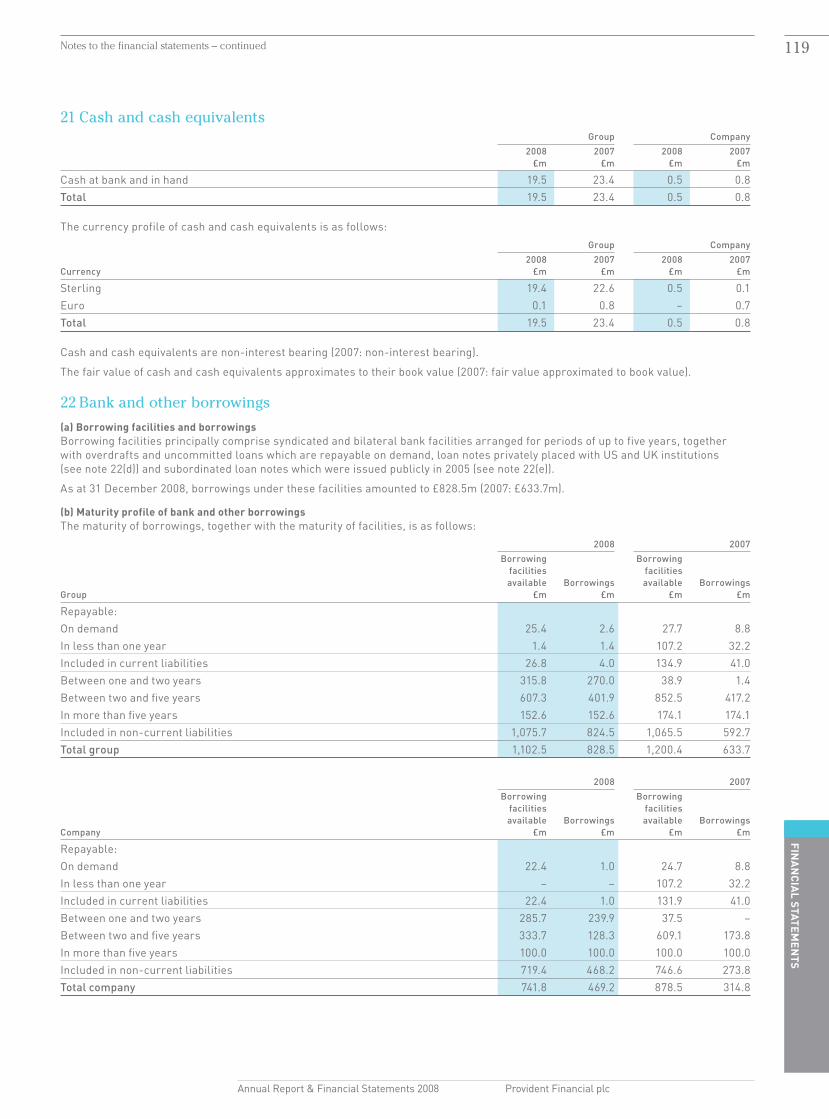
119Fin
an
cia
l Statemen
tS
Annual Report & Financial Statements 2008 Provident Financial plc
21 Cash and cash equivalents Group Company 2008 2007 2008 2007 £m £m £m £m
Cash at bank and in hand 19.5 23.4 0.5 0.8Total 19.5 23.4 0.5 0.8
The currency profile of cash and cash equivalents is as follows: Group Company 2008 2007 2008 2007 Currency £m £m £m £m
Sterling 19.4 22.6 0.5 0.1Euro 0.1 0.8 – 0.7Total 19.5 23.4 0.5 0.8
Cash and cash equivalents are non-interest bearing (2007: non-interest bearing).
The fair value of cash and cash equivalents approximates to their book value (2007: fair value approximated to book value).
22 Bank and other borrowings
(a) Borrowing facilities and borrowingsBorrowing facilities principally comprise syndicated and bilateral bank facilities arranged for periods of up to five years, together with overdrafts and uncommitted loans which are repayable on demand, loan notes privately placed with US and UK institutions (see note 22(d)) and subordinated loan notes which were issued publicly in 2005 (see note 22(e)).
As at 31 December 2008, borrowings under these facilities amounted to £828.5m (2007: £633.7m).
(b) maturity profile of bank and other borrowingsThe maturity of borrowings, together with the maturity of facilities, is as follows: 2008 2007 Borrowing Borrowing facilities facilities available Borrowings available Borrowings Group £m £m £m £m
Repayable:On demand 25.4 2.6 27.7 8.8In less than one year 1.4 1.4 107.2 32.2Included in current liabilities 26.8 4.0 134.9 41.0Between one and two years 315.8 270.0 38.9 1.4Between two and five years 607.3 401.9 852.5 417.2In more than five years 152.6 152.6 174.1 174.1Included in non-current liabilities 1,075.7 824.5 1,065.5 592.7Total group 1,102.5 828.5 1,200.4 633.7
2008 2007 Borrowing Borrowing facilities facilities available Borrowings available Borrowings Company £m £m £m £m
Repayable:On demand 22.4 1.0 24.7 8.8In less than one year – – 107.2 32.2Included in current liabilities 22.4 1.0 131.9 41.0Between one and two years 285.7 239.9 37.5 –Between two and five years 333.7 128.3 609.1 173.8In more than five years 100.0 100.0 100.0 100.0Included in non-current liabilities 719.4 468.2 746.6 273.8Total company 741.8 469.2 878.5 314.8
Notes to the financial statements – continued

120
Fina
nc
ial Statem
entS
Annual Report & Financial Statements 2008 Provident Financial plc
22 Bank and other borrowings – continued
The weighted average period to maturity of the group’s committed facilities was 3.0 years (2007: 3.6 years) and for the company’s committed facilities was 2.8 years (2007: 3.3 years). On 13 February 2009, the group secured a 12-month extension to its three-year syndicated bank facility. Of the £270.7m due to expire on 9 March 2010, £213.2m has been extended to 9 March 2011. Including this extension, the weighted average period to maturity of the group’s committed facilities was 3.2 years and the weighted average period to maturity of the company’s committed facilities was 3.1 years.
(c) interest rate and currency profile of bank and other borrowingsBefore taking account of the various interest rate swaps and cross-currency swap arrangements entered into by the group and company, the interest rate and foreign exchange rate exposure on borrowings is as follows: 2008 2007 Fixed Floating Total Fixed Floating Total Group £m £m £m £m £m £m
Sterling 144.0 463.0 607.0 144.0 301.5 445.5US dollar 170.7 – 170.7 153.7 – 153.7Euro – 50.8 50.8 – 34.5 34.5Total group 314.7 513.8 828.5 297.7 336.0 633.7
2008 2007 Fixed Floating Total Fixed Floating Total Company £m £m £m £m £m £m
Sterling 142.0 259.6 401.6 142.0 94.0 236.0US dollar 16.8 – 16.8 44.3 – 44.3Euro – 50.8 50.8 – 34.5 34.5Total company 158.8 310.4 469.2 186.3 128.5 314.8
As detailed in note 17, the group and company have entered into various interest rate swaps and cross-currency swap arrangements to hedge the above interest rate and foreign exchange rate exposures on borrowings. After taking account of the aforementioned interest rate swaps, the group’s fixed rate borrowings are £704.1m (2007: £397.8m) and the company’s fixed rate borrowings are £421.8m (2007: £286.5m). After taking account of cross-currency swaps, the group and company have no foreign exchange rate exposure to borrowings denominated in US dollars (2007: £nil).
(d) Private placement loan notesOn 10 May 2001, the company issued private placement loan notes as follows:
(i) £42mof7.21%loannotesrepayableon10May2011; (ii) US$64mof7.40%loannotesrepayableon10May2008*;and (iii) US$24m of 7.60% loan notes repayable on 10 May 2011.* Matured and repaid as scheduled on 10 May 2008.
On 24 April 2003, the group issued loan notes as follows:
(i) US$44mof5.81%loannotesrepayableon24April2010;and (ii) US$76m of 6.34% loan notes repayable on 24 April 2013.
On 12 August 2004, the group issued loan notes as follows:
(i) US$30mof6.02%loannotesrepayableon12August2011; (ii) US$67mof6.45%loannotesrepayableon12August2014;and (iii) £2m of 7.01% loan notes repayable on 12 August 2014.
As set out in note 22(c), cross-currency swaps have been put in place to swap the proceeds and liabilities for principal and interest under the US dollar denominated loan notes into sterling.
(e) Subordinated loan notesOn 15 June 2005, the company issued £100.0m of subordinated loan notes. The rights to repayment of holders of the loan notes are subordinated to all other borrowings and liabilities of the company upon a winding up of the company and, in certain circumstances, upon its administration. The debt accrues interest at 7.125% and is repayable on 15 June 2015. The company has an option to redeem the loan notes at par on 15 June 2010.
(f) loan notes issued to vendors on acquisition of Yes car creditAs part of the consideration for the acquisition of Yes Car Credit, the group issued loan notes of £6.7m to certain vendors which carry interest rates linked to LIBOR. £1.4m of these loan notes remain outstanding as at 31 December 2008 (2007: £1.4m). The loan notes are due for repayment on 30 June 2009.
Notes to the financial statements – continued

121Fin
an
cia
l Statemen
tS
Annual Report & Financial Statements 2008 Provident Financial plc
22 Bank and other borrowings – continued
(g) Undrawn borrowing facilitiesThe undrawn borrowing facilities at 31 December were as follows: Group
2008 2007 £m £m
Expiring within one year – 75.0 Expiring within one to two years 45.8 37.5 Expiring in more than two years 205.4 435.3 Total group 251.2 547.8
Company
2008 2007 £m £m
Expiring within one year – 75.0Expiring within one to two years 45.8 37.5 Expiring in more than two years 205.4 435.3 Total company 251.2 547.8
The facilities disclosed as expiring within one year and within one to two years in the year ended 31 December 2007 were terminated at the company’s option on 17 January 2008.
(h) Weighted average interest rates and periods to maturityBefore taking account of the various interest rate swaps and cross-currency swap arrangements entered into by the group and company, the weighted average interest rate and the weighted average period to maturity of the group and company’s fixed rate borrowings is as follows: 2008 2007 Weighted Weighted Weighted Weighted average average average average interest period to interest period to rate maturity rate maturity Group % years % years
Sterling 7.15 5.25 7.15 6.26 US dollar 6.37 3.64 6.58 3.81
2008 2007 Weighted Weighted Weighted Weighted average average average average interest period to interest period to rate maturity rate maturity Company % years % years
Sterling 7.15 5.24 7.15 6.25US dollar 7.60 2.36 7.45 1.18
After taking account of interest rate swaps and cross-currency swaps, the sterling weighted average fixed interest rate for the group is 5.57% (2007: 7.02%) and for the company is 5.78% (2007: 7.19%). The sterling weighted average period to maturity on the same basis is 2.0 years (2007: 5.4 years) for the group and 2.7 years (2007: 6.0 years) for the company. There is no foreign exchange or interest rate risk denominated in US dollars after taking account of cross-currency swaps (2007: £nil).
(i) Fair valuesThe fair values of the group and company’s bank and other borrowings are compared to their book values as follows: 2008 2007 Book value Fair value Book value Fair value Group £m £m £m £m
Bank loans and overdrafts 513.8 513.8 336.0 336.0Sterling private placement loan notes 44.0 49.0 44.0 45.6US dollar private placement loan notes 170.7 174.4 153.7 162.1 Subordinated loan notes 100.0 110.0 100.0 102.5 Total group 828.5 847.2 633.7 646.2
Notes to the financial statements – continued
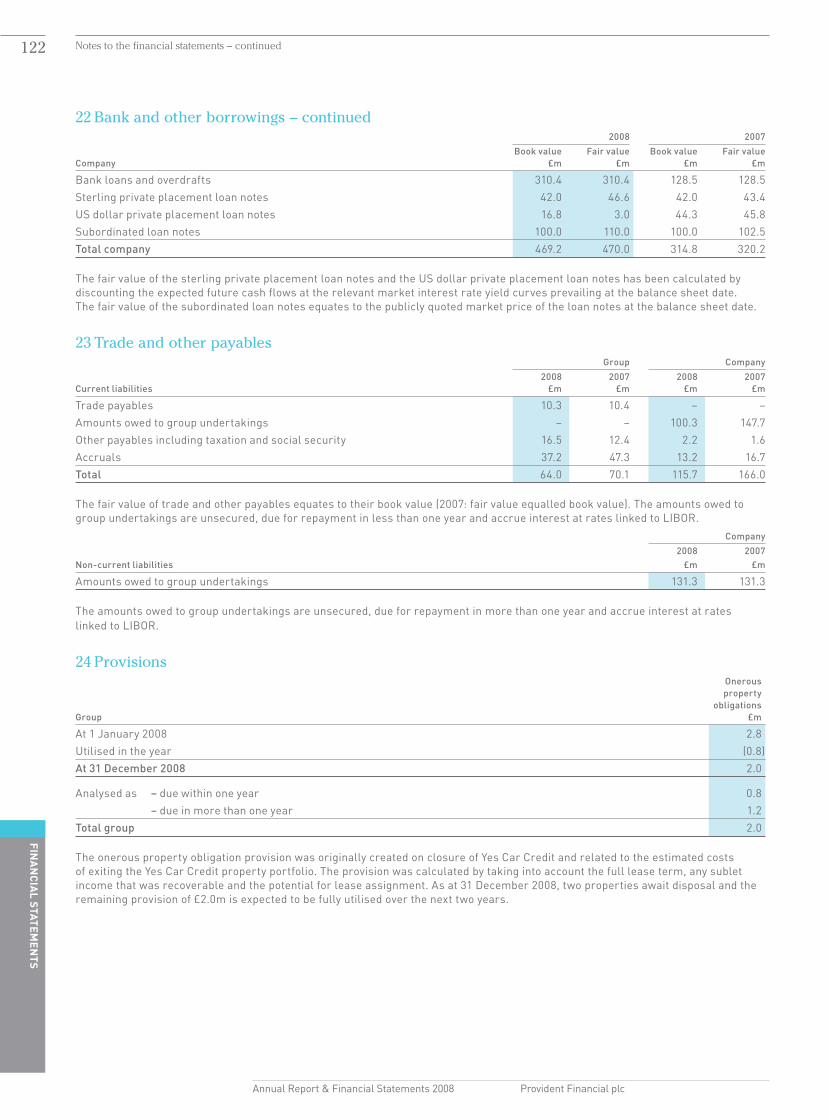
122
Fina
nc
ial Statem
entS
Annual Report & Financial Statements 2008 Provident Financial plc
22 Bank and other borrowings – continued 2008 2007 Book value Fair value Book value Fair value Company £m £m £m £m
Bank loans and overdrafts 310.4 310.4 128.5 128.5Sterling private placement loan notes 42.0 46.6 42.0 43.4US dollar private placement loan notes 16.8 3.0 44.3 45.8Subordinated loan notes 100.0 110.0 100.0 102.5Total company 469.2 470.0 314.8 320.2
The fair value of the sterling private placement loan notes and the US dollar private placement loan notes has been calculated by discounting the expected future cash flows at the relevant market interest rate yield curves prevailing at the balance sheet date. The fair value of the subordinated loan notes equates to the publicly quoted market price of the loan notes at the balance sheet date.
23 Trade and other payables Group Company 2008 2007 2008 2007 Current liabilities £m £m £m £m
Trade payables 10.3 10.4 – –Amounts owed to group undertakings – – 100.3 147.7Other payables including taxation and social security 16.5 12.4 2.2 1.6Accruals 37.2 47.3 13.2 16.7Total 64.0 70.1 115.7 166.0
The fair value of trade and other payables equates to their book value (2007: fair value equalled book value). The amounts owed to group undertakings are unsecured, due for repayment in less than one year and accrue interest at rates linked to LIBOR. Company 2008 2007 Non-current liabilities £m £m
Amounts owed to group undertakings 131.3 131.3
The amounts owed to group undertakings are unsecured, due for repayment in more than one year and accrue interest at rates linked to LIBOR.
24 Provisions Onerous property obligations Group £m
At 1 January 2008 2.8Utilised in the year (0.8)At 31 December 2008 2.0
Analysed as – due within one year 0.8 – due in more than one year 1.2Total group 2.0
The onerous property obligation provision was originally created on closure of Yes Car Credit and related to the estimated costs of exiting the Yes Car Credit property portfolio. The provision was calculated by taking into account the full lease term, any sublet income that was recoverable and the potential for lease assignment. As at 31 December 2008, two properties await disposal and the remaining provision of £2.0m is expected to be fully utilised over the next two years.
Notes to the financial statements – continued

123Fin
an
cia
l Statemen
tS
Annual Report & Financial Statements 2008 Provident Financial plc
25 Called-up share capital Group and company 2008 2007 Issued and Issued and Authorised fully paid Authorised fully paid £m £m £m £m
Ordinary shares of 208⁄11p each 40.0 27.3 40.0 27.2
Following demerger of the international business on 16 July 2007, the company’s share capital was consolidated on the basis of one share for every two shares held.
The movement in the number of shares in issue during the year was as follows: Group and company 2008 2007 Number Number m m
At 1 January 131.2 256.1Shares issued pursuant to the exercise of options – prior to share consolidation – 1.1Share consolidation – one for every two shares – (128.6)Shares issued pursuant to the exercise of options – following share consolidation 0.4 2.6At 31 December 131.6 131.2
The number, nominal value and aggregate consideration of shares issued during the year can be analysed as follows:
Group and company 2008 2007 Nominal Aggregate Nominal Aggregate value consideration value consideration Number £ £m Number £ £m
Shares issued prior to share consolidation – – – 1,142,827 118,438 7.0Shares issued following share consolidation 392,502 81,355 2.0 2,572,288 533,165 15.6Total shares issued 392,502 81,355 2.0 3,715,115 651,603 22.6
Provident Financial plc sponsors the Provident Financial plc 2007 Employee Benefit Trust (EBT) which is a discretionary trust established for the benefit of the employees of the group. The company has appointed Kleinwort Benson (Jersey) Trustees Limited to act as trustee of the EBT. The trustee has waived the right to receive dividends on the shares it holds. As at 31 December 2008, the EBT held 1,507,849 (2007: 723,141) shares in the company with a nominal value of £312,536 (2007: £149,887), a cost of £13.0m (2007: £6.5m) and a market value of £13.0m (2007: £6.0m). The shares have been acquired by the EBT to meet obligations under the Provident Financial Long Term Incentive Scheme 2006.
In addition to the EBT, Provident Financial plc also sponsors the Provident Financial Qualifying Employee Share Ownership Trust (the QUEST) which is also a discretionary trust established for the benefit of the employees of the group. The company established Provident Financial Trustees Limited to act as trustee of the QUEST. The trustee has waived the right to receive dividends on the shares it holds. As at 31 December 2008 and 31 December 2007, the QUEST did not hold any ordinary shares in the company.
Provident Financial plc also sponsors the Performance Share Plan Trust which was established to operate in conjunction with the Performance Share Plan (PSP). As at 31 December 2008, awards under the PSP were 285,195 (2007: 20,649) ordinary shares with a nominal value of £59,113 (2007: £4,280), a cost of £2.3m (2007: £0.1m) and a market value of £2.5m (2007: £0.2m).
All costs relating to the EBT, the QUEST and the PSP are dealt with in the income statement as they accrue. The net of the consideration paid to acquire shares by the EBT, the QUEST and in respect of the PSP and the consideration received on exercise of share options is held in a separate treasury shares reserve.
Notes to the financial statements – continued
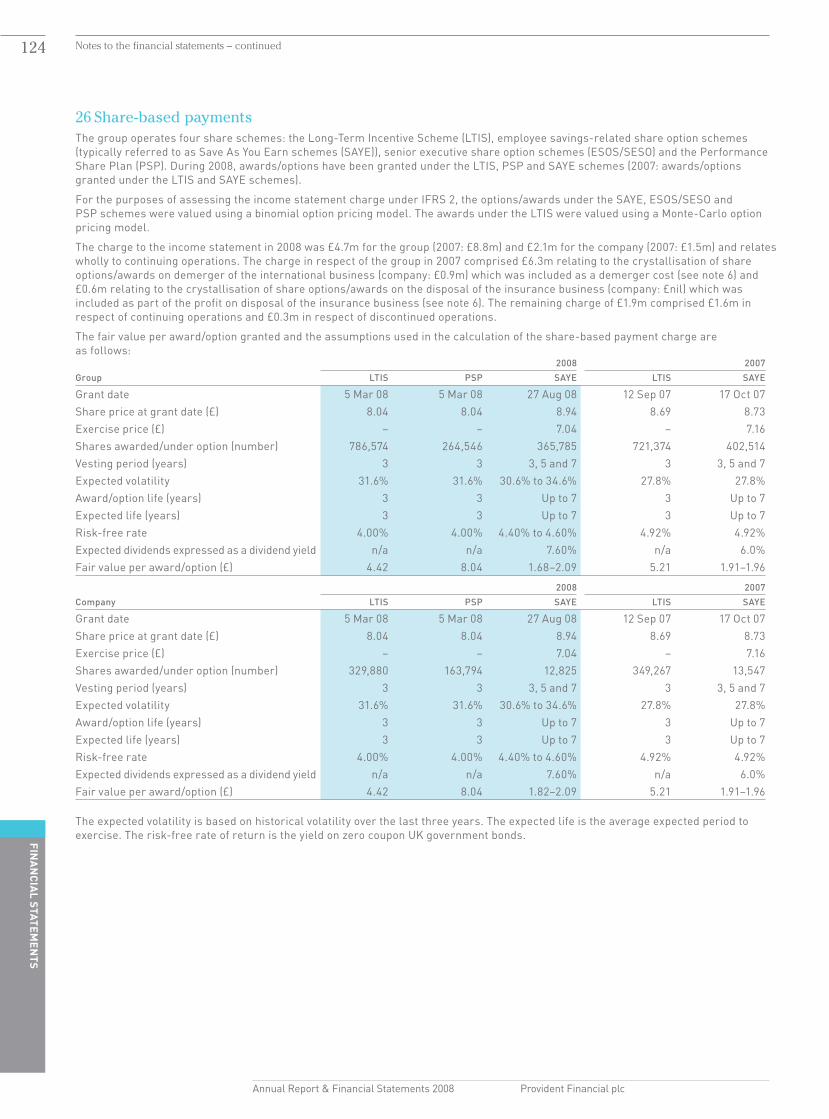
124
Fina
nc
ial Statem
entS
Annual Report & Financial Statements 2008 Provident Financial plc
26 Share-based paymentsThe group operates four share schemes: the Long-Term Incentive Scheme (LTIS), employee savings-related share option schemes (typically referred to as Save As You Earn schemes (SAYE)), senior executive share option schemes (ESOS/SESO) and the Performance Share Plan (PSP). During 2008, awards/options have been granted under the LTIS, PSP and SAYE schemes (2007: awards/options granted under the LTIS and SAYE schemes).
For the purposes of assessing the income statement charge under IFRS 2, the options/awards under the SAYE, ESOS/SESO and PSP schemes were valued using a binomial option pricing model. The awards under the LTIS were valued using a Monte-Carlo option pricing model.
The charge to the income statement in 2008 was £4.7m for the group (2007: £8.8m) and £2.1m for the company (2007: £1.5m) and relates wholly to continuing operations. The charge in respect of the group in 2007 comprised £6.3m relating to the crystallisation of share options/awards on demerger of the international business (company: £0.9m) which was included as a demerger cost (see note 6) and £0.6m relating to the crystallisation of share options/awards on the disposal of the insurance business (company: £nil) which was included as part of the profit on disposal of the insurance business (see note 6). The remaining charge of £1.9m comprised £1.6m in respect of continuing operations and £0.3m in respect of discontinued operations.
The fair value per award/option granted and the assumptions used in the calculation of the share-based payment charge are as follows: 2008 2007Group LTIS PSP SAYE LTIS SAYE
Grant date 5 Mar 08 5 Mar 08 27 Aug 08 12 Sep 07 17 Oct 07Share price at grant date (£) 8.04 8.04 8.94 8.69 8.73Exercise price (£) – – 7.04 – 7.16Shares awarded/under option (number) 786,574 264,546 365,785 721,374 402,514Vesting period (years) 3 3 3, 5 and 7 3 3, 5 and 7Expected volatility 31.6% 31.6% 30.6% to 34.6% 27.8% 27.8%Award/option life (years) 3 3 Up to 7 3 Up to 7Expected life (years) 3 3 Up to 7 3 Up to 7Risk-free rate 4.00% 4.00% 4.40% to 4.60% 4.92% 4.92%Expected dividends expressed as a dividend yield n/a n/a 7.60% n/a 6.0%Fair value per award/option (£) 4.42 8.04 1.68–2.09 5.21 1.91–1.96
2008 2007Company LTIS PSP SAYE LTIS SAYE
Grant date 5 Mar 08 5 Mar 08 27 Aug 08 12 Sep 07 17 Oct 07Share price at grant date (£) 8.04 8.04 8.94 8.69 8.73Exercise price (£) – – 7.04 – 7.16Shares awarded/under option (number) 329,880 163,794 12,825 349,267 13,547Vesting period (years) 3 3 3, 5 and 7 3 3, 5 and 7Expected volatility 31.6% 31.6% 30.6% to 34.6% 27.8% 27.8%Award/option life (years) 3 3 Up to 7 3 Up to 7Expected life (years) 3 3 Up to 7 3 Up to 7Risk-free rate 4.00% 4.00% 4.40% to 4.60% 4.92% 4.92%Expected dividends expressed as a dividend yield n/a n/a 7.60% n/a 6.0%Fair value per award/option (£) 4.42 8.04 1.82–2.09 5.21 1.91–1.96
The expected volatility is based on historical volatility over the last three years. The expected life is the average expected period to exercise. The risk-free rate of return is the yield on zero coupon UK government bonds.
Notes to the financial statements – continued

125Fin
an
cia
l Statemen
tS
Annual Report & Financial Statements 2008 Provident Financial plc
26 Share-based payments – continuedA reconciliation of award/share option movements during the year is shown below:
LTIS ESOS/SESO SAYE PSP Weighted Weighted Weighted Weighted average average average average exercise exercise exercise exercise price price price price Group Number £ Number £ Number £ Number £
Outstanding at 1 January 2008 903,893 – 1,828,346 6.45 1,513,720 5.50 20,649 –Awarded/granted 786,574 – – – 365,785 7.04 264,546 –Lapsed (38,385) – (343,532) 8.24 (105,972) 5.78 – –Exercised – – (46,838) 7.02 (334,999) 5.04 – –Outstanding at 31 December 2008 1,652,082 – 1,437,976 7.02 1,438,534 5.98 285,195 –Exercisable at 31 December 2008 – – 149,606 7.96 28,567 4.94 – –
Share awards outstanding under the LTIS scheme at 31 December 2008 had an exercise price of £nil (2007: £nil) and a weighted average remaining contractual life of 1.8 years (2007: 2.4 years). Share options outstanding under the ESOS/SESO schemes at 31 December 2008 had exercise prices ranging from 522p to 979p (2007: 450p to 1,037p) and a weighted average remaining contractual life of 0.4 years (2007: 1.1 years). Share options outstanding under the SAYE schemes at 31 December 2008 had exercise prices ranging from 453p to 716p (2007: 453p to 716p) and a weighted average remaining contractual life of 2.5 years (2007: 2.6 years). Share awards outstanding under the PSP schemes at 31 December 2008 had an exercise price of £nil (2007: £nil) and a weighted average remaining contractual life of 2.1 years (2007: 1.7 years).
LTIS ESOS/SESO SAYE PSP Weighted Weighted Weighted Weighted average average average average exercise exercise exercise exercise price price price price Group Number £ Number £ Number £ Number £
Outstanding at 1 January 2007 239,633 – 7,571,723 6.27 2,200,868 4.85 109,422 –Awarded/granted 721,374 – – – 402,514 7.16 – –Lapsed (57,114) – (1,382,935) 6.12 (365,929) 4.97 (68,124) –Cancelled* – – (1,144,433) 6.14 – – – –Share consolidation** – – – – – – (20,649) –Exercised – – (3,216,009) 6.29 (723,733) 4.81 – –Outstanding at 31 December 2007 903,893 – 1,828,346 6.45 1,513,720 5.50 20,649 –Exercisable at 31 December 2007 – – 424,006 8.77 96,839 4.90 – –
* Following the demerger of the international business on 16 July 2007, 1,144,433 shares granted under the SESO were cancelled and cash compensation was awarded to the option holder based on the group’s average closing mid-market share price in the week commencing 16 July 2007.
** Following the one-for-two share consolidation on 16 July 2007, shares awarded under the PSP scheme were consolidated on the basis of one share for every two shares originally awarded.
Notes to the financial statements – continued

126
Fina
nc
ial Statem
entS
Annual Report & Financial Statements 2008 Provident Financial plc
26 Share-based payments – continued
LTIS ESOS/SESO SAYE PSP Weighted Weighted Weighted Weighted average average average average exercise exercise exercise exercise price price price price Company Number £ Number £ Number £ Number £
Outstanding at 1 January 2008 532,516 – 595,282 7.38 64,784 5.58 8,902 –Awarded/granted 329,880 – – – 12,825 7.04 163,794 –Lapsed (1,393) – (88,752) 8.72 (9,086) 5.52 – –Exercised – – – – (17,815) 5.78 – –Outstanding at 31 December 2008 861,003 – 506,530 5.89 50,708 5.89 172,696 –Exercisable at 31 December 2008 – – 29,260 7.88 737 5.07 – –
Share awards outstanding under the LTIS scheme at 31 December 2008 had an exercise price of £nil (2007: £nil) and a weighted average remaining contractual life of 1.6 years (2007: 2.3 years). Share options outstanding under the ESOS/SESO schemes at 31 December 2008 had exercise prices ranging from 577p to 979p (2007: 450p to 1,037p) and a weighted average remaining contractual life of 0.4 years (2007: 1.2 years). Share options outstanding under the SAYE schemes at 31 December 2008 had exercise prices ranging from 453p to 716p (2007: 453p to 716p) and a weighted average remaining contractual life of 3.2 years (2007: 2.8 years). Share awards outstanding under the PSP schemes at 31 December 2008 had an exercise price of £nil (2007: £nil) and a weighted average remaining contractual life of 2.1 years (2007: 1.9 years). LTIS ESOS/SESO SAYE PSP Weighted Weighted Weighted Weighted average average average average exercise exercise exercise exercise price price price price Company Number £ Number £ Number £ Number £
Outstanding at 1 January 2007 239,633 – 2,540,357 6.26 98,859 4.79 69,570 –Awarded/granted 349,267 – – – 13,547 7.16 – –Lapsed (56,384) – (322,091) 6.55 (13,146) 4.77 (51,766) –Cancelled* – – (271,952) 6.18 – – – –Share consolidation** – – – – – – (8,902) –Exercised – – (1,351,032) 5.87 (34,476) 4.77 – –Outstanding at 31 December 2007 532,516 – 595,282 7.38 64,784 5.58 8,902 –Exercisable at 31 December 2007 – – 89,432 9.39 6,788 7.12 – –
* Following the demerger of the international business on 16 July 2007, 271,952 shares granted under the SESO were cancelled and cash compensation was awarded to the option holder based on the group’s average closing mid-market share price in the week commencing 16 July 2007.
** Following the one-for-two share consolidation on 16 July 2007, shares awarded under the PSP scheme were consolidated on the basis of one share for every two shares originally awarded.
Notes to the financial statements – continued

127Fin
an
cia
l Statemen
tS
Annual Report & Financial Statements 2008 Provident Financial plc
27 Statement of changes in shareholders’ equity Called-up Share share premium Other Retained capital account reserves earnings Total Group £m £m £m £m £m
At 1 January 2007 26.5 110.8 5.7 211.0 354.0 Cash flow hedges:– net fair value gains – – 1.7 – 1.7– recycled and reported in profit for the year – – 2.8 – 2.8Actuarial gain on retirement benefit asset – – – 46.3 46.3Tax charge on items taken directly to equity – – (1.3) (13.9) (15.2)Impact of change in UK tax rate (note 5) – – – 0.8 0.8Net income recognised directly in equity – – 3.2 33.2 36.4Profit for the year – – – 138.4 138.4Total recognised income for the year – – 3.2 171.6 174.8Issue of share capital 0.7 21.9 – – 22.6Treasury shares adjustments:– purchase of own shares – – (6.5) – (6.5)– vesting of shares – – 2.1 – 2.1– transfer of treasury shares reserve – – 2.6 (2.6) –Share-based payment adjustments:– charge to the income statement – – 8.8 – 8.8– cash settlement in respect of share-based payments – – (3.8) – (3.8)– transfer of share-based payment reserve – – (5.7) 5.7 –– deferred tax on share-based payment reserve transfer (note 20) – – – (0.8) (0.8)Dividends – – – (89.4) (89.4)Demerger of international business – dividend in specie – – – (165.9) (165.9)Transfer of foreign exchange reserve on demerger of international business – – (6.3) 6.3 –At 31 December 2007 27.2 132.7 0.1 135.9 295.9
At 1 January 2008 27.2 132.7 0.1 135.9 295.9Cash flow hedges – net fair value losses – – (17.3) – (17.3)Actuarial loss on retirement benefit asset – – – (17.1) (17.1)Tax credit on items taken directly to equity – – 4.9 4.8 9.7Net expense recognised directly in equity – – (12.4) (12.3) (24.7)Profit for the year – – – 92.1 92.1Total recognised (expense)/income for the year – – (12.4) 79.8 67.4Issue of share capital 0.1 1.9 – – 2.0Treasury shares adjustment – purchase of own shares – – (8.7) – (8.7)Share-based payment adjustment – charge to the income statement – – 4.7 – 4.7Dividends – – – (83.4) (83.4)At 31 December 2008 27.3 134.6 (16.3) 132.3 277.9
The demerger of the international business on 16 July 2007 was effected by a divestment in the form of a dividend in specie. On a group basis, the dividend in specie amounted to the net assets of the international business on demerger of £165.9m.
Goodwill arising on acquisitions prior to 1 January 1998 was eliminated against shareholders’ funds under UK GAAP and was not reinstated on transition to IFRS. Accordingly, retained earnings is shown after directly writing off cumulative goodwill of £1.6m (2007: £1.6m). In addition, cumulative goodwill of £2.3m (2007: £2.3m) has been written off against the merger reserve in previous years.
Other reserves are further analysed in note 28.
Notes to the financial statements – continued
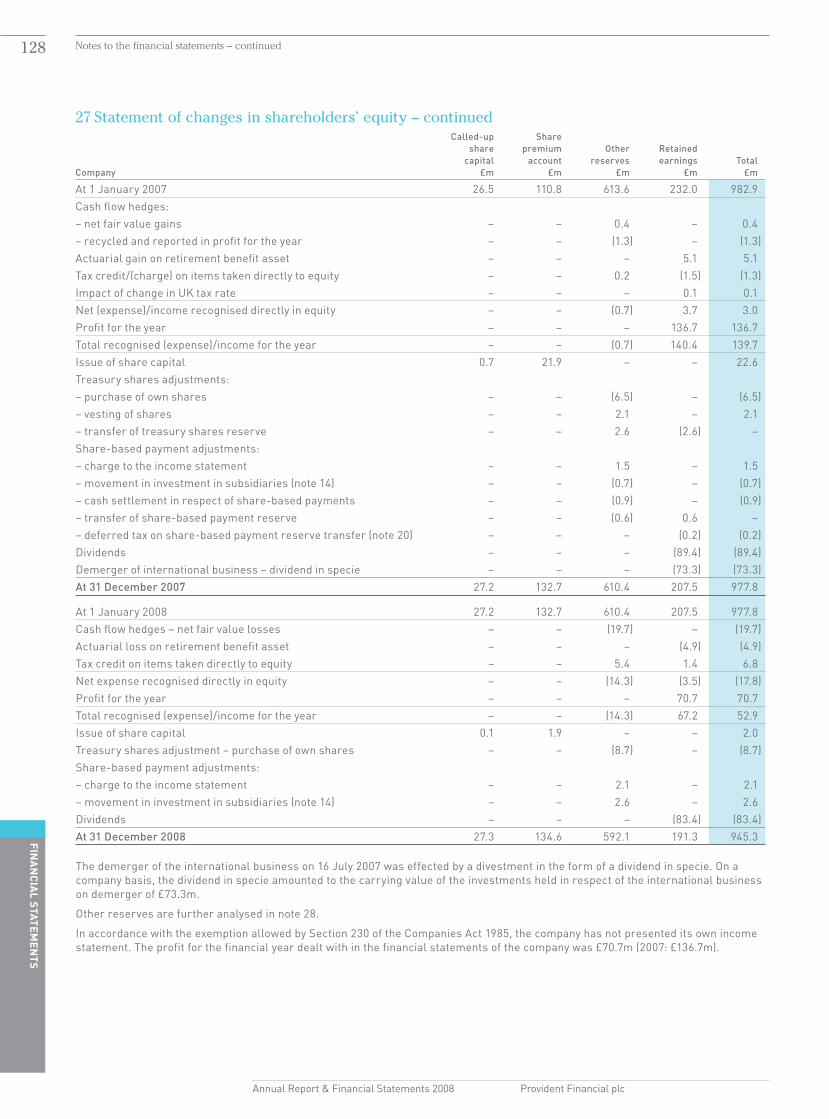
128
Fina
nc
ial Statem
entS
Annual Report & Financial Statements 2008 Provident Financial plc
27 Statement of changes in shareholders’ equity – continued Called-up Share share premium Other Retained capital account reserves earnings Total Company £m £m £m £m £m
At 1 January 2007 26.5 110.8 613.6 232.0 982.9 Cash flow hedges:– net fair value gains – – 0.4 – 0.4– recycled and reported in profit for the year – – (1.3) – (1.3)Actuarial gain on retirement benefit asset – – – 5.1 5.1Tax credit/(charge) on items taken directly to equity – – 0.2 (1.5) (1.3)Impact of change in UK tax rate – – – 0.1 0.1Net (expense)/income recognised directly in equity – – (0.7) 3.7 3.0Profit for the year – – – 136.7 136.7Total recognised (expense)/income for the year – – (0.7) 140.4 139.7Issue of share capital 0.7 21.9 – – 22.6Treasury shares adjustments:– purchase of own shares – – (6.5) – (6.5)– vesting of shares – – 2.1 – 2.1– transfer of treasury shares reserve – – 2.6 (2.6) –Share-based payment adjustments:– charge to the income statement – – 1.5 – 1.5– movement in investment in subsidiaries (note 14) – – (0.7) – (0.7)– cash settlement in respect of share-based payments – – (0.9) – (0.9)– transfer of share-based payment reserve – – (0.6) 0.6 –– deferred tax on share-based payment reserve transfer (note 20) – – – (0.2) (0.2)Dividends – – – (89.4) (89.4)Demerger of international business – dividend in specie – – – (73.3) (73.3)At 31 December 2007 27.2 132.7 610.4 207.5 977.8
At 1 January 2008 27.2 132.7 610.4 207.5 977.8Cash flow hedges – net fair value losses – – (19.7) – (19.7)Actuarial loss on retirement benefit asset – – – (4.9) (4.9)Tax credit on items taken directly to equity – – 5.4 1.4 6.8Net expense recognised directly in equity – – (14.3) (3.5) (17.8)Profit for the year – – – 70.7 70.7Total recognised (expense)/income for the year – – (14.3) 67.2 52.9Issue of share capital 0.1 1.9 – – 2.0Treasury shares adjustment – purchase of own shares – – (8.7) – (8.7)Share-based payment adjustments:– charge to the income statement – – 2.1 – 2.1– movement in investment in subsidiaries (note 14) – – 2.6 – 2.6Dividends – – – (83.4) (83.4)At 31 December 2008 27.3 134.6 592.1 191.3 945.3
The demerger of the international business on 16 July 2007 was effected by a divestment in the form of a dividend in specie. On a company basis, the dividend in specie amounted to the carrying value of the investments held in respect of the international business on demerger of £73.3m.
Other reserves are further analysed in note 28.
In accordance with the exemption allowed by Section 230 of the Companies Act 1985, the company has not presented its own income statement. The profit for the financial year dealt with in the financial statements of the company was £70.7m (2007: £136.7m).
Notes to the financial statements – continued

129Fin
an
cia
l Statemen
tS
Annual Report & Financial Statements 2008 Provident Financial plc
28 Other reserves Profit Capital Treasury Foreign Share-based Total retained by redemption Hedging shares exchange payment other subsidiary reserve reserve reserve reserve reserve reserves Group £m £m £m £m £m £m £m
At 1 January 2007 0.8 3.6 (2.8) (5.5) 6.3 3.3 5.7Cash flow hedges: – net fair value gains – – 1.7 – – – 1.7– recycled and reported in profit for the year – – 2.8 – – – 2.8Tax charge on items taken directly to equity – – (1.3) – – – (1.3)Net income recognised directly in equity – – 3.2 – – – 3.2Treasury shares adjustments:– purchase of own shares – – – (6.5) – – (6.5)– vesting of shares – – – 2.1 – – 2.1– transfer of treasury shares reserve – – – 2.6 – – 2.6Share-based payment adjustments:– charge to the income statement – – – – – 8.8 8.8– cash settlement in respect of share-based
payments – – – – – (3.8) (3.8)– transfer of share-based payment reserve – – – – – (5.7) (5.7)Transfer of foreign exchange reserve on demerger of international business – – – – (6.3) – (6.3)At 31 December 2007 0.8 3.6 0.4 (7.3) – 2.6 0.1
At 1 January 2008 0.8 3.6 0.4 (7.3) – 2.6 0.1Cash flow hedges – net fair value losses – – (17.3) – – – (17.3)Tax credit on items taken directly to equity – – 4.9 – – – 4.9Net expense recognised directly in equity – – (12.4) – – – (12.4)Treasury shares adjustment – purchase of own shares – – – (8.7) – – (8.7)Share-based payment adjustment – charge to the income statement – – – – – 4.7 4.7At 31 December 2008 0.8 3.6 (12.0) (16.0) – 7.3 (16.3)
The transfer of £2.6m from the treasury shares reserve to retained earnings in 2007 represented the shortfall between the cash cost of own shares purchased less the proceeds from vesting of shares in respect of the QUEST, which no longer holds any shares in the company (see note 25).
The share-based payment charge in 2007 included:
• £0.6marisingasaresultofthecrystallisationofexecutiveshareoptionsandSAYEoptionsoftheinsurancebusinessmanagement team following the disposal of that business on 15 June 2007. This amount was included within the profit on disposal of the insurance business which formed part of discontinued operations (see note 6).
• £6.3marisingasaresultofthecrystallisationofexecutiveshareoptionsandSAYEoptionsofgroupemployeesfollowingdemerger of the international business. This amount was included within demerger costs which formed part of discontinued operations (see note 6).
The share-based payment charge arising on demerger of the international business in 2007 included a charge of £3.8m in respect of executive share options which were cancelled and settled in the form of cash compensation. As group net assets reduced by £3.8m following the outflow of cash, a corresponding debit of £3.8m was made to the share-based payment reserve.
Following the issue of shares to satisfy share-based payments during 2007, a transfer of £5.7m was made from the share-based payment reserve to retained earnings.
The foreign exchange reserve represented the cumulative exchange gains/losses on retranslating the opening net assets of the international business. Following demerger of the international business in 2007, the total of this reserve, amounting to £6.3m, was transferred to retained earnings.
Notes to the financial statements – continued

130
Fina
nc
ial Statem
entS
Annual Report & Financial Statements 2008 Provident Financial plc
28 Other reserves – continued Capital Non- Treasury Share-based Total redemption distributable Merger Hedging shares payment other reserve reserve reserve reserve reserve reserve reserves Company £m £m £m £m £m £m £m
At 1 January 2007 3.6 609.2 2.3 0.7 (5.5) 3.3 613.6 Cash flow hedges:– net fair value gains – – – 0.4 – – 0.4– recycled and reported in profit for the year – – – (1.3) – – (1.3)Tax credit on items taken directly to equity – – – 0.2 – – 0.2Net expense recognised directly in equity – – – (0.7) – – (0.7)Treasury shares adjustments:– purchase of own shares – – – – (6.5) – (6.5)– vesting of shares – – – – 2.1 – 2.1– transfer of treasury shares reserve – – – – 2.6 – 2.6Share-based payment adjustments: – charge to the income statement – – – – – 1.5 1.5– movement in investment in subsidiaries (note 14) – – – – – (0.7) (0.7)– cash settlement in respect of share-based
payments – – – – – (0.9) (0.9)– transfer of share-based payment reserve – – – – – (0.6) (0.6)At 31 December 2007 3.6 609.2 2.3 – (7.3) 2.6 610.4
At 1 January 2008 3.6 609.2 2.3 – (7.3) 2.6 610.4Cash flow hedges – net fair value losses – – – (19.7) – – (19.7)Tax credit on items taken directly to equity – – – 5.4 – – 5.4Net expense recognised directly in equity – – – (14.3) – – (14.3) Treasury shares adjustment – purchase of own shares – – – – (8.7) – (8.7) Share-based payment adjustments – charge to the income statement – – – – – 2.1 2.1Movement in investment in subsidiaries (note 14) – – – – – 2.6 2.6At 31 December 2008 3.6 609.2 2.3 (14.3) (16.0) 7.3 592.1
The transfer of £2.6m from the treasury shares reserve to retained earnings in 2007 represented the shortfall between the cash cost of own shares purchased less the proceeds from vesting of shares in respect of the QUEST, which no longer holds any shares in the company (see note 25).
The share-based payment charge in 2007 included a charge of £0.9m in respect of executive share options which were cancelled and settled in the form of cash compensation. As company net assets reduced by £0.9m following the outflow of cash, a corresponding debit of £0.9m was made to the share-based payment reserve.
Following the issue of shares to satisfy share-based payments during 2007, a transfer of £0.6m was made from the share-based payment reserve to retained earnings.
The capital redemption reserve represents profits on the redemption of preference shares arising in prior years, together with the capitalisation of the nominal value of shares purchased and cancelled, net of the utilisation of this reserve to capitalise the nominal value of shares issued to satisfy scrip dividend elections.
The non-distributable reserve was created as a result of an intra-group reorganisation to create a more efficient capital structure that more accurately reflects the group’s management structure.
Notes to the financial statements – continued

131Fin
an
cia
l Statemen
tS
Annual Report & Financial Statements 2008 Provident Financial plc
29 CommitmentsTotal commitments under operating leases are as follows: Group Company 2008 2007 2008 2007 £m £m £m £m
Due within one year 9.1 10.2 0.3 0.3Due between one and five years 17.6 14.2 0.2 0.5Due in more than five years 4.2 2.3 – –Total 30.9 26.7 0.5 0.8
Other group commitments are as follows: Group 2008 2007 £m £m
Capital expenditure commitments contracted with third parties but not provided for at 31 December 0.4 1.7
The company has £nil capital expenditure commitments contracted with third parties but not provided for at 31 December 2008 (2007: £nil). Group
2008 2007 £m £m
Unused committed credit card facilities at 31 December 82.9 76.6
The company has £nil unused committed credit card facilities at 31 December 2008 (2007: £nil).
30 Related party transactionsThe company recharges the major pension scheme referred to in note 19 with a proportion of the costs of administration and professional fees incurred by the company. The total amount recharged during the year was £1.1m (2007: £1.5m) and the amount due from the pension scheme at 31 December 2008 was £0.5m (2007: £1.5m).
Details of the transactions between the company and its subsidiary undertakings, which comprise management recharges and interest charges or credits on intra-group balances, along with any balances outstanding at 31 December are set out below: 2008 2007 Management Interest Outstanding Management Interest Outstanding recharge charge/(credit) balance recharge charge/(credit) balance Company £m £m £m £m £m £m
Consumer Credit Division 4.5 71.6 1,065.8 2.9 69.2 969.3 Vanquis Bank 1.0 8.7 160.0 0.8 5.7 112.5 Yes Car Credit – 3.0 (2.0) 0.2 6.3 32.3 International* – – – 1.0 (1.2) 2.9Insurance** – – – 0.1 (0.2) – Other central companies – (0.4) (156.6) – (0.4) (157.9)Total 5.5 82.9 1,067.2 5.0 79.4 959.1
* Up to the date of demerger on 16 July 2007.
** Up to the date of disposal on 15 June 2007.
During 2008, the company received the following dividends from subsidiary companies forming part of the Consumer Credit Division:
• £40.0mfromProvidentFinancialManagementServicesLimited.
• £0.6mfromN&NChequeEncashmentLimited.
In 2007, dividends amounting to £7.9m were received from subsidiary companies forming part of the insurance business prior to its disposal.
There are no transactions with directors other than those disclosed in the directors’ remuneration report.
Notes to the financial statements – continued

132
Fina
nc
ial Statem
entS
Annual Report & Financial Statements 2008 Provident Financial plc
31 Contingent liabilitiesAs part of the demerger of the international business, the company agreed, subject to the application of a floor, to indemnify International Personal Finance plc (IPF) against a specified proportion of corporate income tax liabilities, and related interest and penalties, in respect of the tax returns of Provident Polska for certain periods ended prior to completion. In addition, subject to certain exceptions, the company has indemnified IPF against tax liabilities arising as a result of the demerger and certain pre-demerger reorganisation steps and against tax liabilities arising as a result of a member of the Provident Financial group making a chargeable payment within the meaning of Section 214 Income and Corporations Taxes Act 1988. No material liabilities are currently expected to arise under these indemnities.
The company has a contingent liability for guarantees given in respect of borrowing facilities of certain subsidiaries to a maximum of £602.2m (2007: £820.2m). At 31 December 2008, the fixed and floating rate borrowings in respect of these guarantees amounted to £359.3m (2007: £319.0m). No loss is expected to arise. These guarantees are defined as financial guarantees under IAS 39 and their fair value at 31 December 2008 was £nil (2007: £nil).
32 Post-balance sheet eventsOn 30 January 2009, N&N Cheque Encashment Limited, a wholly owned subsidiary of the company, sold Cheque Exchange Limited to HertfordInternationalGroupplcforconsiderationof£3.0m.
Notes to the financial statements – continued

133Fin
an
cia
l Statemen
tS
Annual Report & Financial Statements 2008 Provident Financial plc
Independent auditors’ report
To the members of Provident Financial plcWehaveauditedthegroupandparentcompanyfinancialstatements(‘thefinancialstatements’)ofProvidentFinancialplcfortheyearended 31 December 2008 which comprise the consolidated income statement, the group and parent company statements of recognised income and expense, the group and parent company balance sheets, the group and parent company cash flow statements, the statement of accounting policies, financial and capital risk management and the related notes. These financial statements have been prepared under the accounting polices set out therein. We have also audited the information in the directors’ remuneration report that is described as having been audited in paragraph 13 on page 72.
Respective responsibilities of directors and auditorsThe directors’ responsibilities for preparing the annual report, the directors’ remuneration report and the financial statements in accordance with applicable law and International Financial Reporting Standards (IFRSs) as adopted by the European Union are set out in the statement of directors’ responsibilities in paragraph 11 on pages 61 to 62.
Our responsibility is to audit the financial statements and the part of the directors’ remuneration report to be audited in accordance with relevant legal and regulatory requirements and International Standards on Auditing (UK and Ireland). This report, including the opinion, has been prepared for and only for the company’s members as a body in accordance with Section 235 of the Companies Act 1985 and for no other purpose. We do not, in giving this opinion, accept or assume responsibility for any other purpose or to any other person to whom this report is shown or into whose hands it may come save where expressly agreed by our prior consent in writing.
We report to you our opinion as to whether the financial statements give a true and fair view and whether the financial statements and the part of the directors’ remuneration report to be audited have been properly prepared in accordance with the Companies Act 1985 and, as regards the group financial statements, Article 4 of the IAS Regulation. We also report to you whether in our opinion the information given in the directors’ report is consistent with the financial statements.
In addition we report to you if, in our opinion, the company has not kept proper accounting records, if we have not received all the information and explanations we require for our audit, or if information specified by law regarding directors’ remuneration and other transactions is not disclosed.
We review whether the corporate governance statement reflects the parent company’s compliance with the nine provisions of the Combined Code 2006 specified for our review by the Listing Rules of the Financial Services Authority, and we report if it does not. We are not required to consider whether the board’s statements on internal control cover all risks and controls, or to form an opinion on the effectiveness of the group’s corporate governance procedures or its risk and control procedures.
We read the other information contained in the annual report and consider whether it is consistent with the audited financial statements. The other information comprises only the directors’ report and the unaudited part of the directors’ remuneration report. We consider the implications for our report if we become aware of any apparent misstatements or material inconsistencies with the financial statements. Our responsibilities do not extend to any other information.
Basis of audit opinionWe conducted our audit in accordance with International Standards on Auditing (UK and Ireland) issued by the Auditing Practices Board. An audit includes examination, on a test basis, of evidence relevant to the amounts and disclosures in the financial statements and the part of the directors’ remuneration report to be audited. It also includes an assessment of the significant estimates and judgements made by the directors in the preparation of the financial statements, and of whether the accounting policies are appropriate to the group and parent company’s circumstances, consistently applied and adequately disclosed.
We planned and performed our audit so as to obtain all the information and explanations which we considered necessary in order to provide us with sufficient evidence to give reasonable assurance that the financial statements and the part of the directors’ remuneration report to be audited are free from material misstatement, whether caused by fraud or other irregularity or error. In forming our opinion we also evaluated the overall adequacy of the presentation of information in the financial statements and the part of the directors’ remuneration report to be audited.
OpinionIn our opinion:
• thegroupfinancialstatementsgiveatrueandfairview,inaccordancewithIFRSsasadoptedbytheEuropeanUnion,ofthestateofthegroup’saffairsasat31December2008andofitsprofitandcashflowsfortheyearthenended;
• theparentcompanyfinancialstatementsgiveatrueandfairview,inaccordancewithIFRSsasadoptedbytheEuropeanUnion as applied in accordance with the provisions of the Companies Act 1985, of the state of the parent company’s affairs as at 31December2008andcashflowsfortheyearthenended;
• thefinancialstatementsandthepartofthedirectors’remunerationreporttobeauditedhavebeenproperlypreparedinaccordancewiththeCompaniesAct1985andasregardsthegroupfinancialstatements,Article4oftheIASRegulation;and
• theinformationgiveninthedirectors’reportisconsistentwiththefinancialstatements.
PricewaterhouseCoopers LLPChartered Accountants and Registered Auditors Leeds
3 March 2009

134
Annual Report & Financial Statements 2008 Provident Financial plc
Information for shareholders
1 Financial calenDaR – Final DiviDenD
2008 Final
Dividend announced 3 March 2009Annual general meeting 6 May 2009Ex-dividend date for ordinary shares 13 May 2009Record date for the dividend 15 May 2009Payment date of the dividend 19 June 2009
2 SHaRe PRice
Information on our share price is available on the company’s website, www.providentfinancial.com, on Ceefax on BBC1/BBC2 and on Teletext on ITV. Information is also available, at a cost, from FT Cityline (telephone: 09058 171 690).
The share price is also listed in a number of daily newspapers.
3 inDiviDUal SavingS accOUnt (iSa)
Shareholders may take out an ISA which includes shares in the company with a provider oftheirchoice.However,thecompanyhasmadearrangements for its shareholders and employees with Redmayne Bentley for the provision of an ISA. Shareholders who are eligible and who wish to take advantage of this should contact Redmayne Bentley, Merton House,84AlbionStreet,LeedsLS16AG(telephone: 0113 200 6433).
4 tax On DiviDenDS
A UK tax resident individual shareholder who receives a dividend is entitled to a tax credit in respect of the dividend.
The tax credit is 1⁄9th of the dividend (corresponding to 10% of the dividend and the associated tax credit).
A UK tax resident individual shareholder is therefore treated as having paid tax at 10% on the aggregate of the dividend and the associated taxcredit;asstartingandbasicratetaxpayersare liable to tax on the dividend and the associated tax credit at 10%, they will have no further liability to tax in respect of the dividend. UK tax resident individuals cannot claim a refund of the 10% tax credit.
The tax liability on dividends for UK tax resident higher rate taxpayers is an amount equal to 32.5% of the aggregate of the dividend and the associated tax credit less the tax credit. This equates to a liability for additional tax equal to 25% of the dividend.
5 RegiStRaR
5.1 The registrar deals with all matters relating to transfers of ordinary shares in the company and with enquiries concerning holdings. The registrar is: Capita Registrars, The Registry, 34 Beckenham Road, Beckenham, Kent BR3 4TU, telephone: 0871 664 0300 (calls cost 10p per minute plus network extras).
5.2 The registrar’s website is www.capitaregistrars.com. This will give you access to your personal shareholding by means of your investor code (which is printed on your share certificate). A range of services is available to shareholders including: setting up oramendingdividendbankmandates;proxyvoting and amending personal details. Most services will require a user ID and password which will be provided on registration.

135
Annual Report & Financial Statements 2008 Provident Financial plc
6 SPecial ReqUiRementS
A black and white large text version of this document (without pictures) is available on request from the Company Secretary at the address below. A fully accessible html version of the annual report and financial statements is also available on our website which renders all of the text readable by voice browsers and screen readers.
7 aDviSeRS
independent auditorsPricewaterhouseCoopers LLP
Joint financial advisers and stockbrokersDresdner Kleinwort JPMorgan Cazenove
RegistrarCapita Registrars
SolicitorsAddleshaw Goddard LLP Allen & Overy LLP Eversheds LLP
8 cOmPanY DetailS
Registered office and contact details:
Provident Financial plc Colonnade Sunbridge Road Bradford BD1 2LQ
telephone: +44 (0)1274 731111 fax: +44 (0)1274 727300 email: [email protected]: www.providentfinancial.com
company number668987
Information for shareholders – continued

136
Provident Financial plcAnnual Report & Financial Statements 2008

ContentsDIRECTORS’ REPORT: OvERvIEw
Who we are Outside flap
Our history Outside flap
Our group highlights Outside flap
What we do and how we do it Outside flap
Where we operate Inside flap
Our business at a glance Inside flap
Introduction 01
Chairman’s statement 02
Our straightforward approach – Market 04
– Funding 06
– Lending 08
– Repayments 10
DIRECTORS’ REPORT: BUSINESS REvIEw
Our strategy and key performance indicators 12
Chief Executive’s review 14
Group business review 17
Consumer Credit Division– Home credit 18
– Real Personal Finance 23
Vanquis Bank 26
Financial review 32
Risks 38
Corporate responsibility review 40
DIRECTORS’ REPORT: GOvERNaNCE
Our directors, officers and board committees 48
Governance 50
Key governance principles 56
DIRECTORS’ REmUNERaTION REPORT
Remuneration at a glance 63
Remuneration explained 64
Remuneration in detail 69
FINaNCIal STaTEmENTS
Consolidated income statement 74
Statements of recognised income and expense 74
Balance sheets 75
Cash flow statements 76
Statement of accounting policies 78
Financial and capital risk management 85
Notes to the financial statements 89
Independent auditors’ report 133
Information for shareholders 134
Our business at a glanceThe Consumer Credit Division, comprising our home credit and Real Personal Finance (RPF) businesses, is the largest part of our group. Vanquis Bank, our credit card business, was established in 2003 and is growing steadily.
Home credit and direct repayment loans
BrandVanquis Bank
Number of Vanquis Bank customers
404,000
ProductVisa credit card with lower credit limits
Average customer balance
£540
CONSUmER CREDIT DIvISION
vaNQUIS BaNK
Split of customer numbers by business
01 – Consumer Credit Division 1,762,000
02 – Vanquis Bank 404,000
Visit our report online:www.providentfinancial.com/ar2008
UK and Ireland
Where we operateOur head office is based in Bradford, where it has been for the last 129 years. Our Consumer Credit Division has branches in every major town and city in the UK, as well as in rural areas. The home credit business lends to around one in 20 households in both urban and rural locations. Vanquis Bank’s offices are located in London and Chatham.
Home credit agents
11,500Number of employees
3,400
whERE wE aRE
01
02
BrandsProvident Personal Credit Greenwood Personal Credit Real Personal Finance
Number of Consumer Credit Division customers
1.8mAverage customer satisfaction rating
95%
ProductsSmall cash loans Pre-loaded Visa cardsShopping vouchersLarger loansDirect repayment loans
Typical home credit loan
£400Average RPF loan
£1,800
Number of UK non-standard credit customers
10mNumber of home credit regions
34
Number of RPF Personal Finance Managers
58Number of home credit branches
356Cautionary statementAll statements other than statements of historical fact included in this document, including, with limitation, those regarding the financial condition, results, operations and business of Provident Financial plc and its strategy, plans and objectives and the markets in which it operates, are forward-looking statements. Such forward-looking statements which reflect the directors’ assumptions made on the basis of information available to them at this time, involve known and unknown risks, uncertainties and other important factors which could cause the actual results, performance or achievements of Provident Financial plc or the markets in which it operates to be materially different from future results, performance or achievements expressed or implied by such forward-looking statements. Nothing in the document shall be regarded as a profit forecast and its directors accept no liability to third parties in respect of this report save as would arise under English law. In particular, section 463 of the Companies Act 2006 limits the liability of the directors of Provident Financial plc so that their liability is solely to Provident Financial plc.
Paper and print specification This report has been printed on Era Silk and Naturalis Recycled. Era and Naturalis have been independently certified according to the requirements of the FSC (Forest Stewardship Council). Both paper stocks contain 50% recycled fibre and both manufacturing mills are accredited with ISO 14001.
This report is printed by an FSC and ISO 14001 certified printer using vegetable oil-based inks and an alcohol free (0% IPA) process. The carbon footprint of this publication was calculated and carbon credits bought to offset and make this publication completely Carbon Neutral. These carbon credits are invested in projects around the world that save equivalent amounts of CO2.
Designed and produced by salterbaxterPrinted by CTDPhotography by George Brooks

Annual Report & Financial Statements 2008
Provident Financial plc
A straightforward approach in turbulent times
Provident Financial plcColonnade Sunbridge RoadBradford BD1 2LQUnited Kingdom
Telephone: +44(0)1274 731111Fax: +44(0)1274 727300Email: [email protected]: www.providentfinancial.com
Company number 668987
Provident Financial plc Annual Report &
Financial Statements 2008
Who we areWith over two million customers, we serve more non-standard customers than anybody else in the UK. We offer home credit, credit cards and direct repayment loans to those on modest incomes.
Our historyWe’ve been providing small loans, issued in the home and collected weekly, since 1880. In 2003, we started a credit card business that now serves 404,000 customers and in 2007 we began offering larger loans repaid by direct debit.
our group highlights
What We do and hoW We do it
We are good at what we do because we have closer relationships with our customers than most other lenders. Provident agents visit our 1.8m home credit customers every week. Real Personal Finance customers have their own Personal Finance Manager with loans arranged in the home, and we speak to all our Vanquis Bank customers on the phone. This close contact gives us unparalleled insight into how to meet the credit needs of customers in the non-standard market.
Profit before tax
£128.8mEarnings per share
70.9pDividend
63.5p
+11.8%
+11.7%
(2007: 63.5p)