a strategic agricultural sector - wordpress.com strategic agricultural sector and food security...
TRANSCRIPT


0
A Strategic Agricultural Sectorand Food Security Diagnostic for Myanmar
prepared for USAID/Burma1
by Michigan State University (MSU) and theMyanmar Development Resource Institute’s Centre for Economic and Social Development
(MDRI-CESD)
Team leader: Steven HaggbladeExternal team members: Duncan Boughton, Glenn Denning, Renate Kloeppinger-Todd,
Khin Mar Cho, Shannon Wilson, Larry C. Y. WongMDRI-CESD team members: Zaw Oo, Tin Maung Than, Naw Eh Mwee,
Ngu Wah Win, Tun Min Sandar
July 2013
1 This study was made possible by the generous support of the American people through the United States Agencyfor International Development (USAID). The contents are the responsibility of Michigan State University and theMyanmar Development Resource Institute and do not necessarily reflect the views of USAID or the United StatesGovernment.
1
TABLE OF CONTENTS
EXECUTIVE SUMMARY .......................................................................................................... 4
1. INTRODUCTION1.1. Objectives ..................................................................................................................101.2. Methods .....................................................................................................................121.3. Definitions ..................................................................................................................141.4. Organization ..............................................................................................................14
2. DATA QUALITY ISSUES .................................................................................................... 17
3. A PROFILE OF MYANMAR’S AGRICULTURAL SECTOR3.1. Agricultural Resource Base .......................................................................................213.2. Asset Distribution ......................................................................................................243.3. Production and Marketing ..........................................................................................283.4. Agricultural Support Institutions ...............................................................................353.5. Agricultural Performance ...........................................................................................363.6. Implications for Household Livelihoods, Poverty and Food Security .......................38
4. FACTORS AFFECTING PERFORMANCE4.1. Macro Policy ..............................................................................................................424.2. Rural Infrastructure ....................................................................................................434.3. Reforming Public Agricultural Support Institutions ..................................................444.4. Private Sector Agricultural Institutions ....................................................................484.5. Markets ......................................................................................................................494.6. Climate Change and Variability .................................................................................524.7. Factors Affecting Vulnerability .................................................................................53
5. FUTURE TRAJECTORIES5.1. Three Alternative Pathways for Myanmar’s Agriculture ..........................................595.2. The Long Game: Implementing Institutional and Policy Reforms Necessary for
Rapid, Broad-based Agricultural Growth .............................................................615.3. The Short Game: Improving Performance in the Absence of Institutional and Policy
Reforms .................................................................................................................685.4. Key Decisions Going Forward ..................................................................................70
ANNEX A. BACKGROUND PAPERS ...................................................................................... 79ANNEX B. SCHEDULE OF FIELD VISITS ............................................................................. 80ANNEX C. SUPPLEMENTARY TABLES ................................................................................ 82ANNEX D. SUPPLEMENTARY FIGURES .............................................................................. 93ANNEX E. TOPICS FOR FUTURE RESEARCH ..................................................................... 96

2
LIST OF TABLES
1. Indicators of Agricultural Productivity and Food Security ...................................................... 102. Variability in Estimates of Key Socio-Economic Data in Myanmar ....................................... 173. Land Size Distribution in Rural Myanmar, 2011 ......................................................................254. Percent of Households Owning Livestock, by Landholding Size, 2011 ..................................285. Crop Area Planted by Season, 2003 .........................................................................................296. Annual Rates of Growth in Agricultural Production, 1985/86 to 2006/07 ...............................317. Income Sources in Rural Myanmar, 2011 ............................................................................... 388. Most Important Uses of Loans Taken Out Over the Past 12 Months ......................................419. Agricultural Research Intensity ................................................................................................4410. Evolution of Agricultural Policies in Myanmar .....................................................................4611. Key Sources of Household Vulnerability ...............................................................................5512. Strategic Options for the Long Game .....................................................................................6513. Strategic Options for the Short Game .....................................................................................69
LIST OF FIGURES
1. Strategic Options for Myanmar’s Agricultural Sector ....................................................4 and 592. Trends in Rice Exports by Major World Exporters ..................................................................113. Field Interview Locations .........................................................................................................164. Principal Agro-Ecological Zones of Myanmar ....................................................................... 225. Trends in Production of Paddy and Pulses ...............................................................................326. Trends in Exports of Rice and Pulses .......................................................................................327. Pulse Price Volatility, Yangon Market, 2000 to 2011 ..............................................................378. Poverty Levels by State and Region, 2009/10 ..........................................................................409. Stunting by State/Region, 2009/10 ...........................................................................................4010. Returns to Alternate Agricultural Enterprises, 2012 ...............................................................56
LIST OF BOXES
1. The Perils of Administrative Estimates of Agricultural Production: Example from Malawi....202. Landlessness in Neighboring Bangladesh ............................................................................... 273. Hybrid Rice in the Tropics ........................................................................................................344. Scope and Limits of Contract Farming .....................................................................................515. Small and Large Farms: Efficiency and Equity Implications of Agricultural Growth .............57

3
ANNEX C. TABLES
C1. Agricultural Share of GDP .................................................................................................... 82C2. Estimated Livestock Holdings in Myanmar ..........................................................................83C3. Completed Educational Level of the Household Head, 2009-10 ...........................................84C4. Estimated Share of Rural Households without Agricultural Landholdings ..........................85C5. Alternate Estimate of Landlessness .......................................................................................86C6. Land Distribution, by Region and State .................................................................................87C7. Area Planted and Average Plot Sizes for Major Crops, 2003 ................................................88C8. Regional Differences in Horticultural Earnings by Rural Households ..................................89C9. Rural Debt Loads, by Landholding Size ................................................................................90C10. Myanmar Union Government Budget Expenditures, by Sector (percent) ...........................91C11. Agricultural Production in Myanmar, 1986 to 2010 ............................................................92
ANNEX D. FIGURES
D1. Four Dimensions of Food Security ........................................................................................93D2. States and Regions of Myanmar ............................................................................................94D3. Farming Zones by Administrative Regions ...........................................................................95
4
EXECUTIVE SUMMARY
Despite its enormous potential, Myanmar’s agriculture has underperformed over the past fiftyyears. Today, per capita earnings in agriculture average roughly $200 a year, one-half to one-third of the levels achieved by its regional peers. Given that two-thirds of the population worksprimarily in agriculture, low farm productivity translates into high rates of poverty and foodinsecurity. Currently, about one quarter of the population falls below the national poverty line.As a result, in spite of national rice self-sufficiency, food security for many households andindividuals remains elusive. Poor households spend over 70% of their income on food. Inaddition, fully one-third of rural households borrow at some point during the year in order topurchase food. Even after shouldering this heavy financial burden, up to one-half of ruralhouseholds report having to navigate two months each year without adequate food supplies,leaving one-third of the country’s children stunted.
Why has Myanmar’s agricultural sector performed so poorly? As in other sectors of theeconomy, ongoing ethnic civil war and violence over the past 60 years, coupled withinternational isolation, have discouraged private investments and hindered the exchange oftechnology and know-how. Within the agricultural sector, a series of institutional, policy andstructural constraints has hampered agricultural growth and contributed to Myanmar’s currenthigh rates of hunger and malnutrition. The most critical of these problems include:
• a highly skewed land distribution, which leaves roughly half of rural households landless,• poor water control systems in the presence of global climate change and increasinglyunpredictable rainfall,• a high-cost transportation system,• weak rural financial institutions,• unpredictable government policies,• low public investments in agricultural research, and• weak links between extension services and farmers.
Fortunately for the two-thirds of Myanmar citizens who work in agriculture, all of theseimpediments can be remedied through good policies, institutional reforms and key publicinvestments.
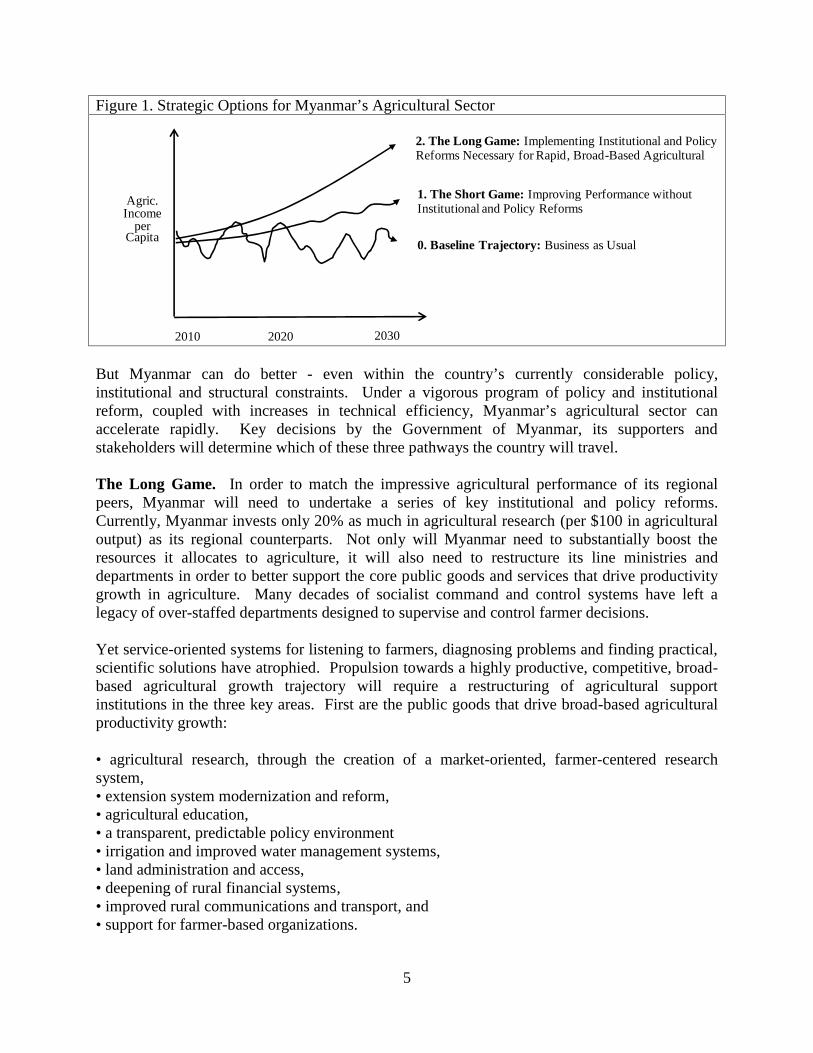
Business as Usual. Looking forward, we see three alternative pathways for Myanmar’sagricultural sector (Figure 1). Under a Business as Usual scenario, Myanmar’s agriculture willcontinue along its current low-productivity, highly volatile trajectory. Persistently lowagricultural productivity stems from five decades of underinvestment in the agricultural supportinstitutions that drive farm productivity growth. Heavy volatility in agricultural production andprices emerges as a result of poor water control in the presence of increasingly irregular rainfallpatterns, unpredictable policies, high transport costs, poor rural communications and a lack ofdiversification among export markets.
5
Figure 1. Strategic Options for Myanmar’s Agricultural Sector
2010 2020 2030
Agric.Income
perCapita
0. Baseline Trajectory: Business as Usual
1. The Short Game: Improving Performance withoutInstitutional and Policy Reforms
2. The Long Game: Implementing Institutional and PolicyReforms Necessary for Rapid, Broad-Based Agricultural
But Myanmar can do better - even within the country’s currently considerable policy,institutional and structural constraints. Under a vigorous program of policy and institutionalreform, coupled with increases in technical efficiency, Myanmar’s agricultural sector canaccelerate rapidly. Key decisions by the Government of Myanmar, its supporters andstakeholders will determine which of these three pathways the country will travel.
The Long Game. In order to match the impressive agricultural performance of its regionalpeers, Myanmar will need to undertake a series of key institutional and policy reforms.Currently, Myanmar invests only 20% as much in agricultural research (per $100 in agriculturaloutput) as its regional counterparts. Not only will Myanmar need to substantially boost theresources it allocates to agriculture, it will also need to restructure its line ministries anddepartments in order to better support the core public goods and services that drive productivitygrowth in agriculture. Many decades of socialist command and control systems have left alegacy of over-staffed departments designed to supervise and control farmer decisions.
Yet service-oriented systems for listening to farmers, diagnosing problems and finding practical,scientific solutions have atrophied. Propulsion towards a highly productive, competitive, broad-based agricultural growth trajectory will require a restructuring of agricultural supportinstitutions in the three key areas. First are the public goods that drive broad-based agriculturalproductivity growth:
• agricultural research, through the creation of a market-oriented, farmer-centered researchsystem,• extension system modernization and reform,• agricultural education,• a transparent, predictable policy environment• irrigation and improved water management systems,• land administration and access,• deepening of rural financial systems,• improved rural communications and transport, and• support for farmer-based organizations.

6
Second is an accurate, objective statistical data collection and dissemination system. Currently,few stakeholders believe Myanmar’s official production statistics - even for rice, where alternateestimates differ by as much as 50%. Yet transparent, effective policies require a firm empiricalgrounding, as do private sector investment decisions.
Third, is a long-range reengineering of the education, health and nutrition institutions thatpromote long-term human capital formation among rural children, particularly the children oflandless households and other disadvantaged groups.
The Short Game. Options for improving agricultural performance without further institutionalor policy reforms center around four strategic axes:
• improving productivity of monsoon rice through improved seed quality, better agronomicpractices, improved water control, optimized fertilizer and input use, integrated pestmanagement, and improved post-harvest management• promoting diversification into high-value horticulture, poultry, fisheries and small livestock byboth small farmers and landless,• preparing the children of landless and near landless households for productive careers in high-productivity agriculture, agribusiness and nonfarm professions by building up their humancapital through nutrition programs and enhanced access to improved rural education and,• improving safety nets.
As a rough order of magnitude, our discussions with local stakeholders suggest that improvedpractices among rice farmers could increase productivity and earnings from paddy farming in theorder of 25% to 50% over the next 5 to 7 years, even under the current policy and institutionalenvironment.
Our team strongly advocates a strategy focused on the Long Game, particularly a set of earlyactions necessary for enabling key institutional reforms, but complemented by Short Gameinterventions that help to increase incomes, assets, farmer skills and water management systemsin ways that expand productive potential in the Long Game. Myanmar’s neighbors andcompetitors in Thailand, Vietnam, Bangladesh, Malaysia, India and China have all committed toa Long Game involving strong public investments in agricultural research, extension and otherpublic goods required to support agricultural productivity growth. Without similar commitmentin Myanmar, we find it difficult to see how the country’s farmers will be able to compete inincreasingly competitive regional and global markets – including those at home.
Policy reforms begun at the end of the 1980s have moved in this direction, though slowly and atsometimes variable speeds. Continued reforms, coupled with increased resource allocations foragriculture and improved policy implementation capacity will be required to translate these still-unfolding policy changes into sustained, improved conditions on the farm. Promulgating newlaws - as difficult as that appears - is often the easiest part of a reform process. Mobilizing thepolitical will to increase budget resources, in the presence of many competing constituencies,frequently proves more difficult, as does institutional restructuring, which by definition alters thepower base of many vested interests. Myanmar has reached the stage in its agricultural reform

7
process where substantial resource increases and significant institutional restructuring arerequired to advance an effective reform agenda.
A balanced portfolio, centered around the Long Game but complemented by Short Gameinterventions, will help to demonstrate to rural communities that the Government and itsdevelopment partners are serious about improving the agriculture sector. This multi-prongedapproach addresses the needs of rural communities for early visible change while at the sametime remaining committed to necessary structural re-engineering of institutions and policies.
As a society, Myanmar’s government, parliament, private sector and civil society will need todecide whether they are willing to commit the financial resources and organizationalrecapitalization required to execute a successful Long Game strategy. If not, in a worst caseMyanmar risks reversion to a Business as Usual future with its record of stagnation, poverty andfood insecurity or, at best, a one-dimensional Short Game with limited upside potential.
The discussion in this document aims to provide a menu of strategic options for improvingagricultural performance under both Long Game and Short Game scenarios. For both, the reportidentifies early actions that will lay the foundation for a successful Long Game under whichaccelerated, broad-based agricultural growth contributes to faster national income growth,improved food security, and increased political stability going forward.
8
ACRONYMS
ACIAR Australian Centre for International Agricultural ResearchADCs Agricultural Development CompaniesADB Asian Development BankADP Agriculture Development ProgrammeADRA Adventist Development and Relief AgencyAED Agriculture Education DivisionAMD Agriculture Mechanization DepartmentAMK Angkor Mikroheranhvatho KampucheaASEAN Association of South East Asian NationsBAAC Bank for Agriculture and Agricultural DevelopmentBIMSTEC Bay of Bengal Initiative for Multi-Sectoral Technical and Economic
CooperationBRAC Bangladesh Rural Advancement CommitteeBRRI Bangladesh Rice Research InstituteBTI Bertelsmann Stiftung’s Transformation IndexCARD Center for Agriculture and Rural DevelopmentCARI Central Agricultural Research InstituteCARTC Central Agricultural Research and Development and Training CentreCBM Central Bank of MyanmarCBO Community-based OrganizationCESD Centre for Economic and Social DevelopmentDA Department of AgricultureDAP Department of Agricultural PlanningDAR Department of Agricultural ResearchDfID Department for International DevelopmentDSLR Department of Settlement and Land RecordsESCAP Economic and Social Commission for Asia and the PacificFAO Food and Agricultural OrganizationFFS Farmers’ Field SchoolFSWG Food Security Working GroupGAD General Administration DepartmentGDP Gross Domestic ProductGMS Greater Mekong Sub regionGOM Government of Myanmar

9
HYV High yielding varietyID Irrigation DepartmentIHLCA Integrated Household Living Conditions AssessmentIMF International Monetary FundIFC International Finance CorporationINGO International non-Government organizationINI Information Networking InstituteIPM Integrated Pest ManagementIRRI International Rice Research InstituteISP Internet service providerJICA Japan International Cooperation AgencyLCG Land Core GroupLIFT Livelihoods and Food Security Trust FundLUD Land Use Division (MOAI)MADB Myanmar Agriculture Development BankMAS Myanmar Agriculture ServiceMDRI Myanmar Development Resources InstituteMEC Myanmar Economic CooperationMFI Microfinance InstitutionMICDE Myanmar Industrial Crop Development EnterpriseMICS Multiple indicator cluster surveyMOAI Ministry of Agriculture and IrrigationMOEC Ministry of Environmental ConservationMOLF Ministry of Livestock and FisheriesMPBSSMA Myanmar Pulses, Beans and Sesame Seeds Merchants AssociationMRIA Myanmar Rice Industry AssociationMSU Michigan State UniversityNGO Non-Governmental OrganizationNMB National Microfinance BankNPK Nitrogen, phosphorus, potassium compound fertilizerRIMES Regional Integrated Multi-hazard Early Warning SystemsRSC Rice Specialized CompaniesSAI State Agricultural InstitutesSEE State Economic EnterprisesSLRD Settlement and Land Records DepartmentUMEH Union of Myanmar Economic Holding CompanyUMFCCI Union of Myanmar Federation of Chambers of Commerce and IndustryUNCDF United Nations Capital Development FundUNDP United Nations Development ProgrammeUNFPA United Nations Population FundUNOPS United Nations Office for Project ServicesUOF University of ForestryUSAID United States Agency for International DevelopmentUSDA United States Department of AgricultureUVS University of Veterinary Science

10
VFVLM Vacant, Fallow and Virgin Lands ManagementWB World BankWRUD Water Resources Utilization DepartmentWFP World Food ProgrammeWRUD Water Resources Utilization DepartmentYAU Yezin Agricultural UniversityYCDC Yangon City Development Council
MEASURES
1 hectare = 2.471 acres1 kg = 0.61 viss1 viss = 1.64 kg100 ticals = 1 viss1 basket of:
Paddy = 21 kgGreen gram = 33 kg
Groundnuts in shell = 11 kgSesame = 24.50 kg
Currency conversion, December 2012US $1.00 = 850 Kyats
11
1. INTRODUCTION
1.1. Objectives
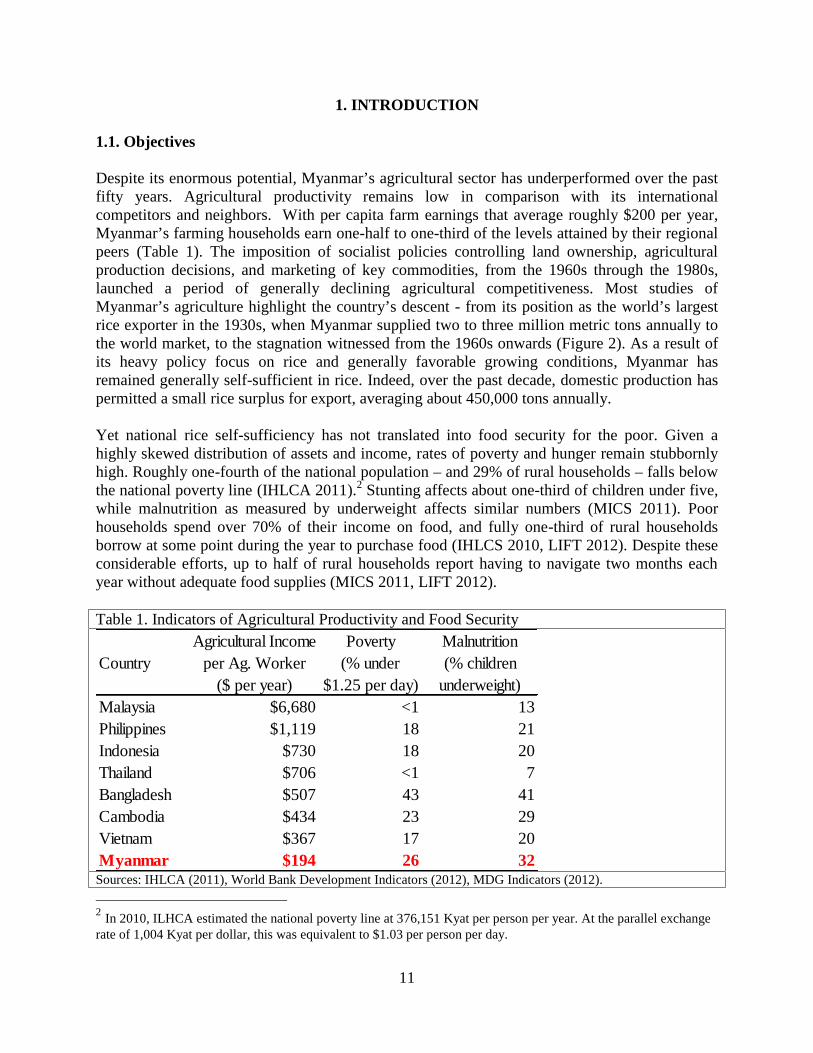
Despite its enormous potential, Myanmar’s agricultural sector has underperformed over the pastfifty years. Agricultural productivity remains low in comparison with its internationalcompetitors and neighbors. With per capita farm earnings that average roughly $200 per year,Myanmar’s farming households earn one-half to one-third of the levels attained by their regionalpeers (Table 1). The imposition of socialist policies controlling land ownership, agriculturalproduction decisions, and marketing of key commodities, from the 1960s through the 1980s,launched a period of generally declining agricultural competitiveness. Most studies ofMyanmar’s agriculture highlight the country’s descent - from its position as the world’s largestrice exporter in the 1930s, when Myanmar supplied two to three million metric tons annually tothe world market, to the stagnation witnessed from the 1960s onwards (Figure 2). As a result ofits heavy policy focus on rice and generally favorable growing conditions, Myanmar hasremained generally self-sufficient in rice. Indeed, over the past decade, domestic production haspermitted a small rice surplus for export, averaging about 450,000 tons annually.
Yet national rice self-sufficiency has not translated into food security for the poor. Given ahighly skewed distribution of assets and income, rates of poverty and hunger remain stubbornlyhigh. Roughly one-fourth of the national population – and 29% of rural households – falls belowthe national poverty line (IHLCA 2011).2 Stunting affects about one-third of children under five,while malnutrition as measured by underweight affects similar numbers (MICS 2011). Poorhouseholds spend over 70% of their income on food, and fully one-third of rural householdsborrow at some point during the year to purchase food (IHLCS 2010, LIFT 2012). Despite theseconsiderable efforts, up to half of rural households report having to navigate two months eachyear without adequate food supplies (MICS 2011, LIFT 2012).
Table 1. Indicators of Agricultural Productivity and Food SecurityAgricultural Income Poverty Malnutrition
Country per Ag. Worker (% under (% children($ per year) $1.25 per day) underweight)
Malaysia $6,680 <1 13Philippines $1,119 18 21Indonesia $730 18 20Thailand $706 <1 7Bangladesh $507 43 41Cambodia $434 23 29Vietnam $367 17 20Myanmar $194 26 32Sources: IHLCA (2011), World Bank Development Indicators (2012), MDG Indicators (2012).
2 In 2010, ILHCA estimated the national poverty line at 376,151 Kyat per person per year. At the parallel exchangerate of 1,004 Kyat per dollar, this was equivalent to $1.03 per person per day.

12
Because agriculture employs two-thirds of Myanmar’s labor force, and because agricultureaffects national food supply, the stability and level of food prices and purchasing power of boththe rural and urban poor, broad-based agricultural growth offers a singularly powerful instrumentfor raising rural incomes and reducing poverty, food prices and hunger. Given the tightcomplementarities between agriculture and food security, this review assesses opportunities forimproving performance in both.
Myanmar’s agricultural potential remains considerable given the country’s resource endowmentsand favorable geographic location. Its considerable water resources center around theAyeyarwady and related river systems which supply 24,000 cubic meters per capita of renewablefresh water each year, over ten times the levels available in China and India and more thandouble the water resources of Vietnam, Thailand and Bangladesh (ADB 2012). Moreover, threeof its four major river systems originate within the country, giving Myanmar exclusive controlover these considerable water resources. As growing water scarcity constrains production aroundthe globe, and particularly in neighboring China and India, Myanmar’s water resources will offera significant agricultural competitive advantage. In addition, the country’s diverse topographyand eco-systems enable farmers to produce a wide range of cereals, pulses, horticulture, fruits,livestock and fish. Combined with its strategic location between two enormous regional markets,in India and China, and easy access to buoyant markets in the Gulf, Myanmar’s farmers andagribusinesses find themselves well positioned to contest both regional and global agriculturalmarkets. This report explores strategic options for charting a more dynamic agricultural and ruralsector going forward.
Many pathways are possible. Thailand and Vietnam have claimed Myanmar’s position as theworld’s leading rice exporters (Figure 2), Thailand by sustained support to the smallholder sectorand Vietnam by transitioning from a socialist system to a free-market beginning with the shiftfrom collectives to individual contracts in 1981 and broader policy changes liberalizing the ricesector in 1988 (Pingali and Xuan, 1992). Bangladesh, despite land pressure similar to
Figure 2. Trends in Rice Exports by Major World Exporters (million tons)
0.0
1.0
2.0
3.0
4.0
5.0
6.0
7.0
8.0
9.0
10.0
1900 1910 1920 1930 1940 1950 1960 1970 1980 1990 2000 2010
Myanmar Thailand Vietnam Pakistan
Sources: Ingram (1955), Young, Cramer and Wailes (1998), FAOSTAT.
13
Myanmar’s, has defied international experts to become food self-sufficient as well as a majorinternational garment exporter. Malaysia, though far from self-sufficient in rice, has achieved thehighest rural income in the region by focusing on support for tree crop exports. Indonesia hascombined support for both rice intensification as well as tree crops by tapping its considerablepetroleum resources to support agricultural growth.
Given Myanmar’s unique culture, history, resource base and timing, the country will need tochart its own pathway forward. In doing so, as it emerges from years of economic and politicalisolation, Myanmar will be able to draw on lessons learned elsewhere over the past five decades.
This report provides a strategic assessment of the key issues, opportunities, constraints andchoices facing Myanmar’s agricultural sector. Discussion focuses on pathways that will permitagriculture to contribute meaningfully to broad-based improvements in purchasing power andfood security for the country’s many landless and vulnerable households. In doing so, it aims toassist public and private stakeholders who will be making the key investment and policydecisions governing future agricultural and food security trajectories in Myanmar.
1.2. Methods
The thirteen-person team conducting this diagnostic review includes members with expertise in abroad range of agricultural disciplines, including research, extension, finance, agronomy,irrigation, marketing, education, policy, food security and safety nets. The team paired its seveninternational members with six Myanmar colleagues from the Center for Economic and SocialDevelopment (CESD) of the Myanmar Development Resources Institute (MDRI) for both thefield and analytical work. A series of thematic background papers served to organize individualassignments and focus the field visits and analytical work on a range of cross-cutting issuesaffecting agricultural performance and food security. In addition to the issues of broad agro-ecological conditions, research and extension systems, rural finance and household food security,the background papers also included a rapid assessment of the rice value chain. Moreimpressionistic field visits aimed to explore activities and issues affecting pulses, oilseeds,poultry and horticulture. Overall, the team produced six for background papers and four sets offield notes that, in turn, provide the basis for the present summary diagnostic report (see AnnexA).
This assessment builds on a wealth of existing background studies and survey work – including arecent agricultural sector review commissioned by United Nations Development Programme(UNDP) and conducted by Food and Agriculture Organization (FAO 2005), an IntegratedHousehold and Living Conditions Survey (IHLCA 2011), a country economic assessmentconducted by the Asian Development Bank (ADB 2012), an important baseline study and earlyevaluation reports by the Livelihoods and Food Security Trust Fund (LIFT) (Barca andRiemenschneider 2011, LIFT 2012, Anderson 2012), and a collection of highly informativesubject-matter reports and studies by the Land Core Group of the Food Security Working Group(LCG 2012, Obendorf 2012, Woods 2013), the FAO (2000), Okamoto (2008), the AustralianCenter for International Agricultural Research (ACIAR) (Henning et al. 2007, 2009; Rao et al.2011) and a series of four reports prepared by the Ashe Center at Harvard University andcommissioned by Proximity Design (Dapice et al. 2009-2012). Private sector trade associations

14
representing the rice industry, poultry, livestock, horticulture, and pulse traders supplied the teamwith similarly useful market data and in some cases survey results commissioned by theirassociations.3
In order to see farm production, marketing, food security conditions and livelihood options first-hand, the team conducted three weeks of field interviews in the Delta, Dry Zone and in ShanState during two waves of visits running from early October through the end of November 2012.The team also attempted to visit Chin, Mon and Kachin States, but was unable to arrange thenecessary travel logistics and permissions (Annex Figure D2). Team members recognize thelimitations this places on the geographic scope of their understanding, particularly given thatconditions vary widely over time and across geographic space in the ethnic and border areas theywere unable to visit. In all, the team visited roughly three dozen villages and two dozen marketsin towns across these three zones, enough to provide context but clearly insufficient to producestatistically reliable data (Figure 3).
During the field visits, team members consulted broadly with government officials, farmers,traders, agribusiness operators and non-government stakeholders in the NGO community and incivil society using rapid rural appraisal techniques, key informant and group interviews. In eachlocation, we specifically sought out women participants in order to ensure gender balance in theinput we received. Following the field visits, the team conducted debriefing meetings with theprivate sector Union of Myanmar Federation of Chambers of Commerce and Industry(UMFCCI) and agricultural sector donors (LIFT consortium) which proved helpful as a soundingboard for initial findings and for clarifying inconsistencies and issues requiring furtherinvestigation. In a second round of consultations, in June 2013, the team benefited from detailedcomments on the draft report during two day-long workshops held in Yangon on June 21 withrepresentatives from the private sector, NGOs, donors, researchers, various political parties andthe media and on June 24 with the Ministry of Agriculture and Irrigation in Nay Pyi Taw.
Data inconsistencies posed consistent challenges throughout the team’s investigations. Virtuallyall of the stakeholders we spoke with – in both the public and private sector – emphasized thefrailties of existing agricultural and socio-economic databases in Myanmar. Even productionestimates for paddy – the single most important agricultural commodity produced in Myanmar –differ by 50% to 100%. These uncertainties over basic facts pose vexing problems, not only forassessment teams such as ours but also for government policy makers and private sectorinvestors. Section 2 of this report discusses these issues in some detail.
3 We are grateful for the valuable insights the team received during these individual meetings and briefings as wellfor the many helpful written comments we have received on earlier drafts of this report. Many people havesuggested amplification in areas related to gender, health, nutrition, natural resource management and education.Where possible, we have complied. However, given our agricultural mandate and limited time for fieldinvestigations, this has not been possible in all cases. Annex E suggests some possible topics for furtherinvestigation, building on this early feedback.

15
1.3. Definitions
Agriculture. This paper considers agriculture to include crop production, livestock and fisheries.According to national income statistics, crop production accounts for about 80% of agriculturalGDP, while livestock and fisheries account for the remaining 20% (Annex Table C1).
Food security. The Food and Agriculture Organization (FAO) considers that food security existswhen all people, at all times, have physical and economic access to sufficient safe and nutritiousfood that meets their dietary needs and food preferences for an active and healthy life. As aresult, four key dimensions define food security: availability, access, utilization, and stability(see Annex Figure D1).
Availability addresses the supply side of the food system, referring to the physical availabilitywithin a country, of food supplies sufficient to feed its population. Access addresses the demandside of the food system by requiring that all population groups possess sufficient purchasingpower to procure the quantity and quality of food their family requires. Utilization refers to theability of the human body to absorb and retain required nutrients. Health status, disease burdens,feeding practices and water quality all affect food utilization and hence nutritional outcomes.Stability along all these dimensions requires that all household members and the food system beable to maintain adequate food availability and consumption in all seasons of the year as well asduring drought or flood periods that may strain supply systems or the income sources ofvulnerable populations.
Agriculture governs three of the four determinants of food security. Availability depends on theproductivity and efficiency of farmers, traders and food processors. Access depends on incomesand purchasing power. In a country such as Myanmar, where two-thirds of the population earnsits living from agriculture, improved agricultural productivity offers a singularly powerful leverfor improving purchasing power of broad groups of vulnerable populations. Stability of foodsupplies, incomes and purchasing power likewise hinges, in large part, on the flexibility,efficiency and responsiveness of water control, farming and marketing systems.
Farmer. Myanmar’s land laws consider as farmers those people and corporate entities that havebeen given rights by the state to cultivate land. Because the government owns all land inMyanmar, under Article 37 of the Constitution, cultivation requires tillage rights that can only beawarded by the state (Oberdorf 2012).
Landless. Rural households without tillage rights to farmland are, by definition, landless. Someown and operate nonfarm businesses although most earn their living as wage laborers, workingprimarily in the fields of neighboring farmers who hold tillage rights. Although estimates varyregionally and across sources, most reports suggest that between 25% and 50% of ruralhouseholds in Myanmar are currently landless (see Section 3.2).
1.4. Organization
This paper begins with a review of data quality and reliability issues that arose repeatedly duringour investigations since these issues affect both our findings and our recommendations.

16
Following that, the paper provides a snapshot of the current status of Myanmar’s agriculturalsector and of the food security status of its vulnerable groups. This leads to a diagnosis of factorsaffecting past and future performance. The final section of the paper looks forward to explorethree potential trajectories for Myanmar’s agricultural sector and key decisions that will affectwhich pathway Myanmar’s rural citizens will travel in coming decades.
This diagnostic report does not claim to provide an exhaustive or statistically definitive overviewof Myanmar’s agricultural sector. Nor does it aim to. Rather, by comparing Myanmar’s currentsituation, performance and policies with experiences from elsewhere and by benchmarkingagainst best-practices from outside, this review aims to highlight critical issues and key choicesthat will govern agricultural and food security trajectories in Myanmar over the coming decades.

17
Figure 3. Field Interview Locations
Source: Annex B.

18
2. DATA QUALITY ISSUES
Wolfgang Stolper wrote his famous book, Planning Without Facts, in 1966. It described hisefforts helping to prepare Nigeria’s first national development plan at a time and in anenvironment where reliable data were in chronically short supply. His labors resemble those ofcurrent policy makers and potential investors in Myanmar, where reliable data remain similarlyelusive even today.
Most stakeholders we spoke with – in the private and public sectors – agree that the quality ofMyanmar’s agricultural data is generally weak. Production estimates for paddy vary by nearly afactor of two across sources. While official government estimates put paddy production at 33million tons in 2011, the major alternative estimate from the U.S. Department of Agriculture(USDA) projects production at closer to 17 million tons.4 For minor crops and livestock, whichenjoy less careful attention and fewer monitoring resources, estimates likewise vary widely(Table 2). Optimistic official production estimates, in turn, give rise to implausibly highestimates of annual rice consumption, over 280 kg per person per year, nearly double the levelsof other major rice-growing countries in the region (see Dapice et al. 2009 and Denning et al.2013).
Problems of data quality are not unique to agriculture. More broadly, users of socio-economicdata in Myanmar raise regular questions about their reliability and accuracy (see Ware and Clark2009, U Myint 2010, Dapice et al. 2011, 2012). A recent review by Ware and Clark (2009, p.1)states flatly that, “Accurate statistical data for Myanmar is lacking, and what is available is ofquestionable validity. This is the result of several factors including the government havinglimited control over parts of the territory, limited resources for data gathering and analysis, anddata being manipulated for internal and external consumption.” The United Nation’s regionalEconomic and Social Commission for Asia and the Pacific similarly concludes that Myanmarstands out as having the least capacity in ASEAN "to produce reliable and timely data even forthe most basic statistics" (ESCAP 2007). As Dapice et al (2012, p.7) note, ‘Myanmar is a verypoor country with very misleading official data.” Several structural problems underlie these basicconcerns about data reliability.
Table 2. Variability in Estimates of Key Socio-Economic Data in Myanmar
Parameter Difference Alternateofficial alternate (of-alt)/alt source
Population, 2008 (millions) 59 49 20% IMF, World BankGDP growth rate (% per year), 2000-2010 12.2 4.7 160% IMFRice production, 2011 (million tons) 32.6 17.2 90% USDACattle population, 2011 (millions) 14 10 40% Livestock industry
Estimates
Sources: Ware and Clark (2009), Hlaing (2011), USDA (2012), ADB (2012).
4 Our field visits suggest that the USDA production estimates lie much closer to reality than the official productionnumbers produced by government and in turn reported without amendment by the FAO. See Denning et al. (2013)for details. Other observers and stakeholders have similarly concluded that official production estimatesconsiderably overstate national rice production. See, for example, Dapice et al. (2011). The Myanmar RiceFederation (MRF) has conducted field studies to estimate rice production since the 2011/12 season. Their estimatesfall in between the USDA and MOAI estimates (MRF 2012a, 2013).
19
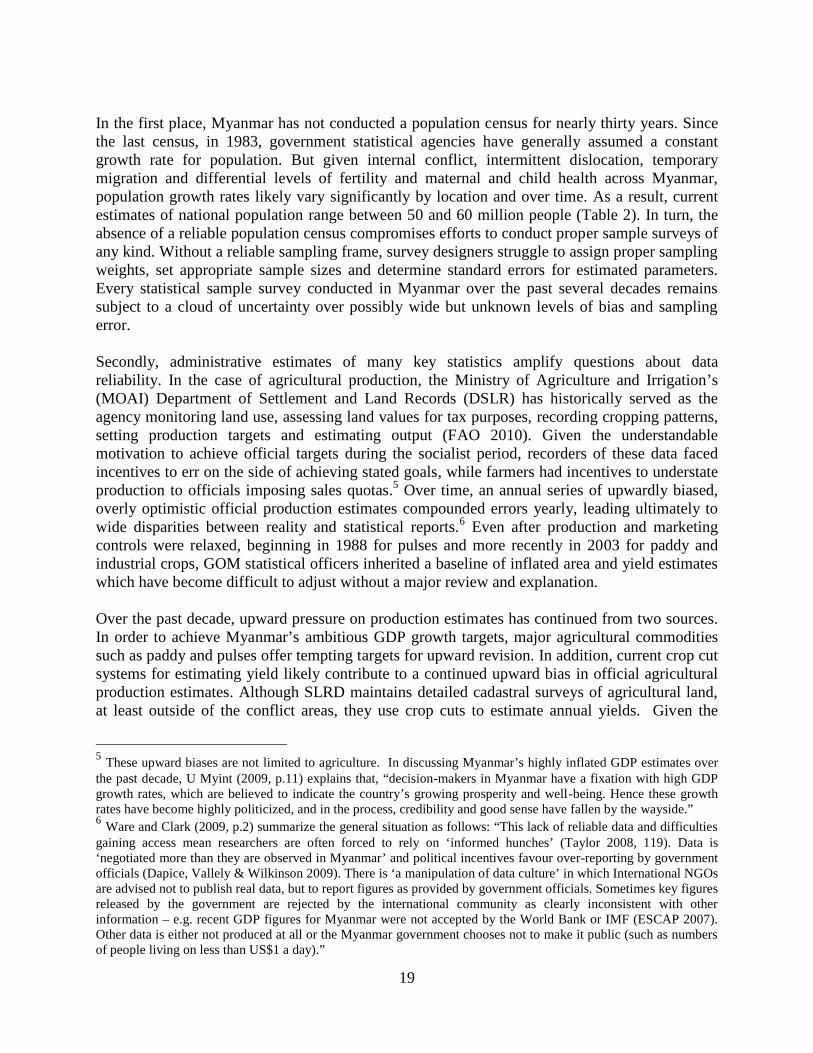
In the first place, Myanmar has not conducted a population census for nearly thirty years. Sincethe last census, in 1983, government statistical agencies have generally assumed a constantgrowth rate for population. But given internal conflict, intermittent dislocation, temporarymigration and differential levels of fertility and maternal and child health across Myanmar,population growth rates likely vary significantly by location and over time. As a result, currentestimates of national population range between 50 and 60 million people (Table 2). In turn, theabsence of a reliable population census compromises efforts to conduct proper sample surveys ofany kind. Without a reliable sampling frame, survey designers struggle to assign proper samplingweights, set appropriate sample sizes and determine standard errors for estimated parameters.Every statistical sample survey conducted in Myanmar over the past several decades remainssubject to a cloud of uncertainty over possibly wide but unknown levels of bias and samplingerror.
Secondly, administrative estimates of many key statistics amplify questions about datareliability. In the case of agricultural production, the Ministry of Agriculture and Irrigation’s(MOAI) Department of Settlement and Land Records (DSLR) has historically served as theagency monitoring land use, assessing land values for tax purposes, recording cropping patterns,setting production targets and estimating output (FAO 2010). Given the understandablemotivation to achieve official targets during the socialist period, recorders of these data facedincentives to err on the side of achieving stated goals, while farmers had incentives to understateproduction to officials imposing sales quotas.5 Over time, an annual series of upwardly biased,overly optimistic official production estimates compounded errors yearly, leading ultimately towide disparities between reality and statistical reports.6 Even after production and marketingcontrols were relaxed, beginning in 1988 for pulses and more recently in 2003 for paddy andindustrial crops, GOM statistical officers inherited a baseline of inflated area and yield estimateswhich have become difficult to adjust without a major review and explanation.
Over the past decade, upward pressure on production estimates has continued from two sources.In order to achieve Myanmar’s ambitious GDP growth targets, major agricultural commoditiessuch as paddy and pulses offer tempting targets for upward revision. In addition, current crop cutsystems for estimating yield likely contribute to a continued upward bias in official agriculturalproduction estimates. Although SLRD maintains detailed cadastral surveys of agricultural land,at least outside of the conflict areas, they use crop cuts to estimate annual yields. Given the
5 These upward biases are not limited to agriculture. In discussing Myanmar’s highly inflated GDP estimates overthe past decade, U Myint (2009, p.11) explains that, “decision-makers in Myanmar have a fixation with high GDPgrowth rates, which are believed to indicate the country’s growing prosperity and well-being. Hence these growthrates have become highly politicized, and in the process, credibility and good sense have fallen by the wayside.”6 Ware and Clark (2009, p.2) summarize the general situation as follows: “This lack of reliable data and difficultiesgaining access mean researchers are often forced to rely on ‘informed hunches’ (Taylor 2008, 119). Data is‘negotiated more than they are observed in Myanmar’ and political incentives favour over-reporting by governmentofficials (Dapice, Vallely & Wilkinson 2009). There is ‘a manipulation of data culture’ in which International NGOsare advised not to publish real data, but to report figures as provided by government officials. Sometimes key figuresreleased by the government are rejected by the international community as clearly inconsistent with otherinformation – e.g. recent GDP figures for Myanmar were not accepted by the World Bank or IMF (ESCAP 2007).Other data is either not produced at all or the Myanmar government chooses not to make it public (such as numbersof people living on less than US$1 a day).”
20
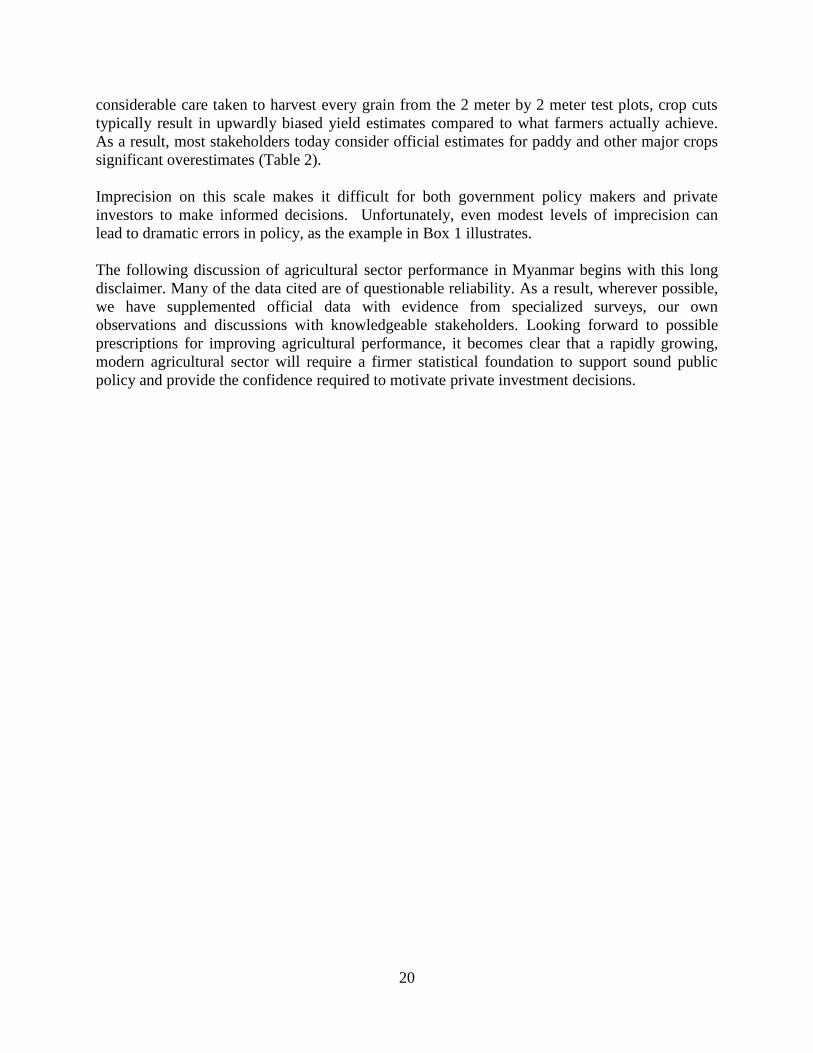
considerable care taken to harvest every grain from the 2 meter by 2 meter test plots, crop cutstypically result in upwardly biased yield estimates compared to what farmers actually achieve.As a result, most stakeholders today consider official estimates for paddy and other major cropssignificant overestimates (Table 2).
Imprecision on this scale makes it difficult for both government policy makers and privateinvestors to make informed decisions. Unfortunately, even modest levels of imprecision canlead to dramatic errors in policy, as the example in Box 1 illustrates.
The following discussion of agricultural sector performance in Myanmar begins with this longdisclaimer. Many of the data cited are of questionable reliability. As a result, wherever possible,we have supplemented official data with evidence from specialized surveys, our ownobservations and discussions with knowledgeable stakeholders. Looking forward to possibleprescriptions for improving agricultural performance, it becomes clear that a rapidly growing,modern agricultural sector will require a firmer statistical foundation to support sound publicpolicy and provide the confidence required to motivate private investment decisions.

21
Box 1. The Perils of Administrative Estimates of Agricultural Production:An Example from MalawiTwo general systems exist for estimating agricultural production: a) administrative estimates by extensionstaff using expert local knowledge, and b) statistical sample surveys of farm households, usually conducted bycentral statistical offices using census sampling frames. The administrative systems base output projections onan aggregation of estimates by local extension workers and other knowledgeable district staff. Generally, theseestimates are considered to be less reliable than survey estimates and also susceptible to political pressures toachieve stated government targets (Jayne and Rashid 2011).
Table B.1. Malawi Crop Production Estimates, 2007
Commodity Differenceadministrative survey-based (a-b)/a
maize 3.2 2.1 34%cassava 3.2 0.4 88%
Production estimates (MMT)
Malawi uses an administrative system similar to Myanmar’s for estimating agricultural output. Malawi’sdeceased past president won three international prizes between 2008 and 2011 for rapidly boosting foodproduction in Malawi. Not surprisingly in these circumstances, ministry officials charged with estimatingannual food production faced unusually strong incentives to issue optimistic estimates of food output. Adetailed farm household survey in 2007 provides a point of comparison for assessing this possible upwardsbias. This comparison suggests that the official administrative estimates for maize production in 2007exceeded the survey estimate by roughly one-third, while they overstated cassava production by nearly 90%(Table B.1).
Over-estimates of this magnitude give rise to potentially serious policy distortions. Consider the followinghypothetical example provided by Jayne and Rashid (2010).
Figure B1. A Heuristic Example of How Inaccurate Crop Forescasts can Lead to National Food Insecurity
Crop forecast estimate: 3.0 MMTActual production: 2.6 MMT
Estimated consumption: 2.4 MMTActual consumption: 2.6 MMT
Estimated food surplus: + 0.6 MMTActual food surplus: zero
Government policy response to estimated food surplus:a) Export 0.5 MMT and store 0.1 MMT
b) Restrict import licenses
OUTCOMES:a) Government export leads to a 0.5 MMT national shortage
b) food price surgesc) a food crisis occurs despite an apparent national food
surplus!
Source: Jayne and Rashid (2010).

22
3. A PROFILE OF MYANMAR’S AGRICULTURAL SECTOR
3.1. Agricultural Resource Base
3.1.1. Climate
Wide climatic diversity occurs across Myanmar as a result of the country’s broad span ofelevation, latitude, temperature and rainfall. Its elongated geography spans 18 degrees of tropicallatitude, from 10 to 28 degrees north latitude. Its multiple river basins and the mountain rangesthat form them, generate changes in elevation that range from sea level along the country’slengthy coastline to as high 5,900 meters in the mountain states that form Myanmar’s borderregions. As a result, temperatures vary considerably, with maximum daily temperaturesaveraging 32 degrees Celsius in the Delta and 21 degrees in the hilly zones. Rainfall ranges from5,000 mm along the coast, to 2,500 mm in the Delta region and about 600 mm in the Dry Zone.This diversity of conditions gives rise to an enormous variety of micro-climates.
Amid wide diversity, three broad agro-ecological zones dominate the agricultural landscape: theDelta, the Dry Zone and the hilly areas (Figure 4). In the south, the densely populated Delta zoneis home to roughly 22 million people who concentrate primarily on lowland rice production,particularly during the monsoon season. Moist monsoon winds off the Bay of Bengal bringseasonal rains to the coastal and Delta regions. In contrast, the middle part of Myanmar lies inthe monsoon’s rainfall shadow, creating a dry zone in which population clusters along the mainriver valleys. Farmers in the Dry Zone cultivate a range of rainfed crops and, where wateravailability permits, summer and monsoon rice. Roughly 19 million people live in the Dry Zone.The third largest agricultural zone lies in the hilly areas of the country, dominated by Shan Statein the eastern part of Myanmar (Annex Figures D2 and D3), which are home to another 6.5million people. Farmers in this zone produce a wide range of rainfed treecrops and horticultureproducts along with rice, maize and pulses.
Three different seasons enable farmers to cultivate crops at different times of the year, dependingon where they farm. The main farming season occurs during the hot, rainy monsoon periodwhich runs from May to October across most of the country. The ensuing dry months begin witha cool, dry winter season running from October to February, while a dry, hot summer seasonruns from February to April. The structure of crop, livestock and fish production variesconsiderably across Myanmar’s three seasons as well as its three principal agro-ecological zones.
3.1.2. Physical Resources
Alluvial and swampy soils dominate in the Delta, while vertisols are more important in theirrigated rice lands of the Dry Zone. About one million acres of coastal mangroves border theDelta region on the south. To the north of the Delta, alluvial lowlands dominate agriculturalproduction areas in the Dry Zone. The hilly, often forested ethnic border states offer moretemperate climates well suited to fruit and horticulture crops.

23
Figure 4. Principal Agro-Ecological Zones of Myanmar
Note: See Annex Figures D2 and D3 for an overlay of farming systems and administrativeboundaries.

24
Although land use data remain the subject of considerable debate, cultivated farm holdingsamount to between 21 and 30 million acres (Agricultural Census 2003, MOAI 2012). Anadditional 14 million acres classified as virgin and fallow land or cultivable wasteland suggestssignificant potential for expanding cultivation. Indeed, most production gains over the past twodecades have come from area expansion rather than increased productivity (see Table 6).Nonetheless, the shifting cultivation and long-term fallow systems historically operated in manyof these areas have precipitated conflict over land claims, particularly in the wake of recentlarge-scale land allocations (LCG 2012).
A further 83 million acres of forest land adds to Myanmar’s reputation as a country with surplusland (MOAI 2012). However, Myanmar has been losing roughly 1% of its forest land per yearover the past 20 years, with Ayeyarwaddy, Mandalay, Yangon and Rakhine regions experiencingannual rates of deforestation of over 5% (Htun 2009). Following the economic reforms of 1988,rates of deforestation reportedly increased as the forestry sector was opened to private sector use.Forest degradation has been most severe along the north and western areas of the Dry Zone, inthe east of the country (bordering Thailand) and the southern tip of the Delta. Large parts of theeast and west have degraded forests affected by shifting cultivation. Overall, forests affected byshifting cultivation provide resources for as many as 2 million families (FAO 2005).
Myanmar enjoys abundant water resources with significant coastal access, groundwater and fourmajor rivers which allow for irrigation and hydropower generation. Only about 10% of the totalwater resources available to the country are utilized, and 90% of that use is for irrigation.Though its water resources are among the largest in the region, availability varies temporally andspatially. Roughly 80% of fresh water flows during the May-October monsoon season with theremaining 20% available during the November-April dry season. Seasonal water scarcity is aparticular challenge in areas such as the Dry Zone and Rakhine State in the west. 7 Since 1988the Government has made large-scale efforts to construct dams (for both irrigation andhydropower), reservoirs and pump irrigation facilities throughout the country. Nonetheless, todate, the country has developed less than 5% of its estimated 40,000 megawatts hydropowerpotential. Total area under irrigation doubled between 1980 and 2000 due to increasing demandand support from government projects. In recent years, the percentage of irrigated land hasremained steady at around 17%, with the highest percentage of irrigated land based in the Delta.Hydrological evidence suggests that a series of both deep and shallow freshwater aquifers lieunder the Ayeyarwady Delta and that these could be developed to irrigate a large portion of landin this area, especially during the dry season.
3.1.3. Livestock and Fish
National accounts indicate that livestock and fisheries account for about 20% of total agriculturalincome in Myanmar, though these estimates may understate the economic and nutritionalimportance of these sectors (Annex Table C1). Within the livestock sector, recent estimates placethe national chicken flock in excess of 170 million birds plus another 15 million ducks. Cattleholdings number about 14 million head with a roughly equal number small livestock such as pigs
7 Our team visited one village in Bago East where residents report that seasonal water shortages often force villagersto rely on donations of fresh water from monks in the adjacent village for two-three months per year.

25
and goats (see Annex Table C2). The Dry Zone is especially important for livestock production.About half of the country’s cattle are raised in the Dry Zone, while 77% of the sheep and goatsare found in this zone (JICA 2010).
Myanmar’s coastal and river delta regions provide rich spawning grounds for fish populations,particularly the zones where seasonal transitions occur between saline and fresh waterinfiltration. As a result, fishing forms a critical part of the national economy and diet.
Substantial additional fishery potential exists in the country’s major rivers, for aquaculturedevelopment in the low-lying river delta areas in the south and center of the country, and formarine fishery resources along the country’s 1,900 km coastline and 500,000 ha of mangroveswamps.
3.1.4. Human Resources
Myanmar’s 50 to 60 million people constitute one of the country’s largest resources. Althoughtotal population numbers are subject to some uncertainty, given the thirty years elapsed since thelast official population census (see Table 2), population density is clearly highest in the Delta,followed closely by the Dry Zone (Figure 3).
Educational standards, however, have declined over the past five decades. Today, according tothe Integrated Household Livelihoods and Consumption Survey (ILHCA) survey of 2010,roughly half of rural household heads have completed primary school, while 8% have noeducation and a similar numbers have completed secondary or higher education (Annex TableC3). Although staffing, facilities and educational standards are generally low, enrollment ratesin rural areas are high, at over 85%, and roughly comparable for girls and boys (IHCLA 2011,UNFPA 2010). Among institutions of higher education, quality has generally declined since the1996 student demonstrations and the subsequent government crackdown on large studentgatherings (BTI 2012).
3.2. Asset Distribution
A signature feature of rural Myanmar is its highly skewed distribution of cultivable farmland.Data on land distribution remain difficult to assemble given acute political sensitivities,locational differences in traditional tenure systems and large numbers of unrecorded, informaltransactions. Even so, available evidence unambiguously suggests that the highest rates oflandlessness occur in the Delta region, where field estimates of rural landlessness range from50% to 80% of rural households.8 In the Dry Zone and hilly regions, where land pressure isvisibly less, the share of landless in total rural households ranges between 25% and 45% (Table3).
8 During our fieldwork, the share of landless households living in the villages we visited ranged between 50% and90% in the Delta area, between 25% and 58% in the Dry Zone and between zero and 40% in the Hilly areas. Fieldvisits by Dapice et al (2009) produced very similar estimates of 50% to 70% landless in the Delta and 25% to 40%in the Dry zone.

26
Table 3. Land Size Distribution in Rural Myanmar, 2011Landholdingsize (acres) Delta/coastal Dry Zone Hilly
0 72 43 26< 5 7 37 63
5 - 10 9 12 9> 10 12 8 2total 100 100 100
Percent of Households
Source: LIFT Baseline (2012), Table 54.
Although estimates of landlessness differ widely, the preponderance of available evidencesuggests that between one quarter and one half of all rural households are landless in the sensethat they have no land use rights to cultivable land. Okamoto (2008), for example, reportslandlessness rates between 30% and 50% during the 1990s. The Integrated HouseholdLivelihoods and Consumption Survey (ILHCA) of 2009/10 estimates rates of rural landlessnessat 24%, while the FAO team conducting the UNDP agricultural sector review of 2005 estimatedlandlessness at 30% of rural households. A World Bank team visiting Myanmar in late 2012 hasprojected rural landlessness at 55%.
Myanmar’s agricultural census data yield a similarly wide range of landlessness estimates.Using data from the last three agricultural censuses, we derive rough ballpark estimates bycomparing the number of rural households with the agricultural census estimates of the numberof agricultural holdings, defined as households with access to over 0.1 acres of farmland9 (seeAnnex Table C4). Calculations using this method based on the 1993 and 2003 censuses suggestaverage rural landlessness rates of about 50%. In 2003, for example, the census data indicate that3 million rural households out of a total of 6.5 million (47%) had no access to cultivable land,while an additional half a million rural households (about 8% of rural households) held tillagerights on holdings under 1 acre, a level commonly associated with functional landlessness(Annex Table C4). The 2010 census, however, reports a 49% increase in the number ofagricultural crop holdings between 2003 and 2010, with the largest increase occurring in thecohorts cultivating 1-5 acres and 5-10 acres. A comparison of the 2003 and 2010 censuseslikewise reveals increased numbers in all landholding size groups over 10 acres. Overall, the2010 census data imply landless rates of about 22% of rural households plus another 4% in thefunctionally landless category under 1 acre (Annex Table C4). Taken together, the last threeagricultural censuses bracket rural landlessness in the range between about 25% and 50% of ruralhouseholds.10
9 Myanmar’s Agricultural Census defines an agricultural holding as, “an economic unit of agricultural production”… “raising crops on at least 1/10 (0.10) acre of land which is approximately 4,356 sq. ft., or raising of at least 4heads of small livestock, or 2 heads of large livestock, or at least 30 heads of chicken or ducks, regardless of the areaof the land.”10 The team’s general observations during our village visits and the far more exhaustive baseline study of 4,000 ruralhouseholds by LIFT (2012, see Table 3) both suggest that, at least in the areas visited, the true figure may lie closerto the high end of this range. National estimates derived by using the landlessness rates found in the LIFT baselinesurvey with population weights derived from Figure 3, together result in an estimated national landless rate of 53%(Annex Table C5).

27
Even the low end of this range would imply a significant imbalance in access to productivefarmland. At the high end of the range, rates of landlessness in the vicinity of 50% would suggestextreme skewness in rural asset distribution. In either case, landlessness emerges as a criticalstructural feature of Myanmar’s rural economy, one that will centrally influence the design ofrural development programs if the country is to achieve broad-based economic growth as well aspolitical stability (see Box 2).
This wide range of estimates in land access raises, once again, concerns about the empiricalfoundations underpinning understanding of the basic structural elements of Myanmar’s ruraleconomy. This level of uncertainty suggests that the issue of land access, like many others, willrequire careful future empirical work exploring landholding trajectories and land access acrosshousehold groups, regions and over time. Given the wide variety of traditional land tenuresystems operating in Myanmar and the emergence of various informal systems for transferringland rights (despite the formal interdictions in place over many decades), unraveling the realityof Myanmar’s land access questions will make these investigations both sensitive and complex.
Over the past decade, the Government of Myanmar has allocated nearly 2 million acres in large-scale commercial land blocks to local agribusiness investors and companies, many with foreignpartners and with links to the military (Woods 2013). These large-scale land allocations amountto between 6% and 8% of total agricultural landholdings (see also Annex Table C6) andcontribute to the skewed distribution of agricultural land.
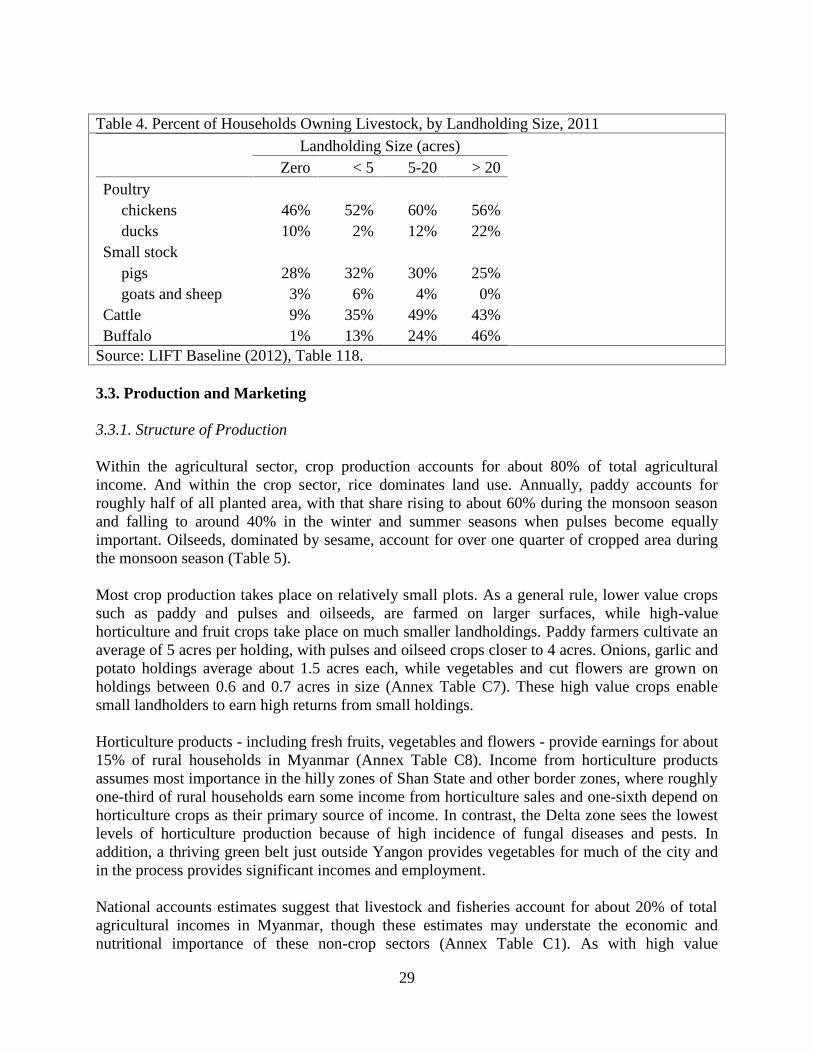
Livestock ownership remains similarly skewed for cattle and oxen (Table 4). However,ownership of poultry and small livestock such as pigs, goats and sheep is prevalent amonghouseholds of all size. Because of their small land requirements, poultry and small livestockoffer opportunities for very small landholders. Even among landless households, roughly halfraise poultry while another 30% rear small livestock such as pigs and goats (Table 4).
Fishing likewise attracts landless households (see Table 7). Small designated areas are open toall fishermen. However, on most inland water bodies, government awards fishing licensesannually by tender. So, in practice, landless households must generally pay tender holders a feefor the right to fish a small portion of their concession.

28
Box 2. Landlessness in Neighboring BangladeshLike its western neighbor, Bangladesh, Myanmar straddles one of the world’s most important natural rice-producing river deltas. During antiquity, rice cultivation emerged along the Ayeyarwady and Jamunariver deltas, as each became home to several thousand indigenous varieties of rice uniquely suited tospecific local water, temperature and soil conditions. The rich productive potential of these naturalfloodplains afforded a source of great wealth around which unique civilizations, wealthy landowners andlarge farming populations emerged over many centuries. As a result, both delta regions have becomeamong the most heavily populated rural regions on earth.
At the outset of Bangladesh’s Green Revolution, inthe mid-1980’s, land scarcity in their river deltaresembled the levels now facing Myanmar, withroughly 40% of rural Bangladeshi householdsconsidered functionally landless (owning under 1acre of farmland). Like Myanmar, rurallandlessness had been increasing in Bangladeshover the past decades. But unlike Myanmar,Bangladesh’s rigorously precise national statisticalsystem paints a clear picture of the pace of landconcentration (Table B1).
Dismissed as a basket case at independence because of these high levels of landlessness, Bangladeshconfounded the skeptics by investing in agricultural research (the Bangladesh Rice Research Institute(BRRI) won multiple awards for rice research during the 1980s), liberalizing input markets for tubewellsand fertilizer, and decontrolling rice marketing by gradually suspending ration channels (like Myanmar,they favored civil servants and military) and price and marketing controls. To deal with heavylandlessness, policy makers promoted not only rice productivity but also diversification into high-valuespecialty rice, horticulture, livestock and fish production along with nonfarm activities and labor-intensiveexport industries. The Grameen Bank and others led massive investments in rural financial systems, whilethe Bangladesh Rural Advancement Committee (BRAC) pioneered brokering and veterinary supportsystems for high-value poultry production for rural landless. Agricultural productivity growth triggeredlower real food prices and a structural transformation of the rural economy with agricultural wage gainsof 30%, rapid growth of high-return nonfarm activities and a decline in low-wage cottage industries.
Although data on rural landlessness remain subject to a large margin of error in Myanmar, it appears thatMyanmar may be starting from a less favorable position than Bangladesh if, indeed, half of Myanmar’srural households are currently landless. If so, Myanmar will need to move even more aggressively thanBangladesh to find ways of raising farm productivity and rural wage rates, improving opportunities forhigh-value, scalable, labor-intensive agricultural activities requiring limited land, and labor-absorbingnonfarm employment.Source: Hossain (1989), Malhotra and Santer (1994), Ahmed and Haggblade (2000), Dorosh et al. (2004),Hossain et al (2007).
Landholdingsize
(acres) 1960 1983/84< 1 24.3 40.41-2.5 27.3 29.92.5-5.0 26.3 185.0 - 7.5 11.4 6.8> 7.5 10.7 4.9All 100 100
Share of Rural Holdings(percent)
Table B2. Changes in the Distribution of Rural LandOwnership in Bangladesh, 1960 - 1983/84
29
Table 4. Percent of Households Owning Livestock, by Landholding Size, 2011
Landholding Size (acres)Zero < 5 5-20 > 20
Poultrychickens 46% 52% 60% 56%ducks 10% 2% 12% 22%
Small stockpigs 28% 32% 30% 25%goats and sheep 3% 6% 4% 0%
Cattle 9% 35% 49% 43%Buffalo 1% 13% 24% 46%
Source: LIFT Baseline (2012), Table 118.
3.3. Production and Marketing
3.3.1. Structure of Production
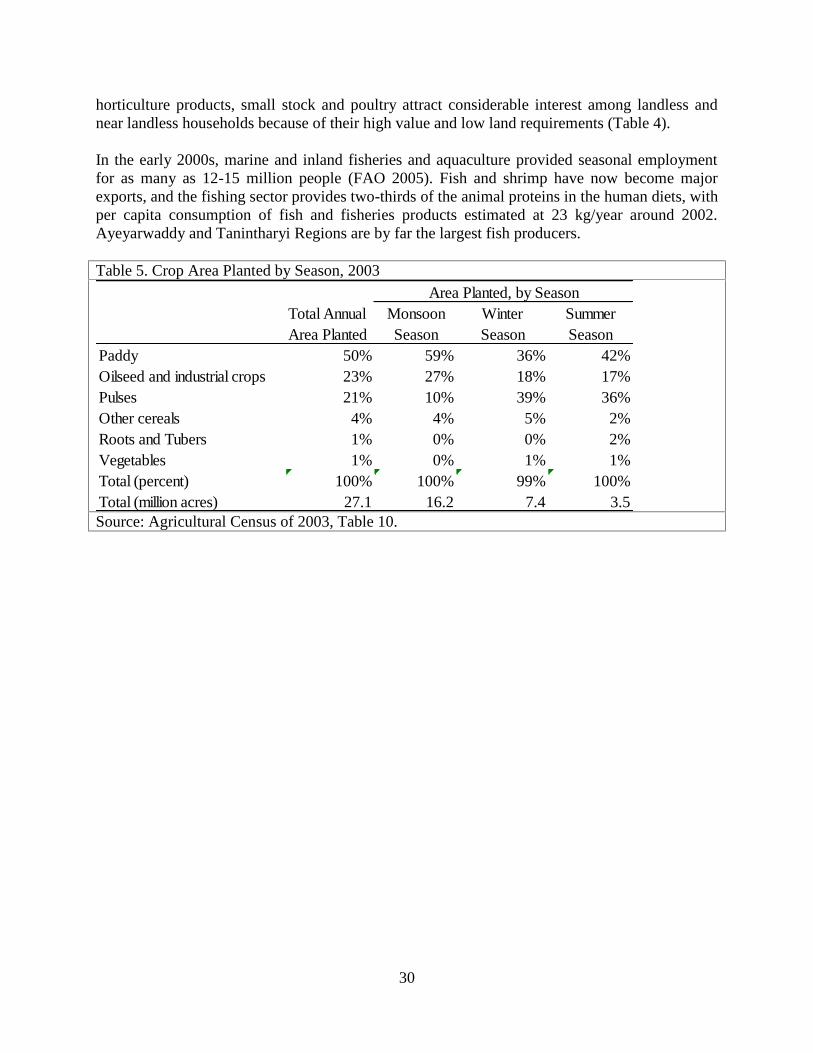
Within the agricultural sector, crop production accounts for about 80% of total agriculturalincome. And within the crop sector, rice dominates land use. Annually, paddy accounts forroughly half of all planted area, with that share rising to about 60% during the monsoon seasonand falling to around 40% in the winter and summer seasons when pulses become equallyimportant. Oilseeds, dominated by sesame, account for over one quarter of cropped area duringthe monsoon season (Table 5).
Most crop production takes place on relatively small plots. As a general rule, lower value cropssuch as paddy and pulses and oilseeds, are farmed on larger surfaces, while high-valuehorticulture and fruit crops take place on much smaller landholdings. Paddy farmers cultivate anaverage of 5 acres per holding, with pulses and oilseed crops closer to 4 acres. Onions, garlic andpotato holdings average about 1.5 acres each, while vegetables and cut flowers are grown onholdings between 0.6 and 0.7 acres in size (Annex Table C7). These high value crops enablesmall landholders to earn high returns from small holdings.
Horticulture products - including fresh fruits, vegetables and flowers - provide earnings for about15% of rural households in Myanmar (Annex Table C8). Income from horticulture productsassumes most importance in the hilly zones of Shan State and other border zones, where roughlyone-third of rural households earn some income from horticulture sales and one-sixth depend onhorticulture crops as their primary source of income. In contrast, the Delta zone sees the lowestlevels of horticulture production because of high incidence of fungal diseases and pests. Inaddition, a thriving green belt just outside Yangon provides vegetables for much of the city andin the process provides significant incomes and employment.
National accounts estimates suggest that livestock and fisheries account for about 20% of totalagricultural incomes in Myanmar, though these estimates may understate the economic andnutritional importance of these non-crop sectors (Annex Table C1). As with high value
30
horticulture products, small stock and poultry attract considerable interest among landless andnear landless households because of their high value and low land requirements (Table 4).
In the early 2000s, marine and inland fisheries and aquaculture provided seasonal employmentfor as many as 12-15 million people (FAO 2005). Fish and shrimp have now become majorexports, and the fishing sector provides two-thirds of the animal proteins in the human diets, withper capita consumption of fish and fisheries products estimated at 23 kg/year around 2002.Ayeyarwaddy and Tanintharyi Regions are by far the largest fish producers.
Table 5. Crop Area Planted by Season, 2003
Total Annual Monsoon Winter SummerArea Planted Season Season Season
Paddy 50% 59% 36% 42%Oilseed and industrial crops 23% 27% 18% 17%Pulses 21% 10% 39% 36%Other cereals 4% 4% 5% 2%Roots and Tubers 1% 0% 0% 2%Vegetables 1% 0% 1% 1%Total (percent) 100% 100% 99% 100%Total (million acres) 27.1 16.2 7.4 3.5
Area Planted, by Season
Source: Agricultural Census of 2003, Table 10.

31
3.3.2. Marketing
Despite low levels of urbanization (about one-third of the national population), Myanmar’sextremely high rate of rural landlessness results in a large majority of households being netpurchasers of staple food. According to the Agricultural Census of 2003, 2.5 million holdings, orabout 40% of rural households produced crops primarily for sale. The remaining 60% producedmainly for subsistence. In 2011, less than 10% of landless households sold any crops, whilevirtually all purchased food (LIFT 2012, Table 84). Because landless rural households and urbanhouseholds are net buyers of food staples, marketed shares are high for most crops.
For many decades, the Government of Myanmar exercised tight control over these major foodand agricultural markets, beginning in 1962. Heavy state controls on production and marketinghave given way to gradual liberalization beginning in 1988. Liberalization of pulse productionand marketing proceeded most quickly and fully, beginning in 1988, resulting in rapid increasein farmer incentives and hence rapid growth of pulse production and exports (Table 6). Paddymarket reform began fifteen years later, in 2003, with the abandonment of compulsorygovernment procurement of paddy and the cessation of ration channel distribution. By 2011,government had sold its rice mills and removed restrictions on private sector domestic trade andexport. With oilseeds, cotton and sugar, reform has also proceeded more slowly than with pulses(Wong and Wai 2013). In many cases, government exit from these markets has been replaced bygovernment-approved commercial enterprises. As a result, two military-affiliated conglomerates,the Union of Myanmar Economic Holding Company (UMEH) and the Myanmar EconomicCooperation (MEC), have become the largest economic enterprises in the country, dominatingmany sectors of the economy (BTI 2012). Until March 2011, when palm oil imports wereliberalized, MEC and UMEH accounted more for than 90% of total palm oil imports, togetherwith a handful of other companies (Wong and Wai 2013).
Since the withdrawal of state marketing companies for pulses and rice, large numbers of privatetraders have emerged to serve as market intermediaries in the assembly, wholesale and exportfunctions. Non-political commodities such as horticulture and poultry products have remainedconsistently within the province of private sector traders. Generally, the trade groups are wellorganized into associations that operate trading floors in major production zones and urbanmarkets. Our field observations suggest that women are particularly active in fresh fruits andvegetables and in small livestock production, while men dominate the trading of paddy, pulsesand oilseeds.
3.3.3. Trends
Despite the Government of Myanmar’s heavy priority for rice, paddy output appears to havegrown more slowly than most other crops. Even optimistic official production figures suggestthat rice output has grown at about 3% annually over the past two and a half decades, with thebulk of the gains coming from area expansion. More conservative estimates from the USDAsuggest paddy output has grown at closer to 1% per year (Table 6). Maize production has grownfar more rapidly than rice, on the heels of rapidly growing demand for poultry feed and emergingregional export markets.
32
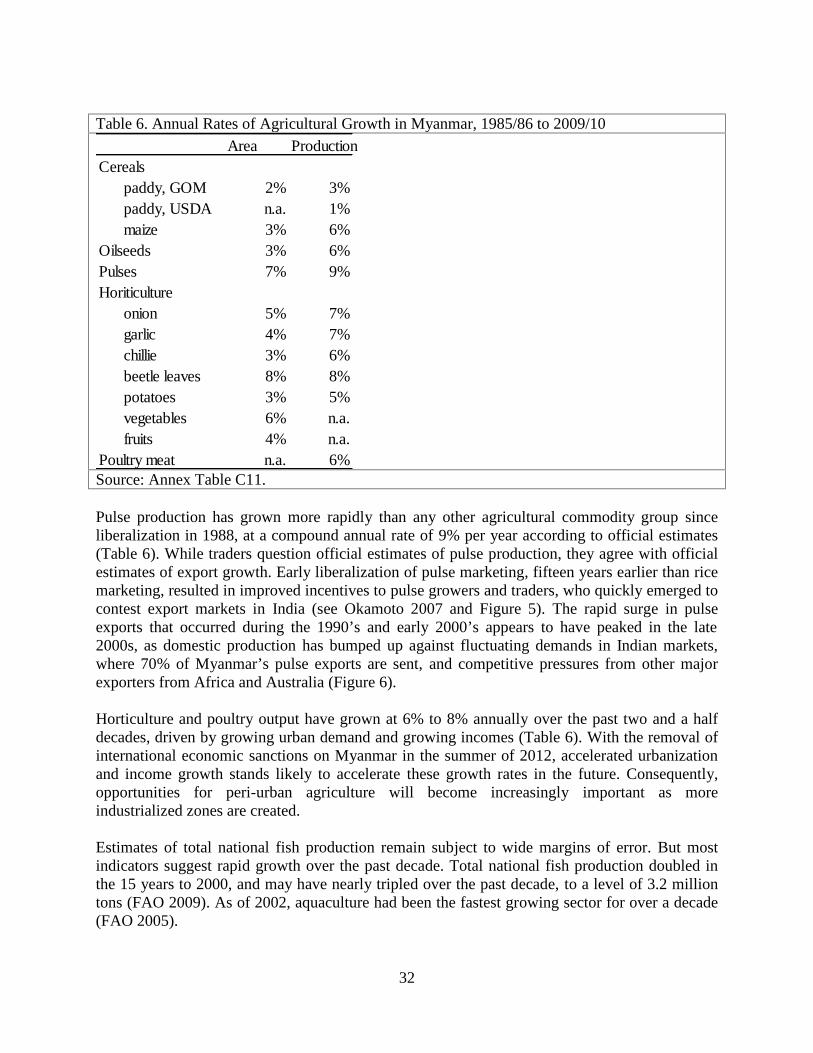
Table 6. Annual Rates of Agricultural Growth in Myanmar, 1985/86 to 2009/10Area Production
Cerealspaddy, GOM 2% 3%paddy, USDA n.a. 1%maize 3% 6%
Oilseeds 3% 6%Pulses 7% 9%Horiticulture
onion 5% 7%garlic 4% 7%chillie 3% 6%beetle leaves 8% 8%potatoes 3% 5%vegetables 6% n.a.fruits 4% n.a.
Poultry meat n.a. 6%Source: Annex Table C11.
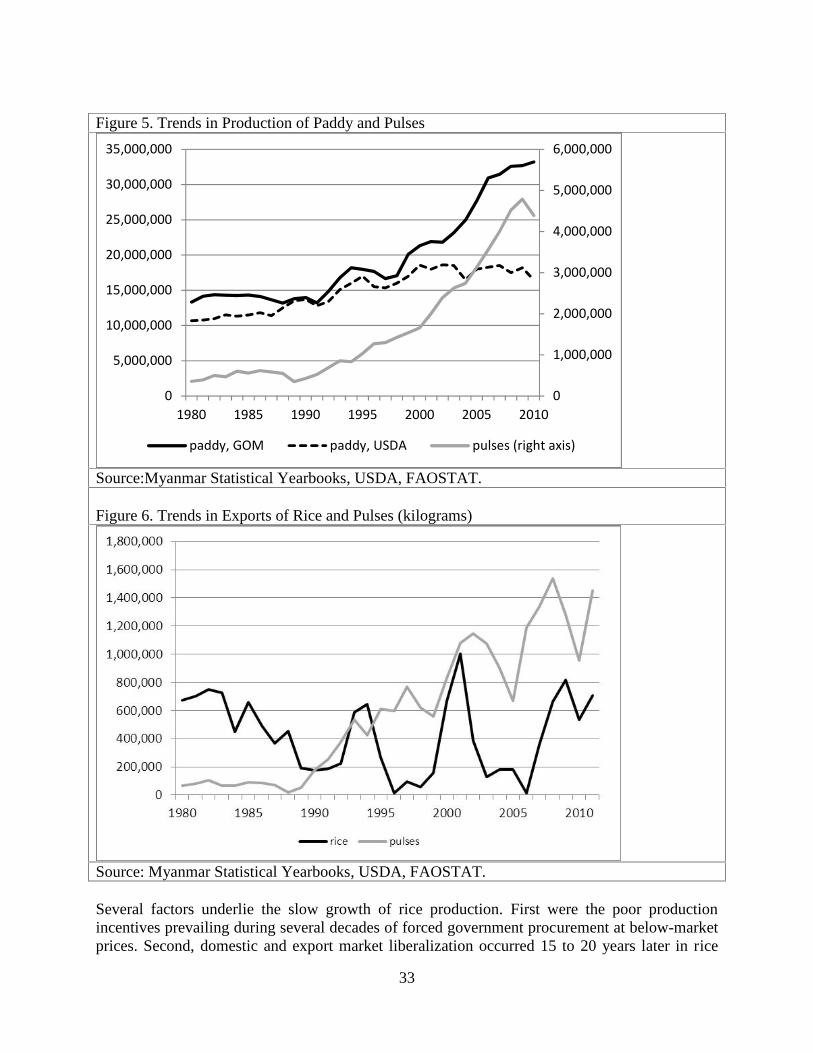
Pulse production has grown more rapidly than any other agricultural commodity group sinceliberalization in 1988, at a compound annual rate of 9% per year according to official estimates(Table 6). While traders question official estimates of pulse production, they agree with officialestimates of export growth. Early liberalization of pulse marketing, fifteen years earlier than ricemarketing, resulted in improved incentives to pulse growers and traders, who quickly emerged tocontest export markets in India (see Okamoto 2007 and Figure 5). The rapid surge in pulseexports that occurred during the 1990’s and early 2000’s appears to have peaked in the late2000s, as domestic production has bumped up against fluctuating demands in Indian markets,where 70% of Myanmar’s pulse exports are sent, and competitive pressures from other majorexporters from Africa and Australia (Figure 6).
Horticulture and poultry output have grown at 6% to 8% annually over the past two and a halfdecades, driven by growing urban demand and growing incomes (Table 6). With the removal ofinternational economic sanctions on Myanmar in the summer of 2012, accelerated urbanizationand income growth stands likely to accelerate these growth rates in the future. Consequently,opportunities for peri-urban agriculture will become increasingly important as moreindustrialized zones are created.
Estimates of total national fish production remain subject to wide margins of error. But mostindicators suggest rapid growth over the past decade. Total national fish production doubled inthe 15 years to 2000, and may have nearly tripled over the past decade, to a level of 3.2 milliontons (FAO 2009). As of 2002, aquaculture had been the fastest growing sector for over a decade(FAO 2005).
33
Figure 5. Trends in Production of Paddy and Pulses
0
1,000,000
2,000,000
3,000,000
4,000,000
5,000,000
6,000,000
0
5,000,000
10,000,000
15,000,000
20,000,000
25,000,000
30,000,000
35,000,000
1980 1985 1990 1995 2000 2005 2010
paddy, GOM paddy, USDA pulses (right axis)
Source:Myanmar Statistical Yearbooks, USDA, FAOSTAT.
Figure 6. Trends in Exports of Rice and Pulses (kilograms)
Source: Myanmar Statistical Yearbooks, USDA, FAOSTAT.
Several factors underlie the slow growth of rice production. First were the poor productionincentives prevailing during several decades of forced government procurement at below-marketprices. Second, domestic and export market liberalization occurred 15 to 20 years later in rice

34
than in pulses, giving paddy farmers a late start at expansion under improving incentive systems.Third, perishable horticultural and livestock products have remained less regulated and havelikewise grown faster than paddy (Table 6). Given their high value and perishability, they havebeen largely been ignored by the large-scale government procurement and state marketingsystems. As a result, market growth and farm profitability have driven rapid growth in thesehigh-value horticulture and livestock commodities.
Finally, many specialists believe that government’s heavy emphasis on hybrid rice may havediverted resources from the promotion of classic improved varieties. Given the high cost and lowvalue of hybrid rice, coupled with its disease susceptibility, adoption rates for hybrid rice remainlow in most tropical countries (Denning et al. 2013). In Myanmar, IRRI reports that hybridsaccount for roughly 1% of paddy area (Xe 2011). Although conventional breeding offers a morelikely quick pathway to rapid productivity gains across most of Myanmar’s rice productionzones, hybridization offers one of many tools available to breeders seeking to improveproductivity across all areas of Myanmar. India’s experience, described below, offers perhaps themost interesting scenario for Myanmar to consider as it seeks to identify a pathway towards rapidrice productivity gains using a mix of conventional and hybrid varieties in situations where eachproves most viable (Box 3).
Fertilizer use on paddy fields has fluctuated significantly over the past four decades as a result offluctuating incentives. During the 27-year period ending in 1993/94, when the governmentheavily subsidized fertilizer prices, per acre use on paddy increased dramatically, from less than1 kilogram per acre (of NPK fertilizer) in 1966/67 to 57 kg/acre in 1993/94. Over the same timeperiod, the share of HYV seeds used in paddy production increased from zero to just over 50%.From 1994 onwards, the government removed fertilizer subsidies on all crops except thoseproduced by the State Economic Enterprises (SEE) operating under MOAI (Young et al. 1998).
Although, Myanmar produces some urea domestically using its local natural gas resources,volumes are insufficient and so the government allows private traders to import the balancerequired. Over the past two decades, fertilizer prices have generally followed international pricemovements, leading to wide swings in relative fertilizer-to-paddy prices and hence substantialswings in fertilizer use.
Currently, about two-thirds of paddy farmers apply fertilizer on their monsoon paddy crop, whileover 90% use fertilizer during the irrigated summer season crop (LIFT 2012). Application rates,however, remain low by Asian standards. Limited available survey evidence suggests thatfarmers apply between 25 and 40 kg of nitrogen per acre. Low fertilizer use on rice, coupled withmodest current yield levels, suggest likely benefits to increased fertilizer use in Myanmar.Indeed, research undertaken by IRRI has demonstrated good responses to fertilizer during thesummer season (Denning et al. 2013).
Unlike fertilizer, pesticide use appears to have grown sharply in Myanmar in recent years,particularly in the years following cyclone Nargis in 2008. This increased use raises concernsabout misuse and possible negative environmental and health impacts. Evidence from severalcountries in Southeast Asia indicates that inappropriate use of pesticide can lead to worsening ofpest problems, most notably planthoppers (Denning et al. 2013). Our interviews with farmersrevealed widespread pesticide use. However, farmers were uniformly unclear about their efficacy

35
and risk. Many noted that instructions on imported pesticides were often printed in Chinese orThai and so farmers relied heavily on agro-dealers for advice on pesticide use.
Box 3. Hybrid Rice in the TropicsThe development of hybrid rice in temperate zones of China has resulted in major yield gains, with yields in therange of 8 tons of paddy per hectare. As a result, Chinese farmers currently plant about 60% of total paddy land inhybrid varieties. However, efforts to develop hybrid rice varieties appropriate for the tropics have met with severaltechnical difficulties. First, the hybrids have proven susceptible to a broad range of tropical diseases and pests, thuslimiting the attainable yield gains in tropical settings. Second, the cost of hybrid seed production is very high giventhe stringent technical requirements and low seed yields of hybrid rice. Third, hybrids produce rice of inferior grainquality and hence command low market price. The combination of high seed costs, heavy pest and disease damageand low value of the paddy produced has made hybrid rice production less viable than conventional improvedvarieties in many tropical settings to date. Researchers continue, nonetheless, to work on rice hybridization in thetropics, driven by the possibility of significant potential yield gains and the prospects of motivating investment byprivate seed companies in agricultural research.
Early experiments with hybrid rice in the Philippines, India, and Bangladesh have produced mixed results, but ingeneral have proven disappointing as a commercial proposition for smallholder farmers. As a result, breeders inthese countries remain focused primarily on conventional rice varieties. Only in northern and central Vietnam hashybrid rice outperformed conventional improved varieties. Outside of Vietnam, studies in tropical Asia indicate that,in general, hybrid rice cultivation has not proven profitable for farmers despite varying levels of subsidies (Janaiahand Hossain 2003). Despite low adoption rates, some Philippine seed companies have started developing hybrids forthe tropics with modest success in selected growing areas. In the Philippines, “Despite concerted efforts and massivesubsidies incurred in the promotion of hybrid rice, there is no strong evidence that currently available hybridvarieties are … commercially viable in the country… (David 2006: 48). Today, hybrid rice accounts for under 10%of paddy land planted in Bangladesh, India, Indonesia and the Philippines and slightly over 10% in Vietnam(Spielman et al 2012). In Myanmar, farmers plant about 1% of paddy land in hybrids (Xe 2011).
The Indian experience offers perhaps the most promising model for Myanmar. Indian seed companies must getgovernment approval to sell new varieties of hybrid rice, but once approved they place no restrictions on where it isgrown. The free market allows farmers the choice to grow hybrids where they perform well and where marketconditions make them viable. As a result, Indian farmers grow hybrids in the selected areas where they are profitableand can produce reasonable yields.
In Myanmar, the MOAI has actively promoted the hybrid rice in recent years in cooperation with Chinesetechnicians. The MOAI reported hybrid seed production during the 2011 summer season on over 300 acres using the“Par-le-thwe” variety. Our team observed this variety near maturity at the Gold Delta Company farm in Danuphyutownship in November 2012. Production appeared to be comparable with the non-hybrid crop at about 4.5- 5 MT/ha.However, we were informed that a higher rate of fertilizer was used. After consulting with many local andinternational rice agronomists and breeders, we found limited support for large-scale promotion of hybrid rice inMyanmar at this time. Chinese varieties are not well adapted to Myanmar’s conditions. Moreover, grain quality ispoor resulting in a low market price. Although hybrids may prove appropriate in certain environments in Myanmar,conventional breeding offers a more likely quick roadway to rapid productivity gains across most of Myanmar’s riceproduction zones. Hybridization, like conventional breeding, offers one of many tools available to breeders seekingto pursue a balanced research program that can successfully improve productivity across all production zones ofMyanmar.Sources: Janaiah and Hossain (2003), David (2006), Xe (2011), Spielman et al. (2012), Denning (2013).
Input credit for purchasing fertilizer, seeds, pesticides and herbicides remains costly in ruralMyanmar. In order to improve input access for paddy production, the government initiated aspecial regime for Rice Specialized Companies (RSC) in 2008 under which large investors wereencouraged to provide inputs under contract farming schemes in return for access to exportlicenses. Today, 57 rice specialized companies have registered. However, since 2011 export

36
permits have been allocated to trading companies as well, so it remains unclear what the futurewill hold for these paddy-based contract farming schemes (Box 4).11 By the 2012 season,industry sources estimate that only 4 of the RSCs were continuing to supply inputs on credit tocontract paddy growers (Wong and Wai 2013).
3.4. Agricultural Support Institutions
Agricultural research, extension and education constitute key public goods driving agriculturalgrowth over time.
Currently, Myanmar operates a network of agricultural research institutions. The centerpiece ofthis system, the Ministry of Agriculture and Irrigation’s (MOAI) Department of AgriculturalResearch (DAR) operates seven major research center and 17 satellite farms across Myanmarcovering rice, other cereals, pulses, oilseeds and various horticulture crops. Formerly the CentralAgricultural Research Institute (CARI) under the Myanmar Agriculture Service (MAS), DARbecame a separate department in 2004. In addition to the 700 research staff at DAR, researchersin a series of specialized units in the Department of Industrial Crops Development (DICD)conduct varietal and agronomic research focusing on industrial crops such as cotton, sugarcane,rubber and jute.
Myanmar likewise operates multiple extension services through the Department of Agriculture(DOA) and a series of specialized units serving fisheries, forestry, rural development, cotton,sugar cane and other cash crops.12 The largest of these, with about 75% of total MOAI extensionpersonnel, is the DOA focusing primarily on paddy production. Within DOA, women accountfor about one-third of total extension officers (Cho 2013).
The agricultural education system in Myanmar includes three universities, all under differentministries and focused on different segments of the agricultural sector. The Yezin AgriculturalUniversity (YAU), under the MOAI, covers crop sciences and, in addition, offers some coursesin animal sciences and fisheries. YAU also operates seven regional research stations where itdeploys students to conduct research during their final year. The University of VeterinaryScience (UVS), also in Yezin but under the Ministry of Livestock and Fisheries (MOLF) - coversveterinary sciences and fisheries but not crop agriculture. The University of Forestry (UOF)under Ministry of Environmental Conservation (MOEC) specializes in issues of landmanagement, environment and forestry. In addition to these degree-conferring institutions, sevenState Agricultural Institutes (SAI) offer post-secondary diploma level training to agriculturalistsfor careers in extension or agribusiness. Although we do not have gender-disaggregatedinformation from UVS or UOF, women constitute 60% of enrolled students at YAU and three-
11 See MRF (2012b) for an assessment of the impact contract farming on rice farmers’ performance.12 In 2004, MOAI’s Department of Agriculture (DOA) reportedly employed 12,000 extension officers, while theministry’s four state economic enterprises (SEEs) responsible for plantation crops such as sugarcane, cotton,mulberry, jute, rubber and oil palm employed an additional 4,000 extension staff (FAO 2005). In 2006, theagricultural SEEs were merged into a single entity, the Myanmar Industrial Crops Development Enterprise(MICDE). In 2012, after selling off most its publicly owned industrial crop processing and production facilities,MOAI transformed MICDE into a line ministerial Department of Industrial Crops Development (DICD). Today, asin 2004, DICD continues to deploy roughly 25% of MOAI extension staff.

37
fourths of the faculty. Slightly over 40% of the teaching staff received master and Ph.D. trainingabroad, primarily in Japan, Thailand, Germany and the Philippines (Cho 2013).
3.5. Agricultural Performance
Despite its significant resource base and strategic location, Myanmar’s agriculture hasunderperformed over the past five decades. Assessment along three standard performancedimensions – productivity, equity and stability – all disappoint. Myanmar’s agriculture ischaracterized by low productivity, extreme inequality and high volatility.
Low agricultural productivity translates into low levels of value added per worker. Currently,farm earnings per worker in Myanmar range between one half and one third of the levels attainedin neighboring countries (Table 1). Reasons for this low productivity vary across commoditiesbut stem in large part from long-term chronic underinvestment in agricultural research, theengine of agricultural productivity growth, coupled with weak extension support and limitedaccess to input credit. Crop yields, though highly variable, remain generally below those ofneighboring countries. Lower levels of input use (particularly improved seeds and fertilizer),poor management practices (particularly weed and pest control) and uncertain water control allcontribute to dampening paddy yields (Denning et al. 2013). As a result, most output gains havecome from area expansion rather than increased yields (Table 6). At an aggregate level, sluggishagricultural productivity growth has resulted in flat per capita farm incomes, while agriculture’sshare in total GDP has declined from about 57% in the early 2000’s to 36% in 2010 as a result ofrapid growth in natural gas production and related sectors (Annex Table C1).
A highly skewed distribution of land and other productive assets results in high levels of ruralinequality and poverty. As many as half of rural households hold no tillage rights to cultivableland. As a result, casual wage labor provides the single largest source of earnings for ruralhouseholds. Although daily wage rates vary by region, season and gender, our field studiessuggest that they commonly range between 1,500 and 2,500 Kyat per day ($1.75 and $2.95).Women typically earn at the low end of this range. They specialize in certain tasks such astransplanting and weeding, but even during harvest time, when both men and women work asday laborers, women receive lower wage rates than men (Wilson and Wai 2013). Pronouncedseasonality of agricultural employment coupled with seasonal underemployment and low wagerates limit annual earnings and place about one-fourth of the rural population under the povertyline (IHLCA 2011). In addition to lower levels of land ownership, poor rural householdstypically own fewer livestock assets, fishing rights and have less access to credit. With lowerincome and fewer assets to cushion against seasonal and episodic health and weather shocks, theaverage rural household has adequate food supplies about 10 months out of the year. For landlesshouseholds, this falls to 9.6 months (LIFT 2012, Table 43).
High volatility of agricultural production and prices compounds the risks facing rural andagricultural households. Indeed, many of the farmers and traders we spoke with talked explicitlyabout the increased unpredictability they face. Following record flooding in 2008, Myanmar hasexperienced episodes of both drought and flooding in the years since then. As a result, farmerswe spoke with are acutely aware of the increasing production risk they face. Most studies ofclimate change in Myanmar suggest that over the coming decades average temperatures will rise,

38
aggregate rainfall will increase, but the rains may become more sporadic, leading to highervolatility and increased incidence of both flooding and drought (RIMES 2011, World Bank2012, Wang et al. 2013). Production volatility, in turn, contributes to price volatility for locallytraded agricultural commodities. Figure 7 illustrates the level of price volatility affecting severalof Myanmar’s major pulses, one of the star performing segments of the agricultural economyover the past two decades.
Figure 7. Pulse Price Volatility, Yangon Market (Kyat/ton), 2000 to 2011
0
200,000
400,000
600,000
800,000
1,000,000
1,200,000
Pulse
Pric
es, Y
ango
n (k
yat p
er 6
0 vi
ss)
Black gram Pigeon pea
Source: Market Information System, Department of Agricultural Planning, MOAI.
Causes of agricultural volatility stem from a number of major structural rigidities. First isincreasingly irregular rainfall, coupled with poor water control which leads to increasingfrequency of both flooding and drought. Second are unpredictable policies, particularly tradepolicies. Many of the agribusiness people we interviewed complained about unexpected exportrestrictions, and in some cases continued land controls, that prevented them from exportingspecific crops over the past decade, even when business conditions looked attractive. Reliance onsingle export markets contributes to volatility of many commodity prices. Currently, Myanmarexports about 70% of its pulses to India and 90% of its watermelons to China. Though mostonions are marketed domestically, about 75% of all onion exports are directed to Thailand. As aresult, dislocations in the Indian, Thai or Chinese markets generate large price swings inMyanmar’s pulse, onion and watermelon prices. When the Chinese watermelon harvest shifts bya few weeks due to abnormal weather, they demand lesser quantities of watermelons fromMyanmar. During our field visits in November 2012, sluggish demand for Chinese imports wascausing a noticeable price slump in Yangon and Mandalay as growers attempted to offloadproduction in local markets. Limited rural cell phone penetration of only 4% limits farmerinformation on regional price spreads (Ericsson 2012; LIFT 2012 Table 90). This stands in sharpcontrast to the rest of Southeast Asia where penetration is close to 100%. High-cost marketingand logistics infrastructure, among the least efficient and highest cost in the Association of SouthEast Asian Nations (ASEAN) region (ADB 2012), further aggravate price swings.

39
3.6. Implications for Household Livelihoods, Poverty and Food Security
3.6.1. Income Sources of Vulnerable Rural Households
For landless and near-landless households, income-earning opportunities center primarily aroundseasonal casual labor working on landowners’ farms, supplemented by small business activityand fishing (IHLCA 2011, LIFT 2012). According to the LIFT baseline survey, roughly half oflandless rural households depend primarily on farm labor as their primary source of income(Table 7). Both men and women work as agricultural wage laborers. Women account for 45% ofagricultural wage labor days, while men supply the remaining 55% (LIFT 2012, Table 25).
Table 7. Income Sources in Rural Myanmar, 2011
Someincome* all households landless
Casual labor 54% 31% 50%agriculture 39% 17% 28%fishing 17% 8% 14%forest products 8% 3% 3%other 11% 4% 5%
Crop production 46% 37% 2%pulses 19% 9%maize, wheat, barley, sorghum 16% 8%paddy 13% 9%vegetables 10% 4% 2%other 15% 7%
Livestock production 8% 3% 2%Fish production 12% 9% 11%Forest and wild food products 3% 2%Small businesses 21% 11% 15%
trading 8% 5% 7%manufacturing 7% 4% 5%services 6% 3% 4%
Regular full-time employment 5% 2% 4%Regular part-time employment 2% 1%Remittances 6% 3% 3%Other 5% 2% 12%Total 161% 100% 100%
Most important sourceIncome Sources
‘* Multiple responses allowed.Source: LIFT (2012), Tables 14-16.
Because of the pronounced seasonality of farm wage employment, landless households requireflexible supplementary income-earning activities to fill in during the slack agricultural seasons.
40
Small business activity such as small-scale trading, basket making and weaving provide primaryincome support for 15% of landless households, while another 11% depend primarily on fishing(Table 7).
In lowlands and along rivers, fisheries play an important role in income generation, as well asproviding a source of protein for household nutrition. According to an FAO study, fisheries(marine, inland and aquaculture) directly employ more than 3 million people, and some 12 to 15million people indirectly benefit from the fisheries and aquaculture sector (FAO 2005). For thelandless, fishing represents an important alternative employment which does not require largeland holdings. Fishery specialists as well as our own field visits suggest oligopolistic control offishing licenses, which prevent some landless from accessing this as an income source. In hillyareas and some upland areas, timber and non-timber forest products play an important role inincome generation (Htun Khin 2009).
Small livestock and poultry offer a part-time supplementary activity for many landless and nearlandless households.13 They, likewise, constitute a critical asset for landless households (Table4), providing a source of protein in the household diet, and are important assets that can bedrawn on in lean times.
Remittances are surely an important income source for some families since an estimated 7million Burmese live outside the country. One estimate from 2009 places Myanmar’s totalremittances at US$137 million (Ratha et al 2011), most of it transmitted from abroad through theinformal hundi 14system. Available evidence suggests that remittances provide an importantincome source for about 6% of rural households but only for 3% the landless (Table 7).
3.6.2. Inequality, Poverty and Food Insecurity
Extreme inequality of rural asset distribution constitutes a singular feature of Myanmar’sagricultural economy (see Tables 3 and 4). This asset inequality contributes to wide variation inincome levels, a skewed distribution of income and high rates of poverty. About one-fourth ofMyanmar’s population lives below the poverty line, although considerable differences arise byregion. In border areas, such as Chin State to the west and Shan State to the east, rural povertyrates surpass 50% (Figure 8). Because rural poverty rates (29%) exceed poverty rates in urbanareas (16%), rural areas account for over three-fourths of the country’s poor (IHLCA 2011).
Chronic malnutrition, as measured by stunting rates, affects about one-third of under-fivechildren and follows similar geographic patterns (Figure 9). A similar percentage of childrenunder five are classified as underweight (MICS 2010).
13 Note that the phrasing of the LIFT income question may have led some respondents to report only cash incomesources. If, as a result, these data under-report subsistence consumption, then in-kind livestock income (from homeconsumption of poultry, eggs and milk) may be under-stated by the figures in Table 7.14 The hundi system is an informal network of businesspeople who transfer money around the world. Myanmarmigrant workers regularly use this network to remit money back to their families. The system is built on trust, whichhas recently been called into question following a number of reported thefts (Aye Thidar Kyaw 2012).

41
Figure 8. Poverty Levels by State and Region, 2009/10
0
0.1
0.2
0.3
0.4
0.5
0.6
0.7
0.8
Rural Urban
Source: IHLCA 2011.
Figure 9. Stunting by State/Region, 2009/10
Source: Myanmar MICS 2009-2010.
Hunger, likewise, remains a persistent, unwanted companion of Myanmar’s poor. Poorhouseholds spend over 70% of their income on food, and fully one-third of rural householdsborrow at some point during the year to purchase food (IHLCS 2010, LIFT 2012). Indeed,among the poor, borrowing becomes a regular strategy for coping with seasonal hunger.Landless households spend nearly 60% of their borrowing on food purchases, while largelandowners spend nearly 90% on agricultural inputs and business investments (Table 8). In spite
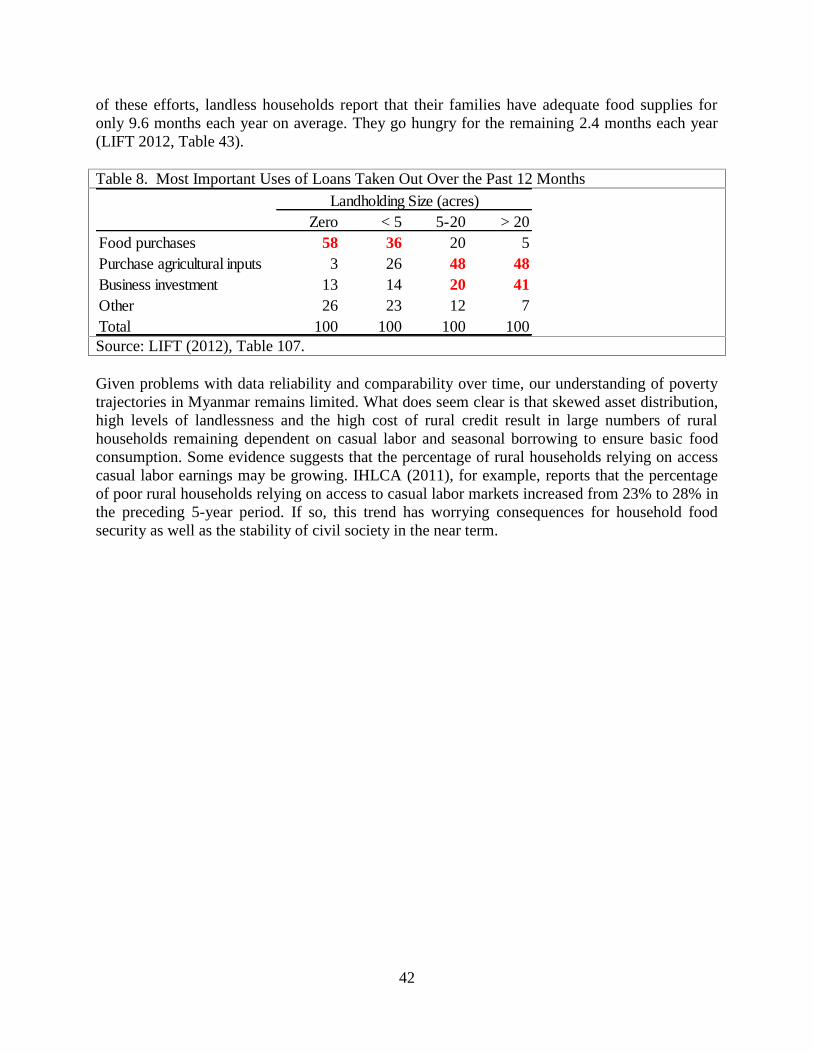
42
of these efforts, landless households report that their families have adequate food supplies foronly 9.6 months each year on average. They go hungry for the remaining 2.4 months each year(LIFT 2012, Table 43).
Table 8. Most Important Uses of Loans Taken Out Over the Past 12 Months
Zero < 5 5-20 > 20Food purchases 58 36 20 5Purchase agricultural inputs 3 26 48 48Business investment 13 14 20 41Other 26 23 12 7Total 100 100 100 100
Landholding Size (acres)
Source: LIFT (2012), Table 107.
Given problems with data reliability and comparability over time, our understanding of povertytrajectories in Myanmar remains limited. What does seem clear is that skewed asset distribution,high levels of landlessness and the high cost of rural credit result in large numbers of ruralhouseholds remaining dependent on casual labor and seasonal borrowing to ensure basic foodconsumption. Some evidence suggests that the percentage of rural households relying on accesscasual labor earnings may be growing. IHLCA (2011), for example, reports that the percentageof poor rural households relying on access to casual labor markets increased from 23% to 28% inthe preceding 5-year period. If so, this trend has worrying consequences for household foodsecurity as well as the stability of civil society in the near term.

43
4. FACTORS AFFECTING PERFORMANCE
4.1. Macro Policy
Independent estimates put GDP growth at 4.6% for the period 2002-2010, rising to exceed 5%toward the end of the period (IMF 2012). This upward trajectory is likely to continue as a resultof improved macro-economic management and wide-ranging reforms under way in Myanmar.Inflation has been brought down from a high of 30% to less than 5% over the last five years. Inthe past, heavy government borrowing in the absence of a corporate bond market has starved theprivate sector of loan access through commercial banks. Public debt remains high (47.6% ofGDP in 2010 according to the IMF) but fiscal deficits are being kept at 4%-6% of GDP (ADB2012).
Recent macro-economic reforms include a new market-determined floating exchange rate regimesince April 2012 and operational autonomy for the Central Bank of Myanmar (CBM) since July2012. Increased exports and foreign direct investment have led to a steady improvement inforeign exchange reserves to the point where they cover an estimated 9 months of imports. Keypriority areas for improvement in macro-economic management include tax revenue collection tofinance needed infrastructure, education and health service expenditures without incurringexcessive deficits, and expansion of the private banking sector to allow greater access tofinancial services by businesses and rural communities
Myanmar’s new foreign investment law and liberalized exchange rate system facilitates foreigndirect investment in all sectors of Myanmar’s economy, including agriculture and agribusiness.In addition, the new farmland law authorizes large-scale holdings as well as joint and majorityforeign ownership of farmland concessions, though land use remains subject to governmentsupervision and control. Lifting of economic sanctions against the country by the United States,the European Union and many bilateral donors has improved the investment prospects for thecountry.
Myanmar’s foreign exchange rate has strengthened in recent years, driven by exports of naturalresources, including gas, timber and jewels. From 1,300 Kyat per dollar in 2006, the currencyhas strengthened to 850 Kyat per dollar at the end of 2012. Exporters and traders we interviewedhighlighted this potential problem in Myanmar as particularly relevant for rice, pulse andhorticulture exporters. Looking forward, an influx of foreign investment and donor aid wouldtend to strengthen the Kyat further. In order to avoid the potential disincentive effects on farmexports, domestic prices and incomes, some central bankers and economists have suggested amanaged float (Dapice et al. 2012, Tate 2012). Clearly, exchange rate policy will play a powerfulrole in shaping agricultural incomes, incentives and competitiveness in the coming decades.
44
4.2. Rural Infrastructure
4.2.1. Transport infrastructure
Transportation and logistics cost are high in Myanmar as a result of many decades ofunderinvestment, heavy regulation and limited structures linking the water, road and railtransportation (Wong and Wai 2013). Currently, Myanmar ranks lowest in the ASEAN region inquality of logistics and transport-related infrastructure (ADB 2012).15 The country’s main riversoffer potentially cheap internal transport. Yet the management of intermodal connections, linkingwater transport, rail, road and air are not well developed. As a result, investments in an integratedintermodal logistics system would help agribusiness to overcome high transportation costs sothat Myanmar’s agribusiness trading networks becomes increasingly more competitive (Min andKudo 2012, Wong and Wai 2013). The recent ADB review has concluded that, “Investment inthe sector during the last 20 years has focused largely on major highways and new railways, withmuch less attention on operations and maintenance and improvements in lower level networks.A key challenge now is to improve the lower level networks and link them to the major networksto increase access for regional towns, local communities, and rural areas through lower transportcosts and wider service.” (ADB 2012, p.23). These investments require urgent attention sincethey will strongly influence Myanmar’s ability to maximize the potential benefits of increasingconnections with the region via overlapping regional organizations such as the Association ofSouth Eastern Nations (ASEAN), the Greater Mekong Subregion (GMS) and the Bay of BengalInitiative for Multi-Sectoral Technical and Economic Cooperation (BIMSTEC), as well asbilaterally with its immediate neighbors.
4.2.2. Telecommunications
Myanmar’s telephone system is the least developed in the ASEAN region and its electricalsystem ranks second to last, behind Cambodia. Internet access is likewise lowest in the regionwith only 0.2% of the population having access (ADB 2012). Moreover, “The internet in Burmaremains tightly controlled through state control of ISPs, state intervention through contentfiltering and various laws and regulations, and state-sanctioned surveillance.” (INI 2012, p.262).
Cell phone penetration varies geographically. Recent liberalization of cell phone access hassignificantly increased cell phone use in urban areas. In rural areas, however, only about 4% ofthe population has access to a cell phone (Ericsson 2012; LIFT 2012 Table 90). Our discussionswith potential cell phone investors suggest that network penetration could increase rapidly givenproper authorizations from state regulatory agencies. Evidence from outside Myanmar suggeststhat the potential gains to farm households and traders would be very significant in terms of farmprices received, market efficiency and integration, and reducing transaction and search costs inagricultural markets (Mital 2010, Akers 2012).
15 Among 155 countries worldwide, Myanmar ranks 129th in the World Bank’s logistics performance index and133rd in terms of quality of infrastructure (World Bank 2012).
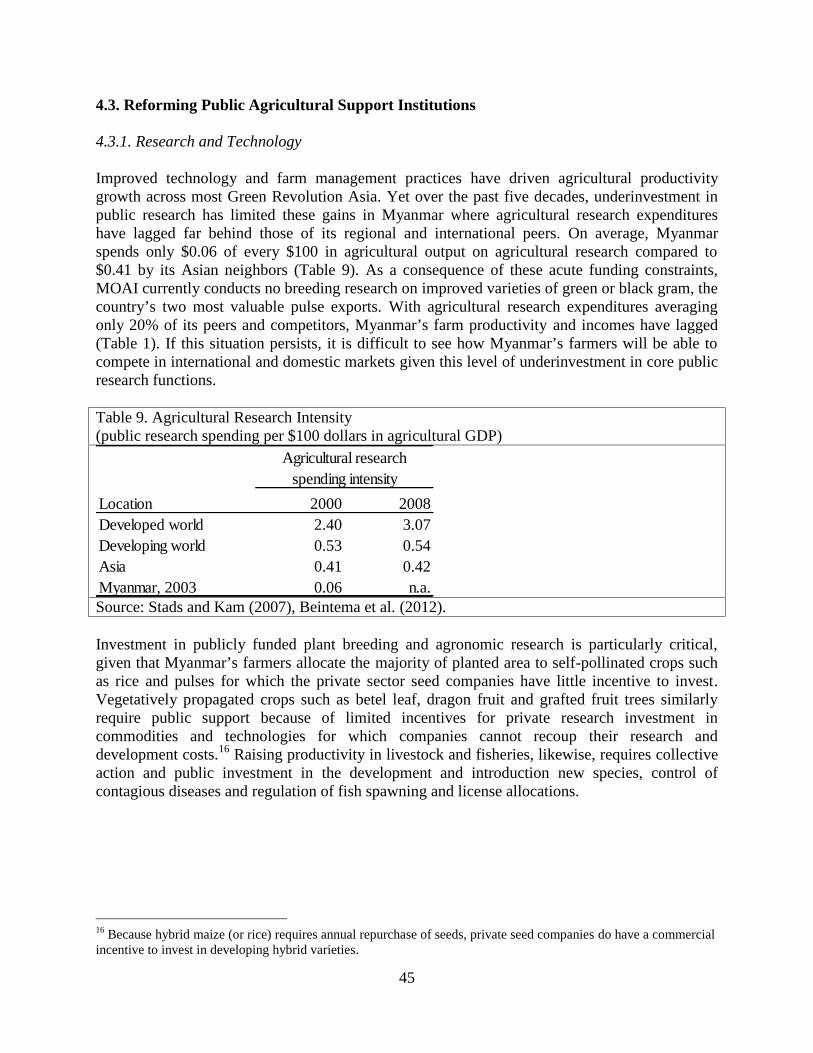
45
4.3. Reforming Public Agricultural Support Institutions
4.3.1. Research and Technology
Improved technology and farm management practices have driven agricultural productivitygrowth across most Green Revolution Asia. Yet over the past five decades, underinvestment inpublic research has limited these gains in Myanmar where agricultural research expenditureshave lagged far behind those of its regional and international peers. On average, Myanmarspends only $0.06 of every $100 in agricultural output on agricultural research compared to$0.41 by its Asian neighbors (Table 9). As a consequence of these acute funding constraints,MOAI currently conducts no breeding research on improved varieties of green or black gram, thecountry’s two most valuable pulse exports. With agricultural research expenditures averagingonly 20% of its peers and competitors, Myanmar’s farm productivity and incomes have lagged(Table 1). If this situation persists, it is difficult to see how Myanmar’s farmers will be able tocompete in international and domestic markets given this level of underinvestment in core publicresearch functions.
Table 9. Agricultural Research Intensity(public research spending per $100 dollars in agricultural GDP)
Location 2000 2008Developed world 2.40 3.07Developing world 0.53 0.54Asia 0.41 0.42Myanmar, 2003 0.06 n.a.
Agricultural researchspending intensity
Source: Stads and Kam (2007), Beintema et al. (2012).
Investment in publicly funded plant breeding and agronomic research is particularly critical,given that Myanmar’s farmers allocate the majority of planted area to self-pollinated crops suchas rice and pulses for which the private sector seed companies have little incentive to invest.Vegetatively propagated crops such as betel leaf, dragon fruit and grafted fruit trees similarlyrequire public support because of limited incentives for private research investment incommodities and technologies for which companies cannot recoup their research anddevelopment costs.16 Raising productivity in livestock and fisheries, likewise, requires collectiveaction and public investment in the development and introduction new species, control ofcontagious diseases and regulation of fish spawning and license allocations.
16 Because hybrid maize (or rice) requires annual repurchase of seeds, private seed companies do have a commercialincentive to invest in developing hybrid varieties.
46
4.3.2. Extension: The Key Link between Farmers and Researchers
A farmer-centered, service-oriented extension system provides the conduit through whichcommon farmer problems get identified and flagged for the attention of researchers so they canhelp farmers to solve practical problems that limit farm productivity.
Nonetheless, links between extension and research remain generally weak in Myanmar. “Ofparticular concern is the absence of operational interaction between staff of CARI’s outlyingresearch farms and staff of the extension services. Extension agents rarely come to the researchstations and researchers do not routinely visit extension offices or demonstration sites.” (FAO2005, p.112). Our interviews with stakeholders suggest that these links between extension andresearch still remain weak in 2012.
Links between extension officers and farmers are similarly limited. In part, extension staff findthemselves constrained by an acute shortage of transport and field allowances. In addition,institutional tendencies to instruct rather than listen to farmers have become embedded over twogenerations of command and control management of Myanmar’s agricultural sector.Consequently, “The strong extension force of MAS is mostly occupied with achievement ofcentral production targets for pillar crops and especially for rice. To have a more significantimpact on improving farm incomes, crop production and the alleviation of rural poverty theservice requires re-orientation within a new enabling environment for farm production.” (FAO2005, p.55). A more recent investigation in 2012 similarly finds that, “extension of agriculturaladvice is virtually non-existent with farmers depending heavily on each other, private suppliersof inputs and wholesale purchasers.” (Anderson Irrigation 2012, p.14). As a result of limitedtravel budgets and cutbacks in extension staff imposed on MOAI in 2006, many of the farmerswe met during our field visits had never encountered an extension agent.
Extension system reform thus becomes imperative (Maung 2008; Cho 2013). We believe that theadvice offered by the FAO in 2005 remains valid today. “The centrally planned approach thatrestricts choice, innovation and diversification should be transformed to a ‘farmer first approach’…Such transformation would require a sea change in the ethos and approach of concernedgovernment agencies …” (FAO 2005, p.7).
4.3.3. Molding Support Institutions for a Liberalized Policy Environment
Today Myanmar’s agricultural sector finds itself in the early stages of a gradual, partiallycompleted policy liberalization. The tight state controls on agricultural land ownership,production decisions, marketing and pricing, initiated during the socialist period in 1962,resulted in diminished incentives and generally poor agricultural performance for nearly threedecades. Following head of state Ne Win’s public acknowledgement of the failure of the“Burmese Way to Socialism” in 1987 and widespread protests in 1988, the military governmentbegan a process of gradual policy liberalization, first with the opening of pulse marketing andexports (Okamoto 2008). Beginning in 2003, the loosening of compulsory marketing quotas forpaddy and government withdrawal from rice markets opened considerable space for privatetraders and agribusinesses. Across a broad range of commodities, agricultural policyliberalization has begun, albeit slowly (Table 10).

47
Table 10. Evolution of Agricultural Policies in MyanmarPolicies
Time Period Land Rights Crop Production MarketingIndependence1948-1952
• private land ownership • farmer decides whatcrops to grow
• private traders marketagricultural commodities
1953-1961 Land Reform (1953)• state ownership of all land• state grants tillage rights• transfers illegal
Same as above Same as above
Socialist Period1962-1987 Same as above
• government mandatesfarmer cropping plans
• government monopoly ondomestic and exportmarketing for scheduled17
crops• compulsory procurementquota for scheduled crops:government purchase atfixed price
EarlyLiberalization1988-2002
Same as above
• informal land transfers dueto increased profitability ofderegulated crops
• formally, free croppingchoice• in practice, governmentenforces cropping plan forprocured crops (paddy,cotton, sugarcane)
• pulses trade liberalized• government markets andexports politically importantcrops: rice, cotton,sugarcane, sometimesoilseeds• compulsory procurementof above crops at reducedquota
Adjustments2003-2007
Same as above • in practice, governmentenforces cropping plan forpaddy
• compulsory paddyprocurement abandoned• government withdrawsfrom rice exporting, endsration channel distributionand allows private riceexports
2008-2009Same as above Same as above
• Rice SpecializationCompanies (RSC) grantedexport licenses in return forcontract farming anddeveloping supply chains
Political Reforms2011-present
Farmland Law (2012)Virgin and Fallow Land Law(2012)Same as before:• state ownership of all land• state grants tillage rightsNew provisions:• transfers and mortgageslegalized• farmers contest landconfiscations in court
Same as above
• From 2011, any registeredtrader with certified stocklevel and facilities can applyfor a rice export license• RSCs lose preferredaccess to export permits.
Source: FAO (2005), Okamoto (2008), Wong and Wai (2013)
17 Scheduled crops included all major crops: paddy, pulses, oilseeds, cotton, sugar, maize.

48
Yet the institutions supporting agricultural growth have reformed more slowly. Despite manypolicy reforms, the key government institutions supporting agriculture still retain staffingstructures embedded in the old system of state controls. Under the socialist system, Myanmar’smilitary government imposed strict land allocation targets and production quotas, fixed purchaseprices and monopolized processing. Still today, the Department of Settlement and Land Records– the MOAI department that performs this monitoring and control at village level – retainsdepartment-level status along with a large block of manpower in the Ministry of Agriculture andIrrigation. Even under the new Farmland Law of 2012, bylaws state that, “the regional farmlandmanagement committee shall have constant supervision of any changes in crop cultivation”.18
At the same time, limited staffing and budgets prevent extension officers from regularlyinteracting with farmers and research system from listening to farmer production problems insetting research agendas. In 2006, MOAI lost 3,000 extension positions, further weakeningextension system capacity.19 A recent review of agricultural and extensions services in the DryZone summarizes the situation as follows, “The methodology of the farm advisory services hasbeen developed out of the command economy with the weaknesses that derive from this top-down delivery approach with limited participatory contact with their target group, the farmers.”(Anderson Irrigation 2012, p.16). 20
In general, the structure, staffing and incentives of key public support institutions have notchanged to reflect the public goods and services needed to support a liberalized agriculturalsector. With the integration of the Myanmar Agricultural Service (MAS) into MOAI, an initialrestructuring of Myanmar’s various research and extension services began around 2005. Morerecently, in 2012, the MOAI enunciated an agenda of topics for institutional reform goingforward (Cho 2013). The success of these efforts will be critical in order to restructureMyanmar’s line agricultural ministries in ways that enable them to provide key public goods andservices that enable farmers to improve their productivity and competitiveness in an increasinglyliberalized agricultural policy environment.
18 Section 12.f of the Farmland Law of August 2012 states that “farmland shall not be worked without permission ofthe relevant farmland management committee.” The statute continues, in section 12.f, to say that “farmland isprohibited for growing other than regular crops without permission.” Amplifying these requirements, the bylawsstate that, “the regional farmland management committee shall have constant supervision of any changes in cropcultivation.” (Farmland Bylaws, Chapter 9, para 69)19 Under new staffing guidelines, MOAI aims to partially recover these personnel losses through the hiring of 700 to1,000 new extension officers in 2013.20 The review continues as follows, “This would indicate that an appreciation of the modern techniques ofcommunicating effectively with farmers is lacking. Model farms and MAS demonstration sites are seen throughoutthe areas visited, but what is most noticeable is the lack of implementation of ideas and practices onto the immediateneighbouring farms. Discussions revealed that research and farm extension messages are focused largely onincreased production of individual crops, with the use of correct techniques and inputs that are often beyond theresources of the disadvantaged farmers. Most extension messages are conceived centrally and are passed down withlimited adapted testing, feedback or adaptation. Advice on the full range of crops that are actually being grown islacking as well as the availability of many of inputs, including quality seeds, and access to seasonal credit.Marketing and farm economics advice are largely absent from advisory messages. It is widely recognised, not leastby MOAI itself, that research and farm advisory services are unable to respond effectively to the current needs offarmers, and are certainly not equipped to support the type of farming systems that exist on many of the PIPs.Within MOAI alternative approaches are taking place, such as with MICDE providing support to cotton, but this hasyet to be effectively realised in the support provided to the PIPs.” (Anderson Irrigation 2012, p.16).
49
4.4. Private Sector Agricultural Institutions
Private sector traders and agribusinesses are well-organized in a series of professionalorganizations within the Union of Myanmar Federation of Chambers of Commerce and Industry(UMFCCI). With government encouragement, and sometimes direct enabling legislation, ricemillers and traders, pulse and oilseed traders, onion traders, poultry producers and fruit exportershave all formed professional organizations. Our interviews suggest that women play anespecially active role in horticulture and livestock associations, though they appear lessprominent on paddy, pulses and oilseeds. As part of their professional responsibilities, thevarious trade groups help to organize and manage wholesale markets in key assembly regionsand in final consumer markets such as Yangon and Mandalay. These organizations serve asofficial conduits between private sector agribusinesses and government. Some observers fearthey also provide forums for collusion. Others maintain that these trade associations serve as avehicle for government monitoring and tacit control. While either or both of these views mayhouse elements of truth, our interviews also suggest that the organizations are highly professionaland active in promoting growth of their various industries.
In contrast, farmers are not well organized. Apart from formal government-sponsoredcooperatives, we were struck during our field visits at the paucity of farmer-initiated andorganized groups. Some of the respondents we asked went so far as to say that farmer-initiatedorganizations were illegal in Myanmar until a series of recent constitutional and legal changeswere introduced, over the past two years, permitting freedom of assembly and labororganizations. Indeed, during previous regimes legislation specifically banned unauthorizedgatherings of more than five individuals.21 Formation and membership in labor organizationswas also previously illegal under a number of laws passed by successive Myanmargovernments.22 As a result, farmers did not in practice organize outside of government-sponsored cooperatives established to ensure commodity distribution23 and to regulate andsupervise collective activities24. Instead, the multiple prior decades of tight restrictions on farmergatherings and organization have resulted in a dearth of farmer-initiated collective ventures and adeficit of organizational skills.
21 Article 144 of the Penal Code bans groups of 5 people gathering together. SLORC Order No. 2 (1988) bans publicgatherings on the streets of five or more people and Directive 2/2010, issued on 23 June 2010, prohibits publicprocessions and marching. Although these laws have not been expressly repealed, there is now new legislationwhich permits public assembly with certain restrictions (as further outlined below).22 These include the SLORC Law No. 6 (1988) on the Law relating to the Formation of Organizations, The UnlawfulAssociations Act (1908), Emergency Provisions Act (1950), Printer and Publisher Registration (1962), StateProtection Law (1975).23 According to the official ministry description, “The Ministry of Cooperatives was first formed as the Ministry ofState Cooperative and Commodity Distribution on 5th April, 1951. On 26th March, 1962, it was united with theMinistry of Civil Supply Services and was named as the Ministry of Civil Supply and Cooperatives. On 18th June1965, it was established as a separate Ministry by the name of the Ministry of Cooperatives.”24 The Ministry of Cooperatives’ official statement of its functions indicates, for example, that “another mainfunction of the Department is that it is empowered to advise and supervise the economic activities of the cooperativesocieties and keep them to be in line with the Government policy.”

50
Several recent legal enactments now make farmer-initiated gatherings and organizationspossible.25 The new Constitution of Myanmar, approved by national referendum in 2008, becameoperational on 31 January 2011 when the first session of the elected national parliament wasconvened, although steps to implement the new state structures and governance system providedfor under the Constitution began in 2010.26 This new constitution provides every citizen ofMyanmar the right to assemble and form associations under section 354, Chapter VIII. Inaddition, Article 38 of the new Farmland Law specifically allows for the formation of farmergroups. Related legislation also protects the rights of assembly and labor organization. Thesenewly promulgated freedoms open up opportunities for farmers to initiate collective ventures inareas such as private irrigation development and water management, input procurement andmarketing.
4.5. Markets
4.5.1. Land Markets and Tenure Security
Under the Land Nationalization Law of 1953, all land became the property of the state, andprivate land ownership and transfers were formally illegal. Nonetheless, land actively traded inrural Myanmar during the socialist era. During our field visits, villagers readily discussed thepractice of land sales, though many indicated that these transfers were not recorded officially. Inmost villages we visited, farmers could readily cite purchase prices for various categories ofland.27 From the 1960’s through the 1980’s, government land ownership and the annualawarding of tillage rights was closely linked to production quotas for various scheduled crops.28
As crop planning controls gradually loosened over the past decade, informal land transactionsappear to have increased.
The new Farmland Law, passed in the summer of 2012, permits the transfer and mortgaging ofland tillage rights while at the same time retaining state ownership and control of all agriculturalland. Households as well as private investors can now purchase tillage rights under the new law,though these remain subject to government control over production decisions. Although thenewly modified legal system for transferring and mortgaging land offers prospects for relieving
25 This right, however, is not absolute, it being subject to laws enacted to ensure national security, law and order,community peace, public order and morality. The Law Relating to Peaceful Assembly and Peaceful Procession (ThePyidaungsu Hluttaw Law No. 15 of 2011) and the Decree on the Right to Peaceful Assembly and PeacefulProcession also came into effect in 2012 setting out a regime for holding public assemblies with prior approval ofthe authorities. Moreover, the Labour Organization Law (The Pyidaungsu Hluttaw Law No. 7/2011) was passed in2011 permitting the formation of labor organizations and allows workers to join such organizations. The law appliesto "workers," which include those engaged in agriculture, and prescribes the categories of labor organizations thatcan be established.26 The establishment of administrative regions, as provided for in the Constitution, began in August 2010.Parliamentary elections took place later that year, in November 2010.27 During our visits in October and November 2012, respondents cited land purchase prices on the order of 1.5million Kyat per acre ($1,800) for irrigated paddy land, 600,000 Kyat per acre ($700) for rainfed lowland farms and450,000 Kyat per acre for rainfed upland ($700). In contrast, serviced industrial land in Yangon sold for around$450,000 per acre, quadruple the level prevailing two years ago.28 “Tillage rights were systematically linked with the compulsory delivery system as well as the planned cropping.If either the quotas or production obligations were not fulfilled, farmers were threatened with losing their annualtillage rights (Okamato 2008, p.17).

51
credit constraints for landholding households, state ownership and production controls remain aconcern. As one recent review of this new legislation notes, “Under the new laws, farmers stilllack land tenure security and are subject to the government’s crop prescriptions and productionquotas. In contrast, in Vietnam the granting of more clearly defined land use rights in the 1980swas critical to boosting farm productivity and transforming the country into one of the world’stop exporters of rice, coffee, pepper, and cashews in less than two decades.” (Hiebert andNguyen 2012, p.1).
Companion legislation, the Vacant, Fallow and Virgin Lands Management (VFVLM) Law of2012, authorizes allocation of large concessions of 5,000 to 50,000 acres on lands deemed by thestate to be vacant or unutilized. Because shifting cultivation or harvesting of forest products maytake place on these parcels, the VFLM has led to regular evictions and growing litigation(Oberdorf 2012, LCWG 2012, Woods 2013).
4.5.2. Financial Markets
Myanmar’s financial sector and banking system are small and underdeveloped. Only about 10%of the population has access to formal financial services, with a much lower ratio in rural areas.Currently, four state-owned banks, seven semi-government and local government-owned banksand twelve private banks operate, some of them quite recently created at the request of GOM.Foreign banks are at present not allowed to operate in Myanmar or to engage in joint ventureswith local banks. However, major regional banks have already set up representative offices witha view towards engaging in banking services once foreign ownership of financial institutions isallowed. In addition, a number of microfinance institutions have begun to operate in Myanmar.Most of them are small, NGO-run and supported by donors. The larger ones, especially thoseinitiated by UNDP and supported by PACT, have the potential to develop into significantsustainable, possibly even nation-wide institutions. The International Finance Corporation (IFC)recently approved an investment in Cambodia’s Acleda Bank, a successful microfinance bankwhich will set up in Myanmar in 2013.
Myanmar’s formal rural financial sector is even less developed, and access to agriculturalproduction credit from formal sources is nearly non-existent. Larger trading companies andprocessors report having access to credit through bank branches of commercial banks intownship centers. However, formal credit is not sufficiently available to farmers, particularlysmallholder farmers. While the agricultural sector in Myanmar represents 36% of GDP andemploys about two thirds of the population, only about 2.5% of all outstanding loans are made tothis sector. The Myanmar Agriculture Development Bank (MADB), a department of the Ministryof Agriculture and Irrigation, is the only major financial institution operating in the rural space.MADB is the second largest financial institution in Myanmar by branches (205) and the largestby assets and loans. Until very recently MADB lent a maximum of 50,000 Kyats per acre forpaddy production, limited to ten acres per farmer. At these levels, it covers about 25-50% of theoverall financing needs per acre at an interest rate of 8% per annum. Farmers finance the balanceof their credit needs through informal loans carrying an interest rate between 5 to 10% permonth.

52
In an effort to improve farm input credit, the government instituted a system of RiceSpecialization Companies (RSC) in 2008 under which registered firms were encouraged toprovide paddy inputs on credit under contract farming schemes in return for rice export permits.Although 57 rice specialized companies have registered, many face difficulties in running viablecontract farming schemes for paddy (Box 4). Due to the heavy cost of input financing and poorrepayment rates resulting from crop losses, flooding and low paddy prices, only a handful ofRSCs continued contract farming in Monsoon crop of 2012 (Wong and Wai 2013).
Box 4. Scope and Limits of Contract FarmingContract farming appeals to small farmers, governments and donors in settings where weak credit systemsand poor input markets make it difficult for small farmers to access productivity-enhancing inputs andhigh-value markets on their own. Contract farming appeals to agribusinesses in settings where smallproducers are the most efficient category of producer and where limited local market outlets compelcontract growers to sell to their agribusiness contractors (Table B3). Because agribusiness contractorsdeliver inputs on credit, and sometimes extension support and quality control diagnostics as well, theyincur costs in supporting their contract farmers. They must recover these lending and technical supportcosts, typically by deducting the interest and other costs from farmer revenue at sales time. In situationswhere many alternative market outlets exist, famers can frequently obtain higher prices from buyers whohave not incurred input supply, credit and extension support costs. As a result, side selling and poachingfrequently sound the commercial death knell for contract farming schemes. Lessons from outside ofMyanmar suggest several emerging lessons.
Table B3. Conditions Favoring Contract FarmingCommodity characteristics Enabling Environment
Farmer incentives • high input costs• specialized large-scaleprocessing required prior toconsumption
• weak credit systems• weak input markets• strong farmer organizations andbargaining power
Agribusiness incentives • limited market outlets (orexport crops)• small farmers most efficientproducers• quality control and certificationrequires tracking
• strong legal systems for contractenforcement
For basic food staples, contract farming rarely proves viable. Maize, ordinary rice, sorghum and localvegetables, for example, “almost never lend themselves to contract farming” because contractors whofinance inputs cannot recover their costs (Tschirley, Minde and Boughton 2009, p.3). In these situations,rampant side-selling forces high-service contractors out of business very quickly. Specialty grains – suchas barley for local breweries or high-value rice varieties for niche export markets – can work undercontract farming, as can exotic horticulture products, particularly for export markets that require foodsafety and traceability certification in order to claim premium prices. Currently, contract farming formaize seed production operates profitably in Myanmar, in large part because the contracting companypays hybrid seed growers triple the market price for ordinary maize, providing farmers strong financialincentives to sell the seed they produce to the company proving input credit and extension support. Purelyexport crops, like cotton, also work well under contract farming because of a limited local market outletsand smallholder advantages in production.
In Myanmar, stakeholders we met frequently proposed contract farming as a solution to weak rural creditsystems and weak input markets. While contract farming schemes can work well for highly specialized,high value export commodities, they are unlikely to prove commercially sustainable for low-valuecommodities with broad market outlets, such as ordinary rice. Hence the heavy losses incurred byMyanmar’s rice specialized companies under their contract farming schemes are not surprising.Source: Tschirley, Minde and Boughton (2009).

53
4.5.3. Agricultural Markets
Two general lessons emerge from Myanmar’s recent experience with agricultural marketliberalization. First, the removal of government production restrictions, price controls andmandatory procurement has generally boosted performance by improving incentives for farmersand traders. Pulses, the earliest and most fully liberalized crops, have performed best over thepast two decades. Similarly, non-political commodities such as horticulture and poultry, whichthe government has never marketed, have out-performed most others. Maize, liberalized fullyand early on, has likewise performed well in recent decades (Table 6).
Second, government continues to play an important regulatory role in even the most fullydecontrolled markets. In poultry and livestock markets, government veterinarians monitor foodsafety of day-old-chick supplies and at slaughterhouses. Given recent outbreaks of avianinfluenza, this food safety and public health role is crucial. Major urban wholesale marketsoperate in zones specially designated and managed by the Yangon City Development Council(YCDC) to improve market integration, ensure traffic flows, minimize losses and permit thedelivery of specialized inspection and marketing services. Market liberalization does not implyno role for government but rather a new role for government in supporting and regulatingagricultural markets.
4.6. Climate Change and Variability
Farmers we spoke with in Myanmar frequently mentioned extreme weather events theyincreasingly face. When we enquired about normal production practices, they noted that normalpatterns were becoming increasingly difficult to predict, with drought one year and flooding thenext.
Indeed, most formal assessments suggest that climate change will affect Myanmar significantly.Major expected changes include rising temperatures, higher rainfall and a possibly a shorterrainy season, which in combination will contribute to considerable increase in flooding. Risingsea levels along the coast are likely to compound these problems by aggravating salt waterintrusion and soil salinity in the coastal areas and river deltas. By the end of the century, climatestudies project that mean temperatures will rise between 1 and 4 degrees in Myanmar, thoughoutcomes will vary throughout the year and spatially across the country (see RIMES 2011 andWorld Bank 2012). Average maximum temperatures are likely to increase as well.
The climate studies project that average rainfall will increase by around 10% over the comingdecades, particularly in the monsoon season. Combined with a continued shortening of the rainyseason, observed over the past 40 years, many climatologists expect greater concentration andvariability in rainfall will lead to increased frequency and intensity of flooding (MOAI 2010,RIMES 2011, World Bank 2012). Other studies, however, highlight potentially conflictinginformation about rainfall totals and extremes, suggests that there may have been no significanttrends over recent decades (RIMES, 2011). One recent study anticipates that the rainy seasonwill lengthen leading to increased periods of drought (Wang et al. 2013). Together with expectedincreases in sea level, the changes under way place Myanmar among the most vulnerable
54
countries globally in projected changes in extreme weather, agricultural productivity loss and sealevel rise (Wheeler, 2011).
The considerable risks faced by Myanmar’s farmers in the past are likely to increase goingforward. In order to improve monitoring and forecasting capacity, the Department ofMeteorology and Hydrology has developed a proposal for UNDP’s Adaptation Fund (UNDP2011). Looking forward, one critical component of an effective program of public investments inthe agricultural sector will revolve around development of strong water management systems,including irrigation and drainage, as well as improved capacity to monitor and forecast weatherpatterns.
4.7. Factors Affecting Vulnerability
4.7.1. Who are the vulnerable?
The groups most vulnerable to food insecurity in Myanmar include landless and near landlesshouseholds, ethnic minorities, women (especially mothers), and young children.
Landless and Near Landless. Lack of access to land is clearly a key source of vulnerability tofood insecurity. Available evidence also suggests a strong correlation between landlessness andpoverty. Poor households hold significantly smaller landholdings than nonpoor (IHLCA 2011,Table 18). Likewise, rates of landlessness are much higher among the poor than the nonpoor.Among the poorest decile of households, 38% are landless. This contrasts with landless rates ofonly 7% among the richest decile of households (IHLCA 2011, Table 21). As a result of lowerincomes and higher poverty rates, landless households are more likely than large landholders togo hungry and to borrow for food purchases (see Table 8 and LIFT (2012), Tables 43 and 107).In addition, because land serves as collateral in widespread informal lending contracts, landlesshouseholds typically have less access to credit. Debt loads among landholders owning over 20acres of land average 750,000 Kyat, roughly four times the level borrowed by landless (seeAnnex Table C9).
Ethnic Minorities. Myanmar’s rich ethnic tapestry has played a crucial role in the nation’shistory and in many of its current crises. Not surprisingly, ethnicity correlates strongly withpoverty and food insecurity for a complex set of reasons (Figure 8). The lands on which ethnicgroups reside are among the most resource rich areas in the country. The major deposits of oil,jade and precious gems, hardwoods, and some of the richest soil for horticulture all lie withinareas dominated by ethnic minorities. As the military and favored corporations have sought toobtain and retain access to these resources, conflicts have taken on economic undertones. This ismost prevalent in specific industries, including logging, mining, hydroelectricity and large scaleagricultural schemes, according to studies and news articles (Woods 2013). Thus, ethnicityappears tied to vulnerability insomuch as the ancestral lands of ethnic minorities containresources that other groups want.29
29 The non-profit Stimson Group has produced an interactive map illustrating where ethnic minorities reside overlaidwith major infrastructure projects. See http://www.stimson.org/programs/myanmar-map/

55
Gender Dimensions of Vulnerability. The relationship between gender and vulnerability is animportant issue, but especially difficult to untangle in Myanmar. Women enjoy a number ofrights which distinguish Myanmar from many other developing countries. Women have the samerights as men to own property, and to equal inheritance. Cultural practices, at least among themajority Burmans, suggest that women enjoy more equality than some of their peers in otherdeveloping countries. For example, women do not change their names upon marriage; neithermen nor women wear wedding rings or other outward symbols of marriage; there is noequivalent for the word “Mrs.” (or a married “Mr.” for that matter) in the Burmese language; andmarriage does not require a change of residence for the woman. Indeed, it is equally acceptablefor newlyweds to live with the bride’s parents, the groom’s parents, or on their own. This kinshippractice has important implication for infant and young child feeding, since there is no onedominant figure (mother or mother-in-law, for example) providing advice to young mothersabout feeding practices. Myanmar has also achieved parity of enrollment of girls and boys inboth primary and secondary education (UNFPA 2010). For educated, urban women, theirsocioeconomic status concerning home chores, private business, and joint-decision making, isreportedly almost equal to that of men. Rural women and ethnic minorities, however, do notappear to enjoy this same level of status.
National poverty data suggest that female-headed households account for just over 20% of allhouseholds and that they are less likely to be poor than are male-headed households (ILHCA2011). The ILHCA team hypothesizes that lower poverty rates among female-headed householdsmay result from high levels of remittance income received by female-headed households or thatonly better-off women can afford to form independent households, while the less affluent insteadbecome absorbed as dependents living with relatives following a divorce or the death of theirhusband (IHLCA 2011, p.34).
Despite legal and cultural practices that encourage gender equality, certain existing gender rolesplace women in relatively more vulnerable positions. Women have primary responsibility forhome and care of children, while still participating in the labor force, often even duringpregnancy and nursing of young children. This dual responsibility places women, especiallywomen of child-bearing years, in danger of poor health and nutrition outcomes, especiallyamong landless who rely on daily labor whenever it is available, the burden of childbearing putswomen and their young children at particular risk.
4.7.2. Shocks Affecting Vulnerability
The key shocks affecting vulnerability and food security include:
• changes in employment and wage rates,• illness and death of working family members,• price volatility of staple foods, which account for 70% of their spending,• natural disaster including seasonal floods and droughts which are likely to worsen with climatechange,• loss of access to land,• animal diseases and• conflict.

56
Many of the key shocks that increase vulnerability to food security do so via loss of productiveassets, including both physical and human capital, either through indebtedness, confiscation,physical loss of assets, or depletion of assets as a coping strategy.
Table 11 below summarizes the key sources of vulnerability for landless and smallholder farmersacross different zones in Myanmar. Many sources of vulnerability – including lack of access toaffordable financial services, climate change and natural disasters – cut across agro-eco zones,and affect both the landless and poorest farmers. Others are unique to particular zones, forexample, the seasonal water shortages that many households in the Dry Zone face. Activeconflict and displacement continues to occur in two of the seven ethnic states and in the other 5ethnic states, an uneasy ceasefire is in place and further trust building is underway after 60 yearsof civil war and anti-government violence.
Table 11. Key Sources of Household VulnerabilityDelta/Coastal Dry Zone Hilly
Farmers Landless Farmers Landless Farmers Landless price volatility lack of access to
affordablefinancialservices
sudden loss ofaccess to land
disease climate change natural disaster conflict/ displacement
un(der)-employment
lack of access toaffordablefinancial services
disease climate change natural disaster conflict/ displacement
price volatility seasonal water
shortage lack of access to
affordablefinancial services
sudden loss ofaccess to land
disease climate change
un(der)-employment
lack of access toaffordable financialservices
seasonal watershortage
disease climate change
lack of access toaffordablefinancial services
disease sudden loss of
access to land conflict/ displacement price volatility
un(der)-employment
lack of access toaffordable financialservices
disease conflict/ displacement
Source: Wilson and Wai (2013).
4.7.3. Options Available to Rural Households
Landless. Landless and near landless rural households constitute the largest single populationgroup in Myanmar and one of its most vulnerable. As demographic pressure increases, theirnumbers will in all likelihood continue to grow over time.
For adults trying to support their families in rural areas without tillage rights to farmland,livelihood options revolve around some mix of the following four strategies:• daily wage labor,• high value agricultural activities requiring minimal land (horticulture, poultry, fisheries),• nonfarm businesses (such as basket making, weaving and small shops) and• migration, both temporary and long-term.
Currently, daily wage labor dominates choices of the rural landless (Table 7). Yet prospects forfuture prosperity appear greater along the other three pathways.
57
Looking forward, policy makers must ask what the future holds for the children of today’slandless households. For landless children, investments in their education and nutritional welfarewill be critical to building the human capital necessary for them to launch remunerative nonfarmcareers as skilled rural artisans, professionals, employees or small business owners.
Smallholder Farms. Rural households owning 5 acres or more of farmland can aspire to supporttheir family through commercial smallholder agriculture. But in order to do so, they will need tosignificantly improve productivity, market predictability and reduce risk. For farm householdswith fewer than 5 acres of land, a move to high-value crops, livestock and fish farming offers themost ready means of raising productivity and welfare (Figure 10). Risk reduction will requirehousehold as well as system-level investments in diversification and water control to manageincreasingly unpredictable swings in seasonal rains and drought.
Some of the children growing up on small farms will continue in farming as a career. To besuccessful, they will require a quality rural education that equips them to become the modern,highly productive small farmers and agribusiness managers of tomorrow. Over time, asdemographic pressure erodes family land holdings, other children from these households willneed to learn skills that propel them into viable nonfarm or agribusiness careers. For thosetransitioning out of agriculture, investments in rural education and nutrition will be central toassuring their long-term productivity and welfare.

58
Figure 10. Returns to Alternate Agricultural Enterprises, 2012 (Kyat per acre)30
Sources. Field interviews, 2012.
Large-scale Agribusiness Farming. Over the past decade, the Government of Myanmar hasallocated nearly 2 million acres of land in large concessions to local agribusiness companies,many with strong ties to the military (Woods 2013; Annex Table C6). Some of the largeconcessions have proven commercially successful as farming businesses. Other concessionairesappear to have limited interest in farming and instead gain land rights in order to enable mineralextraction, lumbering or land rental to smallholder sharecroppers. These large land allocationshave attracted considerable scrutiny as well as litigation. Under the new Peaceful Protest Law of2011, farmers have engaged lawyers to press their claims (LCG 2012). In July 2012, Parliamentset up a formal parliamentary commission to investigate land confiscations.
For some categories of commercial agriculture and agribusiness, large concessions offer a viablemodel for meeting the stringent quantity, timing and quality demands of high-value products andniche export markets. However, these large holdings do not offer a feasible exit for the vastmajority of Myanmar’s landless poor, given common tendencies to mechanize large-scaleoperations. In practice, overly rapid mechanization on large farms risks displacing labor and
30 Profitability varies considerably across farmers, locations and seasons. Nonetheless, several studies haveconcluded that paddy production is often less profitable than other crops, particularly when compared to high-valuehorticulture crops. Dapice et al. (2009) conclude that paddy production was unprofitable in 2009. Anderson (2012,Annex E) finds that in dry land conditions paddy is generally the least profitable crop in both the monsoon andsummer seasons. FAO (2005, pp.119-127) reports that paddy generates per acre returns comparable to pulses andoilseeds, while groundnuts are roughly twice as profitable and onions and garlic five times more profitable per acrethan paddy.
59
thereby depressing rural wage rates, thus further constraining the short-term survival strategies ofthe rural landless. Under most crops and agro-ecological conditions in Myanmar, smallholderfarmers offer significant potential for productivity growth, increased competitiveness andexpanded employment for landless households (Box 5).
Box 5. Small Farms and Large Farms: Efficiency and Equity Implications of AgriculturalGrowthAlternate models. The Government of Myanmar faces important policy choices in the agricultural sector, inparticular whether to focus public resources on the smallholder sector or large-scale commercial farming. This is apolicy question on which much can be learned from the development experience of other countries in the region andaround the world. Many land-constrained Asian countries – including India, China, South Korea, Japan, Vietnam,Bangladesh and the Philippines – have focused their agricultural development strategies on small-farmer-led growth.Others, including Laos and Cambodia, have followed a mixed strategy that promotes large-scale private agribusinessinvestment alongside local small farms. At the other end of the spectrum, land-abundant Brazil has centered itsagricultural growth strategy on highly mechanized, large-scale farms. Over the past three decades, these large farmshave successfully turned Brazil into a highly competitive exporter of soybeans, sugar and meat. Which of thesestrategies will best suit Myanmar? Available evidence on the efficiency and equity implications of alternateagricultural growth strategies can help to answer to this question.
Small farms. Empirical evidence generally suggests that small farms achieve higher land and labor productivity thanlarge farms. Smallholders can achieve this high productivity for two reasons. First, smallholders’ productivityadvantage stems from their widespread use of highly motivated family labor and the ability of family farmers tocarefully supervise hired labor. Large farms, in contrast, typically face lower borrowing costs and hence are betterable to finance equipment and inputs. As a result, smallholder farms generally dominate in early stages ofdevelopment in locations where equipment is expensive and land scarce. Large farms, in contrast, perform better inlater developing countries in with high labor costs and surplus land.
Second, many farm technologies are scale-neutral. The Green Revolution packages of improved seeds and fertilizercan be applied with equal effect on farms of 1 acre or 1,000 acres. Bulk purchasing by large farms, which leads tolower input costs, can be offset by farmer organizations and collective action. The combination of improvedtechnology and good labor management leads to high productivity achievement by smallholders. “The record on thesuperiority of smallholder farming as a form of organization is striking. Many countries have tried to promote large-scale farming believing that smallholder farming is inefficient, backward and resistant to change. The results wereunimpressive and sometimes disastrous.” (World Bank 2007, p.91).
The poverty impact of smallholder farming is also typically greater than from mechanized large farms, whichinstead tend to displace labor. Rapid reductions in poverty following Green Revolutions in India and China aregenerally attributed to small farmer led agricultural growth. More generally, Lipton concludes that, “There arevirtually no examples of mass poverty reduction since 1700 that did not start with a sharp rise in employment andself-employment due to higher productivity on small family farms.” (Lipton 2005, p.9).
Large farms. Large farms are more competitive than small farms in situations where land is plentiful and labor isscarce (like Brazil), where economies of scale in processing lead to high minimum investment costs (as withplantation crops such as palm oil, rubber and sugar cane), where bulky or perishable products require quickprocessing (like tea and sugar cane) or where highly demanding quality and food safety standards (as in exporthorticulture and floriculture). Moreover, large farms offer benefits in mobilizing private investment in agriculture,facilitating international technology transfer and developing new markets. Mixed models frequently emerge withplantation crops (such as rubber, palm oil, sugar cane and tea), where large agroprocessors with core plantationfarms make initial investments, which smallholder can later supply through outgrower schemes.
On the negative side of the ledger, large farms typically generate an unequal distribution of income. Hence theirgenerally poor record of poverty reduction. Likewise subsidies for large farms, through concessional finance, forexample, risk leading to premature mechanization and displacement of labor.

60
Growth linkages. In irrigated Asian agriculture, every dollar in direct farm income generates roughly an additional60 cents in indirect income because of farmer spending on local goods, services and inputs. These growth linkagesdiffer substantially between large and small farms. While large farms purchase more equipment, repair services andinputs, small farms spend more on local consumption goods and services. Because consumption linkages (spendingon consumer goods and services) dominate growth linkages, small farms generate large local income multipliers.These indirect gains from agricultural growth tend to be large and hence small farm led growth has greater directand indirect poverty reduction impacts.
Implications for Myanmar. Myanmar requires an agricultural strategy that will generate rapid income growth as wellas broad-based poverty reduction. Small and large farms each have a role to play in promoting efficient, rapidincome growth. Given Myanmar’s current high levels of landlessness and rural poverty, concerted efforts topromote broad-based small farmer growth offers the likeliest source of broad-based rural poverty reduction,especially in the short term and medium term.
References: Deninger and Byerlee (2012), Haggblade, Hazell and Dorosh (2007), Lipton ( 2005), World Bank(2007).

61
5. FUTURE TRAJECTORIES
5.1. Three Alternative Pathways for Myanmar’s Agriculture
Looking forward, we see three alternative pathways for Myanmar’s agricultural sector (Figure 1,repeated below). Under a Business as Usual scenario, Myanmar’s agriculture will continue alongits current low-productivity, highly volatile trajectory. But Myanmar can do better - even withinthe country’s current considerable policy, institutional and structural constraints. And under avigorous program of policy and structural reforms, Myanmar’s agricultural sector can acceleraterapidly. Key decisions by the GOM, its supporters and stakeholders will determine which ofthese three pathways the country’s farmers will travel.
Figure1. Strategic Options for Myanmar’s Agricultural Sector
2010 2020 2030
Agric.Income
perCapita
0. Baseline Trajectory: Business as Usual
1. The Short Game: Improving Performance withoutInstitutional and Policy Reforms
2. The Long Game: Implementing Institutional and PolicyReforms Necessary for Rapid, Broad-Based Agricultural
5.1.1. Business as Usual
Under a “Business as Usual” scenario, Myanmar’s agricultural future will look much like itspast, characterized by high levels of poverty and vulnerability – outcomes that stem fromendemic low farm productivity and high volatility.
Myanmar’s low agricultural productivity, in relation to its neighbors and competitors, is theproduct of many decades of under-investment in agricultural research, extension, rural roads andtelecommunications. Its rural roads, telecommunication systems and energy grid all rank amongthe least developed in Southeast Asia (ADB 2012). In agricultural research, the engine ofagricultural sector productivity growth, Myanmar invests only 20% as much as its regionalcounterparts (Table 9). While its neighbors have invested in agricultural research, extension,modern statistical systems, rural roads and telecommunication systems, Myanmar has not.
High volatility - of both production and prices - stems in part from increasingly irregular rainfallaccompanying climate change coupled with poor water control and increasingly frequent droughtand flooding. As a result of ongoing changes in rainfall and climate, weather-induced shocksseem likely to aggravate patterns of production and price volatility. Unpredictable policies,particularly trade bans on major export commodities, likewise contribute to price volatility anddrive wide year-to-year swings in farmer planting decisions. Reliance on single markets for

62
export crops compound volatility problems. High transport and transaction costs together withthe lowest cell phone penetration rates in the region combine to exacerbate price volatility anddrive a large wedge between farmgate and consumer prices.
5.1.2. Prospects for Bending the Curve
A pessimist looking at Myanmar’s agricultural sector might conclude that the country’s farmerscurrently operate in the worst of all worlds: a low productivity, high risk environment. But acloser look at the underlying causes of Myanmar’s low agricultural productivity and its highvolatility reveals the bulk of these root problems are subject to remediation. Indeed, many of theunderlying structural and policy problems result from self-inflicted wounds. An optimist lookingforward would, therefore, focus on the key investments, interventions and institutional reformsnecessary for bending the long-run agricultural productivity curve upwards and flattening out itspeaks and valleys.
We emerge from this review convinced that Myanmar can indeed alter its agricultural trajectoryonto one of two higher performance pathways. The more ambitious of these two alternatepathways involves government and other stakeholders committing to a Long Game ofinstitutional, structural and policy reforms that address the root causes of Myanmar’s current lowproductivity and high volatility. Our team sees this as the clearly preferred trajectory. Given thescale of Myanmar’s rural poverty and given the power of broad-based agricultural productivitygrowth to reach the country’s most vulnerable households, we consider these structural reformsboth urgent and necessary. At the same time, we recognize that government, parliament, privatesector, civil society and donor stakeholders will all need to develop and articulate a commonvision and commit to making what will be ambitious but necessary reforms.
In the absence of high-level commitment to structural and policy reforms, Myanmar’s secondbest option lies in a Short Game that promotes productivity improvements within the currentinstitutional and policy framework. The gains attainable under this approach – possibly in therange of 25% to 50% increases in paddy productivity within five to seven years (Denning et al.2013) – can only be sustained and expanded under a Long Game.31 The following discussionexplores the key elements required to improve Myanmar’s agricultural and food securitysituation, under the more ambitious Long Game and the second best Short Game.
31 Note that the terminology used here to contrast the Short Game from the Long Game refers to the magnitude ofpotential gains (fewer in the short game, greater in the long game), not to the time period required for achievingthose gains. In order to execute a Long Game successfully, short-run early actions will be necessary to set up long-term structural reforms. Similarly under a Short Game strategy, early actions will be required to set up later, thoughmore limited gains in the longer run.
63
5.2. The Long Game
5.2.1. Institutional and Policy Reforms Necessary for Broad-Based, Accelerated AgriculturalGrowth
In order to match the impressive agricultural performance of its regional peers, Myanmar willneed to undertake a series of key institutional and policy reforms outlined below (Table 12).Given that three-fourths of the country’s poor live and work in rural areas, we consider thesereforms essential if Myanmar is to unleash the potential for broad-based growth led by adynamic smallholder sector and effectively redress its current high rates of inequality andpoverty.
a) Increase public resources for agriculture. Myanmar has underinvested for many decades inthe public goods required to support agriculture.32 And historically, much of the government’slimited funding has gone to state agricultural enterprises, leaving comparatively little forresearch, extension and education. As a result, Myanmar has invested only 20% as much as itsregional counterparts in agricultural research, in the process systematically depriving theagricultural sector of its major engine of productivity growth. Rural roads andtelecommunications are likewise essential for the development of efficient input supply systems,agricultural markets and extension systems. Yet, Myanmar’s logistics infrastructure, power andtelecommunications systems all rank among the lowest in Southeast Asia (ADB 2012). In orderto reverse its decades-long trend of underinvestment in the rural and agricultural sectors, GOMwill need to substantially boost funding for the key public goods promoting agricultural growth,including agricultural research, extension, education, rural transport, telecommunications andearly warning, climate monitoring and irrigation and drainage control systems.
Long Game Early Action 1: Public expenditure and institutional review of the agriculturalsector.As an early action, we propose a public expenditure review focused on allocations to the agriculturalsector and clearly separating out the financing of state agricultural enterprises from spending on irrigationand recurrent financing for farmer-centered support functions in research, extension and education. To bemost effective, this would take place alongside a thorough needs-based institutional assessmentcomparing existing ministerial staffing, facilities and organizational structure against likely future needs.
b) Structural reform of agricultural support institutions. Not only will Myanmar need tosubstantially boost the resources it allocates to agriculture, it will also need to restructure the lineministries and departments in agriculture, livestock and fishing that will drive future productivitygrowth in agriculture. Today, the legacy of several generations of state control remains evident inthe staffing and institutional culture of key government departments. Two generations of farmersand civil servants have operated under government command and control systems, bequeathing
32 During the early years of their Green Revolution, India and other Asian countries spent 10-20% of theirgovernment budgets on agriculture, investing heavily in agricultural research, extension, agricultural education,irrigation and rural roads (Hazell 2011, Lipton 2012). In contrast, Myanmar currently spends only about 6-10% ofits budget on agriculture and livestock (see Annex Table C11). Yet budget data, like many others in Myanmar,remain the subject of considerable skepticism. In years when budget allocations exceed this threshold, agriculturalspending purportedly surpassed spending on defense. Moreover, within the agricultural sector breakdowns betweenministry departments and across the various state agricultural enterprises are unspecified.

64
an array of relatively well staffed departments built up to supervise and control farmer decisionsbut with limited capacity to listen and respond to farmer needs and felt constraints. AlthoughMyanmar has begun to liberalize the policies governing agricultural production and marketing,the ministerial structures supporting market-oriented growth have not yet been redesigned for thenew policy environment. MOAI has taken several important steps in this direction in the pastyear, most notably by authorizing the hiring of 700 additional extension officers, adding ahorticulture department in DOA to promote crop diversification, elevating plant protectionefforts to departmental status, selling off ministry-owned industrial crop processing enterprisesand restructuring public support to focus on research, development and extension in a newlystructured Department of Industrial Crops Development (DICD). The emergence of a highlyproductive, competitive, broadly growing agricultural sector will require further restructuring ofagricultural support institutions several key areas.
• research: Myanmar needs to create a market-oriented, farmer-centered research system. As partof this effort, increased budgets will be necessary to cater for diagnostic field visits andresearcher consultations with farmers prior to setting their research agenda and for field testingand evaluation of new technologies. The culture of professional expectations within the researchsystem will need to adjust accordingly to accommodate and nurture a farmer-centered researchprogram. The first priorities in any institutional restructuring will lie in providing incentives andmanagement flexibility to hire and retain good male and female scientists as well as incentivesfor them to work with farmers and other value chain actors to solve practical problems facingfarmers. Given Myanmar’s current evolving array of research organizations, some institutionalrestructuring of the research system may be required as well. To this end we propose thatconsideration should be given to the establishment and support of national research centers ofexcellence for the country’s major commodities and farming systems (including, as priorities, anational rice research center and a dry zone center that, combined, could serve over 80% of thefarming population). When well-managed, such centers provide research focus, depth, criticalmass, international partnerships, resource mobilization, and accountability.
• extension: the extension system will similarly require reforms that increase the mobility ofextension officers, improve links between farmers, researchers and extension staff andmodernize agricultural extension services through the application of modern cell phonetechnologies and geographical information systems as vehicles for the provision of diagnostic,prescriptive and monitoring services. Recent efforts to increase extension system staffing andbudgets offer a starting point for reconfiguring the current system into a farmer-centered,service-oriented extension service.
• agricultural education: new skills will be required to meet the needs of a new era of globalagricultural engagement. This will require updating curricula, investing in human capital offaculty and teachers, improving facilities and exploring new scientific frontiers and ways ofimparting information.
Long Game Early Action 2: UDOCs. As an early action, we propose training and deploying a newgeneration of early career agricultural professionals through a system of post-graduate deployment torural areas supported by local and international training and diagnostic backstopping. The universities ofMyanmar have suffered from decades of underinvestment and isolation. Yet, these institutions provide thecountry’s future leaders and change agents. We propose an ambitious scheme that would create a new

65
cadre of professional women and men with the knowledge and skills to modernize agriculture andtransform rural communities. We call this the University Development Outreach Corps (UDOC). Eachyear, graduates of the country’s agricultural universities would compete for places in a 2-year field-oriented program that would deploy UDOCs in communities throughout the country. As in to the USPeace Corps or Teach for America programs, these young men and women would receive initial trainingand orientation upon graduation, as well as at strategic times during the program. UDOCs would be paid abasic wage of an agricultural extension officer and provided with appropriate transport and equipment.We suggest that approximately 200 people per year could enter the program. Efforts would be made toensure a good ethnic and gender balance. After successfully completing the program, UDOCs may thencompete for scholarships for a master’s program. We believe that the prestige of participation coupledwith the potential for higher education scholarships for the best will animate a cadre of highly motivatedyoung professionals .
We believe that such a program would be an appropriate focus for strategic capacity building efforts inthe agriculture sector. International and bilateral partners including universities and CGIAR centers couldengage this program through training programs. In 10 years, roughly 2,000 graduates of the programwould provide the nucleus of strong national capacity in the agriculture sector. We anticipate that theUDOCs would retain important alumni-type connections and alliances that would extend years aftercompletion of the program. Over time, UDOCs would likely fill important leadership roles in researchand extension, as well as in the private sector.
c) Land access. High rates of landlessness, coupled with the recent allocation of 2 million acresin large-scale commercial land blocks, have made land access a highly contentious politicalissue. Current litigation over land confiscation has focused judicial attention on the newFarmland Law (FL), the Vacant, Fallow, and Virgin Land Management Law (VFVLM) and thecurrent implementation of the country’s various land use regulations. To investigate the resultingwaves of claims and counterclaims, Parliament has established a commission of enquiry on thehighly charged subject of land confiscations. Civil society has engaged in this discussion throughthe establishment of a Land Core Group that promotes transparency, collection of empiricalevidence, constructive engagement among key parties and legal education on land use matters.Resolution of the many current conflicts surrounding land litigation will be critical to long termefforts to modernize and raise productivity of Myanmar’s agricultural sector while at the sametime ensuring viable livelihoods for all citizens. Satisfactory resolution of these highlycontentious land claims will also be fundamental to ensuring future political stability.
Long Game Early Action 3: Support ongoing work by the Land Core Group and Parliament.Continuing work by the Parliamentary Commission on Land Confiscations and by the Land Core Groupoffer the most feasible pathway forward on this critical but highly sensitive topic.
d) Farmer organizations. Basic literacy and numeracy, in turn, make it possible to support theformation of farmer-instigated service organizations that help to manage collective actions suchas water control, livestock disease mitigation, input supply and marketing. Many NGOs andcivil society groups, in Myanmar and outside, have experience in this area that can facilitatethese support programs.
Long game early action 4: Micro-irrigation and small-scale water management. A promisingentry point in these efforts would involve a focus on water management for farming and village watersupply systems using low-cost micro-irrigation technologies. Seed multiplication offers another entry

66
point for productivity-enhancing collective action.
e) Water system management. Given the heightened unpredictability of monsoon rainfall and anincreased frequency of both flooding and drought, investments in weather monitoring,forecasting and water control systems will be critical to Myanmar’s ability to manage a highproductivity agricultural system in the face of global climate change. Satellite-based weathermonitoring and physical control systems for managing flooding, drainage and irrigation willform necessary parts of an effective water management system. Because Myanmar’s major riversystems lie within their country borders, this will not require international agreements but ratherfocused, internal assessment, deliberation and collective action. In same way that Bangladeshimplemented its Flood Action Plan over many years and the Mekong River Commissionestablished protocols and control systems for managing water flows, Myanmar will need toimprove its ability to manage its increasingly unpredictable fresh water flows. In view of likelyincreases in both flooding and drought, investments in improved water management appearfundamental to sustainable agricultural productivity growth going forward.
Long Game Early Action 5: Assessment of climate change evidence and technical options formonitoring, forecasting and managing water control systems.
f) Improve data quality. It is difficult to overstate the importance of reliable agricultural statisticsfor guiding government policy and private investments (see Box 1). Current uncertainties aboutproduction, land allocation, yields and prices make it difficult to debate policy options sensibly.Indeed, many policy disputes center on diverging assessments of basic facts about landavailability and use, prices, national production totals and cross-border trade.
A move from the current, highly contested administrative agricultural production estimates willrequire careful assessment of options before determining what systems make most sense inMyanmar. Alternative estimation methods are all based on various choices, measurement toolsand assumptions. None is perfect, and costs of data collection vary along with statisticalaccuracy. So it will be important to help Myanmar review major alternatives before determininghow best to build up its capacity to produce reliable agricultural production estimates.
Structurally, the current coupling of land tax assessment and production estimates by the sameofficers of SLRD will merit review. Possibilities for de-linking these two functions may exist aspart of decentralization efforts, which might reasonably consider devolving land tax assessmentfunctions and staff to local governments. This would free up a smaller but more focusedstatistical staff that could draw on sample survey methods and satellite monitoring tools to morecost-effectively track production over time. As part of an overall effort to improve agriculturaldata, MOAI’s detailed cadastral map library could quickly be digitized, geo-referenced andcombined with best practice survey methods to lower data collection costs, increase speed andimprove precision, early warning and forecasting capacity.
Long Game Early Action 6: Statistical systems review and upgrading. A useful first step in thisdirection would involve establishment of a working group on agricultural statistics charged withreviewing alternative systems currently in use in the region and assessing alternative methods forestimating production of crops, livestock and fish, including survey-based forecasting systems andpossible complementary use of satellite-based RDR and geographical information systems for monitoring
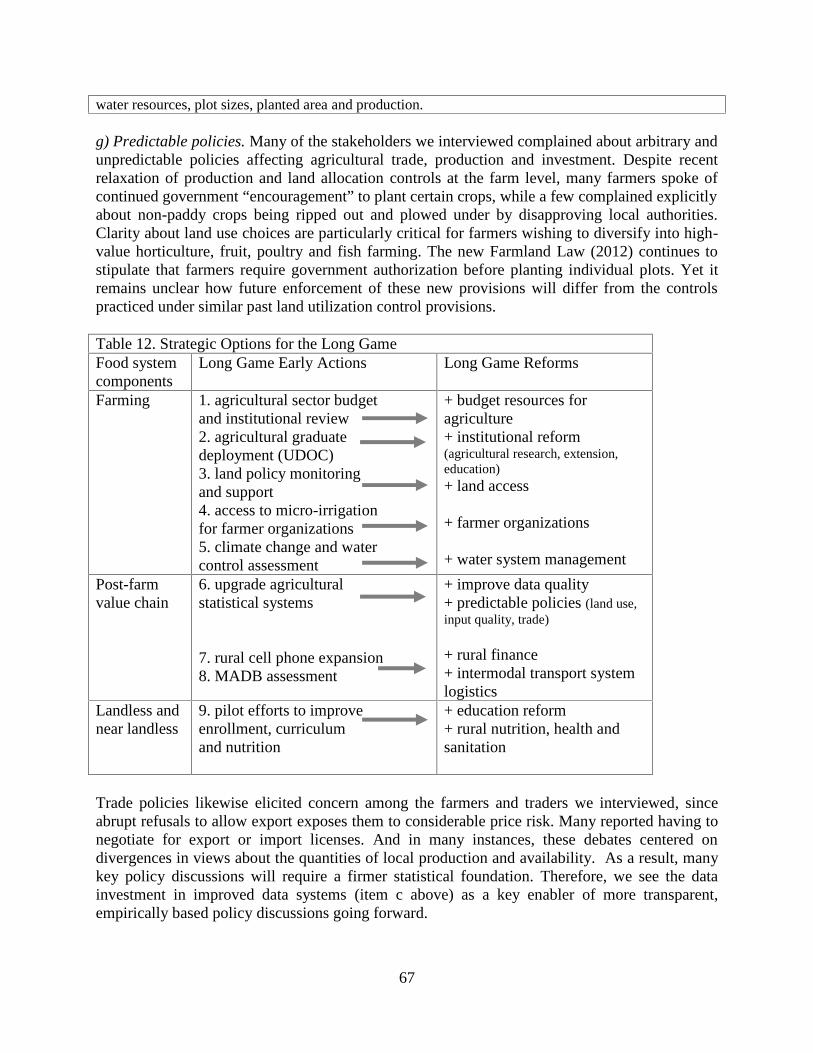
67
water resources, plot sizes, planted area and production.
g) Predictable policies. Many of the stakeholders we interviewed complained about arbitrary andunpredictable policies affecting agricultural trade, production and investment. Despite recentrelaxation of production and land allocation controls at the farm level, many farmers spoke ofcontinued government “encouragement” to plant certain crops, while a few complained explicitlyabout non-paddy crops being ripped out and plowed under by disapproving local authorities.Clarity about land use choices are particularly critical for farmers wishing to diversify into high-value horticulture, fruit, poultry and fish farming. The new Farmland Law (2012) continues tostipulate that farmers require government authorization before planting individual plots. Yet itremains unclear how future enforcement of these new provisions will differ from the controlspracticed under similar past land utilization control provisions.
Table 12. Strategic Options for the Long GameFood systemcomponents
Long Game Early Actions Long Game Reforms
Farming 1. agricultural sector budgetand institutional review2. agricultural graduatedeployment (UDOC)
1) 3. land policy monitoring2) and support3) 4. access to micro-irrigation4) for farmer organizations5) 5. climate change and water6) control assessment
+ budget resources foragriculture+ institutional reform(agricultural research, extension,education)+ land access
+ farmer organizations
+ water system management
Post-farmvalue chain
7) 6. upgrade agricultural8) statistical systems9)
7. rural cell phone expansion8. MADB assessment
+ improve data quality+ predictable policies (land use,input quality, trade)
+ rural finance+ intermodal transport systemlogistics
Landless andnear landless
9. pilot efforts to improveenrollment, curriculumand nutrition
+ education reform+ rural nutrition, health andsanitation
Trade policies likewise elicited concern among the farmers and traders we interviewed, sinceabrupt refusals to allow export exposes them to considerable price risk. Many reported having tonegotiate for export or import licenses. And in many instances, these debates centered ondivergences in views about the quantities of local production and availability. As a result, manykey policy discussions will require a firmer statistical foundation. Therefore, we see the datainvestment in improved data systems (item c above) as a key enabler of more transparent,empirically based policy discussions going forward.
68
h) Rural cell phone expansion. The explosion of cell phone access elsewhere in the developingworld suggests that three major benefits await Myanmar farmers should cell phone penetrationrates increase from their current negligible level.33 First, cell phones empower farmers bymaking price information widely available, thus overcoming the information asymmetry thattraders can otherwise exploit to take advantage of farmers. Empirical studies suggest thatwidespread rural cell phone access enables farmers to target the timing and markets for theirpurchases and sales, leading to increased prices received by farmers and reducing pricedifferentials across markets as well as price variability. Second, mobile phone offer access toweather, disease and extension advice. Third, the mobile phones offer a low-cost platform formoney transfer. This enables relatives to easily transfer funds to rural family and friends,alleviating credit constraints and lower cost of funds. Over time, the development of phone-based savings and banking services provide vehicles for cash management and safeguardingrural savings.
Long Game Early Action 7. Support efforts to facilitate private sector investment in rural cell phonenetworks. Our discussions with private sector investors indicate that regulatory reforms will be requiredto enable companies the confidence to build out rural cell networks. Given the significant potential gainsto farmers and to the agricultural sector, efforts to accelerate this roll out offer potentially significantgains and merit high priority in government reform agenda.
i) Rural financial systems. Weak rural financial systems, high levels of indebtedness and heavydependence on informal financing at high interest rates hamper farmer efforts to financeagricultural production and marketing. Efforts to build up local savings instruments, creditsystems and institutions that intermediate between borrowers and lenders will requireinvestments in long-term institutional development. Ongoing efforts to register and launchsavings-based community financial institutions in rural areas can help in this effort. Althoughmany micro-finance programs are not well-suited to agricultural lending, they do provide savingsvehicles as well as opportunities for permitting highly indebted rural households to manage theirdebt loads by refinancing high-cost consumer loans at more manageable rates of interest.
Long Game Early Action 8: MADB assessment. In addition, given the widespread footprint of MADBin rural areas, and given many lessons from outside Myanmar on ways to reform state-owned ruraldevelopment banks, a formal assessment of the prospects for restructuring or reforming MADB as acommercially managed sustainable bank could prove highly productive (see Kloeppinger-Todd and TunMin Sandar 2013).
j) Rural education. Given high rates of rural landlessness, a key pathway out of poverty for thechildren of currently landless households will center on building up human capital required tolaunch productive careers in agribusiness and in professions outside of agriculture. While foodfor education and related short-term programs can dramatically increase enrollment rates of poorchildren, successful programs require simultaneous investments that increase the capacity andquality of rural education systems.
33 See Aker (2000), Labonne and Chase (2009), Muto and Yamano (2009) and World Bank (2012a).

69
Long Game Early Action 9: Pilot rural education reforms. As an early action to explore practicaloptions and to lay a foundation for prospective rural education reform, we envision a set of small-scalepilot efforts linking increased enrollments (through scholarships, school feeding or food for educationprograms aimed at covering the cash and opportunity costs of attracting landless children to schools) withexpanded teacher staffing and supplementary curricular and extra-curricular learning opportunities aimedat improving the relevance and impact of rural education on the career trajectories of children of the ruralpoor.
5.2.2. Trade-offs among different stakeholder groups during the reform process
Structural and policy reforms of this magnitude require high-level political commitment, broadinternal support from a coalition of interest groups who stand to benefit from the reforms, andsupport from allied outside groups of donors and civil society that stand ready to providefinancial, technical and moral support. Absent these conditions, reform efforts risk foundering onthe pressures and resistance posed by entrenched vested interest groups.
Currently, we see two groups of stakeholders who may perceive their interests to be threatened,at least in the short run, by a program of broad agricultural policy and institutional reforms. Thefirst of these include large landholders who may feel threatened by an open political system thatpermits legal challenges and threatens the retention of their large land holdings. Second aregroups of politically well-connected businesspeople, who may benefit in the short run fromopaque decision-making, favoritism and policy-induced rents. In the long run, however, atransparent, rules-based system for land use rights and policymaking is also in the interest oflarge investors in agribusiness and land development, and will improve their access tointernational capital.
Farmers of all size benefit from improved public research and extension, predictable policies,good infrastructure and well-functioning financial markets. Agribusinesses, input suppliers andtraders similarly stand to benefit from broad rural productivity and income growth. Expansion ofeconomic opportunities for vulnerable groups - in the short run focusing on employmentopportunities for landless adults and in the long run on viable career trajectories for their children- will be essential for reducing Myanmar’s current high levels of inequality, poverty and socialconflict. As a result, serious investments now in human capital, productive assets and high-productivity livelihood options for Myanmar’s rural landless and poor constitute a vital insurancepremium for securing political stability going forward.
5.3. The Short Game: Improving Performance in the Absence of Structural and PolicyReforms
Options for improving agricultural performance and food security in the absence of institutional,structural or further policy reforms will center around four strategic efforts (Table 13).
The first involves improving the productivity of monsoon rice through improved seed quality,better agronomic practices, improved water control, optimized fertilizer and input use andintegrated pest management. As a rough order of magnitude, our discussions with localstakeholders suggest that improved practices could increase productivity and incomes of paddyproducers on the order of 25% to 50% within five to seven years, even under current conditions.

70
Improved water management at the farm level through low-cost micro-irrigation and water usergroups will be central to achieving and amplifying these gains. Updating and enforcing pesticideregulations, such as the 1991 requirement to print instructions in Myanmar language, offers anadditional quick opportunity to reduce pesticide misuse, thereby reducing cost and improvingprofitability of paddy production.
Short Game Early Action 1: Synthesize best practices. Useful early actions for launching this workwould involve efforts to synthesize expert opinion on current best practices for specific farmer settingsand the economics of alternative cropping systems for different agro-ecologies building on ongoing workby IRRI and others.
The second major effort involves promoting diversification into high-value horticulture, freshfruits, poultry, fisheries and small livestock by both small farmers and the rural landless. In theDelta area, monsoon agricultural opportunities center around rice. But in the Dry Zone and in thedry season, farmers enjoy many alternative opportunities. Under conditions of increasing landpressure, small farmers and near-landless will need to consider high-value activities that raisereturns to increasingly scarce land access. Poultry, ducks, horticulture, small livestock, fishingand fish ponds all merit special attention given the small land requirement and scalable, high-productivity technology. Making this viable for landless and near landless often requires specialintermediaries that can help to broker input supply, extension support and veterinary services,and marketing support for small producers. The Bangladesh Rural Advancement Committee’s(BRAC) rural poultry support programs offer one such example (Malhotra and Santer 1996).
Short Game Early Action 2: Examine regional experience promoting commercially viable high-value activities for landless households. Early actions for moving forward in this area might involvebringing in BRAC or others groups with long experience in supporting commercially viable, high-valueagricultural value chains for landless and near-landless households.
A third set of interventions revolves around post-harvest opportunities for reducing losses andincreasing market access for Myanmar farmers. Post-harvest losses are potentially high inMyanmar, especially in paddy. Monsoon paddy is prone to losses during harvesting (shattering)and as a result prolonged exposure in the field after harvest when farmers prioritize landpreparation for winter crops over threshing (resulting in “sun cracking”). Summer paddy is alsoprone to losses as a result of early monsoon rains. However, the extent of such losses has notbeen accurately measured.
Short Game Early Action 3: Post-harvest loss assessment. As an early action we recommend a studyof post-harvest losses in paddy for the major rice production systems, and an assessment of the expectedcosts and benefits of alternative approaches to reducing post-harvest losses (e.g., through mechanizationof harvesting and threshing, improved drying facilities at rice mills, as well as field-scale assessment ofthe susceptibility of improved varieties to harvest/post-harvest loss).
The fourth major axis under a Short Game would focus on landless and other vulnerable ruralhouseholds. One segment of this effort will focus on preparing children of landless and nearlandless for productive career trajectories in high-productivity agriculture, agribusiness andnonfarm professions. In order to complement the productive packages and value chain modelsthat accommodate participation by landless and near landless households (in items 1 and 2

71
above), this component would focus on building up the human capital of landless childrenthrough pre-natal monitoring and nutrient supplementation for pregnant women, promotion ofbreastfeeding, post-natal monitoring and nutrition education for mothers and improved access torural education for landless children. Given the nutrient-dense composition of many high-valuehorticulture and livestock products, the diversification efforts described in item 2 above offerhighly complementary nutritional spillovers.
Table 13. Strategic Options for the Short GameTargets Short Game Early Actions Short GameFarminga) improve productivity ofmonsoon rice
b) promote dry season andDry Zone diversification
1. summarize bestpractices andeconomics of alternatecropping systems2. assess lessons fromelsewhere on promotionof high value activities forvulnerable groups
+ agronomic practices+ seed quality+ farm-level water management
+ diversification: high-value,scalable (horticulture, poultry, fishponds)
Post-farmvalue chain
3. post-harvest lossassessment
+ post-harvest handling
+ target niche marketsLandless andnear landless
4. pilot programspromoting schoolattendance, improvednutrition and health (linkwith high-value diversification)5. test pilot safety netsto reduce indebtednessfollowing livelihoodshocks
+ high value agriculture+ nonfarm income+ education access+ nutrition packages (horticulture,poultry, education, public health)
+ scale up safety nets andinsurance options for landlesshouseholds

72
Short Game Early Action 4: Pilot rural education, nutrition programs. Early actions in this arenacould include pilot efforts to promote packages of high-value agriculture, nutritional support andeducational scholarship programs focused on the rural landless.
In addition, improved safety nets will be critical in a Short Game scenario where continuedclimate risk and continued high volatility in agricultural production and prices weakenssmallholder farmers and subjects landless to wide swings in food prices, which currently accountfor two thirds of their spending.
Short Game Early Action 5: Pilot safety net systems. Early actions in this area involve design andtesting of safety nets for different types of risk that lead to high levels of indebtedness among landless ornear landless households.
5.4. Key Decisions Going Forward
Myanmar’s government, parliament, private sector and civil society must decide collectivelywhether they aspire to pursue a Long Game or a Short Game agricultural growth strategy. Bydefinition, government commitment to key structural and policy reforms constitutes a pre-requisite for a Long Game strategy. So the first question any potential donor must ask is whetheror not the Government of Myanmar is prepared to increase public funding for agriculturalsupport institutions and at the same time ramp up the process of institutional and policy reformsnecessary to raise productivity, lower volatility and increase predictability.
Private sector, civil society and donors can then adjust their aspirations accordingly. In theabsence of government commitment to key institutional and policy reforms, the private sector,civil society and donors will be confined to Short Game interventions. Within the Short Game,early actions in the areas outlined above can help to lay the foundation for quick gains while atthe same time providing a bridge to Long Game structural reforms. As a result, gains in a ShortGame can help to pave the way for much greater gains in a Long Game.
Our team strongly advocates a strategy focused on the Long Game, particularly a set of earlyactions necessary for enabling necessary structural reforms, but complemented by Short Gameinterventions that help to increase incomes, assets, farmer skills and water management systemsthat expand productive potential in the Long Game. By piloting models for effective bottom-upresearch and extension, actions in a Short Game can help to set up a successful Long Game. Abalanced attack, centered on the Long Game but complemented by Short Game interventions,will likewise help to demonstrate to rural communities that the GOM and its developmentpartners are seriously committed to improving the agriculture sector. This multi-prongedapproach addresses the needs of rural communities for early visible change while at the sametime remaining committed to necessary structural re-engineering of institutions and policies.Myanmar’s neighbors and competitors in Thailand, Vietnam, Bangladesh, Malaysia, India andChina have all committed to high-productivity Long Game strategies. Without similarcommitment from Myanmar, we find it difficult to see how Myanmar’s farmers will be able tocompete in increasingly competitive regional and global markets – including those at home.

73
Because two-thirds of Myanmar’s population and three-fourths of its poor live and work in ruralareas, broad-based agricultural growth offers a uniquely powerful instrument for acceleratingeconomic growth and improving the welfare and food security of vulnerable households.Myanmar’s current highly skewed distribution of land, its growing levels of landlessness andincreasingly contentious disputes over land access not only pose dangers to vulnerable householdwelfare but also risk inflaming social tensions and conflict. As a result, we consider the LongGame reforms outlined here imperative for agricultural productivity growth as well as long-termpolitical stability.

74
REFERENCES
Ahmed, Raisuddin, Haggblade, Steven and Chowdhury, Tawfiq-e-Elahi. 2000. Out of theShadow of Famine: Evolving Food Markets and Food Policy in Bangladesh. Baltimore:Johns Hopkins University Press.
Aker, J. 2010. “Information from Markets Near and Far: Mobile Phones and AgriculturalMarkets in Niger.” American Economic Journal: Applied Economics 2(3):46-59.
Anderson Irrigation. 2012. Increasing the Efficiency and Effectiveness of Pumped IrrigationSchemes in the Central Dry Zone of Myanmar. Working Paper No. 3 - Agriculture.Yangon: Livelihoods and Food Security Trust Fund /UNOPS. Water ResourcesUtilization Department.
Asian Development Bank (ADB). 2012. Myanmar in Transition: Opportunities and Challenges.Manila: Asian Development Bank.
Aye Thidar Kyaw. 2012. Banks push safety of money transfers. Myanmar Times, vol.31,No.610, January 16-20, 2012.
Barca, Valentina Barca and Riemenschneider, Nils. 2012. Livelihoods and Food Security TrustFund – Delta Evaluation Final Report. Yangon: LIFT.
Barker, Randolph and Robert Herdt, with Beth Rose. 1985. The Rice Economy of Asia.Washington, DC: Resources for the Future.
Beintema, Nienke, Gert-Jan Stads, Keith Fuglie, and Paul Heisey, 2012. ASTI GlobalAssessment of Agriculture R&D Spending: Developing Countries Accelerate Spending.Agricultural Science and Technology Indicators Project, International Food PolicyResearch Institute, Washington DC.
BTI (Bertelsmann Stiftung’s Transformation Index). 2012. Myanmar Country Report.www.bti-project.org
Dapice, David O., Vallely, Tom and Wilkenson, Ben. 2009. Assessment of the MyanmarAgricultural Economy. Yangon: International Development Enterprises.
Dapice, David O., Vallely, Tom and Wilkenson, Ben. 2010. Revitalizing Agriculture inMyanmar: Breaking Down Barriers, Building a Framework for Growth. Yangon:International Development Enterprises.
Dapice, David O., Vallely, Thomas J., Wilkenson, Ben and McPherson, Malcolm. 2011.Revitalizing Agriculture in Myanmar: Breaking Down Barriers, Building a Framework

75
for Growth. Cambridge, Massachusetts: Ash Center for Democratic Governance and andInnovation, The Kennedy School, Harvard University.
Dapice, David O., Saich, Anthony J., Vallely, Thomas J., and Montesano, Michael J. 2012.Appraising the Post-Sanctions Prospects for Myanmar’s Economy: Choosing the RightPath. Yangon: Proximity Design.
David, Christina C. 2006. The Philippine Hybrid Rice Program: A Case for Redesign andScaling Down. PIDS Research Paper Series No. 2006-03. Manila: Philippine Institutefor Development Studies.
Deininger, Klaus and Byerlee, Derek. 2012. The Rise of Large Farms in Land-AbundantCountries: Do They Have a Future? World Development 40(4):701-714.
Dorosh, Paul, Carlo del Ninno and Quazi Shahabuddin, editors. 2004. The 1998 Floods andBeyond: Towards Comperhensive Food Security in Bangladesh. Dhaka: The UniversityPress and Washington, DC: International Food Policy Research Institute.
Duflos, Eric, Paul Luchtenburg, Li Ren, and Li Yan Chen. 2013. Microfinance in MyanmarSector Assessment. Washington, DC: International Finance Corporation.
Ericsson AB (2012). The Potential Economic Impact of Mobile Communications in Myanmar.
Economic and Social Commission for Asia and the Pacific (ESCAP). 2007. Ten as One:Challenges and Opportunities for ASEAN Integration. United Nations Economic andSocial Commission on Asia and the Pacific (ESCAP): Bangkok
Food and Agriculture Organization (FAO). 2010. Agricultural Census in Myanmar. Asia andPacific Commission on Agricultural Statistics, 23rd Session, Siem Reap, Cambodia, 26-30 April 2010
Food and Agriculture Organization of the United Nations (FAO). 2009. Digital AgriculturalAtlast of the Union of Myanmar. Linked to from FAO GeoNetwork.
Food and Agriculture Organization (FAO). 2005. Myanmar Agricultural Sector Review andInvestment Strategy. New York: UNDP.
FAO. 2000. An Overview of Horticulture Marketing in Myanmar. Rome: FAO.
Government of Union of Myanmar Ministry of National Planning and EconomicDevelopment/Sida/UNICEF/UNDP. 2011. Integrated Household Living ConditionsSurvey in Myanmar (2009-2010) Poverty Profile.
Haggblade, Steven, Hazell, Peter and Dorosh, Paul A. 2007. Agricultural Growth Linkages.Chaper 7 in Transforming the Rural Nonfarm Economy, edited by Steven Haggblade andPeter Hazell, Baltimore: Johns Hopkins University Press.

76
Haggblade, Steven, Peter B.R. Hazell and Thomas Reardon, editors. 2010. Transforming theRural Nonfarm Economy: Opportunities and Threats in the Developing World.Baltimore: Johns Hopkins University Press.
Henning, J., R. Pym, T. Hla, N. Kyaw, and J. Meers (2007) Village chicken production inMyanmar – purpose, magnitude and major constraints. World’s Poult. Sci. J. 63: 308 –322.
Henning, Georg, Meers, Joanne, Morton, John, Pym, Bob and Than Hla. 2009. Village chickensin Myanmar: Characteristics, Constraints and Methods for Improving Health andProduction. Canbera, Australia: Australian Center for International AgriculturalResearch (ACIAR).
Hiebert, Murray and Nguyen, Phuong. 2012. Land Reform: A Critical Test for Myanmar’sGovernment. George Washington University Center for Strategic and InternationalStudies, Volume 3, Issue 21, November 8.
Hossain, Mahabub. 1988. Nature and Impact of the Green Revolution in Bangladesh. IFPRIResearch Report 67. Washington, DC: International Food Policy Research Institute.
Htun, Khin. 2009. Myanmar Forestry Outlook Study. For the Food and Agriculture Organizationof the United Nations Asia-Pacific Forestry Sector Outlook Study II. Working PaperSeries: Working Paper No. APFSOS II/WP/2009/07. Accessed on 20 October 2012 fromhttp://www.fao.org/docrep/014/am252e/am252e00.pdf
Integrated Household Living Conditions Assessment (IHLCA). 2011. Integrated HouseholdLiving Conditions Survey 2009-10 Myanmar: Poverty Profile. Yangon: United NationsDevelopment Programme.
International Monetary Fund. 2012. Article IV Consultation with Myanmar.
JICA report to MOAI (2010). The Development Study on Sustainable Agricultural and RuralDevelopment for Poverty Reduction Programme in the Central Dry Zone.
Janaiah, A. and M. Hossain. 2003. Can hybrid rice technology help productivity growth in Asiantropics? Farmers’ experiences. Economic and Political Weekly. 38(25):2492-2501.
Jayne, T.S. and Rashid, Shahidur. 2010. The Value of Accurate Crop Production Forecast.International Development Working Paper No. 108. East Lansing, Michigan: MichiganState University.
Khin Hlaing. 2011. “Myanmar Livestock Industry Overview,” PowerPoint Presentation by jointsecretary of Myanmar Livestock Federation, December 10, 2011, Yangon, Myanmar.

77
Labonne, J. and Chase, R.S. 2009. “The Power of Information: The Impact of Mobile Phones onFarmers’ Welfare in the Philippines.” Policy Research Working Paper 4996. Washington,DC: The World Bank.
Land Core Group. 2012. Thirteen case studies of land confiscations in three townships of centralMyanmar. Yangon: Food Security Working Group.
Lipton, Michael. 2005. The Family Farm in a Globalizing World: The Role of Crop Science inAlleviating Poverty. 2020 Discussion Paper No. 40. Washington, DC: International FoodPolicy Research Institute.
Livelihood Livelihoods and Food Security Trust (LIFT) Fund. 2012. Baseline Survey Results.
Malhotra, Mohini and Jennifer Santer. 1994. "Towards More Cost-Effective NonfinancialAssistance: Case Studies in Subsector-based MSE Development." GEMINI WorkingPaper 49. Bethesda, MD: Development Alternatives Inc.
Maung, Mya. 2008. Agricultural Extension in Myanmar and How to Strengthen CollaborativeMechanism Between Research and Extension. Myanmar Academy of Agriculture,Forestry, Livestock and Fishery Services, and Myanma Agriculture Services ExtensionDivision.
Ministry of Agriculture and Irrigation of the Union of Myanmar. 2010. Myanmar CountryReport on Climate Change and Impacts on Agriculture and Food Security. Accessed on23 Oct 2012 from http://www.foodsecuritylink.net/myanmar/index.php?option=com_remository&Itemid=13&func=startdown&id=84
Ministry of Agriculture and Irrigation of the Union of Myanmar. 2013 Report on MyanmarCensus of Agriculture 2010. Nay Pyi Taw : MOAI .
Myanmar Multiple Indicator Cluster Survey (MICS). 2011. Myanmar Multiple Indicator ClusterSurvey 2009-10. Yangon: United Nations Children’s Fund, Ministry of Planning andDevelopment and Ministry of Health.
Min, A. and T. Kudo, 2012, ‘Newly Emerging Industrial Development Nodes in Myanmar:Ports, Roads, Industrial Zones along Economic Corridors’, in Emerging EconomicCorridors in the Mekong Region edited by Masami, I., BRC Research Paper No.8,Bangkok Research center, IDE-JETRO, Bangkok, Thailand.
Muto, M. and Yamano, T. 2009. "The Impact of Mobile Phone Coverage on MarketParticipation: Panel Data Evidence from Uganda.” World Development 37(12):1887-96.
Myanmar, Government of. 2012. Framework for Economic and Social Reforms. PolicyPriorities for 2012-15 towards the Long-Term Goals of the National ComprehensiveDevelopment Plan.

78
Mya Maung. 2008. Agricultural Extension in Myanmar and How to Strengthen CollaborativeMechanisms Between Agricultural Research and Extension. Nay Pyi Taw: MyanmaAgricultural Service.
Myanmar Rice Federation (MRF). 2012a. MRF Survey Report 2011. Yangon : Myanmar RiceFederation.
Myanmar Rice Federation (MRF). 2012b. Study of Socio-Demographic Characteristics andImpact of Contract Farming in Myanmar. Yangon: Myanmar Rice Federation.
Myanmar Rice Federation (MRF). 2013. Myanmar Rice Federation. Yangon : MRF..Oberndorf, Robert B. 2012. Legal review of recently enacted Farmland Law and Vacant, Fallow
and Virgin Lands Management Law. Yangon : Land Core Group of the Food SecurityWorking Group.
Okamoto, Ikuko. 2008. Economic Disparity in Rural Myanmar: Transformation Under MarketLiberalization. Singapore: NUS Press.
Open Net Initiative (ONI). 2012. Burma (Myanmar). Toronto: The Open Net Initiative.http://opennet.net/research/profiles/burma
Pingali, P.L. and V-T. Xuan, 1992, “Vietnam: Decollectivization and Rice Productivity Growth”,Economic Development and Cultural Change, 40(4), pp. 697-718.
Rahman, Shafique. 2010. "Economic Overview, Challenges, Opportunities, and ProgrammaticResponses," PowerPoint presentation.
Rao, Ranga G. V. and Herridge, D.F. 2011. Increasing food security and farmer livelihoods.Canbera, Australia: Australian Center for International Agricultural Research (ACIAR).
Ratha, D., S. Mohapatra, and A. Silwal, (2011). The Migration and remittances Factbook.Washington, DC: Migration and Remittances Unit, The World Bank.
Regional Integrated Multi-hazard Early Warning Systems (RIMES). 2011. Managing ClimateChange Risks for Food Security in Myanmar, Technical Report Support to the ECProgramme on Linking Information and Decision Making to Improve Food Security forSelected Greater Mekong Sub-Regional Countries. Accessed on 23 October 2012 fromhttp://www.foodsecuritylink.net/myanmar/index.php?option=com_remository&Itemid=13&func=startdown&id=136
Spielman, David J., Kolady, Deepthi and Cavalieri, Anthony J. 2012. Public Expenditures,Private Incentives and Farmer Adoption: The Economics of Hybrid Rice in Asia.Washington, DC: International Food Policy Research Institute.

79
Stads, Gert-Jan and Pau Sian Kam. 2007. Myanmar. Agricultural Science and TechnologyIndicators (ASTI) Country Brief No.38. Washington, DC : International Food PolicyResearch Institute.
Tate, Daniel Ten. 2012. “Myanmar Nearing Decision on Currency Float in Biggest Shift SinceOpening.” Bloomberg News. March 5, 2012.
Thi Mar Win. 2011. Value Chain Analysis of Poultry Products in Pathein and MyaungTownships. Yangon: LIFT.
Tschirley, David, Minde, Isaac and Boughton, Duncan. 2009. Contract Farming in Sub-SaharanAfrica: Lessons from cotton on what works and under what conditions. Issues Brief No.7. Regional Strategic Analysis and Knowledge Support System (RESAKSS), SouthAfrica.
U Myint. 2010. Myanmar Economy: A Comparative View. Stockholm: Institute for Securityand Development Policy.
United Nations Development Program (UNDP). 2011. Project Proposal for Adaptation Fund:Addressing Climate Change Risks on Water Resource and Food Security in the Dry Zoneof Myanmar. Accessed on 23 Oct 2012 from http://www.adaptation-fund.org/sites/default/files/Submission_AF_Myanmar_8Oct2012.pdf
UNFPA. July 2010. Report on Situation Analysis of Population and Development,Reproductive Health, and Gender in Myanmar.
Vokes, Richard and Goletti, Francesco. 2012. Agriculture and Rural Development in Myanmar:Policy Issues and Challenges. Agri-Food Consulting International.
Ware, Anthony and Clarke, Matthew. 2009. Consequences of Sanctions: Are the MDGsRelevant in Myanmar? Paper presented at the MDG Update Conference, ACFID and LaTrobe University, Melbourne, 30th November 2009.
Wheeler, D. 2011. Mapping the Impacts of Climate Change. A project of the Center for GlobalDevelopment. Accessed on 23 Oct 2012 fromhttp://www.cgdev.org/section/topics/climate_change/mapping_the_impacts_of_climate_change
Woods, Kevin. 2013. Emerging Agribusiness Trends in Myanmar: An Overview. Kunming:Yunnan University Press, in press.
World Bank. 2007. Agriculture for Development: World Development Report 2008.Washington, DC: The World Bank.
World Bank. 2012a. Information and Communications for Development 2012: MaximizingMobile. Washington, DC: The World Bank.

80
World Bank. 2012b. World Bank Climate Change Knowledge Portal. Accessed on 23 Oct 2012fromhttp://sdwebx.worldbank.org/climateportal/index.cfm?page=country_historical_climate&ThisRegion=Asia&ThisCCode=MMR
Xe, Fanming. 2011. Hybrid Rice R&D Program at IRRI. Powerpoint presented in Sanya,China on December 12, 2011.http://www.unapcaem.org/Activities%20Files/A1112sanya/irri.pdf
Young, Kenneth B., Gail L. Cramer and Eric J. Wailes. 1998. An Economic Assessment of theMyanmar Rice Sector: Current Developments and Prospects. Research Bulletin 958.Arkansas Agricultural Experiment Station. Fayetville, Arkansas: University of Arkansas.

81
ANNEX A. BACKGROUND PAPERS
1. Agro-ecological Systems in Myanmar, by Kye Baroang and Glenn Denning2. Rice Productivity: Opportunities for Improving Competitiveness in Rice Production, by GlennDenning, Ye Myint Kyaw, and Tun Min Sandar3. Rural Financial Institutions: Savings, Insurance and Credit, by Renate Kloepplinger-Todd andTun Min Sandar4. Food and Nutrition Security in Myanmar, by Shannon Wilson and Naw Eh Mwee Aye Wai5. Agricultural Education, Research and Extension Institutions, by Khin Mar Cho6. Rapid Value Chain Diagnostic Assessment: Structure and Dynamics of the Rice Value Chainin Mynmar, by Larry Y.C. Wong and Naw Eh Mwee Aye Wai
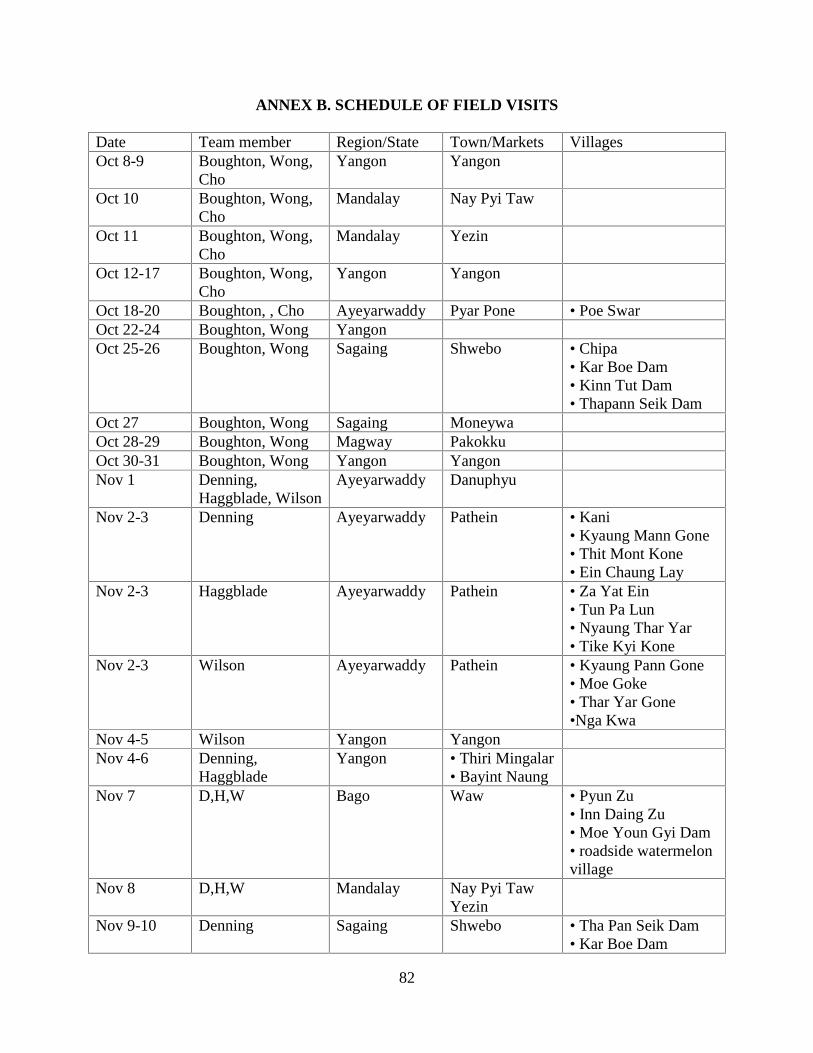
82
ANNEX B. SCHEDULE OF FIELD VISITS
Date Team member Region/State Town/Markets VillagesOct 8-9 Boughton, Wong,
ChoYangon Yangon
Oct 10 Boughton, Wong,Cho
Mandalay Nay Pyi Taw
Oct 11 Boughton, Wong,Cho
Mandalay Yezin
Oct 12-17 Boughton, Wong,Cho
Yangon Yangon
Oct 18-20 Boughton, , Cho Ayeyarwaddy Pyar Pone • Poe SwarOct 22-24 Boughton, Wong YangonOct 25-26 Boughton, Wong Sagaing Shwebo • Chipa
• Kar Boe Dam• Kinn Tut Dam• Thapann Seik Dam
Oct 27 Boughton, Wong Sagaing MoneywaOct 28-29 Boughton, Wong Magway PakokkuOct 30-31 Boughton, Wong Yangon YangonNov 1 Denning,
Haggblade, WilsonAyeyarwaddy Danuphyu
Nov 2-3 Denning Ayeyarwaddy Pathein • Kani• Kyaung Mann Gone• Thit Mont Kone• Ein Chaung Lay
Nov 2-3 Haggblade Ayeyarwaddy Pathein • Za Yat Ein• Tun Pa Lun• Nyaung Thar Yar• Tike Kyi Kone
Nov 2-3 Wilson Ayeyarwaddy Pathein • Kyaung Pann Gone• Moe Goke• Thar Yar Gone•Nga Kwa
Nov 4-5 Wilson Yangon YangonNov 4-6 Denning,
HaggbladeYangon • Thiri Mingalar
• Bayint NaungNov 7 D,H,W Bago Waw • Pyun Zu
• Inn Daing Zu• Moe Youn Gyi Dam• roadside watermelonvillage
Nov 8 D,H,W Mandalay Nay Pyi TawYezin
Nov 9-10 Denning Sagaing Shwebo • Tha Pan Seik Dam• Kar Boe Dam

83
Nov 9-10 Haggblade Sagaing Shwebo •Leik Chin• Naw Maw
Nov 9-10 Wilson Sagaing • Schwebo• A Yar Taw
• Chipa North• Chipa village tract• Kywe Chan• Ye Chin• Bone Let Kut• Naung Gyi Ei
Nov 11 D,H,W Mandalay MandalayNov 12 Denning,
HaggbladeMandalay • Popa
• Taung Tha• Hsee Mee Kan• Thar Zi
Nov 12 Wilson Shan State Inle • Hei Yarr Ywa Ma• Pann Pei
Nov 13 Wilson Shan State • Naung Shwe,Southern Shan
• Payah Phyu• The Le Oo• Naung Lane Gone• Thein Gone• Taung Ni
Nov 13-16 Denning,Haggblade
Yangon • poultrywholesalemarket
Nov 14 Wilson Shan State Aung BannNov 15-17 Wilson Yangon YangonNov 17 Kloeppinger-Todd Mandalay • Mandalay
• Pathein GyiNov 18 Kloeppinger-Todd Sagaing • Monywa • Kin MonNov 19 Kloeppinger-Todd Sagaing • Ayar TawNov 20 Kloeppinger-Todd Shan State
Mandalay• Kyauk Mae• Pyin Oo Lwin
• Pa Gar• Kyauk Mae Gyi• Kyaung Kone• Inn Htake Oo
February 5,2013
Boughton Yangon • Tone Gwa • A Le Gwin
February 13 Boughton,Haggblade
Bago • Painne Kon
February 16 Boughton,Haggblade
Shan State • Taun Ggyi • Taung Chae• Pali Lin• Lay Lwei• Naung Yaung
February 17 Boughton,Haggblade
Shan State • Aumben• Nyaung Shwe
• Saik Pyoe• Chaung Sauk

84
ANNEX C. SUPPLEMENTARY TABLES
Annex Table C1. Agricultural Share of GDP in Myanmar, 2002 and 20102002 2010
Crops 48% 29%Livestock and fisheries 8% 7%Total agriculture 56% 36%Source: Myanmar Central Statistical Organization statistical yearbooks.

85
Annex Table C2. Estimated Livestock Holdings in Myanmar, 2003 to 20122003 2007/2008 2011/12
Poultry 25.6 119.7 189.2chickens 20.8 107.2 172.6ducks 4.8 11.1 15.3
Small livestock 2.3 9.8 14.9pigs 1.8 6.9 10.3goats 0.4 2.4 3.8sheep 0.1 0.5 0.8
Cattle 6.4 12.6 14.0Buffaloes 1.1 2.8 3.1Source: MOAI Agricultural Census of 2003. FAO/WFP, 2009; Ai Thank Kyaw (2012).

86
Annex Table C3. Completed Educational Level of the Household Head, 2009-10
Area
Never attendedschool/KG or1st standard
MonasticSchool
PrimarySchool (2ndto 4th std)
MiddleSchool (5thto 8th std)
SecondarySchool (9thto 10th std)
Post-SecondaryEducation
Kachin 18.5 7.9 35.7 23.4 10.4 4.1Kayah 20.2 3.6 34.1 29.9 8.6 3.6Kayin 10.8 8.2 49.9 20.8 8.2 2.2Chin 14 0 46.3 23.5 12.5 3.7Sagaing 3.2 11.8 59.6 15.7 6.4 3.2Tanintharyi 8.9 15.4 48.2 17.4 8.4 1.7Bago 3 5.9 60.4 20.3 7.8 2.6Bago E 4.9 7.1 54.2 22.3 8.1 3.3Bago W 0.9 4.6 67 18.1 7.5 1.9Magwe 4.2 12.2 59.3 15.6 6.1 2.5Mandalay 6.7 13.2 46.1 20.8 9.3 4Mon 6.9 6.4 47.3 22.8 12.4 4.1Rakhine 16.7 14.4 37 17.5 10.7 3.7Yangon 4 4 27.2 27.6 26.4 10.7Shan 23 17.1 36.6 16.3 5.8 1.3Shan S 18.3 8.9 42.7 22.5 6.6 1Shan N 22.7 24.5 33.7 11.2 5.8 2.1Shan E 41.3 21.1 23.9 11.2 2.4 0Ayeyarwady 2.4 5.6 58.3 20.9 9.4 3.4Urban 4.9 3.8 28.4 27.1 24.2 11.6Rural 7.8 11.5 55.3 17.8 6.1 1.4Poor 12.5 13.3 52.8 15.9 4.7 0.7Non-Poor 5.6 8.4 46.9 21.5 12.6 5.1Union 2010 7.1 9.5 48.1 20.3 10.9 4.1Union 2005 11.9 19.8 34.8 19.4 10 4.1Change (%) -40.7 -52.1 38.3 4.4 9 1.6Source: IHLCA 2011.
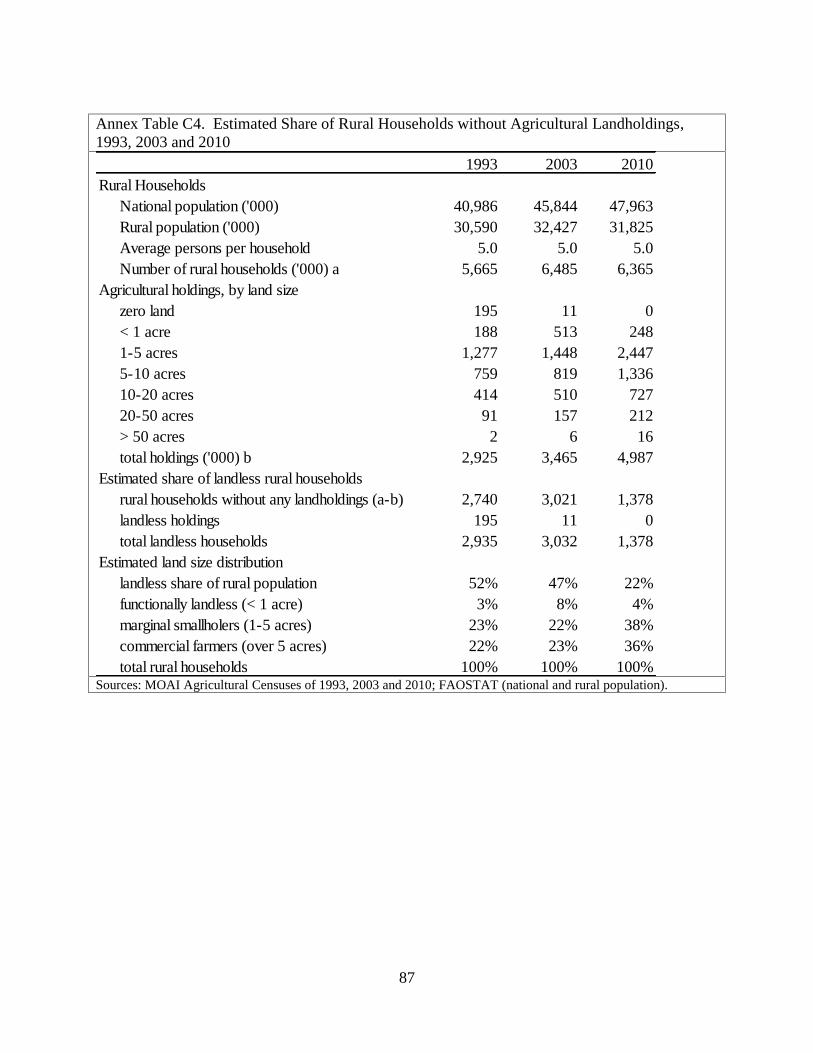
87
Annex Table C4. Estimated Share of Rural Households without Agricultural Landholdings,1993, 2003 and 2010
1993 2003 2010Rural Households
National population ('000) 40,986 45,844 47,963Rural population ('000) 30,590 32,427 31,825Average persons per household 5.0 5.0 5.0Number of rural households ('000) a 5,665 6,485 6,365
Agricultural holdings, by land sizezero land 195 11 0< 1 acre 188 513 2481-5 acres 1,277 1,448 2,4475-10 acres 759 819 1,33610-20 acres 414 510 72720-50 acres 91 157 212> 50 acres 2 6 16total holdings ('000) b 2,925 3,465 4,987
Estimated share of landless rural householdsrural households without any landholdings (a-b) 2,740 3,021 1,378landless holdings 195 11 0total landless households 2,935 3,032 1,378
Estimated land size distributionlandless share of rural population 52% 47% 22%functionally landless (< 1 acre) 3% 8% 4%marginal smallholers (1-5 acres) 23% 22% 38%commercial farmers (over 5 acres) 22% 23% 36%total rural households 100% 100% 100%
Sources: MOAI Agricultural Censuses of 1993, 2003 and 2010; FAOSTAT (national and rural population).

88
Annex Table C5 Alternate Estimate of Landlessness, 2011Delta/coastal Dry Zone Hilly Total
Landlessness (%) 72 43 26Population (millions) 24.8 19.2 9.4 53.4Population shares 46% 36% 18% 100%Weighted average* 33 15 5 53* Landlessness % x population shareSource: LIFT (2012), Table 54 and population shares from Figure 3.
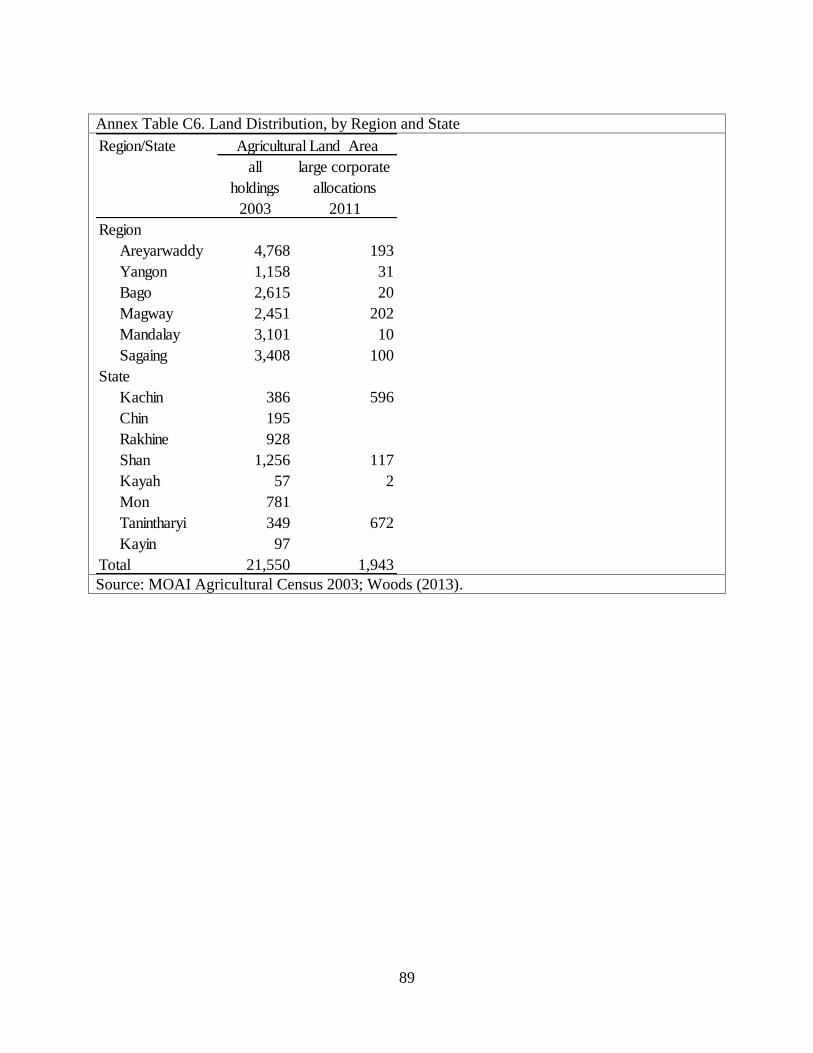
89
Annex Table C6. Land Distribution, by Region and StateRegion/State
allholdings
large corporateallocations
2003 2011Region
Areyarwaddy 4,768 193Yangon 1,158 31Bago 2,615 20Magway 2,451 202Mandalay 3,101 10Sagaing 3,408 100
StateKachin 386 596Chin 195Rakhine 928Shan 1,256 117Kayah 57 2Mon 781Tanintharyi 349 672Kayin 97
Total 21,550 1,943
Agricultural Land Area
Source: MOAI Agricultural Census 2003; Woods (2013).
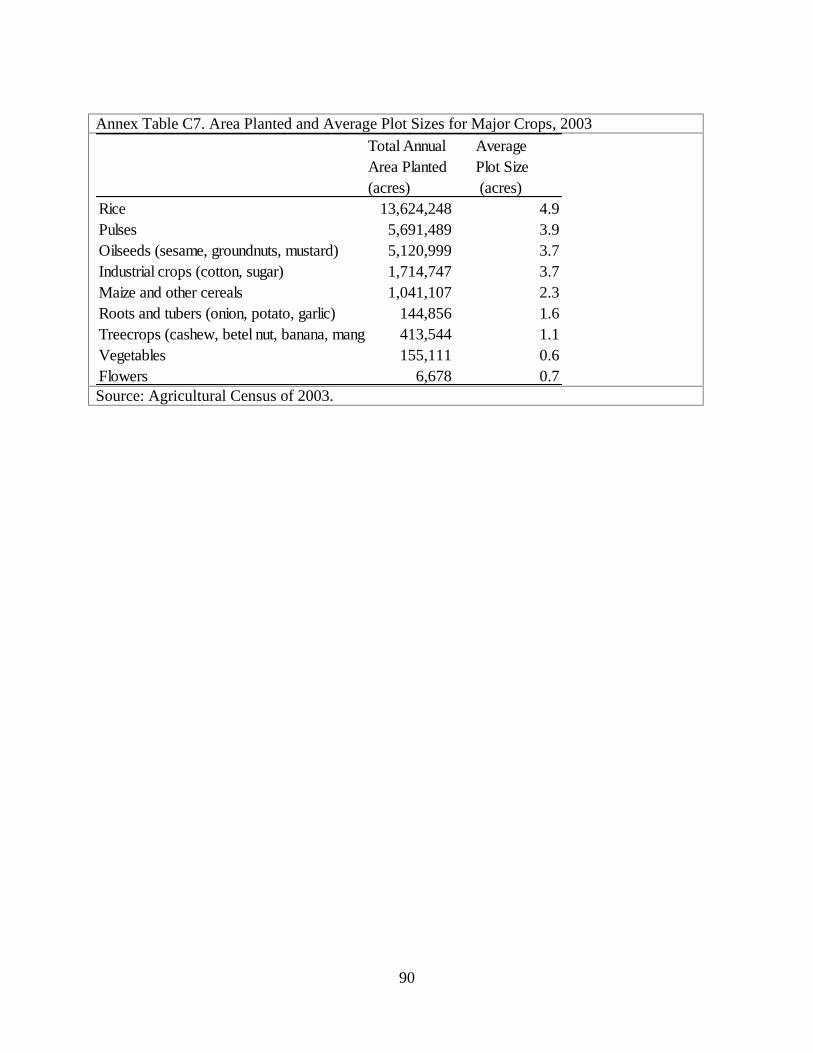
90
Annex Table C7. Area Planted and Average Plot Sizes for Major Crops, 2003Total Annual AverageArea Planted Plot Size(acres) (acres)
Rice 13,624,248 4.9Pulses 5,691,489 3.9Oilseeds (sesame, groundnuts, mustard) 5,120,999 3.7Industrial crops (cotton, sugar) 1,714,747 3.7Maize and other cereals 1,041,107 2.3Roots and tubers (onion, potato, garlic) 144,856 1.6Treecrops (cashew, betel nut, banana, mango) 413,544 1.1Vegetables 155,111 0.6Flowers 6,678 0.7Source: Agricultural Census of 2003.

91
Annex Table C8. Regional Differences in Horticultural Earnings by Rural Households, 2011(percent of households earning income)
Delta Dry Zone Hills TotalEarn some income
vegetables 6% 9% 17% 10%tubers and rootcrops 0% 3% 14% 4%fruits 1% 0% 2% 1%total horticulture 7% 12% 32% 15%
Most important source of incomevegetables 2% 4% 9% 4%tubers and rootcrops 0% 1% 8% 2%fruits 0% 0% 1% 0%total horticulture 2% 5% 17% 7%
Source: LIFT (2012), Tables 14,15.

92
Annex Table C9. Rural Debt Loads, by Landholding Size, 2011
Zero < 5 5-20 > 20Household debt levels ('000 Kyat)
none 3 4 3 3under 100 48 33 11 2101-500 43 51 47 26over 500 6 13 38 69
Estimated indebtedness* ('000 Kyat) 184 269 522 751
Landholding Size (acres)
* Estimates based on midpoints of the 11 debt ranges and 1 million as the average for the over 500,000 category.Source: LIFT (2012), Table 110.

93
Annex Table C10. Myanmar Union Government Budget Expenditures, by Sector 1990 to 2010
Sector 1990/91 1995/96 2000/01 2005/05 2009/10 1990/91 1995/96 2000/01 2005/05 2009/101 Agriculture 3.8 16.4 6.2 7.4 5.6 5 17 23 9 62 Livestock and fisheries 1.3 0.9 3.6 0.4 0.4 1 0 0 0 03 Forestry 3.8 3.2 1.3 1.1 1.0 3 1 1 0 04 Mines 1.8 1.7 0.1 0.2 0.1 1 0 0 * *5 Industry 11.9 8.8 0.8 0.8 1.2 5 1 9 2 36 Energy 10.9 10.2 * 0.7 0.4 8 3 4 7 87 Construction 8.0 10.5 6.5 4.4 2.4 10 12 14 14 98 Transport and communications 4.7 5.0 0.6 0.6 0.6 12 15 7 14 49 Social Services 1/ 13.6 7.0 23.3 20.2 26.1 20 11 10 3 3
10 Finance 5.7 7.5 1.1 1.2 1.7 3 2 1 0 011 Trade 18.3 13.3 0.7 0.6 0.6 3 2 1 0 *12 Defence 7.9 8.6 26.2 27.1 25.9 16 32 26 16 1013 Administration 2/ 6.1 6.9 29.6 35.3 33.9 6 4 3 34 5614 Development committees 2.2 * * * * 8 * * * *
TOTAL (percent) 100.0 100.0 100.0 100.0 100.0 100 100 100 100 100TOTAL (million Kyatt) 48,771 124,523 133,822 343,818 1,158,659 10,210 41,035 109,158 663,898 950,894
Current Budget Capital Budget
Source: Budget Department
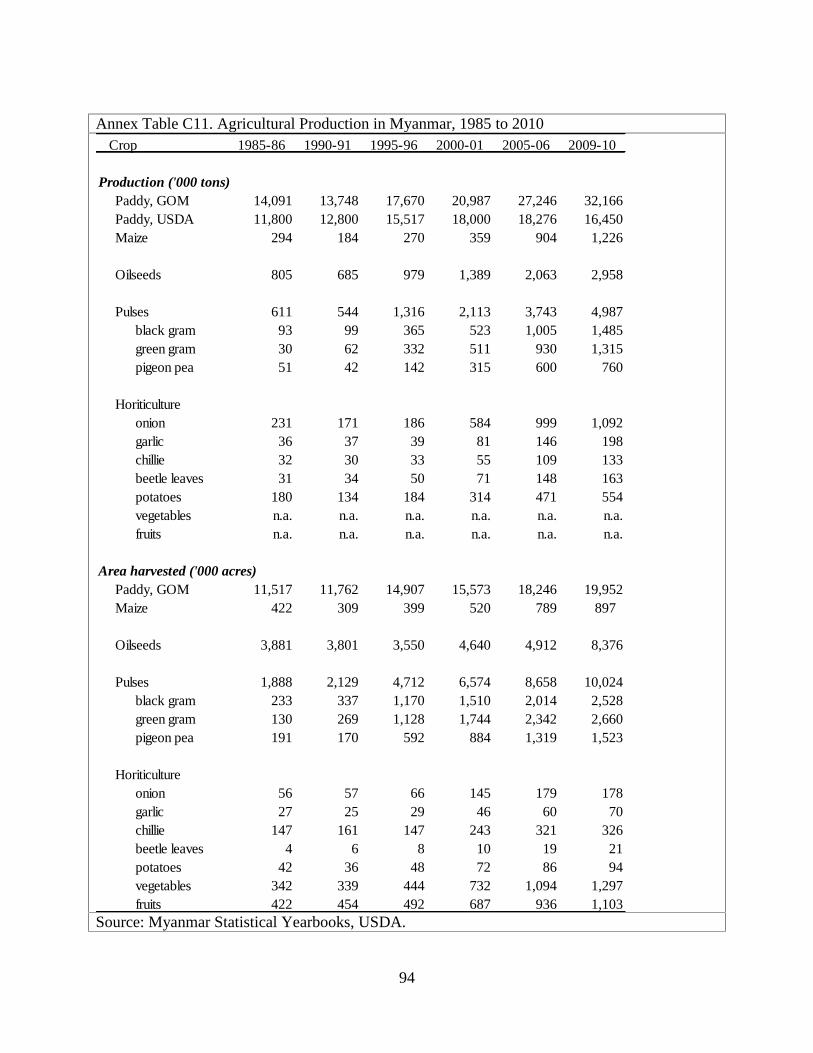
94
Annex Table C11. Agricultural Production in Myanmar, 1985 to 2010Crop 1985-86 1990-91 1995-96 2000-01 2005-06 2009-10
Production ('000 tons)Paddy, GOM 14,091 13,748 17,670 20,987 27,246 32,166Paddy, USDA 11,800 12,800 15,517 18,000 18,276 16,450Maize 294 184 270 359 904 1,226
Oilseeds 805 685 979 1,389 2,063 2,958
Pulses 611 544 1,316 2,113 3,743 4,987black gram 93 99 365 523 1,005 1,485green gram 30 62 332 511 930 1,315pigeon pea 51 42 142 315 600 760
Horiticultureonion 231 171 186 584 999 1,092garlic 36 37 39 81 146 198chillie 32 30 33 55 109 133beetle leaves 31 34 50 71 148 163potatoes 180 134 184 314 471 554vegetables n.a. n.a. n.a. n.a. n.a. n.a.fruits n.a. n.a. n.a. n.a. n.a. n.a.
Area harvested ('000 acres)Paddy, GOM 11,517 11,762 14,907 15,573 18,246 19,952Maize 422 309 399 520 789 897
Oilseeds 3,881 3,801 3,550 4,640 4,912 8,376
Pulses 1,888 2,129 4,712 6,574 8,658 10,024black gram 233 337 1,170 1,510 2,014 2,528green gram 130 269 1,128 1,744 2,342 2,660pigeon pea 191 170 592 884 1,319 1,523
Horiticultureonion 56 57 66 145 179 178garlic 27 25 29 46 60 70chillie 147 161 147 243 321 326beetle leaves 4 6 8 10 19 21potatoes 42 36 48 72 86 94vegetables 342 339 444 732 1,094 1,297fruits 422 454 492 687 936 1,103
Source: Myanmar Statistical Yearbooks, USDA.

95
Figure D1. Four Dimensions of Food Security
FoodSecurity
Access
Stability
UtilizationAvailability
Note: Green ovals indicate dimension of food security governed in large part by agriculture.

96
Figure D2. States and Regions of Myanmar
Source: FAO Geonetwork.

97
Figure D3. A Mapping of Farming Systems and Administrative Borders
Source: FAO GeoNetwork.
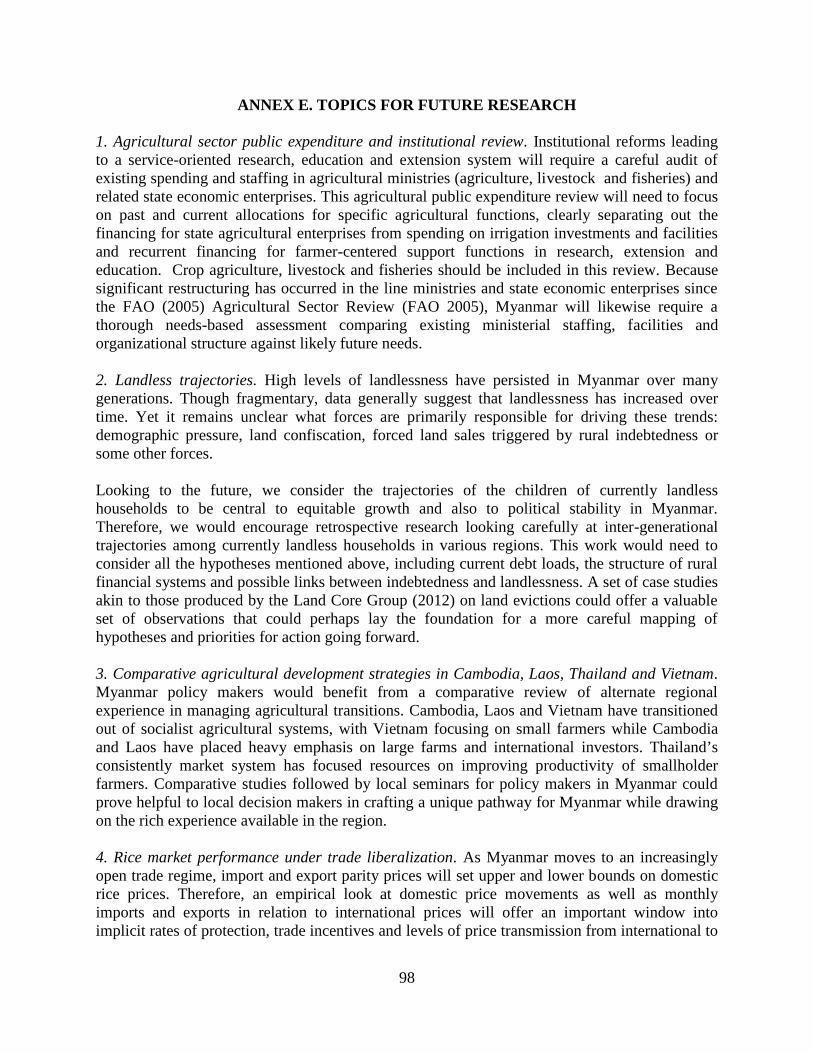
98
ANNEX E. TOPICS FOR FUTURE RESEARCH
1. Agricultural sector public expenditure and institutional review. Institutional reforms leadingto a service-oriented research, education and extension system will require a careful audit ofexisting spending and staffing in agricultural ministries (agriculture, livestock and fisheries) andrelated state economic enterprises. This agricultural public expenditure review will need to focuson past and current allocations for specific agricultural functions, clearly separating out thefinancing for state agricultural enterprises from spending on irrigation investments and facilitiesand recurrent financing for farmer-centered support functions in research, extension andeducation. Crop agriculture, livestock and fisheries should be included in this review. Becausesignificant restructuring has occurred in the line ministries and state economic enterprises sincethe FAO (2005) Agricultural Sector Review (FAO 2005), Myanmar will likewise require athorough needs-based assessment comparing existing ministerial staffing, facilities andorganizational structure against likely future needs.
2. Landless trajectories. High levels of landlessness have persisted in Myanmar over manygenerations. Though fragmentary, data generally suggest that landlessness has increased overtime. Yet it remains unclear what forces are primarily responsible for driving these trends:demographic pressure, land confiscation, forced land sales triggered by rural indebtedness orsome other forces.
Looking to the future, we consider the trajectories of the children of currently landlesshouseholds to be central to equitable growth and also to political stability in Myanmar.Therefore, we would encourage retrospective research looking carefully at inter-generationaltrajectories among currently landless households in various regions. This work would need toconsider all the hypotheses mentioned above, including current debt loads, the structure of ruralfinancial systems and possible links between indebtedness and landlessness. A set of case studiesakin to those produced by the Land Core Group (2012) on land evictions could offer a valuableset of observations that could perhaps lay the foundation for a more careful mapping ofhypotheses and priorities for action going forward.
3. Comparative agricultural development strategies in Cambodia, Laos, Thailand and Vietnam.Myanmar policy makers would benefit from a comparative review of alternate regionalexperience in managing agricultural transitions. Cambodia, Laos and Vietnam have transitionedout of socialist agricultural systems, with Vietnam focusing on small farmers while Cambodiaand Laos have placed heavy emphasis on large farms and international investors. Thailand’sconsistently market system has focused resources on improving productivity of smallholderfarmers. Comparative studies followed by local seminars for policy makers in Myanmar couldprove helpful to local decision makers in crafting a unique pathway for Myanmar while drawingon the rich experience available in the region.
4. Rice market performance under trade liberalization. As Myanmar moves to an increasinglyopen trade regime, import and export parity prices will set upper and lower bounds on domesticrice prices. Therefore, an empirical look at domestic price movements as well as monthlyimports and exports in relation to international prices will offer an important window intoimplicit rates of protection, trade incentives and levels of price transmission from international to
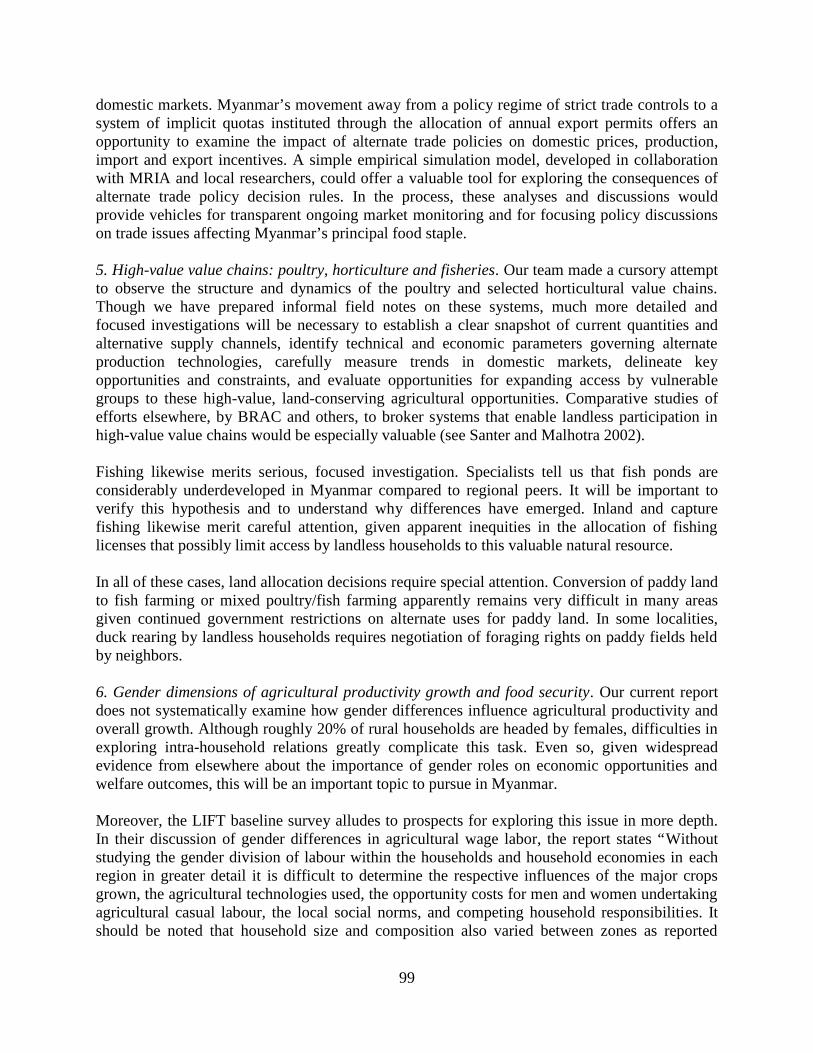
99
domestic markets. Myanmar’s movement away from a policy regime of strict trade controls to asystem of implicit quotas instituted through the allocation of annual export permits offers anopportunity to examine the impact of alternate trade policies on domestic prices, production,import and export incentives. A simple empirical simulation model, developed in collaborationwith MRIA and local researchers, could offer a valuable tool for exploring the consequences ofalternate trade policy decision rules. In the process, these analyses and discussions wouldprovide vehicles for transparent ongoing market monitoring and for focusing policy discussionson trade issues affecting Myanmar’s principal food staple.
5. High-value value chains: poultry, horticulture and fisheries. Our team made a cursory attemptto observe the structure and dynamics of the poultry and selected horticultural value chains.Though we have prepared informal field notes on these systems, much more detailed andfocused investigations will be necessary to establish a clear snapshot of current quantities andalternative supply channels, identify technical and economic parameters governing alternateproduction technologies, carefully measure trends in domestic markets, delineate keyopportunities and constraints, and evaluate opportunities for expanding access by vulnerablegroups to these high-value, land-conserving agricultural opportunities. Comparative studies ofefforts elsewhere, by BRAC and others, to broker systems that enable landless participation inhigh-value value chains would be especially valuable (see Santer and Malhotra 2002).
Fishing likewise merits serious, focused investigation. Specialists tell us that fish ponds areconsiderably underdeveloped in Myanmar compared to regional peers. It will be important toverify this hypothesis and to understand why differences have emerged. Inland and capturefishing likewise merit careful attention, given apparent inequities in the allocation of fishinglicenses that possibly limit access by landless households to this valuable natural resource.
In all of these cases, land allocation decisions require special attention. Conversion of paddy landto fish farming or mixed poultry/fish farming apparently remains very difficult in many areasgiven continued government restrictions on alternate uses for paddy land. In some localities,duck rearing by landless households requires negotiation of foraging rights on paddy fields heldby neighbors.
6. Gender dimensions of agricultural productivity growth and food security. Our current reportdoes not systematically examine how gender differences influence agricultural productivity andoverall growth. Although roughly 20% of rural households are headed by females, difficulties inexploring intra-household relations greatly complicate this task. Even so, given widespreadevidence from elsewhere about the importance of gender roles on economic opportunities andwelfare outcomes, this will be an important topic to pursue in Myanmar.
Moreover, the LIFT baseline survey alludes to prospects for exploring this issue in more depth.In their discussion of gender differences in agricultural wage labor, the report states “Withoutstudying the gender division of labour within the households and household economies in eachregion in greater detail it is difficult to determine the respective influences of the major cropsgrown, the agricultural technologies used, the opportunity costs for men and women undertakingagricultural casual labour, the local social norms, and competing household responsibilities. Itshould be noted that household size and composition also varied between zones as reported
100
earlier and may also influence the gender division of casual labour.” (LIFT 2012, p.21). If theLIFT data offer further room for exploring gender issues, then a focused exploration of thesedata could offer a quick window into general hypotheses about gender roles in agriculture,including asset holdings, access to land, livelihood strategies, agricultural input use, creditaccess, coping systems, food security, nutritional status and other welfare outcomes.
7. Deforestation, shifting cultivation and trends in agricultural land use. Agricultural expansion,shifting cultivation, and large scale land allocations are placing Myanmar’s forests underincreasing stress. Deforestation, in turn, affects water recharge rates, runoff and soil erosion. Yetthe scale of these processes and its impacts on rural household livelihoods remain imperfectlyunderstood. A careful assessment of available spatial data, coupled with focused, in-depth casestudies in selected zones, would provide useful guidance on key issues and options for managingagricultural and forest lands going forward.
8. Nutrition. We are not aware of any available analyses on the determinants of early childhoodmalnutrition in Myanmar. Such analysis could shed light on the role of maternal education andcustomary dietary restrictions during the pre-natal and post-natal periods on household nutritionoutcomes. Given the rich ethnic and cultural diversity, the determinants of malnutrition maydiffer in important ways across ethnic groups.
9. Infant and Young Child Feeding practice. Taboos about the consumption of certain foods,especially during pregnancy, exist in Myanmar. However, documentation of these taboos islacking (at least in the English language). Effective design of policies and programs to improvefood consumption patterns of subgroups (whether increasing quantity or quality of calories) willrequire a thorough understanding of food taboos.
10. Education. It will be important to better understand current barriers to school attendance andeducational attainment and how such barriers may differ across different socio-economic groups,ethnic groups and geographic areas. It is also unclear whether official literacy rates in facttranslate into functional literacy; and whether high official literacy rates mean most people arealso numerate. Learning outcomes depend on many features of the educational system as well ason the health and nutritional status of children in school. Unraveling these myriad influences willbe important to efforts aimed at improving the human capital of children from poor andvulnerable households.
