a study by gallup and inside higher ed -...
TRANSCRIPT

WWW.INSIDEHIGHERED.COMWWW.INSIDEHIGHERED.COM
College & UniversityAdmissions Directors
SCOTT JASCHIK & DOUG LEDERMANEDITORS, INSIDE HIGHER ED
A study by Gallup® and Inside Higher Ed
THE 2015 INSIDE HIGHER ED SURVEY OF
SUPPORT FOR THIS PROJECT PROVIDED BY

THE 2015 INSIDE HIGHER ED SURVEY OF
COLLEGE & UNIVERSITY ADMISSIONS DIRECTORSA study by Gallup and Inside Higher Ed
COPYRIGHT
This document contains proprietary research, copyrighted materials, and literary property of Gallup, Inc. No changes may be made to this document without the express written permission of Gallup, Inc. Gallup® and Gallup University® are trademarks of Gallup, Inc. All other trademarks are property of their respective owners.
Inside Higher Ed1015 18th Street NW, Suite 1100Washington, DC 20036t 202.659.9208
Gallup901 F Street, NWWashington, DC 20004t 202.715.3030

©2015 Jenzabar, Inc. All rights reserved. Jenzabar® is a registered trademark of Jenzabar, Inc. The Jenzabar logo is a trademark of Jenzabar, Inc.*Based on total new institution sales of higher education student information systems during the 2009 – 2013 period.
ERP Continuing Education Retention Managed Services Analytics LMS CRM
Recruitment SIS Advancement Consulting Services Portal Cloud Mobile
Imagine delivering a personalized educational experience with Jenzabar.
Learn more: jenzabar.com/enrollment
Jenzabar student information systems are chosen more often than any other SIS.*
Maximize Enrollment
Increase Student Success
Personalize Student Interactions

4INSIDE HIGHER ED 2015 SURVEY OF COLLEGE AND UNIVERSITY ADMISSIONS DIRECTORS
TABLE OF CONTENTS
Foreword ........................................................................................................................5Snapshot of Findings...................................................................................................6Methodology .................................................................................................................9Detailed Findings ........................................................................................................10 Focus on Recruitment .......................................................................................10 Applicant Admissions .......................................................................................15 Pathways Programs ..........................................................................................19 Internal Pressure to Admit Certain Applicants .............................................20 Admissions Practices .......................................................................................22 Student Enrollment Goals ................................................................................23 Student Debt .......................................................................................................24 Policy ....................................................................................................................25 AffirmativeAction ..............................................................................................26 Applicant Disciplinary Records ........................................................................30 New Approaches to Admissions ....................................................................32 Out-of-State Admissions ..................................................................................34 Community Colleges .........................................................................................36Institution and Personal Demographics ................................................................39About Inside Higher Ed ..............................................................................................41About Gallup ................................................................................................................41

5INSIDE HIGHER ED 2015 SURVEY OF COLLEGE AND UNIVERSITY ADMISSIONS DIRECTORS
FOREWORD
Increasingly, higher education institutions in America are rethinking their admissions and recruiting practices todrawstudentswhowillbeagoodfitwiththeirinstitutionalculture.
This study, part of a series of surveys of key campus leaders by Inside Higher Ed and Gallup, explores important questions about higher education admissions and recruiting policies and procedures as perceived by those grappling with key issues. Among the questions addressed by the study:
• What undergraduate student populations are the focus of recruitment efforts?
• Do institutions admit students from some subgroups in spite of lower academic performance than those typically admitted? Should they?
• Should standardized test scores (such as SAT or ACT) be optional for students applying to a college or university?
• Did colleges meet their enrollment goals this year?
• Are institutions losing potential applicants because of concerns about student debt?
• How common are pathways programs for international students?
• Havehigh-rankinguniversityofficialstriedtoinfluenceadmissionsdecisionsoncertainwell-connectedapplicants?
• How concerned are admissions directors about their ability to consider race and ethnicity in admissions withtheSupremeCourtpreparingtohearanothercaseonaffirmativeaction?Whatstepsmightinstitutionstake if the Supreme Court does ban the use of race in admissions decisions?
• To what extent do colleges seek disciplinary records on applicants?
• What do admissions directors think of some of the new admissions approaches being tried at certain colleges?
• Are public institutions seeking more out-of-state students as a response to budgetary challenges?
• Aretwo-yearinstitutionsexperiencingcompetitionwithfor-profitcollegesanduniversities?
• Are two-year institutions enrolling more students who typically might attend four-year colleges?

6INSIDE HIGHER ED 2015 SURVEY OF COLLEGE AND UNIVERSITY ADMISSIONS DIRECTORS
SNAPSHOT OF FINDINGS
Someofthespecificfindingsfromthestudyinclude:
• Six in 10 admission directors (61 percent) strongly agree that they are very likely to increase their full-time undergraduate recruitment efforts and 47 percent strongly agree they are likely to increase the recruitment of transfer students.
• Twenty-eight percent of admissions directors say admitted minority applicants and athletes at their institution have lower grades and test scores on average than do other applicants.
• Half of admissions directors say minority students (52 percent) and veterans (50 percent) should be given preferential treatment in admissions decisions.
• Nearly one-third of admissions directors (32 percent) say their institution currently has a pathways program for international students and 37 percent say it is a key part of their recruitment strategy.
• About one in four admissions directors say they have received pressure from various high-ranking administrators or trustees to admit applicants who were well-connected politically and otherwise. Forty-four percent agree such pressure is never appropriate, but 33 percent disagree.
• Admissions directors are divided on whether standardized test scores should be optional. Forty-one percent agree they should be optional and 44 percent disagree.
• Half of admissions directors (51 percent) said they were very concerned about meeting their enrollment goals for the 2015-16 academic year. Fifty-eight percent say they did not meet their goals.
• Three-quarters of admissions directors, 76 percent, think their institution is losing applicants because of concerns about student debt. Those working at private colleges are much likelier than those at public institutions to say this.
• Most admissions directors, 73 percent, consider student debt under $30,000 to be a reasonable amount toaccumulateinafour-yearperiod.Admissionsdirectorsatprivatenonprofitcollegesaremorelikely than their public college peers to endorse higher debt levels.
• While no admissions directors say their institution has falsely reported standardized test scores or other admissions data to groups that produce college rankings, an overwhelming majority (92 percent) believe other institutions have done so.

7INSIDE HIGHER ED 2015 SURVEY OF COLLEGE AND UNIVERSITY ADMISSIONS DIRECTORS
SNAPSHOT OF FINDINGS (cont.)
• Admissions directors are generally not overly concerned about their college’s ability to consider race and ethnicity in admissions as the Supreme Court prepares to consider another case on the issue -- 39 percent are either very or somewhat concerned. Seven in 10 have not had any discussions about how they might handle admissions differently if race is banned from consideration.
• The majority of admissions directors, 59 percent, say institutions should ask all applicants to report all disciplinary or legal infractions. Sixty-one percent say they seek disciplinary records on applicants.
• Admissions directors are more likely to describe a series of new approaches to admissions as bad rather than good ideas, including allowing applicants to decide what materials to submit, having applicants submit a two-minute video and two examples of high school work, or having applicants submit four research papers on pre-selected topics that are graded by faculty members.
• Most admissions directors at public institutions say their universities are seeking more out-of-state students. However,onlyoneinfivereportfacingpoliticalorpublicscrutinyforthoseefforts.
• Admissions directors at two-year institutions are about equally likely to say they have seen a decrease as to say they have seen an increase in enrollment of students who normally would attend four-year institutions.Twointhreesaytheirinstitutionisexperiencingatleastsomecompetitionfromfor-profitinstitutionsinallfieldsandprograms.

Connecting learning to life from start to finish
© 2015 Hobsons. All rights reserved worldwide. 150925

9INSIDE HIGHER ED 2015 SURVEY OF COLLEGE AND UNIVERSITY ADMISSIONS DIRECTORS
METHODOLOGY
ThefollowingreportpresentsfindingsfromaquantitativesurveyresearchstudythatGallupconductedonbehalfof Inside Higher Ed. The study’s objective was to learn the practices and perceptions of senior-level college and universityadmissionsandenrollmentofficersrelatedtorecruitmentpolicies,admissionsprocedures,financialaidand education policy.
Gallup education consultants developed the questionnaire in collaboration with Scott Jaschik and Doug Lederman of Inside Higher Ed.Specialtycolleges,namelyBiblecollegesandseminarieswithaCarnegieCodeclassification of 24, and institutions with enrollment fewer than 500 students were excluded from the sample.
Gallup conducted the survey from August 3-25, 2015. Gallup sent invitations via email to 2,575 admissions directors andenrollmentofficers,withregularreminderssentthroughoutthefieldperiod.Gallupcollected264completedWeb surveys, yielding a 10 percent response rate. Respondents represented 107 public institutions, 151 private institutionsandfiveinstitutionsfromthefor-profitsector.
Data are not statistically adjusted (weighted). Some sectors do not have data reported due to low N sizes. Sector groupings are determined based on the 2010 Carnegie Code for the institution. The survey is an attempted census ofalladmissionsdirectors/enrollmentofficersusingthemostcomprehensivesampleinformationavailable.How-ever, gaps in coverage of the sample, along with the participation rate, mean the results from this sample represent theviewsofthosewhoparticipatedinthesurveyandcannot,withahighdegreeofconfidence,beprojectedtothebroader population of admissions directors.
Inadditiontosamplingerror,questionwordingandpracticaldifficultiesinconductingsurveyscanintroduceerror orbiasintothefindingsofopinionpolls.Insomecases,reportedfrequenciesmaynotaddupto100percentdue to rounding. “Don’t know” and “Refused” responses are excluded from the results.
Total Participation by Sector
All Institutions by Sector Public Private Nonprofit
All PublicPrivate
Nonprofit For-Profit*
Doctoral / Master’s /
Baccalaureate Assoc.Doctoral / Master’s Bacc. Assoc.*
TOTAL N 264 107 151 5 61 42 71 64 2
*Data are not reported for these groups due to small sample size.Note:Thetotalsamplesizeincludesoneinstitutionthatcouldnotbecategorizedaspublic,privatenonprofitorfor-profitduetomissingsample information. Fourpublicinstitutionsand15privatenonprofitinstitutionscouldnotbecategorizedbyhighestdegreeofferingduetomissingsample information.

10INSIDE HIGHER ED 2015 SURVEY OF COLLEGE AND UNIVERSITY ADMISSIONS DIRECTORS
DETAILED FINDINGS
FOCUS ON RECRUITMENT
Admissionsdirectorswereaskedtoreflectondifferentstudentgroupsandwhethertheywerelikelytoincreasetheir efforts to recruit those groups. The directors surveyed are most likely to say they will increase recruitment of full-time undergraduates (61 percent) and transfers (47 percent). Slightly fewer strongly agree they will push recruit-ment of out-of-state students (39 percent), minority students (36 percent) and international students (36 percent). About one-quarter strongly agree they will increase recruitment efforts for full-pay students (28 percent), students recruitedwithmeritscholarships(27percent)andfirst-generationcollegestudents(25percent).Admissionsdirectors are least likely to strongly agree they will increase recruitment of veterans, older students, online students and part-time undergraduates.
Admissions directors at public institutions are a bit more likely than those at private institutions to indicate they areincreasingeffortstorecruitminoritystudents,first-generationcollegestudents,veteransandpart-timeunder-graduates. Private institution admissions directors are more likely than those at public institutions to say they are increasing recruitment of full-pay students.
Using a five-point scale, where 5 means strongly agree and 1 means strongly disagree, please
indicate your level of agreement with the following statements about undergraduate applicant
populations.
This year at my institution, I am very likely to increase my recruitment efforts for the following
populations of undergraduate applicants to my institution:
All Institutions by Sector Public Private Nonprofit
All PublicPrivate
NonprofitDoctoral /
Master’s / Bacc. Assoc.Doctoral / Master’s Bacc.
Full-time undergraduates
%5 Strongly agree 61 58 64 63 53 63 68
%4 26 29 24 25 33 21 24
%3 8 8 8 7 10 10 6
%2 2 2 3 2 3 4 0
%1 Strongly disagree 2 3 1 3 3 1 2
Transfer students
%5 Strongly agree 47 46 49 63 20 49 48
%4 26 23 27 26 17 30 27
%3 14 19 12 11 31 7 12
%2 9 8 8 0 23 7 10
%1 Strongly disagree 4 3 4 0 9 6 3

11INSIDE HIGHER ED 2015 SURVEY OF COLLEGE AND UNIVERSITY ADMISSIONS DIRECTORS
FOCUS ON RECRUITMENT (cont.)
All Institutions by Sector Public Private Nonprofit
All PublicPrivate
NonprofitDoctoral /
Master’s / Bacc. Assoc.Doctoral / Master’s Bacc.
Out-of-state students
%5 Strongly agree 61 58 64 63 53 63 68
%4 26 29 24 25 33 21 24
%3 8 8 8 7 10 10 6
%2 2 2 3 2 3 4 0
%1 Strongly disagree 2 3 1 3 3 1 2
Minority students
%5 Strongly agree 36 42 31 41 41 25 42
%4 35 31 37 32 32 41 32
%3 24 22 25 22 24 25 22
%2 5 4 6 5 3 10 2
%1 Strongly disagree 1 0 1 0 0 0 3
International students
%5 Strongly agree 36 33 37 41 21 44 34
%4 24 22 26 33 8 24 29
%3 21 20 22 15 28 16 26
%2 10 15 7 9 21 9 6
%1 Strongly disagree 9 11 8 2 23 7 5
Full-pay students
%5 Strongly agree 28 22 31 20 21 34 30
%4 23 21 26 25 14 26 28
%3 26 30 25 39 18 23 25
%2 14 13 13 8 25 12 12
%1 Strongly disagree 8 13 5 8 21 5 5

12INSIDE HIGHER ED 2015 SURVEY OF COLLEGE AND UNIVERSITY ADMISSIONS DIRECTORS
FOCUS ON RECRUITMENT (cont.)
All Institutions by Sector Public Private Nonprofit
All PublicPrivate
NonprofitDoctoral /
Master’s / Bacc. Assoc.Doctoral / Master’s Bacc.
Students recruited with merit scholarships
%5 Strongly agree 27 29 27 39 4 28 24
%4 33 31 34 31 35 34 41
%3 26 24 28 22 30 25 27
%2 4 6 3 3 9 6 0
%1 Strongly disagree 9 11 8 5 22 7 8
First-generation college students
%5 Strongly agree 25 33 19 23 49 17 22
%4 34 37 33 37 38 38 30
%3 32 25 37 35 10 36 33
%2 7 2 9 4 0 7 12
%1 Strongly disagree 2 2 2 2 3 1 3
Veterans/military personnel
%5 Strongly agree 21 30 14 23 44 15 16
%4 31 34 28 37 31 35 19
%3 30 28 31 35 15 28 31
%2 16 7 22 5 10 21 26
%1 Strongly disagree 3 0 5 0 0 1 9
Students older than 24
%5 Strongly agree 18 19 17 13 28 23 9
%4 21 27 16 21 38 13 18
%3 30 33 28 38 21 27 27
%2 12 13 13 17 8 13 13
%1 Strongly disagree 19 8 28 11 5 23 33

13INSIDE HIGHER ED 2015 SURVEY OF COLLEGE AND UNIVERSITY ADMISSIONS DIRECTORS
FOCUS ON RECRUITMENT (cont.)
All Institutions by Sector Public Private Nonprofit
All PublicPrivate
NonprofitDoctoral /
Master’s / Bacc. Assoc.Doctoral / Master’s Bacc.
Online students
%5 Strongly agree 17 16 18 15 19 24 12
%4 24 32 16 27 41 14 17
%3 16 21 13 17 22 14 10
%2 15 15 15 19 11 19 14
%1 Strongly disagree 27 16 37 23 8 31 48
Part-time undergraduates
%5 Strongly agree 15 24 9 11 40 10 6
%4 10 15 6 11 20 8 4
%3 29 32 27 34 28 26 26
%2 19 15 22 19 10 25 17
%1 Strongly disagree 27 15 36 25 3 31 48

UNIVERSITY’S
© Copyright 2015 ELS Educational Services, Inc., – a Berlitz company.
Attract qualified scholars from around the world. Strengthen and diversify your international recruitment master plan with ELS.
InternationalStudentRecruitment.org
ELS INTERNATIONAL PATHWAYS®
VISIBILITYGLOBAL
Learn More
Recruiting degree candidates from around the world, contact: Ms. Lisa Magliozzo • [email protected]
Mr. Curt Eley Vice President of Recruitment Alliance Strategies
Office: +1.609.759.5505 • Mobile: +1.972.814.4767 Email: [email protected]
yourRAISE
2015 IE_NAFSA News ad.indd 1 9/23/15 12:08 PM

15INSIDE HIGHER ED 2015 SURVEY OF COLLEGE AND UNIVERSITY ADMISSIONS DIRECTORS
APPLICANT ADMISSIONS
Admissions directors generally do not believe members of certain groups are admitted to their institutions with low-er grades and test scores than their other students. Of a list of eight groups that may get special consideration for admission, admissions directors are most likely to say athletes (28 percent) and minority students (28 percent) had lower grades and test scores, on average, than other students typically admitted. They are less likely to say veterans (17 percent), children of alumni (12 percent), international students (12 percent), full-pay students (9 percent) and men (8 percent) and women (2 percent) had lower grades and test scores than other admitted students.
Private college admissions directors are more likely than public university admissions directors to say minority students, children of alumni and full-pay students tended to have lower grades and test scores than other students who attend.
Many institutions admit some applicants who apply with lower grades and test scores than those
typically admitted. For the following groups, do your institution’s admitted applicants, on average,
have lower grades and test scores than do other applicants?
All Institutions by Sector Public Private Nonprofit
All PublicPrivate
NonprofitDoctoral /
Master’s / Bacc. Assoc.Doctoral / Master’s Bacc.
Athletes
% Yes 28 31 27 35 18 34 20
% No 72 69 73 65 82 66 80
Minority students
% Yes 28 23 31 23 15 34 26
% No 72 78 69 77 85 66 74
Veterans
% Yes 17 18 16 20 15 18 16
% No 83 82 84 80 85 82 84
Children of alumni
% Yes 12 4 15 4 7 18 15
% No 88 96 85 96 93 82 85
International students
% Yes 12 9 14 9 9 15 13
% No 88 91 86 91 91 85 87

16INSIDE HIGHER ED 2015 SURVEY OF COLLEGE AND UNIVERSITY ADMISSIONS DIRECTORS
APPLICANT ADMISSIONS (cont.)
All Institutions by Sector Public Private Nonprofit
All PublicPrivate
NonprofitDoctoral /
Master’s / Bacc. Assoc.Doctoral / Master’s Bacc.
Full-pay students
% Yes 9 3 12 4 0 11 16
% No 91 97 88 96 100 89 84
Men (for gender balance)
% Yes 8 4 10 2 11 8 13
% No 92 96 90 98 89 92 87
Women (for gender balance)
% Yes 2 1 3 0 0 2 5
% No 98 99 97 100 100 98 95
When admissions directors were asked if they feel institutions like theirs shouldadmitapplicantsfromspecificgroups even if they apply with lower grades and test scores than other applicants, half say minority students (52 percent) and veterans (50 percent) should be given preferential treatment. Thirty-seven percent say athletes should get special consideration and 32 percent say children of alumni should as well. Admissions directors generally do not think men and women should be admitted with lower grades and test scores to try to achieve gender balance.
Private college admissions directors are more likely than public college admissions directors to believe some minority students and children of alumni should be admitted with lower test scores and grades. Public university admissions directors are more inclined to say some veterans should get that consideration.
In your opinion, should institutions like yours admit some applicants from the following groups
even if they apply with lower grades and test scores than other applicants?
All Institutions by Sector Public Private Nonprofit
All PublicPrivate
NonprofitDoctoral /
Master’s / Bacc. Assoc.Doctoral / Master’s Bacc.
Minority students
% Yes 52 46 56 42 48 53 60
% No 48 54 44 58 52 47 40
Veterans
% Yes 50 57 45 60 48 47 45
% No 50 43 55 40 52 53 55

17INSIDE HIGHER ED 2015 SURVEY OF COLLEGE AND UNIVERSITY ADMISSIONS DIRECTORS
APPLICANT ADMISSIONS (cont.)
All Institutions by Sector Public Private Nonprofit
All PublicPrivate
NonprofitDoctoral /
Master’s / Bacc. Assoc.Doctoral / Master’s Bacc.
Athletes
% Yes 37 35 39 38 27 42 39
% No 63 65 61 62 73 58 61
Children of alumni
% Yes 32 22 37 21 27 35 44
% No 68 78 63 79 73 65 56
International students
% Yes 25 21 26 22 20 31 20
% No 75 79 74 78 80 69 80
Full-pay students
% Yes 22 20 23 14 29 22 27
% No 78 80 77 86 71 78 73
Men (for gender balance)
% Yes 20 19 21 14 27 19 22
% No 80 81 79 86 73 81 78
Women (for gender balance)
% Yes 18 16 19 12 26 17 21
% No 82 84 81 88 74 83 79

SPEND LESS TIME GATHERING AND PROCESSING DATA.
SPEND MORE TIME IMPROVING ENROLLMENT RESULTS.
LIAISON’S ENROLLMENT MANAGEMENT, CRM AND MARKETING SOLUTIONS HELP YOU:Manage complex admissions processes across schools and programs more effectively
Deploy marketing campaigns that connect the unique value of your programs to prospective students
Increase the ability for admissions staff to focus on recruiting
www.liaisonedu.com

19INSIDE HIGHER ED 2015 SURVEY OF COLLEGE AND UNIVERSITY ADMISSIONS DIRECTORS
PATHWAYS PROGRAMS
Admissions directors were asked to respond to a series of questions relating to pathways programs for internation-al students, which combine academic coursework and English language coursework to help prepare them. Nearly one-third of admissions directors (32 percent) say their institution currently has a pathways program, including 50 percent of those working at public institutions and 20 percent of those from private colleges.
For those admissions directors working at universities that have a pathways program, 37 percent say their path-ways program is a key part of their institution’s recruitment strategy. For those directors indicating their institution does not have a pathways program, 30 percent say they are considering implementing such a program.
Pathways programs sometimes refer to formal units in which students have not yet been admitted to the college itself. However, some institutions use the term for less formal efforts to help international students already enrolled.
As you may know, pathways programs are a combination of academic coursework and English
language coursework designed to prepare international students for degree programs
in the United States.
All Institutions by Sector Public Private Nonprofit
All PublicPrivate
NonprofitDoctoral /
Master’s / Bacc. Assoc.Doctoral / Master’s Bacc.
Does your institution currently have a pathways program?
% Yes 32 50 20 60 39 33 8
% No 68 50 80 40 61 67 92
Is your pathways program a key part of your applicant recruitment strategy?*
% Yes 37 40 n/a 37 n/a n/a n/a
% No 63 60 n/a 63 n/a n/a n/a
Are you considering implementing a pathways program at your institution?**
% Yes 30 29 30 n/a n/a 40 24
% No 70 71 70 n/a n/a 60 76
* Asked only of respondents who indicated their institution has a pathways program (n=71).**Asked only of respondents who indicated their institution does not have a pathways program (n=143).n/a: Not reported due to small sample sizes.

20INSIDE HIGHER ED 2015 SURVEY OF COLLEGE AND UNIVERSITY ADMISSIONS DIRECTORS
PATHWAYS PROGRAMS (cont.)
Relatively few admissions directors, 13 percent, believe fabrication of international applications are a prevalent problem at their institution.
All Institutions by Sector Public Private Nonprofit
All PublicPrivate
NonprofitDoctoral /
Master’s / Bacc. Assoc.Doctoral / Master’s Bacc.
Are fabrications on international admissions applications a prevalent problem at your institution?
% Yes 13 18 10 18 19 10 11
% No 87 82 90 82 81 90 89
INTERNAL PRESSURE TO ADMIT APPLICANTS
Arecentinvestigationfoundthethen-presidentofamajoruniversityhadintervenedwithadmissionsofficersondecisions regarding applicants who were well-connected politically and otherwise. Admissions directors were askedwhethertheyhadeverbeenpressuredtoadmitcertainapplicantsbyinfluentialpeopleassociatedwiththeiruniversity. About one in four admissions directors say senior-level administrators (24 percent), trustees or board members(22percent)ordevelopmentofficerepresentatives(26percent)hadtriedtoinfluencedecisionsoncertaincandidates. Reports of such pressure are more common at private rather than public institutions, and at four-year rather than two-year institutions.
As you may know, an investigation this year revealed cases in which the then-president of the
University of Texas at Austin intervened with admissions officers on the decisions involving
applicants who were well-connected, politically and otherwise.
All Institutions by Sector Public Private Nonprofit
All PublicPrivate
NonprofitDoctoral /
Master’s / Bacc. Assoc.Doctoral / Master’s Bacc.
Have senior level administrators tried to influence you to admit some applicants?
% Yes 24 18 29 20 17 33 25
% No 76 82 71 80 83 67 75
Have institution trustees or board members tried to influence you to admit some applicants?
% Yes 22 11 29 15 3 36 21
% No 78 89 71 85 97 64 79
Have development office representatives or big donors tried to influence you to admit some applicants?
% Yes 26 15 32 22 3 38 32
% No 74 85 68 78 97 62 68

21INSIDE HIGHER ED 2015 SURVEY OF COLLEGE AND UNIVERSITY ADMISSIONS DIRECTORS
INTERNAL PRESSURE TO ADMIT APPLICANTS (cont.)
Please indicate your level of agreement or disagreement with the following statements.
All Institutions by Sector Public Private Nonprofit
All PublicPrivate
NonprofitDoctoral /
Master’s / Bacc. Assoc.Doctoral / Master’s Bacc.
It is never appropriate for a president, a board member or a high-ranking official to lobby on behalf of an applicant.
%5 Strongly agree 30 46 20 46 46 16 19
%4 14 14 12 11 22 13 13
%3 23 20 26 19 19 26 26
%2 22 12 29 19 3 33 24
%1 Strongly disagree 11 7 14 5 11 13 18
Responding to pressure from high-ranking officials to admit certain applicants, in moderation,
is a reasonable way to promote financial support for my institution.
%5 Strongly agree 6 3 8 4 3 7 11
%4 19 8 27 5 13 28 28
%3 27 22 29 21 25 34 26
%2 15 19 12 23 9 9 11
%1 Strongly disagree 33 48 24 46 50 21 23

22INSIDE HIGHER ED 2015 SURVEY OF COLLEGE AND UNIVERSITY ADMISSIONS DIRECTORS
ADMISSIONS PRACTICES
Forty-four percent of admissions directors strongly agree and an additional 36 percent agree that merit scholar-shipsareanappropriateuseoftheirinstitution’sfinancialresources.However,mostadmissionsdirectorsstronglydisagree (62 percent) that they are prioritizing a student’s ability to pay in making admissions decisions because of therecentfinancialdownturn.
Admissions directors are divided on whether standardized test scores should be optional for students applying to their institution -- 41 percent agree they should be optional and 44 percent disagree.
Using a five-point scale, where 5 means strongly agree and 1 means strongly disagree,
please indicate your level of agreement with the following items.
All Institutions by Sector Public Private Nonprofit
All PublicPrivate
NonprofitDoctoral /
Master’s / Bacc. Assoc.Doctoral / Master’s Bacc.
Merit scholarships are an appropriate use of our institution’s financial resources.
%5 Strongly agree 44 49 41 53 40 39 45
%4 36 33 38 36 27 39 35
%3 12 14 11 10 23 14 8
%2 5 4 5 2 10 4 5
%1 Strongly disagree 3 0 5 0 0 4 6
Standardized test scores (such as SAT or ACT) should be optional for students who apply to my institution.
%5 Strongly agree 27 16 32 10 29 25 34
%4 14 21 10 28 8 10 11
%3 15 13 16 10 21 13 18
%2 23 27 20 26 25 19 25
%1 Strongly disagree 21 22 22 26 17 32 11
Because of the financial downturn, we are prioritizing an applicant’s ability to pay in making admissions decisions.
%5 Strongly agree 3 2 2 0 8 1 3
%4 6 1 9 2 0 6 15
%3 13 4 19 4 4 19 18
%2 16 11 19 11 8 18 23
%1 Strongly disagree 62 82 51 84 79 56 41

23INSIDE HIGHER ED 2015 SURVEY OF COLLEGE AND UNIVERSITY ADMISSIONS DIRECTORS
STUDENT ENROLLMENT GOALS
Admissions directors were commonly concerned about meeting their institution’s new enrollment goals for the 2015-16 academic year -- 51 percent said they were very concerned and another 31 percent were moderately concerned. High levels of concern were more common among admissions directors at two-year public colleges (63 percent) than among admissions directors at four-year public colleges (38 percent).
Admissions directors’ elevated concerns seem appropriate given that the majority, 58 percent, say their institution did not meet their enrollment goals for the 2015-16 academic year prior to May 1. This includes 80 percent of those at community colleges, 61 percent of those at private baccalaureate colleges, 54 percent at private doctoral or master’s institutions and 47 percent at public four-year institutions.
Using a five-point scale, where 5 means strongly agree and 1 means strongly disagree,
please indicate your level of agreement with the following items.
All Institutions by Sector Public Private Nonprofit
All PublicPrivate
NonprofitDoctoral /
Master’s / Bacc. Assoc.Doctoral / Master’s Bacc.
Thinking back, please indicate how concerned you were about meeting your institution’s new student enrollment goals
for the 2015-16 academic year:
% Very concerned 51 47 54 38 63 53 57
% Moderately concerned 31 35 28 40 28 26 29
% Not too concerned 12 13 11 17 8 9 13
% Not concerned at all 7 6 7 5 3 13 2
Did your institution meet its new student enrollment goals this year prior to May 1, 2015?
% Yes 42 42 42 53 20 46 39
% No 58 58 58 47 80 54 61

24INSIDE HIGHER ED 2015 SURVEY OF COLLEGE AND UNIVERSITY ADMISSIONS DIRECTORS
STUDENT DEBT
An area of increasing concern for recent graduates, prospective students, and parents are the sometimes huge amounts of debt college students can accumulate when working toward a degree. Seventy-six percent of admission directors believe their institution is losing prospective applicants because of concern about student loan debt. The concern is much greater among those at private institutions (87 percent) than those at public ones (57 percent). Admissions directors at public two-year institutions (43 percent) are less likely to see debt as an issue affecting their potential student pool.
When asked what is an appropriate level of debt to accumulate toward a four-year degree, most admissions directorsgiveafigureof$30,000orless,withthemostcommonlevelsbeingbetween$10,000and$20,000(26percent) or between $20,000 and $30,000 (34 percent). Private college admissions directors are more likely to endorse higher debt levels -- 37 percent think debt of $30,000 or greater is reasonable, compared with 9 percent of those at public institutions.
Using a five-point scale, where 5 means strongly agree and 1 means strongly disagree, please indi-
cate your level of agreement with the following items.
All Institutions by Sector Public Private Nonprofit
All PublicPrivate
NonprofitDoctoral /
Master’s / Bacc. Assoc.Doctoral / Master’s Bacc.
Do you think that your institution is losing potential applicants due to concerns about accumulating student loan debt?
% Yes 76 57 87 69 43 84 89
% No 24 43 13 31 57 16 11
In your opinion, what is a reasonable amount of loan debt from all sources for an undergraduate student to accumulate
over a four-year period?
% No amount of loan debt is reasonable 1 2 0 2 3 0 0
% Under $5,000 2 5 0 2 11 0 0
% $5,000 to less than $10,000 10 22 2 16 32 0 3
% $10,000 to less than $20,000 26 37 20 40 32 16 29
% $20,000 to less than $30,000 34 25 41 28 19 44 40
% $30,000 to less than $40,000 17 7 24 10 3 24 21
% $40,000 to less than $50,000 6 1 9 2 0 11 5
% $50,000 or more 4 1 4 2 0 4 2

25INSIDE HIGHER ED 2015 SURVEY OF COLLEGE AND UNIVERSITY ADMISSIONS DIRECTORS
POLICY
Rankings of colleges put out by various organizations receive a lot of media attention and can be an important tool for prospective students and parents when choosing where to apply. As such, there is a temptation for colleges to provide information, including false information, to achieve a higher ranking. Admissions directors are convinced that many colleges succumb to this temptation, as 92 percent believe other institutions have provided false infor-mation on average test scores or other admissions data to groups doing college rankings. However, admissions directors are near unanimous in saying their own institution has not provided false information.
Recently there have been academic scandals involving higher education institutions falsely reporting
standardized test scores or other admissions data to groups that do college rankings.
All Institutions by Sector Public Private Nonprofit
All PublicPrivate
NonprofitDoctoral /
Master’s / Bacc. Assoc.Doctoral / Master’s Bacc.
Has your institution falsely reported standardized test scores or other admissions data?
% Yes <1% 0 1 0 0 0 2
% No 100 100 99 100 100 100 98
Do you think other higher education institutions have falsely reported standardized test scores or other admissions data?
% Yes 92 87 95 91 84 98 92
% No 8 13 5 9 16 2 8
One statistic that may be of special interest to certain prospective students is the percentage of lesbian, gay, bisexual or transgender students who are enrolled. However, most admissions directors, 67 percent, do not believe institutions should include voluntary questions on applications asking about sexual orientation or gender identity.
In your opinion, should higher education institutions add a voluntary question on their admissions application
about sexual orientation or gender identity?
% Yes 33 31 36 38 21 37 36
% No 67 69 64 62 79 63 64

26INSIDE HIGHER ED 2015 SURVEY OF COLLEGE AND UNIVERSITY ADMISSIONS DIRECTORS
AFFIRMATIVE ACTION
The U.S. Supreme Court has agreed to hear another case that challenges the use of race and ethnicity in college admissions, with the ruling likely to be issued next spring. Most admissions directors are not concerned that their institution will lose the ability to take race, ethnicity or gender into account when deciding to admit an applicant, with just 39 percent very or moderately concerned. Those working at public four-year colleges (43 percent) and private colleges (42 percent) are much more concerned than those working at two-year institutions (13 percent), which generally have more open admissions policies.
Relatively few admissions directors say there have been discussions -- let alone action -- at their institution about how they would handle admissions if race or similar factors were to be banned from consideration. Six percent of admissions directors say their institution has a plan for how to handle admissions if the Supreme Court bars affirmativeaction,andanother23percentsaytheyhavehaddiscussionsonhowtheymighthandlerace-neutraladmissions. Those at four-year public institutions are most likely to report having discussed a plan or having already devised one.
As you know, the Supreme Court is currently considering a case which could scale back the ability
of colleges and universities to consider race and ethnicity in admissions decisions.
All Institutions by Sector Public Private Nonprofit
All PublicPrivate
NonprofitDoctoral /
Master’s / Bacc. Assoc.Doctoral / Master’s Bacc.
How concerned are you that colleges may lose the ability to consider race, ethnicity and gender in admissions decisions,
financial decisions, or programs?
% Very concerned 12 13 12 19 3 14 10
% Moderately concerned 27 22 30 24 10 34 26
% Not too concerned 29 23 32 22 23 26 44
% Not concerned at all 32 43 25 36 63 26 21
As of right now, what, if anything, has your institution done to address the possibility that the Supreme Court might restrict
or ban the consideration of race in admissions?
% My institution has made aspecificplanforhowitwill handle admissions if the Supreme Court limits or bans considering race in admissions.
6 15 2 16 0 2 2
% My institution has had discussions on how it might handle admissions differently.
23 24 22 28 0 24 23
% My institution has not yet had discussions on how it might handle admis-sions differently.
71 61 76 56 100 75 74

27INSIDE HIGHER ED 2015 SURVEY OF COLLEGE AND UNIVERSITY ADMISSIONS DIRECTORS
AFFIRMATIVE ACTION (cont.)
Among a range of possible approaches colleges could take to ensure race-neutral admissions, directors are most likelytoagreethattheirinstitutionwouldplacemoreemphasisonfirst-generationstatusinthereviewprocess(29percent strongly agree or agree), give more consideration to applicant socioeconomic status (27 percent) and use non-cognitive measures (31 percent) to evaluate applicants. Very few believe their institution would drop standard-ized test requirements, admit a certain percent of the top-ranking students from every high school in the state, or droppreferencesforalumnichildreninresponsetoapotentialSupremeCourtbanonaffirmativeaction.
It is important to note that on these items the percentages of respondents who did not have an opinion are substan-tial, ranging from 37 percent to 50 percent across the six items. This high level of no opinion suggests that college officialshavenotgivenmuchthoughttohowtheymightaltertheirprocessesifaffirmativeactionisseverelylimitedby the Supreme Court.
Thinking about this case, using a five-point scale, where 5 means strongly agree and 1 means
strongly disagree, please indicate your level of agreement with the following items.
If the right of colleges and universities to consider race and ethnicity in admissions decisions
is scaled back, our institution will:
All Institutions by Sector Public Private Nonprofit
All PublicPrivate
NonprofitDoctoral /
Master’s / Bacc. Assoc.Doctoral / Master’s Bacc.
Place more consideration on first-generation status in the review process.
%5 Strongly agree 12 16 10 13 33 12 8
%4 17 12 20 15 0 22 19
%3 35 30 36 31 11 36 35
%2 13 12 13 13 11 12 13
%1 Strongly disagree 24 30 21 28 44 18 25
Place more consideration on applicants’ socioeconomic status in the review process.
%5 Strongly agree 11 16 8 15 25 10 8
%4 16 12 17 13 0 20 14
%3 22 20 22 21 13 22 22
%2 18 10 22 10 13 24 22
%1 Strongly disagree 34 41 30 41 50 25 34

28INSIDE HIGHER ED 2015 SURVEY OF COLLEGE AND UNIVERSITY ADMISSIONS DIRECTORS
AFFIRMATIVE ACTION (cont.)
All Institutions by Sector Public Private Nonprofit
All PublicPrivate
NonprofitDoctoral /
Master’s / Bacc. Assoc.Doctoral / Master’s Bacc.
Adopt the use of non-cognitive measures in the admissions process.
%5 Strongly agree 10 12 9 13 13 4 14
%4 21 18 23 18 0 24 23
%3 32 18 37 18 25 35 39
%2 13 10 14 13 0 22 9
%1 Strongly disagree 25 41 16 38 63 15 16
Drop standardized test requirements.
%5 Strongly agree 5 0 8 0 0 7 8
%4 7 4 9 5 0 7 11
%3 16 11 19 13 0 20 21
%2 22 19 22 16 29 22 24
%1 Strongly disagree 50 66 42 66 71 44 37
Adopt a policy to admit a top percent of students from every high school class in our state.
%5 Strongly agree 5 11 2 11 14 0 5
%4 4 2 4 0 14 5 5
%3 17 30 12 33 14 14 11
%2 18 7 24 6 14 25 23
%1 Strongly disagree 56 50 58 50 43 57 57
Drop preferences for alumni children.
%5 Strongly agree 3 6 1 7 0 0 3
%4 5 9 3 7 17 5 0
%3 20 20 19 21 17 14 26
%2 26 14 32 17 0 30 38
%1 Strongly disagree 46 51 44 48 67 52 33

29INSIDE HIGHER ED 2015 SURVEY OF COLLEGE AND UNIVERSITY ADMISSIONS DIRECTORS
AFFIRMATIVE ACTION (cont.)
AffirmativeactionprogramsaregenerallyusedtoincreasetherepresentationofAfrican-AmericanandHispanicstudents at a college or university since those students tend to be underrepresented in institutions of higher edu-cation. However, Asian Americans are one minority group that tends to achieve well academically and perform well on standardized tests, and as a result can be proportionally overrepresented at higher education institutions. As a result, it is possible that some institutions may hold Asian-American applicants to higher standards than applicants of other races.
Essentially no admissions directors say this occurs at their institution, but 43 percent believe it does occur at some colleges. Private college admissions directors (51 percent) are more likely than their public college peers (33 percent) to say this occurs at some colleges.
As you may know, some Asian American groups have alleged that Asian American applicants
are held to higher admission standards than all other students.
All Institutions by Sector Public Private Nonprofit
All PublicPrivate
NonprofitDoctoral /
Master’s / Bacc. Assoc.Doctoral / Master’s Bacc.
Based on what you know or have heard, do you believe that some colleges are holding Asian American applicants to higher standards?
% Yes 43 33 51 32 38 46 55
% No 57 67 49 68 62 54 45
Does your college hold Asian American applicants to higher admission standards than all other applicants?
% Yes < 1 0 1 0 0 0 0
% No 100 100 99 100 100 100 100

30INSIDE HIGHER ED 2015 SURVEY OF COLLEGE AND UNIVERSITY ADMISSIONS DIRECTORS
APPLICANT DISCIPLINARY RECORDS
Admissionsofficersoftentakeintoaccountawidevarietyofinformationaboutastudentwhendecidingtoadmithim or her. In addition to high school grades, standardized test scores and extracurricular activities, colleges may also want to review a student’s disciplinary record to make sure he or she does not have any issues that might indicate potential problems. However, seeking out disciplinary information may violate a student’s privacy, and, depending on the nature of the incident, may put the student at a disadvantage compared with a student with no disciplinary issues.
Fifty-nine percent of admissions directors favor a liberal reporting standard on disciplinary records, saying all incidents should be disclosed. Another 36 percent favor a limited approach that would only ask, for example, about recent incidents or violent incidents. Just 5 percent say colleges should not ask any questions about a student’s past history of discipline in school.
In terms of what colleges and universities are doing, 61 percent of admissions directors surveyed say their college seeks out disciplinary information on applicants, including 40 percent of those at public institutions and 77 percent of those at private institutions. Nearly nine in 10 admissions directors at two-year public institutions say their institution does not seek out such information.
Most of those working at institutions that collect such information appear likely to continue to do so, as only 9 percentsaytheyarereconsideringtheirpolicy.Alittlelessthanhalf,43percent,sayadmissionsofficersareprovid-ed training as to how to properly evaluate such information.
As you may know, some colleges are considering applicants’ high school disciplinary records
in the admissions process.
All Institutions by Sector Public Private Nonprofit
All PublicPrivate
NonprofitDoctoral /
Master’s / Bacc. Assoc.Doctoral / Master’s Bacc.
Does your college seek information, either from applicants or their high schools, on whether applicants
have a disciplinary or legal record?
% Yes 61 40 77 60 11 81 79
% No 39 60 23 40 89 19 21
Is your college re-considering whether such information is an appropriate criterion?*
% Yes 9 11 8 12 0 5 13
% No 91 89 92 88 100 95 87
Are admissions officers at your institution provided with special training on how to evaluate disciplinary or legal information?*
% Yes 43 47 41 47 50 42 42
% No 57 53 59 53 50 58 58

31INSIDE HIGHER ED 2015 SURVEY OF COLLEGE AND UNIVERSITY ADMISSIONS DIRECTORS
APPLICANT DISCIPLINARY RECORDS (cont.)
All Institutions by Sector Public Private Nonprofit
All PublicPrivate
NonprofitDoctoral /
Master’s / Bacc. Assoc.Doctoral / Master’s Bacc.
What, if anything, do you think institutions should ask about recent disciplinary or legal infractions?
% Institutions should not ask any questions about applicants’ disciplinary or legal infractions.
5 11 1 9 15 3 0
% Institutions should significantlylimitthescopeof disciplinary or legal infractions that they ask applicants about [for exam-ple: only recent incidents or violent incidents].
36 46 30 43 54 25 33
% Institutions should ask all applicants to report all disciplinary or legal infractions.
59 43 68 48 31 72 67
*Asked of those whose colleges seek applicants’ disciplinary records.

32INSIDE HIGHER ED 2015 SURVEY OF COLLEGE AND UNIVERSITY ADMISSIONS DIRECTORS
NEW APPROACHES TO ADMISSIONS
Some colleges are experimenting with new approaches to admissions that move away from the typical reliance on high school grades and standardized test scores. However, those approaches do not seem to be very appealing to most admissions directors. For example, 74 percent do not believe it is ever appropriate for institutions to consider applicants without requiring a high school transcript. Those working at two-year public institutions are alone in showing majority support for that approach, at 58 percent.
In recent years, a number of colleges have adopted options for applicants that are radically different
from traditional approaches.
All Institutions by Sector Public Private Nonprofit
All PublicPrivate
NonprofitDoctoral /
Master’s / Bacc. Assoc.Doctoral / Master’s Bacc.
Do you think it is ever appropriate for institutions to consider applicants without requiring a high school transcript?
% Yes 26 31 20 17 58 22 15
% No 74 69 80 83 42 78 85
The survey asked admissions directors for their thoughts on some of the novel approaches being tried at certain in-stitutions. Although none of these approaches are evaluated positively, the one getting the most support is a policy that has applicants submit four research papers on pre-selected topics that are graded by the faculty. Twenty-three percent of admissions directors say this is a very good or good idea and 45 percent say it is a bad or very bad idea.
A combined 16 percent say it is a good idea and 51 percent say it is a bad idea to have students submit a two-min-ute video and two examples of high school work for their application. The approach with the worst review is to have applicants decide on their own what materials to submit -- 5 percent say this is a very good or good idea and 78 percent say it is a very bad or bad idea.
Following are some approaches colleges are taking to admit students that do not require applicants
to submit high school transcripts or test scores. For each approach, please indicate whether you
think it is a very good idea, a good idea, a neither good nor bad idea, a bad idea, or a very bad idea as
a new way to admit students.
All Institutions by Sector Public Private Nonprofit
All PublicPrivate
NonprofitDoctoral /
Master’s / Bacc. Assoc.Doctoral / Master’s Bacc.
Applicants submit four research papers on topics selected by the college, which are graded by college faculty members.
% Very good idea 4 4 4 2 9 7 2
% Good idea 19 20 19 22 15 23 10
% Neither good nor bad 33 36 32 38 35 24 40
% Bad idea 29 23 31 19 29 31 31
% Very bad idea 16 17 14 19 12 14 17

33INSIDE HIGHER ED 2015 SURVEY OF COLLEGE AND UNIVERSITY ADMISSIONS DIRECTORS
NEW APPROACHES TO ADMISSIONS (cont.)
All Institutions by Sector Public Private Nonprofit
All PublicPrivate
NonprofitDoctoral /
Master’s / Bacc. Assoc.Doctoral / Master’s Bacc.
A two-minute video of the student and two examples of his/her high school work.
% Very good idea 2 1 2 2 0 1 2
% Good idea 14 14 14 14 16 17 9
% Neither good nor bad 33 28 36 25 38 36 32
% Bad idea 31 29 33 33 22 29 42
% Very bad idea 20 27 15 26 25 16 16
Applicants themselves decide what materials to submit in their application.
% Very good idea 1 2 1 2 0 1 0
% Good idea 4 3 5 3 3 6 5
% Neither good nor bad 17 14 17 17 12 13 20
% Bad idea 37 32 40 33 32 49 31
% Very bad idea 41 48 37 45 53 31 44

34INSIDE HIGHER ED 2015 SURVEY OF COLLEGE AND UNIVERSITY ADMISSIONS DIRECTORS
OUT-OF-STATE ADMISSIONS
Manycollegesanduniversitiesarefacingtremendousfinancialpressure,withpubliccollegesinmanystatesseeingtheir state support diminish. As such, public institutions often seek to offset the loss of revenue by admitting out-of-state students who pay higher tuition than in-state students.
Sixty-eightpercentofadmissionsofficersatpublicinstitutionssaytheircollegehassoughtmoreout-of-stateresidents in recent years, including 90 percent of those at four-year institutions. These efforts have been successful, according to 86 percent of admissions directors.
Those efforts could be controversial, however, as many within the state might believe public institutions in that state should primarily serve students from the state. Nevertheless, admissions directors report the efforts have not been highly controversial, with only 21 percent saying their institution is facing increased scrutiny for admitting more out-of-state students.
As you may know, in recent years some public institutions have significantly increased their admis-
sion of out-of-state students, including international students.
All Public
Public Doctoral /
Master’s / Bacc.Public Assoc.
In recent years, has your college sought more out-of-state students?*
% Yes 68 90 38
% No 32 10 62
Have your college’s efforts to seek more out-of-state students been successful?**
% Yes 86 85 n/a
% No 14 15 n/a
Is your college facing political or public scrutiny over admitting more out-of-state students?**
% Yes 21 23 n/a
% No 79 77 n/a
* Asked only of respondents at public institutions.** Asked only of respondents at public institutions that have sought more out-of-state students (N=69).n/a: Not reported due to small sample size
35INSIDE HIGHER ED 2015 SURVEY OF COLLEGE AND UNIVERSITY ADMISSIONS DIRECTORS
OUT-OF-STATE ADMISSIONS (cont.)
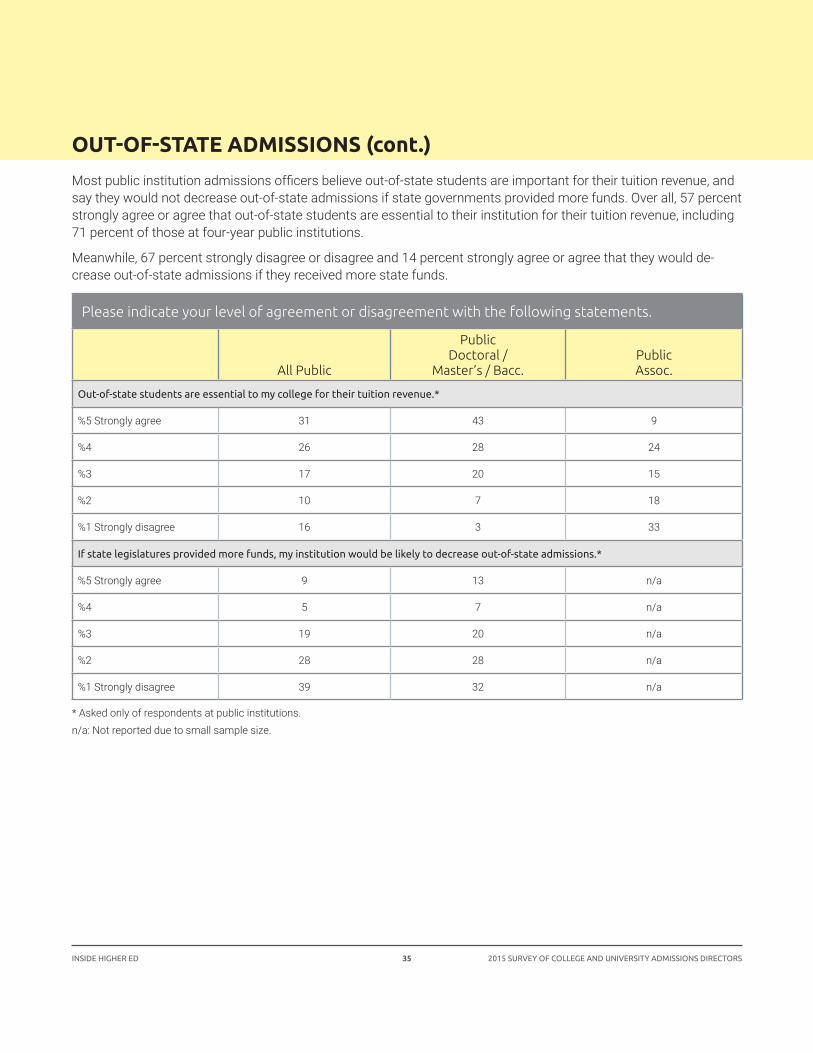
Mostpublicinstitutionadmissionsofficersbelieveout-of-statestudentsareimportantfortheirtuitionrevenue,andsay they would not decrease out-of-state admissions if state governments provided more funds. Over all, 57 percent strongly agree or agree that out-of-state students are essential to their institution for their tuition revenue, including 71 percent of those at four-year public institutions.
Meanwhile, 67 percent strongly disagree or disagree and 14 percent strongly agree or agree that they would de-crease out-of-state admissions if they received more state funds.
Please indicate your level of agreement or disagreement with the following statements.
All Public
Public Doctoral /
Master’s / Bacc.Public Assoc.
Out-of-state students are essential to my college for their tuition revenue.*
%5 Strongly agree 31 43 9
%4 26 28 24
%3 17 20 15
%2 10 7 18
%1 Strongly disagree 16 3 33
If state legislatures provided more funds, my institution would be likely to decrease out-of-state admissions.*
%5 Strongly agree 9 13 n/a
%4 5 7 n/a
%3 19 20 n/a
%2 28 28 n/a
%1 Strongly disagree 39 32 n/a
* Asked only of respondents at public institutions.n/a: Not reported due to small sample size.

36INSIDE HIGHER ED 2015 SURVEY OF COLLEGE AND UNIVERSITY ADMISSIONS DIRECTORS
COMMUNITY COLLEGES
With increasing concerns about student debt, community colleges can be a viable alternative for students who do not have the means to afford four-year college tuition or do not want to take on loans to pay for it. Admissions directors at community colleges are slightly more likely to say there has been a decrease (41 percent) rather than an increase (34 percent) in the enrollment of traditional-college-age students at their institution — those who in the past may have gone directly to a four-year institution.
In the last year, has your institution seen an increase, a decrease or seen no change in the enrollment
of “traditional” students who in the past might have enrolled at public or private four-year colleges
or universities?*
% Increase 34
% Decrease 41
% No change 25
* Asked only of respondents at two-year institutions.
What percent increase in the number of “traditional” students has your institution seen
in the last year?**
1% to less than 5% increase n/a
5% to less than 15% increase n/a
15% to less than 25% increase n/a
25% or greater increase n/a
** Asked only of respondents at two-year institutions who indicated their institution has seen an increase in the number of “traditional” students who in the past might have enrolled at public or private four-year institutions (n=10).n/a: Not reported due to small sample sizes.

37INSIDE HIGHER ED 2015 SURVEY OF COLLEGE AND UNIVERSITY ADMISSIONS DIRECTORS
COMMUNITY COLLEGES (cont.)
In addition to competing with four-year universities for students, community colleges continue to compete with for-profitcollegesanduniversities,someofwhichhavefacedenrollmentandregulatoryproblems.Andwhilefewadmissionsdirectorsattwo-yearcollegessayfor-profitinstitutionsareprovidinga“greatdeal”ofcompetitionforthem--eitherinselectedprogramsoracrossallfieldsandprograms--amajoritysayfor-profitinstitutionsareproviding “some” competition.
Is your institution experiencing a great deal, some, or only a little competition with for-profit col-
leges and universities to enroll students in some selected programs, such as health care or informa-
tion technology?*
% A great deal 11
% Some 62
% Only a little 27
* Asked only of respondents at two-year institutions.
Is your institution experiencing a great deal, some, or only a little competition with for-profit col-
leges and universities to enroll students across all fields and programs?*in the last year?**
% A great deal 11
% Some 56
% Only a little 33
* Asked only of respondents at two-year institutions.
Nearly all admissions directors at two-year colleges, 98 percent, say their institutions have some highly competitive programs, and are unanimous in saying these programs require certain grades in prerequisite courses to gain ad-mission. Sixty-two percent of two-year-college admissions directors with competitive programs say these programs admit less than half of applicants, including 18 percent who say they admit less than a quarter of applicants.
Are there any programs at your institution, such as nursing or automotive technology, for which
admissions is highly competitive? *
% Yes 98
% No 2
* Asked only of respondents at two-year institutions.

38INSIDE HIGHER ED 2015 SURVEY OF COLLEGE AND UNIVERSITY ADMISSIONS DIRECTORS
COMMUNITY COLLEGES (cont.)
For programs which are highly competitive at your institution, are students required
to achieve certain grades in prerequisite courses to secure admission to the program? **
% Yes 100
% No 0
* Asked only of respondents at two-year institutions.
For students who meet basic requirements for admission into highly competitive programs
at your institution, what percent of applicants do you admit? **
% Less than 25% 18
% 25% to less than 50% 44
% 50% or more 38
** Asked only of respondents at two-year institutions who indicate they have highly competitive programs (n=34).
President Obama has unveiled a proposal for free community college tuition. However, most admissions directors at two-year institutions, 59 percent, say this discussion has not generated increased interest in attending community college in their area. All admissions directors surveyed believe there are students in their area who wouldbenefitfromcommunitycollegebutwhodonotenrollbecausetheydonothavethemeanstopayforit.
Has the recent discussion about offering free community college generated increased interest
in your area in attending community college? *
% Yes 41
% No 59
* Asked only of respondents at two-year institutions.
Do you believe there are potential students in your area who could benefit from community college
who do not enroll because of lack of funds? *
% Yes 100
% No 0
* Asked only of respondents at two-year institutions.
39INSIDE HIGHER ED 2015 SURVEY OF COLLEGE AND UNIVERSITY ADMISSIONS DIRECTORS
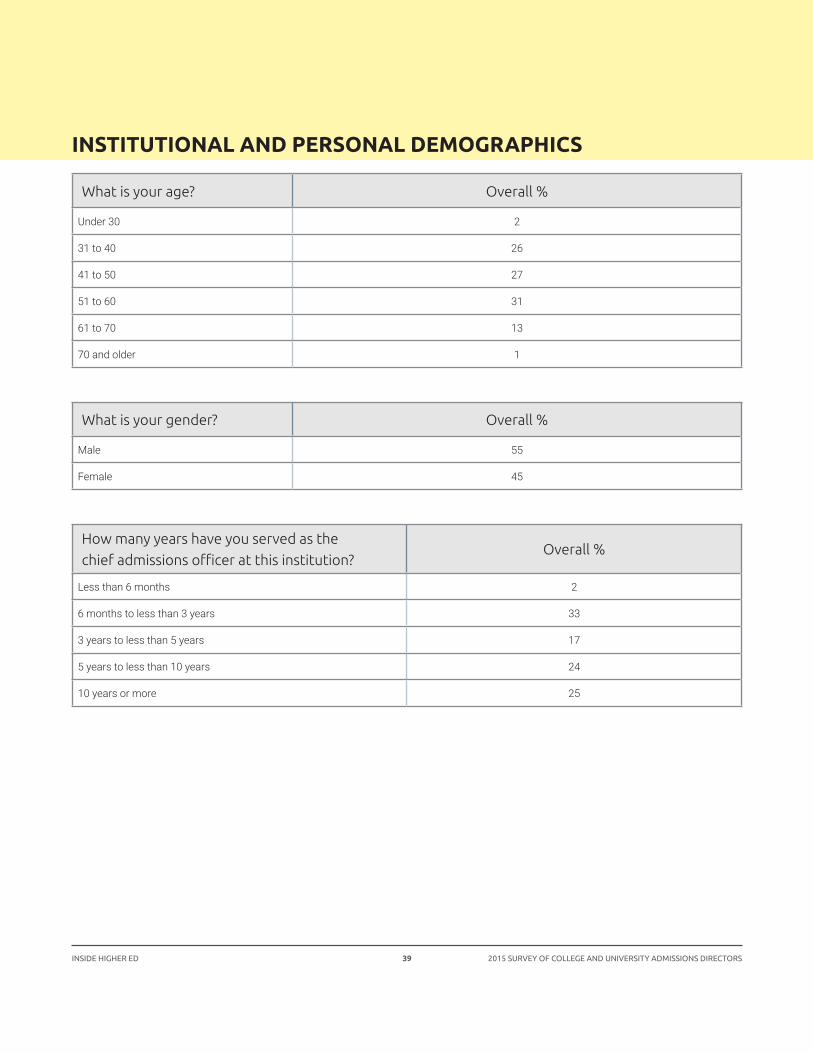
INSTITUTIONAL AND PERSONAL DEMOGRAPHICS
What is your age? Overall %
Under 30 2
31 to 40 26
41 to 50 27
51 to 60 31
61 to 70 13
70 and older 1
What is your gender? Overall %
Male 55
Female 45
How many years have you served as the
chief admissions officer at this institution?Overall %
Less than 6 months 2
6 months to less than 3 years 33
3 years to less than 5 years 17
5 years to less than 10 years 24
10 years or more 25

40INSIDE HIGHER ED 2015 SURVEY OF COLLEGE AND UNIVERSITY ADMISSIONS DIRECTORS
INSTITUTIONAL AND PERSONAL DEMOGRAPHICS (cont.)
How many years have you served as an
admissions or enrollment management officer
at any institution?
Overall %
Less than 6 months 0
6 months to less than 3 years 5
3 years to less than 5 years 7
5 years to less than 10 years 22
10 years or more 66
What proportion of the applicants for full-time
undergraduate admissions do you typically ad-
mit to your college or university?
Overall %
Less than 20% 4
20% to less than 50% 23
50% or more 73

41INSIDE HIGHER ED 2015 SURVEY OF COLLEGE AND UNIVERSITY ADMISSIONS DIRECTORS
ABOUT INSIDE HIGHER ED
Founded in 2004, Inside Higher Ed is the online source for news, opinion and jobs for all of higher education. Inside Higher Edprovideswhathighereducationprofessionalsneedtothriveintheirjobsortofindbetterones:breaking news and feature stories, provocative daily commentary, areas for comment on every article, practical career columns and a powerful suite of tools that keep academic professionals well-informed about issues and employment opportunities and that help colleges identify and hire talented personnel.
For more information, visit www.insidehighered.com.
ABOUT GALLUP
Gallup provides analytics and advice to help leaders and organizations solve their most pressing problems. Combining more than 80 years of experience with its global reach, Gallup knows more about the attitudes and behaviors of employees, customers, students and citizens than any other organization in the world. Gallup works with leaders and organizations to achieve breakthroughs in customer engagement, employee engagement, organizational culture and identity, leadership development, talent-based assessments, entrepreneurship and well-being. Gallup’s 2,000 professionals include noted scientists, renowned subject-matter experts and bestselling authorswhoworkinarangeofindustries,includingbanking,finance,healthcare,consumergoods,automotive, real estate, hospitality, education, government and business-to-business.
For more information, visit www.gallup.com or www.gallup.com/services/170939/higher-education.aspx.