a study conducted for the patuxent river damage … · of the chalk point oil spill by the academy...
TRANSCRIPT

Final Report
A Survey of the Shallow Water and Intertidal Benthic Invertebrates
at Three Sites in the Vicinity of The Chalk Point Steam Electric Station
A Study Conducted for The Patuxent River Damage Assessment
of the Chalk Point Oil Spill
by The Academy of Natural Sciences
Estuarine Research Center10545 Mackall Road
St. Leonard, Maryland 20685
Telephone: 410-586-9700Fax: 410-586-9705
Principal Investigator
Richard W. Osman, CuratorBenthic Ecology

1
A Survey of the Shallow Water and Intertidal Benthic Invertebrates
at Three Sites in the Vicinity of The Chalk Point Steam Electric Station
In April 2000, oil was released into Swanson Creek at the site of the Chalk PointSteam Electric Station (Figure 1). The oil spread into the Patuxent River and wascarried down the river more than 25 km, potentially impacting coastal habitats withinthis area. This study was designed as a simple survey to measure the abundance ofinfaunal invertebrates in sediments from three low intertidal - shallow subtidal sites inthe vicinity of the release. The three sites that were sampled included: 1) a referenceor control site in Hunting Creek that was up-river from the release point and notimpacted by oil, 2) a moderately-oiled site in Trent Hall Creek down-river from therelease point, and 3) a heavily-oiled site in Swanson Creek, the location of the release.Samples were collected in late September 2000, approximately 5 months after the oilwas released.
In order to compare the fauna among the three sites, 10 replicate core sampleswere taken at each of the three sites. To minimize the natural variation among sitesevery effort was made to select sampling locations within each creek that were atsimilar tidal heights, were located adjacent to marsh habitat, and had similar sedimenttypes. All 3 sites were sampled on the same day within 3 h of each other.
Methods
Field Collections
All samples were collected at the three sites on 20 September 2000. To preventany possible contamination of samples, the sites were sampled in order of theirexposure to oil. Samples were first taken at the control site in Hunting Creek (76( 39'26" Long, 38( 33' 26" Lat), then in Trent Hall Creek (76( 40' 52" Long, 38( 28' 45" Lat),and finally in Swanson Creek (76( 41' 34" Long, 38( 32' 39" Lat). At each site wemeasured water temperature and salinity using a YSI 85 meter. Next a 20-m transectparallel to the shore was marked at water depths of 15 - 37 cm. Because the sampleswere collected on a receding tide the mean water depth also was decreased from amean of 35.5 ± 1.0 (SE) cm in Hunting Creek to 25.5 ± 0.6 cm in Trent Hall Creek to18.6 ± 0.8 cm in Swanson Creek in an effort to sample at the same depth relative toMean Low Water. Ten sites along each transect were chosen randomly and marked. At each marked sampling site a 15-cm diameter core sample was taken at a distance of50 cm perpendicular to the transect. The shoreward or seaward direction of the 50-cmdisplacement was chosen randomly.
For each sample we pushed the corer approximately 20 cm into the sediment. Before the corer and sediment core were extracted, we measured the water depth andthen took a 200 g sediment sample adjacent to the core tube. This sample was given

2
to a representative of the Trustee Council for potential chemical analysis. After thissample was taken, the corer was extracted. Each core sampled the sediment to adepth of approximately 20 cm resulting in our sampling 3.5 l of sediment. The sedimentcollected from each replicate core was placed in a separate plastic lidded container,returned to the laboratory and refrigerated.
Laboratory Analyses
Initial processing of the cores, consisting of sub-sample collection and sieving ofthe bulk of the sediment for macroinvertebrates, was done within 24 h of collection. Sub-samples were taken from the mixed core sediments in each container. Sub-sampling included the collection of 100 g of the sediment for grain size analysis and 20ml that was frozen for subsequent analysis of organic matter content. These threetypes of samples were collected as follows:
1. Macroinvertebrate Samples. After the sub-samples were taken, theremaining bulk of the sediment was sieved using a 500 µm screen. Allmaterial retained on the screen was fixed in formalin and stained withRose Bengal. After approximately 1 wk samples were transferred intoalcohol. Subsequently, samples were examined using a dissectingmicroscope and all macroinvertebrate organisms were identified andcounted.
2. Sediment Grain Size Analysis. The 100 g samples were sieved using aseries of stacked screens with mesh sizes of 2000, 1000, 500, 250, 125and 62 µm (Butler and McManus 1979, Buchanan 1984). The sedimentwas sieved wet to avoid aggregation of the finer particles as aconsequence of drying. All water and sediment passing through the 62µm sieve were retained and filtered to retrieve the fine silt - claysediments (Butler and McManus 1979). The proportion of the sample ineach of the 7 size classes was determined by volume and dry weight andused to characterize the sediment and any differences within and amongthe three field sites.
3. Organic Matter Content. The 20-ml frozen samples were analyzed using theignition method (McCave 1979, Rosa et al. 1991) for organic mattercontent. Each sample was dried at 60(C, weighed, combusted at 450( C,and then re-weighed. The difference before and after combustion wasused to estimate the proportion of organic matter in each sample. Combustion was at 450( C to avoid the combustion of any shell(carbonate) material in the samples (Rosa et al. 1991).

3
Data Analyses
The objective of all statistical analyses was to compare the three sites anddetermine whether they differed from one another. All analyses were conducted usingJMP 4.0 statistical software (SAS Institute 2000).
The main type of analysis conducted was a standard one-way analysis ofvariance (ANOVA). Differences among the three stations for individual taxa, trophicgroups, and species richness were all analyzed using one-way ANOVA. For allanalyses in which a significant difference was found (p<0.05), a Tukey multiplecomparison test (Tukey 1991, Kramer 1956, SAS Institute 2000) was used to contrastthe individual stations.
The similarity in community composition among the samples collected at thethree sites was also analyzed using hierarchical clustering using Ward's minimumvariance method for linking clusters (SAS Institute 2000). Three types of analyseswere conducted: 1) similarity among individual samples based on the abundances of alltaxa in the samples, 2) similarity among individual samples based on the abundancesof the 8 most abundant or dominant species, and 3) similarity among the dominantspecies based on their abundances in the samples.
Results
Environmental Differences
A limited number of environmental parameters were measured for each site. These included the water temperature and salinity at each site and the sediment grainsize distribution and organic matter content of each sample. Water temperature variedslightly from 21.3(C at Hunting Creek to 23.8(C at Trent Hall to 25.5(C at SwansonCreek. These differences probably resulted from the order in which the sites weresampled with Hunting Creek being sampled first in the morning and Swanson Creekbeing sampled in the mid-afternoon when air temperatures had increased. Also thesampling day was sunny and solar radiation could be expected to warm the shallowwater at the sites. Unlike temperature there was a substantial difference in salinityamong the sites with the salinity at Trent Hall (9.6 ppt) being almost double that atHunting Creek (5.3 ppt) and Swanson Creek (5.6 ppt).
The analysis of sediment grain size indicated that there was little differenceamong the sites in the types of sediments that were present. When analyzed by dryweight (Figure 2), Swanson Creek had a significantly lower mean percent of it'ssediment in the 125 )m class than the other two sites and Trent Hall had a significantlylower percentage in the >2000 )m class. Likewise when analyzed by volume (Figure3), Swanson Creek had a higher percentage of silt-clay (<63 )m) than the other sites,but this was balanced by lower percentages in the 63 )m and 125 )m classes. Overall,

4
these differences indicate little, if any, meaningful differences in the sediments at thethree sampling sites.
The analyses of organic matter content in the sediments also indicated littledifference among the sites (Figure 4). The mean percent organic matter was highest inthe sediments from Swanson Creek (5.3% ± 1.4 SE) compared to those from HuntingCreek (3.2% ± 0.7) and Trent Hall Creek (2.6% ± 0.8). However, these differenceswere not statistically significant.
Distribution of Dominant Taxa
The fauna sampled at the three sites was fairly typical of shallow subtidal areaswithin the Patuxent River and adjacent Chesapeake Bay. Given the high spatial andtemporal variability in the abundances of these species, the densities observed at thethree sites were within the ranges seen in the region (Holland 1985, Holland et al.1977a, 1977b, 1980), The principal macrofaunal invertebrate groups were polychaeteannelids, nemerteans, molluscs, and crustaceans. Meiofaunal groups (e.g. copepods,nematodes) were also sampled. However, because we used a 500 )m screen inprocessing the samples, the much smaller organisms in these groups were under-represented. Below we compare the abundances of the dominant taxa among thethree sites. All statistical inferences are based on one-way ANOVA's with p<0.05.
Polychaetes. Polychaetes were the most abundant taxa found at all threesites. The polychaete fauna consisted of two species, the sub-surface deposit feedingHeteromastus filiformis and Nereis succinea, an omnivore which also preys on otherinfauna. Surprisingly, no other polychaete species were found, including any surfacedeposit-feeding species.
Both species of polychaetes were significantly more abundant in Trent HallCreek (Figure 5). Their densities were almost 3 times greater at this site than the othertwo sites. They were the two most abundant species at all three sites.
Nemerteans. The only nemertean found at the sites was the predator Micruraleidyi. This species was in fairly low abundance (Figure 5) with no significant differencefound among the three sites.
Molluscs. Three species of molluscs were found in samples from the three sites. These included the bivalves Macoma balthica and Rangia cuneata and the gastropodHydrobia sp. Rangia is a suspension-feeder typically most abundant in low salinityareas. Although Macoma can also suspension-feed it is principally a surface deposit-feeder, especially in muddy sediments (Olafsson 1986, 1989). Hydrobia is anomnivorous grazer on the surface sediments.

5
The distribution of Macoma was similar to the two species of polychaetes (Figure6). It was significantly more abundant in Trent Hall Creek, with densities > 3 timeshigher there than in the other two sites. Rangia exhibited a different pattern with itsdensity being significantly higher in Hunting Creek than in Trent Hall Creek (Figure 6). Densities in Swanson Creek were intermediate between the other two stations and notsignificantly different from either. Finally, Hydrobia was found only in Swanson Creekand its densities were significantly higher there than at the other two sites (Figure 6).
Arthropods. Arthropods formed the most diverse taxonomic group ofmacrofauna at the three sites, including the cumacean Leucon americanus, the amphipodLeptocheirus plumulosus, the isopods Edotea triloba and Cyathura polita, the grass shrimpPalaemonetes pugio, the mud crab Rhithropanopeus harrisii, chironomid insect larvae, andthe barnacle Balanus improvisus. Except for the suspension-feeding barnacle, all ofthese species graze on the sediment surface with Leucon and Leptocheirus consideredto be surface deposit-feeders and the remaining species considered omnivorous(Chesapeake Bay Program 2000).
Of the arthropods, the two isopods, Edotea and Cyathura were most abundant. Cyathura exhibited no significant difference among the three sites (Figure 7). Edotea, onthe other hand, was significantly less abundant in Trent Hall Creek than at the othertwo sites (Figure 7).
The only other arthropod found to vary significantly among the sites was thecumacean Leucon. Leucon was significantly more abundant in Trent Hall Creek than inHunting Creek, where it was absent (Figure 7). Its abundance in Swanson Creek wasintermediate and not significantly different from either of the other two sites.
The remaining arthropod species were in fairly low densities and exhibited nosignificant differences among the three sites (Figure 8). The amphipod Leptocheiruswas found only in Hunting Creek and the mud crab Rhithropanopeus was found only inTrent Hall Creek and Swanson Creek.
Meiofauna. Both meiofaunal groups, copepods and nematodes, were moreabundant in Trent Hall Creek than the other two sites (Figures 9). However, thesedifferences were not statistically significant.
Distribution of Larger Taxonomic Groups
The distribution among the three sites of each of the major taxonomic groups(polychaetes, molluscs, arthropods, and meiofauna) was also compared. Polychaeteswere greater than 50% of the total fauna at all three sites with their proportionalabundance being significantly greater in Trent Hall Creek than at the other two sites(Figure 10). Molluscs comprised 10-20% of the fauna at all three stations (Figure 10)and meiofauna were 5-10% of the sampled fauna (Figure 10). Neither of these groups

6
differed significantly among the sites. Finally, arthropods were >20% of the fauna inSwanson and Hunting Creeks (Figure 10). These percentages were significantlygreater than the <10% found for Trent Hall Creek.
Trophic Group Differences
The taxa in each sample were also pooled by trophic group or guild in order toexamine whether any potential differences existed among the three sites in trophicdynamics. The feeding guild of each taxon was assigned using the Chesapeake BayProgram classification system (Chesapeake Bay Program 2000). Based on this systemthe sites had four major trophic groups; deep, sub-surface deposit feeders(Heteromastus), surface deposit feeders (Leptocheirus, Leucon, Macoma),omnivores/carnivores (chironomids, Cyathura, Edotea, Hydrobia, Micrura, Nereis,Palaemonetes, Rhithropanopeus), and suspension feeders (Rangia, Balanus).
Both the sub-surface deposit feeder (Figure 11) and surface deposit feeder(Figure 11) groups were significantly more abundant in Trent Hall Creek. Much of thisresults from the high densities of Heteromastus and Macoma in Trent Hall Creek. Omnivores (Figure 11) were significantly more abundant in Trent Hall Creek (largelyfrom high Nereis densities) than in Hunting Creek with Swanson Creek beingintermediate and not significantly different from either of the other two stations. Finally,suspension feeders (Figure 11) were significantly more abundant in Hunting Creek (asa consequence of high Rangia densities) than Trent Hall Creek with Swanson Creekbeing intermediate.
Community Patterns
Overall, total faunal densities in Trent Hall Creek were approximately doublethose found at the other two sites and significantly higher (Figure 12). This was largelya consequence of the high abundances of Heteromastus, Nereis, and Macoma in TrentHall Creek. However, this difference in abundances was not reflected in the speciesrichness of the sites. The mean number of species found at the three sites variedbetween 7 and 9 with no significant differences found among the sites (Figure 12).
Hierarchical cluster analyses generally showed the same types of patterns forcommunities as was seen for individual taxa. Cluster analyses were done using theabundance data for all taxa (Figure 13) and also with only the most abundantmacrofaunal taxa (Nereis, Heteromastus, Macoma, Rangia, Micrura, Leucon, Hydrobia,Edotea, Cyathura) to weight the analysis towards dominant species (Figure 14). Ingeneral, the results for both analyses were similar and demonstrated the communitydifferences among the three stations. When all taxa were included (Figure 13) 5 of the10 Trent Hall samples cluster together as a group distinct from all other samples. Likewise, 7 of the 10 Swanson Creek samples along with 1 Hunting Creek sampleformed a second distinct grouping. The remaining samples formed a larger, mixed

7
group dominated by samples from Hunting Creek. However, within this group there are4 distinct sub-groups of a) 5 Hunting Creek samples, b) 3 Trent Hall samples, c) asingle Hunting Creek sample, and d) a mixed group of the remaining samples. Whenthe analysis was repeated with only the dominant species (Figure 14) 7 of the TrentHall samples formed a distinct cluster. The cluster of 7 Swanson Creek samples and 1Hunting Creek sample did not change and there was a grouping of 2 Hunting Creeksamples. The remaining grouping had similar but less distinct sub-groupings as in theprevious analyses. Overall these analyses suggest distinct differences in thecommunities at the three sites but with a great deal of overlap.
Finally, the clustering of species based on their distributions among the 30samples was also examined, one comparing all species (Figure 15) and the other(Figure 16) contrasting the most dominant taxa (Nereis, Heteromastus, Macoma, Rangia,Hydrobia, Edotea, Cyathura, and nematodes). Both analyses show much the samepattern. When all species were included (Figure 15), 5 major clusters were foundincluding a) a distinct cluster with Heteromastus and Nereis, the two most abundantspecies that were also in greatest abundance in Trent Hall Creek, b) a cluster of threespecies that were dominant in Hunting Creek (Rangia, Edotea, and Cyathura), c) acluster of lower density taxa that were also most abundant in Trent Hall Creek (Macoma,nematodes, and copepods), d) Hydrobia that was only found in Swanson Creek, and e)a large group of the remaining species that generally had low densities and a mixeddistribution among the sites. When the 8 most dominant taxa were analyzed separately(Figure 16) the pattern was largely the same with a) the distinct Trent Hall dominantHeteromastus, Nereis cluster, b) the Hunting Creek dominant Rangia, Edotea cluster, andc) a mixed cluster species more prevalent in Trent Hall Creek (Cyathura, Macoma, andnematodes) or Swanson Creek (Hydrobia).
Discussion
This study compares the abundances of sediment-dwelling invertebrates at threesites on one sampling date. Five months prior to the sampling date, the three sitesselected varied in their exposure to oil with Swanson Creek having heavy exposure,Trent Hall Creek moderate exposure, and Hunting Creek no exposure. Except forsalinity, most other environmental variables measured appeared to be similar betweenthe sites. Sediment grain size distributions differed slightly but sediments at all threesampling sites can be classified as muddy sands, similar to western shore sands andmuds of Chesapeake Bay (Ryan 1953). Swanson Creek did have a slightly higherpercentage of silt-clay. Organic matter content did not vary significantly among thethree sites. Tidal heights of the sampling sites and measured water temperatures alsovaried little. The only measured environmental parameter that did differ among thesites was salinity with Trent Hall Creek having a salinity much higher than the other twosites. Given the location of Trent Hall Creek farther down the Patuxent River, it is likelythat it has a higher mean salinity than the other two sites.

8
All three sites had taxa that are characteristic of shallow sub-tidal and intertidalhabitats within the region (e.g. Holland 1985, Holland et al. 1977a, b, 1980, Marsh andTenore 1990, McErlean 1964, Kemp et al. 2000) as well as in other estuarine systems(e.g. Sanders et al. 1965). Species composition at the sites was also similar to thatfound in earlier Academy of Natural Sciences surveys of shallow subtidal areas in theimmediate vicinity of the present study (e.g. ANS 1971, 1978a, 1978b) as well as inintertidal habitats in some Patuxent River marshes (Osman and Whitlatch 1998). In astudy of infaunal populations in the lower Patuxent River, Marsh and Tenore (1990)found that four species, Nereis, Macoma, Leptocheirus, and the spionid polychaeteStreblospio benedicti, accounted for >90% of the community biomass and two of these,Nereis and Macoma were among the 3 most dominant species at the study sites. Theother two species in the lower Patuxent study are opportunistic species that recruit inearly summer. They often suffer high mortalities that result in low abundances by lateAugust (Marsh and Tenore 1990), prior to the time of sampling in our study. Nereis andMacoma recruit in the late summer and fall (Holland et al. 1977b), making it likely forthem to be in higher densities at the time we sampled. McErlean (1964) also found Macoma densities in the Patuxent River to be highly variable but he reported similardensities to those we found in the vicinity of the three sites.
Although many of the same species occurred at all three sites, the densities ofmany taxa at the three sites were clearly different with Trent Hall Creek having muchhigher overall densities (Figure 12) than the other two sites. All three sites weredominated by polychaetes, but this dominance was significantly greater in Trent HallCreek (Figure 10). Both Heteromastus and Nereis had densities in Trent Hall Creek thatwere 3 times greater than at the other two sites (Figure 5). Mollusc densities did notdiffer among the sites (Figure 10), but the dominant species varied among the sites. Macoma was significantly more abundant in Trent Hall Creek, Rangia in Hunting Creek,and Hydrobia in Swanson Creek (Figure 6). Although arthropods had the greatestnumber of species, most species were in fairly low abundance at the sites. Overall,arthropods were a significantly greater part of the fauna in Hunting and SwansonCreeks than in Trent Hall Creek (Figure 10). The isopod Edotea was three times moreabundant in Hunting and Swanson Creeks than in Trent Hall Creek and the cumaceanLeucon was significantly more abundant in Swanson Creek (Figure 7).
These differences in faunal distributions also resulted in differences among thesites in trophic group composition. Because of the dominance of Heteromastus in TrentHall Creek, deep sub-surface deposit feeders formed a significantly greater part of thefauna at this site (Figure 11). Omnivorous species formed the most abundant group atall three sites (Figure 11). However, in Trent Hall Creek this resulted mostly from thehigh densities of the sub-surface feeding Nereis while at the other sites omnivoroussurface-feeding arthropods were more important. Surface deposit feeders weresignificantly more abundant in Trent Hall Creek, largely as a consequence of higherdensities of Macoma, while the high abundances of Rangia in Hunting Creek madesuspension feeders a significantly greater faunal component at this site. Site

9
differences were also reflected in the community analyses. Although there were clearoverlaps among the sites, the cluster analyses suggest that samples from the same sitewere more similar to each other than to samples from other sites. Using all of the taxa(Figure 13) or just dominants (Figure 14) made little difference.
Even though there were clear faunal differences among the three sites, it is notpossible to determine the cause or causes of these differences. First, the sediment-dwelling shallow water and intertidal invertebrate fauna exhibits significant spatial (e.g.McErlean 1964) and temporal (Holland 1985, Marsh and Tenore 1990) variability. Inaddition, the sampling occurred at the end of the summer recruitment season and at atime when species such as Nereis and Macoma may be recruiting in high numbers(Holland et al. 1977b). Natural population variability coupled with the normally highspatial variability in recruitment could have contributed to the observed faunaldifferences among the sites.
Secondly, the large salinity difference observed between Trent Hall Creek andthe other two sites may be indicative of natural environmental differences among thesites. Gradients in salinity have been shown to cause large differences in fauna alonga river (e.g. Sanders et al. 1965). In addition, the significantly higher abundances ofhigher salinity species such as Nereis, Heteromastus, and Macoma (Figures 5, 6) in TrentHall Creek and the significantly higher densities of lower salinity species such asRangia (Figure 6) in Hunting Creek are consistent with a salinity effect.
Thirdly, it is possible that the differences in faunal distributions resulted fromeffects of the released oil. However, the evidence for this is quite mixed. The absenceof Leptocheirus at the sites in both Swanson and Trent Hall Creeks is suggestive of oileffects. Leptocheirus is a species widely used in toxicity studies (e.g. McGee et al.1998, Fuchsman et al. 1998, Norton et al. 1999, Horne et al. 1999) and might beexpected to be a good indicator of oil effects. However, even though field populationsseem to be more sensitive to toxic compounds than those reared in the laboratory(McGee et al. 1998), Leptocheirus has been found to be insensitive to some pollutants in field sampling studies (e.g. Horne et al. 1999). Other taxa used in toxicity testing suchas Hydrobia (e.g. Forbes et al. 1995) and chironomids (e.g. Fuchsman et al. 1998) haddistributions that did not correlate well with the known oil distribution. Hydrobia hadsignificantly higher densities in Swanson Creek (Figure 6) and chironomids had lowerdensities (but not significant) in Swanson and Trent Hall Creeks (Figure 8). Finally, thedistributions of broader taxonomic and trophic groups are also known to be affected bypollutants. Horne et al. (1999) in their study of salt marsh sediments found that highlycontaminated areas were dominated by polychaetes and surface deposit feeders. Polychaetes and surface deposit feeders were significantly more abundant in Trent HallCreek, but not in Swanson Creek (Figures 10, 11). Omnivores, which included manysurface feeding taxa were more abundant at the two oiled sites than in Hunting Creek(Figure 11). Thus these results are also mixed in their support of an effect of oil on thedistribution of the infauna at the three sites.

10
Fourthly, it is also possible that the process of cleaning oil from the intertidalsites could have had an effect on the faunal distributions. However, there is no way todistinguish this from the effects of the oil itself (or other environmental parameters)using the data collected.
Fifthly, the distributions of these sediment-dwelling invertebrates could alsohave been influenced by other toxic substances not associated with the oil spill. Forexample, Riedel et al. (1998, 2000) have shown that cadmium and other toxic traceelements vary spatially and temporally in the Patuxent River. In particular, cadmiumwas found in the highest concentration in oysters taken near Chalk Point and steadilydeclined towards the mouth of the river (Riedel et al. 1998). Given that species suchas Leptocheirus have been shown to be affected by cadmium (e.g. McGee et al. 1998), itis possible that the decreases in many species from Hunting and Swanson Creeks toTrent Hall Creek could result from effects of contaminants, such as cadmium, notassociated with the oil spill.
Finally, the differences in distributions could result from a combination of any orall of the factors described above. For example, if a significant acute mortality ofinfauna resulted from the oil spill or the process of cleaning intertidal areas, then thehigher densities at Trent Hall could have resulted from recruitment in the 5 months afterthe spill. The absence of competitors and predators at this site could have enabledhigh recruitment of opportunistic species such as Heteromastus and Nereis. The lowernumbers of these species at Swanson Creek could be attributed to the interacting effectof salinity on the distribution of these species.
Thus, it is impossible to know the causes of broad spatial differences in faunafrom a set of one time samples taken at only three sites. This study has shown thatsignificant, and sometimes large, differences do exist among the three sites, but itcannot make any inferences regarding the cause or causes of these differences. Thedesign of the study was inadequate to determine such differences. Given the largespatial and temporal variability in environmental parameters (e.g. salinity) and biotainherent in estuarine habitats, a single, one-time set of samples cannot differentiatebetween causes.
The best and most direct approach to identifying and quantifying the effects ofthe oil spill on the biota would have been to have taken samples prior to the spill andcompared these to those taken over time intervals after the spill. Given that the oilspread down-river over a period of many days, this could have been done at many sitesand it is unfortunate that it was not.
Given the lack of sampling before sites were impacted, the best way to haveidentified oil damage would have been to sample many sites, both oiled and unoiledimmediately and then at time intervals after. Samples taken immediately after the spillin April would have identified those species present. Individuals killed would not have

11
been lost immediately. Comparing these samples to those taken later could have beenused to distinguish differences resulting from the mortality of residents from thoseresulting from later recruitment. Differences or similarities seen in one-time samplingcan be ephemeral (e.g. resulting from random recruitment differences that may bechanged by subsequent recruitment or mortality) or they can be long-lasting. It isimpossible to know the dynamic response of such a system based on a single set ofsamples.
Finally, the strong environmental gradients in an estuarine system such as thePatuxent River produce similar gradients in fauna. Natural spatial and temporalvariability in populations can also result from random variation in recruitment, growth,and survival. These processes make it imperative that multiple sites in each class (e.g.control, moderately-oiled, heavily-oiled) be sampled so that oil effects can be isolatedfrom natural differences. These sites should also be sampled repeatedly over a timerange that can account for differences in recruitment as well as short- and long-termvariations in mortality (including population structure changes, growth and reproductiveoutput). By sampling only one site in each category it is not possible to determinewhether a site is different because of the categorical difference (i.e. oil exposure) orjust natural variability.
In summary, although this study can identify differences among the sites, it isinadequate to determine what caused those differences. It is also inadequate for evaluating whether any long-term damage to the intertidal and shallow subtidal faunaresulting from the oil spill has occurred.

12
References
Academy of Natural Sciences. 1971. Patuxent River, Maryland estuarine survey reportfor the Potomac Electric Power Company, 1970. Academy of Natural Sciences,Philadelphia.
Academy of Natural Sciences. 1978a. Seasonal studies of the Patuxent Rivermacroinvertebrate community in the vicinity of the Chalk Point plant for thePotomac Electric Power Company, 1975 and 1976. Academy of NaturalSciences, Philadelphia.
Academy of Natural Sciences. 1978b. Data summaries from Chalk Point studies,January - June 1978. Academy of Natural Sciences, Philadelphia.
Buchanan, J. B. 1984. Sediment analysis. Pp. 41-65 in N. A. Holme and A. D.McIntyre, ed., Methods for the study of marine benthos. Blackwell ScientificPublishers, Boston.
Butler, A. T. and J. McManus. 1979. Sediment sampling and analysis. Pp. 87-130 inK. Dyer, ed., Estuarine hydrography and sedimentation, a handbook. Cambridge University Press, New York.
Chesapeake Bay Program. 2000. The 2000 User's Guide to Chesapeake BayProgram Biological and Living Resources Monitoring Data. USEPA, Annapolis,MD. 138 pp.
Forbes, V. E., V. Møller, and M. H. Depledge. 1995. Intrapopulation variability insublethal response to heavy metal stress in sexual and asexual gastropodpopulations. Functional Ecol. 9:477-484.
Fuchsman, P. C., T. R. Barber, and P. J. Sheehan. 1998. Sediment toxicity evaluationfor hexachlorobenzene: spiked sediment tests with Leptocheirus plumulosus,Hyalella azteca, and Chironomus tentans. Arch. Environ. Contam. Toxicol. 35:573-579.
Holland, A. F. 1985. Long-term variation of macrobenthos in a mesohaline region ofChesapeake Bay. Estuaries 8:93-113.
Holland, A. F., N. K. Mountford, and J. A. Mihursky. 1977a. Identification anddescription of macrobenthic communities in the Calvert Cliffs region of theChesapeake Bay. Chesapeake Sci. 18:360-369.
Holland, A. F., N. K. Mountford, and J. A. Mihursky. 1977b. Temporal variation in

13
upper Bay mesohaline benthic communities: I. The 9-m mud habitat. Chesapeake Sci. 18:370-378.
Holland, A. F., N. K. Mountford, M. H. Hiegel, K. R. Kaumeyer, and J. A. Mihursky. 1980. Influence of predation on infaunal abundance in upper Chesapeake Bay,USA. Mar. Biol. 57:221-235.
Home, M. T., N. J. Finley, and M. D. Sprenger. 1999. Polychlorinated biphenyl- andmercury-associated alterations on benthic invertebrate community structure in acontaminated salt marsh in southeast Georgia. Arch. Environ. Contam. Toxicol.37:317-324.
Kemp, W. M., R. Bartleson, S. Blumenshine, J. D. Hagy, and W. R. Boynton. 2000. Ecosystem models of the Chesapeake Bay relating nutrient loadings,environmental conditions, and living resources. Final Report to USEPAChesapeake Bay Program, 1 May 1998 - April 30 1999. University of Maryland,UMCES[HPL] Contribution # 3218, 114 pp.
Kramer, C. Y. 1956. Extension of multiple range tests to group means with unequalnumbers of replications. Biometrics 12:309-310.
Lopez, G. R. and J. S. Levinton. 1987. Ecology of deposit-feeding animals in marinesediments. Quart. Rev. Biol. 62:235-260.
Marsh, A. G. and K. R. Tenore. 1990. The role of nutrition in regulating the populationdynamics of opportunistic, surface deposit feeders in a mesohaline community. Limnol. Oceanogr. 35:710-724.
McCave, I. N. 1979. Suspended sediments. Pp. 131-185 in K. Dyer, ed., Estuarinehydrography and sedimentation, a handbook. Cambridge University Press, NewYork.
McErlean, A. J. 1964. Characteristics of Macoma balthica populations in the middlePatuxent estuary. Chesapeake Sci. 5:200-208.
McGee, B. L., D. A. Wright, and D. J. Fisher. 1998. Biotic factors modifying acutetoxicity of aqueous cadmium to estuarine amphipod Leptocheirus plumulosus. Arch Envir. Contam. Toxicol. 34:34-40.
Norton, B. L., M. A. Lewis, and L. Mayer. 1999. Storage duration and temperature andthe acute toxicities of estuarine sediments to Mysidopsis bahia and Leptocheirusplumulosus. Bull. Contamin. Toxicol. 63:157-166.
Olafsson, E. B. 1986. Density dependence in suspension-feeding and deposit-feeding

14
populations of the bivalve Macoma balthica: a field experiment. J. Anim. Ecol.55:517-626.
Olafsson, E. B. 1986. Contrasting influences of suspension-feeding and deposit-feeding populations of Macoma balthica on infaunal recruitment. Mar. Ecol. Prog.Ser. 55:171-179.
Osman, R. W. and R. B. Whitlatch. 1998. The effect of local differences in predatorsand grazers on the establishment of communities in new marsh habitat. FinalReport to the Marsh Ecology Research Program. Academy of Natural Sciences,Philadelphia. 25 pp.
Riedel, G. F., G. R. Abbe, and J. G. Sanders. 1998. Temporal and spatial variations oftrace metal concentrations in oysters from the Patuxent River, Maryland. Estuaries 21:423-434.
Riedel, G. F., S. A. Williams, G. S. Riedel, C. C. Gilmour, and J. G. Sanders. Temporaland spatial patterns of trace elements in the Patuxent River: a whole watershedapproach. Estuaries 23:521-535.
Rosa, F, J. Bloesch, and D. E. Rathke. 1991. Sampling the settling and suspendedparticulate matter (SPM). Pp. 97-130 in A. Murdoch and S. D. MacKnight, ed.,CRC Handbook of Techniques for Aquatic Sampling. CRC Press, Boston.
Ryan, J. D. 1953. The sediments of Chesapeake Bay. Bulletin of MarylandDepartment of Geology, Mines, and Water Resources 12:1-60. Baltimore,Maryland.
Sanders, H. L., P. C. Mangelsdorf, and G. R. Hampson. 1965. Salinity and faunaldistribution in the Pocasset River, Massachusetts. Limnol. Oceanogr. 10,Supplement:216-229.
SAS Institute. 2000. JMP Statistical Discovery Software. Version 4.0. SAS Institute,Cary, NC.
Tukey, J. 1991. The philosophy of multiple comparisons. Statistical Science 6:100-116.

15
Figure 1. Map of Patuxent River showing the three sampling locations near the ChalkPoint oil spill site.

0
10
20
30
0
10
20
30
% o
f Tot
al
0
10
20
30
<63 63 125 250 500 1000 2000
<63 63 125 250 500 1000 2000
<63 63 125 250 500 1000 2000
Grain Size (µm)
Trent Hall Creek
Swanson Creek
Huntin g Creek
*
**
16
Figure 2. Comparison of grain size distributions at the three sampling sites. Means(±SE) are shown for each size class. * Indicates a significant differencefrom the other sites for the size class.

0
10
20
30
0
10
20
30
% o
f Tot
al V
olum
e
0
10
20
30
<63 63 125 250 500 1000 2000
<63 63 125 250 500 1000 2000
<63 63 125 250 500 1000 2000
Grain Size (µm)
Trent Hall Creek
Swanson Creek
Hunting Creek
**
*
17
Figure 3. Comparison of grain size distributions at the three sampling sites basedon volume. Means (±SE) are shown for each size class. * Indicates asignificant difference from the other sites for the size class.

0
2
4
6
Hunting Trent Hall Swanson
%Organic Matter
18
Figure 4. Comparison of the % Organic Matter in sediment samples from the three sampling sites. Means (±SE) areshown for each site.

500
1000
1500
2000
500
1000
1500
Den
sity
(N
o. m
-2)
25
50
75
Hunting Trent Hall Swanson
Hunting Trent Hall Swanson
Hunting Trent Hall Swanson
Heteromastus
*
Nereis*
Micrura
19
Figure 5. Comparison of the densities of Heteromatus fili formis, Nereis succinea, andMicrura leidyi among the three sampling sites. Means (±SE) are shownfor each site. * Indicates a significant difference from the other sites.

100
200
300
400
100
200
300
Den
sity
(N
o. m
-2)
50
100
150
Hunting Trent Hall Swanson
Hunting Trent Hall Swanson
Hunting Trent Hall Swanson
Macoma
*
Rangia*
Hydrobia
*
A
BAB
20
Figure 6. Comparison of the densities of Macoma balthica, Rangia cuneata, andHydrobia sp. among the three sampling sites. Means (±SE) are shown foreach site. * Indicates a significant difference from the other sites. Lettersindicate sites with no significant difference.

100
200
300
100
200
300
400
Den
sity
(N
o. m
-2)
25
50
75
Hunting Trent Hall Swanson
Hunting Trent Hall Swanson
Hunting Trent Hall Swanson
Cyathura
Edotea
Leucon
A
B
AB
*
21
Figure 7. Comparison of the densities of Cyathura polita, Edotea triloba, and Leuconamericanus among the three sampling sites. Means (±SE) are shown foreach site. * Indicates a significant difference from the other sites. Lettersindicate sites with no significant difference.

15
30
15
30
45
10
20
15
30
45
Hunting Trent Hall Swanson Hunting Trent Hall Swanson
Hunting Trent Hall Swanson Hunting Trent Hall Swanson
Leptocheirus Chironomids
Palaemonetes Rhithropanopeus
Den
sity
(N
o. m
-2)
22
Figure 8. Comparison of the densities of Leptocheirus plumulosus, Chironomids, Palaemonetes pugio, andRhithropanopeus harrisii among the three sampling sites. Means (±SE) are shown for each site.

100
200
300
100
200
300
Hunting Trent Hall Swanson
Hunting Trent Hall Swanson
Nematodes
Copepods
Den
sity
(N
o. m
-2)
23
Figure 9. Comparison of the densities of Nematodes and Copepods among thethree sampling sites. Means (±SE) are shown for each site.

0
30
60
90
0
10
20
0
10
20
30
0
4
8
12
Hunting Trent Hall Swanson Hunting Trent Hall Swanson
Hunting Trent Hall Swanson Hunting Trent Hall Swanson
% Polychaetes
*% Molluscs
% Arthropods
*
% Meiofauna
24
Figure 10. Comparison of the relative abundances of Polychaetes, Molluscs, Arthropods, and Meiofauna among thethree sampling sites. Means (±SE) are shown for each site. * Indicates a significant difference between thesite and others.

500
1000
1500
2000
150
300
450
500
1000
1500
2000
100
200
300
Hunting Trent Hall Swanson Hunting Trent Hall Swanson
Hunting Trent Hall Swanson Hunting Trent Hall Swanson
Deep Deposit Feeders
*
Surface Deposit Feeders
*
OmnivoresA
B
AB
Suspension Feeders
A
AB
B
Den
sity
(N
o. m
-2)
25
Figure 11. Comparison of the densities of four trophic groups among the three sampling sites. Means (±SE) areshown for each site. * Indicates a significant difference between the site and others. Letters indicate siteswith no significant differences.

1500
3000
4500
Den
sity
(N
o. m
-2)
0
3
6
9
No.
Spe
cies
Hunting Trent Hall Swanson
Hunting Trent Hall Swanson
All Taxa
*
26
Figure 12. Comparison of the densities of All Taxa and the Number of Speciesamong the three sampling sites. Means (±SE) are shown for each site.

0 2 4 6 8 10
H1H5H4H6H8H2T5H0S7H3T8S5S6T3T7T0H9H7S0S1S2S3S4S8S9T1T2T6T9T4
Figure 13. Dendrogram showing similarity among sites based on the densitiesof all taxa. Higher links indicate greater dissimilarity. H = HuntingCreek, S = Swanson Creek, T = Trent Hall Creek.

0 2 4 6 8 10
H1H7H2H3H0S7S5H5H4H6T5H8T8S6T0S2S8S4S3S0S9H9S1T1T4T2T3T6T9T7
Figure 14. Dendrogram showing similarity among sites based on the densitiesof the dominant taxa. Higher links indicate greater dissimilarityH = Hunting Creek, S = Swanson Creek, T = Trent Hall Creek.

0 2 4 8 18
Nereis
Hetermastus
Micrura
Leptocheirus
Palaemonetes
Insect
Balanus
Rhithropanopeus
Choronomid
Leucon
Hydrobia
Copepods
Nematodes
Macoma
Edotea
Cyathura
Rangia
~ ~
Figure 15. Dendrogram showing similarity among all species based on theirdistribution among sites. Higher links indicate greater dissimilarity.

0 2 4 6 8 10 12
Nereis
Heteromastus
Hydrobia
Nematodes
Macoma
Cyathura
Edotea
Rangia
Figure 16. Dendrogram showing similarity among dominant species based on theirdistribution among sites. Higher links indicate greater dissimilarity.

31
APPENDIX I
FAUNAL AND SEDIMENT SAMPLING DATA FOR EACH STATION

32
Hunting CreekSample 1 2 3 4 5 6 7 8 9 10 Mean
Water Depth (cm) 34 31 34 42 37 39 36 34 33 35 35.5 Time of collection 11:00 11:00 11:00 11:00 11:00 11:00 11:00 11:00 11:00 11:00 11:00
Salinity ppt 5.3 5.3 5.3 5.3 5.3 5.3 5.3 5.3 5.3 5.3 5.3 Temperature C 21.3 21.3 21.3 21.3 21.3 21.3 21.3 21.3 21.3 21.3 21.3
Nemerteans Micrura leidyi 1 0 0 1 0 1 3 1 0 0 0.7 Annelids Nereis succinea 11 6 4 10 3 12 10 15 26 10 10.7 Heteromastus filiformis 21 13 12 13 3 3 13 6 13 1 9.8 Bivalve Molluscs Rangia cuneata 4 2 0 6 6 6 11 9 6 1 5.1 Macoma balthica 0 1 0 0 2 0 1 0 1 1 0.6 Gastropods Hydrobia sp. 0 0 0 0 0 0 0 0 0 0 0.0 Cumaceans Leucon americanus 0 0 0 0 0 0 0 0 0 0 0.0 Barnacles Balanus improvisus 0 0 0 0 0 0 0 0 0 0 0.0 Amphipods Leptocheirus plumulosus 1 0 0 0 1 0 0 0 2 0 0.4 Isopods Edotea triloba 10 6 3 3 1 6 17 5 4 1 5.6 Cyathura polita 3 1 1 2 2 3 0 1 1 1 1.5 Decapods Palaemonetes pugio 2 0 0 0 0 0 0 0 0 0 0.2 Rhithropanopeus harrisii 0 0 0 0 0 0 0 0 0 0 0.0 Insects Chironomids 0 0 1 0 0 0 0 1 3 0 0.5 Adult Insects 0 0 0 0 0 0 0 0 0 0 0.0 Meiofauna Copepoda 3 0 0 0 1 1 5 0 3 0 1.3 Nematoda 0 1 0 3 0 1 0 0 8 0 1.3 % Organic Matter 3.2 1.9 1.6 2.3 4.8 3.2 1.7 2.5 1.6 8.8 3.2
Table A1. Abundances of macrofauna in ten core samples from the control site in HuntingCreek. Numbers in each core and the station means are shown. Incidentalmeiofauna numbers and the % organic matter are also shown.

33
Trent Hall Creek1 2 3 4 5 6 7 8 9 10 Mean
Water Depth (cm) 26 26 22 24 25 25 28 29 24 26 25.5 Time of collection 12:00 12:00 12:00 12:00 12:00 12:00 12:00 12:00 12:00 12:00 12:00
Salinity ppt 9.6 9.6 9.6 9.6 9.6 9.6 9.6 9.6 9.6 9.6 9.6 Temperature C 23.8 23.8 23.8 23.8 23.8 23.8 23.8 23.8 23.8 23.8 23.8
Nemerteans Micrura leidyi 1 2 0 2 2 0 0 1 1 1 1.0 Annelids Nereis succinea 36 23 23 25 10 31 34 17 37 29 26.5 Heteromastus filiformis 52 42 21 50 9 34 14 12 24 15 27.3 Bivalve Molluscs Rangia cuneata 1 0 0 4 3 1 0 1 1 1 1.2 Macoma balthica 3 6 8 13 0 10 3 5 10 5 6.3 Gastropods Hydrobia sp. 0 0 0 0 0 0 0 0 0 0 0.0 Cumaceans Leucon americanus 1 2 1 0 0 1 0 0 0 0 0.5 Barnacles Balanus improvisus 0 0 0 0 0 0 1 0 0 0 0.1 Amphipods Leptocheirus plumulosus 0 0 0 0 0 0 0 0 0 0 0.0 Isopods Edotea triloba 2 4 0 1 3 1 0 1 2 0 1.4 Cyathura polita 5 8 0 10 1 5 1 4 4 1 3.9 Decapods Palaemonetes pugio 0 0 1 0 0 0 0 0 0 0 0.1 Rhithropanopeus harrisii 0 1 0 0 0 0 3 0 0 0 0.4 Insects Chironomids 1 0 0 0 0 0 0 0 0 0 0.1 Adult Insects 1 0 0 0 0 0 0 0 0 0 0.1 Meiofauna Copepoda 12 3 0 19 1 5 1 1 4 0 4.6 Nematoda 16 1 1 10 1 1 0 0 0 1 3.1
% Organic Matter 1.6 1.9 2.3 2.5 3.5 1.2 9.4 1.4 0.9 1.4 2.6
Table A2. Abundances of macrofauna in ten core samples from the moderately-oiled sitein Trent Hall Creek. Numbers in each core and the station means are shown. Incidental meiofauna numbers and the % organic matter are also shown.

34
Swanson Creek1 2 3 4 5 6 7 8 9 10 Mean
Water Depth (cm) 20 18 18 19 22 23 18 16 15 17 18.6 Time of collection 13:15 13:15 13:15 13:15 13:15 13:15 13:15 13:15 13:15 13:15 13:15 Salinity ppt 5.6 5.6 5.6 5.6 5.6 5.6 5.6 5.6 5.6 5.6 5.6 Temperature C 25.5 25.5 25.5 25.5 25.5 25.5 25.5 25.5 25.5 25.5 25.5
Nemerteans Micrura leidyi 1 0 1 1 0 1 0 0 0 1 0.5 Annelids Nereis succinea 21 16 8 15 9 14 4 15 11 18 13.1 Heteromastus filiformis 15 17 1 6 1 5 0 3 4 9 6.1 Bivalve Molluscs Rangia cuneata 5 1 1 3 3 3 0 2 1 6 2.5 Macoma balthica 0 0 3 2 2 2 0 0 0 3 1.2 Gastropods Hydrobia sp. 3 2 1 2 1 0 0 3 5 3 2.0 Cumaceans Leucon americanus 2 1 0 2 0 0 0 0 2 2 0.9 Barnacles Balanus improvisus 0 0 0 0 0 0 0 0 0 0 0.0 Amphipods Leptocheirus plumulosus 0 0 0 0 0 0 0 0 0 0 0.0 Isopods Edotea triloba 9 11 13 3 2 0 3 3 0 16 6.0 Cyathura polita 8 2 4 4 4 3 3 4 1 0 3.3 Decapods Palaemonetes pugio 0 0 0 0 1 0 0 0 1 0 0.2
Rhithropanopeus harrisii 0 0 1 0 0 0 0 0 0 1 0.2 Insects Chironomids 3 0 0 0 0 0 0 0 0 0 0.3 Adult Insects 0 0 0 0 0 0 0 0 0 0 0.0 Meiofauna Copepoda 1 2 0 2 0 0 1 1 1 7 1.5 Nematoda 11 0 0 0 0 0 0 1 0 1 1.3 % Organic Matter 2.9 3.0 6.8 2.5 4.6 2.5 16.4 2.1 6.4 5.5 5.3
Table A3. Abundances of macrofauna in ten core samples from the heavily-oiled site inSwanson Creek. Numbers in each core and the station means are shown. Incidental meiofauna numbers and the % organic matter are also shown.
35
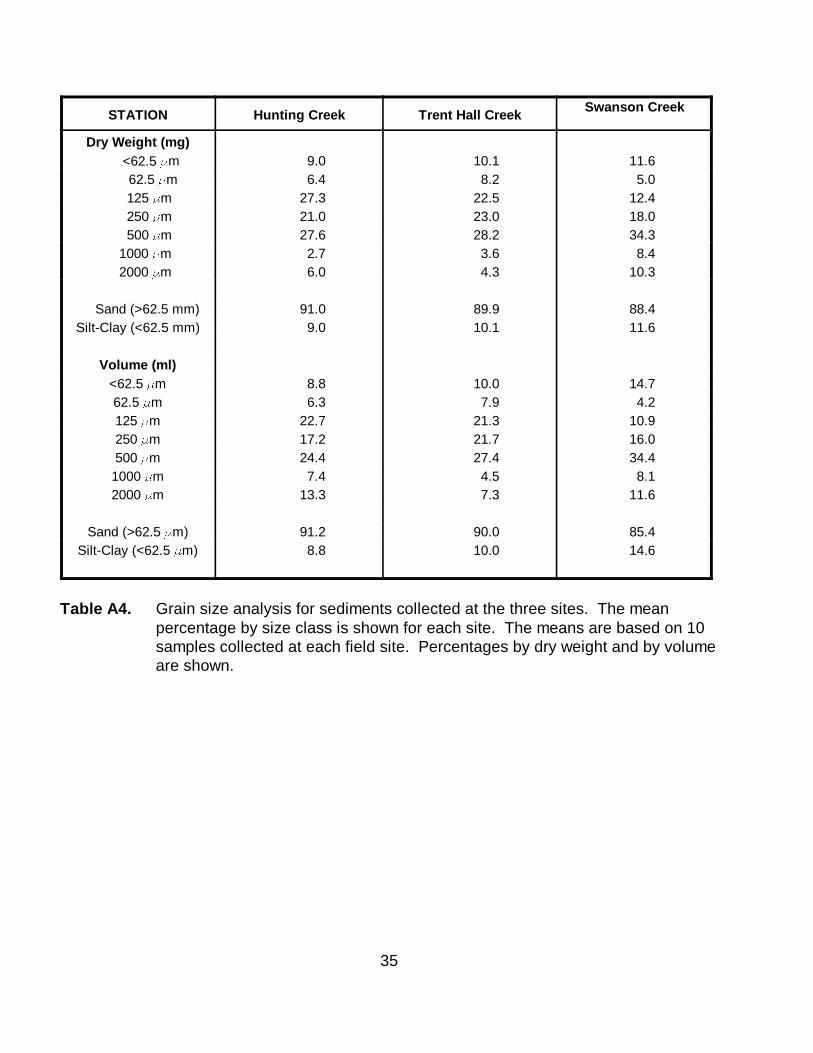
STATION Hunting Creek Trent Hall CreekSwanson Creek
Dry Weight (mg) <62.5 )m 9.0 10.1 11.6 62.5 )m 6.4 8.2 5.0 125 )m 27.3 22.5 12.4 250 )m 21.0 23.0 18.0 500 )m 27.6 28.2 34.3 1000 )m 2.7 3.6 8.4 2000 )m 6.0 4.3 10.3
Sand (>62.5 mm) 91.0 89.9 88.4 Silt-Clay (<62.5 mm) 9.0 10.1 11.6
Volume (ml)<62.5 )m 8.8 10.0 14.7 62.5 )m 6.3 7.9 4.2 125 )m 22.7 21.3 10.9 250 )m 17.2 21.7 16.0 500 )m 24.4 27.4 34.4
1000 )m 7.4 4.5 8.1 2000 )m 13.3 7.3 11.6
Sand (>62.5 )m) 91.2 90.0 85.4 Silt-Clay (<62.5 )m) 8.8 10.0 14.6
Table A4. Grain size analysis for sediments collected at the three sites. The meanpercentage by size class is shown for each site. The means are based on 10samples collected at each field site. Percentages by dry weight and by volumeare shown.