a study into crane loads associated with hose handling · pdf filethat is included in the api...
TRANSCRIPT

A Study into Crane Loads Associated with Hose Handling at Offshore Terminals

Issued by the
Oil Companies International Marine Forum 29 Queen Anne’s Gate London SW1H 9BU England Telephone: +44 (0)20 7654 1200 Fax: +44 (0)20 7654 1205
Email [email protected]
www.ocimf.com
© Oil Companies International Marine Forum
The Oil Companies International Marine Forum (OCIMF)
is a voluntary association of oil companies having an interest in the shipment and terminalling of crude oil and oil products. OCIMF is organised to represent its member-ship before, and consult with, the International Maritime Organization (IMO) and other government bodies on matters relating to the shipment and terminalling of crude oil and oil products, including marine pollution and safety.
Terms of Use While the advice given in this briefing paper (“Paper”) has been developed using the best information currently available, it is intended purely as guidance to be used at the user’s own risk. No responsibility is accepted by the Oil Companies International Marine Forum (“OCIMF”), the membership of OCIMF or by any person, firm, corporation or organization (who or which has been in any way concerned with the furnishing of in-formation or data, the compilation or any translation, publishing, supply or sale of the Paper) for the accuracy of any information or advice given in the Paper or any omission from the Paper or for any consequence whatsoever resulting directly or indirectly from compliance with, or adoption of or reliance on guidance contained in the Paper even if caused by a failure to exercise reasonable care.

Contents 1 Glossary 1 2 References 3 3 Introduction 4 4 Overview of the study 5 5 Major findings 6 6 Recommendations 7 7 Summary 8 Appendix 1 Study of tanker hose cranes at offshore terminals 9 Appendix 2 Water depth effects 13 Appendix 3 Motions, accelerations 16 Appendix 4 Nature of offshore rigid and floating hose loads 27 Appendix 5 Existing design guidelines 29

1 – Oil Companies International Marine Forum
GlossaryBoom Tip Sometimes called boom point or boom head. The boom tip is the extreme point on the crane boom where the lifted load, including the static and dynamic parts, is applied to the crane. The acceleration of the boom tip is directly translated to the lifted load by the lift wire.
Crane Spring The crane spring rate is computed from the lift weight and the total elastic deflection of the entire crane structure including stretch of wire rope, deflection of the boom, deflection of the hydraulic cylinder or boom hoist wire, deflection of the crane pedestal and supporting structure. This is one component of the dynamic factor that is included in the API offshore crane design criteria.
Dynamic Factor / Vertical Dynamic Factor The Dynamic Factor is the factor applied to the weight of an object being lifted to account for all dynamic effects (such as motion and acceleration) that are not otherwise computed directly.
Probability of Loading Probability of Loading concerns the DNV Standard for Certification of Lifting Appliances. The allowable stress in crane structure is dependent on the type of loading applied. When wind forces are included, the total loading is increased but allowable stresses are also. The Safety Factor is dependent on whether wind loading on packages is significant, and the wind loading carries a certain probability of occurrence, so the safety factors are dependent on the probability of the loading.
Side-lead handling Lifting of a load with the main lifting wire misaligned with plane of crane boom so as to impart a side loading on the boom tip.
Swell Waves, either deep water or shallow water, originating from a distance far away from the site. Longer period waves travel faster than shorter period waves. Therefore when a distant storm generates waves, the longer, faster waves separate from the shorter slower waves. Swell arriving at a site is generally regular in nature, that is the swell height and period is similar from wave to wave.
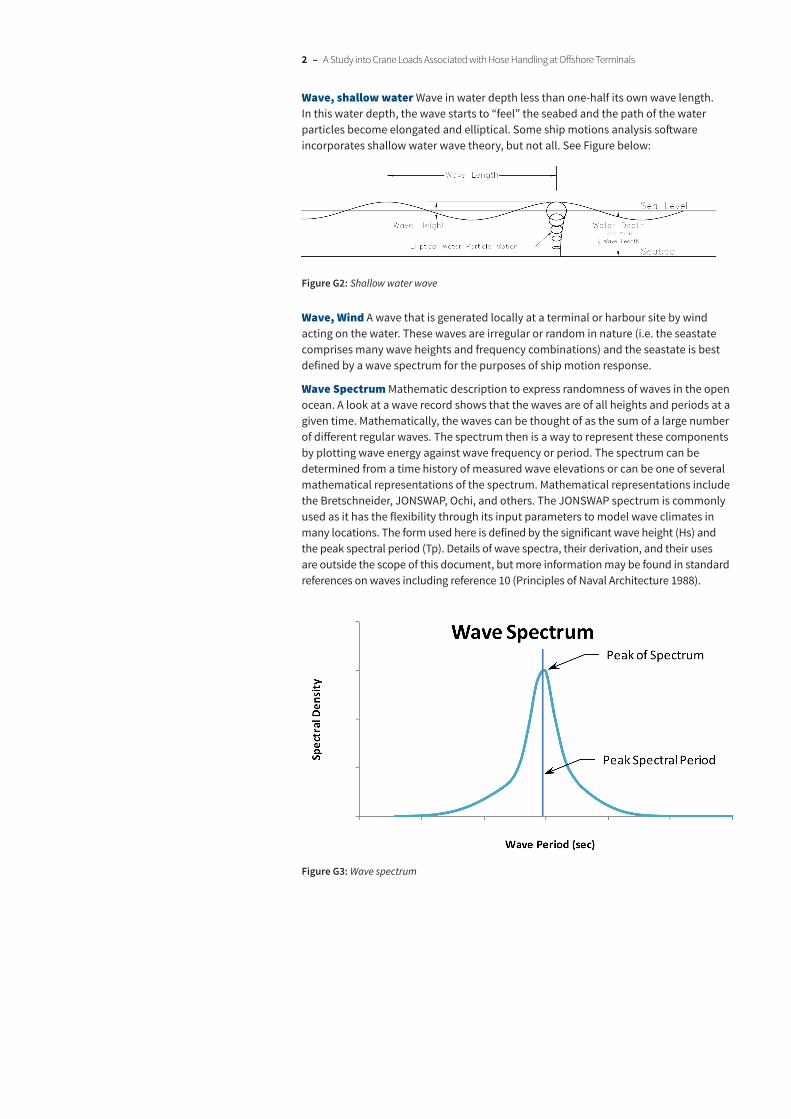
Water Particle Kinematics Motion of water molecules as a wave passes. In deep water the water particles trace a nearly circular path as the wave passes (see figure above). In shallow water, the motions of particles are influenced by the seabed, elongating into ellipses.
Wave, deep water Waves in water deep enough to not “feel” the seabed. This depth is commonly defined as being more than one-half the wave length. The water particle motion is generally circular. The assumption of deep water waves simplifies ship motions analysis. See Figure G1 below:
Figure G1: Deep water wave
B
W
C
DP
S
2 – A Study into Crane Loads Associated with Hose Handling at Offshore Terminals
Wave, shallow water Wave in water depth less than one-half its own wave length. In this water depth, the wave starts to “feel” the seabed and the path of the water particles become elongated and elliptical. Some ship motions analysis software incorporates shallow water wave theory, but not all. See Figure below:
Figure G2: Shallow water wave
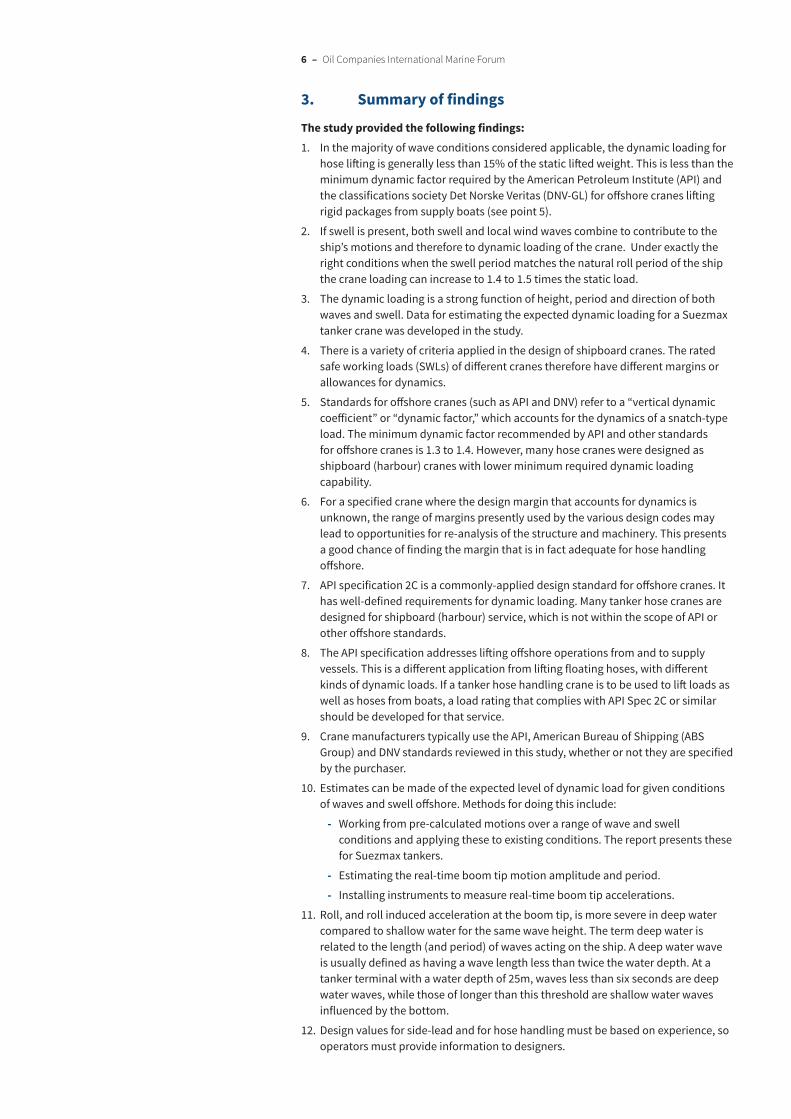
Wave, Wind A wave that is generated locally at a terminal or harbour site by wind acting on the water. These waves are irregular or random in nature (i.e. the seastate comprises many wave heights and frequency combinations) and the seastate is best defined by a wave spectrum for the purposes of ship motion response.
Wave Spectrum Mathematic description to express randomness of waves in the open ocean. A look at a wave record shows that the waves are of all heights and periods at a given time. Mathematically, the waves can be thought of as the sum of a large number of different regular waves. The spectrum then is a way to represent these components by plotting wave energy against wave frequency or period. The spectrum can be determined from a time history of measured wave elevations or can be one of several mathematical representations of the spectrum. Mathematical representations include the Bretschneider, JONSWAP, Ochi, and others. The JONSWAP spectrum is commonly used as it has the flexibility through its input parameters to model wave climates in many locations. The form used here is defined by the significant wave height (Hs) and the peak spectral period (Tp). Details of wave spectra, their derivation, and their uses are outside the scope of this document, but more information may be found in standard references on waves including reference 10 (Principles of Naval Architecture 1988).
Figure G3: Wave spectrum

3 – Oil Companies International Marine Forum
References1. API Specification 2C, Specification for Offshore Pedestal Mounted Cranes,
01 March 2004
2. ABS Guide for Certification of Lifting Appliances, 2007, Chapter 2; Guide for Certification of Cranes
3. DNV Standard for Certification No. 2.22, Lifting Appliances, October 2008
4. Lloyd’s Register Code for Lifting Appliances in a Marine Environment, January 2003
5. GL Noble Denton Guidelines for Marine Lifting Operations, Rev 9, 31 March 2010
6. Department of Defense Interface Standard for Shipboard Systems, Section 301a, Ship Motion and Attitude (Metric), 21 July 1986
7. Naval Ship’s Technical Manual, Chapter 589, Cranes; 30 May 2002
8. Appleton Marine Inc., Technical Review of Tanker Hose Handling Crane Capacity at Offshore Terminals, November 2007
9. Hose Crane Operation at Offshore Terminals, OTF9 Amsterdam March 5-6, 2008, by Capt. A.F. Fantauzzi
10. Principles of Naval Architecture, Vol III, Chapter 8; Society of Naval Architects and Marine Engineers; 1989.

4 – Oil Companies International Marine Forum
1. IntroductionOCIMF members have expressed concerns about the capability of tanker hose handling cranes to safely handle the lengths of hose typically associated with cargo operations at offshore facilities (Floating Production, Storage and Offloading (FPSO) and single point mooring (SPM)). These concerns have been prompted by the increased use of double carcass hoses, which has resulted in an increased weight of each equivalent length of floating hose. In addition, the phasing out of single hull vessels has led to today’s double hull tankers, which have greater freeboard, with the result that the total length (and therefore total weight) of hose string to be lifted has also increased.
Current industry recommendations for the lifting capacities of hose handling cranes are contained in the OCIMF’s Recommendations for Oil Tanker Manifolds and Associated Equipment (an update of which is due in 2015). However, the published guidance does not specifically take account of the potentially increased weight of floating hose strings resulting from the above factors.
OCIMF engaged Herbert Engineering Corp. to conduct an analysis of tanker hose cranes at offshore terminals. A goal of this analysis was to find the expected dynamic effects on the crane loading due to hose-handling operations at offshore terminals.
This paper is a summary of the findings and recommendations from the study. The substance of the report is included as an annex and full copies of the report, including further detailed appendices, are available from the OCIMF secretariat on request.

5 – A Study into Crane Loads Associated with Hose Handling at Offshore Terminals
2. Overview of the studyThe study examines the adequacy of tanker hose cranes at offshore terminals when considering the increase in hose weights that have occurred. The weight increase is primarily due to the replacement of single carcass hoses with double carcass hoses.
The study had two major components:
1. To calculate the expected level of dynamic load at the hose crane boom tip for a range of wave and swell conditions.
2. To assess crane design standards and the allowances made for dynamic loadings in open water environments.
The static weight of the hose is known; however since it can approach the rated capacity of the crane, there is concern that dynamic effects can overload the crane.
The design of shipboard and offshore cranes differ significantly. The shipboard cranes are intended for in-harbour conditions with little or no wave action or ship motion. Offshore cranes are intended for exposed locations where waves and motions are expected and are accounted for in the design (see appendix A5).
It should be noted that all analyses conducted in the study were linear for a 2m significant wave height. Results may be scaled to obtain results for other wave heights.
6 – Oil Companies International Marine Forum
3. Summary of findings
The study provided the following findings:1. In the majority of wave conditions considered applicable, the dynamic loading for
hose lifting is generally less than 15% of the static lifted weight. This is less than the minimum dynamic factor required by the American Petroleum Institute (API) and the classifications society Det Norske Veritas (DNV-GL) for offshore cranes lifting rigid packages from supply boats (see point 5).
2. If swell is present, both swell and local wind waves combine to contribute to the ship’s motions and therefore to dynamic loading of the crane. Under exactly the right conditions when the swell period matches the natural roll period of the ship the crane loading can increase to 1.4 to 1.5 times the static load.
3. The dynamic loading is a strong function of height, period and direction of both waves and swell. Data for estimating the expected dynamic loading for a Suezmax tanker crane was developed in the study.
4. There is a variety of criteria applied in the design of shipboard cranes. The rated safe working loads (SWLs) of different cranes therefore have different margins or allowances for dynamics.
5. Standards for offshore cranes (such as API and DNV) refer to a “vertical dynamic coefficient” or “dynamic factor,” which accounts for the dynamics of a snatch-type load. The minimum dynamic factor recommended by API and other standards for offshore cranes is 1.3 to 1.4. However, many hose cranes were designed as shipboard (harbour) cranes with lower minimum required dynamic loading capability.
6. For a specified crane where the design margin that accounts for dynamics is unknown, the range of margins presently used by the various design codes may lead to opportunities for re-analysis of the structure and machinery. This presents a good chance of finding the margin that is in fact adequate for hose handling offshore.
7. API specification 2C is a commonly-applied design standard for offshore cranes. It has well-defined requirements for dynamic loading. Many tanker hose cranes are designed for shipboard (harbour) service, which is not within the scope of API or other offshore standards.
8. The API specification addresses lifting offshore operations from and to supply vessels. This is a different application from lifting floating hoses, with different kinds of dynamic loads. If a tanker hose handling crane is to be used to lift loads as well as hoses from boats, a load rating that complies with API Spec 2C or similar should be developed for that service.
9. Crane manufacturers typically use the API, American Bureau of Shipping (ABS Group) and DNV standards reviewed in this study, whether or not they are specified by the purchaser.
10. Estimates can be made of the expected level of dynamic load for given conditions of waves and swell offshore. Methods for doing this include:
- Working from pre-calculated motions over a range of wave and swell conditions and applying these to existing conditions. The report presents these for Suezmax tankers.
- Estimating the real-time boom tip motion amplitude and period.
- Installing instruments to measure real-time boom tip accelerations.
11. Roll, and roll induced acceleration at the boom tip, is more severe in deep water compared to shallow water for the same wave height. The term deep water is related to the length (and period) of waves acting on the ship. A deep water wave is usually defined as having a wave length less than twice the water depth. At a tanker terminal with a water depth of 25m, waves less than six seconds are deep water waves, while those of longer than this threshold are shallow water waves influenced by the bottom.
12. Design values for side-lead and for hose handling must be based on experience, so operators must provide information to designers.

7 – A Study into Crane Loads Associated with Hose Handling at Offshore Terminals
4. Recommendations The report contains the following recommendations:
1. Hose crane-specific designs should be developed. As these cranes may sometimes be used for lifting rigid packages, this new criteria should address both in-port and at-sea hose handling, and the lifting of rigid packages off other boats.
2. Where there is concern that rated crane capacity may be exceeded due to heavier double carcass hoses, the crane’s structure and machinery should be analysed to reassess the dynamic loading and the rated capacity.
3. Operators should record and provide experience-based data on side-lead and off-lead hose handling.
4. Operators should consider the influence of roll resonant response on the crane dynamic loadings in wind waves and swell conditions.

8 – Oil Companies International Marine Forum
5. Summary The Herbert Engineering Corp study has indicated that the dynamic loading for hose lifting was generally less than 15% of the static lifted weight. However, there is a variety of criteria applied in the design of shipboard cranes, and the rated safe working loads of different cranes have different margins or allowances for dynamics. Further, some assumptions made during the study, for instance design values for side-lead hose handling, need to be studied further.
Operators should be made aware of limitations of their specific crane installations, and it is recommended that the next revision of the OCIMF’s Recommendations for Oil Tanker Manifolds and Associated Equipment publication include reference to the report’s findings, particularly with regard to anticipated dynamic loadings.

9 – A Study into Crane Loads Associated with Hose Handling at Offshore Terminals
Annex: Study of tanker hose cranes at offshore terminals
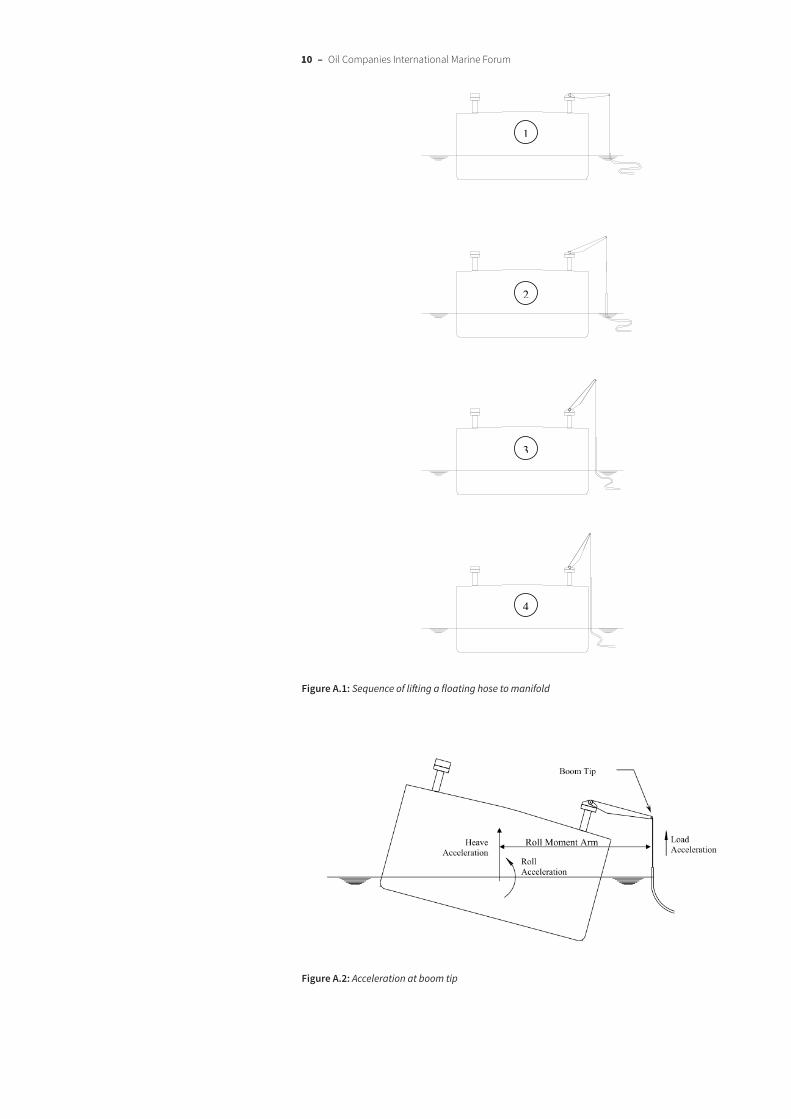
A1 IntroductionLifting the end of a floating hose to connect to the tanker manifold can be broken down into several steps as illustrated in figure A.1. At first, the weight of the hose suspended by the crane is small, and a significant dynamic component (relative to the suspended hose weight) may come from waves alternately floating the hose in a crest and dropping out from under it in a trough. However, the hose weight suspended from the crane is low at this time, so the total load will be small. The boom angle may be relatively flat to facilitate the hose handling crew connecting the crane wire to the hose.
In the second step, the crane starts to lift the hose out of the water. The hose weight on the crane increases, and the dynamic portion due to wave loads declines relative to the total weight suspended. The boom may be raised to pull the hose into the side of the tanker.
In steps three and four the boom is raised to bring the hose end to within a couple of metres of the side shell. The hose weight suspended will be the highest, and the dynamic component of loading on the crane will be primarily due to the vessel motions (roll, pitch, and heave accelerations at the boom tip).
Figure A.2 provides a representation of the acceleration at the boom tip when the vessel is rolling and starting to pick up a hose. When the vessel rolls, hydrostatic forces act to restore it upright producing the roll acceleration in the process. This roll acceleration is maximum at the angle of maximum roll and, in turn, translates to the maximum upward acceleration of the boom tip through the roll moment arm. Any load hung from the boom (i.e. the hose) is also subject to this vertical acceleration. Heave or pitch acting in phase adds (or subtracts) to the vertical acceleration, resulting in the following expression:
Vertical acceleration = AHeave + ARoll x rRoll + APitch x rPitch + gravity
Where:
AHeave = Heave acceleration
ARoll = Roll acceleration
rRoll = Roll moment arm
APitch = Pitch acceleration
rPitch = Pitch moment arm
gravity = acceleration due to gravity
The vertical acceleration in excess of gravity is the primary dynamic load effect that structural engineers use for the design of the crane and its foundation. The present study investigated the dynamic loading through the analysis of the tanker motions in response to a set of defined sea states. The wave period, wave direction and location of the load from the side of the vessel were varied to allow a determination of the maximum accelerations at the boom tip. Two tanker load cases (ballast and full-load) and two water depths (shallow and deep) were also included in the analysis matrix.
See appendix A4 for a further description of hose lifting loads and comparison against lifting of rigid packages.
10 – Oil Companies International Marine Forum
Tanker Hose Cranes Page 7 6 July 2012
Figure 1 – Sequence of Lifting a Floating Hose to Manifold
1
2
3
4
Figure A.1: Sequence of lifting a floating hose to manifold
Figure A.2: Acceleration at boom tip

11 – A Study into Crane Loads Associated with Hose Handling at Offshore Terminals
A1.2 Tanker particularsIn the present study, only a Suezmax tanker was considered. Ballast draft and full load draft loading conditions were assumed sufficient to bracket the operating range of the ship. This vessel has the following particulars:
LOA 274.5m
LBP 261.0m
Beam 50.0m
Depth 25.1m
Full load displacement 180,166 MT
Full load draft 17.2m
Ballast displacement 88,554 MT
Ballast draft 9.1m
Table A.1: Suezmax tanker particulars
A1.3 Environmental assumptionsAssumptions made for this study that affect dynamic loading of hose cranes are:
1. Local wind wave and swell environments.
2. Water depth.
The first of these considers locally-generated wind waves. Such a sea state is characterised by waves of random height and period, generally from the direction of the wind. The waves may be described by a spectrum defined by the significant wave height and the peak spectral period.
Significant wave height is the average of the one-third highest waves, and the peak period is the wave period where the peak wave energy in the spectrum, or sea state, occurs. For this study, the significant wave height for hose handling operations was provided by OCIMF as 2m, based on experience with tankers at various terminals around the world.
A tanker loading or offloading at an offshore terminal typically stays moored in up to 3.5m seas (significant height) and continues to load or offload through the cargo hose. However, because workers will have to aid in the connection or disconnection of the crane lift wire to the hose, it is considered likely that actual operations to pick up or release the hose would occur in lesser sea states. Peak spectral wave periods provided by OCIMF range from 5 seconds up to 13 seconds.

12 – Oil Companies International Marine Forum
Experience with tanker loading and offloading at exposed terminals has shown that long period swells from distant storms can occur in conjunction with local wind waves. These could come from a variety of directions relative to the ship heading. For the purposes of this study, OCIMF directed that a 2m high swell coming from any direction be applied with the wind waves. Swell is defined here as a long-crested regular wave, with little variation in height or period between subsequent waves.
Water depths used in the analysis can range from shallow for near shore terminals, such as a single point mooring (SPM), to greater than 1,000m such as at a deep-water floating production, storage and offloading (FPSO). For this study, the water depths considered range from 1.5 times the full load draft of the study tanker (1.5 x 17.2m = 26m) up to 1,000m.
A1.4 Tanker hose weightsOCIMF provided information on typical loading hose weights and weight growth. The weight growth is primarily due to the replacement of single carcass hoses with double carcass hoses. The typical single carcass weight is 9,212kg (9.2 tonnes) and the typical double carcass weights range from 10,960kg (11 tonnes) to 14,438kg (14.4 tonnes), depending primarily on working pressure.
The OCIMF data was used in the discussion of appendix A4 regarding the nature of the dynamic loads. A typical lifted static weight of ten tonnes was used based on the data provided.

13 – A Study into Crane Loads Associated with Hose Handling at Offshore Terminals
A2 Water depth effectsIn water depths greater than half of a wave’s length, waves are considered deep water waves and depth has no effect on the water particle kinematics, described by essentially circular paths. However, waves start to be affected by the bottom at water depths less than half their length. In such depths, the water particle paths become elliptical, elongated horizontally, and a difference in the wave loading and the resulting motion response of the tanker may be expected.
To determine the significance of this effect, a shallow water case and a deep water case were studied to gauge the importance of depth on tanker motions and accelerations. The shallow water depth selected is 1.5 times the full load draft of the tanker, or 25.8m. Waves with a length more than twice this depth (i.e. longer than 52m), with a corresponding period of 5.75 seconds or longer, are affected by the bottom, becoming “shallow water” waves.
The deep water depth selected for the other extreme is 1,000m, deep enough to ensure common wind waves and swells to a 50-second period are unaffected by the depth.
A2.1 Analysis approachTo evaluate the motions of a vessel in both shallow and deep water, an analysis programme that uses finite water depth theory (SPLASHD) was used. Tanker motion responses to waves for both deep and shallow water were computed for two loading conditions. Only bow quartering seas were considered for this portion of the study. From comparison of results for the four conditions, the importance of water depth on accelerations was determined.
A2.2 RAO comparisons between shallow and deep waterFor each of the four cases described above, the response amplitude operators (RAOs) for motions in six degrees of freedom and vertical acceleration at the boom tip were computed. Figure A.3 presents a comparison of the roll RAOs. This figure shows the effect of water depth for the tanker at both ballast and full load drafts (BL and FL) for the two water depths (1,000m and 25.8m). The frequencies of the peaks of the two ballast draft cases are similar, although the amplitude is much less for the shallow water case. The reduction in amplitude indicates that the effect of the reduced under-keel clearance is significant. The same applies for the full-load draft.
10
15
20
25
30
RAO
(deg
/m)
ROLL
FL-1000
BL-1000
FL-25.8
0
5
0.2 0.3 0.4 0.5 0.6 0.7 0.8Freq (rad/sec)
BL-25.8
Figure A.3: Roll RAOs – Deep and shallow water – bow quartering seas

14 – Oil Companies International Marine Forum
Figure A.4 presents the vertical acceleration RAOs for the same four cases, and similar conclusions may be made as the accelerations correlate well with the roll responses. These accelerations are for the point 7m off the side shell and 10m above the deck.
0 25
0.2
0.25
Vertical Acceleration RAOs
0.15
RAO
(g/m
)
FL-1000
0.1
cele
ratio
n R
BL-1000
FL-25.8
0.05A
c BL-25.8
00.2 0.3 0.4 0.5 0.6 0.7 0.8
Freq (rad/sec)
Figure A.4: Acceleration RAOs – Deep and shallow water - bow quartering seas
A2.3 Response comparisons between shallow and deep waterFrom the RAOs, the significant and maximum expected responses of the tanker to a sea state may be found. For this study, the two-parameter Joint North Sea Wave Project (JONSWAP) spectrum is used to describe the sea states.
Figure A.5 presents spectra for sea states of 2m significant wave height and peak spectral periods (TP) of 5, 7, 9, 11 and 13 seconds.
0.80
1.20
1.60
2.00
ctra
l Den
sity
(m2 -s
ec)
JONSWAP Spectra
Tp =5 Sec
Tp =7 Sec
Tp =9 Sec
Tp =11 Sec
0.00
0.40
0 0.5 1 1.5 2 2.5
Spe
Frequency (rad/sec)
Tp =11 Sec
Tp =13 Sec
Figure A.5: JONSWAP spectra – 2m Hs

15 – A Study into Crane Loads Associated with Hose Handling at Offshore Terminals
By combining the wave spectrum with the acceleration RAOs, the maximum 1:1000 response was found. Note that this response is the highest expected in 1,000 responses or 1,000 waves in a given sea state. For a sea state with an average wave period of approximately 10 seconds, this could be thought to mean the maximum response in 10,000 seconds, i.e. over a close to 3-hour period. Figure A.6 presents the 1:1000 vertical acceleration responses for shallow and deep water locations, plotted against the peak spectral period, TP, of the wave spectrum.
0.12
0.14Vertical Acceleration Response
0.08
0.10
eler
atio
n (g
)FL-1000
0.04
0.06
xim
um A
cce FL 1000
BL-1000
FL-25.8
0 00
0.02
0.04
Max BL-25.8
0.005 7 9 11 13
Peak Spectral Period (sec)
Figure A.6: Maximum vertical acceleration responses
A2.4 ConclusionsIt is clear that the accelerations computed for deep water were more severe than those computed in shallow water, based on the above comparisons. The remainder of the study used deep water wave theory.
For shallow water terminals, where the calculated dynamic loading controls crane operations, it should be noted that the dynamic loading may be conservative.

16 – Oil Companies International Marine Forum
A3 Motions, accelerations
A goal of this study was to find the expected dynamic loads on the crane due to hose-handling operations at offshore terminals. The general approach was to compute the motions of the tanker, and from these motions the accelerations at the crane boom tip. Computations were made for a variety of situations, including distance of load from the side shell and a range of wave periods. The U.S. Navy standard ship motion programme USN-SMP which uses deep water wave theory was used in performing these computations.
Note that all analyses conducted in this study are linear for 2m significant wave height. Linearity implies that the results may be scaled to find results for other wave heights.
The boom tip accelerations can be represented either by a response spectrum or as discrete values in response to a sea state. For this study, discrete values are presented for each of three points off the side of the vessel at the longitudinal location of the crane pedestal, which is 10m above the main deck. These points, at 1m, 3m, and 7m off the side, are shown in figure A.7.
Figure A.7: Acceleration points
A3.1.1 Motion response amplitude operators
Figure A.8 describes the vessel motion response amplitude operators (RAOs) for the tanker at ballast draft, and figure A.9 describes the full-load draft for beam seas. RAOs are simply the response to a regular wave of unit amplitude (for example, 1m amplitude in metric units).
The curve in figure A.8 shows the responses to unit waves over a range of wave frequencies. Note that the roll response is plotted on the right-hand vertical axis – all other responses are plotted on the left-hand axis.
The roll response for the ballast draft case is almost twice the roll for the full load case, while maximum heave and sway RAOs are significantly less than for the full load case.

17 – A Study into Crane Loads Associated with Hose Handling at Offshore Terminals
Figure A.8: RAOs for Ballast Draft – beam seas
8
10
12
14
16
1.0
1.5
2.0
spon
se (d
eg/m
)
e (m
or d
eg /
m)
RAOs
SURGE
HEAVE
SWAY
YAW
Full Load Draft in 1000m - Beam
0
2
4
6
0.0
0.5
0.2 0.3 0.4 0.5 0.6 0.7 0.8
Rol
l Res
Res
pons
e
Freq (rdn/sec)
PITCH
ROLL
Figure A.9: RAOs for full load draft – beam seas
18 – Oil Companies International Marine Forum
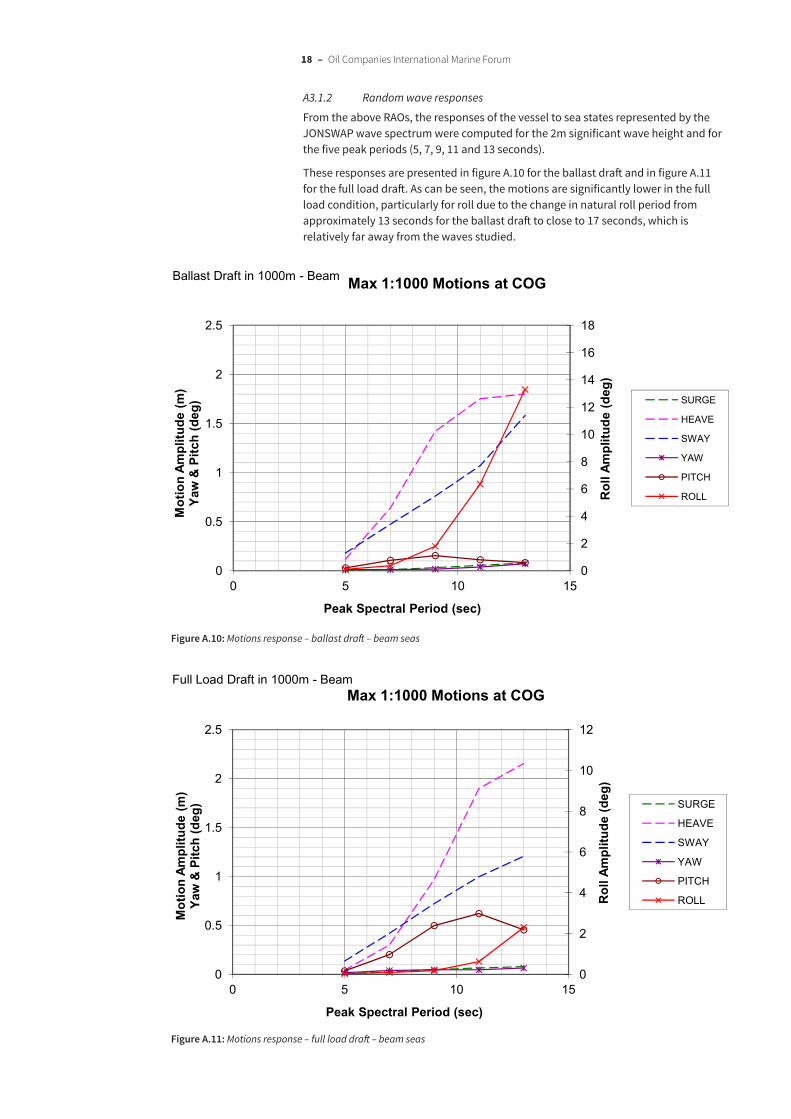
A3.1.2 Random wave responses
From the above RAOs, the responses of the vessel to sea states represented by the JONSWAP wave spectrum were computed for the 2m significant wave height and for the five peak periods (5, 7, 9, 11 and 13 seconds).
These responses are presented in figure A.10 for the ballast draft and in figure A.11 for the full load draft. As can be seen, the motions are significantly lower in the full load condition, particularly for roll due to the change in natural roll period from approximately 13 seconds for the ballast draft to close to 17 seconds, which is relatively far away from the waves studied.
8
10
12
14
16
18
1.5
2
2.5
mpl
itude
(deg
)
mpl
itude
(m)
Pitc
h (d
eg)
Max 1:1000 Motions at COG
SURGE
HEAVE
SWAY
YAW
Ballast Draft in 1000m - Beam
0
2
4
6
8
0
0.5
1
0 5 10 15R
oll A
m
Mot
ion
AmYa
w &
P
Peak Spectral Period (sec)
PITCH
ROLL
Figure A.10: Motions response – ballast draft – beam seas
6
8
10
12
1.5
2
2.5
mpl
itude
(deg
)
mpl
itude
(m)
Pitc
h (d
eg)
Max 1:1000 Motions at COG
SURGE
HEAVE
SWAY
YAW
Full Load Draft in 1000m - Beam
0
2
4
0
0.5
1
0 5 10 15
Rol
l Am
Mot
ion
AYa
w &
Peak Spectral Period (sec)
PITCH
ROLL
Figure A.11: Motions response – full load draft – beam seas

19 – A Study into Crane Loads Associated with Hose Handling at Offshore Terminals
A3.2 Estimating boom tip accelerations in waves
A3.2.1 Random wave responses
Figures A.12 through A.17 present the significant and expected maximum (1:1000) vertical acceleration responses to the sea states of interest for the tanker at ballast draft. The 1:1000 response is a typical maximum value used in marine and offshore engineering, and correlates to the highest response in 1,000 waves. As noted above, this response corresponds to the maximum in approximately 3 hours. Each of these plots shows the maximum acceleration expected in a sea state represented by the JONSWAP spectrum with 2m significant wave height plotted against peak period. The periods actually analysed ranged from 5 seconds to 13 seconds.
The tanker at full load draft experienced lower accelerations than it did at ballast draft.
A3.2.2 Results – beam seas
Table A.2 presents the significant and the maximum vertical acceleration responses for the beam sea condition for the four load points of each of the five sea states of interest shown in figure A.7. Figures A.12 and A.13 present the accelerations graphically.
Significant AccelerationsTP On CL 1m OB 3m OB 7m OB
5 0.008 0.011 0.011 0.011
7 0.024 0.030 0.030 0.031
9 0.038 0.047 0.048 0.049
11 0.036 0.058 0.060 0.065
13 0.030 0.087 0.092 0.103
Maximum AccelerationsTP On CL 1m OB 3m OB 7m OB
5 0.014 0.019 0.020 0.020
7 0.044 0.054 0.055 0.057
9 0.069 0.085 0.086 0.089
11 0.065 0.104 0.108 0.117
13 0.055 0.157 0.166 0.186
Table A.2: Beam sea vertical acceleration responses
The maximum accelerations are in the sea states with a peak period of 13 seconds at the furthest outboard location. For the ballast condition, the roll natural period is close to 13 seconds, so the roll response heavily affects the accelerations. The maximum acceleration approaches 0.2g in this case, the highest dynamic amplification factor (DAF) found in response to random waves.

20 – Oil Companies International Marine Forum
0.10
0.15
0.20
ratio
n (g
)
Significant Vertical Accelerations
1m OB
3m OB
Ballast Draft in 1000m - Beam
0.00
0.05
0 2 4 6 8 10 12 14
Acce
le
Peak Spectral Period (sec)
7m OB
on CL
Figure A.12: Significant vertical acceleration response – beam seas
0.10
0.15
0.20
ratio
n (g
)
Max 1:1000 Accelerations
1m OB
3m OB
Ballast Draft in 1000m - Beam
0.00
0.05
0 2 4 6 8 10 12 14
Acce
le
Peak Spectral Period (sec)
7m OB
on CL
Figure A.13: Maximum expected vertical acceleration response – beam seas

21 – A Study into Crane Loads Associated with Hose Handling at Offshore Terminals
A3.2.3 Results – bow quartering seas
Table A.3 and figures A.14 and A.15 present the accelerations for the tanker at ballast draft with waves coming from the forward quarter. As for beam seas, the distance outboard from the side shell affects the acceleration – the further outboard, the higher the acceleration. This indicates that roll has a significant effect on the acceleration. Again, for the ballast condition, the higher response is found at the wave periods close to the natural roll period. The maximum acceleration due to quartering seas is close to 0.1g.
Significant AccelerationsTP On CL 1m OB 3m OB 7m OB
5 0.001 0.002 0.002 0.002
7 0.004 0.007 0.007 0.008
9 0.007 0.013 0.013 0.014
11 0.008 0.021 0.022 0.025
13 0.010 0.043 0.046 0.051
Maximum AccelerationsTP On CL 1m OB 3m OB 7m OB
5 0.001 0.003 0.003 0.003
7 0.007 0.013 0.013 0.014
9 0.013 0.023 0.024 0.025
11 0.014 0.038 0.040 0.044
13 0.019 0.077 0.082 0.093
Table A.3: Bow quartering sea acceleration responses
0.06
0.08
0.10
ratio
n (g
)
Significant Accelerations
1m OB
3m OB
Ballast Draft in 1000m - Qtr
0.00
0.02
0.04
0 2 4 6 8 10 12 14
Acce
le
Peak Spectral Period (sec)
7m OB
on CL
Figure A.14: Significant vertical acceleration response – bow quartering seas
22 – Oil Companies International Marine Forum
0.06
0.08
0.10
ratio
n (g
)
Max 1:1000 Accelerations
1m OB
3m OB
Ballast Draft in 1000m - Qtr
0.00
0.02
0.04
0.0 2.0 4.0 6.0 8.0 10.0 12.0 14.0Ac
cele
Peak Spectral Period (sec)
7m OB
on CL
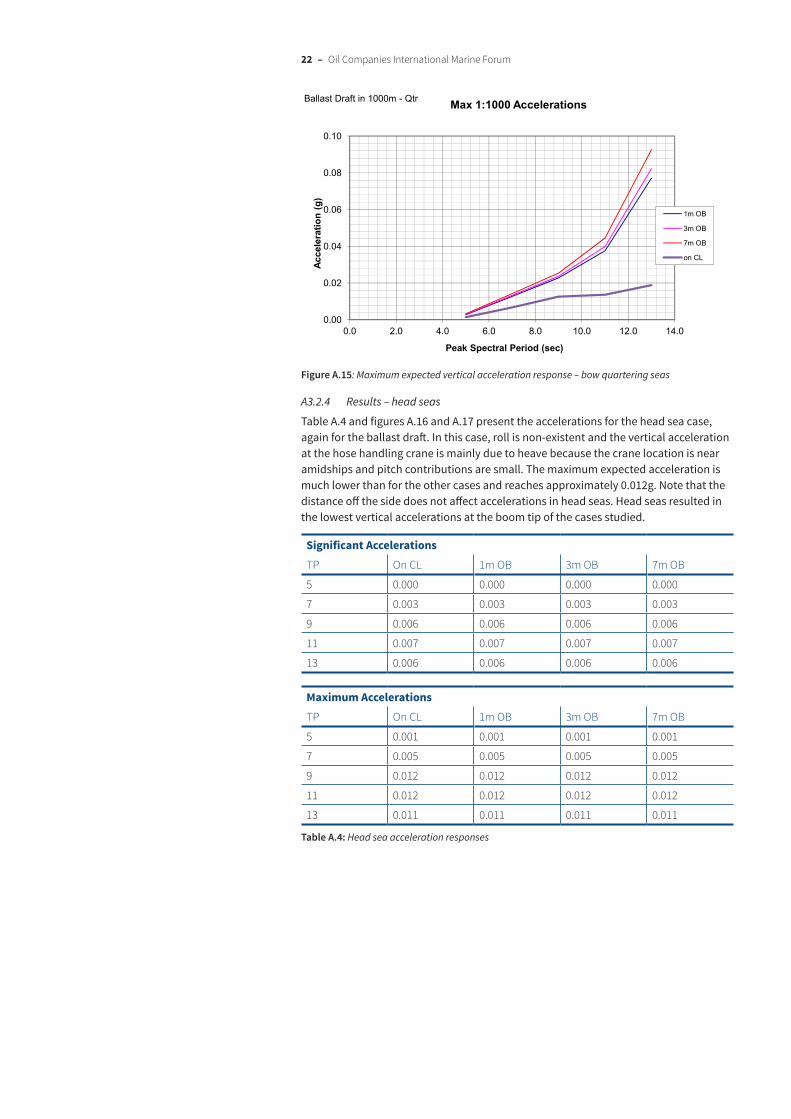
Figure A.15: Maximum expected vertical acceleration response – bow quartering seas
A3.2.4 Results – head seas
Table A.4 and figures A.16 and A.17 present the accelerations for the head sea case, again for the ballast draft. In this case, roll is non-existent and the vertical acceleration at the hose handling crane is mainly due to heave because the crane location is near amidships and pitch contributions are small. The maximum expected acceleration is much lower than for the other cases and reaches approximately 0.012g. Note that the distance off the side does not affect accelerations in head seas. Head seas resulted in the lowest vertical accelerations at the boom tip of the cases studied.
Significant AccelerationsTP On CL 1m OB 3m OB 7m OB
5 0.000 0.000 0.000 0.000
7 0.003 0.003 0.003 0.003
9 0.006 0.006 0.006 0.006
11 0.007 0.007 0.007 0.007
13 0.006 0.006 0.006 0.006
Maximum AccelerationsTP On CL 1m OB 3m OB 7m OB
5 0.001 0.001 0.001 0.001
7 0.005 0.005 0.005 0.005
9 0.012 0.012 0.012 0.012
11 0.012 0.012 0.012 0.012
13 0.011 0.011 0.011 0.011
Table A.4: Head sea acceleration responses

23 – A Study into Crane Loads Associated with Hose Handling at Offshore Terminals
0.006
0.008
0.010
ratio
n (g
)
Significant Accelerations
1m OB
3m OB
Ballast Draft in 1000m - Head
0.000
0.002
0.004
0 2 4 6 8 10 12 14
Acce
le
Peak Spectral Period (sec)
7m OB
on CL
Note: In pure Head Seas, boom tip distance does not affect accelerations
Figure A.16: Significant vertical acceleration response – head seas Note: all points are equal
0.010
0.015
0.020
ratio
n (g
)
Max 1:1000 Accelerations
1m OB
3m OB
Ballast Draft in 1000m - Head
0.000
0.005
0 2 4 6 8 10 12 14
Acce
le
Peak Spectral Period (sec)
7m OB
on CL
Note: In pure Head Seas, boom tip distance does not affect accelerations
Figure A.17: Maximum expected vertical acceleration response – head seas Note: all points are equal
24 – Oil Companies International Marine Forum
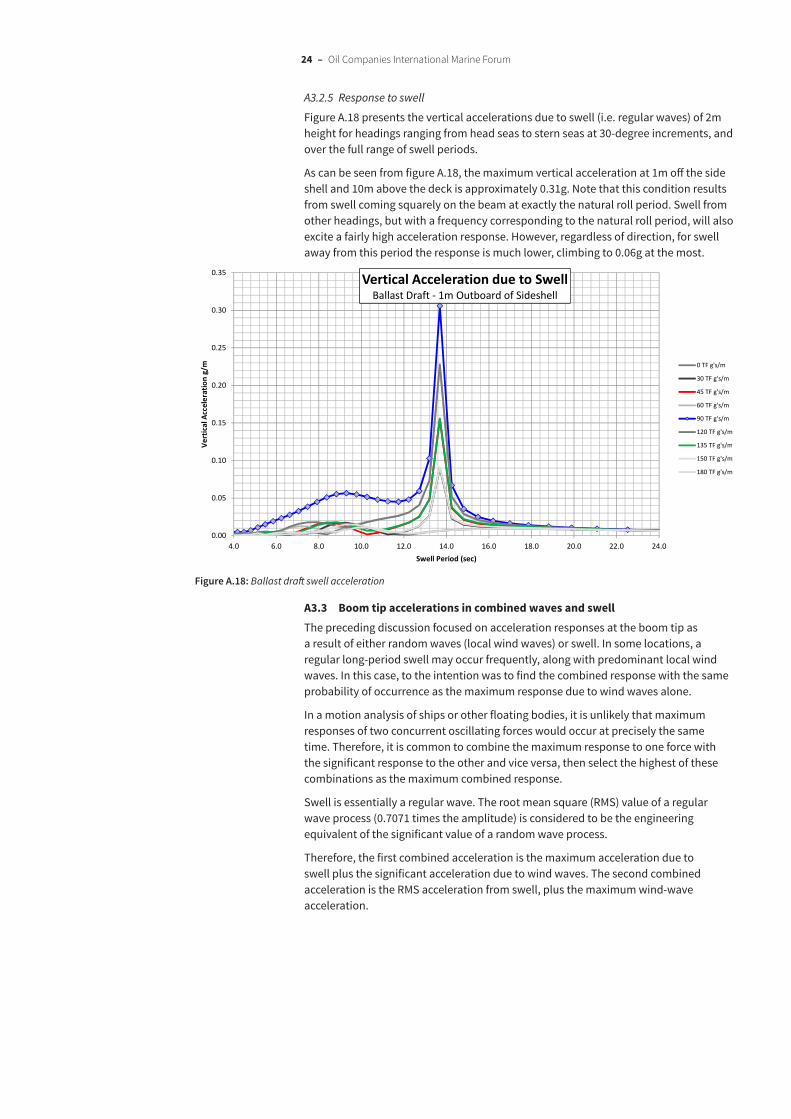
A3.2.5 Response to swell
Figure A.18 presents the vertical accelerations due to swell (i.e. regular waves) of 2m height for headings ranging from head seas to stern seas at 30-degree increments, and over the full range of swell periods.
As can be seen from figure A.18, the maximum vertical acceleration at 1m off the side shell and 10m above the deck is approximately 0.31g. Note that this condition results from swell coming squarely on the beam at exactly the natural roll period. Swell from other headings, but with a frequency corresponding to the natural roll period, will also excite a fairly high acceleration response. However, regardless of direction, for swell away from this period the response is much lower, climbing to 0.06g at the most.
0.15
0.20
0.25
0.30
0.35
Vert
ical
Acc
eler
atio
n g/
m
Vertical Acceleration due to SwellBallast Draft - 1m Outboard of Sideshell
0 TF g's/m
30 TF g's/m
45 TF g's/m
60 TF g's/m
90 TF g's/m
120 TF g's/m
135 TF g's/m
0.00
0.05
0.10
4.0 6.0 8.0 10.0 12.0 14.0 16.0 18.0 20.0 22.0 24.0
V
Swell Period (sec)
135 TF g s/m
150 TF g's/m
180 TF g's/m
Figure A.18: Ballast draft swell acceleration
A3.3 Boom tip accelerations in combined waves and swell The preceding discussion focused on acceleration responses at the boom tip as a result of either random waves (local wind waves) or swell. In some locations, a regular long-period swell may occur frequently, along with predominant local wind waves. In this case, to the intention was to find the combined response with the same probability of occurrence as the maximum response due to wind waves alone.
In a motion analysis of ships or other floating bodies, it is unlikely that maximum responses of two concurrent oscillating forces would occur at precisely the same time. Therefore, it is common to combine the maximum response to one force with the significant response to the other and vice versa, then select the highest of these combinations as the maximum combined response.
Swell is essentially a regular wave. The root mean square (RMS) value of a regular wave process (0.7071 times the amplitude) is considered to be the engineering equivalent of the significant value of a random wave process.
Therefore, the first combined acceleration is the maximum acceleration due to swell plus the significant acceleration due to wind waves. The second combined acceleration is the RMS acceleration from swell, plus the maximum wind-wave acceleration.
25 – A Study into Crane Loads Associated with Hose Handling at Offshore Terminals
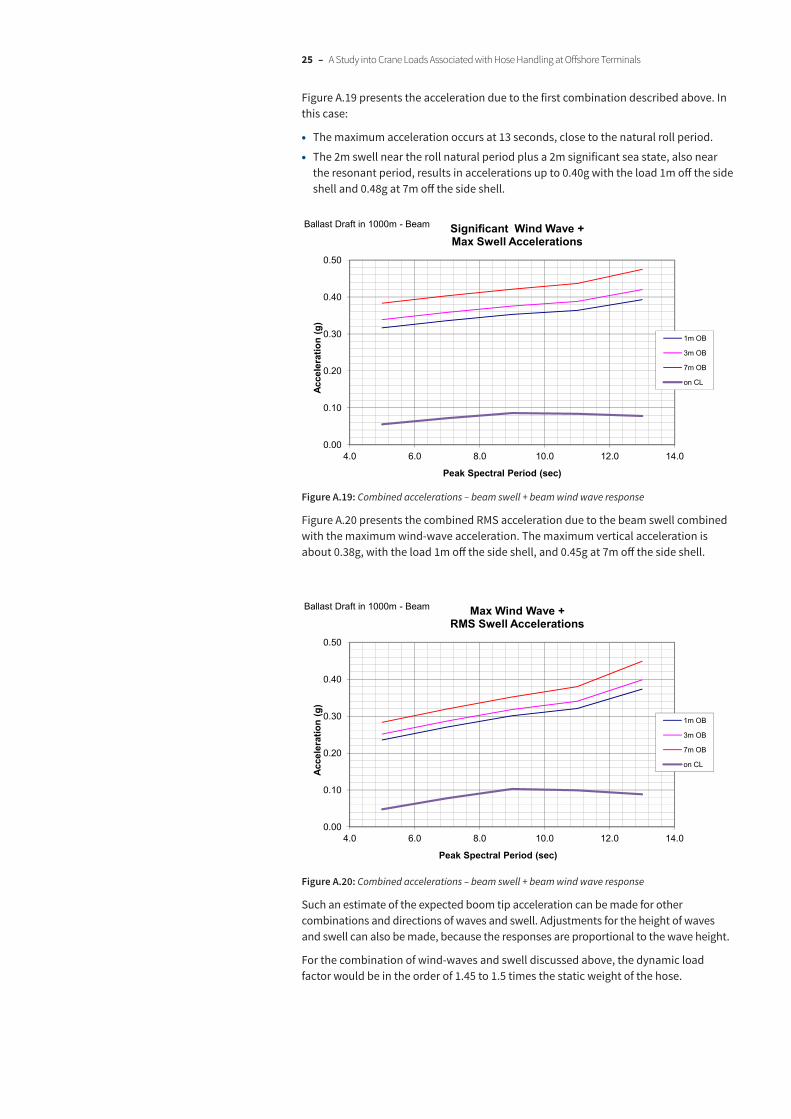
Figure A.19 presents the acceleration due to the first combination described above. In this case:
• The maximum acceleration occurs at 13 seconds, close to the natural roll period.
• The 2m swell near the roll natural period plus a 2m significant sea state, also near the resonant period, results in accelerations up to 0.40g with the load 1m off the side shell and 0.48g at 7m off the side shell.
0.30
0.40
0.50
ratio
n (g
)
Significant Wind Wave + Max Swell Accelerations
1m OB
3m OB
Ballast Draft in 1000m - Beam
0.00
0.10
0.20
4.0 6.0 8.0 10.0 12.0 14.0
Acce
le
Peak Spectral Period (sec)
7m OB
on CL
Figure A.19: Combined accelerations – beam swell + beam wind wave response
Figure A.20 presents the combined RMS acceleration due to the beam swell combined with the maximum wind-wave acceleration. The maximum vertical acceleration is about 0.38g, with the load 1m off the side shell, and 0.45g at 7m off the side shell.
0.30
0.40
0.50
ratio
n (g
)
Max Wind Wave + RMS Swell Accelerations
1m OB
3m OB
Ballast Draft in 1000m - Beam
0.00
0.10
0.20
4.0 6.0 8.0 10.0 12.0 14.0
Acce
le
Peak Spectral Period (sec)
7m OB
on CL
Figure A.20: Combined accelerations – beam swell + beam wind wave response
Such an estimate of the expected boom tip acceleration can be made for other combinations and directions of waves and swell. Adjustments for the height of waves and swell can also be made, because the responses are proportional to the wave height.
For the combination of wind-waves and swell discussed above, the dynamic load factor would be in the order of 1.45 to 1.5 times the static weight of the hose.
26 – Oil Companies International Marine Forum
A3.4 Side lead and off lead effectsA tanker crane lifting a hose will (by definition) have the loading side lead because the centre of gravity of the hose is rarely directly below the boom tip. Currents, winds, and waves exacerbate this effect.
Such out-of-plane effects on the crane loads can be estimated from the maximum roll and pitch values combined with experience-based values for hose out of position due to current. This study’s authors do not expect that translational wave motions of the hose are significant. However, a current may pull the hose out of line with the crane. It is expected that the Crane Operator is sufficiently trained to minimize the side lead by pointing the boom at the load to the extent possible. There is typically little effect expected from a hose-handling boat.
For lifting packages from a supply boat, motions of the boat affect the side and off lead. Off lead must be accounted for because it changes the effective lift radius. API Specification 2C provides guidance on side lead and off lead effects of lifting packages off boats.
Design values for side lead and off lead for lifting hoses should be experience-based, and information for this purpose is needed from Operators.
A3.5 Conclusions1. With 2m significant wave height, the maximum dynamic loading for this case ranges
from approximately 16% of suspended hose weight with the boom raised (load 1.0 m off side) to 19% of suspended hose weight with the boom lowered (load at 7.0 m off the side).
2. Long period swell may result in higher vertical accelerations at the boom tip with or without local seas if it acts at the natural roll period. In this case the maximum dynamic loading may reach 48% or more of suspended hose weight in 2m wave and swell heights.
3. Input from operators is needed to help define side lead and off lead values for design and analysis of crane structures.
4. Operators should be informed of the important effects of roll resonant response from both wind waves and swell on the dynamic loading.

27 – A Study into Crane Loads Associated with Hose Handling at Offshore Terminals
A4 Nature of offshore rigid and floating hose loadsThe loading that is addressed in the API specification is a shock load that occurs as a rigid package is snatched suddenly from its support. The equation that determines the dynamic loading factor (API refers to as vertical dynamic coefficient) is provided in A5.1. The equation is based on a balance between the spring energy developed in the crane and the kinetic energy developed in the momentum of the load as it is accelerated to the snatch velocity. The dynamic load has a period equal to the crane spring natural period and an average value equal to the static weight. The dynamic load damps out over several cycles. This loading is characterised in figure A.21. This is an idealisation that ignores several second order effects to illustrate the important aspects.
4 006.008.00
10.0012.0014.0016.0018.00
Load
(t)
Static Weight
Dynamic Load
0.002.004.00
0.00 1.00 2.00 3.00 4.00 5.00Time (sec)
Figure A.21: Idealisation of a snatch type load
Picking up a floating hose is a radically different kind of dynamic load. The load increases gradually as more length of hose is supported from the crane hook. The crane oscillates as described in the foregoing motions analysis. The acceleration of the hook results in dynamic inertia loads that are proportional to the acceleration and the mass supported by the crane; these loads oscillate with the ship and period of the waves (this loading is characterised in figure A.22). Again, this is an idealisation that ignores some second order effects – including wave forces on the hose that will affect the hook load. Manual calculations indicate that the wave forces are small compared to the weight and inertia forces once the hose is mostly out of the water (static weight for lifting a double-carcass hose is in the order of 10 to 14 tonnes). Note that the inertial loads are directly proportional to the mass being lifted (and therefore also directly proportional to static weight).

28 – Oil Companies International Marine Forum
4 00
6.00
8.00
10.00
12.00
14.00
Load
(t)
Static Weight
Dynamic Load
0.00
2.00
4.00
0 20 40 60 80Time (sec)
Figure A.22: Idealisation of a floating hose pick-up load
The dynamic effect of a snatch-type load tends to be greater than picking up a floating hose for a typical crane stiffness and typical motions of tankers in reasonable wave condition. This is cause to add guidance in the API Specification 2C and other design guides that address the different, generally smaller, dynamic loading experienced by hose cranes.

29 – A Study into Crane Loads Associated with Hose Handling at Offshore Terminals
A5 Existing design guidelinesExisting guidelines were studied to gain a sense of the level of consensus regarding treatment of dynamic loads, allowable stresses and other requirements, such as fatigue.
The guidelines that were studied are from classification societies, one industry association (API) and a government (US Navy).
In the standards reviewed there is a consistent separation between shipboard cranes and offshore cranes. The former are understood to be intended for in-harbour conditions with little or no wave action or ship motion. The latter are intended for exposed locations where waves and motions are expected and are accounted for in the design.
A5.1 API specification 2CThe API specification is the most widely used standard for offshore pedestal mounted cranes. It is not intended to be used for shipboard cranes, however it would be suitable for this purpose with lowered dynamic load factors.
The API specification specifically addresses lifting operations between supply vessels and offshore platforms or ships. These are discrete/rigid load packages that are picked up suddenly where the relative velocity between the hook and the deck of the vessel can be significant and cause shock loads. The specification does not address lifting of floating hoses, because (as discussed in appendix A4) this is a different kind of dynamic load.
API addresses the following structural design issues:
• Onboard and off board lifts.
• Vertical velocities of the crane vessel and supply vessel.
• Hoist velocity of the hook itself.
• Side loads, off loads, wind loads.
• Vertical dynamic loads (via vertical dynamic coefficient).
• Crane inclinations.
• Horizontal accelerations.
• Allowable stresses.
• Fatigue.
• Increased safety factors for crane pedestal and foundation.
The important requirements are summarised in table A.5. The minimum required vertical dynamic coefficient is 1.40 and could easily be higher depending on the actual parameters of the crane, the ship and the supply vessel.
The vertical dynamic coefficient is determined from the equation:
Cv = 1 + Vr (K / (g x SWL)) 1/2
Where:
Cv = vertical dynamic coefficient.
Vr = Vh + (Vd2 + Vc2)1/2 = relative velocity between hook and load at pick-up.
K = vertical stiffness of the crane at the hook.
Vh = maximum steady hoisting velocity.
Vd = maximum vertical velocity of the supply boat deck.
Vc = maximum vertical velocity of the crane boom tip due to vessel motion.
g = acceleration due to gravity.
SWL = static safe working load, including the static weight of package, hook, block, wire etc.
The dynamic coefficient accounts for the shock of a suddenly applied load and the inertia force to accelerate the load.

30 – Oil Companies International Marine Forum
A5.2 ABS Guide for CertificationThe ABS guide for cranes was last issued in 2007, but it has a history going back at least 20 years. From reviewing the guide and from discussions with ABS it is clear that the requirements for shipboard cranes are in need of updating. The requirements for load cases have assumptions on internal load distributions consistent with being produced by a computer programme; i.e. they are not presented in a rigorous form.
The guide does not specifically address several important issues, such as fatigue and shock loads, except for general requirements for the designer/purchaser to specify the design criteria and load ratings. For strength assessment of in-service conditions the guide mentions only suspending a load from the hook. It is noted that shock loads can occur with shipboard as well as offshore cranes. The amount of shock depends on the Crane Operator’s care and skill in controlling the hoist velocity as the load is picked up.
The guide includes allowable stress limits, which are lower than in other standards, with the implication that there are allowances for dynamic and fatigue loads if the design is based on static loads. Overall, the guide takes the appearance of earlier class society rules that implemented successful semi-empirical practices, but have been replaced with rules developed more from first principles.
For offshore cranes the ABS guide adopts API Specification 2C by reference including allowable stresses. The approach is therefore very different between shipboard and offshore cranes. This is generally not the case in the other standards that were reviewed.
A5.3 DNV Standard for CertificationThe DNV standard for cranes has a consistent and rigorous approach for shipboard and offshore cranes, as well as various other types of lifting gear. It also mentions hose cranes; however, it has no special provisions for the different nature of the loading. DNV addresses all the structural design issues listed above for API. There are differences in some assumptions, including the summation of vertical velocities for calculating the dynamic loading, i.e.:
Vr = ½ Vh + (Vd2 + Vc2)1/2 = relative velocity between load and hook at pick-up.
Here, only half of the full hoist velocity is added to the combination of supply boat deck and crane boom tip velocities, so it is less conservative than API. Also, the DNV allowable stresses are greater than for API and ABS. Thus the overall margins are less than API and ABS as reflected in table A.5.
DNV allows higher stresses when wind loads are included, which makes the safety margin dependent on the probability of the loading.
Unlike API, DNV also allows the hoisting speed to be slower than that needed to avoid contact between the load and the next wave crest. This is allowed, provided a notation is entered on the load chart that prevention of re-contact is dependent on the skill of the operator.
A5.4 Lloyd’s Register CodeThe Lloyd’s code has separate sections for pedestal type and other types of lifting gear such as derricks and union purchase arrangements. There are also separate sections for shipboard and offshore cranes, for which treatments of dynamic loads are included for both shipboard and offshore but they are in a simpler format for shipboard cranes.
Lloyd’s addresses all the structural design issues listed above for API and DNV, but with different formats and emphasis. The approach is more empirical. For motions in waves, Lloyd’s provides factors based on wave height and period though without requiring ship-specific motions analysis.
Lloyd’s introduces a duty factor not mentioned in other standards. The duty factor reflects frequency of use and apparently can be implemented in lieu of fatigue analysis. Lloyd’s mentions fatigue analysis in only general terms, with the implication that the code is based on successful practice that typically does not include fatigue analysis. The duty factors are 1.05 and 1.20 for shipboard and offshore cranes respectively.
31 – A Study into Crane Loads Associated with Hose Handling at Offshore Terminals
A5.5 Crane manufacturersTwo crane manufacturers were contacted to obtain comments on their design practices for Shipboard Cranes. The first mentioned the API and ABS standards as the ones most frequently used. They were not familiar with the DNV or Lloyd’s standards, or other standards such as ISO or EN. They indicated they would be most likely to apply the API standard for a hose crane application, but agreed the loading is different and less severe than picking up a rigid package from a supply vessel. They said that fatigue is usually not a concern, and that while fatigue analysis is not usually carried out there are exceptions. They further indicated that the crane structure is rarely a source of problems. This may indicate that the design margins are conservative. They agreed there could be room for reanalysis and an increase of the ratings.
The second manufacturer’s comments were similar to the first’s, but with some different emphasis. They primarily use the API specification and agreed that the ABS guide is less comprehensive and rigorous. They are familiar with the DNV standard and described it as similar to API. They do not use the European ISO and EN standards and consider these to be little-used by other manufacturers, even in Europe.
One manufacturer was familiar with the hose handling issues. They say that the crane manufacturers know little about the dynamic loads involved in lifting floating hoses and that they apply the API specification as being the best available at this time. For fatigue, they find that the API approach is adequate and does not control the design. Regarding machinery limits, they comment that transient overloads are not an issue for most hydraulic and electrical components, but of course there are stress limits for the mechanical systems similar to the steel structure.
Overall, the discussions with the manufacturers indicated that they follow the published standards already discussed above, so that the design margins of these standards are representative for existing and new cranes.
A5.6 Other referencesSeveral other references were reviewed with the intention of including as many design standards as possible for comparison. These references were useful but were found to provide few (or no) design criteria. Instead, they provided guidance for operations, testing and certification or were survey documents describing available standards.
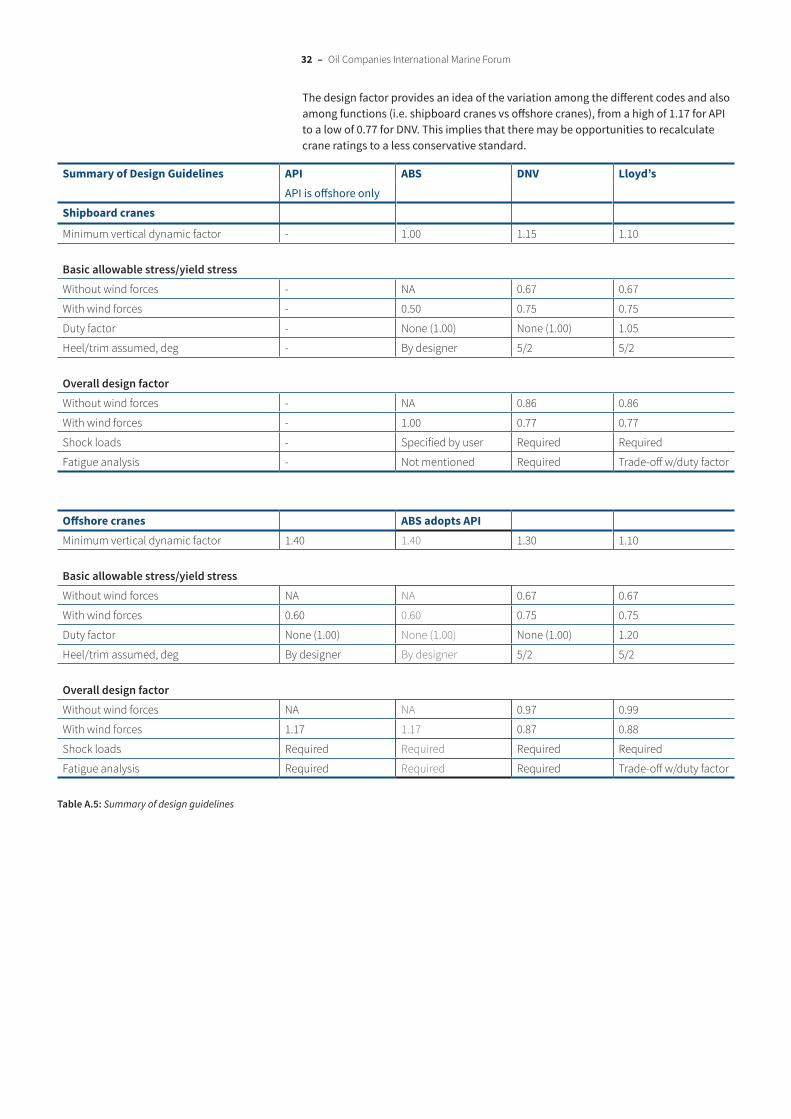
A5.7 Summary of design guidelinesTable A.5 provides a summary of design guidelines from different organisations. In the standards reviewed there is a consistent separation between shipboard cranes and offshore cranes. The former are understood to be intended for in-harbour conditions with little or no wave action or ship motion. The latter are intended for exposed locations where waves and motions are expected and are accounted for in the design.
There are ISO and European (EN) standards for cranes that were not reviewed. The authors understand from discussions with crane manufacturers that these standards are not in use as much as the class society and API standards.
The important factors making up the design factor are summarised for comparison in table A.5. The design factor is an approximate overall safety factor calculated by:
1. Design factor = (minimum vertical dynamic factor) x (duty factor)/stress factor (normalised to the ABS design factor being 1.00).
2. Stress factor = basic allowable stress/yield stress.
Note that the design factor is only an approximation and does not account for variations in other factors, such as buckling stresses and fatigue analysis. Also note that the vertical dynamic factor is only one component of the overall design factor.
32 – Oil Companies International Marine Forum
The design factor provides an idea of the variation among the different codes and also among functions (i.e. shipboard cranes vs offshore cranes), from a high of 1.17 for API to a low of 0.77 for DNV. This implies that there may be opportunities to recalculate crane ratings to a less conservative standard.
Summary of Design Guidelines API ABS DNV Lloyd’sAPI is offshore only
Shipboard cranes
Minimum vertical dynamic factor - 1.00 1.15 1.10
Basic allowable stress/yield stressWithout wind forces - NA 0.67 0.67
With wind forces - 0.50 0.75 0.75
Duty factor - None (1.00) None (1.00) 1.05
Heel/trim assumed, deg - By designer 5/2 5/2
Overall design factorWithout wind forces - NA 0.86 0.86
With wind forces - 1.00 0.77 0.77
Shock loads - Specified by user Required Required
Fatigue analysis - Not mentioned Required Trade-off w/duty factor
Offshore cranes ABS adopts APIMinimum vertical dynamic factor 1.40 1.40 1.30 1.10
Basic allowable stress/yield stressWithout wind forces NA NA 0.67 0.67
With wind forces 0.60 0.60 0.75 0.75
Duty factor None (1.00) None (1.00) None (1.00) 1.20
Heel/trim assumed, deg By designer By designer 5/2 5/2
Overall design factorWithout wind forces NA NA 0.97 0.99
With wind forces 1.17 1.17 0.87 0.88
Shock loads Required Required Required Required
Fatigue analysis Required Required Required Trade-off w/duty factor
Table A.5: Summary of design guidelines
33 – A Study into Crane Loads Associated with Hose Handling at Offshore Terminals
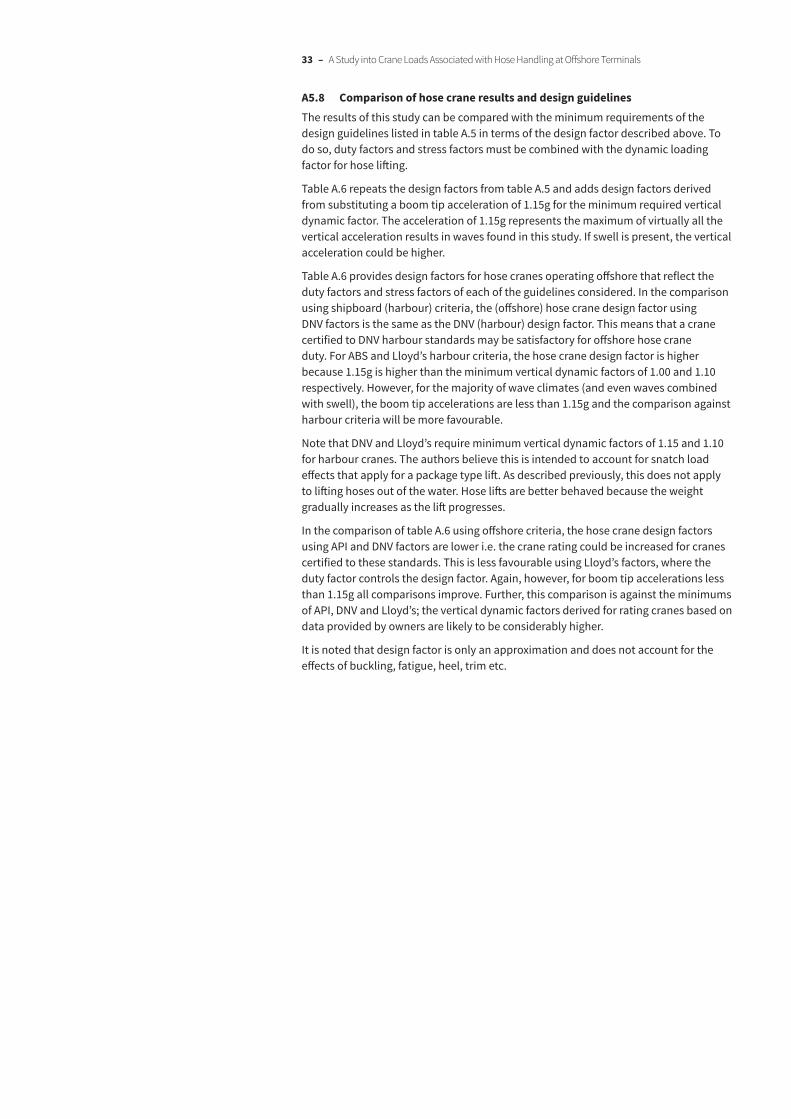
A5.8 Comparison of hose crane results and design guidelinesThe results of this study can be compared with the minimum requirements of the design guidelines listed in table A.5 in terms of the design factor described above. To do so, duty factors and stress factors must be combined with the dynamic loading factor for hose lifting.
Table A.6 repeats the design factors from table A.5 and adds design factors derived from substituting a boom tip acceleration of 1.15g for the minimum required vertical dynamic factor. The acceleration of 1.15g represents the maximum of virtually all the vertical acceleration results in waves found in this study. If swell is present, the vertical acceleration could be higher.
Table A.6 provides design factors for hose cranes operating offshore that reflect the duty factors and stress factors of each of the guidelines considered. In the comparison using shipboard (harbour) criteria, the (offshore) hose crane design factor using DNV factors is the same as the DNV (harbour) design factor. This means that a crane certified to DNV harbour standards may be satisfactory for offshore hose crane duty. For ABS and Lloyd’s harbour criteria, the hose crane design factor is higher because 1.15g is higher than the minimum vertical dynamic factors of 1.00 and 1.10 respectively. However, for the majority of wave climates (and even waves combined with swell), the boom tip accelerations are less than 1.15g and the comparison against harbour criteria will be more favourable.
Note that DNV and Lloyd’s require minimum vertical dynamic factors of 1.15 and 1.10 for harbour cranes. The authors believe this is intended to account for snatch load effects that apply for a package type lift. As described previously, this does not apply to lifting hoses out of the water. Hose lifts are better behaved because the weight gradually increases as the lift progresses.
In the comparison of table A.6 using offshore criteria, the hose crane design factors using API and DNV factors are lower i.e. the crane rating could be increased for cranes certified to these standards. This is less favourable using Lloyd’s factors, where the duty factor controls the design factor. Again, however, for boom tip accelerations less than 1.15g all comparisons improve. Further, this comparison is against the minimums of API, DNV and Lloyd’s; the vertical dynamic factors derived for rating cranes based on data provided by owners are likely to be considerably higher.
It is noted that design factor is only an approximation and does not account for the effects of buckling, fatigue, heel, trim etc.

34 – Oil Companies International Marine Forum
Comparison of Design Factors API ABS DNV Lloyd’sfrom various design guidelines API is offshore only
Shipboard cranes
Minimum vertical dynamic factor - 1.00 1.15 1.10
Basic allowable stress/yield stress
Without wind forces - NA 0.67 0.67
With wind forces - 0.50 0.75 0.75
Duty factor - None (1.00) None (1.00) 1.05
Heel/trim assumed, deg - By designer 5/2 5/2
Overall design factorDesign Factor without wind forces - NA 0.86 0.86
Design Factor with wind forces - 1.00 0.77 0.77
Hose crane design factor assuming boom tip acceleration = 1.15gVertical Dynamic Factor 1.15 1.15 1.15 1.15
Design Factor without wind forces - NA 0.86 0.90
Design Factor with wind forces - 1.15 0.77 0.81
Offshore cranes ABS adopts APIMinimum vertical dynamic factor 1.40 1.40 1.30 1.10
Basic allowable stress/yield stress
Without wind forces NA NA 0.67 0.67
With wind forces 0.60 0.60 0.75 0.75
Duty factor None (1.00) None (1.00) None (1.00) 1.20
Overall design factorWithout wind forces NA NA 0.97 0.99
With wind forces 1.17 1.17 0.87 0.88
Hose crane design factor assuming boom tip acceleration = 1.15gVertical Dynamic Factor 1.15 1.15 1.15 1.15
Design Factor without wind forces NA NA 0.86 1.03
Design Factor with wind forces 0.96 0.96 0.77 0.92 Table A.6: Comparison of design factors
These comparisons once again illustrate that the different and more benign nature of hose lifting compared to package lifts leads to opportunities for reanalysis of the structure and machinery to provide the basis for increasing the crane rating.

35 – A Study into Crane Loads Associated with Hose Handling at Offshore Terminals

36 – Oil Companies International Marine Forum
Oil Companies International Marine Forum29 Queen Anne’s GateLondon SW1H 9BUUnited Kingdom
T +44 (0)20 7654 1200F +44 (0)20 7654 1205E [email protected]
ocimf.com
A voice for safety