a study of campsite impacts on the san juan river utah
TRANSCRIPT

University of Montana University of Montana
ScholarWorks at University of Montana ScholarWorks at University of Montana
Graduate Student Theses, Dissertations, & Professional Papers Graduate School
1991
A study of campsite impacts on the San Juan River Utah A study of campsite impacts on the San Juan River Utah
Debra Jane Sholly The University of Montana
Follow this and additional works at: https://scholarworks.umt.edu/etd
Let us know how access to this document benefits you.
Recommended Citation Recommended Citation Sholly, Debra Jane, "A study of campsite impacts on the San Juan River Utah" (1991). Graduate Student Theses, Dissertations, & Professional Papers. 8572. https://scholarworks.umt.edu/etd/8572
This Thesis is brought to you for free and open access by the Graduate School at ScholarWorks at University of Montana. It has been accepted for inclusion in Graduate Student Theses, Dissertations, & Professional Papers by an authorized administrator of ScholarWorks at University of Montana. For more information, please contact [email protected].

Maureen and Mike MANSFIELD LIBRARY
Copying allowed as provided under provisions of the Fair Use Section of the U.S.
COPYRIGHT LAW, 1976.Any copying for commercial purposes
or fiiiancM gain may be under^en only with the author’s written consent.
University ofMontana
Reproduced with permission of the copyright owner. Further reproduction prohibited without permission.

Reproduced with permission of the copyright owner. Further reproduction prohibited without permission.

A STUDY OF CAMPSITE IMPACTS ON THE
SAN JUAN RIVER, UTAH
By
Debra Jane Sholly
B.S., University of Utah, 1989
Presented in partial fulfillment of the requirements
for the degree of
Master of Science
University of Montana
1991
Approved by
(RjWr (R.
Chairman, Board of Examiners
)ean, Graduate School
^ /
Dat?
Reproduced with permission of the copyright owner. Further reproduction prohibited without permission.

UMI Number; EP39373
All rights reserved
INFORMATION TO ALL USERS The quality of this reproduction is dependent upon the quality of the copy submitted.
In the unlikely event that the author did not send a complete manuscript and there are missing pages, these will be noted. Also, if material had to be removed,
a note will indicate the deletion.
UMIOissertatiofi Publistog
UMI EP39373
Published by ProQuest LLC (2013). Copyright in the Dissertation held by the Author.
Microform Edition © ProQuest LLC.All rights reserved. This work is protected against
unauthorized copying under Title 17, United States Code
ProQ^scProQuest LLC.
789 East Eisenhower Parkway P.O. Box 1346
Ann Arbor, Ml 48106- 1346
Reproduced with permission of the copyright owner. Further reproduction prohibited without permission.

Shol ly, Debra J., M.S., June, 1991 Recreation Management
A Study of Campsite Impacts on the San Juan River, Utah (81 pp.)
Director: Robert R. Ream ^
A campsite inventory was taken on the San Juan River, Glen Carvon National Recreation Area during the summer of 1990, Forty-one campsites were identified. A number of counts and estimates were taken to establish a database of information on site impacts, including both biophysical and aesthetic site impacts. Included were fire remains, litter, fecal remains, evidence of insects, camp pests and soap or gray water. Biophysical included both vegetation and trails counts and estimates such as vegetation damages, presence of vegetation trampling, and estimates of vegetative cover on-site and on a comparative site nearby. Others included the number of trails in and arouno campsites, and on-site compaction and landing erosion. Information was gathered on each site for both future comparison and relocation purposes, and sites were then mapped and photographed.
A campsite condition index was then developed for both categories, biophysical and aesthetic. These were based on ten biophysical and ten aesthetic factors, with more weight applied to the biophysical category. These were then added together and an overall index was created. At this time, the index was categorized into five classifications of site damages.
Information gathered on each campsite facilitated comparisons among campsites in terms of site damages. Some comparisons included impacts and site composition, impacts and site size. There were few vegetation damages, however 88% of the sites exhibited trails within the camp area.
Aesthetic impacts and a decrease in aesthetic value is a major consideration along the San Juan, as 83% of the sites displayed some form of litte r or garbage remains, and over 80% of the campsites exhibited some sort of fire remains, in the form of ashes or charcoal.
11
Reproduced with permission of the copyright owner. Further reproduction prohibited without permission.

ACKNOWLEDGEMENTS
I would like to thank my major professor, Dr. Robert Ream, for his
assistance and personal support of this study. Dr. Ream helped edit the
manuscript, but provided much more than academic help. He provided
encouragement and support when I needed it, yet had the unique ability to
allow me enough space and solitude to do my own project.
This project was funded by the National Park Service, and I thank the
staff at Glen Canyon National Recreation Area, for all the day to day support.
I would like to extend special thanks to Rick Harris for supporting the
project. He provided shuttles for the river trips, flights to Page for
groceries, and in general what I needed to gather the data. Special thanks
also goes to ranger J.D. Swed and his wife Maureen at Hall's Crossing, who
provided much hospitality in the form of friendship, sleeping space, cold
beer and relaxation under their swamp cooler when it was i 10 degrees. I
would also like to thank John Ritenour, Chief of Resource Management, and
the NPS pilot. Tug Kangas, for sharing with me the incredible overflight of
the San Juan River and the beautiful area surrounding it.
There is nothing like the companionship of a friend on a river trip. I
would like to thank Eric Lonn, who committed his entire summer to helping
me with this project. Not only did he provide moral support, but stayed and
drew maps for me during a summer so hot, anyone of less character would
have deserted. I also have to thank him for helping me get the kinks out of
my computer. His patience is astounding.
iii
Reproduced with permission of the copyright owner. Further reproduction prohibited without permission.

TABLE OF CONTENTS
PageAbstract.......................................................................... iiAcknowledgements....................................................... iiiIntroduction...................................................................... 1The Study Area................................................................. 9Methods.......................................................................... 22Results.......................................................................... 43Discussion................................................ 66Conclusions...................................................................... 74Management Recommendations......................................... 76Literature Cited................................................................ 79
IV
Reproduced with permission of the copyright owner. Further reproduction prohibited without permission.

LIST OF FIGURES
Figure Page1. Total number of river users per year.................. a2. Flow in cubic feet per second, summer, 1990.... 123. River visitor use, Mexican Hat to Clay Hills....... 464. Percent vegetative cover loss............................ 525. Amount of l i t te r on riverside campsites............ 586. Aesthetic impacts index..................................... 607. Biophysical impacts index.................................. 618. Overall impact Index ratings.............................. 639, Campsite condition categories........................... 64
10, Campsite condition by site composition............. 671 ). Campsite condition by site size......................... 6812. Impact index by 14.25-m ile travel increments..., 7013. Impact index by 9.5-mile travel increments...... 71
Reproduced with permission of the copyright owner. Further reproduction prohibited without permission.

CHAPTER I
INTRODUCTION
Interest In recreational river floating has Increased substantltally
over the last two decades. This has created a number of problems for
management agencies Involved In river management. The reasons for
these problems are simple: limited resources and seemingly unlimited
numbers of would-be users.
The popularity of river running has increased at an Incredible rate
over the last century, and has now become a leading recreational
activity. For example, before 1966, a total of only 2,068 people had
floated the Colorado River through the Grand Canyon, while over 16,000
people floated It In the single year of 1972. The number of people that
floated the Snake River in Grand Teton National Park In 1975 was five
times greater than the number of people that floated it In 1966 (Huser
1977). Additionally, numerous articles and features on river recreation
have appeared in various magazines across the nation, and the Industry
has emerged with magazines of Its own. Canoe. Currents and River
Runner, to name a few, People's Incomes have Increased, as has the
amount of leisure time to be spent in the pursuit of recreational
activities. Technology has provided better and more affordable
equipment, and publications have increased the public's awareness of the
Reproduced with permission of the copyright owner. Further reproduction prohibited without permission.

2
sport, as well as providing instruction for the do-it-yourselfer. The
number of commercial operators has increased dramatically, to provide
experiences for the customer in search of an outdoor adventure.
An overabundance of recreationists in any area has a direct
influence on the resource, including the river and the areas surrounding
it. Professor, author and river runner Roderick Nash stated in 1977 that
there was a very real possibility that our rivers were in danger of being
loved to death, it was at this time, in the 1970's, that the agencies
administering our nation's rivers began to realize the importance of
saving our rivers. At this point, lim its on use were imposed on many
rivers, and today, there is much competition for use, and some permits
are extremely difficult to obtain, especially on the more popular rivers,
For example, one might wait for up to 7 years to obtain a non
commercial permit to float the Colorado River through the Grand Canyon,
Sociological studies of the effects of crowding on rivers have been
performed, (Roggenbuck and Schreyer 1977, Pfister and Frenkel 1974)
however it is also important to examine the biophysical impacts of
floaters on campsites. Many people float rivers to achieve a wilderness
like experience. A natural environment is a major factor, crucial in the
achievement of a satisfying experience. The adventure may be
undermined by the presence of dégradants left behind by other
recreationists, such as litte r and fire remains. Additionally, the
resource itself may be negatively affected by overuse; through the loss
Reproduced with permission of the copyright owner. Further reproduction prohibited without permission.

of vegetation and the Introduction of exotic species. A loss of habitat
and decrease In natural diversity may ultimately lead to a severe
disturbance of natural processes. Disturbances at campsites are
hereafter referred to as "impacts". The long-term Implications of
campsite Impacts are not fully understood, thus it Is necessary to
thoroughly analyze an area and establish a monitoring program that w ill
provide continuous Information over the long term,
Numerous campsite monitoring processes have been developed for
and have been used in wilderness areas, A sourcebook of assessment
systems has been written to provide information to resource managers
on the various techniques available (Cole, 1989). Additionally, there are
a few programs In existence that have been developed for campsites
within a riverine environment. However, the ones located have been
developed for mountain rivers, and are unable to deal with the unique
characteristics of rivers in an arid environment. For example, it Is
d ifficult to take a system created for a northern Idaho mountain river
and modify it for use on a southern Utah desert river.
There is a shortage of research performed in arid environments,
and few publications have been found in the search for research articles
that outline studies on campsite impacts on southwest desert rivers.
Specifically, a limited amount of research has been done on the San Juan
River. Calhoun (Harris, 1990) began a campsite Impact study on the San
Juan in 1985, but it was not completed, and existing records are
fragmentary. Although the amount of research In these areas is lim ited.
Reproduced with permission of the copyright owner. Further reproduction prohibited without permission.

two somewhat similar rivers have been studied; the Colorado River in
Grand Canyon National Park, and the Cataract Canyon stretch of the
Colorado in Canyonlands National Park, Utah, A campsite survey was
performed in Cataract Canyon (Kitchell and Connor in Cole, 1989), and
numerous studies have been performed in the Grand Canyon. Glen Canyon
Dam has removed the elements of a natural system from the Grand
Canyon river corridor, so it is not a perfect model for comparison.
Nonetheless, the sandy beach campsites are within a sim ilar
environment,
Man-induced changes affect the natural processes and physical
topography of a riverine environment, both in soils and vegetation.
Dolan, Howard and Gallenson (1974) compared pre-dam conditions in the
Grand Canyon with present conditions in terms of water flow and its
effect on beaches and high river terraces, They discovered that the
changes imposed on the natural river flows have resulted in a number of
alterations, At present, great fluctuations in dam discharges result in
beach erosion, and the sediment-free water prohibits beach replacement.
Additionally, the absence of natural and periodic high flooding disallows
the historically occurring "cleansing" of the river corridor. Many studies
have been done on forest soils; compaction and loss of the organic layer
have been well-documented (Cole and Schreiner 1981; Kuss, Graefe, and
Loomis 1977), However, apparently litt le has been done on sandy beach
sites, and beach erosion has been difficult to quantify.
Reproduced with permission of the copyright owner. Further reproduction prohibited without permission.

Recreationists negatively affect natural vegetation systems
through trampling and tree damage. LaPage (1967) determined that
vegetation trampling is a threat to site preservation, and that as a
result, species composition undergoes a change to more recreation-
tolerant species, while less resistant species tend to decline, A
decrease in natural species can encourage growth of and replacement
with exotic species. Root exposure has been linked to heavy use of
recreational areas (Settergren and Cole 1970; Ripley 1962). Frissell and
Duncan (1965) found that tree disease and injury results in occasional
tree death and a lack of tree reproduction in forested campgrounds.
Little research has been located for high-desert areas, however Cole
(1985) found that grassland vegetation is more resistant to trampling
loss than forest vegetation. Although river-specific research is lacking,
perhaps experience gained in other areas can be adapted to river
management (Craig 1977).
Aesthetic degradation can result in more than a loss of aesthetic
value. Cole (1982) concluded that in addition to an aesthetic problem,
non-contalned campfires may lead to eventual soil sterilization. Also,
elimination and burning of wood may remove soil microorganisms, which
in turn may inhibit revegetation. Human feces in campsites is another
aesthetic dégradant. While it is aesthetically displeasing, it may also be
considered a health hazard. Temple, Camper and Lucas (1982) determined
that bacteria can survive over a winter period at an appreciable level,
Reproduced with permission of the copyright owner. Further reproduction prohibited without permission.

and that depth of feces burial is not a factor in the dilution of harmful
pathogens.
Campsites are areas of concentrated activity in recreation areas.
Damages to campsites negatively alter vegetation, soil and aesthetic
attraction. It is necessary for the management agency to assess changes
in the condition of the resource. Systems should be implemented to
provide a database of information and to assess condition changes over
time.
The Bureau of Land Management (3LM) controls nver use along the
58-mile stretch of the San Juan River from the town of Mexican Hat,
Utah, to the take-out at Clay Hills Crossing, Utah. Although the BLM
administers this stretch, the majority of the land along the river is
owned by or administered by other agencies. The entire southern bank is
owned by the Navajo Tribe, and the lower 38 miles of the north bank is
part of Glen Canyon National Recreation Area., administered by the
National Park Service (NPS). The BLM and NPS work cooperatively to
manage this stretch of river.
At the time of this study, there was no river management plan for
this lower canyon of the San Juan, although the National Park Service and
the Bureau of Land Management plan to develop one cooperatively in the
near future. Allocation lim its and the rationing of user days have
been established however, and permits to float the river are issued
through the Bureau of Land Management in Monticello, Utah. The current
system w ill remain in effect, at least until the future river plan has
Reproduced with permission of the copyright owner. Further reproduction prohibited without permission.

7
been completed. In the interim, the National Park Service has sponsored
this research project, which describes the current state of riverside
campsites in the canyon.
Although use in the canyon has increased overall since 1983, the
years of 1986 and 1989 showed a substantial decrease in the number of
floaters (Fig. ^1). Therefore, it appears that use has leveled off, and if
this is true, we can assume that when this study is repeated, changes
w ill Indicate the general overall trend of campsite conditions at the
current levels of river use.
The topography of the the area is in a constant state of flux, as
river levels vary greatly throughout the season and from year to year,
thus causing new sand and s ilt to be brought in, and old beaches and
sandbars to be removed and redistributed. Thus, impacts on the
campsites along the San Juan are d ifficult to interpret, However, it is
important to collect information on the conditions of these campsites.
The firs t objective of this study was to collect information and
establish a database on existing conditions of riverside campsites. This
data w ill serve as a baseline for future comparisons. The second
objective was to develop a monitoring system that could be used to
collect information in the future. In order to compare future data with
the original data, to observe changes, trends or patterns in the condition
of the campsites, consistency in monitoring w ill be necessary.
Reproduced with permission of the copyright owner. Further reproduction prohibited without permission.

8
o
- ?
î
to
I
93■ t- '3i_rQ)>2cCC733c«0œiS<oCD
l_CDd<00>(ft3
CDaE3C
o■*-<oh~
OÏ
o
Reproduced with permission of the copyright owner. Further reproduction prohibited without permission.

CHAPTER
THE STUDY AREA
Area PhvsiograDhv
The San Juan River begins in Colorado, and runs southwest into
northern New Mexico. It then turns north and west into and across
southeastern Utah. It's source is near Wolf Creek Pass in the San Juan
Mountains of Colorado, and it's mouth is the Colorado River at Lake
Powell in southeast Utah. It's total length Is 366 miles, and it has an
approximate drainage area of 25,800 square miles. Beginning at over
12,000 feet in elevation, it is less than half that by the time it reaches
the Colorado/New Mexico border. (Rennicke 1985.)
The San Juan begins as a mountain river, and flows through the San
Juan National Forest in Colorado. Along the way, it gathers the West
Fork, the East Fork, and Turkey Creek. The Navajo River flows into the
San Juan near the Navajo Reservoir on the Colorado/New Mexico border.
This Navajo Reservation Project near Aztec, New Mexico, s tills and
reroutes the waters of the San Juan for irrigation of the San Juan Basin.
This affects the study area in that the extreme high water floods which
occurred previous to the dam no longer exist. The Piedra and Los Pinos
rivers join the San Juan at the Navajo Reservoir. Below this man-made
Reproduced with permission of the copyright owner. Further reproduction prohibited without permission.

10
lake, the Animas River and the Mancos River join the San Juan as it once
again begins its journey to the west.
As the river runs through southern Utah, its character changes
from that of a mountain river to a desert river, cutting through and
creating deep sandstone and limestone canyons. Originally, the San Juan
joined the Colorado River and flowed to the Gulf of California and the
Pacific Ocean. Now, however, it meets an untimely end, dying at the
backwash waters of Lake Powell in Glen Canyon National Recreation
Area. The 58-m11e stretch of river, upstream from Lake Powell, from
Mexican Hat, Utah to Clay Hills Crossing, Utah, has been chosen for this
study. This reach Is a desert river In its entirety.
In spite of the Navajo Dam upstream, there is s till seasonal
variation in the river's flow. Spring runoff, especially from the Animas
and Mancos rivers. Increases the river's flows substantially during May
and June. Thunderstorms throughout the summer months of July and
August periodically flood Chlnle Wash, near the town of Mexican Hat, as
well as many of the other numerous side canyon tributaries along the
river canyon's length. Some of these within the study area are Johns
Canyon, SHckhorn Gulch, Grand Gulch and Oljeto Creek. Although the
average gradient of the San Juan is only 7 feet per mile, these tributary
canyons generally have much steeper gradients; for example, SHckhorn
Gulch has a gradient of 200 feet per mile. (Rennicke 1985) These side
canyons receive most of their runoff water from the rainy season in
spring, and the torrential thundershowers during the summer months.
Reproduced with permission of the copyright owner. Further reproduction prohibited without permission.
1 ]
These creeks drain large areas and contribute much water to the San
Juan River,
River flows, measured as cubic-feet-per-second (cfs) show an
incredible variation In the San Juan (Fig, ^2). Measurements on this river
have ranged from 40 cfs to 24,800 cfs at Mexican Hat during a single
season, before the Navajo Dam. (Rennicke 1985, A Itch Ison 1983,) Since
the Navajo Dam was built, typical flows on the San Juan vary from lows
of about 200 cfs to highs of well below 10,000 cfs.
Area Geology
The Colorado Plateau of the four corners area is an example of
" Û73SS denudation o f a landscape dominated by essentially fla t-ly in g
strata! (Baars andMolenaar1971) The canyons have been created by the
erosional powers of the Green, Colorado and San Juan Rivers, which have
cut deep channels Into the sedimentary layers.
The variety of shapes and sizes of the features of the area
(Monument Valley, Goblin Valley, arches and windows in Arches and
Canyonlands National Parks) has been determined by two major factors.
These are the relative hardness of the rock strata, or rather, its
resistance to erosive forces, such as running water, and the precise
location of the existing structural features underlying the area, such as
joints, faults and folds. The shapes of slopes is determined by the type
of rock in the strata, while major features such as pinnacles and buttes
Reproduced with permission of the copyright owner. Further reproduction prohibited without permission.

u. r<N
o D CO U Û L U i Û C (OuiOOZO
Reproduced with permission of the copyright owner. Further reproduction prohibited without permission.

13
are controlled by the pattern of the basic structure of joints. (Baars and
Molenaar 1971)
The canyons of the San Juan River are carved across the Monument
upwarp, which is defined as "that region o f geoJogicai u p lift that is
surrounded by exposures o f the Navajo Sandstone o f Jurassic agë. (Four
Corners Geological Society 1973). The canyons have cut down into the
heart of the Monument upwarp, exposing the Hermosa Group of
Pennsylvanian age. This group is characterized by limestones, and is
interspersed with layers and slopes of shales and sandstones. (Four
Corners Geological Society 1973),
The canyons of the San Juan River are composed of sedimentary
rock, exposed to view over time. Originally, these sediments were
deposited into a shallow sea some 290-310 million years ago, (Baars
and Stevenson 1986) The strata consist of interbedded sandstone,
limestone and shale, deposited alternately through time, into this then-
marine environment. Sandstone is composed of sand grains of quartz
that have been cemented into hard rock with some mineral. In this area,
calcite is the most common, however, iron oxide and silica appear as
well. The sandstones along the San Juan River run from shades of light
tan and gray to white, with coloration of reds and browns, caused from
impurities in the rock. A phenomenon known as "desert varnish" causes
colored streaks to run over the rocks in shades of black and red. These
are caused by the oxidation of manganese and iron in the rock. (Baars and
Stevenson 1986)
Reproduced with permission of the copyright owner. Further reproduction prohibited without permission.

Limestone particles are composed of lime or calcite. These
particles are almost entirely made up of organisms that lived in this
shallow marine environment, The shells may be broken down into
particles the size of mud or sand grains, then the accumulations are
cemented together into hardened rock. Thus, since limestones are made
up of fossil material, there are many fossils in these layers.
Shales are the accumulation and cementation of clay, or very fine
quartz-muds. Formed in marine waters, these muds settle into a moist
environment, then are squeezed into rock by compaction or force of other
sediments piled on top. Shales are usually soft rock, and erode easily,
thus they are called "slope formers", and form slopes between the
limestones and sandstone cliffs. Because they are formed in extremely
wet environments, many shales also contain fossils. As the rock around
them erodes away, many of these fossils are exposed at the surface,
making this area of great interest to geologists.
Climate
The San Juan country is an arid high desert country of extreme
temperatures, hot in summer and cold in winter. Elevations vary
throughout the area, averaging about 6000-7000' on Cedar Mesa above the
river to the north, 5000' on the plateau, and about 3500-4000' along the
river. The landscape appears dry and inhospitable. Receiving only about
6 inches of rainfall per year along the river, summer maximum
temperatures remain around and rise well above the 100 degrees
Reproduced with permission of the copyright owner. Further reproduction prohibited without permission.

15
Farenheit mark. Daily temperatures vary widely. Maximum and minimum
daily temperatures in the summer range from over 110 degrees Farenheit
to less than 60 degrees Farenheit. Winter temperatures can be as
extreme, dropping to -20 degrees Farenheit, when it is dry and cold,
(Altchlson 1983)
Precipitation occurs mostly during spring, throughout the months
of April and May. However, during July and August, desert thunderstorms
create gigantic and sometimes devastating flash floods in the canyons,
alternating with periods of drought throughout the rest of the year.
Within this desert environment, the river is the main key to survival for
the species of flora and fauna found in the canyon country.
Flora and Fauna
There are four main habitats in the San Juan River area, the river
community, including the river itself, the riparian community, the river
terrace or talus community, and finally, the c liff environment. Only the
river community, riparian community and terrace communities w ill be
touched upon here, due to the nature of this study, which concerns only
these areas,
In the silty waters of the river community, about 17 species of
fish are believed to exist currently, but only 6 of these are considered
native, (Aitchison 1983). The native fish are disappearing due to man's
interference with the natural system, through damming, diversion, and
pollution of the river's waters. Common ducks and other waterfowl are
Reproduced with permission of the copyright owner. Further reproduction prohibited without permission.

i6
sometimes seen on the river, and beaver are the most common mammal
seen in the river and along the riparian zone.
Along the riparian zone grows a lush growth of vegetation,
discordant to the heat-baked communities further back from the water.
Typically, this community is composed of native willow and the exotic
shrub, tamarisk. Although originally from the Mediterranean area,
tamarisk is an Incredibly prolific shrub, and has succeeded In virtually
taking over river beaches In the canyons of the Southwest. Canyons
above the study area are wider, and there are wooded areas of Fremont
cottonwood, box elder and the naturalized exotic Russian olive. However,
canyons of the study area support very few box elders, virtually no
Russian olives, and cottonwoods are seen only near the creeks of the
major side canyons, such as SHckhorn Gulch and Grand Gulch. The great
blue heron is commonly seen in the riparian zone, and various types of
amphibians such as frogs and toads are heard along the river down
through the canyons.
Terraced areas along the San Juan River are extremely dry, thus
there is much competition for moisture. Plants in this region must rely
on rainfall alone, and have adapted to these harsh conditions, Common
shrubs found in this community in the study area are Indian ricegrass,
four-wing saltbush, Ephedra (Mormon tea), buffaloberry, sagebrush,
rabbitbrush, scrub oak and yucca. Some cacti are found in the lower
canyon area as well. In these areas, various types of reptiles are at
home; for example, desert snakes and a variety of lizards.
Reproduced with permission of the copyright owner. Further reproduction prohibited without permission.

17
The level of Lake Powell has dropped over 50 feet during the past
few years, leaving dry silt-beds along the river banks in the lower
canyons. These s ilt banks have now filled in with tamarisk and russian
thistle, or tumbleweed, both exotic species that have been introduced to
the area, thus creating an unnatural variation on the riparian community,
San Juan River Area History
The firs t "scientific" expedition was the fourth party to run the
river, the 1921 Trimble Expedition, A geologist, Hugh D, Miser, was on
the trip, and the group spent months exploring, surveying and studying
the canyon. The geological survey report by Miser, published in 1924,
includes information on the geology and climate of the San Juan River
canyons, and is s till considered mostly accurate today. (Four Corners
Geological Society 1973)
Allegedly the firs t person to traverse the canyon, E,L. Goodndge
was an oil prospector and made the run in the spring of 1882, losing one
boat to the river. (Four Corners Geological Society 1973) Another
historic version reports that Goodridge made the run earlier, in the year
1879-80, and that Bert Loper of Grand Canyon fame made the trip and
explored the San Juan during the years of 1893-94, (Four Corners
Geological Society 1973). Additionally, Goodridge drilled the oil well at
SHckhorn Gulch, which was abandoned some years prior to 1921,
However, further attempts were made to obtain oil from the SHckhorn
area during the 1940's and 50's, (Swed 1990), The old road cribbing,
Reproduced with permission of the copyright owner. Further reproduction prohibited without permission.

18
parts of the oil wells and some of the equipment remain visible today, in
and around the Slickhorn campsites.
The second run through the San Juan canyons was by Walter E.
Mendenhall in 1894, in search of gold. Mendenhall allegedly made the run
in a hand-made boat the firs t trip, then ran the canyon again in 1895
with six other people. Mendenhall lived in the canyon while prospecting
for gold, and the remains of his cabin and storehouse are s till in
existence today, a popular site to visit while on the river. Another
historic report states that Mendenhall made three trips, not two, during
the years of 1894-95. (Four Corners Geological Society 1973)
Gold prospecting began in the San Juan canyons in about 1892. At
this time, wild tales of gold spread about, bringing around 1200 men into
the canyon. They left empty-handed, but attempts at prospecting
continued until about 1915.
The Honaker Trail was built about 1904, for the purpose of
bringing supplies down into the canyon to the gold prospectors. However,
the firs t packhorse to attempt the descent fell off a c liff and died, thus
proving the precipitous trail too d ifficu lt for pack animals. The Honaker
Trail was then abandoned, except as a hiking trail, and is s till usable to
hikers today.
March 1934, began the era of running the San Juan river for
recreation, when Norman and Doris Nevills, and Jack and Nana Frost ran
the river from Mexican Hat to Copper Canyon. The Nevills and Frosts
then began commercial river-running in the late I930's, and continued
Reproduced with permission of the copyright owner. Further reproduction prohibited without permission.

19
through the I950’s, (Baars and Molenaar 1971, Four Corners Geological
Society 1973) They carried tourists and geologists alike through the
canyons. This was the introduction to the now-popular activity of river-
running for fun on the San Juan.
The number of users on the Mexican Hat to Clay Hills stretch has
increased substantially over the past few years. The number of users on
this stretch in 1983 was 1326, and had increased to 2139 users in 1989.
The main attractions of the San Juan area are the high desert
scenery and deep sandstone canyons, The river does include a few small
rapids that require some basic boating skills, especially during the
spring runoff or "highwater” season, which is during the months of April,
May and early June.
Present-dav Use
This 58-mile reach of river is administered by three government
agencies. Along the north bank for the firs t 18,5 miles below Mexican
Hat, Utah, the land is administered by the Department of the Interior,
Bureau of Land Management, out of Monticello, Utah. The entire length of
the river on the south side is owned by the Navajo Tribe. The remaining
land of 38.5 miles on the north bank is administered by the Department
of the interior, National Park Service, Glen Canyon National Recreation
Area, headquartered in Page, Arizona.
The Bureau of Land Management in Monticello, Utah administers
this stretch of the San Juan River. Currently, there is a permit system in
Reproduced with permission of the copyright owner. Further reproduction prohibited without permission.

20
existence for floating the canyon. Permits are Issued through advance
reservation only.
The summer season is May 1 through September 30, and there are
four ways to obtain a launch reservation:
1) through a pre-season drawing
2) through a post-drawing telephone reservation
3) through the waiting list
4) through a cancellation
The current established limits to users are as follows. The
number of people launching per day may total up to 50, or the number of
trips launching per day may be up to 5. When either lim it has been
reached (whichever one is first), no more permits or users are allowed
for any given day, except in the case of cancellations. When
cancellations occur, permits may be given to users on the waiting list.
There is a user fee established for multi-day users on the San
Juan. For the reach from Mexican Hat to Clay Hills Crossing, a fee of
$5.25 is assessed per person, which is paid to the Bureau of Land
Management upon receipt of a river use permit.
There are specific requirements for multi-day users on the San
Juan River. In addition to the Utah state regulations requiring spare
oars or paddles, firs t aid kits and personal floatation devices, all solid
human body waste must now be carried out of the canyon, as there are no
portable or pit toilets along the river, The exception to this rule is for
unsupported kayak groups of less than 5 boats.
Reproduced with permission of the copyright owner. Further reproduction prohibited without permission.

21
This is an extremely isolated area, and there is no vehicular
access along this stretch of river. The put-in is at the Bureau of Land
Management ramp above the town of Mexican Hat, Utah, and the take-out
is at Clay Hills Crossing, Utah, 58 miles downstream. Once in the
canyon, the only way in or out is by primitive trail through a few
si decanyons. Honaker Trail, Grand Gulch, and Slickhorn Canyons are the
major ways into the canyon, and these accesses are achieved only by a
distant, 4-wheel drive road across Cedar Mesa, then a steep climb by
foot down into the canyon; or as in the case of Grand Gulch, about a 50-
mile hike from the road to the river.
Reproduced with permission of the copyright owner. Further reproduction prohibited without permission.

CHAPTER
METHODS
Process Selected for the Study
The purpose of this study was twofold. The firs t objective was to
establish a baseline of informational data for the river corridor and
second, to develop a system for monitoring the condition of campsites in
the future, Quantitative data was desired, in order to view the river
corridor in a thorough statistical manner. However, in the interest of
cost-effectiveness, the creation of a practical monitoring system
necessitated an average of 30 minutes or less per site, Additionally,
descriptive information on the river corridor and its campsites was a
desirable quality, for viewing by off-site managers. This, in
conjunction with the quantitative information required and the desired
data collection time, put some constraints on the process, and there are
trade-offs in the attempt to achieve both ends, Thus, a rapid estimation
process with some quantitative counts was deemed a desirable system
for the study.
A search was conducted for a process usable for this study, both in
terms of the above requirements of a rapid estimation procedure and in
terms of acquiring the amount and type of information desired. The
Wilderness Campsite Monitoring Methods: A Sourcebook (Cole. 1989) is
22
Reproduced with permission of the copyright owner. Further reproduction prohibited without permission.

23
the most up-to-date handbook of campsite monitoring systems, and was
examined for a process usable for this study. However, most of the
described processes are area-specific, and cater to other types of
environments, and a process with all the desired characteristics was
unavailable.
Four river managers were contacted and questioned as to the types
of monitoring systems in place in their areas. Two situations occurred;
either there was no monitoring system in place at the present time, or
the existing system was created for a specific area, and was
inapplicable to this area. Thus, the following procedure was developed
for the San Juan River and its particular desert-environment
characteristics.
impact Factors and Variables Selected
Ideally, a system w ill provide two things: quantitative and
descriptive information to managers not on-site, and quick examination
of sites while in the field. The field process in this study included both
categorical questions to be answered yes or no, and numerical counts, In
the final analysis, this provided a mixture of both frequencies and
contingency tables, which allowed for an overview of descriptive
information on riverside conditions and existing campsite impact
conditions. Some counted variables were selected in the interest of
accuracy and statistical analyses, and some estimates were made, based
Reproduced with permission of the copyright owner. Further reproduction prohibited without permission.

24
on the desire to acquire as much information as possible while spending
litt le time per site.
In an attempt to present a complete descriptive view of the river
corridor off-site, factors were selected in two areas: impacts and
descriptive site information.
IMPACTS
Impacts have been divided into two types; biophysical and
aesthetic. Biophysical impacts within campsites have been further
subdivided into vegetation variables and erosion/trails variables.
Although there is little vegetation along the San Juan, the National Park
Service is curious to see if users are damaging the existing flora,
Floaters and backpackers are not required to carry stoves, therefore
there is the possibility of tree damage due to firewood demand.
Consequently, vegetation damage and trail observations were made and
documented in two ways; in counts and in assignment to categories.
BiapbyaicaiVegetation
Vegetation impact was recorded in a number of different ways.
Two variables were the presence or absence of:
1 ) vegetation damage at landing
2) trampled vegetation on-site.
Reproduced with permission of the copyright owner. Further reproduction prohibited without permission.

25
Other types of vegetation impact consisted of numerical counts.
Counts were made of the following:
1 ) the number of tree stumps or dead trees
2) the number of trees with scars or broken limbs
3) the number of trees with exposed roots.
Finally, estimates of vegetation cover on-site and at a
comparable undamaged site were used to assess:
1 ) the current amount of on-site vegetation, which was recorded
to the closest 5%
2) the amount of vegetation lost as a result of recreational use
This latter parameter was obtained by subtracting on-site cover
from the cover on the undisturbed sites,
Estimates are subject to inter-observer variation. This reduces
the precision of these estimates. We tested the precision of cover
estimates by having two observers estimate cover independently on 10
sites. On 9 of the 10 sites, estimates were within 5-10% of each other,
suggesting a moderately high level of precision.
Additionally, frequencies were calculated on the categorical
variables, and some summary statistics were calculated for the
numerical factors, including the mean, median and range.
Trails
Trail damages were also observed and recorded in different ways.
Two variables were the presence or absence of:
1) landing erosion
Reproduced with permission of the copyright owner. Further reproduction prohibited without permission.

26
2) compaction present in the campsite core.
No measurements of compaction were taken. The estimate was
easy to judge, as campsites were soft or hardpacked sand. Any
compaction was obvious to the observer.
Other types of trail damages consisted of numerical counts.
Counts were made of the following:
1 ) the number of trails from landing to site
2) the number of trails within camp
3) the number of trails to features of interest nearby.
Aesthetic
Aesthetic factors are those variables that, while perhaps not
physically damaging to the resource, are visually displeasing, and
detract from the aesthetic quality of a campsite. When calculated and
developed into the aesthetic index, this information w ill provide
managers a view of impermanent impacts that may be rectified by
management or user actions.
This information pinpoints specific sites that are prone to
aesthetic problems, such as excessive fire remains and litter. At this
point, information on site use may be brought into play to determine
possible causes. For example, if the majority of fire remains are only at
sites accessible to backpackers, management actions might be
concentrated towards those users. These variables were recorded in
various ways. Four variables were the presence or absence of:
Reproduced with permission of the copyright owner. Further reproduction prohibited without permission.

27
1 ) charcoal and ashes on-s1te
2) soap or grey water
3) camp pests
4) ants and/or flies
Aesthetic factors included fire remains and fecal matter, Counts
were made of the following;
1 ) the number of campfire pits
2) the number of campfire rock rings
3) the number of rocks charred or scarred per site.
4) piles of human feces
5) piles of toilet paper.
Although human waste is not necessarily biophysically damaging,
its presence at a campsite is distasteful. Also, although litte r might
seem only aesthetically objectional, fecal matter presents potential
health dangers through fecal bacteria. (Temple, Camper & Lucas, 1982)
The aesthetic index ends with a count of:
1) the number of pieces of litte r (foil, cans, paper, etc,) per site,
DFSCRIPTIVF SITE INFORMATION
Although not an indicator of damage, information factors were
selected for two reasons. First, these provide the off-site manager
descriptive information on the river corridor itself. Second, these
information variables may be cross-tabulated with impact variables to
Reproduced with permission of the copyright owner. Further reproduction prohibited without permission.

28
determine if there is any obvious correlation, trend or pattern to the
impacts along the river.
As with the aesthetic and biophysical factors, the
descriptive variables were both categorical and numerical, and were
subdivided into categories. The more general information was gathered
by categories for ease in the field, while counts that varied largely from
site to site were individually tabulated. Descriptive site information
was divided into two categories: general area information and specific
site information. Site numbers were given, and river miles were
calculated from the river map, for relocation purposes.
Area Information
General area information included:
I ) site number
2) rivermile
3) bankside (right or left).
River Information
information was gathered on river conditions at each site. For
example, river information placed into categories was:
1) river conditions (rapids, flatwater, eddy, riffles). This w ill aid
in both future relocation and changes in river topography, helping
managers keep up-to-date on their resource.
Estimates were made on:
2) current flow in cfs, Official flows were obtained and
documented at the start of each trip, in order to estimate flows at each
Reproduced with permission of the copyright owner. Further reproduction prohibited without permission.

29
Site. This information is important in the interest of future monitoring.
Some campsites may be flooded and thus "cleansed" at periodic intervals,
or may be underwater at some levels and unusable, and thus subject to
less use and less impact.
Site_Landirig information
In order to map more accurately, relocate sites easier, and view
changes over time, information was gathered at each site's landing area.
Accessibility from the river was placed into categories of;
1 ) easy, moderately easy, d ifficult and very difficult,
Measurements were taken of:
1) landing length
2) distance from landing to site core
Estimates were made of:
1 ) vertical climb to site and
2) slope from landing to site core
B..l.o.âd..aû Z..Qj].e.
Although the National Park Service desired information on the
types of vegetation along the river corridor, specific studies were
beyond the range of this project. Additionally, there is litt le diversity in
the riparian vegetation along this stretch of river, and there are
approximately three to four species that dominate in the river corridor.
Therefore, a basic list of the principal species in the riparian zone was
compiled at each site.
Campsite Information
Reproduced with permission of the copyright owner. Further reproduction prohibited without permission.

30
Unlike the riparian vegetation, which is similar throughout the
river corridor, on-site vegetation varied between sites, so a list of these
dominant species was also compiled.
Additionally, other site-specific information was gathered. Site
use was gathered into categories of
I ) floaters only or floaters and backpackers
Site composition was placed into categories by type:
1 ) beach, rock ledge, or terrace (sand or soil bank)
Site size was documented by category, and an estimate of site
capacity was also taken. Size categories were:
1 ) small, medium, large, and extra-large sites
Site size was defined by the number of two-man tent spaces
available. For example, a site might accomodate 5 tents, and would be
placed into the "large" size category, which ranges from 5 to 9 tents.
This provides an idea as to the physical size of the site, but as this size
site can accomodate anywhere from i to 18 people, it does not give a
clear idea of actual capacity. Thus, the estimate of capacity was added
to provide more accurate information and consisted of a numerical count.
A count was also entered for:
1) number of satellite bedrooms in a site, if any.
This was to offer further information as to the "spread" of sites
with regards to trails and to help map the site.
A measurement was taken on
1) the areal size of the site core, if any.
Reproduced with permission of the copyright owner. Further reproduction prohibited without permission.

This was taken with a tape measure. The site core was sometimes
d ifficult to establish. River parties use different areas for their
activities and there is no established center site with picnic tables and
firegrates. Additionally, the choice of the central area sometimes
changes with the water level. For example, in low-water levels, beaches
are exposed and used for kitchen activities, while the area higher up on
the terrace might or might not be used for sleeping purposes. At high
water levels, some beaches w ill be underwater so the terrace w ill be
used for kitchen activities and sleeping. However, there are sites with
obvious "core" areas, some with logs for benches and perhaps with
leftover charcoal and/or ashes from firepans. These areas may also be
used for other purposes, but the ones selected to be counted were
obvious centers of concentrated use. Defined by rock or vegetation
boundaries, these areas generally exhibited the widest and most obvious
trails from the landing site, and were among the ones with soil
compaction present. Additionally, the core sites tended to be the areas
one gravitated to firs t upon leaving the boat in search of a "kitchen" spot.
The majority of these were permanent areas up on the terrace, were
selected as "core" areas, and were marked on the site map. However,
conditions are ever-changing along the river, and users have different
preferences as to the placement of their central gathering areas.
Additionally, this is subject to change on beach sites, which makes
precision more difficult. At the sites where there was any doubt as to
Reproduced with permission of the copyright owner. Further reproduction prohibited without permission.

32
the core area, this part was left blank, and the site was considered to be
without a central core site.
Campsite Condition Index
Two campsite condition indices were developed from the
information collected. One was for biophysical impacts, and the other
for aesthetic impacts. These were then added together to obtain an
overall rating. This index rating does not indicate deterioration over
time, but only the present variation among sites. It offers a baseline,
and if monitored steadily and consistently over time, w ill provide a
measure of change throughout the years,
In the formulation of these indices, all categorical and numerical
impact variables played a part. A rating scale was developed and
weights were applied to each answer In order to create both the
biophysical and aesthetic indices, which may be viewed individually or
together as the overall index.
The decrease in vegetative cover percentage was developed
separately and was not calculated into either index. Some of the older
campsites that were discarded from the original lis t showed indications
of revegetation, The estimates of this variable w ill provide information
on the degradation and recovery rates of vegetative cover. This should
be monitored and calculated separately over time.
Biophysical impacts are more of a concern to the National Park
Service than aesthetic impacts, due to their permanency and ecological
Reproduced with permission of the copyright owner. Further reproduction prohibited without permission.

33
considerations, so more weight was applied to the vegetation and trails
variables than the aesthetic variables.
For example, in this study, there were 20 total variables in the
beginning. There were 10 Aesthetic and 10 Biophysical variables. Within
these categories, there were 6 numerical and 4 categorical in each. The
following are the categories selected for the San Juan River study:
AESTHETIC BIOPHYSICAL
NUMERICAL 1) litte r 1 ) trees dead2) fire pits 2) trees scarred3) fire rings 3) exposed roots4) rocks scarred 4) trails/landing5) fecal matter piles 5) trails/camp6) toilet paper 6) trails/features
CATEGORICAL 1) ants, flies 1 ) landing erosion2) charcoal, ashes 2) riparian vegetation3) soap, gray water 3) compaction4) camp pests 4 )vegetation
Reproduced with permission of the copyright owner. Further reproduction prohibited without permission.

34
There is subjectivity in the creation of any scale, when numbers
and weights are applied to non-quantifiable objects and occurrences in
the natural world. The following scale is no exception, however, if used
consistently, w ill provide some idea as to changes occurring over time.
The rating scale and weights applied are as follows;
AESTHETIC IMPACTS INDEX
Categorical variables; No = 0
Yes = 1
Numerical variables; 0 = 0
1 -3 = 1
4 -6 = 2
7-9 = 3
>10 = 4
BIOPHYSICAL IMPACTS INDEX
Categorical variables; No = 0
Yes = 2
Numerical variables: 0 = 0
1 - 2 = 1
3 -4 = 2
5 -6 = 3
7-8 = 4
9-10= 5
> 1 0 = 6
Reproduced with permission of the copyright owner. Further reproduction prohibited without permission.

35
To see how the results were obtained, here's an example. Let's say
we have four variables:
Variable A: aesthetic (categorical)
Variable B: aesthetic (numerical)
Variable C: biophysical (categorical)
Variable D: biophysical (numerical).
Let's say that both numerical variables are a "6" (in other words, we
counted 6 of whatever it was were we counting in the field), and that
both categorical variables are answered with a "yes". Here's how to add
them up:
Variable A = 1 (A categorical "yes" under the aesthetic scale = 1 )
Variable 8 = 2
Variable C = 2
Variable D = 3
8
Since the weights are already added in (biophysical weighing more
heavily for a " yes" than an aesthetic "yes", we now just add them
together to get the final index, therefore, the index is an "8".
Applying weights, and therefore a judgement, to any aspect of the
natural world is surely subjective, and obviously has its limitations. For
example, this "scale" cannot be applied to another area or across the
board to other studies. There is no "grand scale". However, if used
consistently within this particular group of campsites, it w ill provide a
measure of deterioration over time. Again, the numbers don’t "mean"
Reproduced with permission of the copyright owner. Further reproduction prohibited without permission.

35
anything, (i.e., that campsite ^ 14 is rated as a ’7" on the index) but act
simply as a comparison from year to year to see how campsite
deterioration is changing in terms of these given variables with their
applied values.
For this study, a numerical total for each campsite was obtained
for both the biophysical and aesthetic indices. These were then added
together to get the overall index rating for each campsite.
Numerical counts are more accurate and thus more important than
the categorical variables. Discrete variables can be placed into ordinal
classes, but have the advantage of being broken down later and viewed
individually, to obtain specific information on each site. Qualitative
variables are non-numerical and w ill not provide as accurate a measure
as the quantitative counts.
The overall index ratings ranged from 0 to 30, and were then re
coded into five categories to determine the condition of campsites.
These categories are as follows;
A) 0 impact rating, no damages
B) 1-10 impact rating, least damaged
C) 11 -20 impact rating, moderately damaged
D) 21-30 impact rating, more severely damaged
E) > 30 impact rating, most severely damaged
This may also be calculated for the separate indices, biophysical
and aesthetic, however, It must be taken into account that the spreads
w ill vary between the indices. When calculating an individual index, the
Reproduced with permission of the copyright owner. Further reproduction prohibited without permission.

37
spread must be divided into five categories individually for each index.
In the calculation of the overall index, however, the impact numbers
must be added together firs t, then placed into the five categories.
Campsite Selection and Inventorv
One of the objectives of this study was to establish a baseline of
information on the condition of campsites on the lower San Juan, All
campsites were selected for examination.
There is no BLM or Park Service campsite inventory, Baars and
Stephenson marked 26 campsites (25 medium-sized and 1 large) on their
river guide. This guide was used as a starting point. A pilot trip was
then run through the canyon, and all the Baars sites were examined to
determine their condition, in terms of present usability. "Usability " was
defined by areas that were accessible by boat and that held enough clear
space to sleep and perform kitchen duties. Areas that were wildly
overgrown with willows or tamarisks were not considered usable as
campsites unless there were existing and/or obvious tra ils to the site.
A fter examination of the Baars sites, it was determined that 7 of
these campsites should be removed from the inventory, Two sites (miles
31,5 and 448), were no longer in existence, possibly due to side-canyon
flash floods or high river floods. One site was only possibly usable in
extrem ely high water, (mile 48.4), and appeared as though there was a
very small open area up against the c liff. This area was too far from the
river to be a feasible camping site, and appeared as though it had not
Reproduced with permission of the copyright owner. Further reproduction prohibited without permission.

38
been used for a very long time. Three sites were cancelled due to
overgrowth of vegetation. (Miles 37.0, 49.5, and 65.9) After a thorough
examination, vestiges of old trails were found, but the sites were not
usable due to vegetation regeneration. The remaining site was in a side
canyon, and was eliminated due to its inaccessibility by boat. Upon the
drop of Lake Powell, (the level has dropped from 3700' to less than
3650') the mouth of the canyon was left with a 2' deep layer of sediment,
effectively blocking access to this inner-canyon campsite. This site
might possibly be accessible again, If Lake Powell ever rises above
3700'.
At this point, the inventory totaled 19 sites. Another pilot trip
was run, to add sites that were I) obvious campsites, new since the river
guide, 2) "micro-camps", usable for 1 or 2 people, and 3) split sites,
large sites that have been divided into two or more camps since the river
guide was published. Twenty-two more sites were added for a new total
inventory of forty-one (41) sites. All 41 sites were inventoried, mapped
and photographed for this report.
Data Collection Methods
All trips on the river were run in an inflatable kayak, so all
campsites were accessible and all forty-one were examined.
As previously stated, two pilot trips were run prior to data
collection. On these two trips, the overall area and individual campsites
Reproduced with permission of the copyright owner. Further reproduction prohibited without permission.

39
were examined for possible factors to be observed In the study.
Additionally, the total inventory was completed on these trips.
Following the firs t trip, a preliminary field form was developed to
gather information on-site. On the second trip, an assistant came along
to assist in the gathering of data.
At this point, the preliminary data sheet was field-tested for
convenience, some sites were mapped and photographed, and the entire
process was timed. Both individuals completed data sheets on each site,
to examine precision and consistency of answers. Then they were
compared and discussed on-site, to discover and correct any
complications. This was done to determine where the discrepancies
were, either In the observations themselves, or In the data sheets. In
some cases, questions on the field form were unclear and produced
inconsistent ratings.
On this second trip, vegetative cover percentages were also
estimated and compared for precision. It was determined that even with
two people estimating percentages, results were close, within
approximately 10-15%.
Upon return from the second pilot trip, the data sheet was
reviewed and changes were made. Some variables were eliminated and
some re-worded for clarification and better comprehension. The entire
field form was then rearranged for ease of information collection on
site.
Reproduced with permission of the copyright owner. Further reproduction prohibited without permission.

40
At this point, data collection began. Three trips were scheduled,
of six-day length each, All data-collection trips consisted of a party of
two, myself and an assistant, Twenty-four sites were examined during
the firs t collection trip.
Site examination consisted of the following: Upon landing, the
entire site would be covered on foot, before commiting anything to paper.
It was necessary to get an idea of the layout of the site, Its size and
spread, and the type of terrain and vegetation on-site. At this point, one
person would obtain graph paper and begin the map drawing. The other
individual completed the datasheet. The drawing of the site map was the
more time-consuming of the two, thus the individual completing the
datasheet would then photograph the site. The rate of four to five sites
per day was comfortable for two kayakers. This is attributed partly to
the size of the party (two people) and to the lack of many detailed camp
chores and duties. The final seventeen sites were examined on the
second six-day trip. At this time, the summer thunderstorms were in
full swing, and the river's flow increased considerably. As a result, the
trip moved speedily along, and the collection of data was completed on
this second run.
Photographs
A 35mm camera was used to photodocument the main aspects of
each campsite. Each shot taken at a campsite was marked on the
Reproduced with permission of the copyright owner. Further reproduction prohibited without permission.

41
datasheet for that site, Photos taken were marked on the site map with a
triangular-shaped arrow, indicating the direction of the shot.
Photographing each site was difficult and produced some problem s.
The National Park Service did not want any permanent photopoints
established. Due to the fluctuating nature of the river, this would be
infeasible as well. As a result, the landing sites were photographed, to
view the sizes and types of vegetation. Core sites, if any, were
photographed, and major satellite bedroom sites as well as indications
of m ajor damage to vegetation were photographed. Areas with severe
erosion were photographed and documented as well,
A 50mm lens was used for close-ups of small areas, such as the
smaller satellite sites and core areas. In most sites, additional photos
were shot w ith a wide-angle 28mm lens, to incorporate large areas.
Where possible, a c liff above the campsite was climbed so an
overall view of the site and trails could be obtained from above. At
these locations, a wide-angle lens was used.
Upon return from the final data collection trip, the National Park
Service provided an overflight of the San Juan corridor to obtain aerial
photographs, and in September, a solo four-day trip was run to reshoot
some photographs.
Maos
Maps were sketched on graph paper in the field, and campsites
were measured or paced off. Each graph paper drawing was marked with
Reproduced with permission of the copyright owner. Further reproduction prohibited without permission.

42
the river mile, bankside and date. Each 1/4 Inch square on the graph
paper equals approximately ten feet on a side. Some extra large sites
required use of a different scale and are so noted on the map. Features
marked on each map are the river, its direction of flow and the direction
north. Features differ from site to site, but those generally drawn In
were clumps of vegetation, trails, and satellite bedroom sites. Basic
site composition, such as beach, rock ledge or terraces was marked as
well,
Reproduced with permission of the copyright owner. Further reproduction prohibited without permission.

CHAPTER IV
RESULTS,
Although data was collected on twenty variables, and all data was
used to calculate tables and plot graphs, some variables w ill be
eliminated from the results and discussion phase, or w ill touched upon
only briefly. Generally, these results presented numbers small enough to
be considered non-repeatable. These were the following:
Landing erosion
Vegetation damage at landing
Compaction present in site core
Presence of ants, flies
Presence of camp pests
Presence of soap, gray water
Numbers of tree stumps/dead trees
Piles of human feces
Amounts of toilet paper
Although all information was gathered for the original study, it is
advisable that on future monitoring trips, only the following variables be
selected for data gathering:
1) Vegetation trampling
2) Presence of charcoal, ashes
43
Reproduced with permission of the copyright owner. Further reproduction prohibited without permission.

44
3) Litter
4) Fire remains of campfire pits, rings and rocks scarred
combined into one numerical variable)
5) Tree damages of trees scarred and trees with exposed
roots combined into one numerical variable)
6) Social trails of trails from landing, within camp and to
features combined into one numerical variable)
This w ill be a total of six variables, two aesthetic and four
biophysical, three categorical and three numerical, which should greatly
simplify the data gathering process on future monitoring trips, and
reduce the time consumed by paperwork off-river.
US£
There is presently no way to determine the amount of use at each
campsite, however, the Bureau of Land Management has kept daily visitor
use records on the river based on the number of permits issued. Although
there is a ranger to check permits during most days at the launch ramp,
there is an alternate launch point at the Mexican Hat Bridge, and thus
most likely not a 100% compliance in the launch check rate.
Additionally, this stretch is seldom patroled, and there is a possibility
that use is actually higher than permit records indicate.
Visitor use peaks during the spring months of May and June, During
this time, the water's flow reaches its yearly high, and temperatures in
the area are hot, but do not reach the extremes recorded in the months of
July and August. The summer of 1990 was no exception. The total
Reproduced with permission of the copyright owner. Further reproduction prohibited without permission.

45
number of users In May was 468, w ith 469 total users in June. (Fig. -»3)
These figures include all use; commercial, private and educational. As
of August 31, the total number of users for the year was 1,645. Use on
this stretch of the San Juan has declined since 1988, at which time
to ta ls reached their highest since 1983, with 2 ,664 river visitors.
Campsite Distribution
There were forty-one campsites inventoried and examined during
this study. The stretch of river observed was approximately 57 miles in
length.
To view the campsite distribution, the river corridor was divided
into six 9.5-mile stretches and four 14.25-mile stretches. These were
selected because trips through this canyon run from four to six days in
length.
There are relatively few campsites in the lower canyon. For
example, over 90% of the total number of campsites are in the firs t three
14.25-mile increments. Since there are only four campsites in the last
15 miles, there Is competition between groups for a campsite prior to
the take-out day. This suggests that the campsites contained within the
section prior to the last day might sustain greater overall impacts than
the other sections of river. This w ill be examined further under the
section on Impact results.
Numerous observations were taken at each site, to obtain an
overall view of the river corridor. The following sections w ill briefly
discuss the findings of these examinations. An overall "site profile" w ill
Reproduced with permission of the copyright owner. Further reproduction prohibited without permission.

CD■DOQ.C
gQ.
■DCD
C/)C/)
8
( O '
3.3"CD
CDT3OQ.Cao3
T3O
CDQ.
#
OFUSERS
400
300
200
100
++ ♦
FEB MAR APRM. MAY JUNE JULY AUG
T3CD
(/)(/)
Ot-
+-
- C0M4ERCIAL USE -o EDUCATIONAL USE -*■ PRIVATE USE
Fig 3. San Juan River visitor use from Mexican Hat to Clay Hills Crossing, Summer, 1990.
(Data courtesy of Bureau of Land Management)
à

47
then be presented, which w ill provide a view of an "average" riverside
campsite along the San Juan River.
Accessibility
Camps were divided up into four categories of accessibility by
raft from the river; easy, moderately easy, more difficult and very
difficult. Results indicated that 76% of the sites were easily
accessible, 12% were moderately easy, 7% were more difficult, and only
5% were considered very difficult.
River Information
The majority of campsites, 54%, were located on a flatwater
stretch of water. 34% were located on a stretch of quickwater or
riffles, and only 12% were situated nearby a rapid. This is not indicative
of a preference for camping on a f la tw a te r stretch, however. The San
Juan has only about three to four rapids, and the majority of the trip is
scenic flatwater.
Site Use
Campsites along the corridor are accessible only by floaters and
backpackers. About three quarters of the sites are accessible to floaters
only, while 26% are reachable by backpackers. No backpackers were seen
in the canyon on any of the trips run by this observer. Most backpacking
trips in this area are done during the spring months, before the summer's
heat, when there is water available .
Reproduced with permission of the copyright owner. Further reproduction prohibited without permission.

48
Site Composition
The campsites in the canyon were categorized into three types:
beaches, upper terrace soil/sand sites, and rock ledges. If a site was
observed during a low-water period, and there was a dry camping beach
available, the upper terrace was examined for a higher-water campsite.
In this situation, the upper terrace site was considered the more
permanent campsite, and it was counted and examined. The sites counted
as beach sites did not contain any upper bench site; they were only beach
sites. Thus, some of these w ill disappear during extremely high flows.
Only 10% were beaches, 12% were rock ledges, and the remaining 78%
were upper bench or terrace sites.
Landing Areas
The campsites had an average of a 104' landing length. The
average distance from the landing to the center of the site was 66'. The
average climb from the river to the campsite was almost 9 vertical feet.
This was calculated on an observation of 38 of the 41 total sites and
w ill vary with river level.
Site Size
Sites were categorized into four sizes, Microsites were small
sites for 1-2 tents; the medium size was 3-4 tents; large sites could
accomodate 5-9 tents and an extra-large site would hold more than 9
tents. Overall, 51% of the sites were large, and 22% fell into the extra
large category. Seventeen percent were considered micro-sites for the
smallest groups, and only about 10% of the campsites were in the
Reproduced with permission of the copyright owner. Further reproduction prohibited without permission.

49
category considered medium-sized. Average capacity of the camp areas
was M people, and the campsites averaged 4 additional satellite
bedrooms.
Proximity to other campsites and features
Eighty-five percent of the campsites do not provide a view of the
next campsite from the landing area, and 81% of the campsites do not
provide a view of the closest campsite from the center of the site, or the
site core.
There are a number of attractions near the river. Features of
interest were defined by an attraction where one might spend time in
recreation activities separate from the river. For example, there are
canyons that contain swimming potholes and scenic areas for day hikes.
Campsites tend to concentrate near these areas. For example, 63% of the
total sites had a feature of interest or attraction nearby, while only 37%
offered no off-river activity.
Site Profile
Most campsites along the San Juan River are in a flatwater area,
with easy access to the landing. The landing area has space for plenty of
boats and the distance from the boats to the campsite center averages
66 feet. Most sites are on a sandy/soil bank or terrace, and w ill
accomodate from 5 to 9 tents, and about 14 people. Most sites have
extra satellite bedrooms (an average of 4) aside from the main area.
Most campsites cannot be seen from other sites, are used only by river
floaters, and have a feature of interest nearby,
Reproduced with permission of the copyright owner. Further reproduction prohibited without permission.
50
Impact Results
As previously stated, impacts have been divided into tv/o
categories, biophysical and aesthetic. Biophysical impacts have been
further broken down into vegetation damage and trail damage,
Biophvsical Impacts
Vegetatkm
Overall, vegetation damage along the river does not seem to
present a problem. In general, most vegetation damage occurs when
campers chop, cut, break, or in some other way damage a tree in order to
obtain firewood. The San Juan differs from other areas in two main
respects. First, there is not any shortage in available firewood along the
San Juan River, The river drains a large area, from the mountains to the
desert, and there is a surplus of driftwood. There are numerous large
piles of dried wood washed ashore in much higher-water days, and
driftwood and pine cones are frequently washed in to flood the beaches
during the flash floods caused by the summer thunderstorms.
Additionally, there is not much vegetation other than the tamarisk
and willow, and these are not prime choices for firewood. Tamarisk is a
hard wood, d ifficult to break or split, and most of the existing willows
are too small to realistically consider as firewood.
Tree Damage
Reproduced with permission of the copyright owner. Further reproduction prohibited without permission.

51
Less than 10% of the sites exhibited any dead trees or tree
stumps. Over a third of the sites exhibited scarred trees or those with
broken limbs, and almost a quarter of the camps had exposed tree roots.
For future monitoring purposes, number of dead trees/stumps should be
eliminated and trees scarred and those with exposed roots should be
combined into one variable.
Irarmling
Forty-four percent of the sites showed on-site vegetation
trampling. Over half the terrace sites showed evidence of on-site
vegetation trampling. Almost half of the large and extra-large sites
Indicated trampling on-site as well. Additionally, of the sites exhibiting
trampling, only 50% (22% of the whole) had measurable site cores,
however, of these, 67% (15% of the whole) were smaller than 1000
square feet, while only 33% (7% of the whole) were larger than 1000
square feet, Sites with smaller core sites were more likely to display
vegetation trampling on-site than those with larger center cores,
On-Site Cover and Cover Loss
Campsites along the San Juan River averaged a 23% on-site
vegetative cover, ranging from 5% to 75% throughout the river corridor.
Seventy-eight percent of the sites showed some cover loss (Fig.
^4). Eighty-six percent of the sites with nearby features of Interest
showed some cover loss, while 77% of the sites that were of easy or
moderately easy accessibility indicated some cover loss as well.
Reproduced with permission of the copyright owner. Further reproduction prohibited without permission.
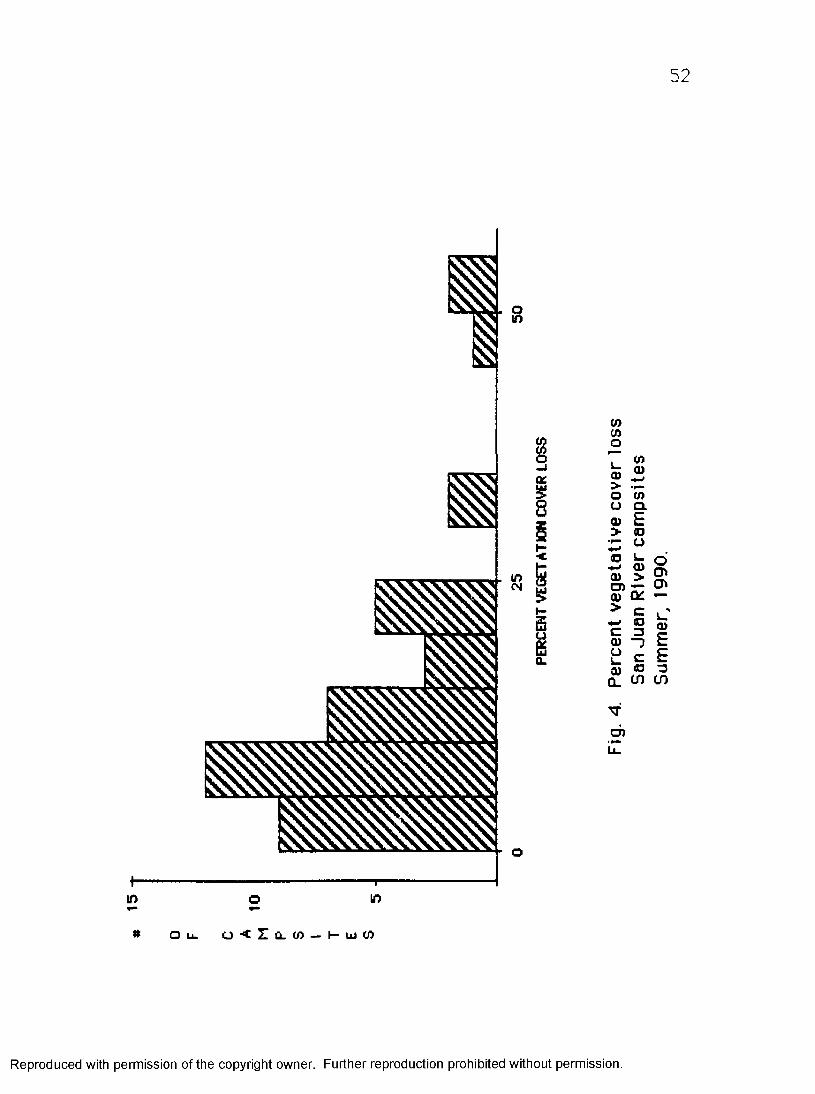
52
0
If)—I—in
§
I
i
(/>wo(0CDCD
o a> u d0) E> CO
z: « .
I P> c
CO
illC L cn CD
d)
Q)
O u . o < 2I û . ü ) — K U J Ü )
Reproduced with permission of the copyright owner. Further reproduction prohibited without permission.

53
Eighty-seven percent (68% of the whole) were terrace sites, and 85%
(66% of the whole) were on sites of large and extra large size.
Although 78% of the campsites showed some loss of vegetative
cover, 60% of those sites showing loss revealed a loss of less than 10%,
and there was a small percentage of overall cover loss.
The majority of sites showing losses had nearby features of
interest, which are generally the more popular campsites, are of easy
accessibility, and are terrace or the more permanent campsites. Type of
user (floater or backpacker) does not appear to affect the amount of
vegetation damage. There is little evidence of vegetation damage on
sites throughout the corridor.
Compaction
Campsites with any type of soil compaction are few and far
between, but those that have been affected are terrace sites, large sites,
and those used by both floaters and backpackers.
T.[a..l).,SAs with tree damage, it should be noted here that in the field, a
campsite that contained more than ten trails of a type was marked only
as > 10 trails.
S ixty-three percent of the river campsites had trails from the
boat landing to the campsite. Only about half of the sites had trails to
features, however, 88% of the sites contained trails within the camp
Reproduced with permission of the copyright owner. Further reproduction prohibited without permission.

54
itself, Ninety-four percent of the terrace sites exhibited trails from the
landing area to the campsite. The number of landing trails rises slightly
with the increase in vertical climb. Eighty-eight percent of the sites
had at least one tra il and 27% had more than 10 trails in camp. All camps
used by backpackers and floaters had at least one trail within camp,
while there were five campsites used by floaters only that exhibited no
trails within the camp.
Ninety-six percent of the large and extra large campsites had at
least one trail within the camp area, while 97% of the terrace campsites
contained at least one trail within the campsite. Ninety-seven percent
of the sites with features nearby exhibited trails within camp. The
number of trails within camp increases with the number of satellite
bedrooms in the site.
Over half of the sites (51%) displayed trails to nearby features.
Eighty percent of these (41% of the whole) were on terrace sites; 86%
(44% Of the whole) were on large and extra large sites, and as expected,
the entire 51% of these sites had nearby features of interest.
On campsite trails, as with tree damage, particular sites have
coincided with the most damage displayed. The following campsites
stand out; the Honaker Trail sites, two unnamed, extra-large sites, the
two John's Canyon campsites. Government Rapid camp, three of the four
Slickhorn Canyon campsites, and the Trimble camp in the lower canyon.
The campsites most likely to exhibit compaction and largest
number of trails are large and extra large sites and terrace sites.
Reproduced with permission of the copyright owner. Further reproduction prohibited without permission.

55
Additionally, the number of landing trails appears to increase with the
vertical climb from the river to the campsite, and as expected, the
number of trails within camp increases with the number of satellite
bedrooms.
Aesthetic Degradation
Fire Remains
On sites with fire remains, we recorded the presence of charcoal
and ashes, the number of campfire rings and campfire pits in evidence,
and the number of rocks that were charred and/or scarred due to fire
damage. These counts were then compared to the site information
variables to try to understand which sites had the most fire remains.
Charcoal and Ash Litter
Eighty-one percent of all sites had charcoal/ash litter. Eighty-
three percent of the terrace campsites exhibited this characteristic, as
well as 84% of the sites with features nearby. Ninety percent of the
large and extra-large sites exhibited charcoal litter. Additionally, over
half (58%) of the campsites that contained charcoal/ash litte r w ill
accomodate more than 10 people. While only 27% of all river campsites
are accessible to backpackers, 100% of those sites exhibited charcoal
and ash litter.
Reproduced with permission of the copyright owner. Further reproduction prohibited without permission.

56
Campfire Rings. Campfire Pits and Scarred/Charred Rocks
Only 39% of the campsites had campfire rings. Fifty-nine percent
of the s ites displayed campfire pits, and 66% of the sites exhibited some
charred or fire scarred rocks.
Less than half of the large and extra-large sites had a campfire
ring. The same holds true for the sites with features nearby and terrace
camps, and type of use does not appear to matter.
Fifty-nine percent of the sites displayed campfire pits. Sixty-five
percent of the terrace sites exhibited fire pits. Sixty-seven percent of
the large and extra large sites had fire pits. Slightly over half of the
sites with nearby features of interest contained some form of fire pit,
and 61% of the sites used by floaters only had fire pits on-site as well.
Sixty-six percent of the campsites contained rocks that had been
scarred through fire damage. Seventy-four percent of the large and extra
large sites exhibited charred rocks, while 78% of the sites with nearby
features of interest displayed this characteristic. Sixty percent of the
campsites that are used only by river floaters contained charred rocks
on-site, as well as 76% of the terrace sites.
All these figures indicate some basic points. The terrace sites are
more visibly littered with fire remains, and there is very little evidence
of fire remains on beaches or rock sites. Presumably, charcoal and ash
are either blown or washed away from these sites; there is no evidence.
The majority of sites had nearby features of interest, and again, the
large and extra large sites were the most visibly degraded.
Reproduced with permission of the copyright owner. Further reproduction prohibited without permission.

57
On future monitoring trips, fire remains should be combined into
one numerical variable.
Litter
In this section, litte r is defined as garbage left behind, such as
aluminum cans, foil, paper, etc. A full 83% of tne campsites contained
some form of litte r or garbage, ranging from 1 to 16 pieces. (Fig, ^5.)
Eighty-nine percent of the sites with features of interest nearby, 91% of
the terrace sites, and 93% percent of the large and extra large size sites
are littered. Probably due to the high percentage of flatwater sites,
more of these are littered than any other, but sites situated by rapids
have the largest amount of litter,
Feces and Toilet Paper Litter
There was little evidence of this type of degradation. Users on the
San Juan are required to carry out human waste, which most likely
accounts for the small numbers.
Only 12% of the riverside campsites exhibited any amount of
surface-level human waste. These ranged from 0 to 6 occurrences, All
were at large and extra large size sites, at sites with nearby features of
interest, and at terrace sites. Only 27% of the backpacker-accessible
sites exhibited any surface-level feces, while 68% of the floaters-only
sites displayed surface-level human waste.
Reproduced with permission of the copyright owner. Further reproduction prohibited without permission.

58
i
Q
q
CM
S fe<ogCL
OCM
qo
CI)<Dw«C L
£<DU
I iU 3g uT eu ^ >§ £L. C O) <D 3z: -3 — cw CDO en c3O£<
inO)
Ou. (j<r!a.<A — H-ujo)
Reproduced with permission of the copyright owner. Further reproduction prohibited without permission.

59
However, almost half of the sites, 46%, contained surface to ile t
paper litter. Of these, there was an even distribution between sites used
by floaters only and those used by both floaters and backpackers. Less
than half the terrace sites and less than half the large and extra large
campsites exhibited any toilet paper l it te r , so site size and composition
were not a factor.
Camp Pests. Ants, Flies. Soao and Gray Water
Although not neccessarily an indication of degradation, the
presence of large quantities of these entitles indicates that users may
not be complying with the regulatory methods of removing their garbage
and camp waste. Data collected on these variables revealed numbers
small enough so that these might be eliminated from future monitoring
trips.
The campsites on this stretch of the San Juan appear to be most
affected by litte r left behind by campers, but of an easily removable
type, such as cans, paper and foil.
Campsite Condition Indices
An overall index number was obtained for each campsite. This was
accomplished by assigning a weight to each numerical impact variable
counting aesthetic and biophysical damages. An index was arrived at for
both aesthetic and biophysical impacts, individually (Fig. ^6 and Fig. ^7.)
These were then added together to reach the overall index number.
Reproduced with permission of the copyright owner. Further reproduction prohibited without permission.

60
:
CO
yû
n- X
CM 5- 5ÛC
2 5
00
so
<M
X0}T3C
(O COO)uCO % Q. (0
- Eu ou
II5) CK — < c
CO 3
3u. (j) to
0)£0)
vDL_CD
C7> C<30
Ou. (J<Z(LtO — HwCO
Reproduced with permission of the copyright owner. Further reproduction prohibited without permission.

g
CN
M
to'D- 5
OCX
00
oCJ>
0)3 §? Ito ♦-’ ̂o (0«3 Q) a t - f
S w— C l
O Eo o uco3)=0
a .2:o Q/CD C a
^ = üL. m
Ou. U<Zo.CO — ) - U J t O
Reproduced with permission of the copyright owner. Further reproduction prohibited without permission.

62
The overall Impact index spread was from 0 to 30, The overall
index mean is 14,6, or almost in the center of the impact index (Fig, ^9).
These were then recoded into five categories, and labeled as follows:
A = 0 = no damages
B= 1-10 = slightly damaged
C = 11 -20 = more damaged
D = 21-30 = more severely damaged
E = > 30 = most severely damaged
Five percent fall into the "A" category, 27% fall into the "B"
category, 449% fall into the "C" category, 19% fall into the "D" category,
and 0% fall into the "E" category as of this study (Fig. *9),
Reproduced with permission of the copyright owner. Further reproduction prohibited without permission.

63
«
oin
o
C93L.'0)>q2c403-]CCOmcmO)cwCOl_XCD
IDC
uCOQ .£
£CD>o
(Dd)
# o u . c j < Z i 3 . c n — »-uicm
Reproduced with permission of the copyright owner. Further reproduction prohibited without permission.

CD■ DOQ .C
gQ .
■DCD
C/)C/)
20 T49%
8
ci'15 -
33 "CD
CD■DOQ .CaO3"OO
CDQ .
■DCD
C/)C/)
CAMPSITES
27%
10
5%
m
19%
0 IMPACTSB
1-10 MPACT RATING LEAST AMOUNT
OF IMPACTS
C11-20
IMPACT RATKG MODERATELY
IMPACTED
D21-30
IMPACT RATWG MORE
SEVERELY IMPACTED
E>30
MPACT RATING MOST
SEVERELY IMPACTED
Fig 9 C am psite con d itio n c a teg o rie s San Juan R iv e r c a m p s ite s , sum m er, 1990. cr>

65
Limitations of Study
Estimates w ill vary somewhat between observers, so the level of
precision should be tested between observers for consistency.
For example, on vegetative cover, an assistant and myself were close in
our estimates only after we practiced with the chart to estimate cover
in various types of areas. This chart should be used for practice before
actual data collection begins,
One flaw in this process concerns examination time. Even with
two people collecting data, drawing maps and photographing, examination
time averaged thirty minutes per site. Unless a shorter field form is
developed for future monitoring, the process w ill be too time-consuming
for one person.
Reproduced with permission of the copyright owner. Further reproduction prohibited without permission.

CHAPTER V
DISCUSSION
Vegetation and trails impacts appear few when compared to
aesthetic degradation, such as litter, Variations within campsite
conditions are more visibly marked when viewed with site information
such as site composition and site size. For example, in viewing the
overall index as compared to site composition by boxpiot, it is obvious
that the bank/terrace campsites have a higher rate of overall impact, as
is indicated by the level of the interquartile range (Fig. ^10). Several
factors most likely accounted for the lesser resistance to damages on
these sites. As previously stated, the San Juan River is continuously in a
state of change. Beach sites are few, and those that do exist w ill most
likely be "cleansed" of litte r during times of floods and high water
Additionally, due to flooding, these beach sites are underwater a great
deal of the time and are thus not usable as campsites. Consequently,
they most likely receive less use than the always-available terrace
sites. Also, the rock ledge sites are less likely to receive major
biophysical damages, due to the resistant nature of the rock to
vegetation growth.
Additionally, upon comparison of campsite condition and site size
it appears that the large and extra large sites have slightly higher
impact ratings as well (Fig. ^ i I). Large groups of users camping on the
66
Reproduced with permission of the copyright owner. Further reproduction prohibited without permission.

CD■ DOQ .C
gQ .
■DCD
C/)C/)
22.5
8
ci'
33"(D
(DT3OQ .Cao3
T3O
(DQ .
0VERALL
NDEX
15 .0 -
7 .5 -
- 0.0
BEACH ROCK LEDGE BAMK/TERRACE
T3(D
(/)(/) Fig. 10 C am p s ite cond ition by s ite com position .
V a r ia t io n in c am p s ite cond ition in d ices among c a m p s ite s and in re la tio n to c a m p s ite com position .

CD■ DOQ .C
gQ .
■DCD
C/)C/)
8
( O '
3.3"CD
CDT3OQ .Cao3
T3O
CDQ .
22.5 --
0VERALL
INDEX
15.0 --
7.5 --
- 0.0
T
SMALL MEDIUM LARGE EXTRA LARGE
■DCD
C/)C/)
Fig. 11. C am p s ite cond ition and s ize . V a r ia t io n inc a m p s ite c o n d itio n ind ices among cam p s ites and in re la t io n to c am p s ite s ize . CTvoo

69
larger sites w ill Impose more damage on an area, both through sheer
numbers of users, and through physical enlargement or spread of a site.
The National Park Service Is Interested in campsite distribution
along this stretch of river, Due to the shortage of campsites In the
lower canyon, there is concern that competition for sites directly above
the last-day stretch might place undue stress on the resource In this
area, resulting in more severe damages. Because of this concern, the
Impact Indices have been viewed In two ways, In 9,5-m ile Increments
and 1425-mile Increments. (These are based on the distance an average
river party might travel In one day on this river, approximately ten to
fifteen miles. These segments have been chosen because most river
parties run trips of four to six days' length.) Both the 9.5-mile river
Increments and the 1425-mile river increments have then been crossed
with the Impact Index to examine the site conditions within each
stretch. When the 1425-mile Increment stretch Is crossed with the
Impact index, no interval stands out significantly above the others (Fig.
*12). However, when the river Is broken down Into 9,5-mile blocks and
then cross-tabulated w ith the impact index, the next-to-last stretch
stands out somewhat above the others (Fig. *1 3 ). This stretch contains
the campsites with the highest Impact ratings, as well as the largest
range of Impacts.
Reproduced with permission of the copyright owner. Further reproduction prohibited without permission.

70
HR
ri
n<vils
To
v>. Qin
V).r- ?
<n4-»Cœ£guc
0)>£4-*O)£Iin<NTf
3O<*-3)XO)T3C
OCDCL£
<N
enLi.
o > W K < _j _j — ZÛLUX
Reproduced with permission of the copyright owner. Further reproduction prohibited without permission.

7
*
m m
r-
«h-TR
!
inON
inON6
qin
qr-
0)■*->c0)£2Îuc
O)><0#-*0)£Iin
ON%cS3)13X0)T3C
u(0a.£
K)d)
01O > U1 Û£ < -J _J z a w X
Reproduced with permission of the copyright owner. Further reproduction prohibited without permission.

72
One particular factor probably accounts for this. Two of the most
popular areas along the San Juan River, Slickhorn Gulch and Grand Gulch
are within this next-to-last stretch, Slickhorn Gulch has five campsites
within view of the canyon. Four of these are at the mouth of the canyon
itself, and are accessible by boat. The Bureau of Land Management states
specifically in its river permit instruction pamphlet that only one night's
camping is allowed at the mouths of Slickhorn and Grand Gulch,
Additionally, there is an on-river campsite register whereby a river
party registers for these campsites for one specific night. However, this
observer has spoken with and observed river parties that have chosen to
ignore these regulations, and have stayed in these areas for two and
three nights. The fact that there are very few campsites downstream
serves to increase their attractiveness as a last-night place to stay
before the take-out day. These sites are very popular, due to existing
on-site features, and are also in the next-to-last day stretch,
Therefore, the high incidence of impacts in this area may partly be
attributed to the popularity of the Slickhorn and Grand Gulch areas. The
same is true for the Honaker Trail area. Although there is no lim it on the
number of nights a party is allowed to stay at Honaker, there are four
campsites within walking distance of the trail, and this is a popular area
for early-morning hikes.
There is litt le evidence of compaction along the river. Only 7% of
the sites show any indication of soil hardening at all. This is most likely
Reproduced with permission of the copyright owner. Further reproduction prohibited without permission.

73
due to the nature of the campsite composition, All sites, including upper
terrace sites, are composed of either sand or rock.
In conclusion, there is a higher degree of aesthetic degradation
than biophysical degeneration.
Reproduced with permission of the copyright owner. Further reproduction prohibited without permission.

CHAPTER VI
CONCLUSIONS
A new riverside campsite inventory revealed a total of forty-one
campsites on this 57-mile stretch. An examination was performed on
each campsite, to provide a baseline of information. Periodic
reassessment of these sites w ill provide information by which to assess
trends in campsite conditions.
A campsite condition index was obtained for these sites. An index
rating was obtained for each site on both aesthetic and biophysical
impacts, and the two were then combined. Condition indices were
developed for the aesthetic and biophysical damages separately as well,
for individual comparison.
Campsites that appeared most damaged overall were of large and
extra large size, and were of upper terrace, soil/sand bench composition.
Additionally, there are a few specific locations that have sustained the
most damage, and these are the popular sites of Slickhorn Gulch and
Honaker Trail.
Dividing the river into specific travel increments indicated that
there is an area with slightly higher impacts, which is the next-to-last-
day stretch before the take-out at Clay Hills Crossing. The above-
mentioned Slickhorn Gulch falls into this travel stretch, presumably for
two reasons: there are few campsites below this site, and Slickhorn is a
74
Reproduced with permission of the copyright owner. Further reproduction prohibited without permission.

75
popular place to stay. It is accessible to both floaters and backpackers,
and provides off-river recreational activities, in the form of canyon
hiking and swimming.
Little vegetation damage has occurred. The river provides
driftwood for campfires, and the type of vegetation in the canyons
(tamarisk and willow) is not conducive to firewood gathering. Soil
compaction is almost nonexistent. Campsite composition (sand or rock)
most likely precludes hardening of sites.
The most severe biophysical damages are in the form of trails.
Most of the campsites contained trails within the camp, and these are
usually located on sandy terraces and high banks. Due to the fluctuation
of the San Juan River, there are few beach impacts. The San Juan has a
high s ilt content, and therefore, the question of beach loss through
erosion is not a concern.
Final results indicate that the amount of visible litte r might
become a major consideration. Some is left behind by floaters, and there
are vast amounts washed in by floods from upstream in the form of tires,
oil cans, etc. However, in viewing this stretch of the San Juan River as a
whole, there appears to be little biophysical damage
Reproduced with permission of the copyright owner. Further reproduction prohibited without permission.

MANAGEMENT RECOMMEND AT IONS
1. Campsite conditions should be monitored every two to three years.
Many changes have occurred in the past four seasons since the 1986
publication of the Baars' river map, so monitoring should be done more
often than every four years to maintain a current inventory and assure
relocation of sites. However, if monitoring is performed every year,
small changes w ill most likely not show up, due to the nature of the
rapid estimation procedure. The aesthetic and biophysical indices w ill
allow for off-site inspection of overall conditions to view any trends in
campsite condition.
2. A re-inventory of campsites should be performed every five to
seven years. Campsites have changed between the time the river map
was published in 1986 and the time this investigation was performed in
1990. Re-vegetation and changing river and lake levels affect
availability of campsites, thus a new study should be performed
periodically, to update the inventory.
3. A change should be made to a shorter field form. Information
baselines have been established, thus the monitoring process need not be
as detailed as the original procedure, and information collected should be
cut to erosion/trails and vegetation information, that which is needed to
develop the condition indices, and basic details necessary for relocation
purposes. In the determination of trail impacts, a measure of depth
and/or width should be added to the format, and consequently be
76
Reproduced with permission of the copyright owner. Further reproduction prohibited without permission.

77
calculated Into the Impact index. This should increase depth of
knowledge,
4 A study on user behavior and user perceptions should be
considered. To date, no such study has been performed on this stretch of
river. A sociological study would provide further information for the
agencies. This would be useful for decision-making regarding river
regulations, and in the preparation of the proposed river management
plan.
5. Non-manipulative techniques should be used to rejuvenate the
resource. This may be accomplished by educating and thus changing user
behavior, and by cleaning up campsites. There are numerous ways to do
this:
a) An informational brochure should be developed to educate users
as to the responses of campsites to damaging user behavior. This should
then be distributed to all permit-holders, both backpackers and river
users.
b) Create a new river map to be distributed to permit holders.
Include newly-inventoried campsites and information on site size and
conditions. Advocate use of small and medium-sized sites for smaller
groups.
c) It is doubtful that use can be restricted at the campsites at
Slickhorn Gulch. This may be desirable only as a last resort, Compliance
is an issue, especially considering the scarcity of campsites below this
area. However, if levels of site damages become unacceptable in the
Reproduced with permission of the copyright owner. Further reproduction prohibited without permission.

78
future, closure of one site at a time is a possibility. In the event this
becomes a reality, users should be informed of the reasons for closure,
and suggestions for alternative campsites should be provided,
d) Agencies should increase the number of river patrols and the
percentage of compliance checks at launch points. This w ill provide in-
the-field information and better assurance of regulation compliance.
Presence of river rangers at launch points and on the river w ill promote
relations and contact with the public, and w ill stimulate the concept
that the administering agencies are concerned with both the resource and
its recreational users. During the summer of 1990, there was an obvious
deficiency of agency personnel on this stretch of river.
e) Cleanup of campsites w ill lessen aesthetic degradation, This
may be accomplished by runnihg river cleahup patrols. Litter can be
removed and fire remains can be cleaned up by screening ashes and
charcoal, by removing rock fire rings and cleaning scarred and blackened
rocks.
Reproduced with permission of the copyright owner. Further reproduction prohibited without permission.
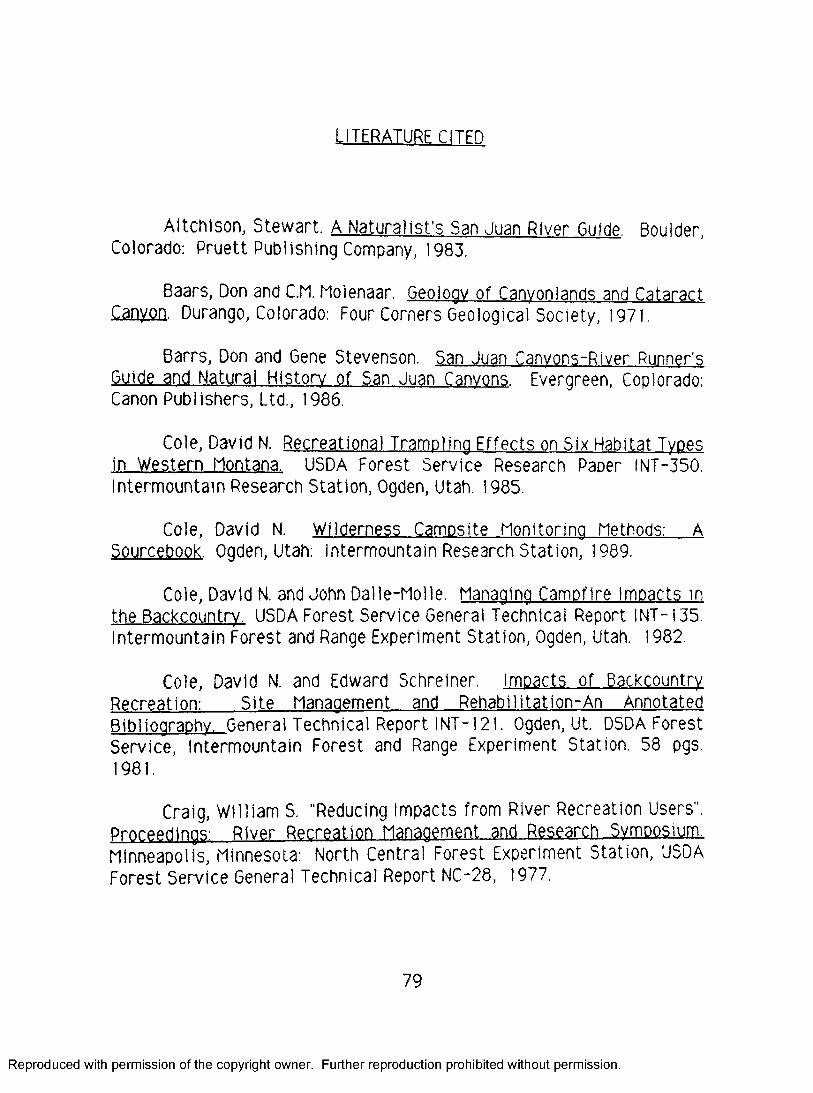
ÜTERATURE CITED
Altchison, Stewart. A Naturalist’s San Juan River Guide. Boulder, Colorado; Pruett Publishing Company, 1983.
Baars, Don and C.M. Molenaar. Geoloav of Canvonlands and Cataract Canyon. Durango, Colorado: Four Corners Geological Society, 1971,
Barrs, Don and Gene Stevenson. San Juan Canvons-River Runner’s Guide and Natural History of San Juan Canyons. Evergreen, Coplorado: Canon Publishers, Ltd., 1986.
Cole, David N. Recreational Trampling Effects on Six Habitat Types in Western Montana. USDA Forest Service Research Paper iNT-350. Intermountain Research Station, Ogden, Utah. 1985,
Cole, David N. Wilderness Campsite Monitoring Methods: ASourcebook. Ogden, Utah: intermountain Research Station, 1989.
Cole, David N. and John Dalle-Molle. Managing Campfire Impacts in the Backcountrv. USDA Forest Service General Technical Report INT-135, Intermountain Forest and Range Experiment Station, Ogden, Utah. 1982.
Cole, David N. and Edward Schreiner. Impacts of Backcountrv Recreation: Site Management and Rehabilitation-An AnnotatedBibliography. General Technical Report INT-121. Ogden, Ut. DSDA Forest Service, Intermountain Forest and Range Experiment Station. 58 pgs. 1981.
Craig, William S. "Reducing Impacts from River Recreation Users". Proceedings: River Recreation Management and Research SvmPQS.Mn: Minneapolis, Minnesota: North Central Forest Experiment Station, USDA Forest Service General Technical Report NC-28, 1977.
79
Reproduced with permission of the copyright owner. Further reproduction prohibited without permission.

80
Dolan, Robert and Alan Howard and Arthur Gallenson. "Man's Impact on the Colorado River in the Grand Canyon", American Scientist Volume 62, pgs. 392-401, July-August, 1974
Four Corners Geological Society. Edited by Don Baars. Geology of the faovons of the_San Juan River. Durango, Colorado: Four Corners Geological Society, 1973.
Frissell, S.5. and D.P. Duncan. "Campsite Preference and Deterioration." Journal of Forestry 63(4); Pgs 2S6-260 1965.
Harris, Rick. National Park Service, Resource Specialist. Personal communication. Page, Arizona. Summer, 1990.
Kuss, Fred R., Alan R. Graefe, and Laura Loomis. "Plant and Soil Responses to Recreation: A Synthesis of Previous Research." inProceedings: River Recreation Management and Research Symposium.Minneapolis, Minnesota: North Central Forest Experiment Station, USDA Forest Service General Technical Report NC-28, 1977.
LaPage, Wilbur F. "Campground Tampling and Ground Cover Response". Some Observations on Campground Trampling and Ground Cover Response. U.S. Forest Research Paper NE-68. USDA, Forest Service, Northeastern Forest Experiment Station, pgs. 1-11. 1967,
Pfister, Robert E., and Robert E. Frenkel. "Field Investigations of River Use Within the Wild River Area of the Rogue River, Oregon." Rogue. River Study Reo. 1. 108 pgs. Dept. Geography, Oregon State University, Corvallis, Oregon. 1974.
Rennicke, Jeff. The Rivers of Colorado. Billings and Helena, Montana: Falcon Press Publishing Co., Inc., 1985.
Reproduced with permission of the copyright owner. Further reproduction prohibited without permission.

81
Ripley, TH. Recreation Impact on Southern Appalachian GrnundR and Picnic Sites. U.S. Forest Service Research Paoer. SE-153. 20 pgs. 1962.
Roggenbuck, Joseph w. and Richard M. Schreyer, "Relations Between River Trip Motives and Perception of Crowding, Management Preference, and Experience Satisfaction" in Proceedings: RiverRecreation Management and Research Symposium. Minneapolis, Minnesota: North Central Forest Experiment Station, USDA ForestService General Technical Report NC-28, 1977.
Settergren, CD. and DM. Cole, "Recreation Effects on Soil and Vegetation in the Missouri Ozarks". Journal of foce&try (68)4; pgs, 231- 233. 1970.
Swed, J.D, National Park Service, Hall's Crossing Ranger, Personal communication. Hall's Crossing, Utah. Summer, 1990.
Temple, Kenneth L, and Anne K. Camper and Gordon A. McFeters. "Survival of Two Enterobacterla in Feces Buried in Soil Under Field Conditions", Applied and Environmental Microbiology, pgs, 794-797 October, 1980,
Temple, Kenneth L. and Anne K, Camper and Robert C. Lucas, "Potential Health Hazard from Human Wastes in Wilderness," Journal ..„Qf. Soil .and Water Conservation. Volume 37, Number 6, pgs. 357-359, 1982.
Reproduced with permission of the copyright owner. Further reproduction prohibited without permission.