“a study of change in occupational patterns · pdf filenirman, maharashtra. page 1...
TRANSCRIPT
NIRMAN, Maharashtra. Page 1
“A STUDY OF CHANGE IN OCCUPATIONAL PATTERNS OF RAMOSHI
COMMUNITY”, WITH SPECIAL REFERENCE OF INDAPUR TALUKA OF PUNE
DISTRICT.
Prepared by
Uttam Madane
Published by
NIRMAN (New Initiative for Reclamation of Mankind)
Maharashtra
2010
NIRMAN, Maharashtra. Page 2
ACKNOWEDGEMENT
I take this opportunity to thank all people of Ramoshi community particularly my respondents
who have given me valuable information’s for my research study. It was their sincere response
which helped me to complete this study.
I also thank to my research guide Mr. Vishal Karuna, faculty Karve Instititute of social service,
Pune, for his immense support and input throughout the research process in completion the
study. He also has given lots of input for developing understanding about research
methodology and developed analytical thinking for the study.
I would like to thank all leaders of Ramoshi community, for their help for introducing me to the
Ramoshi community in their village. It was because of their contacts and relation in the
community that I was able to do my data collection in these villages.
I sincerely thanks to my family members and friends for their enduring support and motivation
have led me to complete the study.
I thank to the Library staff for providing me books and other materials as per my need.
I thank all the people who provided me their laptops and computers to complete this work.
Lastly I would like to thank all who have helped, encouraged, guided me in the process of the
study and led me to complete the study effectively.
Uttam Madane
Indapur, March- 2010

NIRMAN, Maharashtra. Page 3
CONTENT
Acknowledgement ................................................................................................... i
List of Tables .......................................................................................................... v
List of Diagram ........................................................................................................vii
Chapter I: Introduction …………………………………………………………1 to 8
Evalution of Mankind and Nomadic Communities
Tribe means
Major nomadic communities in India and world
1. Todas
2. Masai
3. Bahima
4. Kazak
5. Dhangar
6. Gaddi
7. Gujjars
8. Ramoshi
Forest and nomadic people
Historical perspective of Ramoshi Community
Surnames of Ramoshi community
Cultural/ Religious life of Ramoshi

NIRMAN, Maharashtra. Page 4
Colloquial Language of Ramoshi
Marriage System of Ramoshi
Jat-Panchayat of Ramoshi
Crematorium (last sanskaras) Ritual of Ramoshi
Educational Status of Ramoshi Community
Chapter II: Methodology .....................................................................................9 to 16
Title
Statement of the Problem
Significance of the Study
Ethical concerns
Review of Related Literature
Scope of the Study
Assumptions Underlying the Study
Objectives of the Study
Hypothesis
Research Questions
Key Variables
Operations Definitions of Concepts
Items of information in the Study
Analysis plan
Research Methodology
Sample Design

NIRMAN, Maharashtra. Page 5
Source of data
Tools for Data Collection
Chapter III: Data Analysis and Findings .................................................................17 to 63
I) community people analysis :…. ……………………………………….19 to 52
Profile of the Respondents
Occupational pattern and changes occurred in traditional occupation
pattern
Reason for change in occupatin
Relation with other community
II) Community leaders opinion:………………………………………… .53 to 63
Chapter IV: .......................................................................................................... 64 to 69
Summary
conclusion
Suggestions
Bibliography
Annexure
Tools of Data Collection
NIRMAN, Maharashtra. Page 6
List of the
Table
S.N List of the Table Page No.
I. community people analysis
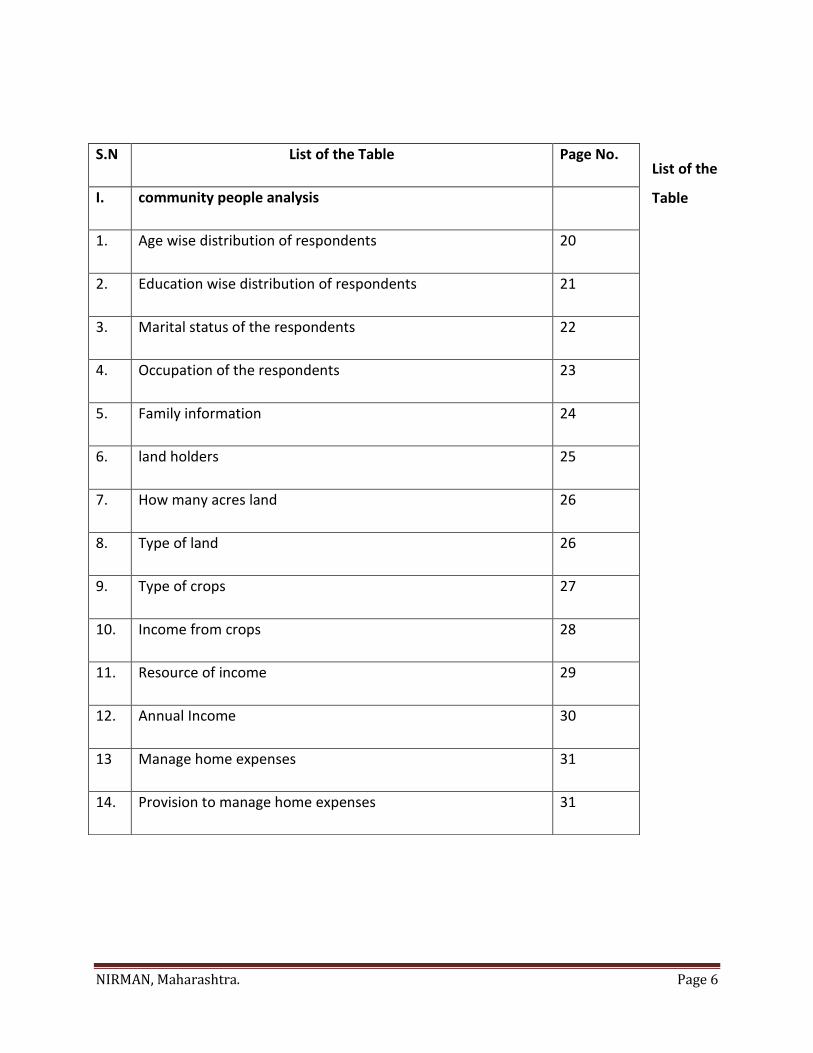
1. Age wise distribution of respondents 20
2. Education wise distribution of respondents 21
3. Marital status of the respondents 22
4. Occupation of the respondents 23
5. Family information 24
6. land holders 25
7. How many acres land 26
8. Type of land 26
9. Type of crops 27
10. Income from crops 28
11. Resource of income 29
12. Annual Income 30
13 Manage home expenses 31
14. Provision to manage home expenses 31

NIRMAN, Maharashtra. Page 7
15. Change in occupation 32
16. Reason for change in occupation 33
17. Ancestor doing same occupation 33
18. Type of job 34
19. Period of traditional occupation 34
20. Liking traditional occupation 35
21. If yes, reason 35
22. Reasons for not liking 36
23. Present occupation 36
24. Reasons for liking 37
25. Reasons for not liking 37
26. How many generations not following ancestral occupations 38
27. Peoples reaction towards the present occupation 39
28. Relation with other community 40
29. Position in family 41
30. Status in village 42
31. Benefits got from membership 43
32. Demand fulfill by the Grampanchayat 44
33. Attitude of Grampanchayat members 45
NIRMAN, Maharashtra. Page 8
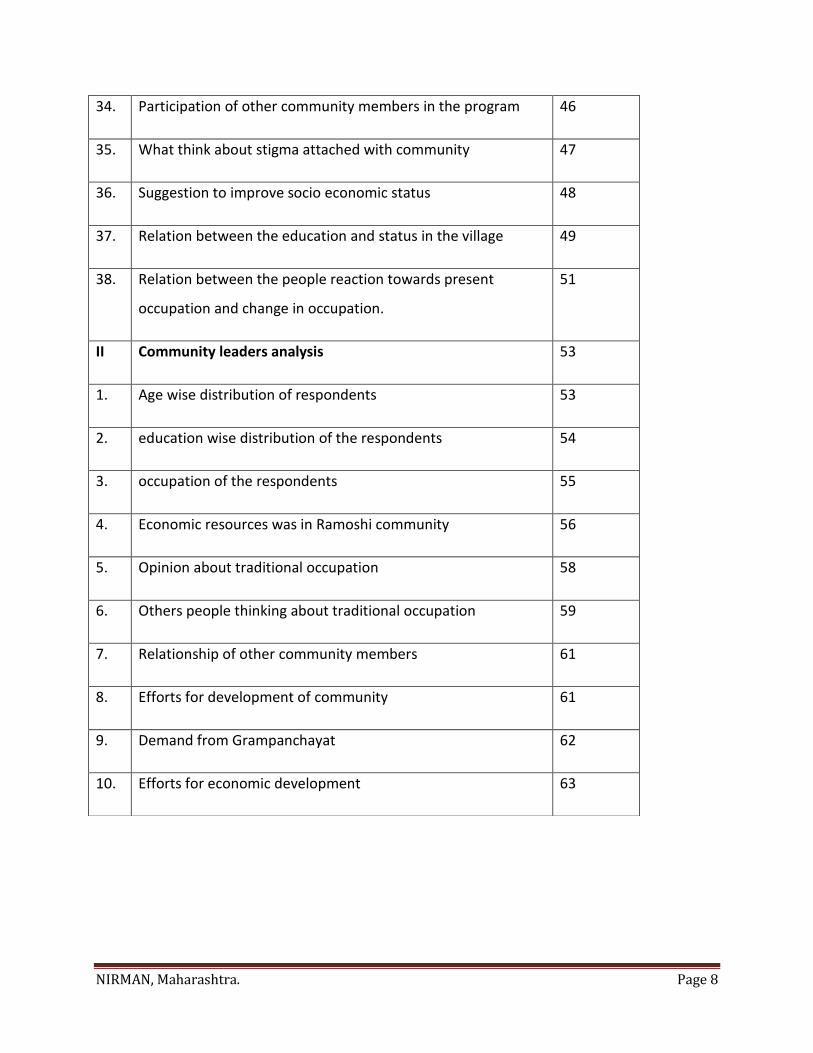
34. Participation of other community members in the program 46
35. What think about stigma attached with community 47
36. Suggestion to improve socio economic status 48
37. Relation between the education and status in the village 49
38. Relation between the people reaction towards present
occupation and change in occupation.
51
II Community leaders analysis 53
1. Age wise distribution of respondents 53
2. education wise distribution of the respondents 54
3. occupation of the respondents 55
4. Economic resources was in Ramoshi community 56
5. Opinion about traditional occupation 58
6. Others people thinking about traditional occupation 59
7. Relationship of other community members 61
8. Efforts for development of community 61
9. Demand from Grampanchayat 62
10. Efforts for economic development 63

NIRMAN, Maharashtra. Page 9
LIST OF DIAGRAM
S.N LIST OF DIAGRAM PAGE
NO.
I. Community people analysis
1. Age wise distribution of respondents 20
2. Education of respondents 21
3. Marital status 22
4. Occupation 23
5. Land Holder 25
6. Income from Crops 28
7. Annual Income 30
8. Change in Occupation 32
9. Type of Job 34
10. Peoples reaction towards the present occupation 39
11. Relation with other community 40
12. Position in family 41
13. Status in village 42
14. Demand fulfill by the Grampanchayat 44
15. Attitude of Grampanchayat members 45
16. Participation of other community members in the program 46
NIRMAN, Maharashtra. Page 10
17. What think about stigma attached with community 47
18. Suggestion to improve socio economic status 48
19. relation between the education and status in the village 49
20. Relation between the people reaction towards present
occupation and change in occupation
52
II. Community leaders analysis
1. Age wise distribution of the respondents 53
2. Education wise distribution of the respondents 54
3. Occupation of the respondents 55
4. Opinion about traditional occupation 58
5. People thinking about traditional occupation 59
6. Demand from Grampanchayat 62
NIRMAN, Maharashtra. Page 11
Chapter I
Introduction chapter
Evolution of Mankind and Nomadic Communities
Mankind has been on earth for about 1.75 million years, for more than 99% of this period the
human being have been hunters and gatherers. It was only about 10,000 years ago that they
began to change over to farming and keeping animals. As hunters and gatherers, human being
lived off the resources of their environment. They collected roots. Fruits, seeds for food and
killed or caught animals. When it is said that human being domesticated plants and animals for
their economical and social needs, it means that they have chose certain plant and animal
species to produce their food. They chose the species that world grow best in their particular
region. They captured the animals. Kept them in captivity and controlled their mating. They
caught the species of the animals which would be easier to tame or those which would give
good mild and food. After generation of breeding the animal is very different from its wild
ancestor.
Slowly specialized animal herding developed in some parts of the world. In the large tracks of
land which cold not support agriculture or in areas where the dry season was severe and fodder
was not available for a large number of animals, people gave up interest in agriculture and
became full time herders. They use to take their animals to pastures in different areas. Until
today many communities in the world and India move around with their herds of sheep, goats
and buffalos. They move to different areas in different seasons in search of grass and stay in the
areas where the fodder is available in abundance. These people are called nomadic people.
Some of the cases these monds have a permanent hues and they move from there in a
particular season and come back when the season is changed. This practice is called seasonal
migration. In some case the people will be on a regular migration throughout the year and will
stay in different areas in different seasons, this is called permanent or regular migration.

NIRMAN, Maharashtra. Page 12
Tribe means:
A tribe is a collection of families bearing a common name, speaking a common dialect,
occupying or professing to occupy a common territory and is not usually endogamous, though
originally it might have been so. – Imperial Gazetteer of India
A tribe is a social group with territorial affiliation, endogamous, with no specialization of
functions, ruled by tribal officers, hereditary or otherwise, united in language or dialect,
recognizing social distance with other tribes or castes, without any social obloquy attaching to
them, as it does in the case structure, followed tribal traditions, beliefs and customs, illiberal of
naturalization of ideas from alien source, above all conscious of homogeneity of ethnic and
territorial integration. – D.N> Majumdar
Major nomadic communities in India and world
1) Todas :
One of the nomadic communities is todas of nilgiri mountain of chennai this is a tribe of
buffalo herders . now very reduced in numbers, who practice no agriculture and have a
few industrial art.
They are mostly depend on buffalo rearing for their livelihood .the rest of the produce
used by them are supplied by their neighbours who receive in exchange milk and other
dairy products.
2) Masai:
The masai of the highland of the east of lake Victoria in Africa is another nomadic
community .in this community cattle are by far the more important and in normal time
each family has its own herd . sheep are also in abundant but heir economic and social
importance cannot be compared to that of cattle . Pastrolism among the masai is more

NIRMAN, Maharashtra. Page 13
than an economical activity and it is a cultural pursuit’s cow ar a goat is a object of
affection which is known to the master by its name .
3) Bahima:
Bahima of ankole in Uganda is similar to the masai and their main source of livelihood is
cattle .the community get agricultural products in exchange with t milk and other
animal products from bairu who are doing agriculture and smithy work
4) Kazak:
The kazak of Siberia are pastoral nomads or racial Mongolian features. Cattle, horses,
camels and sheep are their main source of wealth. Their early cycle is divided into two
stage in accordance with the season of the year , the most important being the winter
period of five months ,during which they live settle in the river valleys . Where they get
plenty of grass for their animals .in summer season they are constantly on move .
5) Dhangar:
Dhangar is a pastoral nomads of Maharashtra (India) . Dhangar community is depend on
the rearing of the sheep and goat for their livelihood as they use them for wool and
meat purpose .the community is on the move throughout the year .
6) Gaddi:
Gaddi is a pastoral nomad of Himachal Pradessh in India .the community is rearing
sheep and goat for their livelihood. The life of the community is divided into major
seasons, in summer they go to the high pastures of Himalaya and in winter season they
go the plain area of Punjab,Haryana,and Rajasthan . income from the wool and meat are
the only source of livelihood of the community . at present the number of sheep
herders is reducing in Gaddi community as their younger generation is not willing to
continue the nomadic life.
7) Gujjars:
Gujjars is another nomadic tribe of Himachal Pradesh which follows the Islam religion.
Buffalo rearing is the source of livelihood of the community like Gaddi Gujjar also follow

NIRMAN, Maharashtra. Page 14
the same pattern of migration and they stay in the pastures of Himalaya for six months
and in plain areas for six months of the year.
8. Ramoshi
Since ancient age Ramoshi community is famous for protection of village. Majority of
the Ramoshi people are residing in Pune. Satara and Ahmednagar districts of
Maharashtra state. Especially the bottom and surrounding of the fact are prominent
living places of Ramoshi.
Ramoshi consider themselves as lineage of Lord Rama. In Marathi language they say “we
are Ramwanshi” by the flow of time work has got alteration and became Ramoshi.
It has myth which tells that Ramoshi community is a tribal community. The people from
Narmada river belt coincidently developed friendship with the load Ram during his 14
years “Vanwas” (Expedition in which spends time of life in the company of nature)
consequently they turned to Kingdom of Rama at Ayodhya and Rama allotted them duty
of protecting village. Rama used to call them his lineage. But the fact is some what
contrast. It is clear indication of body built ritual practices and god- goddess custom
which supports that Ramoshi community were coming from south India and is a creed
of Dravid.
Forest and nomadic people
Tribal people have a lot of dependency on forest for their livelihood ,specially nomadic
communities are dependent on forest for their cattle .they collect fodder and fuel wood from
forest .pastoral nomads migrate from one place to another in search of fodder. They stay in the
area where fodder is available in abundance . in the olden times where under sthe community
,nomadic community had free access to the forest resources /during the British period the
forest access of the nomadic people were restricted by introducing forest and after
independence Indian government provided them limited access and limited rights in relation to
grazing and fodder collection are provided to nomadic tribes .at present nomadic tribe people
often blame for their destruction of the forest with their intervention in the forest .

NIRMAN, Maharashtra. Page 15
Historical perspective of Ramoshi Community:-
Primarily Ramoshi community used to each bread and butter by wandering in the jungle later
on they started to habituate in Maharashtra and Karnataka. It is recognized as ‘Berad” in
Karnataka. In Maharashtra it is not primarily related to village life. The community is bold and
adventures so at very easy they got task of protecting village, fort. Thus it has way of earning of
living. The community is highly trust-worthy and followers of promise and hence it is well
known for it.
Even though Ramoshi community resides away from vllage or sometimes close to the jungle.
“Ramoshi” has the common habituate of the community.
Maratha emperor Shivaji utilixed the inherent qualities of men of Ramoshi. They used to
protect fort.. They are expecting in finding path ways and chasing thieves. One more evidence
states that because of expertise of Ramoshi under the head of Bahirji Naik, Shivaji Maharaja
established surveillance department of his state. The protection of from, village and fort had
administrated by Ramoshi community. They are employed till the end of Maratha Empire at
1818 A.D. there after community have become unemployed, jobless wandering. Nothing had
left out as a source of earning for them.
And hence they started with antisocial practices such as robbery, dacoit to fulfill their basic
needs. The rich and powerful element of society i.e. patil, kulershi, Vatandar had taken
advantage of this social circumstance. They used to encourage men of Rmoshi for of treasure
that was the loot of British Empire. In order to confine antisocial practices of Ramoshi
offender’s prevention act declared Ramoshi as a criminal community.
In 987 the British government declared some tribal as “criminal- Ramoshi community is one
among in the criminal tribes. The established society did not oppose this; contrarily they seem
to have liked it. Some clauses were:
1. Permission should be obtained from police while shifting from one location to other
2. Government could send the group to people outside the bounds of ascertain
3. Government got the right to form a settlement and keep the groups of people there.

NIRMAN, Maharashtra. Page 16
Today Ramoshi is called Boya, Berad, and venolan. In Andhra it is called Boya and in Tamil Nadu
it was called Berad and Bedar. Ramoshi of Maharashtra has come from mostly Karnataka and
their surnames as Berad – Ramoshi of Karnataka. Their original language is southern. They first
got settled in Karenataka and later migrated to Maharashtra word. “Bhuyal” in Berad’s
language seems to have originated from Boya though it is known in Maharashtra as Ramoshi.
Berad, the name “Ramoshi” is not older than 100 – 200 years.
Surnames of Ramoshi community
Colloquial language of Ramoshi community is Marathi, no other languages are being spoken by
them. It shows that they are residing in Maharashtra since long ago. Their surname are
resembling to the surnames of Maratha, kunbi, mali and Dhangar community such as Aajgire,
virge, Bhosale, Chavan, ghukat, phokane, gergal, thodgar, gopane, gudagul, jawale, zapade,
shelar, shinde, shirke, waghmare, bodare, khirsagar, konde, langde, Madane, Rode, saparde,
jadhav patole, gujale, mohite etc.
Each surname belongs to separate kuldevtas, surya phul, umber, jambhul, kuranb, shuni etc.
Some devakas members are supposed that they are brotherhood of each other. They never
engage their marriage within clan.
Cultural/ Religious life of Ramoshi
Inhabitant of Maharashtra like Marathe, Mali and Dhangar the religious life of Ramoshi has
resemblance Khandoba is the main God of Ramoshi. Khandoba is war diety of Ramoshi Khund
means sword. Oath taking practice is prevalent in Ramoshi by taking Bandara, ash of sacred
incense stick etc. Though Ramoshi are Ramwanshi they consider Mahadeva as a main God of
community their worship Vital, Bairoba, Ambabai, Janai, Kalubai, Phirangia, Navlai, Takal etc.
They try to get blessings of God and wants to live happy and peace full life. They celebrate
carnivals by sacrificing goats and cocks.
Ramoshi celebrate all common festivals of Maharashtra. In order to ge security from infection
of epidemic Ramoshi kill goats for God and arrange party for Kith and Kins. Brahmin treats them

NIRMAN, Maharashtra. Page 17
as untouchable. Ramoshi performance religious practices with the Chief Assistance of “Gurav
from Lingayat community Pitar Puja is prevalent in them. They believe of rebirth of man.
Colloquial Language of Ramoshi
Ramoshi are having Marathi as thir mother tongue. In order to have convenience of crime they
speak code language. Right now many of the Ramoshi converse in code language.they call
“Parushi” for this code language. The composition “parushi” consits the combination of origin
of Marathi and Kannad language.
Marriage System of Ramoshi
The valid and prevalent age for marriage is 5 to 30 years. Either in childhood the marriages of
girls are prevalent father of the bridegroom demand for bride. Long age bridegroom party had
to pa Rs. 50 to 150 as a value of ride, striking of beetlenut is a milestone function of marriage.
In joint meet of both parties of bridegroom and bride plans about da of marriage ceremony.
Previous day of marriage concerns to massaging the body of bride and bridegroom by turmeric
solution separately at their own place by aragng special function of ritual. They bring five plants
of jowar or bajara and tie together and place close to God of home and sprinkle water on that.
They keep betel nut in front of goddess. Bavani, Navlai etc. and worship by haldi kumkum.
There after they kill goat and offers meal and alcohol to guest. All these rituals are practiced at
their own place of bride and bridegroom.
On the day of marriage by wearing new dress, head crown (Bashing) and handling a katiyar ( a
special kind of ion made arm) bridge groom goes to place to bride on the border of brides
village a man from Mahar caste welcomes and greets by Puja arti in return Mahar gets dress,
subsequently bridegroom visits first Maruti temple and enters to marrage place where he and
bride stand on reap of rice. Tey face each other while standing. All guest, kith and kins wish to
bride and bridegroom by manglastaka along with sprinkling rice granules. Thereafter they
conduct eating programme of meat and alcohol Jangam carries out advocacy of marriage
function are ritual.
NIRMAN, Maharashtra. Page 18
In Ramoshi community widower are liable for remarriage and they are permitted to do so by
their Jat Panchayat. These marriages are conducted at night and only in presence of ment.
Bachelors are nt allowed to marry a widow. Divorce can be taken by consultation of relatives
and elder Panch leader of community. They bestowed boy as aWaghya and girl as a”Murli” to
god Khondoba for its life long care.
Jat-Panchayat of Ramoshi
It has definite practice and status of Jat-Panchayat of community leaders (Panch) of community
performs judicial justice. Usually Naik or Patil is the Chief Head of Community.
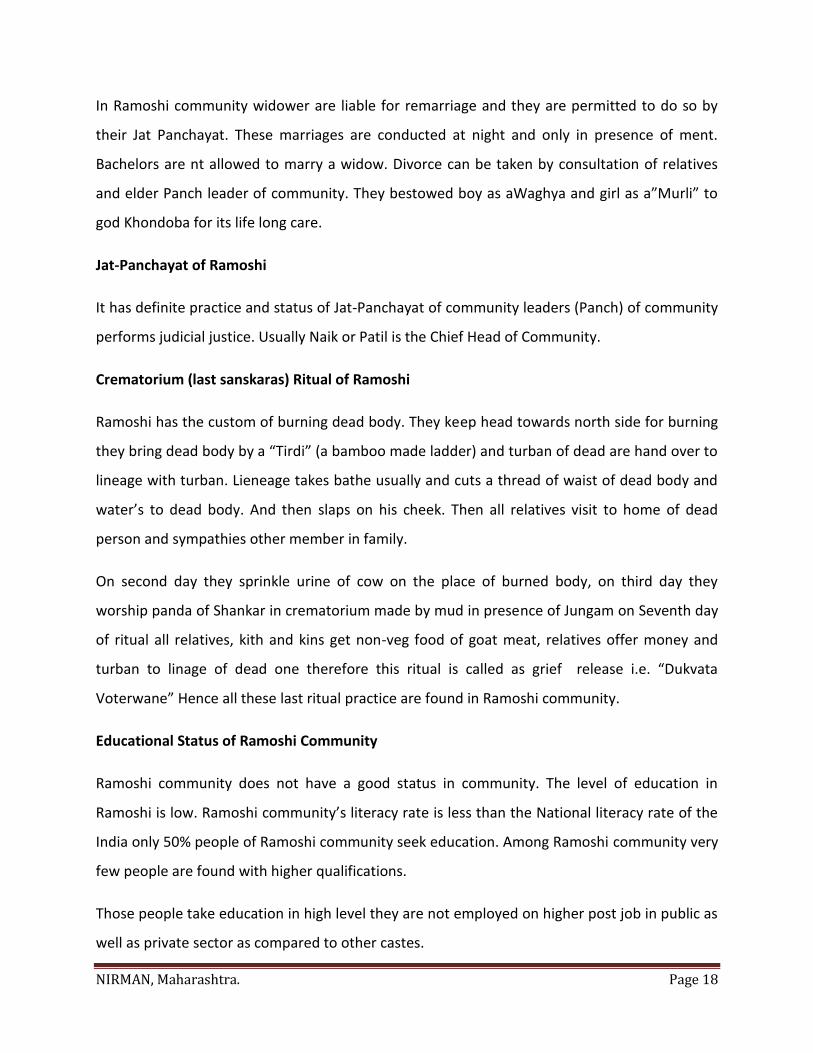
Crematorium (last sanskaras) Ritual of Ramoshi
Ramoshi has the custom of burning dead body. They keep head towards north side for burning
they bring dead body by a “Tirdi” (a bamboo made ladder) and turban of dead are hand over to
lineage with turban. Lieneage takes bathe usually and cuts a thread of waist of dead body and
water’s to dead body. And then slaps on his cheek. Then all relatives visit to home of dead
person and sympathies other member in family.
On second day they sprinkle urine of cow on the place of burned body, on third day they
worship panda of Shankar in crematorium made by mud in presence of Jungam on Seventh day
of ritual all relatives, kith and kins get non-veg food of goat meat, relatives offer money and
turban to linage of dead one therefore this ritual is called as grief release i.e. “Dukvata
Voterwane” Hence all these last ritual practice are found in Ramoshi community.
Educational Status of Ramoshi Community
Ramoshi community does not have a good status in community. The level of education in
Ramoshi is low. Ramoshi community’s literacy rate is less than the National literacy rate of the
India only 50% people of Ramoshi community seek education. Among Ramoshi community very
few people are found with higher qualifications.
Those people take education in high level they are not employed on higher post job in public as
well as private sector as compared to other castes.
NIRMAN, Maharashtra. Page 19
Chapter II
RESEARCH METHODOLOGY
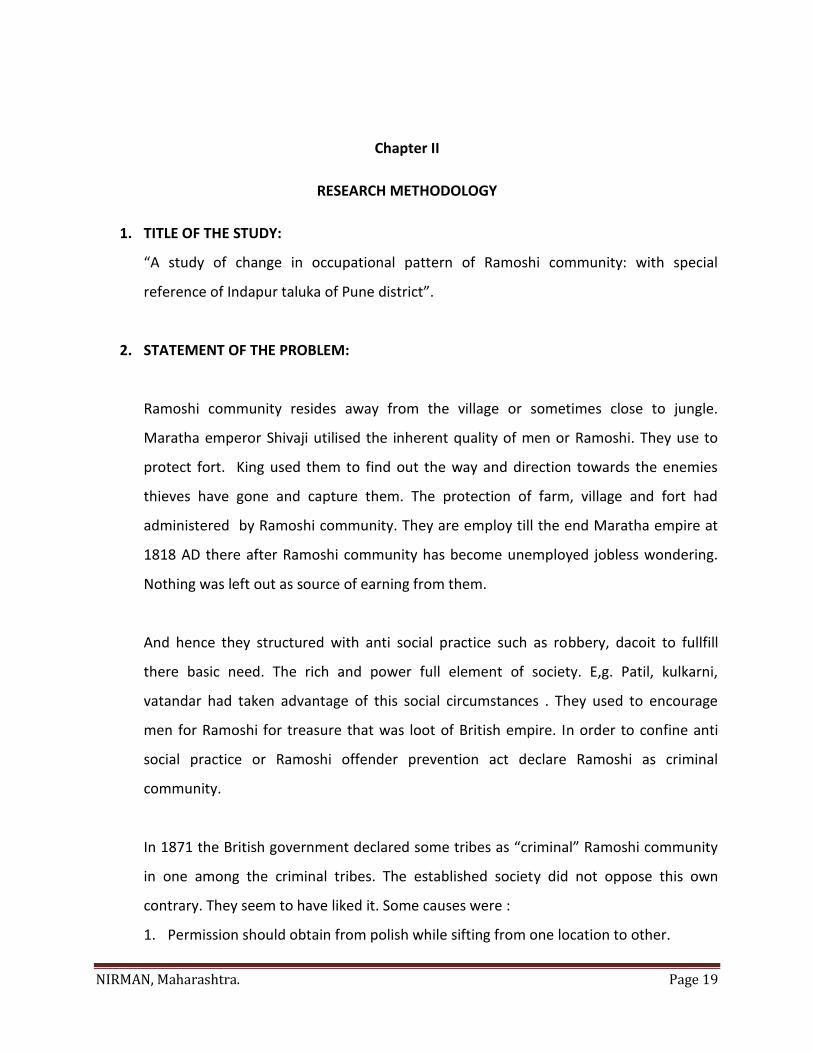
1. TITLE OF THE STUDY:
“A study of change in occupational pattern of Ramoshi community: with special
reference of Indapur taluka of Pune district”.
2. STATEMENT OF THE PROBLEM:
Ramoshi community resides away from the village or sometimes close to jungle.
Maratha emperor Shivaji utilised the inherent quality of men or Ramoshi. They use to
protect fort. King used them to find out the way and direction towards the enemies
thieves have gone and capture them. The protection of farm, village and fort had
administered by Ramoshi community. They are employ till the end Maratha empire at
1818 AD there after Ramoshi community has become unemployed jobless wondering.
Nothing was left out as source of earning from them.
And hence they structured with anti social practice such as robbery, dacoit to fullfill
there basic need. The rich and power full element of society. E,g. Patil, kulkarni,
vatandar had taken advantage of this social circumstances . They used to encourage
men for Ramoshi for treasure that was loot of British empire. In order to confine anti
social practice or Ramoshi offender prevention act declare Ramoshi as criminal
community.
In 1871 the British government declared some tribes as “criminal” Ramoshi community
in one among the criminal tribes. The established society did not oppose this own
contrary. They seem to have liked it. Some causes were :
1. Permission should obtain from polish while sifting from one location to other.

NIRMAN, Maharashtra. Page 20
2. Government could send the group of people outside the boundary of ascertain.
3. Government got the right to form settlement and the keep the group there.
The time of land distribution Ramoshi community got the land and that land is not
fertile without water because majority Ramoshi got unfertile land. Ramoshi community
[population increased day by day. But land is nit increasing. So they are marginalised
farmer and another made by land lees labour in the resent past Many people of the
Ramoshi community have left their traditional occupational and nomadic life style. They
are selecting down in nearby village or also in the village. Some of them have purchased
the fertile land started agriculture and some are doing laboured work this change has
occurred in last 20 -25 years. The new generation is not willing to carry forward the
traditional occupation due to various reasons. Some people are still in to traditional
practice.
3. SIGNIFICANCE OF THE STUDY.
The study will look in to theoccupational and life style of Ramoshi community of indapur
taluka of Pune district. There are very few studies done with Ramoshi community.
Earlier studies are mostly done on the social and cultural life of the community. Very
few studies have covered the economic and occupational aspect also they have not
looked in to the depth.
The finding of the study can be help for the organisation which are working with
Ramoshi community, (e.g. Nirman, Manusaki) to plan there future intervention.
The finding of the study can help the government to important some good project for
Ramoshi community for their development. Also this study can be help full for
researcher to understand the life style or Ramoshi community and their occupational
pattern.
The student researcher belongs to the Indapur taluka of Pune district and he has
personal interest to work with the Ramoshi community. The study helped him to

NIRMAN, Maharashtra. Page 21
understand the Ramoshi community in depth or directly interest to work with them in
future.
4. DISCUSSION ON ETHICAL CONCERNS AND HOW THEY WILL BE ADDRESSE.
The will ethical values in the research as follows:
1. The references used by the researcher will be mentioned the in sources of
information.
2. The data will be collected with the prior permission of respondents after giving
them information about the research purpose, issues and questions in research
tool.
3. The data collected is used for the academic purpose.
4. The respondents personal information will be kept confidential.
5. REVIEW OF RELATED LITARATURE:
I) Vimuktayan by Laxman Mane
Vimuktayan book tell about the origin of Ramoshi community. It says that the Ramoshi
community came from neighbouring Karnataka state. Laxman mane author of
vimuktayan conducted a sociological study of nomadic tribes of Maharashtra. He made
and attempt to study all the nomadic tribes found in Maharashtra in detail. The focus
group discussion conducted by him could bring out all the real information of Nomadic
tribe. He shared his personal experience while conducted this study. This is one of the
major book written by him about Nomadic and Denotified tribe.
The author is also include in this book about the historical perspectives of Ramoshi
community. Surname of Ramoshi community , culture/ religious life of Ramoshi
community , colloquial language of Ramoshi, marriage system of Ramoshi, Jat panchayat
of Ramoshi, crematorium ritual no0f Ramoshi. Educational status of Ramoshi
community, cultural problems faced by Ramoshi community.
NIRMAN, Maharashtra. Page 22
ii)DARKOS………..DAR MUKKAM……….PALNIVASHI………….BHATAKYA JAMATI by
Motiraj Rathod.
DARKOS………..DAR MUKKAM………..PALNIVASHI………….BHATAKYA JAMATI book tells
about the festival of Ramoshi community, jatpanchayat of Ramoshi community, present
condition of Ramoshi community.
Ramoshi community is celebrating all Hindu festival. This commu nity is God worship.
They are superstitious. Addiction is very high in this community. In case of any conflict in
the communjty, they are solved by jat panchayat. State government of Maharashtra has
included this community in vimukta jamati category.
6. SCOP OF THE STUDY:
The study will be conducted with Ramoshi community in the Indapur taluka of Pune
district. It will study the occupational pattern of Ramoshi community and the change
that is taking place in the present time. Perception of the community people about this
change will be studied.
This study will be conducted in six villages of indapur taluka of Pune district.
Respondents include the members of the Ramoshi community and community leaders
etc.
7. UNDERLING THE STUDY ASSUMPTION:
1. No person is born as a criminal it is the society makes people criminals
2. Human being is going to change when they get conducive environment.
8. OBJECTIVES OF THE STUDY:
1. To study the educational condition of Ramoshi community.
2. To understand the social status of Ramoshi community.
3. To study the historical (traditional) aspects of occupation of Ramoshi community.

NIRMAN, Maharashtra. Page 23
4. To study the reason of change in occupational pattern of Ramoshi community.
5. To know the perception of Ramoshi community people about changing occupational
pattern.
9. HYPOTHESES:
1. Change of time has brought change in occupational pattern.
2. Education has led the Ramoshi community to change in their traditional occupation.
3. Change in occupation pattern has led the Ramoshi community to live a settled life.
10. RESEARCH QUESTION:
1. What are the factors that led to the change in the occupational pattern?
2. What are the changes that have occurred in the traditional occupational pattern in
thee Ramoshi community?
3. How these changes have affected on the life of Ramoshi community?
4. What Ramoshi community thinks about this changes in their occupational patterns?
11. KEY VARIABLES:
Independent Dependent
Education nature of Occupation
Change in occupation Professional pattern
Occupational pattern Status of life
Perception of people.
NIRMAN, Maharashtra. Page 24
12.OPERATIONAL DEFINATION OF CONCEPTS:
1. Ramoshi community:
Ramoshi community oriented from the southern culture in Indian constitution included
this community in the VJNT categories. This community identified another name in
other state like Boya, Begad, talwar and Urdan.
2. Change in occupational pattern:
To refer to shift occupation of security of village to settled way of life and shifted to new
occupation(agriculture, labouretc.,) or mixture of oldand new occupation.
13.ITEMS INFORMTION IN THE STUDY:
A. The community:
1. The Education of respondents.
2. The age of respondents.
B. occupation related:
1. the current occupation
2. Old occupation.
3. reasons for change in occupation.
4. perception about the change.
14. ANALYSIS PLAN:
The student researcher will be analyzing the historical traditional aspect of occupation
of Ramoshi community, reason of change in occupational pattern, perception of

NIRMAN, Maharashtra. Page 25
Ramoshi community people about their changing occupational pattern, understand the
educational condition of Ramoshi community and social status of Ramoshi community.
The student researcher is also using diagram and statistic for the analysis of the data.
15. RESEARCH METHODOLGY:
A. Research design
The study was conducted among Ramoshi community. Study tried to find the reasons for
change in occupation within the Ramoshi community and also the change in their attitude
about old occupation pattern. The study tried to find out known fact of Ramoshi community
and therefore it was an exploratory study. The study was also aimed at understanding
current pattern of occupation so it was descriptive as well.
This study was explorative descriptive.
B. Research methods:
The study was done with whole Ramoshi community. Different aspects of the
community were studied. This study was done through survey as research method.
16. SAMPLING DESIGN:
A. Universe:
Members of Ramoshi community and also community leaders from six
villages(Gotondi, Pitkeshwar, Kati, Bidsinge, Khoruchi Lasurne) of indapur taluka of
pune district,
B.Sample size:
Sample size was sixty community members (with the new profession and with the
old profession) from six village of Indapur taluka.
NIRMAN, Maharashtra. Page 26
C. Method of sampling:
Purposive sampling was done for selection of village and six villages having highest
Ramoshi population will be selected.
Random sampling: Respondents were selected randomly from the list. (list will be
obtained from grampanchayat)
D. techniques of sampling:
Student researcher was use non probability sampling technique.
17. SOURCE OF DATA.
A. Primary source:
1. Respondents.
2. Community leaders
3. Observations.
B. Secondary source:
1. Panchayat records of village.
2. Revenue records of the village.
3. Research and studies conducted bon this topic/ subject.
c. Methods of data collection:
Interview through structured interview schedule.
18. TOOL FOR DATA COLLECTION:
Interview schedule: this include two type of interview schedule.
NIRMAN, Maharashtra. Page 27
1. For respondents.
2. For community leaders.
19. LIMITATION OF THE STUDY:
1. During data collection, the people were talking to me only when some one was with
me from that community.
2. When the student researcher was talking the interview of the women respondents,
many often it was the family members who speak more rather than the women.

NIRMAN, Maharashtra. Page 28
Chapter III: Data Analysis and Findings
TABULATION AND ANALYSIS
Introduction to Tabulation and analysis
Thus study is focusing on the changes that are happening in traditional occupation pattern of
Ramoshi community. Study is also looking in to reason for these changes and opinion of the
community about these changes. Data collected during the study is analyzed and presented in
this chapter. Data is analyzed to know the opinion of the respondents and on the basis of that
opinion doing the finding of the study.
The tabulation and analysis of the study is divided in to two areas, such as community people
analysis and community leader’s analysis. Community people analysis is divided in four areas.
First is respondent’s profile and socio economic background of respondents followed by
occupational pattern and changes occurred in traditional occupation pattern, reason for change
in occupation, relation with other people. Second is community leader’s opinion about the
change in occupation.
In basic profile of the respondents, area where study is done, sex of respondents, family
information, education level, yearly income, land, economic level, in Ramoshi community is
explained. In occupational pattern and changes occurred in traditional
Occupation pattern explained such as land holders, how many acres land, type of land, type of
crop, resource of income, annual income, manage home expenses, provision to manage home
expenses. In reason for change in occupation, explained such as change in occupation, reason
for change in occupation, ancestors doing same occupation, shift from traditional occupation,
type of job, period of traditional occupation, liking traditional occupation, reason for liking or
not liking occupation, present occupation and its reason for liking and not liking it, how many
generation not following ancestral occupation, people reaction towards the occupation, change
in occupation develop the social status etc. In relation with other community explained,
NIRMAN, Maharashtra. Page 29
relation with other people, membership, position in family, status in village, benefit got from
membership, reason for not being members of such organization, representative in
Grampanchayat, demand fulfill by the Grampanchayat, participation in decision making,
attitude of Grampanchayat members, accepted by other community members, participation f
other community members in the programme, stigma attached with community, suggestion to
improve socio economic status of Ramoshi community. In second areas explained community
leaders opinion.
The data in each section is presented in the form of independents statements, merged
statement, univariate and bivariate table. Data is also presented in the for of diagrams. The
perentage of univiarate vtable is calculated from the total frequency in relation with the total
number f respondents. Detailed description and analysis of each table is given.
NIRMAN, Maharashtra. Page 30
I) COMMUNITY PEOPE ANALYSIS:
a) Basic profile of the respondents:
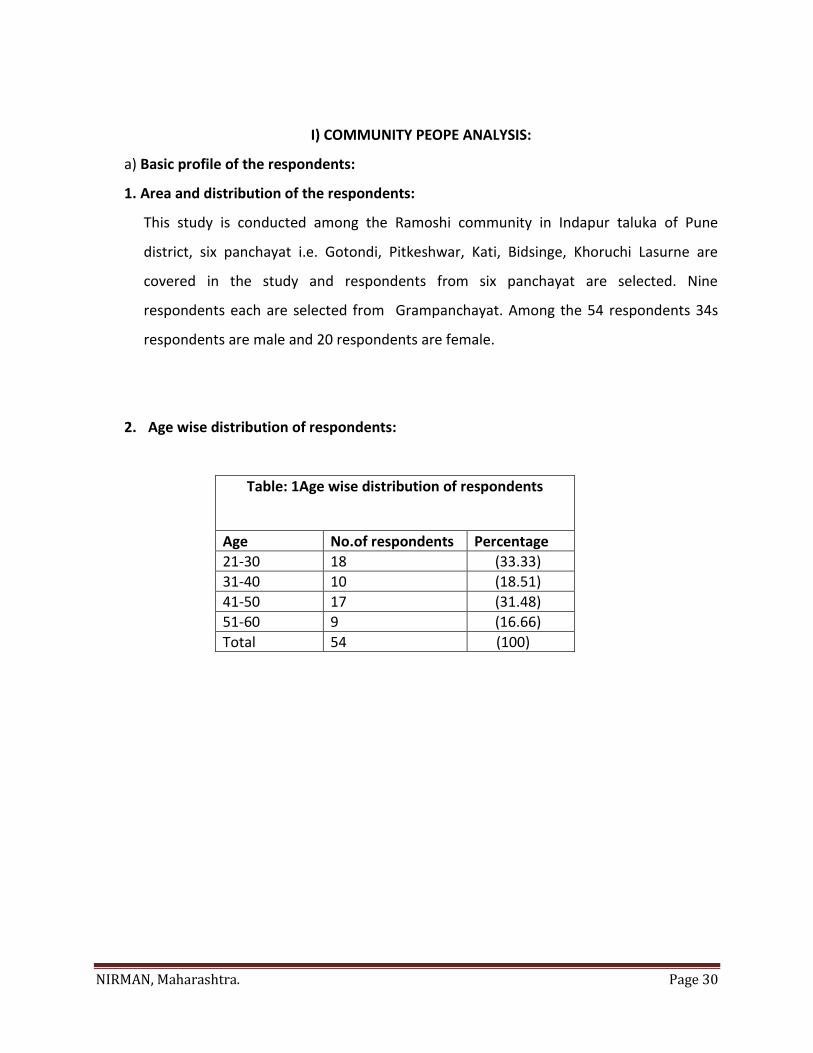
1. Area and distribution of the respondents:
This study is conducted among the Ramoshi community in Indapur taluka of Pune
district, six panchayat i.e. Gotondi, Pitkeshwar, Kati, Bidsinge, Khoruchi Lasurne are
covered in the study and respondents from six panchayat are selected. Nine
respondents each are selected from Grampanchayat. Among the 54 respondents 34s
respondents are male and 20 respondents are female.
2. Age wise distribution of respondents:
Table: 1Age wise distribution of respondents
Age No.of respondents Percentage
21-30 18 (33.33)
31-40 10 (18.51)
41-50 17 (31.48)
51-60 9 (16.66)
Total 54 (100)

NIRMAN, Maharashtra. Page 31
Range of the respondents varies from 21 years to 60 years and among that they are divided in
four categories, 18 (33.33%) respondents belong to first categories i.e. between 21 to 30 years,
10(18 51%) respondents are between the age group of 31 to 40, 17 (31.48%) respondents are
between the age group of 41 to 50, and 9(16.66% ) respondents are from the age group of 51
to 60 years. The age group between 31 to 50 years, this age group are earning group in the
family. Basically family is depends on this age group.
33%
19%
31%
17%
Chart 1: Age wise distribution of respondents
21-30 31-40

NIRMAN, Maharashtra. Page 32
3. Education wise distribution of respondents:
Table 2: Education wise distribution of respondents
Education NO.of respondents
percentage
Illiterate 27 (50.00)
Primary 12 (22.22)
Secondary 07 (12.96)
Higher secondary 02 (3.70)
Graduate 03 (5.55)
Any other 03 (5.55)
Total 54
(100)
The table shows that the majority of the respondents, 27 ( 50%) respondents are
illiterate, majority respondents are the illiterate, 12(22.22%) respondents are educated
up to primary, 7(12.96%) respondents educated up to secondary, 2(3.70%) respondents
educated up to higher secondary, 3 (5.55%) respondents educated up to graduate, and
27
12
7
2 3 3
0
5
10
15
20
25
30
Chart 2:Education of respondents
IlliteratePrimarySecondaryHigher secondaryGraduateAny other

NIRMAN, Maharashtra. Page 33
3(5.55%) respondents are doing the D.Ed, I.T.I. maximum respondents are illiterate.
And very few members are taking education till graduation.
4. Marital status of the respondents:
Table 3: Marital status of the respondents
Marital status
No.of respondents percentage
Married 45 (83.33)
Unmarried 09 (16.66)
Total 54 (100)
The above table shows that the marital status of the respondents, among the total
respondents 45(83.33%) respondents are married and 9(16.66%) respondents are
unmarried. The responsibility of running the family is on the married person, they are
doing some type of occupation and try to manage home expenses.
45
9
Chart 3: Marital status
Married

NIRMAN, Maharashtra. Page 34
5. Occupation of the respondents
Table 4: Occupation of the respondents
Occupation Noof respondents
Percentage
Providing protection to farm
02 (3.70)
Daily wage earner 14 (25.92)
Farmer 13 (24.07)
Housewife 15 (27.77)
Service 07 (12.96)
Not working/ unemployment
03 (5.55)
Totals 54 (100)
The above table shows that occupation of respondents, among the total respondents
2(3.70%) respondents are doing providing protection to farm, 14(25.92%) respondents
are daily wage worker, 13(24.07%) respondents are farmers, 15(27.77%) are the house
2
14 1315
7
30
2
4
6
8
10
12
14
16
Chart 4: Occupation
Ocupation

NIRMAN, Maharashtra. Page 35
wives, 7 (12.96%) respondents are in service, 3(5.55%) respondents are not working.
People occupation shows their social status and also economic condition, economic
condition also depend on the occupation of people, among the respondents daily
wages earner and farmers are the more.
6. Family information:
The above table shows that the Family information of the respondents and relation
between education, sex and age, among the total respondents one male respondents
are illiterate between the age group 1 to 20, 16 male respondents are educated up to
primary between the age group 1 to 20 years, 7 male respondents are educated up to
primary between the age group 21 to 40 years, 4 female respondents are educated up
to primary between the age group 21 to 40 years old. 7 male respondents are educated
up to primary between the age group 41 to 60 years old. 7 female respondents are the
educated up to primary between the age group 41 to 60 years old. 3 male respondents
Table 5: Family information
Education Age
Illiterate
Primary
Secondary
Higher secondary
Graduate
Any other
Total
M F M F M F M F M F M F
1 to 20 1 (1.85%)
- 16 (29.62%)
1 (1.85%)
- - - - 1 (1.85%)
- - - 19 (35.18%)
21 to 40 - - 7 (12.96%)
4 (7.40%)
- - - - - - - - 11 (20.37%)
41 to 60 - 1 (1.85%)
7 (12.96%)
7 (12.96%)
- - - - - - - - 15 (27.77%)
Above 60.
1 (1.85%)
3 (5.55%)
5 (9.25%)
- - - - - - - - 9 (16.66%)
Total 2 (3.70%)
1 (1.85%)
33 (61.11%)
17 - - - - 1 (1.85%)
- - - 54

NIRMAN, Maharashtra. Page 36
are the educated up to primary who are above the 60 years old. Among the total
respondents, there are only one respondents who are educated up to graduate.
Here clearly indicate that more male are educated rather than female between the age
group 1 to 20 years old.
b) Ocupational pattern and changes occurred in traditional occupation pattern
7. land holders :
Table 6 : land holders
Land No.of respondents
percentage
Have land 32 (59.25)
Not land 22 (40.74)
Total 54 (100)
32
22
Chart 5: land holders
Have land

NIRMAN, Maharashtra. Page 37
Land is one of the economic sources, among the total respondents 33(61.11%)
respondents have their own land, and 21(38.88%) respondents have not their own land.
Maximum people don’t have their own land; land is the most important economic
source of people.
8. How many acres land
(Multiple respondents)
Table 7: How many acres land
How many acres land No.of respondents percentage
1 to 5 30 (55.55)
5 to 10 03 (5.55)
Among the total respondents 33 respondents have their own land, among these total
respondents 30 respondents i.e. 55.55% respondents have land between the 1 to 5 acre
land and 3 respondents 5.55% respondents have 5 to 10 acres land. Maximum
respondents are small land holders, only few people have more land.
NIRMAN, Maharashtra. Page 38
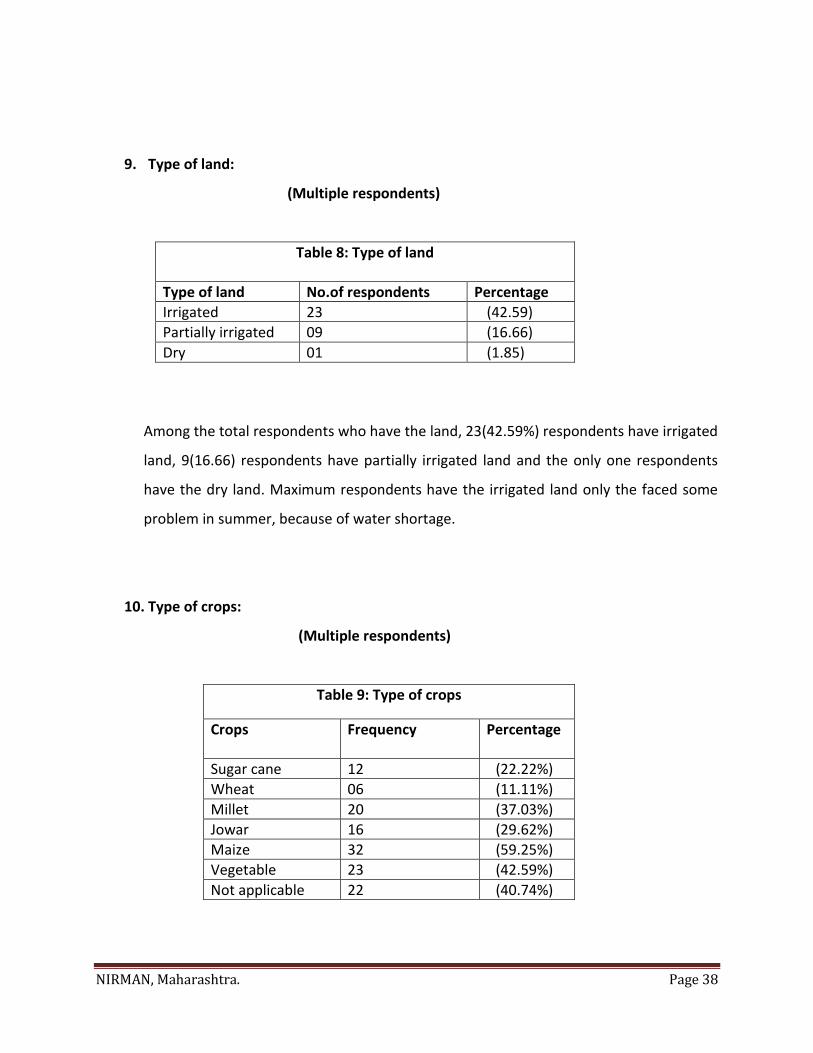
9. Type of land:
(Multiple respondents)
Table 8: Type of land
Type of land No.of respondents Percentage
Irrigated 23 (42.59)
Partially irrigated 09 (16.66)
Dry 01 (1.85)
Among the total respondents who have the land, 23(42.59%) respondents have irrigated
land, 9(16.66) respondents have partially irrigated land and the only one respondents
have the dry land. Maximum respondents have the irrigated land only the faced some
problem in summer, because of water shortage.
10. Type of crops:
(Multiple respondents)
Table 9: Type of crops
Crops Frequency Percentage
Sugar cane 12 (22.22%)
Wheat 06 (11.11%)
Millet 20 (37.03%)
Jowar 16 (29.62%)
Maize 32 (59.25%)
Vegetable 23 (42.59%)
Not applicable 22 (40.74%)

NIRMAN, Maharashtra. Page 39
The above table shows that the 12(22.22%) of the total respondents grow sugar cane,
6(11.11%) of the total respondents grow the wheat, 20(37.03%) respondents of the total
respondents grow the millet, 16(29.62%) respondents are growing jowar, 32(59.25%)
respondents of the total respondents are growing maize, 23(42.59%) respondents of the total
respondents are growing the vegetables. Here maximum people are growing the maize in their
agriculture, then majority farmer are taking the vegetable in the agriculture. Crops type is also
depend on the type of land so there is land utilized for the maize and vegetable.
Maize is the crop which is cultivated by majority of the respondents.
11. Income from crops
Table 10: Income from crops
Income from crops No. of respondents percentage
Less than 15 thousand 11 (20.37)
20 to 30 thousand 15 (27.77)
30 to 40 thousand 05 (9.25)
Above 50 thousand 01 (1.85)
Not applicable 22 (40.74)
Total 54 (100)
Economic
background
of the
respondents
is directly
linked with
the income
of the family
11
15
51
22
Chart 6: Income from crops
Less than 15 thousand20 to 30 thousand
30 to 40 thousand
Above 50 thousand
NIRMAN, Maharashtra. Page 40
and basically farmer’s income also depends on the type of crops.
Income of 11(20.37%)respondents are less than Rs. 15000, 15(27.77%) respondents are having
their income betweens 20000 to 30000, 5(9.25%) respondents are having their income
between 30000 to 40000, and only one respondents i.e. 1.85% respondents are having their
income above the 50000. Among the total respondents, maximum respondent’s income is
having 20000 to 30000.
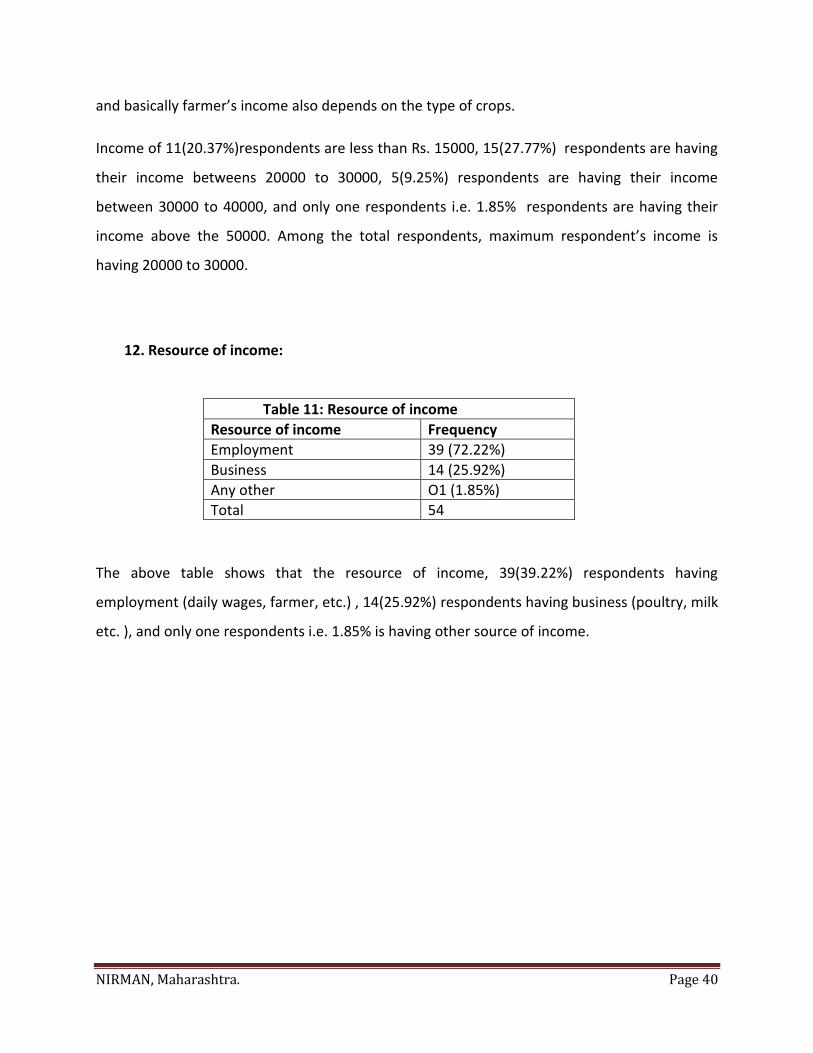
12. Resource of income:
Table 11: Resource of income
Resource of income Frequency
Employment 39 (72.22%)
Business 14 (25.92%)
Any other O1 (1.85%)
Total 54
The above table shows that the resource of income, 39(39.22%) respondents having
employment (daily wages, farmer, etc.) , 14(25.92%) respondents having business (poultry, milk
etc. ), and only one respondents i.e. 1.85% is having other source of income.
NIRMAN, Maharashtra. Page 41
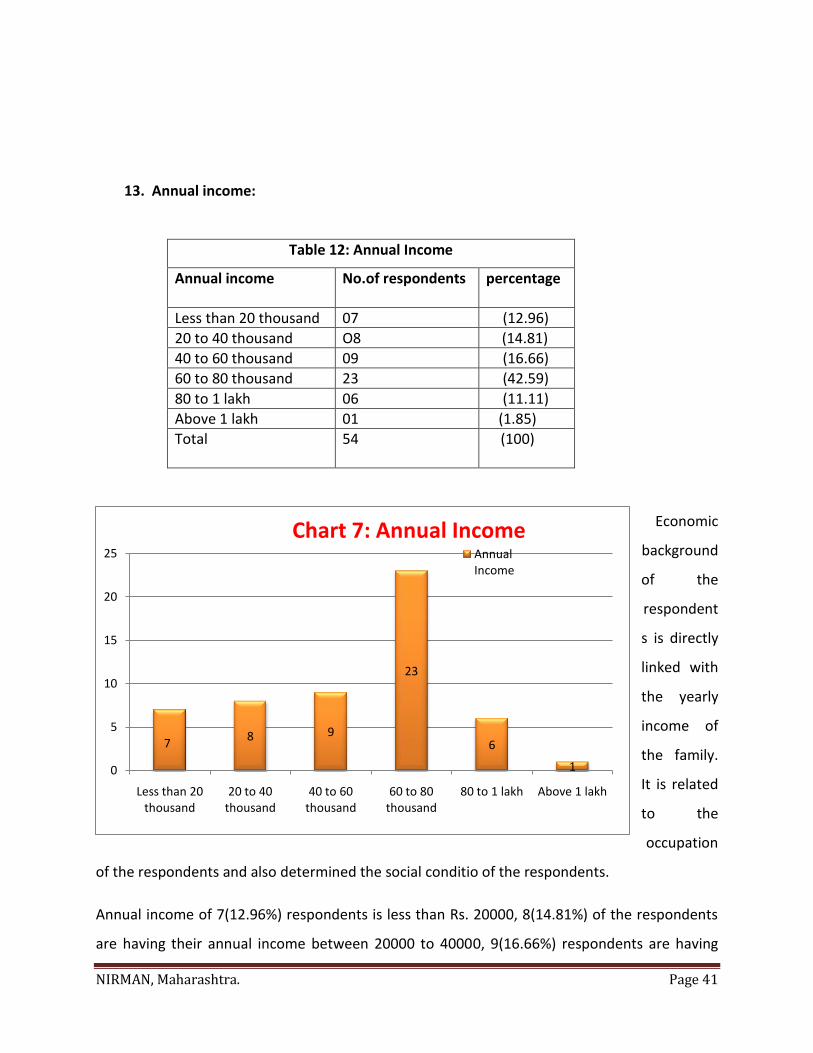
13. Annual income:
Table 12: Annual Income
Annual income No.of respondents
percentage
Less than 20 thousand 07 (12.96)
20 to 40 thousand O8 (14.81)
40 to 60 thousand 09 (16.66)
60 to 80 thousand 23 (42.59)
80 to 1 lakh 06 (11.11)
Above 1 lakh 01 (1.85)
Total 54 (100)
Economic
background
of the
respondent
s is directly
linked with
the yearly
income of
the family.
It is related
to the
occupation
of the respondents and also determined the social conditio of the respondents.
Annual income of 7(12.96%) respondents is less than Rs. 20000, 8(14.81%) of the respondents
are having their annual income between 20000 to 40000, 9(16.66%) respondents are having
78 9
23
6
10
5
10
15
20
25
Less than 20 thousand
20 to 40 thousand
40 to 60 thousand
60 to 80 thousand
80 to 1 lakh Above 1 lakh
Chart 7: Annual IncomeAnnual Income

NIRMAN, Maharashtra. Page 42
annual income between 40000 to 60000, 23(42.59%) respondents are having their annual
income between 80 thousand to one lakh, and only one respondents have their annual income
above one lakh.
14. Manage home expenses:
Table 13: Manage home expenses
Manage home expenses No.of respondents
percentage
Manage expenses 10 (18.51)
Not Manage expenses 44 (81.48)
Total 54 (100)
Home expenses is the depend on the no of family members. Also it is depend on the needs of
family.
10(18.51%) respondents manage their home expenses in annual income, 44(81.48%)
respondents are not able to manage their home expenses in their annual income.
15. Provision to manage home expenses :
Table 14: Provision to manage home expenses
provision to manage home expenses No.of respondents
percentage
By reducing the expenses 03 (5.55%)
By taking loan 07 (12.96%)
Borrowing from other 32 (58.25%)
Doing some additional work 03 (5.55%)
People’s needs are unlimited and he is always trying to fulfil it by making some provisions,
such as reducing the expenses, taking loan, borrowing from other, doing some additional work.
The above shows that the provision to manage home expenses, 3(5.55%) respondents are
manage their home expenses by the reducing the expenses, 7(12.96%) respondents are
NIRMAN, Maharashtra. Page 43
manage their home expenses by taking loan, 32(58.25%) respondents are manage their home
expenses by borrowing from other, 3(5.55%) respondents are manage their home expenses by
doing some additional work.
Table directly shows that maximum 32 respondents i.e. 58.25% are manage their home
expenses by borrowing from other.
c) Reason for change in occupation:
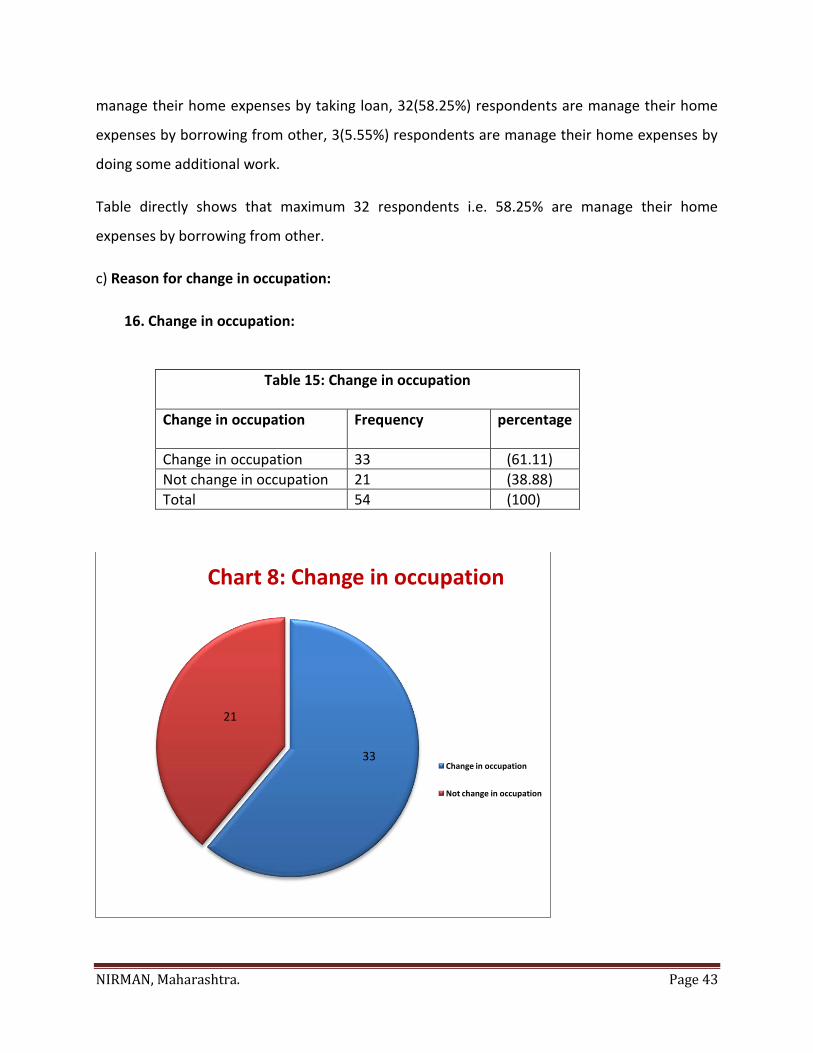
16. Change in occupation:
Table 15: Change in occupation
Change in occupation Frequency
percentage
Change in occupation 33 (61.11)
Not change in occupation 21 (38.88)
Total 54 (100)
33
21
Chart 8: Change in occupation
Change in occupation
Not change in occupation

NIRMAN, Maharashtra. Page 44
We have seen that there is a trend of of change in the occupation pattern of Ramoshi
community and also they are slowly sifting to other profession fully or partly. There is various
reasons for these changes. Such get employment, purchase own land, also change for better
income, not happy with old occupation.
The above table shows that 33(61.11%) respondents had change in occupation, and 21(38.88%)
respondents have not change in their occupation.
17. Reason for change in occupation:
Table 16: Reason for change in occupation
Reason for change in occupation No.of respondents
percentage
Got employment 04 (7.44)
Purchase own land 06 (11.11)
For better income 21 (38.88)
Not happy with old occupation 02 (3.70)
The above table shows that reason for change in occupation, 4(7.44%) respondents are
change their occupation because of got employment, 6(11.11%) respondents are
change their occupation because of purchase own land, 21(38.88%) respondents are
change their occupation for better income, 2(3.07%) respondents are change their
occupation because of they are not happy with old occupation.
18. Ancestor doing same occupation:
Table 17: Ancestor doing same occupation
Ancestor doing same occupation No. of Respondent s
Percentage
Doing same occupation 28 (51.85)
Not doing same occupation 26 (48.14)
Total 54 (100)

NIRMAN, Maharashtra. Page 45
The above table shows that 28(51.85%) respondents are doing same occupation,
26(48.14%) respondents are not doing any occupation.
19. Shift from traditional occupation
People have unlimited needs, and there are minimum resources for fulfilling the needs,
many people change their occupation, among the total respondents, 52(96.29%)
respondents shift from traditional occupation to new occupation. Only two
respondents, i.e. 3.70% respondents are not shift from traditional occupation to new
occupation.
20. Type of job:
Table 18: Type of job
Type of job No.of Respondent Percentage
Daily wages 17 (31.48)
Employment 05 (9.25)
Farmer 32 (61.11)
Total 54 (100)

NIRMAN, Maharashtra. Page 46
People have different type of income sources; income depends on the type of job. The above
table shows that 17(31.48%) respondents are doing daily wages work, 5(9.25%) respondents
have employment, 32(61.11%) respondents are the farmer. Table shows that the maximum
respondents are doing agriculture and their main income sources are agriculture.
21. Period of traditional occupation:
Table 19: Period of traditional occupation
Period of traditional occupation No. of Respondent percentage
One generation 29 (53.85%)
Two generation 25 (46.29%)
Total 54 (100)
Among the total respondents 29(53.85%) respondents were doing traditional
occupation from one generation, 25(46.29%) respondents were doing traditional
occupation from two generation.
Maximum respondents were done traditional occupation from one generation.
17
5
32
0
5
10
15
20
25
30
35
Daily wages Employment Farmer
Chart 9: type of Job
Job
NIRMAN, Maharashtra. Page 47
22. Liking traditional occupation:
Table 20: Liking traditional occupation
Liking traditional occupation
No.of respondents Percentage
Like traditional occupation 16 (29.62%)
Not like traditional occupation 38 (70.37%)
Total 54 (100)
People social status depend on their occupation, Ramoshi communities traditional
occupation is providing protection to farm and providing protection to village. Ramoshi
community people are very believable that why they are select for that work,
The above table shows that 16(29.62%) respondents are like traditional occupation and
38 (70.37%) respondents do not like traditional occupation.
Among the total respondents maximum respondents do not like traditional occupation
means there is no status for traditional occupation of Ramoshi community. This is also
may be reason of change in occupation.
23. If yes, reason:
(Multiple respondents)
Table 21: If yes, reason
If yes, reason No.of respondents
Percentage
Traditional occupation are our identity
13 (24.07)
Our ancestors doing same job we also have to do the same
02 (3.70)
The above table shows that the reason for liking the traditional occupation, 13(24.07%)
respondents like traditional occupation because traditional occupation is their identity.
NIRMAN, Maharashtra. Page 48
2(3.70%) respondents like traditional occupation because of their ancestors were doing
same job that why they also to do the same job.
24. Reasons for not liking:
(Multiple respondents)
Table 22: Reasons for not liking
Reasons for not liking
Frequency Percentage
This traditional job are the employment of old generation not he present
11 (20.37)
Job are our needs are changing with new situations
15 (27.77)
Inadequate income from traditional occupation
13 (24.07)
The above table shows that the reason for not liking the traditional occupation, among
the total respondents, there are some respondents who do not like the traditional
occupation, 11(20.37%) respondents feel this traditional occupation are the
employment of old generation and not the present, 15(27.77%) respondents gave
reason, job are their needs are change with new situations, 13(24.07%) respondents
said traditional occupation give inadequate.
NIRMAN, Maharashtra. Page 49
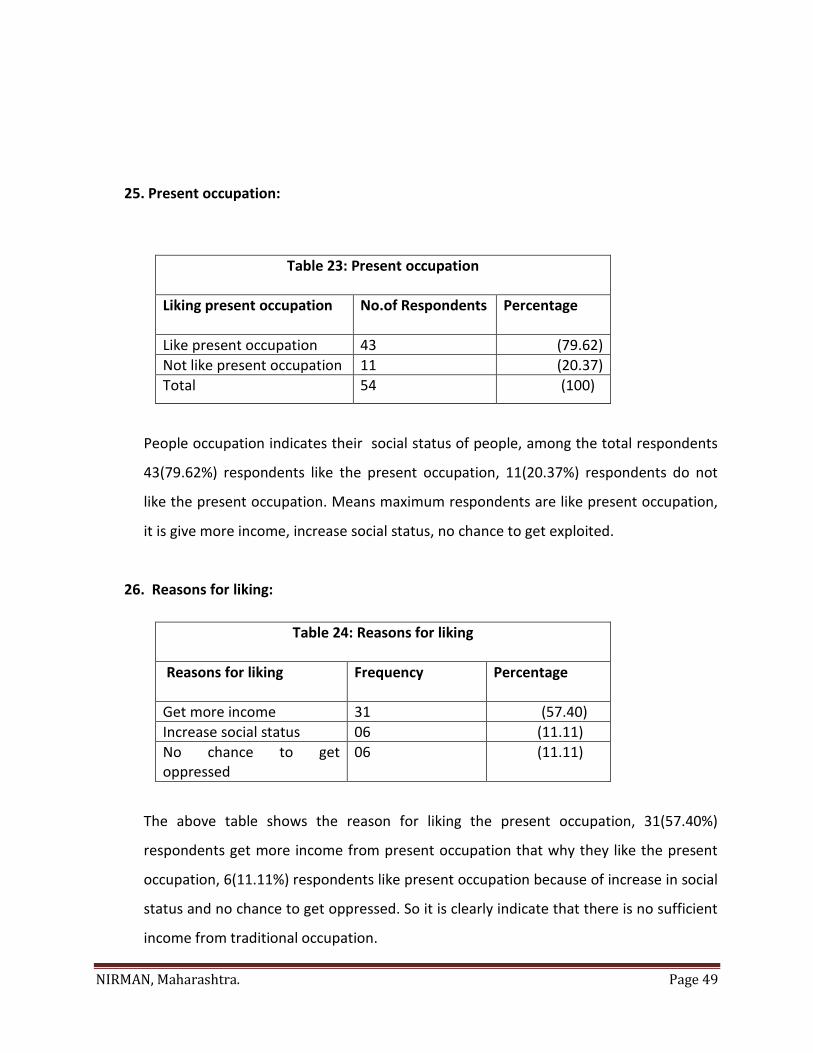
25. Present occupation:
Table 23: Present occupation
Liking present occupation No.of Respondents
Percentage
Like present occupation 43 (79.62)
Not like present occupation 11 (20.37)
Total 54 (100)
People occupation indicates their social status of people, among the total respondents
43(79.62%) respondents like the present occupation, 11(20.37%) respondents do not
like the present occupation. Means maximum respondents are like present occupation,
it is give more income, increase social status, no chance to get exploited.
26. Reasons for liking:
Table 24: Reasons for liking
Reasons for liking
Frequency Percentage
Get more income 31 (57.40)
Increase social status 06 (11.11)
No chance to get oppressed
06 (11.11)
The above table shows the reason for liking the present occupation, 31(57.40%)
respondents get more income from present occupation that why they like the present
occupation, 6(11.11%) respondents like present occupation because of increase in social
status and no chance to get oppressed. So it is clearly indicate that there is no sufficient
income from traditional occupation.

NIRMAN, Maharashtra. Page 50
27. Reasons for not liking:
(Multiple respondents)
Table 25: Reasons for not liking
reasons for not liking
No.of respondents Percentage
Do not get more success 03 (5.55)
Need to work hard and talent
01 (1.85)
No interest 07 (12.96)
The above table shows the reason for not liking the present occupation, among the total
respondents 3(5.55%) respondents gave reason for not liking the present occupation as
they do not get more success, only one respondents gave the reason that is need to
work hard and talent, 7(12.96%) respondents are not interest in present occupation. In
the modern age people do not get more success in occupation there is need for hard
work and talent also need of interest, which is the most important thing for doing
occupation.

NIRMAN, Maharashtra. Page 51
28. How many generations not following ancestral occupations:
Table 26: How many generations not following ancestral occupations
How many generations not following ancestral occupations
Frequency Percentage
One generation 08 (14.81)
Two generation 46 (85.18)
Total 54 (100)
Among the total respondents, 46(85.18%) respondents are not following ancestral
occupation from two generation, and only 8(14.81%) respondents are following
ancestral occupation from one generation.

NIRMAN, Maharashtra. Page 52
29. Peoples reaction towards the present occupation:
Table 27: Peoples reaction towards the present occupation
Peoples reaction towards the present occupation
Frequency Percentage
Respect 22 (40.74)
Underestimate 12 (22.22)
It is the part of the occupation 12 (22.22)
It is based on occupation 07 (12.96)
Don’t know 01 (1.85)
Total 54 (100)
The above table shows that other people reaction towards the present occupation, 22
(40.74%) respondents feel other community people gave respect to the present
occupation, 12(22.22%) respondents fell other community people have underestimate
and they think it is the part of the occupation, 7(12.96%) respondents think it is based
22
12
12
7
1
Chart 10: Peoples reaction towards the present occupation
Respect
Underestimate
It is the part of the occupation
It is based on occupation
Don’t know

NIRMAN, Maharashtra. Page 53
on occupation, and only one respondents don’t know what other people think about
their present occupation. Now there are changing occupation pattern of Ramoshi
community is changing other community people give respect to their present
occupation.
30. Change in occupation ,develop social status:
Social status develop on economic condition of people, occupation, position in the
family and society etc are the components that affected the social status, among the all
respondents 53(98.14%) respondents give their opinion is like that change in occupation
develop social status and only one respondent told that there is no any relation of
change in occupation and social status.
d) Relation with other community:
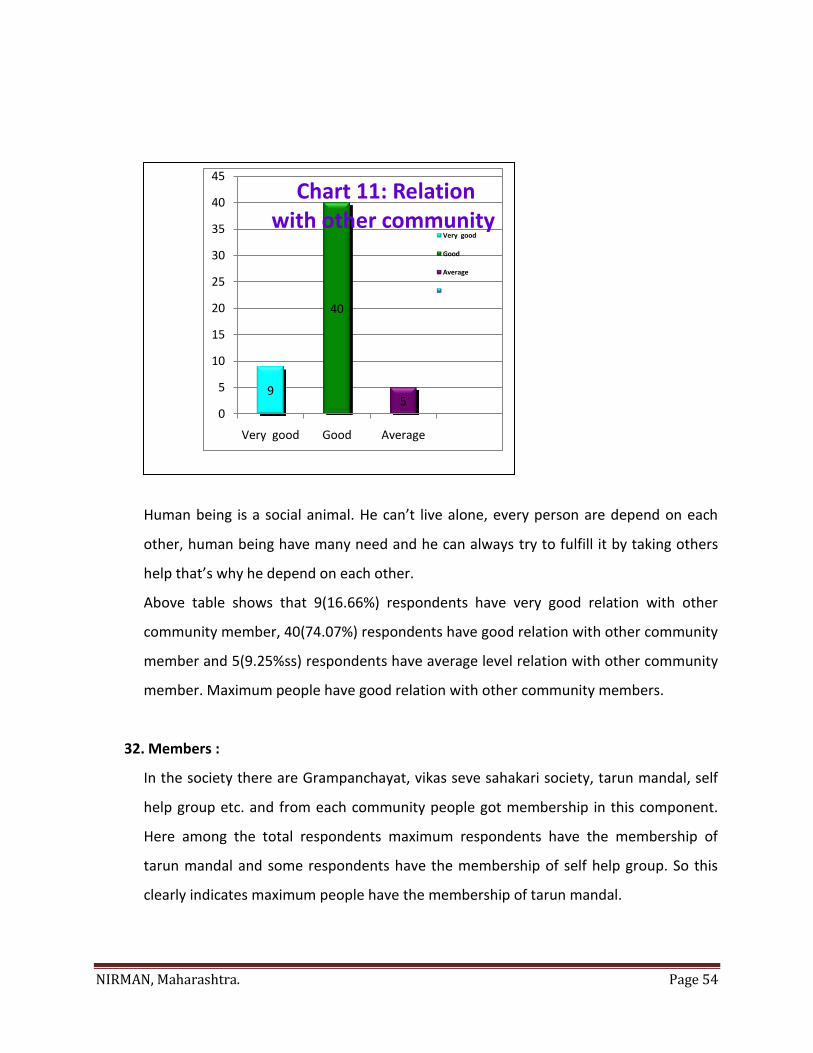
31. Relation with other community:
Table 28: Relation with other community
Relation with other community No.of respondents
Percentage
Very good 09 (16.66)
Good 40 (74.07)
Average 05 (9.25)
Total 54 (100)
NIRMAN, Maharashtra. Page 54
Human being is a social animal. He can’t live alone, every person are depend on each
other, human being have many need and he can always try to fulfill it by taking others
help that’s why he depend on each other.
Above table shows that 9(16.66%) respondents have very good relation with other
community member, 40(74.07%) respondents have good relation with other community
member and 5(9.25%ss) respondents have average level relation with other community
member. Maximum people have good relation with other community members.
32. Members :
In the society there are Grampanchayat, vikas seve sahakari society, tarun mandal, self
help group etc. and from each community people got membership in this component.
Here among the total respondents maximum respondents have the membership of
tarun mandal and some respondents have the membership of self help group. So this
clearly indicates maximum people have the membership of tarun mandal.
9
40
50
5
10
15
20
25
30
35
40
45
Very good Good Average
Chart 11: Relation with other community
Very good
Good
Average
NIRMAN, Maharashtra. Page 55
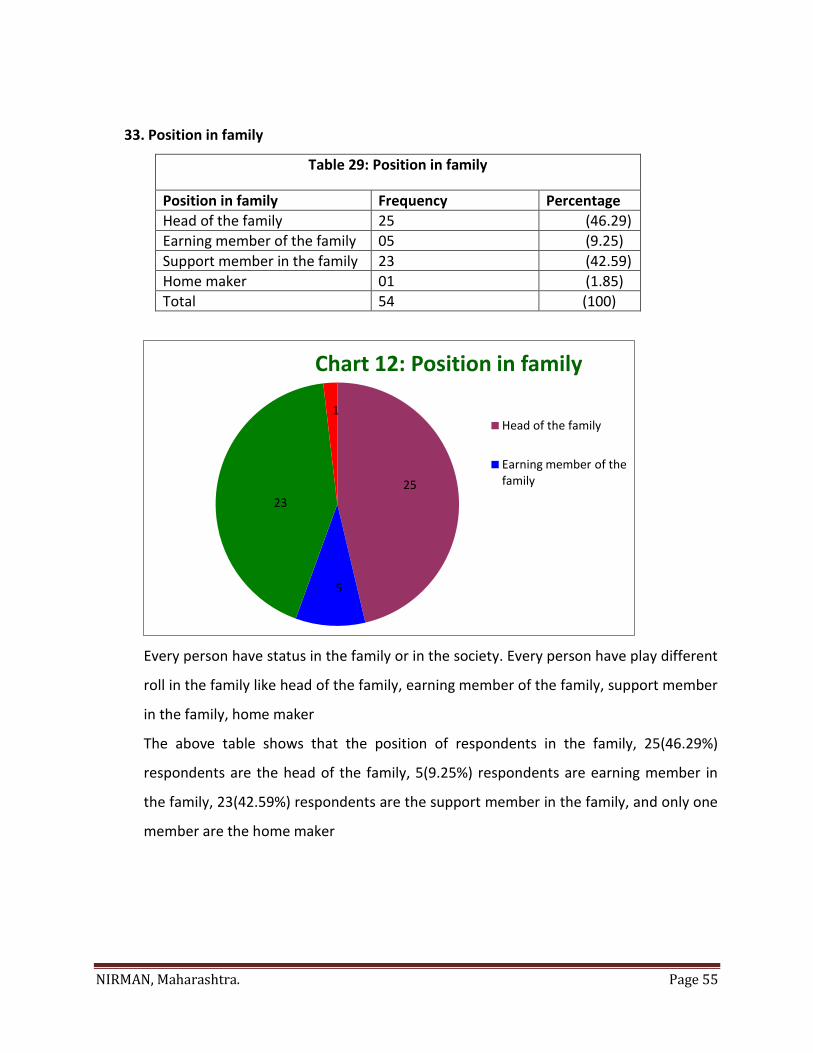
33. Position in family
Table 29: Position in family
Position in family Frequency Percentage
Head of the family 25 (46.29)
Earning member of the family 05 (9.25)
Support member in the family 23 (42.59)
Home maker 01 (1.85)
Total 54 (100)
Every person have status in the family or in the society. Every person have play different
roll in the family like head of the family, earning member of the family, support member
in the family, home maker
The above table shows that the position of respondents in the family, 25(46.29%)
respondents are the head of the family, 5(9.25%) respondents are earning member in
the family, 23(42.59%) respondents are the support member in the family, and only one
member are the home maker
25
5
23
1
Chart 12: Position in family
Head of the family
Earning member of the family
NIRMAN, Maharashtra. Page 56
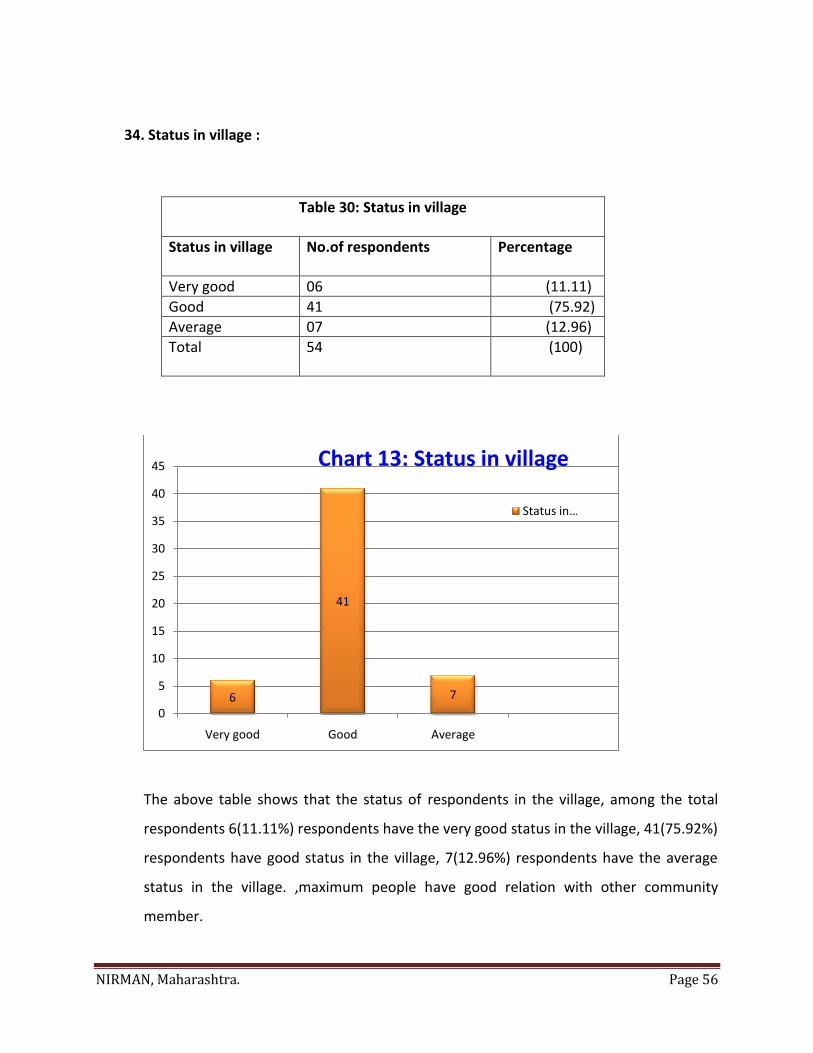
34. Status in village :
Table 30: Status in village
Status in village
No.of respondents Percentage
Very good 06 (11.11)
Good 41 (75.92)
Average 07 (12.96)
Total 54 (100)
The above table shows that the status of respondents in the village, among the total
respondents 6(11.11%) respondents have the very good status in the village, 41(75.92%)
respondents have good status in the village, 7(12.96%) respondents have the average
status in the village. ,maximum people have good relation with other community
member.
6
41
7
0
5
10
15
20
25
30
35
40
45
Very good Good Average
Chart 13: Status in village
Status in …
NIRMAN, Maharashtra. Page 57
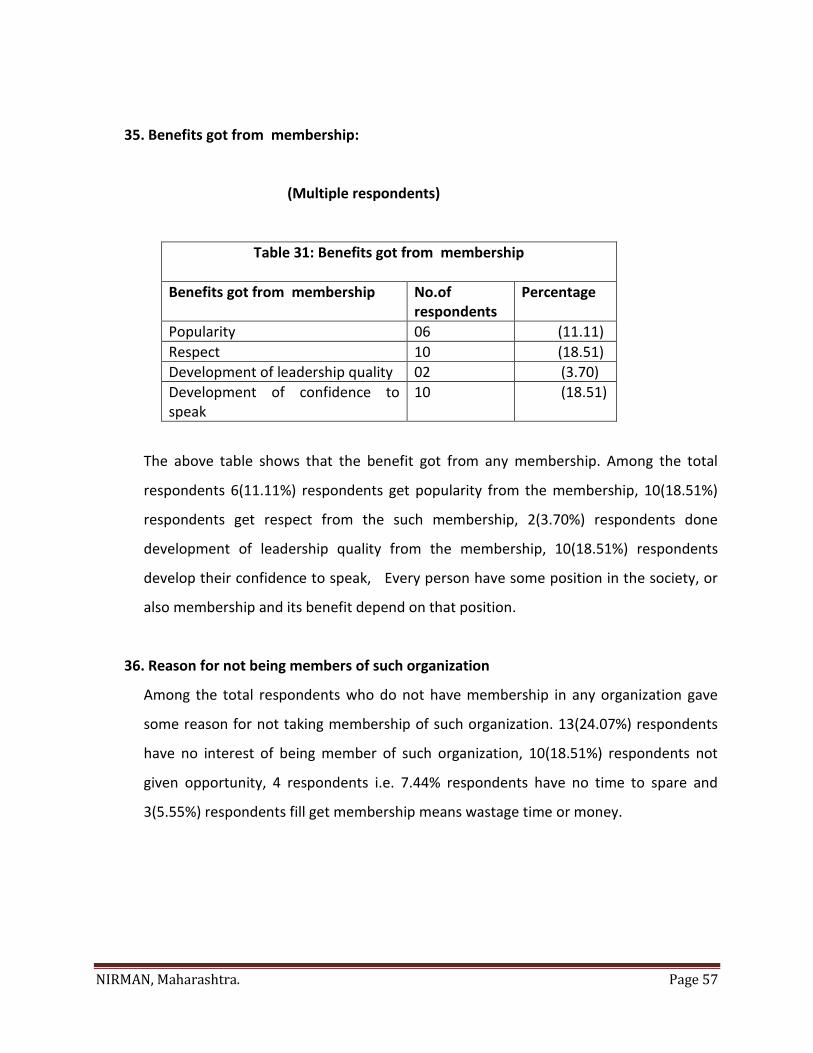
35. Benefits got from membership:
(Multiple respondents)
Table 31: Benefits got from membership
Benefits got from membership No.of respondents
Percentage
Popularity 06 (11.11)
Respect 10 (18.51)
Development of leadership quality 02 (3.70)
Development of confidence to speak
10 (18.51)
The above table shows that the benefit got from any membership. Among the total
respondents 6(11.11%) respondents get popularity from the membership, 10(18.51%)
respondents get respect from the such membership, 2(3.70%) respondents done
development of leadership quality from the membership, 10(18.51%) respondents
develop their confidence to speak, Every person have some position in the society, or
also membership and its benefit depend on that position.
36. Reason for not being members of such organization
Among the total respondents who do not have membership in any organization gave
some reason for not taking membership of such organization. 13(24.07%) respondents
have no interest of being member of such organization, 10(18.51%) respondents not
given opportunity, 4 respondents i.e. 7.44% respondents have no time to spare and
3(5.55%) respondents fill get membership means wastage time or money.

NIRMAN, Maharashtra. Page 58
37. Representative in Grampanchayat
Among the total respondents, maximum respondents fill that, they have their
representation in the Grampanchayat. Or only some respondents fill that, they have no
their representation the Grampanchayat.
38. Demand fulfill by the grampanchayat:
Table 32: Demand fulfill by the Grampanchayat
Demand fulfill by the Grampanchayat
No,of respondents
Percentage
Demand fulfill 47 (87.03)
Not fulfill demand 07 (12.96)
Total 54 (100)
The above table shows that demand fulfill by the grampanchayat, among the total
respondents 47(87.03%) respondents demand fulfill by the grampanchayat and only
7(12.96%)s respondents demand have not fulfill by the grampanchayat. Means the
47
70
Chart 14: Demand fulfilled by the grampanchayat
Demand fulfill
Not fulfill demand

NIRMAN, Maharashtra. Page 59
grampanchayat provide facilities to the Ramoshi community, which is come from
government. Maximum people are happy with the grampanchayat.
39. Participation in decision making
our India is the democratic country and in the democratic country there are every
person have the right of taking participation in the decision making processes, here
among the total respondents, 50% respondents take the participation in the decision
making process of Grampanchayat and 50% respondents are not take the participation
of decision making of the Grampanchayat. Participation in decision like the, which type
of scheme implement for village development like that.
40. Attitude of Grampanchayat members:
Table 33: Attitude of Grampanchayat members
Attitude of Grampanchayat members Frequency Percentage
Indifferent 07 (12.96)
Cooperative 23 (42.59)
Respectful 14 (25.92)
Underestimate 10 (18.51)
Total 54 (100)

NIRMAN, Maharashtra. Page 60
The above table shows that the attitude of grampanchayat members towards Ramoshi
community people, among the total respondents 7(12.96%) respondents gave answer
grampanchayat members attitude is indifferent, 23(42.59%) respondents gave answer
grampanchayat member’s attitude is cooperative, 14(25.92%)respondents gave answer
grampanchayat members attitude is respectful, 10(18.51%)respondents gave answer
grampanchayat members attitude is underestimate.
These data shows that grampanchayat members attitude is well regarding Ramoshi
community. Maximum respondents are the cooperative to ramoshi community.
41. Accepted by other community
There are many cast in our country and there is different status to different cast, various
untouchabilities practices are going on in the society. Among the respondents
52(96.29%) accepted by other community people, they can keep freely relation with
other community people, only few respondents feel they are not accepted by other
community people. It is shows that the now there are untouchability practice going on
that in a low level.
7
2314 10
05
10152025
Chart 15: Attitude of grampanchayat
members
Attitude of grampanchayat members

NIRMAN, Maharashtra. Page 61
42. Participation of other community members in the programme:
Table 34: Participation of other community members in the programme
Participation of other community members in the programme
No.of respondents
Percentage
Very good 08 (14.81)
Good 39 (72.22)
Average 07 (12.96)
Total 54 (100)
The above table shows that the participation of other community member in the
program, among the total respondents 8(14.81%) respondents feel other community
people give very good participation in the program, 39(72.22%) respondents feel other
community people give good participation in the program, and 7(12.96%) respondents
8
39
7
Chart 16: Participation of other community members in the programme Very
goodGood

NIRMAN, Maharashtra. Page 62
feel other community people give average participation in the program. So different
cast people mix each other’s program.
43. What think about stigma attached with community:
Table 35: What think about stigma attached with community
What think about stigma attached with community
No.of respondents Percentage
Get angry 05 (9.25)
To regret 24 (44.44)
Feel shame 17 (31.48)
Impose 08 (14.81)
Total 54 (100)
The above table shows that what Ramoshi community people think about the stigma
attached with Ramoshi community. Among the total respondents 5(9.25%) respondent
get angry when anybody speak about stigma, 24(44.44%) respondents feel regret,
17(31.48%) respondents feel shame and 8(14.81%) respondents imposed by stigma.
Maximum people feel shame and regret, when other people speak regarding the stigma
which is attached to Ramoshi community.
5
2417
8
Chart 17: What think about stigma attached with community
Get angry
To regret
Feel shame
Impose

NIRMAN, Maharashtra. Page 63
44. Suggestion to improve socio economic status:
Table 36: Suggestion to improve socio economic status
Suggestion to improve socio economic status
No.of respondents Percentage
Getting education 13 (24.07)
Doing job 24 (44.44)
Leave addiction 06 (11.11)
Farm the land 11 (20.37)
Total 54 (100)
The above table shows that the suggestion to improve socio economic status of
Ramoshi community, among the total respondents, 13(24.07%) respondents gave
suggestion to getting education, 24(44.44%) respondents gave suggestion, which is
doing job, 6(11.11%) respondents suggest for leave addiction and 11(20.37%)s
respondents suggest for doing good agriculture.
13
24
6
11
0
5
10
15
20
25
30
Getting education Doing job Leave addiction Farm the land
Chart 18: Suggestion to improve socio economic status
Suggestion to improve socio economic status

NIRMAN, Maharashtra. Page 64
46. Relation between the education and status in the village
Table 37: relation between the education and status in the village
status in village
Education
Illterate Primary
Secondary Higher secondery
graduate Any other
Total
Very good
3 (5.55%)
2 (3.70%)
- - 1 (1.85%)
1 (1.85%)
7 (2.96%)
Good 18 (33.33%)
8 (14.81%)
7 (12.96%)
2 (3.70%)
2 (3.70%)
2 (3.70%)
39 (72.22%)
Average 6 (11.11%)
2(3.70%) - - - - 8 (14.81%)
Total 27 (50%)
12 (22.22%)
7 (12.96%)
2 (3.70%)
3 (5.55%)
3 (5.55%)
54 (100%)
0
2
4
6
8
10
12
14
16
18
Illiterate Primary Secondary Higher secondery
Graduate any other
very good
good
Average

NIRMAN, Maharashtra. Page 65
The above table show that the education of respondents and their status in the village, among
the total respondents, 3(5.55%) respondents are illiterate and they have good status in the
village, 18 (33.33%) respondents are illiterate and they have the good status in the village, or
there are 6(11.11%) respondents are also illiterate and they have the average status in the
village. 2(3.70%) respondents are educated up to primary and the have the good status in the
village, 8(14.81%) respondents are educated up to primary and they have the good status in
the village, 2(3.70%) respondents are educated up to primary and they have average status in
the village, among the total respondents 7(12.96%) respondents are educated up to secondary
level and they have the good status in the village, 2(3.70%) respondents are educated up to
secondary and they have the good status in the village. 2(3.70%) respondents are educated up
to higher secondary level and they have the good status in the village, 1(1.85%) respondents
are educated up to the graduate and they have the very god status in the village, 2(3.70%)
respondents are educated up to the graduate and they have the god status in the village.
Among the total respondents, one respondents i.e. 1.85% respondents done other cource and
the have the very good status. Among the total respondents maximum respondents are the
illiterate but the have the very good or good status in the village so not only education is the
most important components of getting status there are also some similar components for
getting the status in the village. There are very few member who is educated up to graduate
they have the very good ststus in the village.

NIRMAN, Maharashtra. Page 66
47. Relation between the people reaction towards present occupation and change in
occupation.
Table 38: Relation between the people reaction towards present occupation and
change in occupation.
Peoples reaction towards present occupation
change in
occupation
Respect
Underestimate
It is the
part of the
occupation
It is based
on
occupation
Don’t
know
Total
Change in
occupation
12
(22.22%)
6
(11.11%)
8
(14.81%)
6
(11.11%)
1
(1.85%)
33
(61.11%)
Not
change in
occupation
10
(18.51%)
6
(11.11%)
4
(7.40%)
1
(1.85%)
- 21
(38.88%)
Total 22
(40.74%)
12
(22.22%)
12
(22.22%)
7
(12.96%)
1
(1.85%)
54
(100%)
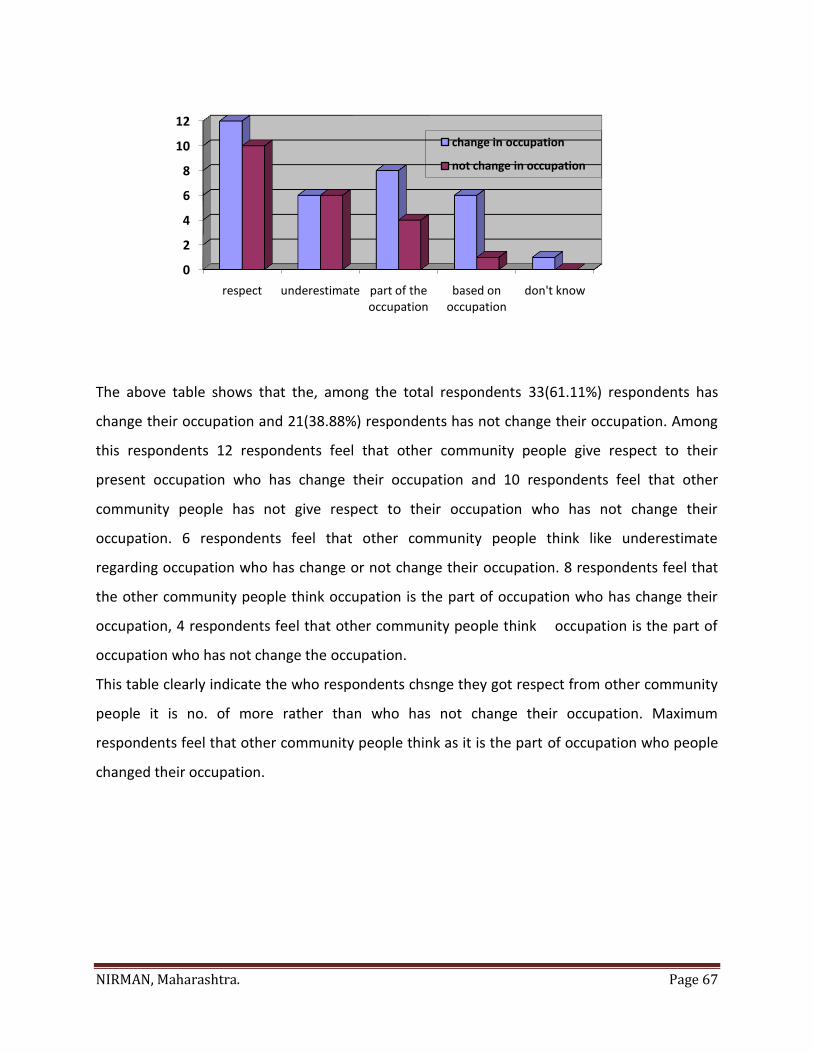
NIRMAN, Maharashtra. Page 67
The above table shows that the, among the total respondents 33(61.11%) respondents has
change their occupation and 21(38.88%) respondents has not change their occupation. Among
this respondents 12 respondents feel that other community people give respect to their
present occupation who has change their occupation and 10 respondents feel that other
community people has not give respect to their occupation who has not change their
occupation. 6 respondents feel that other community people think like underestimate
regarding occupation who has change or not change their occupation. 8 respondents feel that
the other community people think occupation is the part of occupation who has change their
occupation, 4 respondents feel that other community people think occupation is the part of
occupation who has not change the occupation.
This table clearly indicate the who respondents chsnge they got respect from other community
people it is no. of more rather than who has not change their occupation. Maximum
respondents feel that other community people think as it is the part of occupation who people
changed their occupation.
0
2
4
6
8
10
12
respect underestimate part of the occupation
based on occupation
don't know
change in occupation
not change in occupation
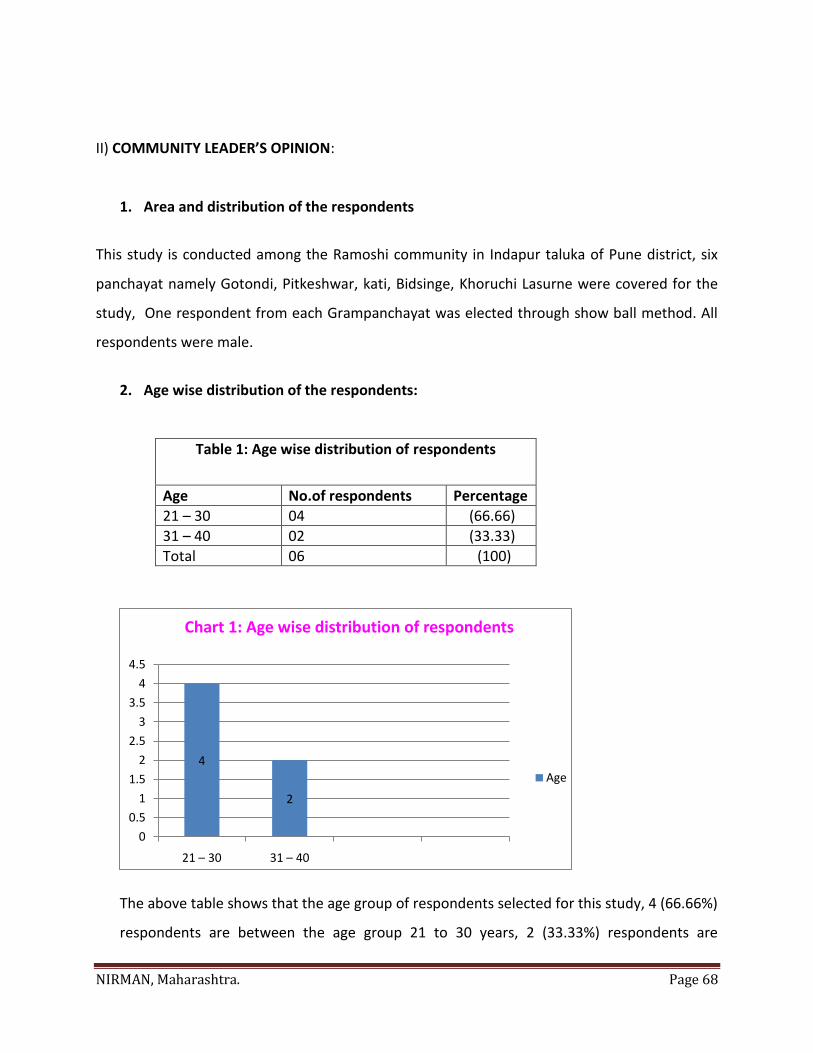
NIRMAN, Maharashtra. Page 68
II) COMMUNITY LEADER’S OPINION:
1. Area and distribution of the respondents
This study is conducted among the Ramoshi community in Indapur taluka of Pune district, six
panchayat namely Gotondi, Pitkeshwar, kati, Bidsinge, Khoruchi Lasurne were covered for the
study, One respondent from each Grampanchayat was elected through show ball method. All
respondents were male.
2. Age wise distribution of the respondents:
Table 1: Age wise distribution of respondents
Age No.of respondents Percentage
21 – 30 04 (66.66)
31 – 40 02 (33.33)
Total 06 (100)
The above table shows that the age group of respondents selected for this study, 4 (66.66%)
respondents are between the age group 21 to 30 years, 2 (33.33%) respondents are
4
2
0
0.5
1
1.5
2
2.5
3
3.5
4
4.5
21 – 30 31 – 40
Chart 1: Age wise distribution of respondents
Age

NIRMAN, Maharashtra. Page 69
between the age group of 31 to 40 years. Age group between 31 to 40 years is more
important for earning for family expenses.
3. Education:-
Table 2: education wise distribution of the respondents
Education No. of respondents Percentage
Illiterate 04 (66.66)
Primary 02 (33.33)
Total 06 (100)
The above table shows that the education status of the respondents selected for this study,
among the total respondents, 4(66.66%) respondents are illiterate and 2(33.33%)
respondents educated up to primary. Education of a person is depended on his/her
economic status, this data shows that majority of the respondents are illiterate and other
have education up to primary.
Illiterate 67%
Primary 33%
Chart 2: Education of Respondents

NIRMAN, Maharashtra. Page 70
4. Occupation of the Respondents:
Table 3. occupation of the respondents
Occupation Frequency percentage
Providing protection to farm 02 (33.33)
Farmer 01 (16.66)
Not working 03 (50.00)
Total 06 (100)
The above table shows that the occupation of respondents, among the total respondents
selected for this study, 2 (33.33%) respondents are providing the protection to farm, only
one i.e. 16.66% respondents are farmer, 3(50%) respondents are not working. Occupation is
the indicate the status of the people. People income depends on the occupation.
Occupation is the indication of the economic status of the people.
5. Difficulties faced for taking education
In the human being’s life , they faces many difficulties for taking education like the poor
economic condition, when people are totally unaware about the importance of education
that time they can’t gave education to their children, here among the total respondents
6(100%) respondents told Ramoshi community faced economic problem for taking the
2
1
3
0
0.5
1
1.5
2
2.5
3
3.5
Providing protection to farm
Farmer Not working
Chart 3: Occupation
Occupa…
NIRMAN, Maharashtra. Page 71
education. 4(66.66%) respondents told the Ramoshi community people don’t know about
the awareness about the education; only two(33.33%) respondents told Ramoshi
community people have no importance of education. This clearly shows Ramoshi
community faced economic problem for taking the education.
6. Economic resources was in Ramoshi community
Table 4: Economic resources was in Ramoshi community
Economic resources
was in Ramoshi community
No. of respondents Percentage
Protection to land 03 (50.00)
Daily wages 03 (50.00)
Total O6 (100)
The above table shows that the economic resource was in Ramoshi community. Among
the total respondent 3(50% ) respondent were providing protection to land and get
income from it, 3(50%)respondents were doing daily wages and got their income. Here
clearly indicate that the, maximum people were doing protection to land and daily wages
work. This work is very unskilled work and Ramoshi community doing this type of work.
7. Economic resources is in Ramoshi community
Now there come out to observation changing the occupation of the Ramoshi community, now
there are various economic resources resources in the Ramoshi community like the daily wages,
self employment, employment, farmer, working in the own land, driver etc. among the total
respondents 100% respondents opinion is daily wages is the main economic resources in the
Ramoshi community.
NIRMAN, Maharashtra. Page 72
8. Sufficient resources for running family
Among the total respondents, 6 respondents i.e. 100% respondent’s opinion is that, there are
no sufficient economic resources for the running family of Ramoshi community.
9. Making provision
People need is unlimited and there are limited resources for fulfilling the human beings need,
people are always try to make the provision and solve their problem. they make some provision
like that by reducing the some expenses , by taking the loan, borrowing from others , doing
some additional work, among the total respondents, 4(66.66%) respondents opinion is people
are making provision by reducing the home expenses , 6 (100%) respondents opinion is the
people are taking the loan for making the provision, 5(83.33%) respondents are borrowing from
other and making the provision, only 2(33.33%) respondents opinion’s the people are doing
some additional work.
10. Fulfil economic need doing traditional occupation
Among the total respondents 5(83.33%) respondents opinion is that, Ramoshi community was
fulfil their economic need by doing the traditional occupation and only one respondents i.e.
16.66% respondents opinion is that Ramoshi community had not fulfil their economic need by
doing the traditional occupation.

NIRMAN, Maharashtra. Page 73
11. Opinion about traditional occupation
Table 5: Opinion about traditional occupation
Opinion about traditional occupation
No. of respondents
Percentage
Traditional occupation is identity 03 (50.00)
Recognize status 02 (33.33)
Traditional occupation was enough to cater the need of family.
01 (16.66)
Total 06 (100)
Traditional occupation is
identity50%
Recognize status33%
Traditional occupation is
enough to daily wages.
17%
Chart 4: Opinion about traditional occupation

NIRMAN, Maharashtra. Page 74
The above table shows the opinion of respondents about traditional occupation, among the
total respondents 3(50%) respondents opinion is traditional occupation is their identity,
2(33.33%) respondents opinion is recognise status, and only one respondent i.e. opinion is
traditional occupation is enough to daily wages.
12. Opinion of others people thinking about traditional occupation
Table 6: Others people thinking about traditional occupation
Others people thinking about traditional occupation
No.of respondents
Percentage
Inadequate income 03 (50.00)
No status for traditional occupation 02 (33.33)
Employment of old generation 01 (16.66)
Total 06 (100)
The above table shows that the other people opinion about the traditional occupation of
Ramoshi community, among the total respondents, 3(50%) respondents told other people think
like that inadequate income from traditional occupation, 2(33.33%) respondents told like that
other people is not given status for traditional occupation, and only one person i.e. 16.66%
32
10
0.51
1.52
2.53
3.5
Inadequate income No status for traditional occupation
Employment of old generation
Chart 5: people thinking about traditional occupation
people thinking about traditional occupation
NIRMAN, Maharashtra. Page 75
respondents told like that other community people think traditional occupation is the
employment of old generation.
13. Difficulties faced landholder
There are various difficulties faced by the land holder’s such as economic shortage, no modern
technology, water problem, less income from the crops and marketing problem. Among the
total (six) respondents 6(100%) respondents opinion is that the economic problem faced by
landholder, 5(83.33) respondents opinion is that they have no modern technology, 4(66.66%)
respondents opinion is that the, Ramoshi community people faced water problem for
cultivating the land. 3(50%) respondents opinion is that these, Ramoshi community people
faced the market problem and less income.
14. Provision
Landholder faced many problem for cultivating the land, but they are always make some
provision for solving their problem, among the total respondents 5(83.33%) respondents
opinion is that landholder take others help for making the provision. And only one respondents
i.e. 16.66 respondents opinion is that landholders taking the bank loan and the making the
provision.
15. People ready for accepting change
All the respondents of this study were of the opinion is that the people are ready for accepting
the change.
16. Respect from other community member
All the respondents of this study were of the respondents have the respect from other
community members.

NIRMAN, Maharashtra. Page 76
17. Relationship of other community members
Table 7: Relationship of other community members
Relationship of other community members
No. of respondents Percentage
Good 03 (50.00)
Average 03 (50.00)
Total 06 (100)
Human being are social animal, people can’t live alone, he is depend on each other, every
person has several need and for fulfil this need always he depend on others, people needs are
the unlimited. Among the total respondent 3(50%) respondents have good relation with the
other community people, 3(50%) respondents have average relation with other community
people.
18. Efforts for development of community
Table 8: Efforts for development of community
Efforts for development of community
No. of respondents
Percentage
Tell about education 03 (50.00)
Motivate to youth for taking education
03 (50.00)
Total 06 (100)
The above table shows that the Ramoshi community leaders take efforts for development
of Ramoshi community. Leaders do try to bring resources and provide to people and do
their development, among the total respondents, 3(50%) respondents told to community
people regarding the education, convince to them for taking the education,
3(50%)respondents motivate to community youth for taking the education. Such type of
efforts are taken by community leaders. Here clearly indicate that the community leaders
are focusing on education for the development of Ramoshi community and education is one
most important thing for the development of people.

NIRMAN, Maharashtra. Page 77
19. Things necessary for development
All the respondents were of the opinion is that, education is the necessary things for the
development of Ramoshi community, when people get education then their mind set will be
change and they think about the development, that’s why education is the important for the
development.
20. Demand from Grampanchayat
Table 9: Demand from Grampanchayat
Demand from Grampanchayat No. of respondents
Percentage
Gharkul yojana 03 (50.00)
Water facilities 01 (16.66)
Proper implementation of scheme.
02 (33.33)
Total 06 (100)
The above table shows that, the demand of Ramoshi communities from the Grampanchyat?
Among the total respondents, 3(50%) respondents were of the opinion that, Ramoshi
community people demanding the Gharkul from the Grampanchayat, one respondents i.e.
16.66% respondents opinion is the, Ramoshi community people demand water facilities and
0
0.5
1
1.5
2
2.5
3
3.5
Gharkul Yojana water facilities proper emplementation of schwmw
Demand from Grampanchayat
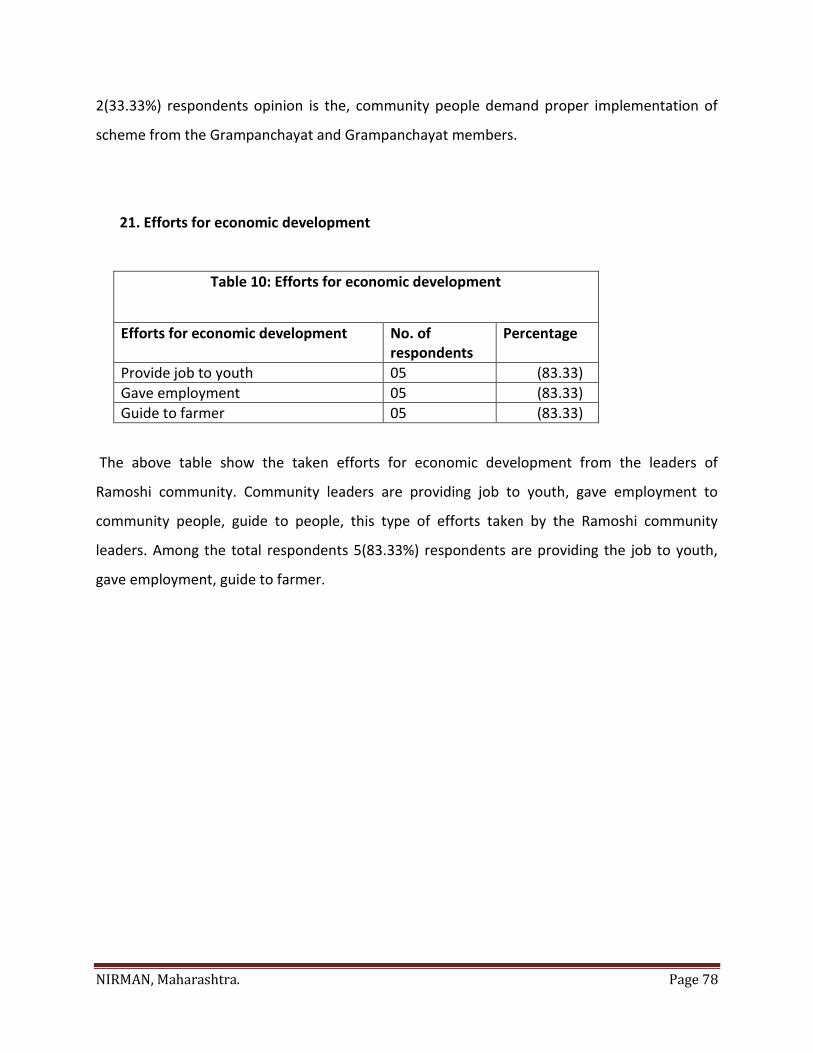
NIRMAN, Maharashtra. Page 78
2(33.33%) respondents opinion is the, community people demand proper implementation of
scheme from the Grampanchayat and Grampanchayat members.
21. Efforts for economic development
Table 10: Efforts for economic development
Efforts for economic development No. of respondents
Percentage
Provide job to youth 05 (83.33)
Gave employment 05 (83.33)
Guide to farmer 05 (83.33)
The above table show the taken efforts for economic development from the leaders of
Ramoshi community. Community leaders are providing job to youth, gave employment to
community people, guide to people, this type of efforts taken by the Ramoshi community
leaders. Among the total respondents 5(83.33%) respondents are providing the job to youth,
gave employment, guide to farmer.
NIRMAN, Maharashtra. Page 79
Chapter IV
SUMMARY AND FINDINGS
Introduction:
This chapter of the study is brining out the major findings and the summary of these finding.
The study is done in relation to the objectives, hypothesis, and research question of the study.
The main factors which are tried to look into the study are the occupational pattern of the
Ramoshi community and the main change in occupational pattern. The study is also tried to find
out the major reason for this change in occupation over a course of time and people’s opinion
about this change. Study is also looking into the relationship of community with other
community members.
COMMUNITY PEOPLE:
Respondents profile:
Study is conducted in the six villages (Gotondi, Pitkeshwar, Kati, Bidsinge, Khoruchi and
Lasurne) of Indapur taluka of Pune district. And majority of the respondents in the study are
between the age group of 21 to 30 and 41 to 50. Level of education among the community is
low, as 27(50%) of the respondents are illiterate. Maximum people are doing the farm & daily
wages earner i.e. 13 – 14 respondents. Among the total respondents farmer & daily wages
workers are the more.
NIRMAN, Maharashtra. Page 80
Occupational pattern and change occurred in traditional occupation pattern:
Study show that the land is most important economic resources of Ramoshi community, around
60% people have their own land, but aximum peple are have land between 1 to 5 acre and it is
irrigated land. Maximum people are taking maize and vegetables in farm. Around 28%
percentage people take income between 20 to 30 thousand from crops, and around 2% people
get income above 50 thousand from crops, maximum people’s income is low which get from
crops is. Maximum people 82% people are not manage their home expenses. Because of their
income is very low. But they are making some provision for to manage their home expenses,
such as reducing the home expenses, taking loan from bank and patananstha, borrowing from
others and also some are doing additional work for provision to manage home expenses.
Reason for change in occupation:
There is a trend of change in occupation pattern of Ramoshi community and also slowly sifting
to other profession fully or partly. 62% people are changing their occupation because of got
employment, purchase own land or for better income, maximum people changed their their
occupation for better income. Around 70% people are not lking traditional occupation because
of this this traditional job are the employment of old generation not the present, jobs are their
need and changing with new situations or also inadequate income from the traditional
occupation. Around 85% people’s two generation are not following ancestral occupation.
Among the all respondents give their opinion is like that change in occupation develop social
status.
Relation with other community members:
Ramoshi community belong to Nomadic Tribe, they are living outside the village , but here
Ramoshi community people relation are good with other community people . around 70%
people opinion is that their relation are good with other community people , also maximum
people have the membership of the self help group, Tarun Mandal, every person have the
status in the family and in the society.
NIRMAN, Maharashtra. Page 81
COMMUNITY LEADERS OPINION:
According to the community leaders Ramoshi community people faced many difficulties for
taking the education, like the poor economic condition, when people are totally unaware about
the importance of education that time they can’t give education to their children. Mostly
people faced economic problem for taking the education.
Provide protection to the land and daily wages was the main economic resources in Ramoshi
community, and now there are daily wages, self employment, employment, farmer, working in
the own land, driver, etc economic resources available. But these resources are not sufficient
for running the family.
These economic resources are not sufficient for running the family but people are make some
provision like by reducing the some home expenses, taking the loan from the bank and
Patasanstha, borrowing from others, doing some additional work.
Human being are social animal, people can’t live alone, he is depend on each other, every
person has several need and for fulfill this need always he depend on others. Around 50%
people relation are good with other community members.
Community leaders take efforts for development of Ramoshi community, leaders told to
community people about importance of education and motivate to youth for taking the
education.
All the respondents were of the opinion is that, education is the necessary things for the
development of Ramoshi community, when people get education then their mind set will be
change and they think about the development, that’s why education is the important for the
development.

NIRMAN, Maharashtra. Page 82
GENERAL FINDINGS
Study revels that the overall economic condition of the respondents is not good as 43%
of the respondents belong poor economic condition, and 44.44% of the respondents
belong to very poor economic condition. They are not manage their home expenses
among these income.
They make some provision for the manage home expenses like taking loan, reducing
expenses, borrowing from others, doing some additional work etc.
Study shows that the provide protection to land and farm was the main traditional
occupation of the Ramoshi community.
Now maximum people are the shift from traditional occupation ,96% of the respondents
shift from traditional occupation.
Now there are daily wages, self employment, employment, farmer, working in the own
land, driver, etc economic resources available in the Ramoshi community.
Study shows that the 50% of the respondents are illiterate; means education condition
of the Ramoshi community is also not well. People are faced many problem for taking
the education like economic problem, unaware about education etc.
The main reason for change in occupation is that the, got employment, purchase own
land, for better income.

NIRMAN, Maharashtra. Page 83
People are not liking the traditional occupation because of the, traditional job are the
employment of old generation not he present, job are our need changing with new
situations, inadequate income from traditional occupation.
Study shows that the other community people’s reaction is respectfully towards the
present occupation of the Ramoshi community which occupation are accepting by
Ramoshi community.
Study shows that Ramoshi community people’s relation are good with others
community people, 74% of the respondents opinion is that, their relation are good with
other community members.
Study shows that Ramoshi community people’s status are also good in the village, 75%
of the respondents opinion is that, their status are good in the village.
Study shows that, attitude of Grampanchayat members are cooperatives towards
Ramoshi community, around 43% of respondents opinion is that Grampanchayat
members attitude are cooperative towards Ramoshi community.
NIRMAN, Maharashtra. Page 84
CONCLUSION
Ramoshi community’s economic condition is not good. Their previous occupations used to
provide protection to land/farm which belong to landlords of the village, but now maximum
people are shiftining from traditional occupation to new occupation. Education condition of
Ramoshi community is not good. People are facing the many problems for taking the education
like economic problem, unaware about education etc. The main reason for change in
occupation is that, many people are getting employment, purchase own land for better income.
Other community people reaction is respectfully towards the present occupation of Ramoshi
community, which occupation is accepting by Ramoshi community. Attitude of Grampanchayat
members are cooperatives towards Ramoshi community.
SUGGESION
1. There is need of more government scheme for the development of Ramoshi community
(VJNT community).
2. There is need to create awareness among the Ramoshi community about the education.
3. Provide more education facilities to Ramoshi (VJNT) community from the Government
like scholarships, hostel facilities.

NIRMAN, Maharashtra. Page 85
BIBLIOGRAPHY
1. S. R. Chavhan (1989) Bhatkya Vimuktanche Antarang, Pune: Shivam publication.
2. Laxman Mane (2003) Bhatkyacha Bharud, Mumbai: Granthali Prakashan
3. L. Bavane (2005) Bhatakyacha Bhana Sansar Ani Sanskruti, Wardha: Sudhir Prakashan.
4. Laxman Mane, Vimuktayan.

NIRMAN, Maharashtra. Page 86
Interview Schedule (community people)
Schedule No:
Date:
Title of the study:
“A study of change in occupational patterns of Ramosahi community: with special reference
of Indapur taluka of Pune District.”
1. Name of the Respondent:…………………………………………………
a. Address in detail: Phone no:
2. Sex:
a. Male:
b. Female
3. Age ( in years):
a. 21 to 30
b. 31 to 40
c. 41 to 50
d. 51 to 60
e. Above 60
4. Education:
a. Illiterate
b. Primary
c. Secondary
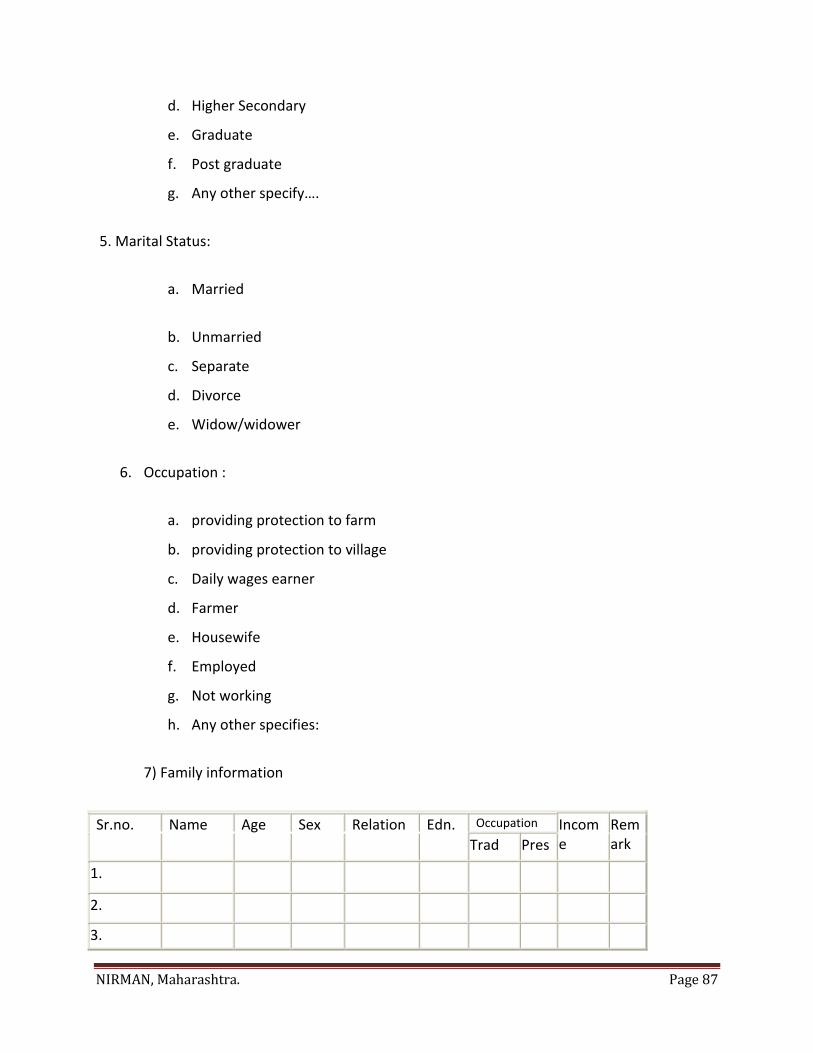
NIRMAN, Maharashtra. Page 87
d. Higher Secondary
e. Graduate
f. Post graduate
g. Any other specify….
5. Marital Status:
a. Married
b. Unmarried
c. Separate
d. Divorce
e. Widow/widower
6. Occupation :
a. providing protection to farm
b. providing protection to village
c. Daily wages earner
d. Farmer
e. Housewife
f. Employed
g. Not working
h. Any other specifies:
7) Family information
Sr.no. Name Age Sex Relation Edn. Occupation Income
Remark Trad Pres
1.
2.
3.
NIRMAN, Maharashtra. Page 88
4.
5.
6.
7.
8) Do you own land?
a. Yes
b. No
9) If yes, how many acres land you have?
a. 1 to 5 acres
b. 5 to 10 acres
c. 10 to 15 acres
d. 15 to 20 acres
e. Above 20 acres
f. Not applicable
10) Type of land
a. Irrigated
b. Partially irrigated
c. Dry
d. Not applicable
11) Which types of crops you take in the farm?
a. Sugar cane
b. Wheat
c. Millet

NIRMAN, Maharashtra. Page 89
d. Jowar
e. Maize
f. Vegetables
g. Legume
h. Any other
i. Not applicable
j.
12) How much yearly income do you get from crops?
a. Less than 15 thousand
b. 20 to 30 thousand
c. 30 to 40 thousand
d. 40 to 50 thousand
e. Above 50 thousand
f. Not applicable
13) What are the other resources of income?
a. Employment
b. Business
c. Any other specify
14) Total annual income-
a. Less than 20 thousand
b. 20 to 40 thousand
c. 40 to 60 thousand
d. 60 to 80 thousand
e. 80 to 1 lakh
f. Above 1 lakh

NIRMAN, Maharashtra. Page 90
15) Do you manage your home expense within the income?
a. Yes
b. No
16) If no what do you make the provision to manage the expenses of family?
a. By reducing the expense
b. Employing more family member in the occupation
c. By taking loan
d. borrowing from others
e. Doing some additional work
f. Any other specify
17) Is there any change in your occupation?
a. Yes
b. No
18) If yes. reason for change in occupation
a. Got employment
b. Purchase own land
c. For better income
d. Not happy with old occupation
e. Any other specify
f. Not applicable
19) Were your parents and grandparents (ancestor) doing same occupation?
a. Yes
b. No
NIRMAN, Maharashtra. Page 91
20) Is there any shift from this traditional occupation in recent past?
a. Yes
b. No
21) If yes then type of job?
a. Daily wages
b. Self employment
c. Employment
d. Farmer
e. Working in own land
f. Any other specify
22) Since when are you doing this occupation?
a. One generation
b. two generation
c. Three generation
d. Four generation
e. More than four generation
23) Do you like traditional occupation?
a. Yes
b. No
24) If yes Why?
a. Traditional occupation are our identity
b. Our ancestors were doing same job so we also have to do the same
c. This employment is enough to meet daily requirement
d. Recognize our status

NIRMAN, Maharashtra. Page 92
e. Any other specify
f. Not applicable
25) If no, why?
a. This traditional jobs are the employment of old generation not the present(new)
b. Job as our need are changing with the new situation
c. Inadequate income from traditional occupation
d. Any other specify
e. Not applicable
26) Do you like the present occupation?
a. Yes
b. No
27) If yes what is reason?
a. Get more income
b. Increase social status
c. No chance to get oppressed
d. Any other specify
e. Not applicable
28) If no what is reason?
a. Do not get more success
b. Need to hardworking talents
c. No interest
d. Any other specify
e. Not applicable

NIRMAN, Maharashtra. Page 93
29)) How many generations are not following ancestral occupation?
a. One generation
b. two generation
c. Three generation
d. Four generation
e. More than four generation
30) What other community people think about your present occupation?
a. Respect
b. Underestimate
c. It is the part of occupation
d. It based on cast occupation
e. Don’t know
f. Any other specify
31) Do you think change in occupation developed better social status?
a. Yes
b. No
32) How is your relationship with other community?
a. Very good
b. Good
c. Average
d. Poor
e. Very Poor
NIRMAN, Maharashtra. Page 94
33) Are you member of –
a. Grampanchayat
b. Sahakari vikas seva Society
c. Tarun mandal
d. Self helf group
e. Any other specify
f. Not applicable
34) What is your position in family?
a. Head of the family
b. Earning member in the family
c. Support member in the family
d. Home maker
e. Dependent
35) What is your status in the village?
a. Very good
b. Good
c. Average
d. Poor
e. Very Poor
36) What benefits did you get from this membership?
a. Popularity
b. Respect
c. Development of leadership quality
d. Developed the confidence for speaking
e. Any other specify

NIRMAN, Maharashtra. Page 95
f. Not applicable
37) If not what are the reason for not being members of such organization?
a. No interest
b. Not given opportunity
c. No time to spare
d. Wastage of time and money
e. I like to be alone
f. Any other specify
g. Not applicable
38) Is there any representative from your community in Grampanchayat?
a. Yes
b. No
39) Are your demand fulfill by the Grampanchayat?
a. Yes
b. No
40) Do you get sufficient participation in Decision making process of Grampanchayat?
a. Yes
b. No
41) What is the attitude of Grampanchayat members towards your community?
a. Indifferent
b. Cooperative
c. Respectful
d. Underestimate
NIRMAN, Maharashtra. Page 96
e. Any other specify
42) Are you easily accepted by other community?
a. Yes
b. No
43) If no, what are the reasons for not accepting?
44) How is the participation of other community member in any program me conducted by
your own community?
a. Very good
b. Good
c. Average
d. Poor
e. Very Poor
45) What do you think about stigma attached with your community as theft?
46) What your suggestions to improve the socio-economic status of the people?

NIRMAN, Maharashtra. Page 97
Interview Schedule (community leaders)
Schedule No:
Date:
Title of the study:
“A study of change in occupational patterns of Ramosahi community: with special reference
of Indapur taluka of Pune District.”
2. Name of the Respondent:…………………………………………………
a. Address in detail:
Phone no:
2. Sex:
c. Male:
d. Female
3. Age ( in years):
f. 21 to 30
g. 31 to 40
h. 41 to 50
i. 51 to 60
j. Above 60
5. Education:
h. Illiterate
i. Primary

NIRMAN, Maharashtra. Page 98
j. Secondary
k. Higher Secondary
l. Graduate
m. Post graduate
n. Any other specify….
5. Marital Status:
f. Married
g. Unmarried
h. Separate
i. Divorce
j. Widow/widower
7. Occupation :
i. providing protection to farm
j. providing protection to village
k. Daily wages earner
l. Farmer
m. Housewife
n. Employed
o. Not working
p. Any other specifies:
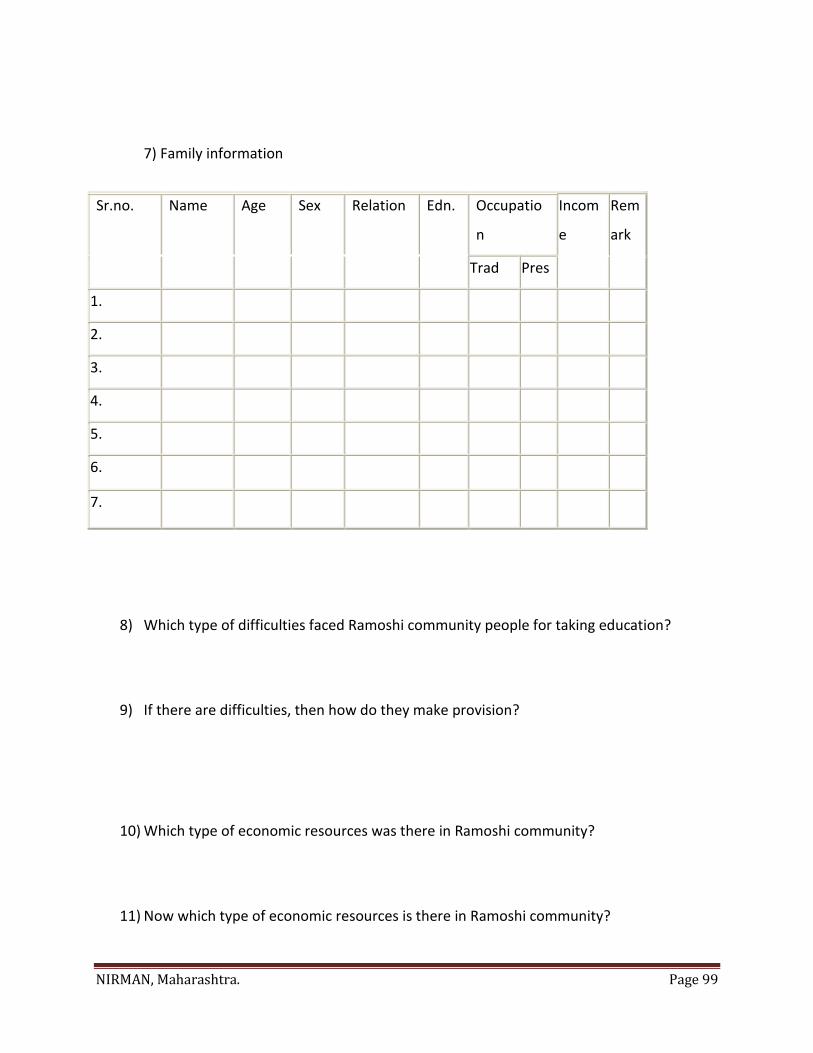
NIRMAN, Maharashtra. Page 99
7) Family information
Sr.no. Name Age Sex Relation Edn. Occupatio
n
Incom
e
Rem
ark
Trad Pres
1.
2.
3.
4.
5.
6.
7.
8) Which type of difficulties faced Ramoshi community people for taking education?
9) If there are difficulties, then how do they make provision?
10) Which type of economic resources was there in Ramoshi community?
11) Now which type of economic resources is there in Ramoshi community?
NIRMAN, Maharashtra. Page 100
12) Us it resources sufficient for running family?
13) If there are no sufficient economic resources, then how do they make provision?
14) Are they fulfil their economic need, those are doing traditional occupation?
15) What is your opinion about your traditional occupation?
16) What other community people think about your traditional occupation?
17) Which type difficulties faced landholders in cultivating farm?
18) If there are difficulties, then how do they make provision for solving difficulties?
19) According to you, are people ready for accepting the change?

NIRMAN, Maharashtra. Page 101
20) What do you think that, your own community leaders got respect from other
communities?
a. Yes b. No
21) How is the relationship of your community members and other community members?
22) What did you do, for the development of Ramoshi community?
23) Which things are the necessary for the development of people?
24) What is your demand for the development of Ramoshi community from
Grampanchayat?
25) What are you doing for the development of Ramoshi community?