a study of electric mobility for city of hyderabad · a study of electric mobility for city of...
TRANSCRIPT

A Study of Electric Mobility for City of Hyderabad
Subash Dhar, UNEP DTU Partnership Srinivas Cherla, Sustain Impact
Contents
• Context • Objectives • Methods • Results • Conclusions
Context
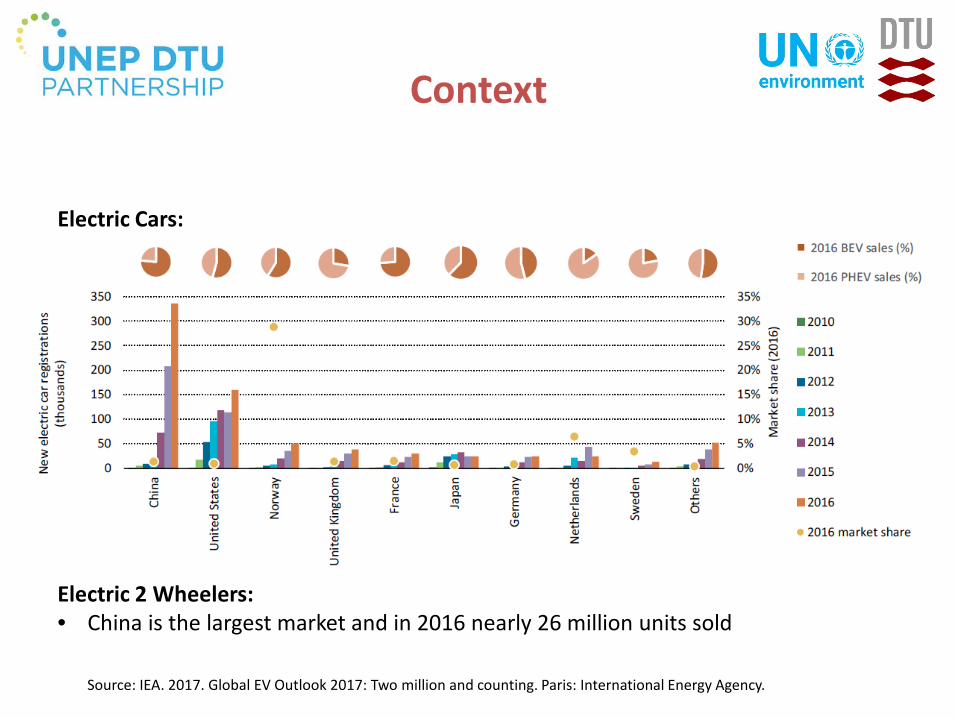
Source: IEA. 2017. Global EV Outlook 2017: Two million and counting. Paris: International Energy Agency.
Electric Cars:
Electric 2 Wheelers: • China is the largest market and in 2016 nearly 26 million units sold

Context
Focus Area Action/Target Policy Fuel quality standards
Phase in Euro V fuel standards from 2019 onwards
Auto Fuel Vision and Policy 2025
Emission norms for cars
Euro IV (2017) Euro V (2021) Euro VI (2024)
Auto Fuel Vision and Policy 2025
Promoting Electric Vehicles
Subsidies for EV, infrastructure investments and R & D
National Electric Mobility Mission Plan, 2020
Vehicle Fuel Efficiency Program
Passenger vehicle fuel efficiency standards, labelling and penalties
In process of implementation (includes EVs)
Achievement
Country Stock Market Share China 648,770 1.4 %
US 563,710 0.9 %
Norway 133,260 28.8 %
India 4,800 0.0 %
Strong enabling policies in India
Source: IEA. 2017. Global EV Outlook 2017: Two million and counting. Paris: International Energy Agency.
Source: Dhar, S., Pathak, M., & Shukla, P. R. 2017. Electric vehicles and India's low carbon passenger transport: a long-term co-benefits assessment. Journal of Cleaner Production, 146: 139-148.
Context
0%
20%
40%
60%
80%
100%
2020 2030 2040 2050
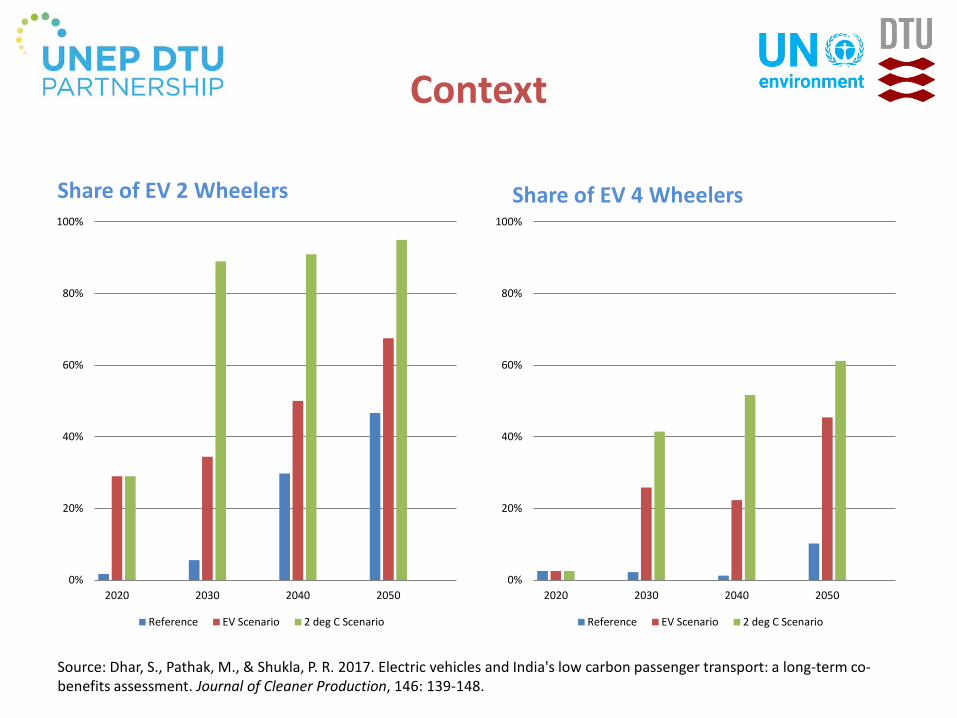
Reference EV Scenario 2 deg C Scenario
0%
20%
40%
60%
80%
100%
2020 2030 2040 2050
Reference EV Scenario 2 deg C Scenario
Share of EV 2 Wheelers Share of EV 4 Wheelers
Source: Dhar, S., Pathak, M., & Shukla, P. R. 2017. Electric vehicles and India's low carbon passenger transport: a long-term co-benefits assessment. Journal of Cleaner Production, 146: 139-148.

OBJECTIVES
• Undertaking a detailed study of the existing supply
chain for electric vehicles including support infrastructure.
• Investigate the barriers current users face for electric vehicles (EVs)
• Identify the likely improvements that can improve demand for EVs

Methods
• Market Mapping using qualitative interviews of dealers, municipal officials, etc. – 20 stake holders interviewed (including HMRL, TSRTC,
GHMC & Industries and Commerce Ministry, Telangana State)
• Analysis of consumer preferences, a market study titled “Study on Electric Mobility in India” was conducted for the city of Hyderabad between May and September 2017 – 1000 consumers surveyed and

Market Map for EVs
ELECTRIC CAR COMPANY
ELECTRIC CAR ASSEMBLERS
COMPONENT PRODUCERS
CAR MARKETING
CAR DEALERS
CAR CUSTOMERS
FINANCIAL SERVICES
TRANSPORT SERVICES
ELECTRIC UTILITIES
VEHICLE TESTING SERVICES
STANDARDS & LABLELLING SERVICES
RAW MATERIAL PROVIDERS
SCRAP SERVICES
BATTERY RECYCLING SERVICES
R & D SERVICES
INPUT / SERVICE PROVISION
CORE MARKET ACTORS
ELECTRICITY TARIFF POLICIES
FOSSIL FUEL SUBSIDIES
RENEWABLE POLICIES
ENVIRONMENT POLICIES
TAXES / TARIFF REGULATORY INSTITUTIONS
CONSUMER TRENDS
ENABLING ENVIRONMENT

Results - Awareness
• Awareness is low • Automakers are also not
pushing EVs – Hero has maintained a
portfolio of 18 EVs since 2010♠
– Maruti, Tata had showcased EVs as early as 2010 ♣
• Tender for 10,000 EV cars (ESSL)
♣ https://timesofindia.indiatimes.com/business/india-business/maruti-will-make-electric-cars-in-gujarat/articleshow/60521285.cms ♠ L. Philip, “How manufacturers are gearing up to seize the opportunity in electric vehicle space,” Economic Times, 29 August 2017
Source : Srinivas Cherla & Amit Garg, 2017, Study on Electric Mobility in India, UNEP DTU Partnership
Travel Mode Preferences
0% 20% 40% 60% 80% 100%
2W
4W
Public
% of people using a given transport mode
Ow
ners
hip
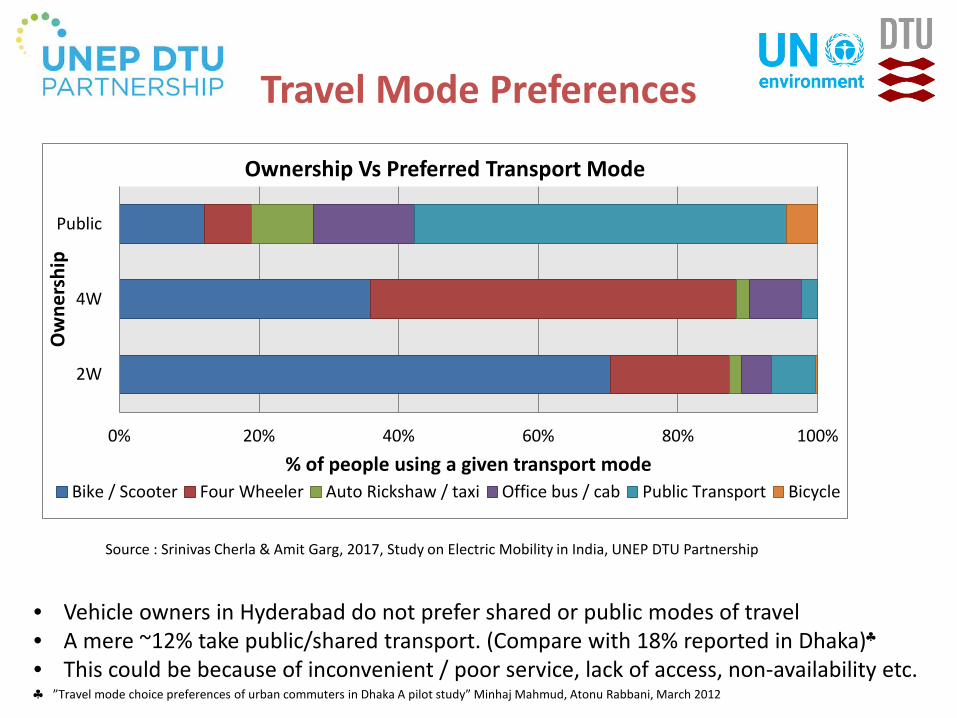
Ownership Vs Preferred Transport Mode
Bike / Scooter Four Wheeler Auto Rickshaw / taxi Office bus / cab Public Transport Bicycle
• Vehicle owners in Hyderabad do not prefer shared or public modes of travel • A mere ~12% take public/shared transport. (Compare with 18% reported in Dhaka)♣
• This could be because of inconvenient / poor service, lack of access, non-availability etc. ♣ ”Travel mode choice preferences of urban commuters in Dhaka A pilot study” Minhaj Mahmud, Atonu Rabbani, March 2012
Source : Srinivas Cherla & Amit Garg, 2017, Study on Electric Mobility in India, UNEP DTU Partnership

Results – Range Expectation
0%
10%
20%
30%
40%
50%
60%
70%
80%
90%
100%
0 20 40 60 80 100
150
200
250
300
500
Mor
e
Actual Travel / Range Expectation in KM
Range Expectation %
Actual Travel%
0%
10%
20%
30%
40%
50%
60%
70%
80%
90%
100%
0 50 100
150
200
250
300
400
500
600
700
800
Mor
e
Actual Travel / Range Expectation in KM
Range Expectation %
Actual Travel %
~ 100 km range will meet expectations of 3/4th of the consumers
~ 200 km range will meet expectations of 3/4th of the consumers
2 wheelers 4 wheelers
Source : Srinivas Cherla & Amit Garg, 2017, Study on Electric Mobility in India, UNEP DTU Partnership

Results - Driving Range
0%
20%
40%
60%
80%
100%
0 50 100
150
200
250
300
400
500
600
700
800
Mor
e
Range Expectation in KM
Current battery designs can satisfy 75% of customers expectations
Source : Bruce PG, Freunberger SA, Hardwick LJ, Tarascon J-M (2012) Li-O2 and Li-S batteries with high energy storage. Nature Materials 11(1):19-29
Source : Srinivas Cherla & Amit Garg, 2017, Study on Electric Mobility in India, UNEP DTU Partnership

Results - Charging time
• Up to 70% of the consumers are willing to wait between 5 and 15 minutes at a public charging station for a booster charge
• DC super charging stations are capable of delivering to this need
5 min 12%
10 min 30%
15 min 28%
30 min 20%
upto 1 hr
10%
Maximum agreeable waiting time for 40 km range extension
Source : Srinivas Cherla & Amit Garg, 2017, Study on Electric Mobility in India, UNEP DTU Partnership

Electric Vehicle Supply Equipment
Source: IEA. 2017. Global EV Outlook 2017: Two million and counting. Paris: International Energy Agency.

Results – Purchase Criteria
1 Availbility of Charging stations
2 Initial purchase cost
3 Driving range per full charge
4 Top Speed / Acceleration / Performance
5 Maintenance cost / Servicing costs
6 Running cost
7 Look and feel / Styling
8 Re-sale value
9 Environmental benefits
10 Vehicle Variant and Segment(Hatchback/Sedan/SUV)
Source : Srinivas Cherla & Amit Garg, 2017, Study on Electric Mobility in India, UNEP DTU Partnership
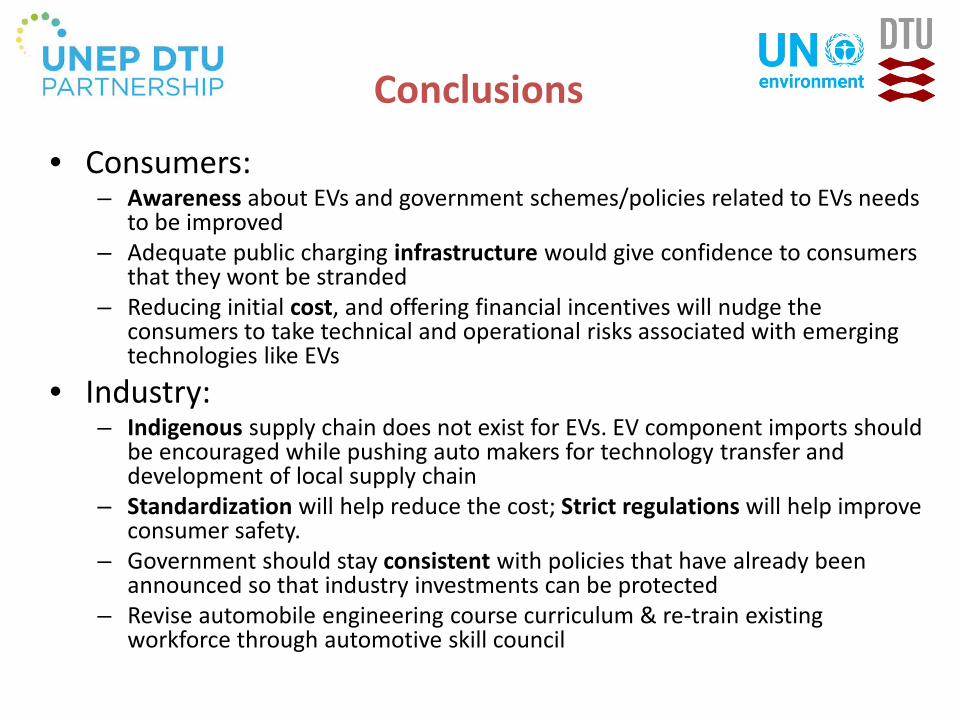
Conclusions
• Consumers: – Awareness about EVs and government schemes/policies related to EVs needs
to be improved – Adequate public charging infrastructure would give confidence to consumers
that they wont be stranded – Reducing initial cost, and offering financial incentives will nudge the
consumers to take technical and operational risks associated with emerging technologies like EVs
• Industry: – Indigenous supply chain does not exist for EVs. EV component imports should
be encouraged while pushing auto makers for technology transfer and development of local supply chain
– Standardization will help reduce the cost; Strict regulations will help improve consumer safety.
– Government should stay consistent with policies that have already been announced so that industry investments can be protected
– Revise automobile engineering course curriculum & re-train existing workforce through automotive skill council

Thank You!