a study of friction mechanisms between a surrogate...
TRANSCRIPT

Available online at www.sciencedirect.com
www.elsevier.com/locate/jmbbm
j o u r n a l o f t h e m e c h a n i c a l b e h a v i o r o f b i o m e d i c a l m a t e r i a l s 2 8 ( 2 0 1 3 ) 4 1 0 – 4 2 6
1751-6161/$ - see frohttp://dx.doi.org/10.
$This is an openWorks License, whisource are credited.
nCorresponding autE-mail address: a
Research Paper
A study of friction mechanisms between a surrogateskin (Lorica soft) and nonwoven fabrics$
David J. Cottenden, Alan M. Cottendenn
Department Medical Physics & Bioengineering, University College London, Gower Street, London WC1E 6BT, UK
a r t i c l e i n f o
Article history:
Received 20 December 2012
Received in revised form
8 March 2013
Accepted 29 April 2013
Available online 15 May 2013
nt matter & 2013 Elsevie1016/j.jmbbm.2013.04.024
-access article distributech permits non-commer
hor. Tel.: +44 [email protected] (A.
a b s t r a c t
Hygiene products such as incontinence pads bring nonwoven fabrics into contact with users'
skin, which can cause damage in various ways, including the nonwoven abrading the skin by
friction. The aim of the work described here was to develop and use methods for understanding
the origin of friction between nonwoven fabrics and skin by relating measured normal and
friction forces to the nature and area of the contact (fibre footprint) between them. The method
development work reported here used a skin surrogate (Lorica Soft) in place of skin for
reproducibility. The work was primarily experimental in nature, and involved two separate
approaches. In the first, a microscope with a shallow depth of field was used to determine the
length of nonwoven fibre in contact with a facing surface as a function of pressure, from which
the contact area could be inferred; and, in the second, friction between chosen nonwoven fabrics
and Lorica Soft was measured at a variety of anatomically relevant pressures (0.25–32.1 kPa) and
speeds (0.05–5mm s−1). Both techniques were extensively validated, and showed reproducibility
of about 5% in length and force, respectively. Straightforward inspection of the data for Lorica Soft
against the nonwovens showed that Amontons' law (with respect to load) was obeyed to high
precision (R240:999 in all cases), though there was the suggestion of sub-linearity at
low loads. More detailed consideration of the friction traces suggested that two different friction
mechanisms are important, and comparison with the contact data suggests tentatively that they
may correspond to adhesion between two different populations of contacts, one “rough” and one
“smooth”. This additional insight is a good illustration of how these techniques may prove
valuable in studying other, similar interfaces. In particular, they could be used to investigate
interfaces between nonwovens and skin, whichwas the primarymotivation for developing them.
& 2013 Elsevier Ltd. All rights reserved.
1. Introduction
Most human skin spends much of its time in contact withfabrics, and mechanical interaction between the two is central to
r Ltd. All rights reserved.
d under the terms of thcial use, distribution, and
.M. Cottenden).
clothing comfort. There are also some contexts in which thehealth of skin is critically dependent on its interaction with
fabrics, such as the facing materials of absorbent pads worn by
incontinent people, or (bed)clothes between the body and load-
e Creative Commons Attribution-NonCommercial-No Derivativereproduction in any medium, provided the original author and

j o u r n a l o f t h e m e c h a n i c a l b e h a v i o r o f b i o m e d i c a l m a t e r i a l s 2 8 ( 2 0 1 3 ) 4 1 0 – 4 2 6 411
bearing surfaces of those susceptible to pressure sores. Yet thenature of friction between fabrics and skin is poorly understood,with the most fundamental experimental results still disputed;for example, there is no firm consensus as to the applicabilityof Amontons' law, or of the variation of friction with slidingspeed, which must—in large measure—be attributed to a lackof robust, validated experimental methods. Furthermore, coeffi-cients of friction are phenomenological. There is no widelyrecognised simple relationship between obvious surface proper-ties and coefficients of friction for interfaces between eitherfabric (Ajayi, 1992; Hosseini Ravandi et al., 1994; Jeddi et al., 2003;Ramkumar and Roedel, 2003; Wang et al., 2006) or skin (El-Shimi, 1977; Nakajima and Narasaka, 1993; Bobjer and et al.,1993; Hendriks and Franklin, 2010) and other surfaces, despitethe exertion of considerable experimental effort. The lack of atheory relating friction to material and surface properties deniesguidance to the attempt to engineer materials with specifiedfrictional properties.
If Amontons' law is to be rejected or placed on a firmerfooting, muchmoremust be understood about themechanismsof friction in this instance: not only are the friction mechanismsfar from clear, but the very nature of the interface is unknown.Accordingly, the work described in this paper set out to developand validate two methods; the first, to measure the fibre foot-print of nonwoven fabrics on surfaces; and the second tomeasure the friction forces between a surrogate skin and aselection of nonwoven materials of the kind commonly used inthe body-facing coverstocks of incontinence pads accurately.Data generated using these two methods were then used toinvestigate the associated friction mechanisms.
2. Literature review
2.1. Methods for measuring friction between (surrogate)skin and fabrics
Methods reported in the literature for measuring frictionbetween (surrogate) skin and fabrics can be divided into twomain types: (1) rotational methods in which a circular pad orannulus faced with one material is pressed against the othermaterial and rotated about its axis (Zhang and Mak, 1999);and (2) linear pull methods in which one material is simplytranslated across the other under load (Cottenden et al., 2008;Gerhardt et al., 2008, 2009; Derler et al., 2007; Gwosdow et al.,1986; Kenins, 1994; Hong et al., 2005; Comaish and Bottoms,1971). Linear pull methods can be further divided into straightpull methods in which the translation is in a straight lineacross a flat surface (Cottenden et al., 2008; Gerhardt et al.,2008, 2009; Derler et al., 2007; Hong et al., 2005; Comaish andBottoms, 1971) and curved pull methods in which a strip ofone material is draped under load over a curved surface facedwith the other material and is dragged along a curved pathcorresponding to a geodesic of the curved surface (Cottendenet al., 2008; Gwosdow et al., 1986; Kenins, 1994).
Each of these methods has its advantages and disadvan-tages. Rotational methods have the advantage that at leastone commercial probe has been produced, lowering thebarrier to beginning measurements. Such devices can alsobe self-contained and thus quite simple to use. However, they
have several intrinsic limitations. The most fundamental isthat since not all regions of the contact are experiencingequivalent conditions (sliding velocity is obviously propor-tional to radial distance) any reading must be an average,which cannot be interpreted without assuming some knownvariation of friction with velocity. These probes are thus bytheir nature not suited to fundamental measurements of howfriction changes with velocity. Furthermore, strain fields andbuckling patterns are often set up on compliant substrates,making the results hard to interpret with certainty.
Straight pull linear methods are the most direct of the threetypes of method, simply applying a load to an interface, puttingit into sliding motion, and measuring the force required toinitiate or maintain it. This has the advantage that the nominalcondition of each part of the interface is the same, making theresults easier to interpret. Due to the rectilinear pull the issueswith buckling are generally less since the surface can move enbloc to accommodate, though for some interfaces problems stilloccur. The two main disadvantages of this type of method arethat there is no known neat commercial implementation – thusrequiring the equipment to be built in-house – and, moreseriously, that it is difficult to provide a pulling force withouteither imparting amoment (due to the non-colinear pulling forceand friction) or making the method very reliant upon perfectalignment of parts and non-robust against deformation.
Both rotational and straight pull linear methods sufferfrom difficulties with the shape of the probe on which themoving sheet material is mounted. It is well-known (thoughnot universally appreciated) that a flat punch impressed intoa compliant surface does not give rise to a uniform pressuredistribution below it; rather, there are sharp peaks in pressureat the periphery (Johnson, 1985a). Though for interfaces thatobey Amontons' law, departures from uniformity of pressureare clearly unimportant this is not so for more generalinterfaces. Further, frictional forces at an interface them-selves distort the normal force distribution (Johnson, 1985b),quite apart from any incidental moments introduced by theequipment. These effects appear never to have been assessedor corrected for in friction measurements.
The curved pull linear method is the most indirect of the threemethods, relying as it does upon the curvature of the surface toturn a tensile stress in the draped sheet into a normal stresswhich gives rise to friction. It is also an “integrated” method; thatis, the measured force is the sum of a continuum of differentcontributions since the tension (and thus normal loading) changearound the contact region. It is therefore necessary to use anestablished model to extract any desired interface parameters,and this will generally require some parameters of the curvedsurface to be known. In view of these points this type of methodis not suitable for making fundamental friction measurements,though it is very suitable for certain routinemeasurements wherea friction model has been established and one material is notusually flat, for example in vivo skin.
The novel method described and validated here aimed to over-come themajority of the problems exhibited by existing methods.
2.2. Skin surrogates
Any material co-opted as a surrogate skin must be equivalent toskin in the capacity in which it is being used. The overwhelming

j o u r n a l o f t h e m e c h a n i c a l b e h a v i o r o f b i o m e d i c a l m a t e r i a l s 2 8 ( 2 0 1 3 ) 4 1 0 – 4 2 6412
majority of surrogate skins have been designed to be used toimitate the biological or histological properties of skin with littleor no regard for their mechanical or textural similarity. They aredesigned to be stable for biological testing, but are not suitablefor mechanical experiments. If there have been few mechanicalsurrogates, there have been fewer friction surrogates.
In their 2008 paper Gerhardt et al. (2008) stated that therewas not at that time a sufficiently validated skin surrogate forfriction against fabrics. In that work they referred to workundertaken by some of their group and published at a similartime (Derler et al., 2007) which compared friction betweenskin and a standard woollen fabric with that between aselection of proposed synthetic skin surrogates and the samefabric. This work (by Derler et al., 2007) gathered friction datafor real skin by having subjects stroke a biaxial force platefaced with the test fabric, exerting varied normal forces;whereas most work on skin surrogates (using a reciprocating,faced circular punch) was at a single load. Comparisonbetween the data for all of the skin surrogates and the skinitself showed that a synthetic leather composed of polyamidefleece with a polyurethane coating, Lorica Soft, was theclosest match. They demonstrated that the coefficient offriction against the test fabric was similar to that of skinagainst the same fabric for normal loads from almost nothingto about 10 N. Additionally, Gerhardt et al. (2008) noted thatthe mean absolute deviation from the surface mean planeand a measure of the difference between the highest “peaks”and lowest “valleys” were similar for Lorica Soft and foryoung, dry, hairless skin.
2.3. Friction mechanisms
Based on the literature, there are a number of a priori likelynonwoven-skin (surrogate) friction mechanisms which areconsistent with known experimental results for differentpairs of surfaces, each mechanism with its own “signature”by which it would be revealed.
Plastic dissipation. The hallmark of plastic dissipation is thepresence of persistent deformation to the contactingsurfaces after sliding. This has been establishednot to occur for skin (El-Shimi, 1977; Nakajima andNarasaka, 1993), but there are no known negativeresults for nonwovens. Such deformation could inprinciple be easily detected in nonwovens by takingmicrographs of a given region before and after anexperiment. Plastic deformation is usually expectedto lead to friction proportional to load.
Viscoelastic dissipation. It is very difficult to distinguishinstantaneously between plastic and viscoelasticdissipation; the key difference is that viscoelasticdeformation relaxes after an experiment, whereplastic deformation does not. Viscoelastic deforma-tion must therefore be observed by comparingany deformation during an experiment with thatobserved afterwards. Viscoelasticity can further bedistinguished from simple non-dissipative elasticityby conducting experiments at different speeds: theformer will vary with rate, while the latter will not.
The variation of this type of friction with loaddepends on the details of the contact.
Pinning. “Pinning” refers to temporary trapping of features ofone surface by those of the other. Although pinningin combination with pure elasticity does not pro-duce friction, this mechanism can lead to relativelyweak viscoelasticity causing a significant frictionalforce. This is because, although the dissipativeeffect of viscoelasticity may be weak at the meansliding velocity, at time of slip contact points aretravelling much faster than this, and so viscousdissipation is substantially increased. The key sig-nature of this mechanism is fibres “pinging”; that is,suddenly freeing themselves from a pinning pointand rapidly correcting. Merely observing pinging inan arbitrary system would not, of course, imply thatthis mechanism is relevant: in the absence of aninternal or interfacial dissipative mechanism pin-ging conserves energy. However, skin is known to beviscoelastic, and thermoplastic polymers (such asconstitute the fibres in common nonwoven cover-stocks) are the prototypical viscoelastic materials, soobserving pinging may reasonably be assumed toimplicate pinning as at least a relevant mechanism.No characteristic variation of friction with load isassociated with this mechanism.
Interfacial adhesion and dissipation. Friction due to true inter-facial adhesion and dissipation is very hard to identifyunambiguously due to a lack of visible mechanism.In practice, it must be inferred by assessing whetheror not the other identified mechanisms accountfor the measured frictional behaviour. Adhesive fric-tion varies linearly with contact area, though contactarea's variation with load depends upon the nature ofthe surface.
The best approach, then, for identifying the mechanism(s)at play in a given system is to look for the correspondingdiagnostic signs in the friction data; the materials before,during, and after friction experiments; and the nature andextent of the interface between the two material surfaces.
3. Strategy for the work, and structure of thepaper
In order to establish which of the mechanisms identified inSection 2.3 (or indeed those as yet unidentified) are relevantat the nonwoven-skin (surrogate) interface of interest inthe current work, the friction force and fibre footprint wouldideally be measured simultaneously. Unfortunately, thisproved impossible, but it was possible to gather all necessarydata using only two distinct but linked experimental meth-ods. The first involved using the shallow depth of field of ahigh magnification microscope to observe and measure thearrangement of the fibre footprint of nonwoven fabrics on aflat glass surface as a function of pressure. Being a rigid,transparent and readily available material with a flat surface,glass is much easier to work with than skin (surrogate) and –
counterintuitively – it can be shown to be an informative
j o u r n a l o f t h e m e c h a n i c a l b e h a v i o r o f b i o m e d i c a l m a t e r i a l s 2 8 ( 2 0 1 3 ) 4 1 0 – 4 2 6 413
representative for both, allowing the contact area betweentested nonwovens and skin (surrogate) to be calculated fromthe experimental results, up to an unknown multiplicativeconstant which depends on the skin relief. The method andcorresponding results are described in Section 5, along with ajustification for using glass.
Section 6 describes the second method and correspondingresults. In this method, the friction force between nonwovensand skin surrogate was measured for a range of interfacialpressures and velocities while simultaneously observing themovement of fibres within the fabric using low magnificationmicroscopy. The results from the two methods are consid-ered together in Section 7 to identify the friction mechanismsoperating. But first, the materials chosen for the work aredescribed in Section 4.
4. Materials
The motivation for the work described here was to under-stand the interaction between human skin and nonwovenfabrics of the kind used in incontinence pads. However, skinis an awkward material to obtain and to work with; it isimpossible to obtain identical samples and properties changerapidly with time ex vivo. Accordingly, a skin surrogate wasused instead, for the purposes of method development.Lorica Soft (Ehrlich Lederhandels GmbH, Biberach, Germany;http://www.ehrlich-leder-lorica.de) was chosen as it is theonly one that has been shown to mimic skins frictionbehaviour reasonably well (Section 2.2). It is supplied in avariety of colours and, arbitrarily, the white variant waschosen for the current work. In all force measurements thepulling direction was along the length of the roll.
A huge range of nonwoven fabrics is available but thosebased on polypropylene fibres are most commonly used forincontinence pad coverstocks (the layer that lays against theskin) and nonwovens experts at SCA Hygiene Products (partsponsors of this work) selected three of these for the currentwork (Table 1). All were experimental fabrics produced by awell-known supplier of nonwovens for the hygiene industry,and all had the same area density (basis weight in thelanguage of textiles) of 17 g m−2 ¼ 1:7� 10−2 kg m−2. Addition-ally, all fabrics had the same common surface treatments andthe same thermal bonding pattern (calendering) in terms ofthe size, shape and lattice size of bonding points. Theydiffered principally in the diameter of their fibres and in theirfibre length per unit area of fabric, variables which werejudged likely to be the principal factors in determining
Table 1 – A summary table for the nonwovens used in this projemeasure linear density (titre) is defined as the mass in grams ofibre diameter (that is, the length of fibre per area of fabric) usipolypropylene, ρPP ¼ 904 kg m−372 kg m−3 (Kaye and Laby, 2004
Fabric code Linear density (dtex)
NW1 2.0NW3 1.4NW6 3.6
friction. Accordingly, the fabrics were chosen to representas wide a range as possible of these variables. All samples ofeach nonwoven came from the same roll of the same batch;samples of each were thus as nearly equivalent as differentsamples of nonwoven ever can be. The method by whichnonwovens are produced causes them to be anisotropic: the“upper” surface is different from the “lower” surface, and the“machine direction” is different from the “cross direction”.There is no strict convention on which side of nonwovencoverstocks is in contact with skin in use, so the choice ofwhich side to characterise is arbitrary, but must be consis-tent. The nonwovens used in this work were thereforelabelled to identify their orientation.
5. Measuring the fibre footprint
The arrangement of fibres in nonwoven coverstocks is sparse:the fibres typically occupy much less than 10% of the nominalfabric volume and so when they lay against a surface, theiractual contact area – the fibre footprint, through which anyfriction is mediated – with even a very compliant substrateis very much smaller than the nominal contact area. Themethod chosen to measure the fibre contact length made useof what is usually encountered as a limitation in opticalmicroscopy: its limited depth of field (DoF). If the focal planeof the microscope is placed at the interface between a surfaceand a piece of nonwoven laying on it then any fibres that arenot discernibly out of focus must be no further from the focalplane than a single characteristic depth of field distance. Ifthe depth of field is shallow enough then this effect can beused to assess whether a fibre is in contact with the surface.From the contact length information it is quite simple tocalculate contact area up to an unknown constant factorcorresponding to the skin (surrogate) relief.
It would have been ideal to measure the fibre footprint ofnonwovens against the Lorica Soft used in friction experi-ments but this proved impractical. Lorica Soft is opaque andso the interface would have to have been viewed through thenonwoven, but fibres “above” others at the interface obscurethe latter sufficiently to make the resultant images very hardto interpret.
Additionally, because the surface of Lorica Soft is irregular,it is difficult to focus on the exact plane of the surface, evenif the surface can indeed be reasonably approximated asa plane. Further, even if the Lorica Soft surface is “grossly”planar, like skin, it is covered in fine lines and wrinkles thatby definition deviate from the plane: the DoF technique
ct. The curious “decitex” unit used by textile technologists tof 10 km of fibre. For these fibres this may be converted to ang the circular cross section of the fibres and the density of).
Fibre diameter ðμmÞ Fibre density ðμm mm−2Þ
16.870.2 8.5� 104
14.070.3 1.2� 105
22.570.2 4.7� 104
-1 -0.8 -0.6 -0.4 -0.2 0.00 0.2 0.4 0.6 0.8 1
-18
-16
-14
-12
-10
-8
-6
-4
-2
0
1.00E-0023.00E-0025.00E-0027.00E-0021.00E-001
Lateral distance from centre / contact lengths
Sur
face
def
lect
ion
/ µm
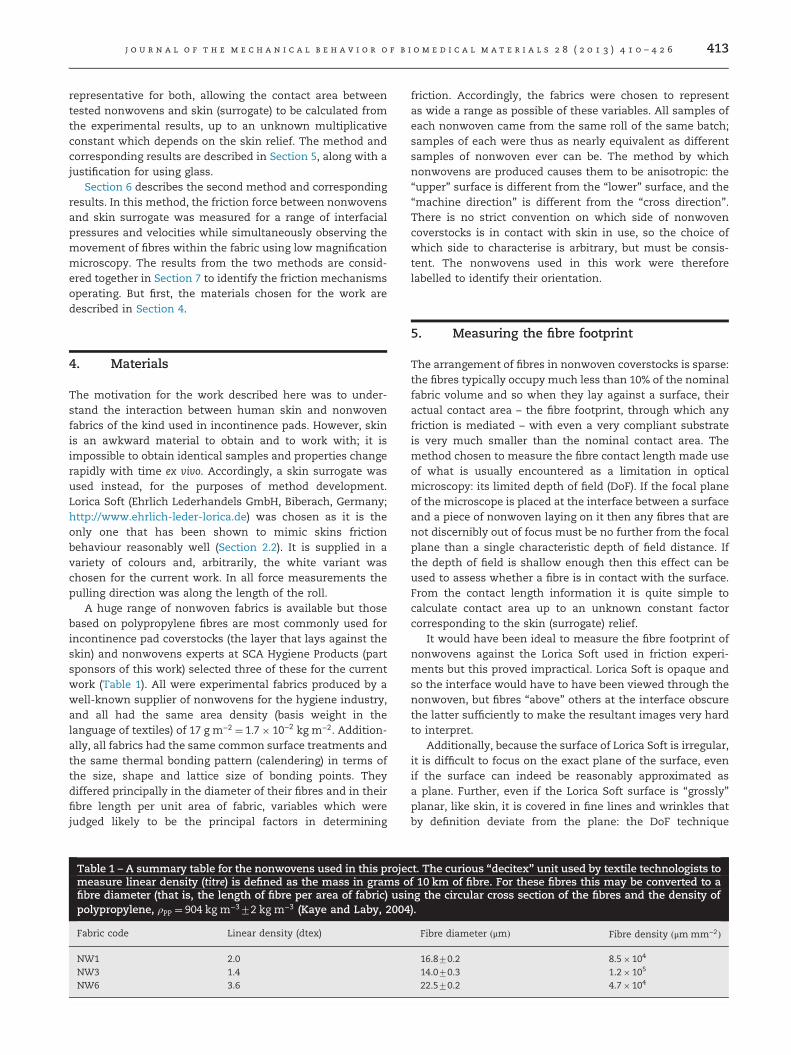
Fig. 1 – Surface deflection due to parallel, aligned fibresegments of length 400 μm each separated by 400 μmm,typical values for the nonwovens used in this work. Thecurves each represent a different pressure (materialindependent – Π values given in the key). For comparison, thefibre diameter is taken as 20 μm. For simplicity only fivefibres were used to create this graph, but as deflectionsrapidly decay very little error is introduced.
j o u r n a l o f t h e m e c h a n i c a l b e h a v i o r o f b i o m e d i c a l m a t e r i a l s 2 8 ( 2 0 1 3 ) 4 1 0 – 4 2 6414
would unavoidably be inaccurate in this respect as it wouldconsider the gross, planar surface not including these details.However, these limitations can be avoided if a smooth, flat,transparent glass surface is used instead of Lorica Soft, andthe following section shows that, surprisingly, glass is anexcellent surrogate for Lorica Soft (or real skin) for measuringthe length of the fibre footprint.
5.1. Justification for using glass to represent skin andLorica Soft
It is immediately apparent that the contact area between anonwoven and glass will be radically different from thatbetween the same nonwoven and Lorica Soft or skin underthe same conditions. However, since the imaging method usedin this work (described in Section 5.3) does not measure contactarea but rather fibre contact length, the comparison that is reallymade is between the contact length for a nonwoven againstglass or Lorica Soft/skin. The contact length of fibres is primarilydetermined by the mechanical properties of the fibre assemblywhich constitutes the nonwoven as the structure modulus forthe nonwoven is substantially lower than the modulus of thefibre polymer or any of the facing materials. In view of this theidea that one substrate material can be substituted for anotherwithout significantly changing the contact length results nolonger seems unlikely. This section demonstrates that – so faras contact length goes – nonwoven against glass is insignif-icantly different from nonwoven against Lorica Soft or skin. It isthus possible to calculate the contact area between fibre andskin/Lorica Soft (up to an unknown constant) from thesenonwoven-glass contact length data and the material proper-ties of skin/Lorica Soft.
If fibre segments are pressed against a surface there willbe “bulging out” of the surface between the contacting fibresegments – to a degree dependent on the mechanical proper-ties of the materials – which acts to bring additional fibresegments into contact with the surface, causing rearrange-ment of all fibres and a second order change in the fibrefootprint. If the bulge heights for all compared materials aresmall relative to a fibre diameter then bulging has nosignificant effect on contact length for any material, leavingcontact length determined entirely by the properties of thenonwoven and independent of those of the substrate. Toascertain whether glass can be used to represent skin andLorica Soft in such measurements, it is necessary to obtainand compare the characteristic “bulge” heights of the sur-faces. Given the small deformations involved and the diffi-culties of measuring them directly, the problem of calculatingbulge heights was addressed using linear elasticity theory ina half space. The complexity and variety of the fibre contactsegments precludes any attempt to model the details directly;instead, noting that most fibres have a low curvature it ismore helpful to consider the behaviour of an ensemble ofstraight fibres of known pitch and dimensions.
In order to obtain a solution with finite near and far fields,the support for contact force density must also be finite. Inthe interests of simplicity, it is assumed here that a constantforce density p is exerted over the interval ½−L; L� in x and½−a; a� in y, with 2a corresponding to contact width and 2L atypical fibre contact length. From these assumptions the
surface deflection can be calculated using Boussinesq's solu-tion (see Johnson, 1985c):
uzðx; yÞ ¼ p1−ν2
πE
Z a
−a
Z L
−L
1ffiffiffiffiffiffiffiffiffiffiffiffiffiffiffiffiffiffiffiffiffiffiffiffiffiffiffiffiffiffiffiffiffiffiffiffiðy−y′Þ2 þ ðx−x′Þ2
q dx′ dy′
¼ p1−ν2
πE
Z a
−alog
ffiffiffiffiffiffiffiffiffiffiffiffiffiffiffiffiffiffiffiffiffiffiffiffiffiffiffiffiffiffiffiffiffiffiffiffiffiffiðy−y′Þ2 þ ðxþ LÞ2
qþ ðxþ LÞffiffiffiffiffiffiffiffiffiffiffiffiffiffiffiffiffiffiffiffiffiffiffiffiffiffiffiffiffiffiffiffiffiffiffi
ðy−y′Þ2 þ ðx−LÞ2q
þ ðx−LÞ
0B@
1CA dy′
¼ p1−ν2
πE
f ðyþ a; xþ L; x−LÞ−f ðy−a; xþ L; x−LÞþf ðxþ L; yþ a; y−aÞ−f ðx−L; yþ a; y−aÞ
!;
where
f ðα; β; γÞ≔α log
ffiffiffiffiffiffiffiffiffiffiffiffiffiffiffiffiα2 þ β2
pþ βffiffiffiffiffiffiffiffiffiffiffiffiffiffiffi
α2 þ γ2p
þ γ
!;
E is Young's modulus and ν is Poisson's ratio. The originalquestion of the characteristic “bulge” between fibres can now beaddressed by taking multiple instances of this solution centredon locations separated by λ and adding them together. Anexample of the results obtained is shown for reference in Fig. 1;the family of curves represents surface deflection as a functionof distance from the central fibre's axis for a variety of values ofΠ ¼ pnomð1−ν2Þ=E. The maximum “bulge” height for fibre con-tact segments with the typical parameters used in the graph istabulated in Table 2 for a variety of Π values.
Before any characteristics can be obtained, the parametersof the model (a, L, characteristic distance between fibres ðλÞ,and p) must be related to known quantities. For L and λ this iseasily done: results presented later (Section 5.5) show that themean fibre contact length varies very slowly with pressureand is typically about 400 μm, and that if the fibre contactswere laid out in parallel and equally spaced straight linesthen they would be separated by about the same distance.Contact pressure can also be dealt with: taking the assump-tion of uniformity, p¼ pnomλ=2a where pnom is the nominalpressure. Contact width is most convincingly estimated bymaking use of the two-dimensional Hertz theory for an

Table 2 – Bulge height calculated on the basis of five fibres aligned as described in the text. The “pressure” is in factΠ ¼ pnomð1−ν2Þ=E in order to make the table material-independent, where pnom is the nominal applied force per unit area, ν isPoisson's ratio, and E is Young's modulus.
Pressure ðΠÞ Maximum deflection ðμmÞ Minimum deflection ðμmÞ “Bulge height ðμmÞ
1� 10−3 2.2� 10−2 7.5� 10−3 1.4� 10−2
1� 10−2 5.9� 10−1 2.4� 10−1 3.5� 10−1
3� 10−2 2.8 1.2 1.65� 10−2 5.8 2.7 3.17� 10−2 9.3 4.4 4.91� 10−1 15 7.5 7.8
Slides
Nonwoven
Springs
Fig. 2 – Simple apparatus used to apply pressures tononwoven under a microscope. The upper and lower surfacesare drilled so that there is an entirely uninterrupted light pathfrom the light source to the immediate environment of thenonwoven, and from there to the microscope lens. The slidesand nonwoven are not attached to the rest of the assemblyand can be freely positioned.
j o u r n a l o f t h e m e c h a n i c a l b e h a v i o r o f b i o m e d i c a l m a t e r i a l s 2 8 ( 2 0 1 3 ) 4 1 0 – 4 2 6 415
infinite cylinder pressed into an elastic half space. For thissystem, the contact width is given by
a¼ffiffiffiffiffiffiffiffiffi4PRπEn
r; ð1Þ
where P is the linear force density, R is the cylinder radius(set to 10 μm in the following analysis – see Table 1), and (fora rigid fibre) En ¼ E=ð1−ν2) is the plane modulus (Johnson,1985d). Linear force density is related to mean pressure byP¼ 2pa¼ pnomλ (Johnson, 1985d), so
a¼ffiffiffiffiffiffiffiffiffiffiffiffiffiffiffiffiffiffiffi4pnomλR
πEn
r¼
ffiffiffiffiffiffiffiffiffiffiffiffiffi4λRπ
Π
r: ð2Þ
The results presented in Fig. 1 and Table 2 suggest that –provided Πo5� 10−2 – the bulge is sufficiently small thatfew “additional” fibre contacts will be formed; that is, movingbetween two substrate materials for which Π obeys thiscondition is unlikely to cause any substantial alteration inthe fibre contacts.
For micron-scale indentations the relevant mechanicalproperties for skin are those of the stratum corneum (SC).The reported modulus of the SC varies widely, but at 100% RH(most compliant) the lowest result known is En ¼ 6 MPa Parkand Baddiel, 1972, giving Π ¼ 8� 10−3 for the highest loadsused in this work. (A review of the mechanical properties ofSC is provided by Cottenden, 2011). As part of the presentwork the stiffness of the laminar structure of the Lorica Softwas measured in uniform stress (compression, normal to thesheet) and uniform strain (tensile, parallel to the sheet), andthe most superficial lamina was found to have a stiffness,En4En
unif strain≈6 MPa for Π ¼ 8� 10−3 again. At Π ¼ 8� 10−3 thebulge height is 0:3 μm, which is 1%–2% of a fibre diameter. It isthus reasonable to expect that second-order fibre rearrange-ment will be equally negligible against skin or Lorica Soft asagainst glass (where Π is substantially smaller).
In summary, although contact length measurements can-not be taken on skin and Lorica Soft (as would be ideal),measurements made on glass are excellent surrogates.
5.2. Apparatus
The apparatus designed to gather DoF data is very simple; itneed only apply known pressures within the confined spaceof the microscope stage, so consists of two perspex platesand an arrangement of springs (Fig. 2). The springs are abovethe upper plate and serve to apply a compressive force. Asthe wing nuts are tightened, the vertical travel – and so the
force they apply – can be controlled very precisely. Thepressure plates apply their pressure to a piece of nonwovenheld between a pair of crossed microscope slides (chosen fortransparency and flatness; 24:57 1
4 mm� 76:07 14 mm). The
high stiffness of glass compared to the applied pressures(Eglass≈80 GPa (Kaye and Laby, 2004), pmax ¼ 50 kPa) meansthat no significant deformation of the slides will occur,and thus flat “anvils” can be safely used (see Section 6.1).Experiments were conducted using five different pressuresspanning the range selected for pulling experiments (seeSection 6.1). Due to the difficulty in assessing when the springsfirst apply pressure to better than about 0.5–1 rotation, the verylowest pressures (0.5 kPa and 1.5 kPa) were achieved using puredeadweight loading, omitting the upper plate and adding asmall additional weight with a hole (for microscopy) on the top.This simple system works well for low pressures, but the size ofthe required deadweight and the consequent instability thatwould be suffered make it inappropriate for higher pressures(5 kPa, 15 kPa, and 50 kPa).
5.3. Method for raw data collection
The method for measuring fibre contact lengths can bedivided into two main stages: gathering raw micrographs;
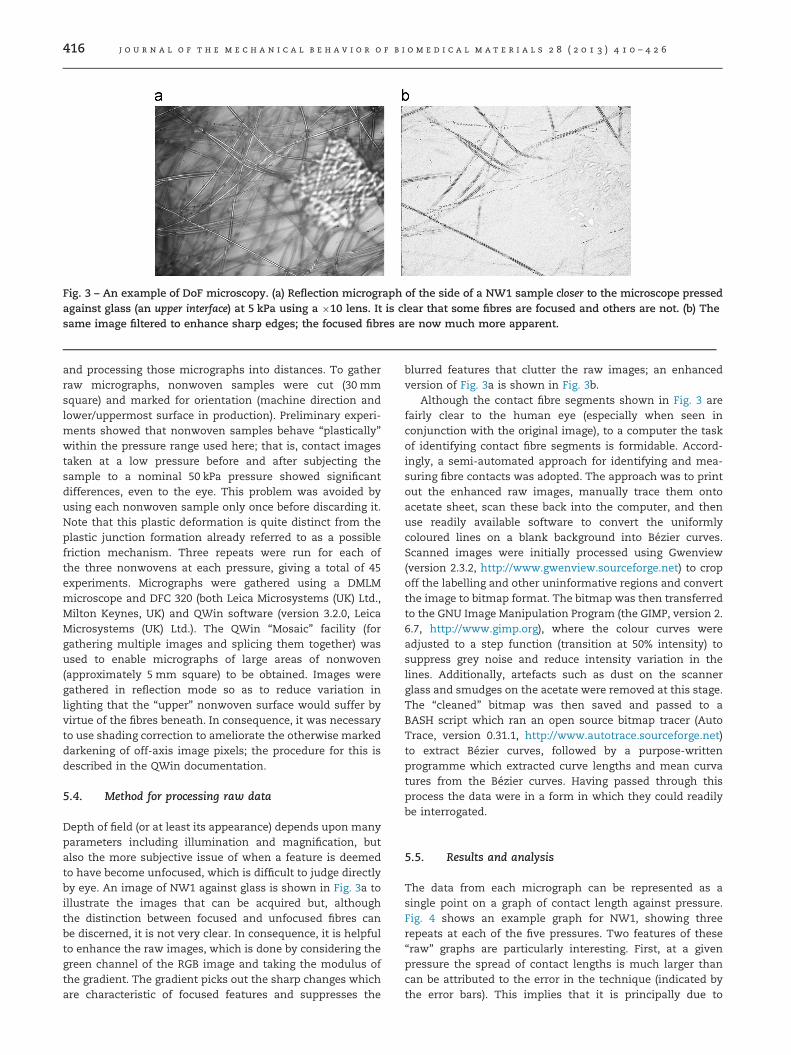
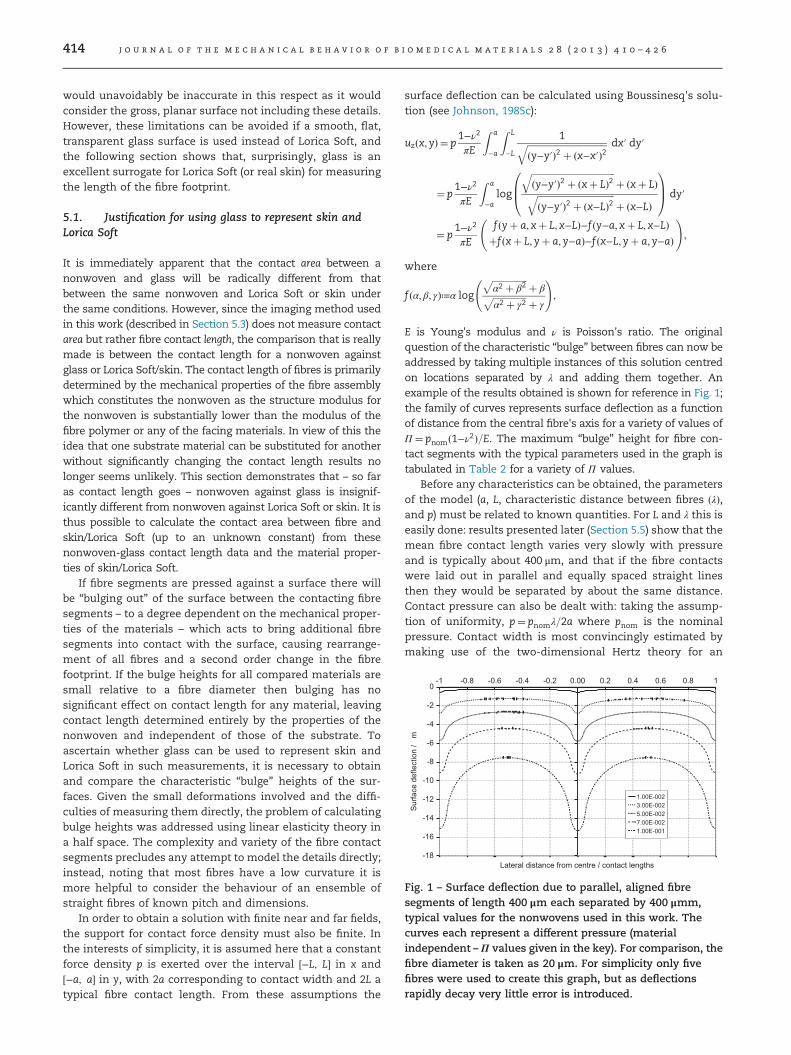
Fig. 3 – An example of DoF microscopy. (a) Reflection micrograph of the side of a NW1 sample closer to the microscope pressedagainst glass (an upper interface) at 5 kPa using a �10 lens. It is clear that some fibres are focused and others are not. (b) Thesame image filtered to enhance sharp edges; the focused fibres are now much more apparent.
j o u r n a l o f t h e m e c h a n i c a l b e h a v i o r o f b i o m e d i c a l m a t e r i a l s 2 8 ( 2 0 1 3 ) 4 1 0 – 4 2 6416
and processing those micrographs into distances. To gatherraw micrographs, nonwoven samples were cut (30 mmsquare) and marked for orientation (machine direction andlower/uppermost surface in production). Preliminary experi-ments showed that nonwoven samples behave “plastically”within the pressure range used here; that is, contact imagestaken at a low pressure before and after subjecting thesample to a nominal 50 kPa pressure showed significantdifferences, even to the eye. This problem was avoided byusing each nonwoven sample only once before discarding it.Note that this plastic deformation is quite distinct from theplastic junction formation already referred to as a possiblefriction mechanism. Three repeats were run for each ofthe three nonwovens at each pressure, giving a total of 45experiments. Micrographs were gathered using a DMLMmicroscope and DFC 320 (both Leica Microsystems (UK) Ltd.,Milton Keynes, UK) and QWin software (version 3.2.0, LeicaMicrosystems (UK) Ltd.). The QWin “Mosaic” facility (forgathering multiple images and splicing them together) wasused to enable micrographs of large areas of nonwoven(approximately 5 mm square) to be obtained. Images weregathered in reflection mode so as to reduce variation inlighting that the “upper” nonwoven surface would suffer byvirtue of the fibres beneath. In consequence, it was necessaryto use shading correction to ameliorate the otherwise markeddarkening of off-axis image pixels; the procedure for this isdescribed in the QWin documentation.
5.4. Method for processing raw data
Depth of field (or at least its appearance) depends upon manyparameters including illumination and magnification, butalso the more subjective issue of when a feature is deemedto have become unfocused, which is difficult to judge directlyby eye. An image of NW1 against glass is shown in Fig. 3a toillustrate the images that can be acquired but, althoughthe distinction between focused and unfocused fibres canbe discerned, it is not very clear. In consequence, it is helpfulto enhance the raw images, which is done by considering thegreen channel of the RGB image and taking the modulus ofthe gradient. The gradient picks out the sharp changes whichare characteristic of focused features and suppresses the
blurred features that clutter the raw images; an enhancedversion of Fig. 3a is shown in Fig. 3b.
Although the contact fibre segments shown in Fig. 3 arefairly clear to the human eye (especially when seen inconjunction with the original image), to a computer the taskof identifying contact fibre segments is formidable. Accord-ingly, a semi-automated approach for identifying and mea-suring fibre contacts was adopted. The approach was to printout the enhanced raw images, manually trace them ontoacetate sheet, scan these back into the computer, and thenuse readily available software to convert the uniformlycoloured lines on a blank background into Bézier curves.Scanned images were initially processed using Gwenview(version 2.3.2, http://www.gwenview.sourceforge.net) to cropoff the labelling and other uninformative regions and convertthe image to bitmap format. The bitmap was then transferredto the GNU Image Manipulation Program (the GIMP, version 2.6.7, http://www.gimp.org), where the colour curves wereadjusted to a step function (transition at 50% intensity) tosuppress grey noise and reduce intensity variation in thelines. Additionally, artefacts such as dust on the scannerglass and smudges on the acetate were removed at this stage.The “cleaned” bitmap was then saved and passed to aBASH script which ran an open source bitmap tracer (AutoTrace, version 0.31.1, http://www.autotrace.sourceforge.net)to extract Bézier curves, followed by a purpose-writtenprogramme which extracted curve lengths and mean curvatures from the Bézier curves. Having passed through thisprocess the data were in a form in which they could readilybe interrogated.
5.5. Results and analysis
The data from each micrograph can be represented as asingle point on a graph of contact length against pressure.Fig. 4 shows an example graph for NW1, showing threerepeats at each of the five pressures. Two features of these“raw” graphs are particularly interesting. First, at a givenpressure the spread of contact lengths is much larger thancan be attributed to the error in the technique (indicated bythe error bars). This implies that it is principally due to
0.1 101 1000
10000
20000
30000
40000
50000
60000
70000
80000
f(x) = 6113.66 ln(x) + 38460.59R²= 0.6
Pressure / kPa
Con
tact
leng
th /
μm
Fig. 4 – Contact length against pressure for NW1 and glass.Each point corresponds to a single micrograph. In all casesthe pressure error bars are smaller than the marker; contactlength error bars are based upon the approximate 75% totalprocess error identified in method validation work.
0 5 10 15 20 25 30 35 40 45 500.0E+0
1.0E-3
2.0E-3
3.0E-3
4.0E-3
f(x) = 4.14E-4 x^5.74E-1R = 1.00E+0
Pressure / kPa
Con
tact
frac
tion
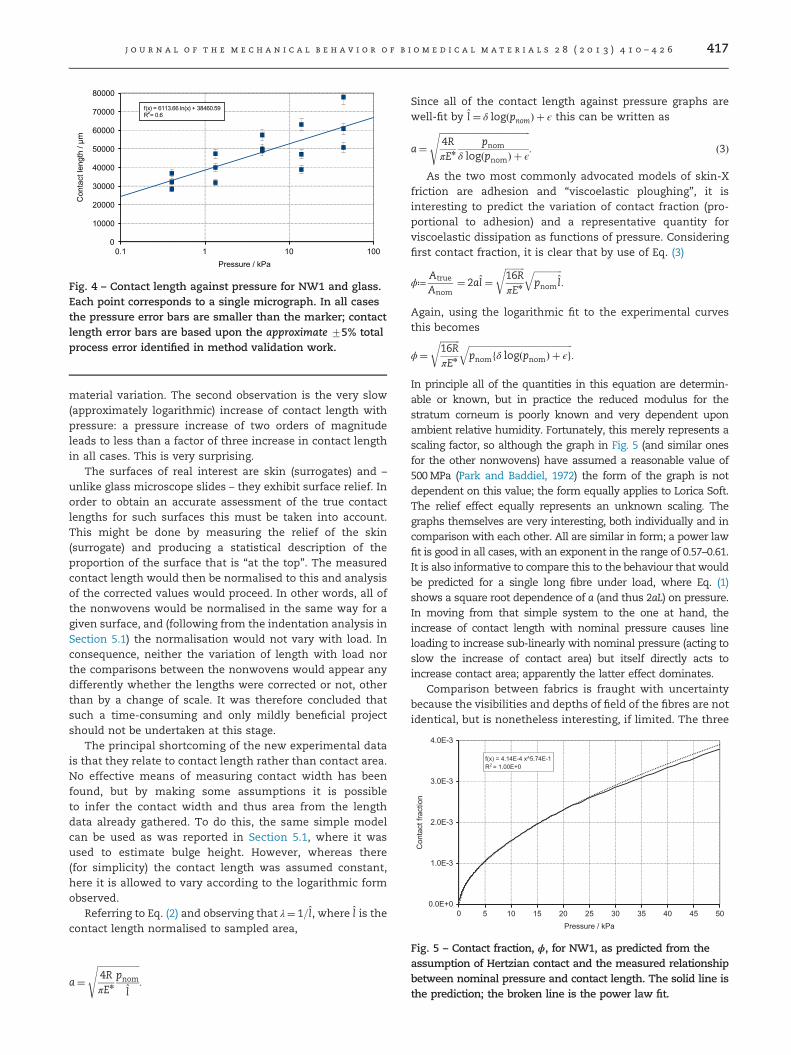
Fig. 5 – Contact fraction, ϕ, for NW1, as predicted from theassumption of Hertzian contact and the measured relationshipbetween nominal pressure and contact length. The solid line isthe prediction; the broken line is the power law fit.
j o u r n a l o f t h e m e c h a n i c a l b e h a v i o r o f b i o m e d i c a l m a t e r i a l s 2 8 ( 2 0 1 3 ) 4 1 0 – 4 2 6 417
material variation. The second observation is the very slow(approximately logarithmic) increase of contact length withpressure: a pressure increase of two orders of magnitudeleads to less than a factor of three increase in contact lengthin all cases. This is very surprising.
The surfaces of real interest are skin (surrogates) and –
unlike glass microscope slides – they exhibit surface relief. Inorder to obtain an accurate assessment of the true contactlengths for such surfaces this must be taken into account.This might be done by measuring the relief of the skin(surrogate) and producing a statistical description of theproportion of the surface that is “at the top”. The measuredcontact length would then be normalised to this and analysisof the corrected values would proceed. In other words, all ofthe nonwovens would be normalised in the same way for agiven surface, and (following from the indentation analysis inSection 5.1) the normalisation would not vary with load. Inconsequence, neither the variation of length with load northe comparisons between the nonwovens would appear anydifferently whether the lengths were corrected or not, otherthan by a change of scale. It was therefore concluded thatsuch a time-consuming and only mildly beneficial projectshould not be undertaken at this stage.
The principal shortcoming of the new experimental datais that they relate to contact length rather than contact area.No effective means of measuring contact width has beenfound, but by making some assumptions it is possibleto infer the contact width and thus area from the lengthdata already gathered. To do this, the same simple modelcan be used as was reported in Section 5.1, where it wasused to estimate bulge height. However, whereas there(for simplicity) the contact length was assumed constant,here it is allowed to vary according to the logarithmic formobserved.
Referring to Eq. (2) and observing that λ¼ 1=l̂, where l̂ is thecontact length normalised to sampled area,
a¼ffiffiffiffiffiffiffiffiffiffiffiffiffiffiffiffiffiffiffi4RπEn
pnoml̂
s:
Since all of the contact length against pressure graphs arewell-fit by l̂ ¼ δ logðpnomÞ þ ϵ this can be written as
a¼ffiffiffiffiffiffiffiffiffiffiffiffiffiffiffiffiffiffiffiffiffiffiffiffiffiffiffiffiffiffiffiffiffiffiffiffiffiffiffiffiffi4RπEn
pnomδ logðpnomÞ þ ϵ
s: ð3Þ
As the two most commonly advocated models of skin-Xfriction are adhesion and “viscoelastic ploughing”, it isinteresting to predict the variation of contact fraction (pro-portional to adhesion) and a representative quantity forviscoelastic dissipation as functions of pressure. Consideringfirst contact fraction, it is clear that by use of Eq. (3)
ϕ≔Atrue
Anom¼ 2al̂ ¼
ffiffiffiffiffiffiffiffiffi16RπEn
r ffiffiffiffiffiffiffiffiffiffiffiffiffipnom l̂
q:
Again, using the logarithmic fit to the experimental curvesthis becomes
ϕ¼ffiffiffiffiffiffiffiffiffi16RπEn
r ffiffiffiffiffiffiffiffiffiffiffiffiffiffiffiffiffiffiffiffiffiffiffiffiffiffiffiffiffiffiffiffiffiffiffiffiffiffiffiffiffiffiffiffiffiffiffipnomfδ logðpnomÞ þ ϵg
q:
In principle all of the quantities in this equation are determin-able or known, but in practice the reduced modulus for thestratum corneum is poorly known and very dependent uponambient relative humidity. Fortunately, this merely represents ascaling factor, so although the graph in Fig. 5 (and similar onesfor the other nonwovens) have assumed a reasonable value of500MPa (Park and Baddiel, 1972) the form of the graph is notdependent on this value; the form equally applies to Lorica Soft.The relief effect equally represents an unknown scaling. Thegraphs themselves are very interesting, both individually and incomparison with each other. All are similar in form; a power lawfit is good in all cases, with an exponent in the range of 0.57–0.61.It is also informative to compare this to the behaviour that wouldbe predicted for a single long fibre under load, where Eq. (1)shows a square root dependence of a (and thus 2aL) on pressure.In moving from that simple system to the one at hand, theincrease of contact length with nominal pressure causes lineloading to increase sub-linearly with nominal pressure (acting toslow the increase of contact area) but itself directly acts toincrease contact area; apparently the latter effect dominates.
Comparison between fabrics is fraught with uncertaintybecause the visibilities and depths of field of the fibres are notidentical, but is nonetheless interesting, if limited. The three
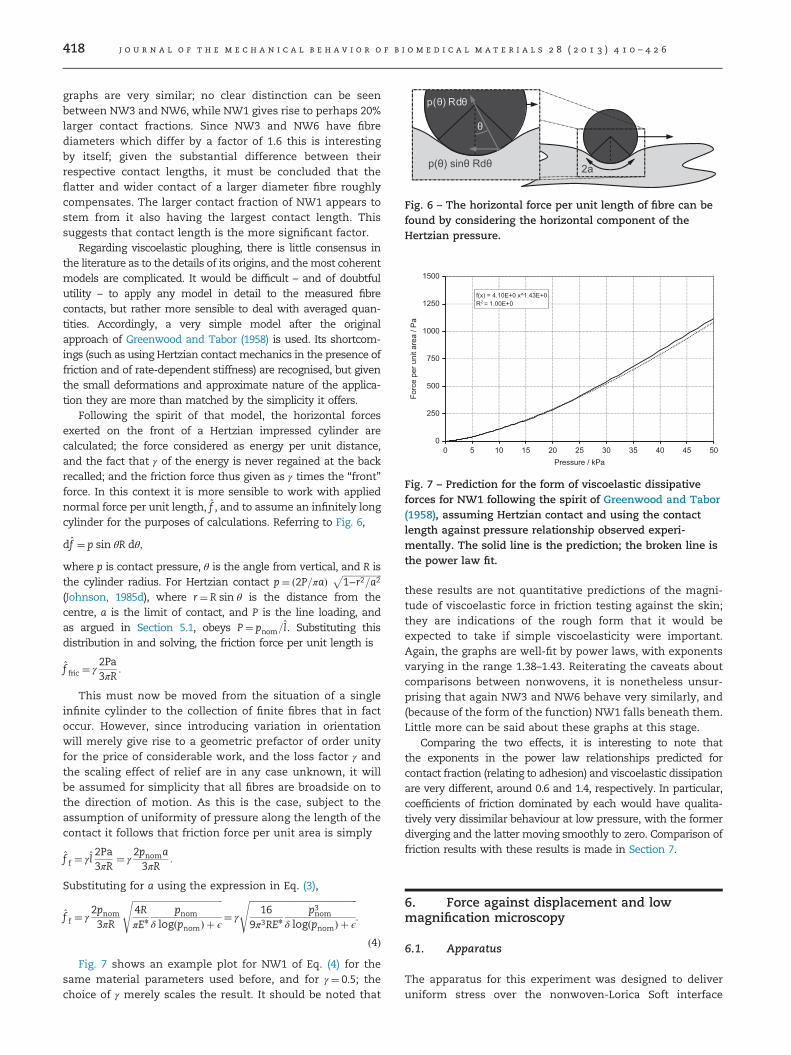
Fig. 6 – The horizontal force per unit length of fibre can befound by considering the horizontal component of theHertzian pressure.
0 5 10 15 20 25 30 35 40 45 500
250
500
750
1000
1250
1500
f(x) = 4.10E+0 x^1.43E+0R = 1.00E+0
Pressure / kPa
Forc
e pe
r uni
t are
a / P
a
Fig. 7 – Prediction for the form of viscoelastic dissipativeforces for NW1 following the spirit of Greenwood and Tabor(1958), assuming Hertzian contact and using the contactlength against pressure relationship observed experi-mentally. The solid line is the prediction; the broken line isthe power law fit.
j o u r n a l o f t h e m e c h a n i c a l b e h a v i o r o f b i o m e d i c a l m a t e r i a l s 2 8 ( 2 0 1 3 ) 4 1 0 – 4 2 6418
graphs are very similar; no clear distinction can be seenbetween NW3 and NW6, while NW1 gives rise to perhaps 20%larger contact fractions. Since NW3 and NW6 have fibrediameters which differ by a factor of 1.6 this is interestingby itself; given the substantial difference between theirrespective contact lengths, it must be concluded that theflatter and wider contact of a larger diameter fibre roughlycompensates. The larger contact fraction of NW1 appears tostem from it also having the largest contact length. Thissuggests that contact length is the more significant factor.
Regarding viscoelastic ploughing, there is little consensus inthe literature as to the details of its origins, and themost coherentmodels are complicated. It would be difficult – and of doubtfulutility – to apply any model in detail to the measured fibrecontacts, but rather more sensible to deal with averaged quan-tities. Accordingly, a very simple model after the originalapproach of Greenwood and Tabor (1958) is used. Its shortcom-ings (such as using Hertzian contact mechanics in the presence offriction and of rate-dependent stiffness) are recognised, but giventhe small deformations and approximate nature of the applica-tion they are more than matched by the simplicity it offers.
Following the spirit of that model, the horizontal forcesexerted on the front of a Hertzian impressed cylinder arecalculated; the force considered as energy per unit distance,and the fact that γ of the energy is never regained at the backrecalled; and the friction force thus given as γ times the “front”force. In this context it is more sensible to work with appliednormal force per unit length, f̂ , and to assume an infinitely longcylinder for the purposes of calculations. Referring to Fig. 6,
df̂ ¼ p sin θR dθ;
where p is contact pressure, θ is the angle from vertical, and R isthe cylinder radius. For Hertzian contact p¼ ð2P=πaÞ
ffiffiffiffiffiffiffiffiffiffiffiffiffiffiffiffiffiffi1−r2=a2
p(Johnson, 1985d), where r¼ R sin θ is the distance from thecentre, a is the limit of contact, and P is the line loading, andas argued in Section 5.1, obeys P¼ pnom=l̂. Substituting thisdistribution in and solving, the friction force per unit length is
f̂ fric ¼ γ2Pa3πR
:
This must now be moved from the situation of a singleinfinite cylinder to the collection of finite fibres that in factoccur. However, since introducing variation in orientationwill merely give rise to a geometric prefactor of order unityfor the price of considerable work, and the loss factor γ andthe scaling effect of relief are in any case unknown, it willbe assumed for simplicity that all fibres are broadside on tothe direction of motion. As this is the case, subject to theassumption of uniformity of pressure along the length of thecontact it follows that friction force per unit area is simply
f̂ f ¼ γl̂2Pa3πR
¼ γ2pnoma3πR
:
Substituting for a using the expression in Eq. (3),
f̂ f ¼ γ2pnom3πR
ffiffiffiffiffiffiffiffiffiffiffiffiffiffiffiffiffiffiffiffiffiffiffiffiffiffiffiffiffiffiffiffiffiffiffiffiffiffiffiffiffi4RπEn
pnomδ logðpnomÞ þ ϵ
s¼ γ
ffiffiffiffiffiffiffiffiffiffiffiffiffiffiffiffiffiffiffiffiffiffiffiffiffiffiffiffiffiffiffiffiffiffiffiffiffiffiffiffiffiffiffiffiffiffiffiffiffi16
9π3REn
p3nomδ logðpnomÞ þ ϵ
s:
ð4ÞFig. 7 shows an example plot for NW1 of Eq. (4) for the
same material parameters used before, and for γ ¼ 0:5; thechoice of γ merely scales the result. It should be noted that
these results are not quantitative predictions of the magni-tude of viscoelastic force in friction testing against the skin;they are indications of the rough form that it would beexpected to take if simple viscoelasticity were important.Again, the graphs are well-fit by power laws, with exponentsvarying in the range 1.38–1.43. Reiterating the caveats aboutcomparisons between nonwovens, it is nonetheless unsur-prising that again NW3 and NW6 behave very similarly, and(because of the form of the function) NW1 falls beneath them.Little more can be said about these graphs at this stage.
Comparing the two effects, it is interesting to note thatthe exponents in the power law relationships predicted forcontact fraction (relating to adhesion) and viscoelastic dissipationare very different, around 0.6 and 1.4, respectively. In particular,coefficients of friction dominated by each would have qualita-tively very dissimilar behaviour at low pressure, with the formerdiverging and the latter moving smoothly to zero. Comparison offriction results with these results is made in Section 7.
6. Force against displacement and lowmagnification microscopy
6.1. Apparatus
The apparatus for this experiment was designed to deliveruniform stress over the nonwoven-Lorica Soft interface

j o u r n a l o f t h e m e c h a n i c a l b e h a v i o r o f b i o m e d i c a l m a t e r i a l s 2 8 ( 2 0 1 3 ) 4 1 0 – 4 2 6 419
whilst driving it at a constant speed. Simultaneously, theforce required to maintain motion, and the behaviour of theLorica Soft and the nonwoven fibres needed to be observable.These requirements were all met by the apparatus illustratedin Fig. 8. At the heart of the equipment is a slider mountedwith two rectangles of Lorica Soft (100 mm long (in thedirection of motion) and 50 mm wide) – one above, one below– against which transparent, nonwoven-covered anvils areheld and loads applied using dead weights. The use of twononwoven-Lorica Soft interfaces was to avoid the turningmoment that would have been encountered with one if theline of pull of the tensometer had not passed exactly throughthe nonwoven/Lorica Soft interface. The 26 mm diameteranvils (each identified with a lower case Greek letter – seeTable 3) were made of epoxy resin, and shaped so that thenormal and transverse force densities were constant. Thisrequired a separate set of anvils for each pressure andmaterial used; the method for making anvils is described inthe appendix. Nonwoven was fixed to the anvils at theperiphery using nail varnish, and Lorica Soft to 2 mm thickperspex on either side of the slider using epoxy resin. Theslider assembly was pulled between the anvils at a constantspeed by a tensometer (MTT170, Diastron, Andover, UK)which measured the force required to maintain motion. Byvirtue of the transparency of the anvils and relatively sparsenature of the nonwoven it was possible to observe the fibresin the nonwoven and some of the Lorica Soft surface using amicroscope and camera (Leica DMLM and DFC295, LeicaMicrosystems (UK) Ltd., Milton Keynes, UK); a micrographicvideo of sliding was recorded for later evaluation using theLAS software for the microscope camera.
All experiments were carried out in an environmentallycontrolled room held at 23 1C71 1C and 50%75% relativehumidity in which materials were stored for at least one hourprior to testing.
All experiments were carried out at one of five differentvelocities ((0.05mm s−1, 0.167 mm s−1, 0.5 mm s−1, 1.67 mm s−1,and 5 mm s−1) covering the range of the tensometer, andfive different loads (pressures) (0.25 N (0.56 kPa), 0.73 N
Weights
Slider
Fig. 8 – The apparatus for force and low magnificationmicroscopy experiments. The upper surface slides freely onthe rods, providing the pressure, but is fairly unconstrainedin terms of orientation to enable it to adjust to anyimperfections in the anvils. The anvils are faced withnonwoven (not shown) and are pressed against the sliderassembly which bears the skin (surrogate). The wholeassembly is shown mounted on the microscope stage forwhich it was designed.
(1.5 kPa), 2.65 N (5.0 kPa), 8.09 N (15 kPa) and 19.01 N (32.1 kPa))covering the physiologically relevant range (Ferguson-Pell et al.,1976).
To clarify the following description, some terminologymust be introduced. The procedure in which the tensometershuttles back and forth with the slider once is referred to as acycle; a pre-programmed set of cycles is referred to as a phase;a set of phases designed to constitute a test of a particularcombination of parameters and materials (for example, achosen slider and nonwoven combination at a fixed speed)are referred to as a run. It is, of course, possible for a phaseto consist of only one cycle, and a run to contain onlyone phase.
In general, a first phase of experiments with a nonwovensample consisted of ten cycles – materials wore quite rapidlyinitially – with subsequent phases consisting of five cycles.The only exceptions to this were experiments at the slowestspeed where only those cycles deemed strictly necessarywere undertaken in order to save time. A given run continueduntil the majority of cycles in a five cycle phase wereconsistent; that is, they showed acceptably small randomvariation, and no longer any tendency for the force–displace-ment trace to drift up or down. In consequence mean traces –
calculated as simple point-by-point arithmetic means – wereusually based on four or five individual cycles, with threequite common and two very rare. Two different Lorica Softsliders were used, both cut in the same orientation but fromdifferent edges of the material roll and from different endsof the sample; these were designated sliders L8 and L11.Nonwovens were arbitrarily considered in the order NW6,NW3, NW1.
In this work the initial wear-in period was not studied.This was not because it was judged unimportant, but ratherbecause the long-term behaviour is also important and is lessawkward to measure. Further, it is reasonable (though cer-tainly unproven) to think that the same mechanisms will actas in the long-term case, though on an unworn nonwovenfibre configuration. Studying the initial friction behaviourand checking this hypothesis would be interesting, but isnot done here.
6.2. Results
The results for this experiment divide fundamentally intoforce data and microscopy data. An example of raw (indivi-dual cycle) data is given in Fig. 9, from which it is apparentthat there is a “wear-in” period of around 12 cycles duringwhich the friction force gradually diminishes to a relativelyrepeatable trace. These raw graphs give rise to mean-tracegraphs, produced by averaging data for all cycles beyond the“wear in” period. To facilitate simple comparison betweencurves all friction forces were normalised by the mean loadon the two anvils for a given run. Traces showing variationwith velocity are given in Fig. 10, and graphs summarising thevariation of the trace with load are shown in Fig. 11. Since theslight difference in load between the two anvil faces compli-cates matters slightly, traces grouped by load are labelledwith the letter designations of the anvils used. It is immedi-ately apparent that whilst in most cases there is veryconsiderable similarity between the traces for a given slider

Table 3 – A summary of anvils produced. Pressure and loadare not proportional as the contact area varied with load.
Designation Pressure (kPa) Load (N)
ρ 32.1 19.0s 1.5 0.73τ 5.0 2.65ϕ 0.6 0.25χ 15.0 8.09ψ 6.3 3.14ω 2.4 1.23
25 35 45 55 65 751
1.05
1.1
1.15
1.2
1.25
1.3
1.35
1 3 6 11 16 21 25
Displacement / mm
Fric
tion
forc
e / N
Fig. 9 – An example of a new slider (L11) “wearing in” over 25cycles. This experiment used the τ–ψ combination of anvils,NW6, and a sliding speed of 1:67 mm s−1. The final five cycles(21–25; only 21 and 25 shown) can be clearly seen to haveconverged and the run-to-run force reading to havestabilised.
Fig. 10 – Comparison of normalised force–displacementcurves at different sliding speeds for NW6 and the L8 LoricaSoft slider with anvils τ and ψ.
25 35 45 55 65 750.3
0.32
0.34
0.36
0.38
0.4
0.42
0.44
0.46
0.48
0.5
Displacement / mm
Frc
tion
/ Loa
d
Fig. 11 – Comparison of normalised force–displacementcurves at different loads (different anvils) for NW3 and the L8Lorica Soft slider at 0.5 mm s−1. The traces are labelled by thedesignation of the anvils used to take the measurements: thedifferential in load between the two surfaces precludeslabelling them with a simple pressure, so this simpleexpedient has been adopted here and henceforth.
j o u r n a l o f t h e m e c h a n i c a l b e h a v i o r o f b i o m e d i c a l m a t e r i a l s 2 8 ( 2 0 1 3 ) 4 1 0 – 4 2 6420
against different nonwovens, traces for the two slidersagainst the same nonwoven often differ markedly. This isnot unexpected: it is simply a reflection of the inhomogeneityof the Lorica Soft, and in fact provides a means by which toassess variation with sliding speed and load independently ofthe shape of the force–displacement curve.
Microscopy data from this experiment were very disap-pointing. Due to the very limited reflection from the LoricaSoft surfaces (skin could be expected to be similar) thecontrast in the fibres was poor, and they had very limited
visibility against the mottled backgrounds. The only generalcomment that can be made is that the fibres of all fabricswere seen to move in essentially all circumstances. Somealso periodically “flashed”; that is, they briefly reflected lightbefore appearing dull again. It is conjectured that thisbehaviour is due to the fibres being lifted up off the surface,thus changing their optical properties. However, “pinging” –
that is, movement with the slider followed by rapid correc-tion – was not seen. Nevertheless, whatever their othershortcomings the constant focus of the videos correspondingto sliders L8 and L11 made it clear that the slider thicknesseswere constant to less than 100 μm, which suggests thatsystematic noise due to non-constant thickness will havebeen no more than a few millinewtons and can thus beignored.
6.3. Analysis
Considering the data as a body, it is apparent that (a) therelative scale of the short-wavelength variation on the force–displacement traces decreases with increasing load; (b) ingeneral, friction increases with velocity, though not verymuch; (c) in several cases the first short distance of a tracedoes not conform to the patterns that the remainderdoes; and (d) in almost all cases the traces for a given slidershare a strong family resemblance; that is, their shapes arediscernibly alike. These observations are valuable guides toquantitative analysis.
In quantitative terms, the relationship between frictionforce and load, and friction force and sliding speed for theLorica Soft data are the simplest to establish. Consideringfriction force against load, it is useful to extract a singlenumber from the friction trace so that a plot of friction forceagainst load can be constructed. In all cases the traces are notuniform horizontal lines, so some interpretation is requiredin order to extract such a characteristic. Fortunately, as notedit is apparent that in the majority of cases the traces fordifferent loads applied to the same interface are not far from
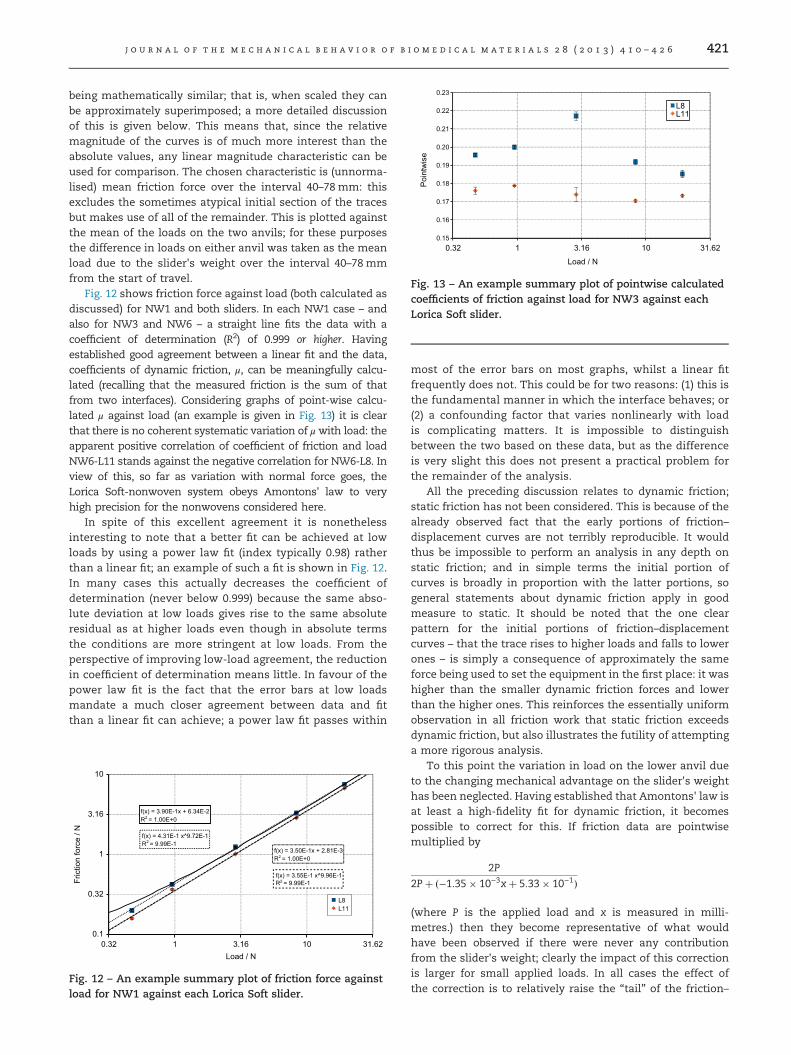
0.32 1 3.16 10 31.620.15
0.16
0.17
0.18
0.19
0.20
0.21
0.22
0.23
L8L11
Load / N
Poi
ntw
ise
Fig. 13 – An example summary plot of pointwise calculatedcoefficients of friction against load for NW3 against eachLorica Soft slider.
j o u r n a l o f t h e m e c h a n i c a l b e h a v i o r o f b i o m e d i c a l m a t e r i a l s 2 8 ( 2 0 1 3 ) 4 1 0 – 4 2 6 421
being mathematically similar; that is, when scaled they canbe approximately superimposed; a more detailed discussionof this is given below. This means that, since the relativemagnitude of the curves is of much more interest than theabsolute values, any linear magnitude characteristic can beused for comparison. The chosen characteristic is (unnorma-lised) mean friction force over the interval 40–78 mm: thisexcludes the sometimes atypical initial section of the tracesbut makes use of all of the remainder. This is plotted againstthe mean of the loads on the two anvils; for these purposesthe difference in loads on either anvil was taken as the meanload due to the slider's weight over the interval 40–78 mmfrom the start of travel.
Fig. 12 shows friction force against load (both calculated asdiscussed) for NW1 and both sliders. In each NW1 case – andalso for NW3 and NW6 – a straight line fits the data with acoefficient of determination (R2) of 0.999 or higher. Havingestablished good agreement between a linear fit and the data,coefficients of dynamic friction, μ, can be meaningfully calcu-lated (recalling that the measured friction is the sum of thatfrom two interfaces). Considering graphs of point-wise calcu-lated μ against load (an example is given in Fig. 13) it is clearthat there is no coherent systematic variation of μ with load: theapparent positive correlation of coefficient of friction and loadNW6-L11 stands against the negative correlation for NW6-L8. Inview of this, so far as variation with normal force goes, theLorica Soft-nonwoven system obeys Amontons' law to veryhigh precision for the nonwovens considered here.
In spite of this excellent agreement it is nonethelessinteresting to note that a better fit can be achieved at lowloads by using a power law fit (index typically 0.98) ratherthan a linear fit; an example of such a fit is shown in Fig. 12.In many cases this actually decreases the coefficient ofdetermination (never below 0.999) because the same abso-lute deviation at low loads gives rise to the same absoluteresidual as at higher loads even though in absolute termsthe conditions are more stringent at low loads. From theperspective of improving low-load agreement, the reductionin coefficient of determination means little. In favour of thepower law fit is the fact that the error bars at low loadsmandate a much closer agreement between data and fitthan a linear fit can achieve; a power law fit passes within
0.32 1 3.16 10 31.620.1
0.32
1
3.16
10
f(x) = 3.55E-1 x^9.96E-1R = 9.99E-1
f(x) = 4.31E-1 x^9.72E-1R = 9.99E-1
f(x) = 3.50E-1x + 2.81E-3R = 1.00E+0
f(x) = 3.90E-1x + 6.34E-2R = 1.00E+0
Load / N
Fric
tion
forc
e / N
L8L11
Fig. 12 – An example summary plot of friction force againstload for NW1 against each Lorica Soft slider.
most of the error bars on most graphs, whilst a linear fitfrequently does not. This could be for two reasons: (1) this isthe fundamental manner in which the interface behaves; or(2) a confounding factor that varies nonlinearly with loadis complicating matters. It is impossible to distinguishbetween the two based on these data, but as the differenceis very slight this does not present a practical problem forthe remainder of the analysis.
All the preceding discussion relates to dynamic friction;static friction has not been considered. This is because of thealready observed fact that the early portions of friction–displacement curves are not terribly reproducible. It wouldthus be impossible to perform an analysis in any depth onstatic friction; and in simple terms the initial portion ofcurves is broadly in proportion with the latter portions, sogeneral statements about dynamic friction apply in goodmeasure to static. It should be noted that the one clearpattern for the initial portions of friction–displacementcurves – that the trace rises to higher loads and falls to lowerones – is simply a consequence of approximately the sameforce being used to set the equipment in the first place: it washigher than the smaller dynamic friction forces and lowerthan the higher ones. This reinforces the essentially uniformobservation in all friction work that static friction exceedsdynamic friction, but also illustrates the futility of attemptinga more rigorous analysis.
To this point the variation in load on the lower anvil dueto the changing mechanical advantage on the slider's weighthas been neglected. Having established that Amontons' law isat least a high-fidelity fit for dynamic friction, it becomespossible to correct for this. If friction data are pointwisemultiplied by
2P
2Pþ ð−1:35� 10−3xþ 5:33� 10−1Þ
(where P is the applied load and x is measured in milli-metres.) then they become representative of what wouldhave been observed if there were never any contributionfrom the slider's weight; clearly the impact of this correctionis larger for small applied loads. In all cases the effect ofthe correction is to relatively raise the “tail” of the friction–
25 35 45 55 65 750.3
0.32
0.34
0.36
0.38
0.4
0.42
0.44
0.46
0.48
0.5
Displacement / mm
Cor
rect
ed fr
ictio
n / L
oad
0.11
arb
j o u r n a l o f t h e m e c h a n i c a l b e h a v i o r o f b i o m e d i c a l m a t e r i a l s 2 8 ( 2 0 1 3 ) 4 1 0 – 4 2 6422
displacement traces. Data discussed henceforth have hadthis correction applied.
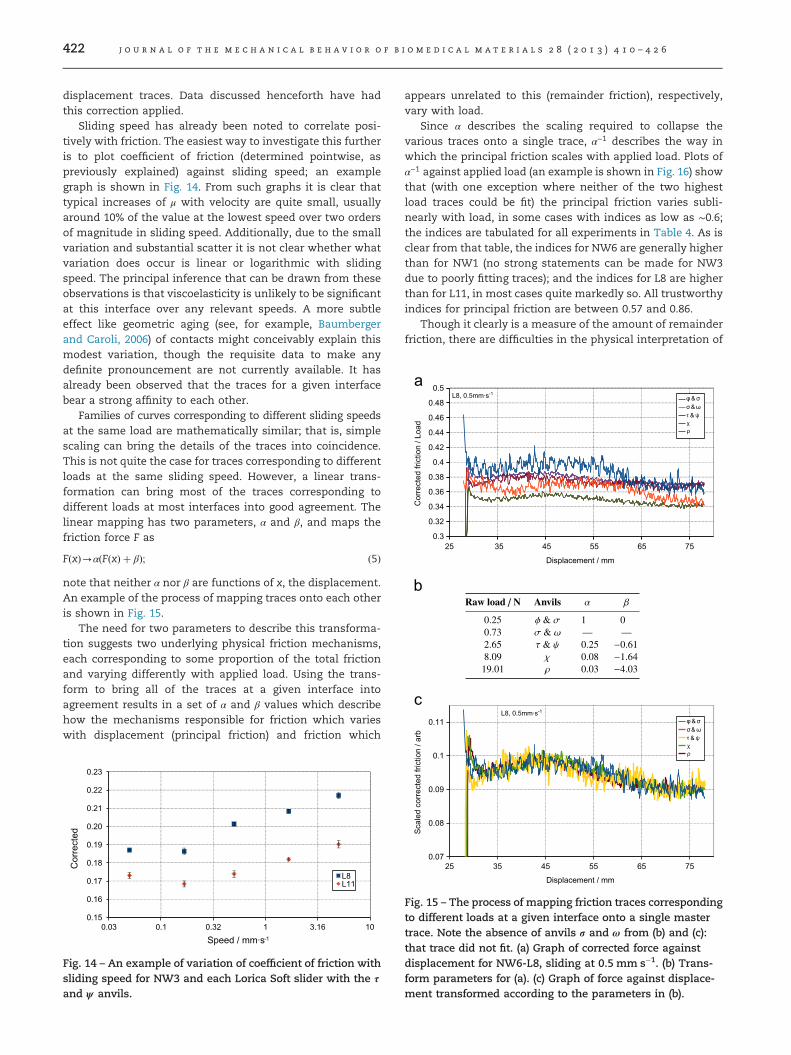
Sliding speed has already been noted to correlate posi-tively with friction. The easiest way to investigate this furtheris to plot coefficient of friction (determined pointwise, aspreviously explained) against sliding speed; an examplegraph is shown in Fig. 14. From such graphs it is clear thattypical increases of μ with velocity are quite small, usuallyaround 10% of the value at the lowest speed over two ordersof magnitude in sliding speed. Additionally, due to the smallvariation and substantial scatter it is not clear whether whatvariation does occur is linear or logarithmic with slidingspeed. The principal inference that can be drawn from theseobservations is that viscoelasticity is unlikely to be significantat this interface over any relevant speeds. A more subtleeffect like geometric aging (see, for example, Baumbergerand Caroli, 2006) of contacts might conceivably explain thismodest variation, though the requisite data to make anydefinite pronouncement are not currently available. It hasalready been observed that the traces for a given interfacebear a strong affinity to each other.
Families of curves corresponding to different sliding speedsat the same load are mathematically similar; that is, simplescaling can bring the details of the traces into coincidence.This is not quite the case for traces corresponding to differentloads at the same sliding speed. However, a linear trans-formation can bring most of the traces corresponding todifferent loads at most interfaces into good agreement. Thelinear mapping has two parameters, α and β, and maps thefriction force F as
FðxÞ-αðFðxÞ þ βÞ; ð5Þ
note that neither α nor β are functions of x, the displacement.An example of the process of mapping traces onto each otheris shown in Fig. 15.
The need for two parameters to describe this transforma-tion suggests two underlying physical friction mechanisms,each corresponding to some proportion of the total frictionand varying differently with applied load. Using the trans-form to bring all of the traces at a given interface intoagreement results in a set of α and β values which describehow the mechanisms responsible for friction which varieswith displacement (principal friction) and friction which
0.03 0.1 0.32 1 3.16 100.15
0.16
0.17
0.18
0.19
0.20
0.21
0.22
0.23
L8L11
Speed / mm·s-1
Cor
rect
ed
Fig. 14 – An example of variation of coefficient of friction withsliding speed for NW3 and each Lorica Soft slider with the τ
and ψ anvils.
appears unrelated to this (remainder friction), respectively,vary with load.
Since α describes the scaling required to collapse thevarious traces onto a single trace, α−1 describes the way inwhich the principal friction scales with applied load. Plots ofα−1 against applied load (an example is shown in Fig. 16) showthat (with one exception where neither of the two highestload traces could be fit) the principal friction varies subli-nearly with load, in some cases with indices as low as ∼0:6;the indices are tabulated for all experiments in Table 4. As isclear from that table, the indices for NW6 are generally higherthan for NW1 (no strong statements can be made for NW3due to poorly fitting traces); and the indices for L8 are higherthan for L11, in most cases quite markedly so. All trustworthyindices for principal friction are between 0.57 and 0.86.
Though it clearly is a measure of the amount of remainderfriction, there are difficulties in the physical interpretation of
25 35 45 55 65 750.07
0.08
0.09
0.1
Displacement / mm
Sca
led
corr
ecte
d fr
ictio
n /
Fig. 15 – The process of mapping friction traces correspondingto different loads at a given interface onto a single mastertrace. Note the absence of anvils r and ω from (b) and (c):that trace did not fit. (a) Graph of corrected force againstdisplacement for NW6-L8, sliding at 0.5 mm s−1. (b) Trans-form parameters for (a). (c) Graph of force against displace-ment transformed according to the parameters in (b).

0.10 0.32 1.00 3.16 10.00 31.620
1
2
3
4
5
6
f(x) = 2.12E-1x - 2.03E-2R = 9.99E-1
f(x) = 2.87E-1x - 1.26E-1R = 9.98E-1
Applied load / N
β / N
L8L11
Fig. 17 – An example plot of β against applied load for NW6sliding against each of the Lorica Soft sliders at 0.5 mm s−1.
j o u r n a l o f t h e m e c h a n i c a l b e h a v i o r o f b i o m e d i c a l m a t e r i a l s 2 8 ( 2 0 1 3 ) 4 1 0 – 4 2 6 423
β. The nature of the transformation described in Eq. (5) is thatif an addition is made to each β value in inverse proportion tothe corresponding α value then all of the traces simply moveen bloc. In consequence, no significance can be attributed toabsolute values of β. On the other hand, the change of β withapplied load is meaningful. Fig. 17 shows graphs of β againstapplied load; all but those corresponding to interfaces alreadyidentified as problematic are fit well by straight lines. How-ever, the uncertainty in the intercept prevents a directassessment of the relative magnitudes of the principal andremainder components of friction. Of course, another avenueis open in determining these relative scales: the overallrelationship between total friction and load is known tobe linear to high precision for each interface, so a simplecomputational experiment can be run to ascertain the pro-portions in which a power law with known index butunknown scale (corresponding to principal friction) shouldbe added to a linear function with known gradient butunknown intercept (corresponding to remainder friction) inorder to produce a function consistent with experimentalresults. This is achieved by fitting (least squares) a straightline to the sum of the two contributions, then manipulatingfirst the coefficient of the principal friction term to obtain thecorrect gradient, and secondly adjusting the intercept of the
0.10 0.32 1.00 3.16 10.00 31.621
3.16
10
31.62
100
f(x) = 4.01E+0 x^8.79E-1R = 9.84E-1
f(x) = 2.66E+0 x^6.81E-1R = 9.99E-1
Applied load / N
α−1
L8L11
Fig. 16 – An example plot of α−1 against applied load for NW1against each Lorica Soft slider, sliding at 0.5 mm s−1.
Table 4 – The scaling factor ðα−1Þ for principal friction hasbeen found to vary as a power law with applied load. Theindices for each of the tested interfaces and sliding speedsare shown in the table.
Nonwoven Slider Speed ðmm s−1Þ α−1 index
NW6 L8 0.05 0.7970.167 0.8620.5 0.7891.67 0.7535 0.761
L11 0.5 0.568NW3 L8 0.5 1.08a
L11 0.5 0.554a
NW1 L8 0.5 0.879a
L11 0.5 0.681
a Indicates that something was wrong with the data which mightmake these numbers unreliable.
remainder friction term to obtain the correct overall inter-cept. The results of this process are shown in Fig. 18; in allcases the coefficient of determination (R2) is at least 0.998.Though these values reflect a poorer fit than the samestraight lines were to the original data, they remain good.It is perhaps not surprising that the fidelity of the fitsis reduced: the data have been through several stages ofprocessing before this, and though the fidelity of each hasbeen good, they have inevitably not been perfect. That suchagreement between calculated values and experimental fits ispossible is strongly suggestive that the approach has merit.Typical proportions of the total friction ascribed to principaland remainder as a function of load are given in Table 5.
Having established the relative scales and manners ofvariation with applied load of principal and remainder fric-tion for the Lorica Soft-nonwoven interface, it remains to tryto identify the mechanisms that they correspond to. This isconsidered in Section 7, where these data and those fromSection 5 are compared.
7. Summary and conclusion
A brief summary of the main results presented will be givenbefore making connections between the two distinct experi-ments. Section 5 found that the contact length of fibresconstituting the interface between nonwoven and skin (sur-rogate) varied logarithmically with load, increasing by afactor of two to three (depending on the nonwoven) overtwo orders of magnitude of load. Assuming that the cylind-rical fibres pressing into the skin (surrogate) obeyed Hertziancontact mechanics, predictions were made on the basis ofthe experimental data for the variation of adhesive fric-tion (assuming no roughness on the scale of fibres) andviscoelastic friction (based on the Greenwood and Tabormodel, 1958) with load. Power law fits were good for bothquantities; subject to their assumptions, adhesive frictionwas predicted to vary as P0:6 and viscoelastic friction as P1:4,with slight variations between nonwovens. NW1 had thehighest contact fraction, followed by NW6, and then NW3.NW6 had the highest viscoelastic loss, followed by NW3, andfinally NW1; however, this ranking is a little uncertain as

j o u r n a l o f t h e m e c h a n i c a l b e h a v i o r o f b i o m e d i c a l m a t e r i a l s 2 8 ( 2 0 1 3 ) 4 1 0 – 4 2 6424
Lorica Soft's loss factor may not be the same for all fibrediameters.
In Section 6 it was found that for Lorica Soft against eachof the nonwovens overall friction against load could be wellfit by a straight line, though there was a hint of sublinearity,especially at low loads. There was good evidence that thefriction was composed of two different components (termedprincipal and remainder), the former varying with loadsublinearly with a typical index around 0.75, and the lattervarying linearly with load. Friction did generally increasewith velocity, but only by about 10% over two orders ofmagnitude velocity change; it was not possible to ascertainthe manner of variation. Finally, under equivalent condi-tions NW1 had the highest friction, followed by NW3, andfinally NW6.
Comparing the contact measurement and friction dataobtained in this work, it is reasonable to conjecture that theprincipal friction is due to “nearly smooth” adhesion; that is,where the assumption that the skin and nonwoven fibres aresmooth on the scale of a fibre diameter nearly holds. This issupported by the index of variation of principal friction withload only slightly exceeding the index found in Section 5.5 forcontact fraction. According to the work of Archard (1953,1957) and others, roughness has the effect of increasing suchindices towards unity; the slight difference in indices is thusattributed to slight roughness. Unfortunately, though thisidentification is quite plausible there is no direct evidenceto support it.
Only two mechanisms are known which give rise to thelinear relationship between friction and load that remainder
0 2 4 6 8 10 12 14 16 18 200
1
2
3
4
5
6
7
8
f(x) = 3.49E-1x + 2.31E-2R = 9.99E-1
f(x) = 3.58E-1x - 2.86E-2R = 9.99E-1
Applied load / N
Cal
cula
ted
frict
ion
/ N
L8L11
Fig. 18 – An example graph of calculated friction against load,comparing the models with the original linear fits fromthe data.
Table 5 – Approximate breakdown of friction into principal andare approximate indicators, averaging across interfaces and slidincreases the importance of the remainder. At low loads the remis simply because the offset is attributed entirely to this term.
Anvils Load (N)
ϕ and s 0.25s and ω 0.73τ and ψ 2.65χ 8.09ρ 19.01
friction demonstrates: plastic junction formation (followingBowden and Tabor, 1986); and adhesion at rough, elasticallydeforming junctions (Archard, 1953, 1957 and others). Theformer is inconsistent with the lack of observed damage,apparently implicating the latter. This would suggest thatLorica Soft-nonwoven friction was all due to adhesion and(after a wear-in period) elastic deformation, but that twodistinct populations of contacts took part: those correspond-ing to principal friction forming a fairly smooth interface;those corresponding to remainder friction forming a roughone. The lack of an explicitly viscoelastic friction mechanismis certainly consistent with the very limited variation of fric-tion with sliding speed; what variation there is can perhapsbe attributed to a rather more subtle viscoelastic effect likegeometric aging.
The primary purpose of the work described here was touse the relatively simple nonwoven-Lorica Soft system todevelop experimental and interpretative methodologies thatcould be used in future studies of friction between nonwo-vens and skin, and this has been achieved. Measurementswith the model system proved robust enough to provideinsights into friction mechanisms, giving confidence that asimilar approach with nonwoven and excised skin should befruitful, if more challenging practically.
By the arguments outlined in Section 5.1, the results onvariation of contact area with load for the nonwoven-LoricaSoft interface could be transferred to the same nonwovenagainst skin simply by changing the mechanical propertiesused in the final calculations, though it should be remem-bered that the absolute values provided by this calculation donot allow for surface relief. However, although it is likely thatstructurally similar nonwovens will behave similarly andshow similar variation of contact area with load, the resultscannot be applied to substantially different materials; a newrun of experiments would be required for them.
The friction force results and subsequent analysis arenot portable to skin from Lorica Soft on the strength ofthe currently know relationship between them, thoughthe methods could be expected to be effective if skin wereused. In particular, the division of friction into principaland remainder may or not may apply if skin were used.An interesting avenue for future work would be to establishwhether this division is more general. If this were thecase and the features and properties responsible for eachcould be identified then experimental results may becometransferable between different though qualitatively similarinterfaces.
remainder parts. It must be emphasised that these numbersing speeds. In general, reducing the sliding speed relativelyainder component is negative; whilst clearly unphysical this
Remainder (N) Principal (N)
−0.15 0.12−0.05 0.250.30 0.701.6 1.54 3

j o u r n a l o f t h e m e c h a n i c a l b e h a v i o r o f b i o m e d i c a l m a t e r i a l s 2 8 ( 2 0 1 3 ) 4 1 0 – 4 2 6 425
Acknowledgments
We acknowledge with thanks SCA Hygiene Products AB andthe Engineering and Physical Sciences Research Council forfunding the work.
Fig. A.2 – The shear force required to obtain the correct anvilshape is provided by a nonwoven strip pulled along at aconstant rate by the tensometer used in all other experiments.In order to prevent the membrane from shearing unduly a“relief strip” is also included which pulls in the oppositedirection and is pre-tensioned before sliding begins.
Appendix A. The production of anvils forapplying uniform normal stress atnonwoven-Lorica Soft interfaces
The key to producing appropriate anvils is to turn theproblem on its head: instead of trying to produce the shapethat gives rise to a set of forces, apply the set of forces andtake note of the shape. Further, given the complex materialsinvolved, it is far easier to use the materials and configura-tions themselves than to try to imitate them. Following theseprinciples, the equipment illustrated in Fig. A.1 was built toimplement the correct force fields.
The apparatus provides a known, constant normal stressagainst the test surface via fluid pressure; applies a corre-sponding shear stress by pulling a strip of nonwoven betweenthe retaining membrane and the aforementioned surface(Fig. A.2); and measures the normal force with a balance.The equipment is built upon a balance: the test surface(along with necessary spacers) is fixed to the balance pan;the remainder of the equipment rests upon the balancesurround. Pressure chambers were made by cutting down a50 ml, 26.5 mm syringe are. The open end of the syringe iscovered with a latex membrane held in place by a widerubber band.
Anvils are cast with a three-stage process. The first stageinvolves introducing a small quantity of a fast-curing resin(polyurethane (PUR), Axson F16, Axson UK, Newmarket, UK)into the syringe before pressurising it, applying pressure, andremoving the cast shape once the resin has cured (typicallyaround ten minutes). The second stage involves stretchingsmooth latex rubber over the blank and producing a counter-cast. Finally, a high-optical-quality anvil is cast in slow-curing epoxy using the counter-cast as a mould.
Fig. A.1 – The apparatus used to produce uniform-stress anvilshapes. The equipment is built onto a balance; part of oneside has been cut away for visual clarity.
r e f e r e n c e s
Ajayi, J.O., 1992. Effects of fabric structure on frictional properties.Textile Research Journal 62, 87–93.
Archard, J.F., 1953. Contact and rubbing of flat surfaces. Journal ofApplied Physics 24, 981–988.
Archard, J.F., 1957. Elastic deformation and the laws of friction.Proceedings of Royal Society of London Series A 243, 190–205.
Baumberger, T., Caroli, C., 2006. Solid friction from stick-slipdown to pinning and aging. Advances in Physics 55, 279–348.
Bobjer, O., et al., 1993. Friction between hand and handle. Effects ofoil and lard on textured and non-textured surfaces; perception ofdiscomfort. Applied Ergonomics 24, 190–202.
Bowden, F., Tabor, D., 1986. The Friction and Lubrication of Solids.OUP, Oxford, UK (Chapter 5).
Comaish, S., Bottoms, E., 1971. The skin and friction: deviationsfrom Amontons' laws, and the effects of hydration andlubrication. British Journal of Dermatology 84, 37–43.
Cottenden, D.J., 2011. A Multiscale Analysis of FrictionalInteraction Between Human Skin and Nonwoven Fabrics,Table 2.1 and Associated Text. Ph.D. Thesis, University CollegeLondon, London, UK. ⟨http://discovery.ucl.ac.uk/1301772/⟩.
Cottenden, A.M., Wong, W.K.R., Cottenden, D.J., Farbrot, A., 2008.Development and validation of a new method for measuringfriction between skin and nonwoven materials. Journal ofEngineering in Medicine 222, 791–803.
Derler, S., Schrade, U., Gerhardt, L.-C., 2007. Tribology of humanskin and mechanical skin equivalents in contact with textiles.Wear 263, 1112–1116.
El-Shimi, A., 1977. In vivo skin friction measurements. Journal ofSociety of Cosmetic Chemists 28, 37–51.
Ferguson-Pell, M.W., Bell, F., Evans, J.H., 1976. Interface pressuresensors: existing devices, their suitability and limitations. In:Kenedi, R.M., Cowden, J.M., Scales, J.T. (Eds.), BedsoreBiomechanics. Macmillan, London, UK (Chapter 5).
Gerhardt, L.-C., Strässle, V., Lenz, A., Spencer, N.D., Derler, S., 2008.Influence of epidermal hydration on the friction of human skinagainst textiles. Journal of Royal Society Interface 5, 1317–1328.
Gerhardt, L.-C., Lenz, A., Spencer, N.D., Münzer, T., Derler, S.,2009. Skin-textile friction and skin elasticity in young andaged persons. Skin Research & Technology 15, 288–298.

j o u r n a l o f t h e m e c h a n i c a l b e h a v i o r o f b i o m e d i c a l m a t e r i a l s 2 8 ( 2 0 1 3 ) 4 1 0 – 4 2 6426
Greenwood, J., Tabor, D., 1958. The friction of hard sliders onlubricated rubber: the importance of deformation losses. Proc.Phys. Soc. Proceedings of the Physical Society 71, 989–1001.
Gwosdow, A.R., Stevens, J.C., Berglund, L.G., Stolwijk, J.A.J., 1986.Skin friction and fabric sensation in neutral and warmenvironments. Textile Research Journal 56, 574–580.
Hendriks, C.P., Franklin, S.E., 2010. Influence of surfaceroughness, material and climate conditions on the friction ofhuman skin. Tribology Letters 37, 361–373.
Hong, K.H., Kim, S.C., Kang, T.J., Oh, K.W., 2005. Effect of abrasionand absorbed water on the handle of nonwovens. TextileResearch Journal 75, 544–550.
Hosseini Ravandi, S.A., Toriumi, K., Matsumoto, Y., 1994. Spectralanalysis of the stick-slip motion of dynamic friction in thefabric surface. Textile Research Journal 64, 224–229.
Jeddi, A.A.A., Shams, S., Nosraty, H., Sarsharzadeh, A., 2003.Relations between fabric structure and friction. Part I. Wovenfabrics. Journal of the Textile Institute 94, 223–234.
Johnson, K., 1985a. Contact Mechanics, vol. 59. CUP, Cambridge,UK.
Johnson, K., 1985b. Contact Mechanics, vol. 47. CUP, Cambridge,UK.
Johnson, K., 1985c. Contact Mechanics, vol. 49. CUP, Cambridge,UK.
Johnson, K., 1985d. Contact Mechanics, vol. 101. CUP, Cambridge,UK.
Kaye, G.W.C., Laby, T.H., 2004. Tables of Physical and ChemicalConstants. ⟨http://www.kayelaby.npl.co.uk/⟩. (accessed16.04.10).
Kenins, P., 1994. Influence of fiber type and moisture onmeasured fabric-to-skin friction. Textile Research Journal 64,722–728.
Nakajima, K., Narasaka, H., 1993. Evaluation of skin surfaceassociated with morphology and coefficient of friction.International Journal of Cosmetic Science 15, 135–151.
Park, A.C., Baddiel, C.B., 1972. Rheology of stratum corneum. I. Amolecular interpretation of the stress–strain curve. J. Soc.Cosmet. Chem. Journal of the Society of Cosmetic Chemists23, 3–12.
Ramkumar, S.S., Roedel, C., 2003. Study of needle penetrationspeeds on frictional properties of nonwoven webs: a newapproach. Journal of Applied Polymer Science 89, 3626–3631.
Wang, X.Y., Gong, R.H., Dong, Z., Porat, I., 2006. Frictionalproperties of thermally bonded 3d nonwoven fabrics preparedfrom polypropylene/polyester bicomponent staple fibre.Polymer and Engineering Science 46, 853–863.
Zhang, M., Mak, A.F.T., 1999. In vivo friction properties of humanskin. Prosthetics and Orthotics International 23, 135–141.