a study of nucleated rbc in cord blood as a...
TRANSCRIPT

"A STUDY OF NUCLEATED RBC IN CORD BLOOD AS A PROGNOSTICMARKER OF PERINATAL ASPHYXIA"
Dissertation submitted in partial fulfillment of the requirement for theaward of the Degree of
DOCTOR OF MEDICINE-BRANCH VII
PAEDIATRIC MEDICINE
APRIL 2017
TIRUNELVELI MEDICAL COLLEGE HOSPITAL
THE TAMIL NADU DR.M.G.R MEDICAL UNIVERSITY
CHENNAI
TAMILNADU

CERTIFICATE
This is to certify that the Dissertation entitled "STUDY OF
NUCLEATED RBCS IN CORD BLOOD AS A PROGNOSTIC
MARKER OF PERINATAL ASPHYXIA" submitted by Dr. C.
BAGAVATHI PRIYADARSHINI, to The Tamil Nadu Dr. M.G.R
Medical University, Chennai in partial fulfillment for the award of
M.D. Degree (Paediatrics) is a original work carried out by her
under my guidance and supervision during the academic year 2014 -
2016.This Dissertation partially or fully has not been submitted for
any other degree or diploma of this university or other.
Dr. C. Krishnamoorthy MD., Dr. T. R. R. Ananthyshri MD.,
Professor and HOD, Professor & Unit II chief,
Department of Paediatrics, Department of Paediatrics,
Tirunelveli Medical College, Tirunelveli Medical College,
Tirunelveli-627011 Tirunelveli-627011
The Dean
Tirunelveli Medical College
Tirunelveli

DECLARATION
I, Dr. C. BAGAVATHI PRIYADARSHINI, solemnly declare that
this Dissertation titled" A STUDY OF NUCLEATED RBCS IN
CORD BLOOD AS A PROGNOSTIC MARKER OF PERINATAL
ASPHYXIA" has been prepared by me. This is submitted to The
Tamil Nadu Dr. M.G.R. Medical University, Chennai, in partial
fulfillment of the regulations for the award of M. D. Degree Branch
VII (PAEDIATRICS). This dissertation has not been submitted
previously by me for the award of any diploma or degree of any other
university.
PLACE: Tirunelveli Dr.C.Bagavathi Priyadarshini,
DATE: Post Graduate,
M. D. Paediatrics,
Tirunelveli Medical College,
Tirunelveli

ACKNOWLEDGEMENT
At the outset I wish to thank our Dean, DR. Siddhi athiya
munnavara. M.D., for permitting me to carry out this study in our hospital.
I express my sincere thanks to my Professor and Head of department,
Dr. Krishnamoorthy for his constant encouragement and support. Iam
deeply indebted to my chief, Prof. Dr. Ananthyshri for her help. I also
thank Prof. Dr. Babukanthakumar, who was the brain behind the study. I
also sincerely thank Prof. Dr. Baskaran for his constant support and
guidance.
Iam greatly thankful to my Assistant professors, Dr. Venkatraman,
Dr. Senthilkumaran, Dr. Suresh, Dr. Naresh and Dr. Kavitha for their
valuable suggestions.
I am also immensely grateful to my statistician Mr. Arumugam for
the guidance provided in analysis and interpretation of data.
I also thank the Departments of Obstetrics and Gynaecology and
Pathology for the co-operation and lab work of this study. I will always be
grateful to God and my parents for their love and support in doing my study.
Last but not the least, I sincerely thank all the newborns and their
parents who cooperated with me by participating in the study.

TABLE OF CONTENTS
1. INTRODUCTION ……………………………………………. 1
2. AIM OF STUDY ……………………………………………… 4
3. REVIEW OF LITERATURE …………………………………. 5
4. PERINATAL ASPHYXIA ……………………………………. 16
5. ASSESSMENT OF FETAL WELL BEING…………………... 34
6. NUCLEATED RED BLOOD CELLS………………………… 40
7. MATERIALS & METHODS …………………………………. 43
8. OBSERVATION & RESULTS ……………………………….. 47
9. DISCUSSION …………………………………………………. 71
10.SUMMARY …………………………………………………… 75
11. LIMITATIONS ……………………………………………….. 78
12.CONCLUSION ………………………………………………... 79
13. RECOMMENDATION ………………………………………. 80
14.BIBLIOGRAPHY……………………………………………… 81
15.ANNEXURES ………………………………………………… 93
Annexure I - Proforma
Annexure II - Master Chart

ABBREVATIONS
HIE Hypoxic Ischemic Encephalopathy NIRS Near Infra Red Spectroscopy
WBC White Blood Cells FeNa Fractional excretion of sodium
NRBC Nucleated Red Blood Cells cu.mm cubic.millimeter
RBC Red Blood Cells mmol/L millimole/ Liter
FHR Fetal Heart Rate SEM Standard error of mean
MSAF Meconium Stained Amniotic Fluid CKBB Creatine kinase brain
SD Standard Deviation CKMB Creatine kinase myocardium
EPO Erythropoietin EEG Electro Encephalo Graphy
IL Interleukin
MRI Magnetic Resonance Imaging
CT Computerized Tomography
CNS Central Nervous System
CVS Cardiovascular System
Hb Hemoglobin
ACOG American College of Obstetretics & Gynaecology
NE Neonatal Encephalopathy
ATP Adenosine Tri Phosphate
CBF Cerebral Blood Flow
NO Nitric Oxide
SIADH Syndrome of Inappropriate secretion of ADH
DIC Disseminated Intravascular Coagulation
CS Cranial UltraSonography
IVH Intra Ventricular Hemorrhage

1
INTRODUCTION
Perinatal asphyxia is one of the leading causes of death in newborns
with about 19% of neonatal deaths1. Perinatal asphyxia is defined as failure
to initiate or sustain breathing at birth with an Apgar score of less than 7 at
1 minute of life2. Moderate perinatal asphyxia is slowly initiated gasping or
Apgar of 4 - 6 and severe asphyxia is no breathing or Apgar of less than 3
at 1 minute after birth.
Perinatal asphyxia leads to various organ dysfunction in the neonate
due to lack of oxygen and low perfusion. Among the various organ
dysfunctions, hypoxic ischemic encephalopathy is one of the common co
morbidity leading to neurological disability and mortality3. Early prediction
of hypoxic ischemic encephalopathy is very important as there is only a
brief therapeutic window and because of the possible side effects of the
neurological interventions4.
Hypoxic-ischemic encephalopathy (HIE) should have the following
to result in acute neurological injury: profound metabolic or mixed
acidemia (pH < 7) in an umbilical artery blood sample, if obtained;
persistence of an Apgar score of 0-3 for longer than 5 minutes; neonatal
neurologic sequelae and multiple organ involvement (kidney, lungs, liver,

2
heart, intestines)5,6. HIE can be graded as stage 1,2 and 3 based on severity
after clinical neurological examination.
HIE as a result of systemic hypoxia leads to neurological sequelae in
the form of developmental delay, seizures, mental retardation and cerebral
palsy on short term and long term follow up7-9. The diagnosis and severity
of hypoxic ischemic encephalopathy is confirmed by clinical examination
24 hours after birth10.
Asphyxiated neonates show some biochemical and hematological
variations in some of the variables in the form of acidosis, elevated lactate,
hypoxia and hypercarbia. Among these variables nucleated red blood cells
in neonates were also elevated because of perinatal asphyxia11.
Nucleated red blood cells are produced in the fetal bone marrow in
response to erythropoietin and are stored in the marrow as reticulocytes
and mature erythrocytes. They are normally present in the neonatal blood12.
Many studies were done in the past to assess the ability of nucleated
red blood cells to serve as a marker of perinatal asphyxia. The level of
nucleated red blood cells per 100 white blood cells (WBCs) correlates with
acute as well antepartum asphyxia and can be used as a reliable index of
birth asphyxia and early neonatal outcome.

3
Though most of the studies claim an increase in nucleated red blood
cell count in umbilical cord blood of neonates to be elevated as a result of
birth asphyxia only a few studies tried to assess the severity of hypoxic
ischemic encephalopathy based on the elevated nucleated red blood cell
count13.
In our study we have tried to analyse the use of nucleated red blood
cell count in umbilical cord blood as a marker to grade the severity of
hypoxic ischemic encephalopathy and to assess the short term outcome
based on the nucleated red blood cell count.

4
AIM OF STUDY
To investigate the variations in nucleated red blood cell count in
cord blood in asphyxiated neonates and to assess its relationship with both
severity and short term outcome of hypoxic ischemic encephalopathy
OBJECTIVES
1. To assess the variations in increase in nucleated red blood cell count in
asphyxiated neonates based on Apgar score.
2. To assess the relationship between nucleated RBC count and severity of
hypoxic ischemic encephalopathy based on the sarnat and sarnat grading.
3. To analyse any relationship between short term outcome in terms of
mortality due to perinatal asphyxia and nucleated RBC count.

5
REVIEW OF LITERATURE
Fields LM et al (1983)14 did a study to assess the possibility of any
correlation between the pH of umbilical arterial blood and one minute
Apgar score for neonatal assessment at Vanderbilt University Hospital in
172 singleton neonates. They found that when Apgar score was less than 7,
about 56% of the neonates had normal pH values. Of this group 46% had
undergone intubation and nasopharyngeal suctioning suggesting of poor
correlation between them. They recommended that neonates with Apgar
score of less than 7 to be further evaluated with umbilical arterial blood gas
studies to ascertain the presence of acidosis.
Bryce RL et al (1985)15 did a methodological review to determine the
strength of association of each of these perinatal findings (meconium
staining of amniotic fluid, abnormal fetal heart rate patterns, acidotic fetal
scalp blood gases, low Apgar scores and acidotic cord blood gases) as
indicators of perinatal asphyxia. They found that the strength of association
(relative risk) was found to inversely with the prevalence of the outcome.
Gonzalez DJ et al (1996)16 investigated in term infants, the relation
between HIE and neurologic sequelae at follow up. They did a prospective
epidemiologic study for a period of five years and graded perinatal
asphyxia as non severe and severe (based on 1 minute Apgar score, cord
blood pH, abnormal FHR and MSAF and need for resuscitation. HIE was

6
classified into three stage based on classification of Levene and Sarnat &
Sarnat. The neurologic abnormalities sequelae were graded as mild,
moderate and severe based on Finer and Amiel-Tinson classification. They
analysed these relationships with univariant & multivariant analysis (Cox's
regression). They found that out of 115 asphyxiated full term infants who
were followed up for 12 - 24 months, 4 cases had severe sequelae, 4
moderate and 11 mild. Asphyxia related infant mortality rate was
0.87/1000 live births. They found a statistically significant association
between perinatal asphyxia, HIE and neurologic sequelae. They concluded
that most survivors of perinatal asphyxia did not have adverse sequelae.
The best predictive tool was severe asphyxia at birth.
Korst et al (1996)17 aimed to determine whether nucleated red blood
cells are related to long-term neurologic impairment. They compared
nucleated red blood cell count of 153 term neurologically impaired
neonates with cord blood nucleated red blood cells of 83 term normal
babies. Neurologically impaired babies group was separated into the
following subgroups: group I (n = 69), groupie (n = 47) and group III (n =
37) based on fetal heart rate abnormalities. They found that the mean
number of initial NRBC counts was significantly higher in the group of
neurologically impaired neonates (30.3 +/- 77.5, range 0 to 732 per 100
WBCs) than in the control group (3.4 +/- 3.0, range 0 to 12 per 100
WBCs). When the group of neurologically impaired neonates was

7
separated on the basis of timing of the neurologic impairment, distinct
nucleated red blood cell patterns were observed. Maximum nucleated red
blood cell values were higher in group I (mean 51.5 +/- 108.9) than in
groups II and III combined (mean 12.7 +/- 11.9) (p = 0.0005). Group I also
had a longer clearance time (119 +/- 123 hours) than groups II and III
combined (mean 59 +/- 64 hours) (p < 0.001). They concluded that
nucleated red blood cells identify the presence of fetal asphyxia and
distinct nucleated red blood cell patterns were observed that relate to the
timing of fetal injury. It may assist in determining the timing of fetal
neurologic injury.
Gonzalez D et al (1997)18 did a study to know the perinatal
differences of perinatal asphyxia in relation to its severity. They did a
prospective epidemiologic study of perinatal asphyxia in 3,343 live births
over a period of five years and graded perinatal asphyxia as non severe and
severe. The perinatal variables were graded as prenatal, neonatal and post
neonatal. Perinatal asphyxia was in 156 cases (31 severe and 125 non
severe), with an incidence of 4.66 cases per 1000 full term live births.HIE
was present in 25.6% cases and incidence of neurologic sequelae in infants
followed up for 12 months was 16.5%. The main differences between
severe and non severe perinatal asphyxia were important in the clinical

8
management of asphyxiated newborns and in their follow up was their
conclusion.
Hanion – Lundberg et al (1997)19 aimed to establish normal values
for nucleated red blood cells in term singletons and factors associated with
their elevation. Umbilical vein white blood cells and nucleated red blood
cells per 100 white blood cells were counted and umbilical arterial pH was
determined from the collected cord blood in term singleton gestations for a
period of 5 years from 1112 cases. Nine outliers were censored (nucleated
red blood cells per 100 white blood cells = 126 to 830); five cases were
excluded because of missing data. They found that the mean value of
nucleated red blood cells per 100 white blood cells was 8.55, the SD was
10.27, and the range was 0 to 89. The value did not very by maternal
tobacco or drug use, anemia, fetal presentation, or mode of delivery. Both
maternal diabetes and meconium were associated with elevated values, p <
0.01. Apgar scores and cord pH showed trends toward inverse
proportionality to the number of nucleated red blood cells per 100 white
blood cells.
Phelan et al (1998)20 determined whether neonatal lymphocyte or
nucleated red blood cell (RBC) counts can be used to date fetal neurologic
injury. Term infants with hypoxic ischemic encephalopathy and permanent
neurologic impairment were divided into two groups: infants with

9
preadmission injury, manifested by a nonreactive fetal heart rate (FHR)
pattern from admission until delivery; and infants with acute injury,
manifested by a normal FHR pattern followed by a sudden prolonged FHR
deceleration. Lymphocyte and nucleated RBC values were compared with
published high normal counts for normal neonates: 8000
lymphocytes/mm3 and 2000 nucleated RBCs/mm3. The study population
consisted of 101 neonates. In the first hours of life, lymphocyte counts
were elevated among injured newborns, and then the counts rapidly
normalized. Brain-injured neonates were 25 times more likely to have a
lymphocyte count greater than 8000 than were normal neonates (54 [62%]
of 87 versus 6 [7%] of 84; odds ratio 25.5; 95% confidence interval 8.8,
80.1; P < .001). The mean lymphocyte count tended to be higher in the
preadmission-injury group than in the acute-injury group. In comparison,
nucleated RBC values were not correlated as strongly with neonatal hours
of life; nucleated RBC counts tended to be higher and persist longer among
neonates with preadmission injury than among those with acute injury.
They concluded that compared with normal levels, both lymphocyte and
nucleated RBC counts were elevated among neonates with asphyxial
injury. Both counts appear to be more elevated and to remain elevated
longer in newborns with preadmission injury than in infants with acute
injury. However, the rapid normalization of lymphocyte counts in these

10
injured neonates limits the clinical usefulness of these counts after the first
several hours of life.
Axt et al(1999)21 did a study to determine whether nucleated red
blood cells are elevated in pregnancies that continue beyond 289 days of
gestation. They collected cord blood from term and post-term singleton
neonates and umbilical artery nucleated red blood cells were counted per
100 white blood cells in about 304 cases. The comparison was made
between pregnancies ending at 261-289 days (37.1-41.2 weeks) of
gestation and those ending after 289 days (> or = 41.3 weeks) of gestation.
They found that the mean value of nucleated red blood cells per 100 white
blood cells in the post-term neonate group was significantly higher than in
the term neonate group (median 6.5, range 0-24 vs. median 3.7, range 0-14;
p < 0.05). The values did not vary by fetal presentation, mode or duration
of delivery. Neonatal outcome was comparable between both study groups.
Ghosh B et al (2003)22 did a study to determine the normal level of
nucleated red blood cells per 100 white blood cells in cord blood of term
non asphyxiated newborns and to investigate the variations in NRBC
counts in perinatal asphyxia. About 75 cases in which 26 asphyxiated
(group I) and 49 non asphyxiated (group II) newborns were included in this
study. The NRBC count in group I was 16.5 +/- 6.4 with a range of 3 - 25.
The same variable in the group II was 8.6 +/- 7.01 with range 1 - 26. This
statistically significant difference also showed a significant negative

11
correlation with Apgar score and umbilical arterial pH and early neonatal
outcome. They concluded that the level of NRBC per 100 WBC correlates
both with acute and chronic antepartum asphyxia and can be used as a
reliable variable to predict early neonatal outcome.
Ferns SJ et al (2004)23 did a prospective control study to determine
the predictive value in short term outcome and the value of nucleated
RBCs in assessing the severity of perinatal asphyxia. About 56 term
neonates with birth asphyxia and 56 normal full term neonates were
included in the study. Cord blood pH and NRBC counts were noted and
neonates were followed up till discharge. ANOVA test and logistic and
linear regression analysis were done and there was a significant increase in
NRBC count in asphyxiated neonates. Blood pH, low Apgar score and
neonatal outcome also correlated well with nucleated RBC counts. They
concluded that NRBC count at birth was a useful predictor of severity and
short term outcome of perinatal asphyxia.
Perri T et al (2004)24 did a study to evaluate fetal NRBCs in
prolonged pregnancies (beyond 287 days). They collected umbilical cord
blood at delivery from 75 prolonged pregnancies. 150 term deliveries
served as controls. Nucleated red blood cell counts were expressed per 100
white blood cells (WBC) with umbilical arterial pH. The median NRBCs
per 100 WBCs in prolonged pregnancy was not significantly elevated over
the term values (median 3, range 0 - 35 median of 3, range 0 - 34,
12
respectively). The univariate analysis showed a statistically significant
association between elevated NRBC count and low arterial blood pH, low
platelet counts and male gender. They concluded that elevated NRBC
count were not associated with prolonged pregnancies and were usually
associated with pregnancy related specific complications.
Ferber A et al (2004)25 did a study to determine the correlation
between EPO levels and NRBC counts in human fetus as animal studies
demonstrated elevated EPO levels in response to intrauterine hypoxic
events. Umbilical cord blood was obtained from 40 patients after birth. The
mean gestational age was 39.5 +/- 1.2 weeks and the mean birth weight
was 3.5 +/- 0.3 Kg. The median EPO (µU/mL) was 34 (range 13 - 427).
The median NRBC count was 10 (range 0 - 150). A simple regression
analysis indicated that NRBC counts are significantly and positively
correlated with EPO. They concluded a strong association between EPO
and elevated NRBC levels but they also indicated that there are other
variables that can result in elevated NRBC counts.
Ferber A et al (2005)26 did a study to see the role of erythropoietin
and IL-6 as potential mediators of NRBCs in response to acute hypoxia.
100 women participated in the study. Deliveries with non reassuring fetal
status were included in the case group and other cases served as control.
Nonparametric univariate analysis showed an association between Apgar
scores, cord blood pH, IL-6 and EPO as independent variables and elevated

13
NRBCs count at birth. IL-6 was significantly increased in the study group
but EPO was not different in both the groups. They concluded that IL-6
may have a short term role in elevating fetal nucleated RBC counts.
McCarthy JM et al (2006)27 made an analysis to determine the
umbilical cord blood NRBC count in uncomplicated pregnancies delivered
by elective cesarean section or delivered vaginally. 57 pregnancies studied
in which 33 were elective cesarean sections and 24 were vaginal deliveries.
The mean +/- SD for NRBC/100 WBC of elective cesarean section group
was 7.8+/- 7.4 and vaginal delivery was 9.3 +/- 10.5 which were not
statistically significant. They concluded that the stress of uncomplicated
labor did not change the nucleated RBC level and so it can be used as a
marker for hypoxia.
Shah V et al (2009)28 did a prospective study to analyse the
association between hypoxic ischemic encephalopathy and hematological
findings due to birth asphyxia. They categorized 316 neonates with
asphyxia insult as acute near total, prolonged partial or mixed and
measured their hematological counts between 0 to 120 hours of age.
Associations between the adverse outcome at 2 years of age and
hematological counts measured were analysed. No associations were found
between the patterns of count in the first 12 hours after birth. Nucleated red
blood cell counts peaked at 6 to 8 hours after birth and returned back to
normal by 36 to 72 hours after birth. They found that the hematological

14
changes were attributable to birth asphyxia and not to brain injury based on
long term outcome and these counts cannot be used to time the asphyxial
insults.
Boskabadi H et al (2010)29 studied the variations in nucleated red
blood cell (NRBC) count per 100 white blood cells (WBC) and absolute
NRBC / cu.mm in blood associated with perinatal asphyxia and its
relationship with both severity of short term prognosis of asphyxia. They
did a prospective case control study in 91 infants out of which 42
asphyxiated cases where compared against 49 normal neonates (control).
The NRBC/100 WBC count and the absolute nucleated red blood cell
count in newborns of control group were 3.87 +/- 5.06 and 58.21 +/- 87.57/
cu.mm; whereas the corresponding values in cases were 18.63 +/-16.63 and
634.04 +/- 1002/ cu.mm. A statistically significant negative correlation
existed between nucleated red blood cell level and severity of perinatal
asphyxia, first minute Apgar score and blood pH. A positive correlation
was there between these parameters and severity of asphyxia, acidosis and
poor outcome. They concluded that NRBC count can be used as a simple
marker for assessment of severity and early outcomes of perinatal
asphyxia.

15
Manjusha et al (2013)30 did a prospective case control study to
investigate the variations in nucleated red blood cell (NRBC) in blood and
its relationship to severity and short term prognosis of asphyxia by
comparing levels of NRBC/100 white blood cells (WBC) and absolute
NRBC counts in cord blood between 50 asphyxiated (case group) and 50
normal neonates (control group). They found that the number of
NRBC/100 WBC in newborns of asphyxiated group was 29.5 ± 26 and 5.9
± 2.6 in the control group (P < 0.01). Using quartile deviation, staging of
hypoxic ischemic encephalopathy (HIE) was done on basis of NRBC count
with 80% agreement between clinical and NRBC staging of HIE.
NRBC/100 WBC count significantly correlated with Apgar scoring, HIE
staging and mortality. They concluded that NRBCs/100 WBCs can be used
as a simple marker for the assessing the severity and early outcome of
perinatal asphyxia.
Mohanty et al (2014)31 did a correlation study between NRBC/100
white blood cell (WBC) count and perinatal asphyxia in terms of severity
and short-term outcome. Material and methods: A prospective, case-control
study was done from January 2011 to December 2012 that included a total
of 200 neonates with 100 asphyxiated babies (case group) and 100 normal
babies (control group). NRBC/100 WBC and pH were immediately
measured after birth from cord blood. Early neonatal outcome was also

16
evaluated in relation to NRBC/100 WBC count. They found that the mean
NRBC/100 WBC count was 50.82 ± 23.85 in case group and 1.67 ± 1.005
in control group (p < 0.001). There was a statistically significant
correlation between stages of hypoxic-ischemic encephalopathy [HIE]),
poor outcome and higher number of NRBC/100 WBC count (p < 0.001).
They concluded that measurement of NRBC/ 100 WBC count is an
inexpensive and easily available procedure in a resource poor country like
ours, where blood gas analysis facilities are not available. It is also a good
predictor of short-term outcome in asphyxiated babies.
Bala D et al (2015)13 carried out a study to analyse relationship
between nucleated red blood cell count and severity of HIE.
A prospective, case control study was undertaken between august 2011 and
October 2013 in the neonatal intensive care unit that included 50 full term
infants with asphyxia (group-1) and 50 healthy newborns (group-2). They
found that the average absolute NRBC count (NRBC/mm3) for the control
group was 38.6/mm3. It is 426.55/mm3 in the first period with SD of
203.99 & a SEM of 48.08 in HIE (Group-I). It increases with time in 2nd
period and again decreases in the third time period. The average value will
be always higher than that of the control group (p<0.001). In HIE Group-II
the average NRBC count is 498.45 with SD of 214.72 and a SEM of 56.8
whereas these are 412.43, SD of 202.54 & SEM of 48.32 in case of HIE

17
Group-III. They concluded that Nucleated red blood cell count (NRBC)
count increases in all grades of HIE, but there is no linear correlation
between NRBC count and the severity of HIE.

18
PERINATAL ASPHYXIA
The incidence of birth asphyxia is 1-6/1000 live births34. It is one of
an important cause of neonatal mortality (23%)35 with a number of
peripartum risk factors.
Causes of neonatal mortality
The term “asphyxia” is derived from the Greek and means “stopping
of the pulse”. Perinatal asphyxia is defined as a condition with impaired
gas exchange during labor, leading to hypoxemia, hypercarbia and fetal
acidosis (pH < 7)36.
The terms that are used for evaluating term infants with perinatal
brain injury risk are as follows:
19
A. Neonatal depression: A term used to define an infant who has a
prolonged transition from an intrauterine to an extra uterine environment. 1
min and 5 min Apgar scores are usually low in these infants37.
B. Neonatal encephalopathy: A clinical term used to define an
abnormal neurobehavioral state that includes a decreased level of
consciousness with neuro motor tone abnormalities. It begins within the
first postnatal day and may be associated with seizure like activity,
hypoventilation or apnea, depressed primitive reflexes and the appearance
of brain stem reflexes. There is no specific etiology or an irreversible
neurological injury.
C. Hypoxic-ischemic encephalopathy: HIE is “an abnormal
neurobehavioral state in which the predominant pathogenic mechanism is
impaired cerebral blood flow”.
D. Hypoxic-ischemic brain injury: It refers to “neuropathology
attributable to hypoxia and/or ischemia as evidenced by biochemical (such
as serum creatine kinase brain bound [CK BB]), electro physiologic (EEG),
neuroimaging (cranial ultrasonography, MRI, CT) or post-mortem
abnormalities”.
Hypoxic ischemic encephalopathy (HIE) is one of the sequelae that
follows asphyxia. Hypoxic ischemic encephalopathy is an important cause
20
of permanent damage to CNS tissues which may progress to cerebral palsy.
Early 8.4% of inborn babies in India have 1 minute Apgar score < 7 and
around 1.4% have HIE38.
Infants treated with therapeutic hypothermia have lower incidence of
cortical neuronal injury.
Etiology
Impaired gas exchange across the placenta is the main problem that
leads to 90% of asphyxial events during and before the labor period in term
infants. Rest of the event was secondary to pulmonary, cardiovascular or
neurologic abnormalities that occur in the postpartum period.
A. Following factors increase the chances of perinatal asphyxia:
1. Decline in mother’s oxygenation / Hb saturation
2. Decreased placental blood flow from the mother
3. Decreased blood flow from the placenta to fetus
4. Insufficient gas exchange across the placenta or at the fetal tissue level.
5. Increased fetal oxygen requirement.
B. Etiologies of perinatal hypoxia-ischemia are
1. Maternal determinants: hypertension (acute or chronic), infection, diabetes,
hypotension, vascular disease, drug use and hypoxia due to pulmonary,
cardiac or neurologic diseases.

21
2. Placental causes: infarction, fibrosis, abruption or hydrops.
3. Uterine bleed, rupture.
4. Umbilical cord accidents: cord prolapse, entanglement, true knot, external
compression.
5. Abnormalities of umbilical vessels.
6. Fetal factors: low Hb levels, intra uterine infection, cardiac diseases,
hydrops, severe cardiac / circulatory insufficiency.
7. Neonatal factors: severe neonatal hypoxia due to cyanotic congenital heart
disease, persistent pulmonary hypertension of the newborn (PPHN),
cardiomyopathy, other forms of neonatal carcinogenic and/or septic shock.
Diagnosis of Perinatal asphyxia
Three consensus statements has been used to guide for the diagnosis
of perinatal asphyxia.
The American Academy of Pediatrics and American College of
Obstetrics and Gynecology39 defined it as:
a) 5 minute Apgar < 3
b) Cord blood with severe metabolic acidosis (pH < 7.0)
c) Neonatal encephalopathy
d) Multi-organ system dysfunction.

22
International Cerebral Palsy Task Force in 1999 later defined the
following:
The essential criteria were the following:
a) pH < 7.0 and base deficit ≥ 12 mmol/L
b) Cerebral palsy
c) Moderate or severe encephalopathy
The additional five criteria were:
a. Persistent 5 minute Apgar score of < 6
b. Sentinel event
c. Fetal heart rate changes
d. Multiple organ involvement
e. Early imaging evidence40.
The ACOG published the following in 2002:
The essential criteria:
a) pH < 7.0 and base deficit ≥ 12 mmol/L
b) Moderate or severe encephalopathy
c) Cerebral palsy
d) Exclusion of other etiologies.

23
In the 5 additional criteria Apgar score < 3 at 5 minutes and multi organ
failure within 72 hours were the two altered criteria. Rest of the three
criteria were similar to that published by the 1999 Task Force41.
The arterial cord blood reflects the fetal status and the venous cord
blood reflects the oxygen exchange across the placenta42. Clinical effects
of perinatal asphyxia
Apgar score
`Apgar score can be used to predict the severity of asphyxia though
it is influenced by a number of factors other than asphyxia. It can also
predict the outcome43.
Neonatal encephalopathy
Neonatal encephalopathy (NE) is defined as “a clinically defined
syndrome of disturbed function in the earliest days of life in the term
infant, manifested by difficulty with initiating and maintaining respiration,
depression of tone and reflexes, subnormal level of consciousness, and
often by seizures44”.
The incidence of NE is around 3/1000 live births. NE requires
multiple pathways to cause a less specific response in case of a brain injury
due to hypoxia45.

24
The below table shows the various causes of neonatal encephalopathy.
Hypoxic ischemic encephalopathy
HIE is termed as “an acute non-static encephalopathy caused by
intrapartum or late antepartum brain hypoxia and ischemia46”.
Severity of HIE predicts the outcome of cerebral development
following asphyxia.

25
Sarnat and Sarnat33 classified HIE into 3 clinical stages: mild (stage
1), moderate (stage 2) and severe (stage 3) encephalopathy.
Sarnat and sarnat staging of HIE
SIGNS STAGE 1 STAGE 2 STAGE 3
Level of
consciousness
Hyperalert Lethargic Stuporous,Coma
Muscle tone Normal Hypotonic Flaccid
Posture Normal Flexion Decerebrate
Tendon reflexes/
clonus
Hyperactive Hyperactive Absent
Myoclonus Present Present Absent
Moro reflex Strong Weak Absent
Pupils Mydriasis Miosis Unequal, poor
light reflex
Seizures None Common Decerebration
EEG Normal Low voltage
changing to
seizure
activity
Burst supression
to isoelectric
Duration <24 hrs 24 hrs - 14
days
Days to weeks
Outcome Good Variable Death, severe
deficits

26
HIE outcome can be modified when early identification of its
severity is made. The incidence of HIE is around 1.5/1000 live births with
60% occurring because of perinatal asphyxia48.
Pathophysiology of hypoxic-ischemic encephalopathy
Perinatal hypoxic injury effects had been done in animal studies
and two phases of energy failures (primary and secondary) were
observed49.
Histology of Brain in HIE
Primary energy failure:
This occurs at the cellular level with reduced CBF, ATP and increased
O2 requirement with inhibition of protein synthesis50. Calcium triggered
release of destructive enzymes initiate cell lysis51.

27
Secondary energy failure:
Delayed neuronal death in the form of apoptosis occur secondary to
calcium mediated release of lytic enzymes and perturbation of electron
transport chain. Generation of free radicals, leukotrienes, NO synthesis and
depletion of energy stores all lead to delayed neuronal death.
Reperfusion of previously ischemic tissue promotes the release of
free radicals in excess which causes injury to the blood brain barrier and
cellular components which in turn results in neutrophil influx and cytokine
release.
Flow chart showing pathophysiology of HIE

28
Effects of asphyxia on organ systems:
Respiratory system:
Asphyxia can lead to pulmonary hypertension52, pulmonary
hemorrhage and impaired surfactant production.
Cardiovascular system:
Hypoxia leads to myocardial injury53, 54 in the form of transient
myocardial ischemia, cardiac conduction abnormalities and myocardial
stunning.
Renal system:
Acute tubular necrosis with proximal tubular injury and adrenal
hemorrhage
Gastrointestinal system:
Perforation, ulceration and hemorrhage of gastric mucosa
Metabolic:
SIADH, hypoglycemia, hyperglycemia55, hypocalcemia &
myoglobinuria

29
Hematological system:
DIC, thrombocytopenia and increased NRBC count.
Adaptation of new borns to hypoxia:
The following are the newborn response to hypoxia

30
Diagnosis
A combination of clinical and laboratory investigations is required to
diagnose perinatal asphyxia.
Topography of brain injury in infants with HIE:
1. Selective neuronal necrosis: It involves the cerebral cortex, basal ganglia,
thalamus (status marmoratus), hippocampus and anterior horn cells of
spinal cord manifesting as seizures and coma.
2. Para sagittal injury: it is a water shed area vulnerable to ischemia resulting
in proximal limb weakness more involving the upper limbs.
3. Focal ischemic necrosis: involving cortical and subcortical white matter
manifesting as seizures and unilateral findings.
4. Periventricular injury (preterm): injury to lower motor tracts leading to
bilateral lower extremity weakness.
MRI showing Selective neuronal loss

31
Cranial ultrasonography
Cranial ultrasonography (CS) has limited utility in demonstrating
hypoxic injury in term infants. It is the initial modality used in preterm
infants56.
The above image is a cranial ultrasound of preterm infant showing
periventricular leucomalacia with IVH.
Doppler ultrasonography
Doppler ultrasonography not commonly used but can be used to
measure flow velocity57.
Computerized tomography
CT scan imaging can be used in term babies with asphyxia. It has
lost its popularity after the advent of MRI scan and also due to risk of
radiation exposure in assessing asphyxia58.

32
CT scan imaging of term infant with HIE
Magnetic resonance imaging
Diffusion weighted MRI is the preferred imaging modality in
neonates with HIE because it can detect topography of the lesion within
hours of insult59. MRI performed in later weeks of life of the neonate can
predict the neurological outcome60.

33
MRI scan of term neonate with HIE
Near-infrared spectroscopy
Near-infrared spectroscopy (NIRS) is non invasive and the degree of
reperfusion injury can be assessed with the use of it61.
Electroencephalography
Burst suppression on EEG is predictive of death or pathological
outcome62. Continuous EEG is more important than a single EEG63 in
predicting subclinical seizure activity. Amplitude integrated EEG (aEEG)
can predict long term neurological damage and it is simple to perform and

34
correlates with standard EEG. It can be used to predict HIE early so that
early treatment can be started64.
Laboratory evaluation
It includes ABG showing severe acidosis, elevated urea and creatinine,
FeNa, urinary β2 microglobulin65,66 and cystatin C67.
Cardiovascular system:
Troponin T and I, CK-MB can indicate myocardial ischemia68.
Central nervous system:
Glial fibrillary acid protein (GFAP), S-100 β69 protein, neuron
specific enolase and creatine kinase BB can indicate brain damage due to
asphyxia.
Management
Newborn resuscitation followed by ICU admission and supportive
care in the initial few hours of life are the most important measures to
reduce the progress of severity of injury.
Hypothermia initiated within 6 hours in severe asphyxia and
continued till 72 hours has resulted in good survival and outcome in
asphyxiated babies70. But this mode of treatment also causes a wide variety
of adverse effects and so vigilant monitoring is necessary71.

35
New born undergoing hypothermia
Neuroprotective agents that are used for the treatment are
phenobarbitone, melatonin, magnesium, erythropoietin and many other
drugs. The exact efficacy cannot be individualized for each drug.
Stem cell therapy, neuroprotection and immunomodulation are
newer modalities for the future still under research.
Outcome
Severe asphyxia is associated with high mortality. The morbidity
following HIE are listed in the pie chart depicted below. Cerebral palsy and
cognitive defects are the common forms of sequelae in these neonates.

36
Incidence of outcomes following HIE72

37
ASSESSMENT OF FETAL WELL BEING:
Fetal well being during labor and following delivery is being
assessed by observing for meconium passage, electronic fetal heart rate
monitoring, Apgar score and fetal acid base balance.
MECONIUM STAINING OF AMNIOTIC FLUID:
Heavy or thick meconium staining is considered a reliable marker of
more prolonged or severe asphyxia episodes. The incidence of meconium
staining is around 15% in all labors. But only 0.4% of term infants with
meconium staining during labor subsequently had cerebral palsy. This sign
is poorly predictive of adverse outcome and in one study, more than half of
infants who had early neonatal seizures (a possible indicator of intra
partum asphyxia) showed no evidence of meconium staining.
ELECTRONIC FETAL MONITORING (EFM):
Continuous electronic fetal monitoring is widely accepted and used
despite the fact it has not been shown to reduce perinatal mortality or
asphyxia relative to auscultation by trained personnel but has increased the
incidence of operative delivery. The parameters of fetal monitoring
recorded and evaluated are:

38
Baseline heart rate - normal between 110 and 160 beats in a
minute(bpm). This baseline value must be apparent continuously for a
period of 2 minutes in any segment for a stretch of 10 minute.
Fetal bradycardia is defined as a FHR < 110 bpm may result from
congenital heart block with associated congenital heart malformations or
maternal systemic lupus erythematosus.
Baseline tachycardia defined as FHR >160 bpm and may result due
to fetal dysrhythmia, hyperthyroidism, maternal fever or choioamnionitis.
Beat-to-beat variability: in an awake term fetus the autonomic
system constantly varies the fetal heart rate from beat to beat by
approximately 5 to 25 beats /minute. Depression of the fetal central
nervous system due to fetal immaturity, hypoxia, fetal sleep or specific 44
maternal medications such as narcotics, sedatives, beta blockers and
magnesium sulphate injections may result in a reduced beat to beat
variability.
Accelerations of the FHR are reassuring, as they are during a non
stress test(NST).
Decelerations of the FHR may be benign or indicative of fetal
compromise depending on the shape and timing in relation to uterine
contractions.

39
Early decelerations
Late decelerations
Variable decelerations
A normal fetal heart rate trace in labor appears to be a good indicator
that metabolic acidosis is not developing, but a severely abnormal trace
with late decelerations in the fetal heart rate is associated with significant
fetal acidosis in only about 50% of cases.

40
APGAR SCORE:
Apgar scores are a method of describing the condition of an infant at
birth, originally described by Virginia Apgar32.
Heart rate, respiratory efforts, tone, reflex activity and color a score
is established at 1 min and then at 5 min intervals as necessary (maximum
score 10).
Sign 0 1 2
Heart Rate absent <100 >100
Respiratory
effort
absent Slow, irregular Good & crying
Muscle tone Limp Some flexion
of extremities
Active motion
Response No
Response
Grimace Cough or sneeze
Color Blue, pale Body pink
extremities
blue
Completely pink

41
The ICD -10 definition of birth asphyxia is dependent on the 1
minute-Apgar score. The 1 minute-Apgar score is the scoring done to the
newborn exactly 1 minute after birth. 1 minute -Apgar score at of 0-3
defines severe birth asphyxia and an Apgar score of 4-7 indicates moderate
asphyxia. There is much debate as to whether this definition is of clinical
use. Defining birth asphyxia by Apgar score is however useful in
identifying a high risk group requiring further observation of their
neurological conditions with an understanding that it overestimates eight
folds the scale of the problem. A low Apgar score may be due to various
other conditions, like maternal drug administration in labor and or due to
immaturity of the baby.
The 1 minute Apgar score shows the need for resuscitation and the 5
minute Apgar score shows the effectiveness of resuscitation and also
predicts the prognosis of survival outcomes in neonates. Apgar score and
pH of cord blood both raises the relative risk of mortality in neonates
following asphyxia73.
NEONATAL RESUSCITATION
Though newborns breath effectively after delivery, 5 -10% of babies
require active intervention. The goals of neonatal resuscitation are to
prevent the morbidity and mortality associated with hypoxic injury and to
reestablish adequate spontaneous respiration and cardiac output.

42
Guidelines for neonatal resuscitation provide an integrated approach
to evaluate and resuscitate newborns. They help to intervene in quick time
in a stepwise manner so that timely resuscitation is provided. American
Heart Association has given updated guidelines in 2015 which is illustrated
below.
Resuscitation with room air rather than 100% oxygen is important
even in term infants to prevent free radical injury caused by hyperoxia.

43
Neonatal resuscitation guidelines 2015

44
NUCLEATED RED BLOOD CELLS AND NEWBORN
Nucleated red blood cells (NRBCs) are precursor cells to red blood
cells and they rarely enter the circulation from the bone marrow74.
Erythropoietin is the major stimulus for its release into the circulation from
the bone marrow
Acute and chronic hypoxia act as primary stimuli for erythropoietin release
which in turn can cause release of immature cells into the circulation.
These immature red blood cells are called as the nucleated red blood cells
or erythroblasts. It is expressed as an absolute number of cells per unit
volume, either “NRBCs/mm3” or “NRBCs/l”.
NRBC count per 100 white blood cells (WBCs) can also be used as
measure to quantitatively express their counts. But variation in WBCs due
to other causes like sepsis can affect NRBC count74.

45
Histology showing nucleated red blood cells
Raised WBCs will decrease NRBC count and low WBC
count will relatively raise the NRBC count. Careful elimination of causes
that alter these WBC count should be eliminated.
Normal NRBC count in term babies was 500 NRBCs/mm3 or 0-10 /
100 WBCs. NRBC count above 1000 NRBCs/mm3 or > 10/ 100 WBCs
can be considered elevated. It is often increased in preterm infants75. They
are usually cleared from the circulation after three days of life.
The NRBCs increase after perinatal asphyxia. They reach a peak at 6-
8 hours following brain injury and returns to normal by 36-72 hours. On
the other hand, the platelet count falls sometimes by 12 hours, and reaches
the nadir at 2-3 days.

46
Causes of increased nucleated red bloods cells in newborn
I. Physiological
Labor and vaginal births
Preterm newborns
Post-term newborns
II. Increased erythropoiesis
Chronic hypoxia
Growth restriction
Maternal pre-eclampsia
Maternal smoking
Anemia
Blood loss
Hemolysis—ABO or Rh isoimmunization, other
Maternal diabetes
Other
Leukemia
Down’s syndrome
TORCH infections
III. Acute stress release
Acute hypoxia
Subacute hypoxia
Chorioamnionitis
IV. Postnatal hypoxia
Cyanotic heart disease
Pulmonary failure
V. Idiopathic

47
MATERIALS AND METHODS
Study design:
A prospective observational case study
Study population and area:
With the approval from the hospital ethical committee and obtaining
informed consent from the parents, 100 asphyxiated newborns with
hypoxic ischemic encephalopathy were included in the study that was
conducted in tirunelveli medical college and hospital.
Study groups:
100 asphyxiated newborn babies were included as sample size based
on previous studies and time constraint in our study. They were divided
into two groups based on their Apgar score32 at 1 minute as
Group I: 56 babies with moderate asphyxia (APGAR of 4 - 6)
Group II: 44 babies with severe asphyxia (APGAR of < 3)
The study was conducted over a period of one year from August 2015
to August 2016.
48
Inclusion criteria:
All term intramural babies with perinatal asphyxia according to the
definition of WHO-NEONATAL PERINATAL DATABASE (2000),
Birth asphyxia: Apgar score of less than 7 at 1 minute of age
Moderate asphyxia: Apgar score between 4 to 6 at 1-minute of age
Severe birth asphyxia: Apgar score of 3 or less at 1-minute of age.
Babies who progress on to develop HIE
Exclusion criteria:
Preterm (< 37 weeks of gestational age)
Infant of diabetic mother
Mother on sedatives
Babies with congenital heart disease
Babies with Rh isoimmunisation
Babies with severe congenital malformation
Babies with chromosomal anomalies
Babies without hypoxic ischemic encephalopathy
Procedure and Observation:
After obtaining informed consent from the parents 100 asphyxiated
new born babies were included in the study based on the severity of
asphyxia. Severity of asphyxia was assessed based on the Apgar at 1 min
of age. The babies were divided into two groups based on their Apgar score

49
at 1 minute. Babies with low Apgar were followed up with their Apgar at
5 min of age. Babies requiring positive pressure ventilation for more than 1
minute were also noted. Once the newborns were stabilized, umbilical cord
blood of about 2ml was obtained and the babies were shifted to neonatal
intensive care for further observation and treatment.
The babies were monitored clinically and neurological insult because
of asphyxia was assessed based on sarnat and sarnat staging33 for hypoxic
ischemic encephalopathy. Babies without HIE were eliminated from the
study. Babies with HIE were graded as stage I (mild), stage II (moderate)
and stage III (severe).
These babies were followed and their short term outcome in the form
of mortality was noted.
Lab work:
After obtaining 2 ml of umbilical cord blood in a sterile syringe
during resuscitation, it was transferred within 30 minutes in a EDTA tube
to the pathology department. The blood was fixed with ethanol and
peripheral smear was obtained with leishmann stain on a glass slide. The
number of nucleated RBCs for 100 WBCs were observed and noted by the
pathologist.

50
Statistical analysis:
Mean and standard deviation were calculated for continuous
variables and percentage was calculated for categorical variables like sex
and mode of delivery. Student t test was used to compare the statistical
significance between the means of the two groups. P < 0.05 was considered
statistically significant. Chi square test was used for the categorical
variables. Correlation coefficient and area under the curve were used to
assess the strength of predicting the severity of asphyxia based on
nucleated RBC count.

51
FLOW DIAGRAM OF METHODOLOGY
Perinatal asphyxia with HIE (n= 100)included in study
Group I
Moderate asphyxia (n= 56)
Apgar 4-6
Group II
Sever asphyxia (n= 44)
Apgar < 3
n
n
Cord blood collected and NRBCcount measured
Staged into three stages basedon sarnat and sarnat staging of
HIE
n
n
Mild HIE (n = 33) Moderate HIE (n = 43) Severe HIE (n = 24)

52
OBSERVATION AND RESULTS
About 100 asphyxiated babies who developed HIE were included in
the study. They were divided into two groups based on the severity of
perinatal asphyxia based on Apgar score at 1 minute as
Group I- 56 moderate asphyxia(Apgar score - 4 to 6)
Group II- 44 severe asphyxia(Apgar score - < 3)
Demographic details
Table 1: Demographic parameters of study groups
Patient
factors
Group Mean S.D t
value
P
value
Statistical
significance
Maternal
age
Moderate 25.7 2.8 0.510 >0.05 Not
significantSevere 25.4 2.7
Gestational
age
Moderate 38.2 1.0 0.385 >0.05 Not
significantSevere 38.3 0.9
Birth
weight
Moderate 2.9 0.3 1.074 >0.05 Not
significantSevere 2.8 0.3
The above table summarizes the baseline characteristics like maternal age,
gestational age and birth weight of the study population between the two
groups. P value is > 0.05 and hence there is no statistically significant
difference.

53
Figure 1: Distribution based on maternal age
Bar chart showing mean maternal age distribution in the moderate and
severe asphyxia groups
Figure 2: Distribution based on different maternal age group
Bar chart showing distribution based on different maternal age group

54
Figure 3: Distribution based on mean gestational age
Bar chart showing mean gestational age distribution between the two
groups.
Figure 4 : Distribution based on mean birth weight
Bar chart showing mean birth weight distribution in both groups
38.2 38.3
35
36
37
38
39
40
MODERATE ASPHYXIA SEVERE ASPHYXIA
MEANGESTATIONALAGEINWEEKS

55
Distribution based on parity
Table 2: Association between parity and perinatal asphyxia
Parity
Perinatal asphyxia
χ 2 df SignificanceModerate Severe Total
No % No % No %
Primipara 25 44.6 24 54.5 49 49
0.967 1 P>0.05Multipara 31 55.4 20 45.5 51 51
Total 56 100 44 100 100 100
The above table summarizes the association between parity of
mothers and severity of asphyxia. The results revealed that there was no
statistically significant relationship between the parity of mothers and
perinatal asphyxia (P>0.05).
Figure 5 : Distribution based on parity
25
31
24
20
0
5
10
15
20
25
30
35
PRIMIPARA MULTIPARA
NO
OF
PATE
INTS
MODERATE ASPHYXIA
SEVERE ASPHYXIA
Bar chart showing distribution of patients based on parity between the two
groups.
56
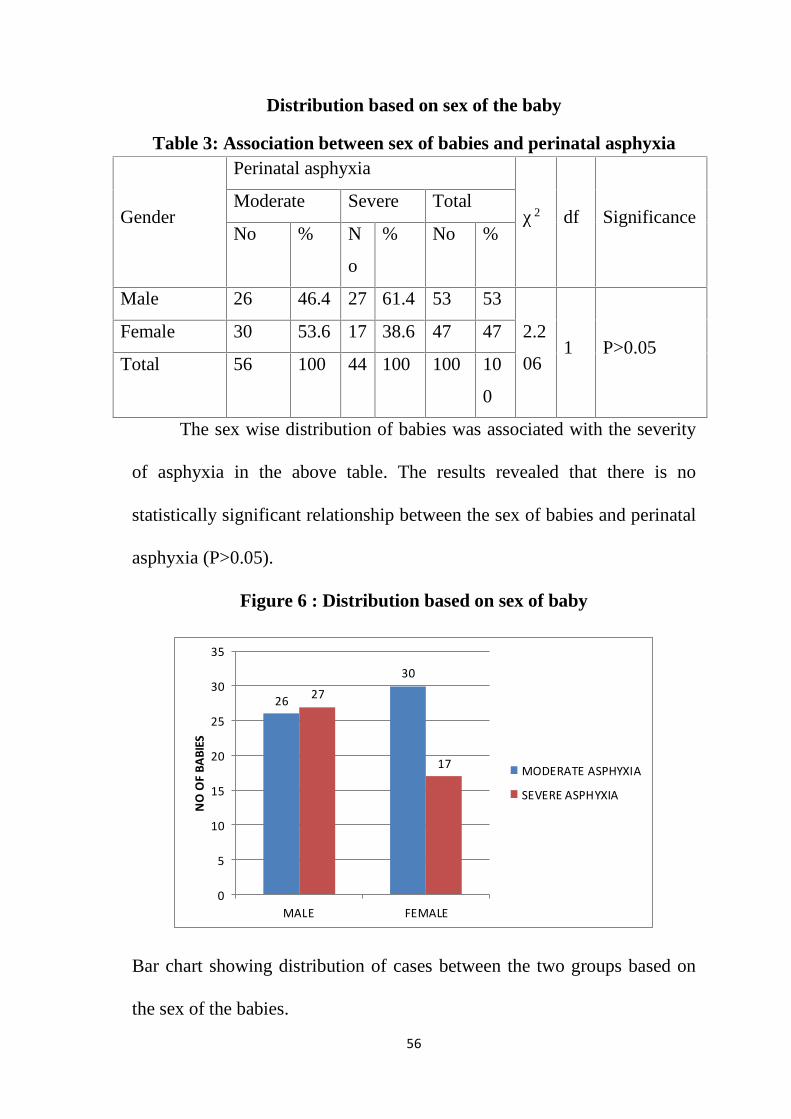
Distribution based on sex of the baby
Table 3: Association between sex of babies and perinatal asphyxia
Gender
Perinatal asphyxia
χ 2 df SignificanceModerate Severe Total
No % N
o
% No %
Male 26 46.4 27 61.4 53 53
2.2
061 P>0.05
Female 30 53.6 17 38.6 47 47
Total 56 100 44 100 100 10
0
The sex wise distribution of babies was associated with the severity
of asphyxia in the above table. The results revealed that there is no
statistically significant relationship between the sex of babies and perinatal
asphyxia (P>0.05).
Figure 6 : Distribution based on sex of baby
26
30
27
17
0
5
10
15
20
25
30
35
MALE FEMALE
NO
OF
BABI
ES
MODERATE ASPHYXIA
SEVERE ASPHYXIA
Bar chart showing distribution of cases between the two groups based on
the sex of the babies.

57
Distribution based on the mode of delivery
Figure 7 : Mode of delivery
34%
15%
51%
LABOUR NATURAL
ASISSTED
LSCS
Pie chart showing the mode of delivery. About 51% of the cases had
the mode of delivery as caesarean section.
Table 4: Association between modes of delivery and perinatal
asphyxia
Mode ofDeliveries
Perinatal asphyxiaχ 2 df
SignificanceModerate Severe Total
No % No % No %Assisted 8 14.
37 15.
915 15
4.635
1 P>0.05
LSCS 24 42.9
27 61.4
51 51
NVD 24 42.9
10 22.7
34 34
Total 56 100 44 100 100 100
In the above table, the modes deliveries were related with the
moderate and severe perinatal asphyxia of baby. There was no significant
relationship between the two attributes (P>0.05).

58
Figure 8: Distribution based on mode of delivery
Bar chart showing distribution of cases based on the mode of delivery
between the two groups.
Distribution based on presence of fetal distress
Figure 9 : Fetal distress
Pie chart showing the causes of fetal distress

59
Table 5: Association between fetal distress and perinatal asphyxia
FetalDistress
Perinatal asphyxia χ 2 df Sig.Moderate Severe TotalNo % No % No %
Cordaroundneck
3 5.4 1 2.3 4 4
30.504
1P<0.001
Cordprolapse
0 0 2 4.5 2 2
FBRADY
3 5.4 3 6.8 6 6
MSAF 6 10.7 25 56.8 31 31No 44 78.6 13 29.5 57 57Total 56 100 44 100 100 100
The above table states the relationship between the fetal distress and
perinatal asphyxia severity. MSAF was strongly associated with severe
asphyxia. The above relationship is statistically very highly significant
(P<0.001).
Figure 10: Distribution based on presence of fetal distress
Bar chart showing distribution based on presence of fetal distress

60
Figure 11: Distribution based on nature of amniotic fluid
Bar chart showing distribution based on nature of amniotic fluid.
There is a significant association between the meconium stained amniotic
fluid(MSAF) and severe asphyxia.

61
Distribution based on mean Apgar at 5 minutes
Table 6: Apgar at 5 min between the moderate and severe asphyxia
Variable
Moderate,
n=56
Severe,
n=44
Difference
b/w
means
“t” df Sig.
Mean SD Mean SD
Apgar
at 5 Min6.2 0.9 3.8 1.1 2.4 12.026 98 P<0.001
In the above table, Apgar at 5 min was compared between the moderate
and severe asphyxia babies. The mean Apgar of moderate category was
6.2±0.9 and severe category was 3.8±1.1. The difference between them
was statistically very significant (P<0.01).
Figure 12: Distribution based on mean Apgar at 5 minutes
Bar chart showing a significant difference in the mean Apgar score at 5
minutes between both the groups.

62
Distribution based on requirement of positive pressure ventilation
Table 7: Association between perinatal asphyxia and PPV > 1Min
Apgar
PPV > 1 Min
χ 2 df SigYes No Total
No % No % No %
Moderate 8 16.3 48 94.1 56 56
61.374 1 P<0.001Severe 41 83.7 3 5.9 44 44
Total 49 100 51 100 100 100
The above table states the relationship between the perinatal
asphyxia babies’ severity and PPV requirement for more than 1min. The
severe asphyxia was strongly associated with PPV > 1min. The above
relationship was statistically very significant (P<0.001).
Figure 13 : Distribution based on requirement of PPV > 1min
Bar chart showing significant difference in the requirement of positive
pressure ventilation of more than 1 minute between both the groups.

63
Distribution based on mean hemoglobin level at birth
Table 8: Level of Hb between the moderate and severe asphyxia
Variable
Moderate,
n=56
Severe,
n=44
Difference
b/w
means
“t” df Sig.
Mean SD Mean SD
Hb 15.5 0.9 15.6 0.8 0.1 0.356 98 P>0.05
In the above table-9, the Hemoglobin at birth was compared between the
moderate and severe asphyxia babies. The Hb of two category babies were
not statistically significant (P>0.05).
Figure 14: Distribution based on mean Hb level at birth
Bar chart showing that there is no difference in the mean
hemoglobin values between both the groups at birth.

64
Assessment of Nucleated RBCs
Table 9: Relationship between perinatal asphyxia and NRBCs
VariableModerate
n=56
Severe
n=44
Difference
b/w
means
“t” df Sig
NRBCs Mean SD Mean SD
9.6 6.6 26 12.5 16.48.4
50
9
8
P<0.00
1
The NRBCs of neonates were compared between the moderate and
severe asphyxia groups. The mean NRBCs of moderate asphyxia babies
was 9.6±6.6 and severe category was 26.0±12.5. The difference between
the means was statistically very highly significant (P<0.001).
Figure 15: Distribution based on nucleated RBCs
Bar chart showing statistically significant difference in the distribution of
nucleated RBCs between moderate and severe asphyxia.

65
Relationship between MSAF and NRBC count
Table 10: relationship between NRBC count and MSAF
Variable
WithoutMSAFn=69
With MSAFn=31
Differenceb/wmeans
“t”df
Sig
Mean SD Mean SD
NRBCs 12.2 9.2 24.5 12.8 13.35.886
98
P<0.0001
The above table shows the comparison between the presence of
meconium stained amniotic fluid and increase in nucleated RBC count. It
shows a statistically significant increase in nucleated RBC count in
MSAF patients.
Figure 16:NRBC count based on presence of MSAF
Bar chart shows a statistically significant difference in the mean NRBC
count between babies with MSAF and babies without MSAF

66
Relationship between HIE staging and NRBCs level
Table 11: Relationship between HIE stage with Nucleated RBCs:
HIEStage
NNRBCs
“F” df Sig. ComparisonsMean SD
Mild 33 6.2 2.9
141.734 2,97 P<0.001
The meanvalues
between the3 groups
weresignificant.
Moderate 43 15.0 5.1
Severe 24 34.8 10.7
The NRBCs of neonates were compared between the mild, moderate
and severe HIE stages of asphyxiated babies. The mean NRBCs of mild
HIE was 6.2±2.9, moderate HIE was 15.0 ±5.1 and severe HIE was
34.8±10.7. The differences between the means were statistically very
highly significant (P<0.001).
Figure 17: Distribution based on severity of HIE
6.2
15
34.8
0
5
10
15
20
25
30
35
40
MILD HIE MODERATE HIE SEVERE HIE
MEA
N N
UCL
EATE
D RB
C LE
VEL
Bar chart showing a statistically significant difference in the mean
nucleated RBC level between the three stages of HIE.

67
Correlation between NRBC count and APGAR and HIE Staging
Table 12: NRBC count correlation with APGAR and HIE staging:
Variables r Sig. r2 %
NRBC X APGAR -.806 P<0.001 0.65 65.0
NRBC X HIE
Staging.836 P<0.001 0.70 70.0
In the above table, NRBC count correlated with Apgar and HIE
staging. The correlation coefficient between the NBRCs and Apgar score
was -.806. That means, when the Apgar score decreases, the NRBC level
increases. The NRBCs determine the Apgar score by 65% and the
determination was statistically very highly significant (P<0.001). NRBCs
and HIE status were positively correlated (+.836). That means, when
NRBC count increases, the HIE staging also increases. NRBCs determined
the HIE staging by 70%. The determination was statistically very highly
significant (P<0.001).

68
Estimation of APGAR score and HIE Stage from NRBCs:
Fig 18: Estimation of Apgar score by NRBCs.
Apgar score (Y) = 4.846 - .081 NRBCs - (1).
In the above equation -1, when the NRBCs value is substituted the
Apgar score may be obtained.

69
Fig 19: Estimation of HIE score by NRBCs.
HIE stage (Y) = 1.068+0.050 NRBCs. – (2)
In the above equation -2, when the NRBCs value is substituted the
HIES stage may be obtained.

70
Predictions of NRBCs for determination of APGAR scores:
Fig 20: The ROC Curve predicts cut off point of NRBCs for
determining the severity of asphyxia.
The above table explains the predictive capacity of ROC curve.
The cut point was 15 NRBCs.
That means, the moderate (4-6) perinatal asphyxia will be ≤ 15 of
NRBCs and >15 will be severe (1-3) perinatal asphyxia.
Table 13:Area Under the Curve
AreaStd.
ErrorSig.
95% Confidence Interval
Lower BoundUpperBound
.905 .030 .000 .846 .963

71
Predictions of NRBCs for determination of HIE staging
Fig 21: The ROC Curve predicts cut point of NRBCs for determining
Mild HIE staging
Table 14: Area Under the Curve
Test Result Variable(s): NRBC
AreaStd.
ErrorSig
95% Confidence Interval
Lower Bound Upper Bound
.963 .016 .000 .932 .993
The above table explains the predictive capacity of ROC curve.
The cutoff point was 10. That means ≤ 10 NRBCs will be mild HIE status
and > 10 will be either moderate or severe HIE.

72
Fig 22: The ROC Curve predicts cut point of NRBCs for determining
Moderate HIE staging:
Table 15: Area Under the Curve
Area Std. Error Sig.95% Confidence Interval
Lower Bound Upper Bound
.912 .029 .000 .856 .968
The above table explains the predictive capacity of ROC curve.
The cut point was 18. That means the ≤ 18 NRBCs will be either
moderate or mild HIE status. But the cut point of mild HIE status is 10.
The moderate HIE status will be in between > 10 to ≤ 18.
The predicted cut point values lead to determine severe HIE will be > 18 of
NRBCs values.

73
Sensitivity and specificity of NRBC count
Table 16: Sensitivity and Specificity of APGAR with NRBCs:
NRBCsApgar score
Total4-6 1-3
<15 47 8 55
15+ 9 36 45
Total 56 44 100
The Cut off value of NRBCs was 15. Sensitivity of predicting severe
perinatal asphyxia- 83.9%. Specificity of predicting severe perinatal
asphyxia- 81.8%. Positive predictive value was 85.4%. Negative
predictive value was 80.0%.
Table 17: Sensitivity and Specificity of Mild HIE with NRBCs:
NRBCsHIEs
TotalMild others
<10 30 8 38
10+ 3 59 62
Total 33 67 100
The Cut off value of NRBCs was 10. Sensitivity of predicting Mild
HIEs was 90.9%. Specificity of predicting Mild HIEs was 88.1%. Positive
predicting value was 78.9%. Negative predicting value was 95.2%.

74
Table 18: Sensitivity and Specificity of Moderate HIE with NRBCs:
NRBCsHIEs
TotalModerate others
10-17 24 5 29
<10
and18+19 52 71
Total 43 57 100
The Cut off value of NRBCs was 10 to <18. Sensitivity of predicting
Moderate HIEs was 55.8%. Specificity of predicting Moderate HIEs was
91.2%. Positive predicting value was 82.7%. Negative predicting value
was 73.2%.

75
Association between nucleated RBCs and short term outcome
Table 19: Relationship between short term outcome and NRBCs
Variable
Discharged
n = 80
Death
n=20
Difference
b/w
means
“t” df Sig
Mean SD Mean SD
NRBCs 12.7 8.4 33.6 12.8 20.93 8.872 98 P < .0001
The above table shows that there was as significant association(P < 0.0001)
between short term outcome and NRBC count. The mortality was 20%
with cases having a significantly high mean NRBC count (33.6 +/- 12.8)
than the discharged cases (12.7 +/- 8.4).
Figure 23 : Distribution of short term outcome based on HIE staging
Bar chart showing distribution of short term outcome of cases based on
HIE staging.

76
DISCUSSION
Early recognition of severity of birth asphyxia is more important
because early institution of therapeutic measures in severe hypoxic
ischemic encephalopathy has resulted in better neurological outcome76.
One of the common finding in term neonates is presence of
nucleated RBCs after birth in umbilical cord blood. Their normal values
are usually less than 10/ 100 WBCs and will be cleared from neonatal
blood during the initial week after birth77.
Perinatal asphyxia is one of the causes for increase in NRBC count
in term neonates. Immature nucleated RBCs are released into the
circulation because of increased erythropoiesis as there is increased
erythropoietin release due to fetal distress induced hypoxia. Ferber et al has
studied the association between acute increase in NRBC level and
erythropoietin level after hypoxia25.
Hypothermia is effective if initiated within the first 6 hours of
birth78. But there has been no reliable method to identify poor neurological
prognosis in the initial hours after birth79. Markers of acute asphyxia like
lactate levels, base deficit and pH do not determine the chronicity of
disturbance as it is one of the important antecedent of permanent
neurological damage80. In contrast, NRBC elevation after hypoxia, reflects

77
both the chronicity and severity of the disturbance and may be an important
early predictor of poor neurological outcome77, 80.
This study was performed to use nucleated RBCs in umbilical cord
blood of term neonates as an indicator or predictor of severity of perinatal
asphyxia and severity of hypoxic ischemic encephalopathy in 100
asphyxiated neonates who develop HIE. They were divided into two
groups based on their one minute Apgar. Group I with Apgar of 4- 6 were
the moderate asphyxia group. Group II with Apgar < 3 were the severe
asphyxia group.
The demographic details of the mother and term neonates included in
the study like maternal age, gestational age, parity, mode of delivery, sex
of baby and birth weight of baby were comparable between both the groups
with no significant difference (p > 0.05). The presence of fetal distress was
significantly associated with severe asphyxia. Neonates born to mothers
with meconium stained liquor had a significant association with severe
asphyxia (p <0.001). There was a positive correlation between the presence
of meconium stained liquor and increase in nucleated red blood cell count.
Hanion-Lundberg et al19 also observed a similar positive correlation
between NRBC count and meconium stained liquor. There was also a
strong association between neonates in the severe asphyxia group and their
requirement of positive pressure ventilation for more than one minute

78
(p<0.001).The Apgar score at 5 minutes was also significantly comparable
between both the groups (p <0.001).
The association of nucleated red blood cells was also significantly
comparable between both the groups (p<0.001). Perrone et al81 reported
that Apgar scores at 1 minute and 5 minutes were inversely related to the
nucleated red blood cell count. Similarly in our study babies with low
Apgar showed a significantly high nucleated red blood cell count. In our
study the mean of nucleated red blood cells in the moderate asphyxia group
was 9.6 +/- 6.6 and in the severe asphyxia group it was 26 +/- 12.5. The
difference was statistically significant. Tungalag et al82 and Phelan et al83
also compared the nucleated RBC counts between asphyxiated and non
asphyxiated group and found that the NRBC counts to be more in the
asphyxiated group.
We also assessed the association between nucleated RBCs and
severity of HIE. Tungalag82 et al and Saracoglu et al84 reported a
statistically significant association between NRBC count and the severity
of hypoxic ischemic encephalopathy. This relationship was also
statistically significant in our study indicating that increase in nucleated
RBC count can predict the severity of hypoxic ischemic encephalopathy.
Manjusha G et al30 also evaluated this association and found that higher the
HIE staging, higher the mean NRBC/100 WBC count.

79
In our study the mean NRBC count in babies with mild HIE (33) was
6.2, moderate HIE was 15 and severe HIE was 34.8. This was comparable
to other studies.
HIE Stage
NRBCs
Our study Fern SJ et
al23 (2004)
Boskabadi et
al29 (2010)
Shivaprakash85
et al (2013)
Mild HIE 6.2 5.6 11.94 10.43
Moderate
HIE15 12.25 21.08 18.63
Severe HIE 34.8 8.4 29.18 30.83
P value <0.001 <0.001 <0.001 <0.001
The mean NRBC values of our study correlated well with the above
studies that also showed a statistically significant relationship with the
severity of HIE.
In our study, nucleated red blood cells count was reliable to detect as
area under the curve (AUC) was 90% and best cut off nucleated red blood
cells to predict severe asphyxia was >15/100 WBCs with a sensitivity of
83.9% and specificity of 81.8%. Saracoglu et al84 also reported that a level
of 14 NRBCs/ 100WBCs was required to predict fetal hypoxia.

80
In our study we also predicted the cutoff values of nucleated RBCs for
the different stages of HIE. The cutoff point for mild HIE was <10
NRBCs/100 WBC with a sensitivity of 90.9% and specificity of 88.1%;
severe HIE was >18 with a sensitivity of 87.5% and specificity of 96.9%
and in between the two values it was moderate asphyxia with a sensitivity
and specificity of 55.8% and 91.2%. Blackwell12 et al, showed that the best
cut off value for NRBCs counts in predicting HIE was 15/100 WBCs with
a sensitivity 100% and specificity of 73%.
With a mean NRBC count of 33.6 there was about 20% mortality in
the study population. Mortality was high in patients with severe HIE with a
statistically significant increase in NRBC count.

81
SUMMARY
The results of our study in 100 asphyxiated babies showed the following.
1. The 100 asphyxiated neonates were divided into two groups of group I
(moderate asphyxia, n= 56) and group II (severe asphyxia, n= 44). Based
on sarnat and sarnat grading they were divided into three grades of mild
(n= 33), moderate (n= 43) and severe (n = 24) HIE.
2. The mean NRBC count / 100 WBC in the severe asphyxia group ( 26 +/-
12.5) was significantly higher than that in the moderate asphyxia group(
9.6 +/- 6.6) with a P value of <0.001.
3. The NRBCs of neonates were compared between the mild, moderate and
severe, HIE stages of asphyxiated babies. The mean NRBCs of mild HIE
was 6.2±2.9, moderate HIE was 15.0 ±5.1 and severe HIE was 34.8±10.7.
The differences between the means of the three stages were statistically
very highly significant (P<0.001).
4. The correlation coefficient between the NRBCs and Apgar score at 1
minute was -.806. That means, when the Apgar score decreases, the NRBC
level increases. NRBCs determine severity of asphyxia based on Apgar
score by 65% and the determination was statistically very highly
significant (P<0.001).

82
5. NRBCs and HIE status were positively correlated (+.836). That means,
when NRBC count increases, the HIE staging also increases. NRBCs
determined the HIE staging by 70%. And the determination was
statistically very highly significant (P<0.001).
6. The ROC Curve predicted the cutoff point of NRBC / 100 WBC for
determining the severity of asphyxia with an area of 0.906. The cut point
was 15. NRBCs. That means, the moderate (4-6) perinatal asphyxia will be
≤ 15 of NRBCs and >15 will be severe (1-3) perinatal asphyxia.
7. The ROC Curve predicted the cutoff point of NRBC / 100 WBC for
determining the three different stages of hypoxic ischemic encephalopathy.
The cutoff point of NRBCs was 10 for mild HIE status, more than 10 but
less than 18 for moderate HIE and severe HIE will be >18 of NRBCs
values.
8. The sensitivity and specificity for predicting severe asphyxia based on
Apgar score at 1 minute by measuring NRBC count was 83.9% and 81.8%.
The sensitivity and specificity for predicting severe stage of HIE by
measuring nucleated RBC count was 55.8% and 91.2%.

83
9. There was 20% mortality in measuring the short term outcome with
statistically significant increase in NRBC count in these patients with a
mean of 33.6. The mortality was high in babies with stage III (severe) HIE.

84
LIMITATIONS
The following are our study limitations
1. As this was a case study involving 100 asphyxiated neonates divided into
two groups based on their first minute Apgar score the exact sample size
required was difficult to determine and there was unequal distribution of
sample size in between the two groups.
2. We did not study the pH of the cord blood or lactate level due to reduced
availability of resources and time constrain and so we used Apgar score at
1 minute to divide asphyxia as moderate or severe asphyxia although
Apgar score is a poor predictor of asphyxia.
3. We were not able to study the relationship between NRBC count and
acidosis because of the same above reason.
4. We did not consider the duration of clearance of NRBCs from venous
circulation of neonates and so we cannot establish its importance.
5. One of our limitation is that our study is a short term follow up study.
6. Although we excluded confounding factors like intra uterine growth
restriction, gestational diabetes, preeclampsia from our study, still a

85
complexity of interactions with variables other than asphyxia can affect the
level of nucleated RBCs.

86
CONCLUSION
We conclude that nucleated red blood cell count is a useful measure to
differentiate between moderate and severe asphyxia based on one minute
Apgar. Increase in NRBC count positively correlates with the three
different stages (mild, moderate & severe) of hypoxic ischemic
encephalopathy especially in the severe stage based on sarnat and sarnat
staging. Raised NRBC count can also predict the outcome of asphyxiates
babies in terms of mortality.

87
RECOMMENDATIONS
1. Cord blood nucleated RBCs can be used as an effective tool to predict the
severity of asphyxia along with other predictors. It also predicts the
severity of HIE based on Sarnat and Sarnat staging.
2. It stands as a simple, cost effective and least invasive test that provide
valuable information about the prognosis of asphyxiated neonates at the
earliest so that early treatment can be initiated.

CLINICAL PROFORMA
B/O: Maternal age: IP NO:
Date: Time: GA:
BW: Sex:
Fetal distress: Yes/ No
If yes: MSAF / Fetal bradycardia/ Cord prolapse/ Cord around neck/Others.
Mode of Delivery: NVD/ AVD/ LSCS
APGAR 1 min :
5 min :
Group I: Moderate asphyxia or Group II: Severe asphyxia
PPV > 1min :
Umbilical Cord Blood: Hb:
Management in NICU: Ventilatory support: Yes/No
HIE staging based on Sarnat and Sarnat: I / II / III
Nucleated RBCs / 100 WBCs:
Outcome : Discharged/ Death

Sarnat and Sarnat Staging

1
BIBLIOGRAPHY
1. World Health Organization. Global Health Workforce Statistics, The 2013
update, WHO, Geneva.
2. WHO. Basic Newborn Resuscitation: A Practical Guide. WHO Reference
Number: WQ 450 98 BA. Geneva: WHO; 1997.
3. Fahey JO and King TL. Intrauterine asphyxia; neonatal encephalopathy,
hypoxic ischemic encephalopathy, and cerebral palsy. Midwife Women’s
Health, 2005: 50 (6): 498-506.
4. Zhang H, Hao S, Fan X, Yang LU and Ruopeng S. The combined
detection of umbilical cord nucleated red blood cells and lactate: Early
prediction of neonatal hypoxic ischemic encephalopathy. J. Perinat. Med.,
2008 36: 240-247.
5. [Guideline] American Academy of Pediatrics. Relation between perinatal
factors and neurological outcome. In: Guidelines for Perinatal Care. 3rd ed.
Elk Grove Village, Ill: American Academy of Pediatrics; 1992:221-234.
6. [Guideline] Committee on fetus and newborn, American Academy of
Pediatrics and Committee on obstetric practice, American College of
Obstetrics and Gynecology. Use and abuse of the APGAR score. Pediatr.
1996. 98:141-142.
7. Al-Alfry A, Carol JE, Devarajan LV, Moussa MA. Term infant asphyxia
in Kuwait. Ann Trop Pediatr 1900; 10:355-61.

2
8. Boo NY. Factors associated with clinically significant perinatal asphyxia in
the Malaysians neonates: A case control study. J Trop Pediatr 1991; 34: 284-
9.
9. Airede AI. Birth asphyxia and hypoxic-ischaemic encephalopathy:
Incidence and severity. Ann Trop Paediatr 1991; 11: 331-5.
10.Synder EY, Cloherty JP. 6th ed. Lippincott-Williams and Wilkins; 2008.
Perinatal asphyxia. Manual of Neonatal Car; pp. 518–28.
11.Hermansen MC. Nucleated red blood cells in the fetus and newborn. Arch
Dis Child Fetal Neonatal Ed. 2001; 84: 211–5.
12.Blackwell SC, Refuerzo JS, Wolfe HM, Hassan SS, Berry SM, Sokol RJ
et al. The relationship between nucleated red blood cells counts and early-
onest neonatal seizures. Am. J. Obstet. Gynecol. 2000 182: 1452-57.
13.Bala D, Das S. A study of nucleated red blood cell count as a marker of
severity of hypoxic ischemic encephalopathy. Int J Contemp Pediatr. 2015
Aug; 2(3):224-226.
14.Fields LM, Entman SS, Boehm FH. Correlation of the one-minute Apgar
score and the pH value of umbilical arterial blood. South Med J. 1983 Dec;
76(12): 1477-9.
15.Bryce RL, Halperin ME, Sinclair JC. Association between indicators of
perinatal asphyxia and adverse outcome in the term infant: a methodological
review. Neuroepidemiology. 1985; 4(1): 24-38.

3
16.Gonzalez DJ, Moya M. Perinatal asphyxia, hypoxic-ischemic
encephalopathy and neurological sequelae in full-term newborns. II.
Description and interrelation. Rev Neurol. 1996 Aug; 24(132): 969-76.
17.Korst LM, Phelan JP, Ahn MO, Martin GI. Nucleated red blood cell: an
update on the marker for perinatal asphyxia. Am J Obstet Gynecol. 1996 Oct;
175(4): 843-6.
18.Gonzalez DJ, Moya M, Carratala F. Perinatal differences in relation to the
severity of perinatal asphyxia. An Esp Pediatr 1997 Jul; 47(1): 46-53.
19.Hanion – Lundberg KM, Kirby RS, Gandhi S, Broekhuizen FF.
Nucleated red blood cells in cord blood of singleton term neonates. Am J
Obstet Gynecol. 1997 Jun; 176(6): 1149-54.
20.Phelan JP, Korst LM, Ahn MO, Martin GI. Neonatal red blood cells and
lymphocyte counts in fetal brain injury. Obstet Gynecol 1998. Apr; 91(4):
485-9.
21.Axt R, Ertan K, Hendrik J, Wrobel M, Mink D, Schmidt W. Nucleated
red blood cells in cord blood of singleton term and post term neonates. J
Perinat Med 1999; 27(5): 376-81.
22.Ghosh B, Mittal S, Kumar S, Dadhwal V. Prediction of perinatal asphyxia
with nucleated red blood cells in cord blood of newborns. Int J Gynaecol
Obstet 2003 Jun; 81(3): 267-71.

4
23.Ferns SJ, Bhat BV, Basu D. Value of red blood cells in predicting severity
and outcome of perinatal asphyxia. Indain J Pathol Microbiol 2004 Oct;
47(4): 503-5.
24.Perri T, Ferber A, Digli A, Rabizadeh E, Weissmann A, Divon MY.
Nucleated red blood cells in uncomplicated pregnancy. Obstet Gynecol 2004
Aug; 104(2): 372-6.
25.Ferber A, Fridel Z, Weissmann A, Minior VK, Divon MY. Are elevated
fetal nucleated red blood cell counts an indirect reflection of enhanced
erythropoietin activity? Am J Obstet Gynecol 2004 May; 190(5): 1473-5.
26.Ferber A, Minior VK, Bomstein E, Divon MY. Fetal non reassuring status
is associated with elevation of nucleated red blood cell counts and
interleukin 6. Am J Obstet Gynecol. 2005 May; 192(5): 1427-9.
27.McCarthy JM, Capullari T, Thompson Z, Zhu Y, Spellacy WN.
Umbilical cord red blood cell counts : normal values and the effect of labour.
J Perinatol. 2006 Feb; 26(2): 89-92.
28.Shah V, Beyene J, Shah P, Perlman M. Association between
hematological findings and brain injury due to neonatal hypoxic ischemic
encephalopathy. Am J Perinatol. 2009 Apr; 26(4): 295-302.
29.Boskabadi H, Maamouri G, Sadeghian MH, Ghayour M, Heidarzade
M, Shakeri MT et al. Early diagnosis of perinatal asphyxia by nucleated
red blood cell count: a case-control study. Arch Iran Med 2010 Jul; 13(4):
274-81.

5
30.Manjusha G, Rashmi Dwivedi, Poorya G, Deepraj H. Nucleated red
blood cell in cord blood as a marker of perinatal asphyxia. J Clin Neonatol.
2013; 2(4): 179-82.
31.Mohanty A, Leena D, Subal P, Bijay M, Siba Shankar B. Cord blood
nucleated RBC as a predictor of perinatal asphyxia, severity and outcome.
Indian Journal of Clinical Practice. 2014 Mar; 24(10): 983-6.
32.Apgar V. A proposal for anew method of evaluation of the newborn infant.
Curr. Res. Anesth. Analg. 1953; 32(4): 260-7.
33.Sarnat H, Sarnat M. Neonatal encaphalopathy following fetal distress.
Arch Neurol.1976; 33: 695 - 705.
34.de Haan M, Wyatt JS, Roth S, Vargha-Khadem F, Gadian D, Mishkin
M. Brain and cognitive-behavioural development after asphyxia at term
birth. Dev Sci. 2006; 9: 350-8.
35.Lawn JE, Cousens S, Zupan J. 4 million neonatal deaths: when? where?
why? Lancet. 2005; 365: 891-900.
36.Bax MC, Flodmark O, Tydeman C. Definition and classification of
cerebral palsy. From syndrome toward disease. Dev Med Child Neurol
Suppl. 2007; 109: 39-41.
37.Addock LM, Papile L. Perinatal Asphyxia. Cloherty. JP, Editor. Manual of
neonatal care. 6th edition. Lippincott Williams and wilkins a wolters kluwar
business; 2008: p.518-528.

6
38.NNPD network. National neonatal perinatal database-report for the year
2002-2003.NNF NNPD network. New Delhi: 2005.
39.Committee on fetus and newborn, Committee on obstetric practice. Use and
abuse of the Apgar score. Pediatrics. 1996; 98: 141-2.
40.MacLennan A. A template for defining a causal relation between acute
intrapartum events and CP: International Consensus Statement. BMJ. 1999;
319(7216): 1054-9.
41.Task Force American College of Obstetricians and Gynecologists and the
American Academy of Pediatrics. Neonatal encephalopathy and CP.
Defining the pathogenesis and patho physiology. Washington DC: ACOG,
2003.
42.Muraskas JK, Morrison JC. A proposed evidence-based neonatal work-
up to confirm or refute allegations of intrapartum asphyxia. Obstet Gynecol.
2010; 116(2): 261-8.
43.Nelson K, Ellenberg J. Apgar scores as predictors of chronic neurologic
disability. Pediatrics. 1981; 68: 36-44.
44.Nelson KB, Leviton A. How much of neonatal encephalopathy is due to
birth asphyxia? Am J Dis Child. 1991; 145: 1325-31.
45.Badawi N, Kurinczuk JJ, Keogh JM, Alessandri LM, O’Sullivan F,
Burton PR et al. Intrapartum risk factors for newborn encephalopathy: the
western australian case-control study. BMJ. 1998; 317(7172): 1554-8.

7
46.Robertson CMT, Perlman M. Follow-up of the term infant after hypoxic-
ischemic encephalopathy. Paediatr Child Health. 2006; 11: 278-82.
47.Ferriero DM. Neonatal brain injury. N Engl J Med. 2004; 351: 1985-95.
48.Kurinczuk JJ, White-Koning M, Badawi N. Epidemiology of neonatal
encephalopathy and hypoxic-ischaemic encephalopathy. Early Hum Dev.
2010; 86: 329-38.
49.Lorek A, Takei Y, Cady EB, Wyatt JS, Penrice J, Edwards AD et al.
Delayed (“secondary”) cerebral energy failure after acute hypoxia-ischemia
in the newborn piglet: continuous 48-hour studies by phosphorus magnetic
resonance spectroscopy. Pediatr Res. 1994; 36(6): 699-706.
50.Johnston MV, Trescher WH, Ishida A, Nakajima W. Neurobiology of
hypoxic-ischemic injury in the developing brain. Pediatr Res. 2001; 49(6):
735-41.
51.Siesjo BK, Bengtsson F. Calcium fluxes, calcium antagonists, and calcium-
related pathology in brain ischemia, hypoglycemia, and spreading
depression: a unifying hypothesis. J Cereb Blood Flow Metab. 1989; 9: 127-
40.
52.Lapointe A, Barrington KJ. Pulmonary hypertension and the asphyxiated
newborn. J Pediatr. 2011; 158(2): 19-24.
53.Phelan JP, Korst LM, Martin GI. Application of criteria developed by the
Task Force on Neonatal Encephalopathy and Cerebral Palsy to acutely
asphyxiated neonates. Obstet Gynecol. 2011; 118: 824-30.

8
54.Hankins GD, Koen S, Gei AF, Lopez SM, Van Hook JW & Anderson
GD. Neonatal organ system injury in acute birth asphyxia sufficient to result
in neonatal encephalopathy. Obstet Gynecol. 2002; 99: 688-91.
55.Efron D, South M, Volpe JJ, Inder T. Cerebral injury in association with
profound iatrogenic hyperglycemia in a neonate. Eur J Paediatr Neurol.
2003; 7(4): 167-71.
56.Rutherford MA, Pennock JM, Dubowitz LMS. Cranial ultrasound and
magnetic resonance in imaging in hypoxic-ischaemic encephalopathy: a
comparison with outcome. Dev Med Child Neurol. 1994; 36: 813-25.
57.Daneman A, Epelman M, Blaser S, Jarrin JR. Imaging of the brain in
full-term neonates: does sonography still play a role? Pediatr Radiol. 2006;
36(7): 636-46.
58.Barnette AR, Horbar JD, Soll RF, Pfister RH, Nelson KB, Kenny MJ et
al. Neuroimaging in the evaluation of neonatal encephalopathy. Pediatrics.
2014; 133(6): 1508-17.
59.Kudreviciene A, Lukosevicius S, Laurynaitiene J, Marmiene V,
Tameliene R & Basevicius A. Ultrasonography and Magnetic Resonance
Imaging of the brain in hypoxic full term newborns. Medicina (Kaunas).
2013; 49(1): 42-9.
60.Martinez-Biarge M, Diez-Sebastian J, Kapellou O, Gindner D, Allsop
JM, Rutherford MA et al. Predicting motor outcome and death in term
hypoxic-ischemic encephalopathy. Neurology. 2011; 76: 2055-61.

9
61.Wintermark P, Hansen A, Gregas MC, Soul J, Labrecque M Robertson
RL et al. Brain perfusion in asphyxiated newborns treated with therapeutic
hypothermia. Am J Neuroradiol. 2011; 32(11): 2023-9.
62.Jose A, Matthai J, Paul S. Correlation of EEG, CT, and MRI brain with
neurological outcome at 12 months in term newborns with hypoxic ischemic
encephalopathy. J Clin Neonatol. 2013; 2(3): 125-30.
63.Khan RL, Nunes ML, Garcias da Silva LF, da Costa JC. Predictive value
of sequential electroencephalogram (EEG) in neonates with seizures and its
relation to neurological outcome. J Child Neurol. 2008; 23(2): 144-50.
64.Hellstrom-Westas L RI, de Vries LS, Greisen G. Amplitude-integrated
EEG classification and interpretation in preterm and term infants.
Neoreviews. 2006; 7: 76-87.
65.Banerjee M, Majumdar SK, Shahidullah MD. Relationships of Urinary
Beta2- microglobulin in neonates with impaired renal function in different
stages of hypoxic ischaemic encephalopathy. Bangladesh J Child Health.
2013; 37(1): 22-6.
66.Karlo J, Vishnu Bhat B, Koner BC, Adhisivam B. Evaluation of renal
function in term babies with perinatal asphyxia. Indian J Pediatr. 2014; 81:
243-7.
67.Treiber M, Gorenjak M, Balon BP. Serum cystatin-C as a marker of acute
kidney injury in the newborn after perinatal asphyxia. Ther Apher Dial.
2014; 18(1): 57-67.
10
68.. Kanik E, Ozer EA, Bakiler AR, Aydinlioglu H, Dorak C, Dogrusoz B
et al. Assessment of myocardial dysfunction in neonates with hypoxic-
ischemic encephalopathy: is it a significant predictor of mortality? J Matern
Fetal Neonatal Med. 2009; 22(3): 239-42.
69.Qian J, Zhou D, Wang YW. Umbilical artery blood S100b protein: a tool
for the early identification of neonatal hypoxic ischemic encephalopathy.
Eur J Pediatr. 2009; 168(1): 71-7.
70.Thoresen M, Tooley J, Liu X, Jary S, Fleming P, Luyt K et al. Time Is
Brain: Starting Therapeutic Hypothermia within Three Hours after Birth
Improves Motor Outcome in Asphyxiated Newborns. Neonatology. 2013;
104: 228-33.
71.Jannatdoost A, Assadollahi M, Arshadi M, Asghari M, Mohammadi F.
Therapeutic hypothermia head Cooling and its Adverse Effects in Newborns
with Perinatal Asphyxia. Intl Res J Appl Basic Sci. 2013; 5(12): 1546-51.
72.Mwaniki MK, Atieno M, Lawn JE, Newton CRJC. Long-term
neurodevelopmental outcomes after intrauterine and neonatal insults: a
systematic review. Lancet. 2012; 379(9814): 445-52.
73.Stoll BJ. Routine delivery room care. The Newborn. The fetus and the
Neonatal Infant. Nelson textbook of Pediatrics. 18th edition. Philadelphia:
Saunders; 2007. P. 679-680.

11
74.Lippman HS. Morphological and quantitative study of blood corpuscles in
the newborn period. American Journal of diseases in children 1924; 27: 473-
515.
75.Green DW, Hendon B, Mimouni FB. Nucleated erythrocytes and
intraventricular hemorrhage in preterm infants. Pediatrics. 1995; 96: 475-8.
76.Azzopardi DV, Strohm B, Edwards AD, Dyet L, Halliday HL, Juszczak
E, et al. Moderate hypothermia to treat perinatal asphyxial encephalopathy.
N Engl J Med 2009; 361: 1349–58.
77.Baschat AA, Gungor S, Kush ML, Berg C, Gembruch U, Harman CR.
Nucleated red blood cell counts in the first week of life: a critical appraisal
of relationships with perinatal outcome in preterm growth-restricted
neonates. Am J Obstet Gynecol 2007; 197(286): 1–8.
78.Jacobs S, Hunt R, Tarnow-Mordi W, Inder T, Davis P. Cooling for
newborns with hypoxic–ischemic encephalopathy. Cochrane Database Syst
Rev 2007;4:CD003311.
79.Li J, Funato M, Tamai H, Wada H, Nishihara M, Iwamoto H, et al.
Predictors of neurological outcome in cooled neonates. Pediatr Int 2013; 55:
169–76.
80.Soothill PW, Ajayi RA, Campbell S, Ross EM, Candy DC, Snijders RM,
et al. Relationship between fetal acidemia at cordocentesis and subsequent
neurodevelopment. Ultrasound Obstet Gynecol 1992; 2: 80–3.

12
81. Perrone S, Vezzosi P, Longini M, Marzocchi B, Tanganelli D, Testa M
et al. Nucleated red blood cell count in term and preterm newborns:
reference values at birth. Arch Dis Child Fetal Neonatal 2005; 90: 174–5.
82. Tungalag L, Gerelmaa Z. Nucleated red blood cell count in asphyxiated
newborns. Open Sci J Clin Med 2014; 2(1): 33-8.
83. Phelan JP, Ahn MO, Korst LM, Martin GI. Nucleated red blood cells :
a marker for fetal asphyxia? Am J Obstet Gynecol 1995; 173(5): 1380-4.
84.Saracoglu, Sahin I, Eser E, Gol K., Turkkani B et al. Nucleated red blood
cells as a marker in acute and chronic fetal asphyxia. Int. J. Gynaecol. Obstet.
2000; 71: 113-8.
85.Shivaprakash NC, Nigam G. Prediction of HIE by nucleated RBC’s in cord
blood, serum creatine kinase and assessment of outcome by follow up up to
6 months. Journal of Evolution of Medical and Dental Sciences. 2013: 2(19):
3340-8.

S.NO IPNO MATERNAL AGEGA PARITY sex B.WT MODE OF DELIVERYFD APGAR 4-6 APGAR <3 APGAR AT 5MINPPV > 1MIN
2 2922 25 37 M F 3.1 ASSISTED NO 4 6 N
4 2990 24 40 M F 2.7 LSCS NO 5 7 N
7 3036 25 37 M M 2.8 NVD NO 4 6 N
10 3040 22 39 P M 3.36 NVD NO 5 6 N
8 3044 26 38 M F 2.83 ASSISTED NO 5 7 N
11 3033 23 38 M F 2.87 NVD NO 4 7 N
13 2613 27 39 M M 2.67 LSCS NO 4 5 N
22 2619 25 38 P M 3.35 ASSISTED NO 5 7 N
23 2625 24 38 M F 3.43 LSCS NO 6 7 N
28 2626 22 38 P F 2.9 ASSISTED NO 4 7 N
30 2630 33 38 P F 3.4 LSCS NO 5 7 N
34 2634 24 40 P F 2.98 NVD NO 5 7 N
35 2648 24 38 M F 2.63 LSCS NO 5 7 N
37 2655 26 37 P M 2.67 NVD NO 5 6 N
39 3048 26 37 P M 3.1 ASSISTED NO 5 7 N
41 2663 27 39 P F 3.21 LSCS NO 4 8 N
42 2676 28 37 M F 3.03 LSCS NO 5 7 N
44 2680 31 39 M F 2.54 NVD NO 5 7 N
48 2704 21 39 M F 3.2 LSCS NO 5 8 N
51 2714 29 38 P M 2.9 LSCS NO 5 7 N
57 2966 25 38 P F 3.1 LSCS NO 5 7 N
63 2721 25 39 P F 3.24 LSCS cord around neck 4 6 N
64 2722 24 40 M M 2.54 NVD NO 4 7 N
69 2723 23 37 M F 3.14 LSCS NO 5 7 N
72 2937 26 40 M M 3.1 NVD NO 5 7 N
78 5358 32 38 M M 3.13 LSCS NO 4 7 N
79 3271 24 37 P F 3.4 LSCS F BRADY 5 7 N
83 3272 24 39 P F 2.74 NVD NO 5 7 N
87 3304 25 39 M M 3 LSCS F BRADY 5 6 N
89 3317 26 38 P M 2.91 NVD NO 5 7 N
91 3331 25 37 M M 3.34 NVD NO 4 7 N
94 3340 29 37 P F 2.6 LSCS NO 5 7 N
96 3370 21 38 P M 3.1 NVD NO 5 7 N

1 3374 23 38 P M 2.8 LSCS NO 3 5 N
2 3384 26 39 P F 2.9 ASSISTED NO 2 3 N
5 5413 25 39 P M 2.6 LSCS MSAF 3 4 Y
9 3393 24 39 M F 3.1 LSCS NO 4 5 N
12 5358 30 38 M M 2.6 NVD NO 4 5 N
14 3402 28 38 P F 2.56 LSCS NO 3 5 Y
16 3437 23 39 P F 2.9 ASSISTED MSAF 4 6 Y
18 3439 32 39 P F 2.78 NVD MSAF 4 5 Y
20 3451 19 37 P M 2.83 NVD NO 2 3 Y
24 5435 27 39 P M 2.56 LSCS MSAF 3 4 Y
27 4060 25 37 M M 2.65 LSCS F BRADY 3 5 N
32 4963 26 38 M M 2.9 ASSISTED F BRADY 3 5 Y
33 4060 27 39 P M 2.77 LSCS MSAF 3 6 Y
36 4068 25 37 M M 2.51 LSCS MSAF 3 5 Y
40 4095 25 38 M M 3.23 LSCS cord around neck 3 4 Y
46 4117 26 37 M M 2.51 LSCS F BRADY 3 5 Y
47 4123 24 38 M M 3.01 LSCS NO 4 5 N
50 4189 30 37 P F 2.73 NVD NO 4 5 N
52 4204 25 38 M M 3.06 LSCS MSAF 2 5 Y
53 4203 27 38 P M 3.4 ASISSTED NO 3 6 Y
55 4103 24 40 M M 2.8 LSCS cord around neck 4 6 N
58 4229 26 39 M F 2.66 NVD NO 4 5 N
59 4210 25 37 M M 2.7 NVD NO 4 5 N
60 4211 27 37 P M 2.8 NVD NO 4 5 N
61 4220 23 38 M M 3.5 LSCS F BRADY 4 6 Y
65 4227 27 40 P M 3.03 LSCS MSAF 3 5 Y
67 4234 25 39 P M 2.58 ASSISTED NO 4 5 Y
66 4241 24 38 M F 2.65 NVD NO 4 6 N
70 5017 24 38 P F 2.78 LSCS cord around neck 4 6 Y
73 4251 24 37 M M 2.98 ASSISTED NO 4 6 N
74 4877 25 38 P F 2.87 LSCS NO 4 5 N
75 4908 28 38 M M 2.79 LSCS MSAF 4 6 N
76 4909 26 38 P F 2.54 NVD NO 5 6 N
80 4912 27 38 M M 2.51 NVD NO 4 6 Y

82 4043 21 38 M M 2.73 NVD NO 2 5 Y
84 4938 33 37 P F 2.61 LSCS NO 3 5 Y
86 4956 30 39 M F 3.02 NVD MSAF 4 5 Y
88 2308 27 38 P F 2.66 ASSISTED NO 3 5 Y
90 4979 24 39 M M 3.23 NVD NO 3 5 Y
92 4901 26 39 P M 3.08 LSCS MSAF 3 5 Y
95 4996 30 38 M F 3.2 NVD MSAF 4 6 Y
98 4108 24 39 M F 3.2 LSCS MSAF 3 5 Y
99 5001 25 40 P M 2.76 NVD NO 4 5 N
6 2366 23 38 P F 2.7 LSCS MSAF 2 3 Y
15 5002 22 40 M M 2.81 NVD MSAF 1 3 Y
17 5013 26 38 M F 3.2 ASSISTED NO 2 3 Y
19 5011 21 40 M M 2.71 LSCS MSAF 2 2 Y
21 3326 26 37 M F 2.7 NVD MSAF 3 3 Y
25 5024 26 39 M M 2.53 NVD MSAF 1 2 Y
26 4404 24 40 P M 2.76 NVD NO 1 3 Y
29 4417 23 38 P M 3.05 LSCS MSAF 1 3 Y
31 3352 25 39 M M 3.2 NVD MSAF 2 3 Y
38 4438 27 38 M F 2.8 LSCS MSAF 2 3 Y
43 4495 26 38 P F 2.6 LSCS MSAF 2 3 Y
45 4461 22 40 P M 2.62 LSCS cord prolapse 3 4 Y
49 4489 23 40 M M 2.67 LSCS MSAF 4 4 N
54 4481 26 39 P F 3.1 NVD NO 1 3 Y
56 4511 30 37 P F 2.76 LSCS MSAF 2 3 Y
62 4528 27 38 P F 3.43 ASSISTED MSAF 1 2 Y
68 3423 27 38 M F 3.06 LSCS MSAF 2 3 Y
71 4524 25 39 P M 3.16 LSCS NO 2 3 Y
77 4530 26 39 P F 3.12 LSCS MSAF 2 3 Y
81 4541 23 39 P M 2.67 NVD MSAF 1 3 Y
85 3431 26 38 P F 2.51 LSCS MSAF 2 3 Y
93 4534 27 38 M M 2.75 LSCS MSAF 2 3 Y
97 4560 22 37 M F 3.4 LSCS cord prolapse 2 3 Y
100 4551 33 38 M M 2.8 ASSISTED MSAF 1 3 Y
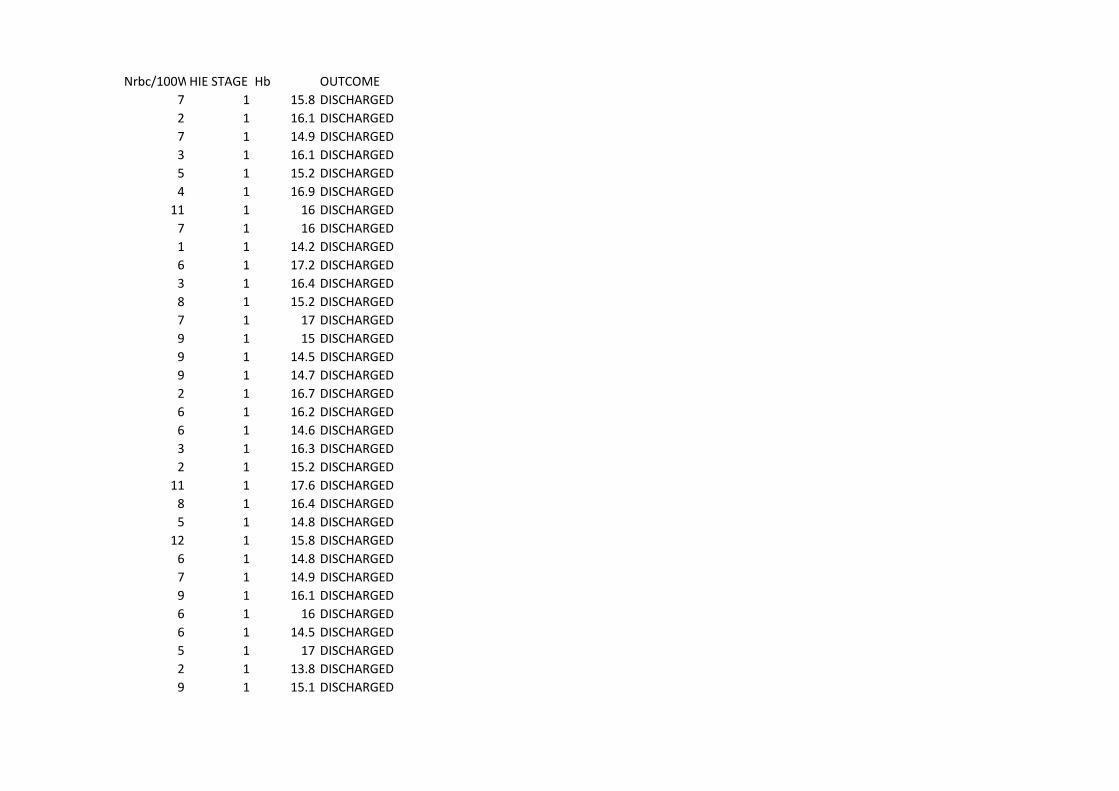
Nrbc/100WBCSHIE STAGE Hb OUTCOME
7 1 15.8 DISCHARGED
2 1 16.1 DISCHARGED
7 1 14.9 DISCHARGED
3 1 16.1 DISCHARGED
5 1 15.2 DISCHARGED
4 1 16.9 DISCHARGED
11 1 16 DISCHARGED
7 1 16 DISCHARGED
1 1 14.2 DISCHARGED
6 1 17.2 DISCHARGED
3 1 16.4 DISCHARGED
8 1 15.2 DISCHARGED
7 1 17 DISCHARGED
9 1 15 DISCHARGED
9 1 14.5 DISCHARGED
9 1 14.7 DISCHARGED
2 1 16.7 DISCHARGED
6 1 16.2 DISCHARGED
6 1 14.6 DISCHARGED
3 1 16.3 DISCHARGED
2 1 15.2 DISCHARGED
11 1 17.6 DISCHARGED
8 1 16.4 DISCHARGED
5 1 14.8 DISCHARGED
12 1 15.8 DISCHARGED
6 1 14.8 DISCHARGED
7 1 14.9 DISCHARGED
9 1 16.1 DISCHARGED
6 1 16 DISCHARGED
6 1 14.5 DISCHARGED
5 1 17 DISCHARGED
2 1 13.8 DISCHARGED
9 1 15.1 DISCHARGED

14 2 16.5 DISCHARGED
16 2 15.7 DISCHARGED
34 2 16.2 DISCHARGED
13 2 16 DISCHARGED
16 2 15.3 DISCHARGED
14 2 15 DISCHARGED
15 2 14.6 DISCHARGED
9 2 14.3 DISCHARGED
17 2 15.4 DISCHARGED
9 2 15.8 DISCHARGED
19 2 16.5 DISCHARGED
17 2 15.2 DISCHARGED
17 2 15.3 DISCHARGED
16 2 17.1 DEATH
7 2 15.1 DISCHARGED
14 2 15.1 DISCHARGED
10 2 15.2 DISCHARGED
14 2 15.2 DISCHARGED
21 2 17.1 DISCHARGED
15 2 15.8 DISCHARGED
8 2 15.9 DISCHARGED
6 2 14.8 DISCHARGED
15 2 15.2 DISCHARGED
9 2 15.7 DISCHARGED
21 2 15.9 DISCHARGED
19 2 16.3 DISCHARGED
8 2 14.6 DISCHARGED
14 2 16.1 DISCHARGED
11 2 17 DEATH
11 2 15.6 DISCHARGED
13 2 15.4 DISCHARGED
20 2 14.3 DISCHARGED
24 2 14.5 DISCHARGED
10 2 14.8 DISCHARGED

19 2 15.4 DISCHARGED
18 2 16.3 DISCHARGED
17 2 16.1 DISCHARGED
19 2 14 DISCHARGED
16 2 15.5 DISCHARGED
11 2 15 DISCHARGED
14 2 17 DISCHARGED
18 2 15.7 DISCHARGED
18 2 16 DISCHARGED
46 3 15 DEATH
48 3 15.1 DEATH
36 3 14 DISCHARGED
19 3 15.2 DISCHARGED
14 3 15 DEATH
42 3 16.4 DEATH
32 3 17 DEATH
29 3 16.1 DISCHARGED
28 3 16.5 DISCHARGED
30 3 17 DEATH
40 3 14.6 DEATH
17 3 15.3 DEATH
41 3 14.7 DISCHARGED
43 3 15.7 DEATH
39 3 16.1 DISCHARGED
41 3 14.3 DEATH
9 3 14.7 DEATH
44 3 16.2 DEATH
42 3 14.6 DEATH
44 3 15.3 DEATH
40 3 16.3 DEATH
33 3 16.2 DEATH
38 3 15.2 DEATH
42 3 15.4 DEATH