a study of rapid hydrological appraisal in the krueng...
TRANSCRIPT

Technical Final Report
A Study of Rapid Hydrological Appraisal
in the Krueng Peusangan Watershed, NAD,
Sumatra
Submitted by
World Agroforestry Centre (ICRAFSEA)
To
WWF Indonesia
World Agroforestry Centre (ICRAFSEA)
30 September 2010

Technical Final Report
A Study of Rapid Hydrological Appraisal
in the Krueng Peusangan Watershed, NAD,
Sumatra
Ni’matul Khasanah
Elok Mulyoutami
Andree Ekadinata
Toni Asmawan
Lisa Tanika
Zuraida Said
Meine van Noordwijk
Beria Leimona
World Agroforestry Centre (ICRAF SEA)
30 September 2010

i
Summary
The Krueng Peusangan Watershed is categorized as degraded area with 1st
priority by the Department of Public Work and Water Resource Services of Aceh
Province (Departemen Pekerjaan Umum dan Dinas Sumber Daya Air, Aceh province)
meaning this watershed has experienced very severe degradation and needs high
priority to improve its situation. The Aceh Provincial Government developed a strategic
planning of integrated and sustainable watershed management of the Krueng
Peusangan watershed to prevent further watershed degradation. Aligned to the
development of the strategic planning, WWF in collaboration with the World
Agroforestry Centre (ICRAF) SEA Regional Program conducted a comprehensive
hydrology study from the perspective of multiple stakeholders using the Rapid
Hydrological Appraisal (RHA) method.
The objectives of the RHA are to appraise the hydrological situation from the
perspective of multiple stakeholders: local ecological knowledge, public/policymakers
ecological knowledge, and hydrologist/modeler ecological knowledge. Further, the
recommendation from the application of RHA is to design a realistic approach in
designing a reward for watershed services scheme. To accomplish the objective of the
study, the RHA method was implemented through the following activities:
1. Survey and exploration of the two main types of stakeholder knowledge: local and
public/policy maker ecological knowledge (LEK and PEK) on water movement and
causes and consequences of land use options on the landscape from the perspective
of multiple users of the Krueng Peusangan watershed,
2. Gathering and analyzing of existing climate and hydrology data on the Krueng
Peusangan watershed,
3. Spatial data analysis of the Krueng Peusangan watershed to obtain land cover
information, land cover change information and watershed characteristic,
4. Analyses of the consequences of current land cover change on the values of water
balance including river flow in the Krueng Peusangan watershed using GenRiver 2.0
model, and
5. Analyses of plausible future land cover changes scenarios and its impacts using
GenRiver 2.0 model.
The Krueng Peusangan watershed is a cross-district watershed with a lake
located in its upper part and consists of 11 sub-watersheds. It has moderately high
rainfall and wet seasons. Our analysis of land cover change in 1990 – 2009 showed that
the watershed had experienced decrease of forest and pine forest cover (about 40%)
and increase of settlement, oil palm plantation and other tree cover systems such as
coffee agroforest, both monoculture and complex mixed tree crops.
As the consequences of tree cover decrease in the landscape for the last 20
years, the total water yield as a fraction of total rainfall increased. High total water yield
especially under intensive rainfall events contributed to increasing surface flow and lead
to floods, soil erosion and riverbank abrasion.
In the upper watershed, the Gayo people live along the river and surrounding
the Lake Laut Tawar, while the Aceh people live in mid and downstream of the

ii
watershed. The Gayo people mostly planted upland rice, coffee, cocoa, and pinang
under both monoculture and mixed crop systems. The Acehnese practiced fishing and
cultivated irrigated paddy, coconut, oil palm, and mixed garden.
Our survey resulted that both upstream and downstream communities
recognized the importance of river; however, they had different opinions of the major
problem of the watershed. The upstream community mentioned decreasing river flow,
low water quality and sedimentation as the problems, while the mid- and downstream
community considered disaster as the main problems, such as riverbank collapse
(abrasion) and flood causing economic lost to them. We found that the locals were also
familiar with tree species with high capacity to reduce erosion and simple constructions
to maintain the stability of riverbank.
Our interview with policy makers, such as district and provincial government
officers revealed that the Krueng Peusangan watershed had important economical and
ecological roles. While mentioning abrasion, erosion, flooding and sedimentation as the
problems they faced, they considered forest clearing and mining activities, and wild
foraging as the main causes of these problems.
The study analyzed 5 scenarios to understand the impact of land use change to
the key hydrological parameters of the Krueng Peusangan watershed. The scenarios vary
from “business as usual” with 4 percent decrease of forest over time, mild level
increment of tree cover, such as increase of complex mixed tree crop and/or pine forest,
and extreme increment of tree cover with full natural forest cover except for the
settlement. We found that the water balance did not differ significantly under
conversion of non-tree cover system to complex mixed tree crop and logged over forest
to pine forest, or the combination of both (Scenario 1,2,3) because the affected area is
relatively small (10-15% of the total area). Reforesting all land cover in the watershed
except settlement area (scenario 5) resulted on increase in evapotransporation (50%)
and decrease in river discharge (25%). Reforesting part of the watershed, such as
bareland and logged over forest and converting monoculture crop and plantation to
complex mixed tree system (scenario 4) gave slightly lower water balance
(evapotranspiration and river flow) trend compare to scenario 5. There is also a slight
increase in soil base flow for both scenarios 4 and 5. It is imply that there is transfer of
surface runoff into soil base flow. Shifts in this pathway that water takes to reach the
river, from current surface flow to an increase in base flow will depend on the rate of
recovery of soil physical conditions.
For the next step of research, we recommend a follow up study on (1) the
effects of coffee agroforestry and other forest derived land uses on soil physical
conditions; (2) explore types of tress preferred by the communities with ecological and
economical values.
This study gave basic understanding in designing rewards for environmental
service schemes (RES) in the Krueng Peusangan watershed. It proved that modification
of parts of the watershed to forest and/or complex mixed system can enhance water
balance of the watershed. We also found out that the local knowledge in this area could
contribute greatly to the tree selection and solution to watershed problem, such as
simple constructions to retain collapse riverbank. Therefore, recognition of such
knowledge will become an important element in the RES design. Layered stakeholders

iii
and complex issues of land cover in this watershed suggest that applying a direct –
supply demand – payment for environmental services might not work at the initial stage
of the process. The site manager may want to build a joint investment approach in
solving the problems and managing the watershed, between communities who maintain
a healthy watershed (ES providers) and ones who benefit from it (ES beneficiaries). The
co-investment scheme, in principle, is to have strong trust and commitment in order to
gain benefits and share risks together between ES providers and ES beneficiaries.

iv
Table of Content
I. INTRODUCTION ........................................................................................................... 1
II. METHODOLOGY .......................................................................................................... 3
2.1. Knowledge Surveys and Stakeholder Analysis .................................................. 3
2.2. Analysis of Climate and Hydrology Data............................................................ 5
2.3. Analysis of Land Cover/Land Cover Change and Watershed Characteristic ..... 6
2.4. Analyses of the Consequences of Current and Future Land Cover Change on
Water Balance Including River Flow ......................................................................... 11
III. RESULT ...................................................................................................................... 18
3.1. The Study Site .................................................................................................. 18
3.2. Knowledge Surveys and Stakeholder Analysis ................................................ 21
3.3. Analysis of Climate and Hydrology Data.......................................................... 25
3.4. Spatial Analysis: Land Cover/Land Cover Change and Watershed Characteristic
Analysis ..................................................................................................................... 28
3.5. Analyses on the Consequences of Current and Future Land Cover Change on
Water Balance Including River Flow ......................................................................... 36
IV. DISCUSSION ............................................................................................................... 43
V. CONCLUSION ............................................................................................................. 46
REFERENCES ...................................................................................................................... 47
APPENDIXES ...................................................................................................................... 48

v
List of Figure
Figure 1. Three types of knowledge deal with in understanding the hydrological
situation. ............................................................................................................................. 2
Figure 2. Rapid Hydrological Appraisal activities ................................................................ 3
Figure 3. Time series satellite image for the Krueng Peusangan watershed ...................... 7
Figure 4. Overall workflow of terrain processing for watershed and stream network
delineation .......................................................................................................................... 8
Figure 5. Overall work flow of analysis of land use/cover change and trajectories (ALUCT)
............................................................................................................................................ 9
Figure 6. Segmentation process ........................................................................................ 10
Figure 7. Classification hierarchical scheme ..................................................................... 11
Figure 8. Overview of GenRiver 2.0 model ....................................................................... 12
Figure 9. Study area of the Krueng Peusangan watershed ............................................... 18
Figure 10. Monthly rainfall pattern in the Krueng Peusangan watershed
(www.worldclim.com) ...................................................................................................... 19
Figure 11. Monthly and daily evapotranpiration in the Krueng Peusangan watershed ... 19
Figure 12. Local community perspectives on the cause and impact of abrasion ............. 23
Figure 13. Local community perspectives on the cause and impact of decreasing of river
flow, sedimentation and water quality ............................................................................. 23
Figure 14. Stakeholder perspectives on main hydrological problems and the causal
factors on down – midstream of the Krueng Peusangan watershed ............................... 24
Figure 15. Stakeholder perspectives on the hydrological problems and cause of Lake Laut
Tawar and upstream of the Krueng Peusangan watershed ............................................. 25
Figure 16. Double mass cumulative rainfall – river flow curve. ........................................ 26
Figure 17. Flow persistence Qi+I versus Qi plots. ............................................................... 28
Figure 18. Sub-catchment of the Krueng Peusangan watershed ..................................... 29
Figure 19. GPS points for accuracy assessment ................................................................ 30
Figure 20. Time series land cover maps of the Krueng Peusangan watershed ................ 32

vi
Figure 21. Overall land cover change of the Kreung Peusangan watershed .................... 34
Figure 22. Deforestation in the Kreung Peusangan watershed ........................................ 34
Figure 23. Land use trajectories map of the Kreung Peusangan watershed .................... 35
Figure 24. Land use trajectories for each sub-catchment of the Kreung Peusangan
watershed ......................................................................................................................... 35
Figure 25. Plot of cumulative rainfall vs cumulative discharge of simulation and
measurement .................................................................................................................... 36
Figure 26. Flow persistence Qt+1 versus Qt plots ............................................................... 37
Figure 27. Hydrograph of simulation and measurement of discharge (mm) ................... 37
Figure 28. Water balance from 1991 – 2009 (mm)........................................................... 38
Figure 29. Indicator of watershed function for the last 18 years ..................................... 39
Figure 30. Water balance for each scenario compared to the 2009 condition ................ 40
Figure 31. Buffering indicator of scenario 1, 4 and 5 expressed to its frequency ............ 42

vii
List of Tables
Table 1. Steps of LEK and PEK survey on RHA ..................................................................... 4
Table 2. Available data on climate and hydrology of the Krueng Peusangan watershed. . 5
Table 3. List of satellite images for the Krueng Peusangan watershed .............................. 7
Table 4. Input data for GenRiver 2.0 model ..................................................................... 13
Table 5. Multiplier of daily potential evapotranspiration for each land cover type......... 13
Table 6. Soil type, area and distance to outlet for each sub-catchment .......................... 14
Table 7. Land cover re-classification ................................................................................. 14
Table 8. Input parameter BD/BDref, potential interception and relative drought
Threshold .......................................................................................................................... 15
Table 9. Presentation of land cover change ..................................................................... 15
Table 10. A number of non measured parameters ........................................................... 15
Table 11. Scenarios to understand the impact of land use change .................................. 16
Table 12. Percentage of land cover change for each scenario ......................................... 17
Table 13. Community characteristics ................................................................................ 20
Table 14. Riparian land use area in down to midstream .................................................. 20
Table 15. Land use in surrounding Lake Laut Tawar ......................................................... 21
Table 16. Knowledge and perspective of local community on watershed functions ....... 22
Table 17. Knowledge and perspective of local community on hydrological problems .... 22
Table 18. Rainfall – River flow data analysis, ∑P-∑Q ......................................................... 26
Table 19. Generated monthly rainfall data (1991 - 2009) using rainfall simulator .......... 27
Table 20. Sub-catchment area of the Krueng Peusangan watershed ............................... 29
Table 21. Accuracy assessment result .............................................................................. 31
Table 22. Area of change for each land cover type in the Kreung Peusangan watershed
1990-2009 ......................................................................................................................... 33
Table 23. Monthly discharge performance test................................................................ 38

viii
Table 24. The summary of water balance 1991 – 2009 .................................................... 38
Table 25. The summary of water balance 1991 – 2009 .................................................... 39
Table 26. The summary of water balance for each scenario at year 2019 ....................... 40
Tabel 27. Lake volume in any scenarios (m3) .................................................................... 41
Table 28. The summary of water balance 2000 – 2019 .................................................... 41
Table 29. Local community perception on some action ................................................... 44
Table 30. Stakeholder perception on hydrological problems and the appropriate action
.......................................................................................................................................... 45

1
I. INTRODUCTION
The Krueng Peusangan watershed is one of the main watersheds in Nanggroe
Aceh Darussalam province. Its total area is about 238,550 ha and it includes four
regencies (kabupaten), an upstream area in Aceh Tengah, a mid stream area in Bener
Meriah, and a downstream area in Bireun and Aceh Utara. Communities outside of the
Krueng Peusangan watershed are also stakeholders as they derive benefits from the
Peusangan river, including companies in Lhokseumawe.
Forest degradation has been mainly caused by timber extraction and forest fire.
Due to the rebuilding efforts after the tsunami disaster hit Aceh province at the end of
2004, timber extraction have drastically increased. Forest fire occurs mostly during dry
season especially in easily burnt pine forest (located alongside Lake Laut Tawar).
Flooding as well as riverbank abrasion occurs during high rainfall events. Other issues
mentioned are the perceived decrease of river flow during dry seasons and a decreasing
lake volume.
In policy documents, the current situation of the Krueng Peusangan Watershed
is categorized as degraded area priority 1. The Aceh Provincial Government developed
strategic planning of integrated and sustainable watershed management of the Krueng
Peusangan watershed to prevent further watershed degradation. Aligned to the
development of the strategic planning, WWF in collaboration with the World
Agroforestry Centre (ICRAF) SEA Regional Program conducted a comprehensive
hydrology study on watershed function from the perspective of multiple stakeholders
using the Rapid Hydrological Appraisal (RHA) method (Jeanes et al., 2006)1.
The generic term of ‘watershed function’ means different things to different
stakeholders and in different situations and it may be constrained by gaps between
three types of knowledge (Figure 1). In discussions between upstream and downstream
land users, public policy, and science, the three types of 'knowledge' (local, public and
scientific) are interacting, often expressed in languages that have little in common and
using concepts that may be considered 'myths' by other stakeholder groups (Jeanes, et
al., 2006).
The objectives of the RHA are as follow:
1. To appraise the hydrological situation from the perspective of multiple stakeholders:
local ecological knowledge, public/policymakers ecological knowledge, and
hydrologist/modeler ecological knowledge,
2. To identify existing gaps between the three types of knowledge and to provide
integrated analysis to assess hydrological situation, and
3. To develop plausible future watersheds management scenarios using GenRiver 2.0
model for further exploration and development of rewards for watershed services.
1 This technical report is based on an agreement between WWF and ICRAF Southeast Asia
Regional program (ICRAF-SEA) to deliver Rapid Hydrological Appraisal of the Krueng Peusangan
Watershed, NAD, Sumatra.

2
Figure 1. Three types of knowledge deal with in understanding the hydrological situation.

3
II. METHODOLOGY
To accomplish the objective of the study, the RHA approach was implemented
through the following activities (Figure 2):
1. Survey and exploration of the two main types of stakeholder knowledge: local and
public/policy maker ecological knowledge (LEK and PEK) on water movement and
causes and consequences of land use options on the landscape from the perspective
of multiple users of the Krueng Peusangan watershed,
2. Gathering and analyzing of existing climate and hydrology data on the Krueng
Peusangan watershed,
3. Spatial data analysis of the Krueng Peusangan watershed to obtain land cover
information, land cover change information and watershed characteristic,
4. Analyses of the consequences of current land cover change on the values of water
balance including river flow in the Krueng Peusangan watershed using GenRiver 2.0
model, and
5. Analyses of plausible future land cover changes scenarios and its impacts using
GenRiver 2.0 model.
Figure 2. Rapid Hydrological Appraisal activities
2.1. Knowledge Surveys and Stakeholder Analysis
The objectives of the PEK and LEK surveys are:
1. To explore and articulate the knowledge, experience and perceptions of the major
groups of people/institutions who have direct influence upon the management of all
sub-catchments of the Krueng Peusangan watershed.
2. To explore and articulate the knowledge, experience and perceptions of the selected
local communities which have direct influence upon the management of one focus
sub-catchments.
To accomplish those objectives, the knowledge acquisition method adapted
from the knowledge based system approach (Dixon, et al., 2001) was used. LEK and PEK
survey were conducted with some modification in data collection to reduce time and
expenditure. A series of discussions with the same groups within the community were
conducted as well as few individual interviews by snow ball techniques to find the
supposedly representative and most knowledgeable persons. In the analytical stage,
4
statements from local people were extracted and presented in diagram form to show
the interrelationship between the statements.
Stakeholder analysis was conducted before a series of individual interviews and
documentation review with relevant stakeholders. This is important to provide useful
material for description of the stakeholders who are keys to watershed management
and potential rewards schemes.
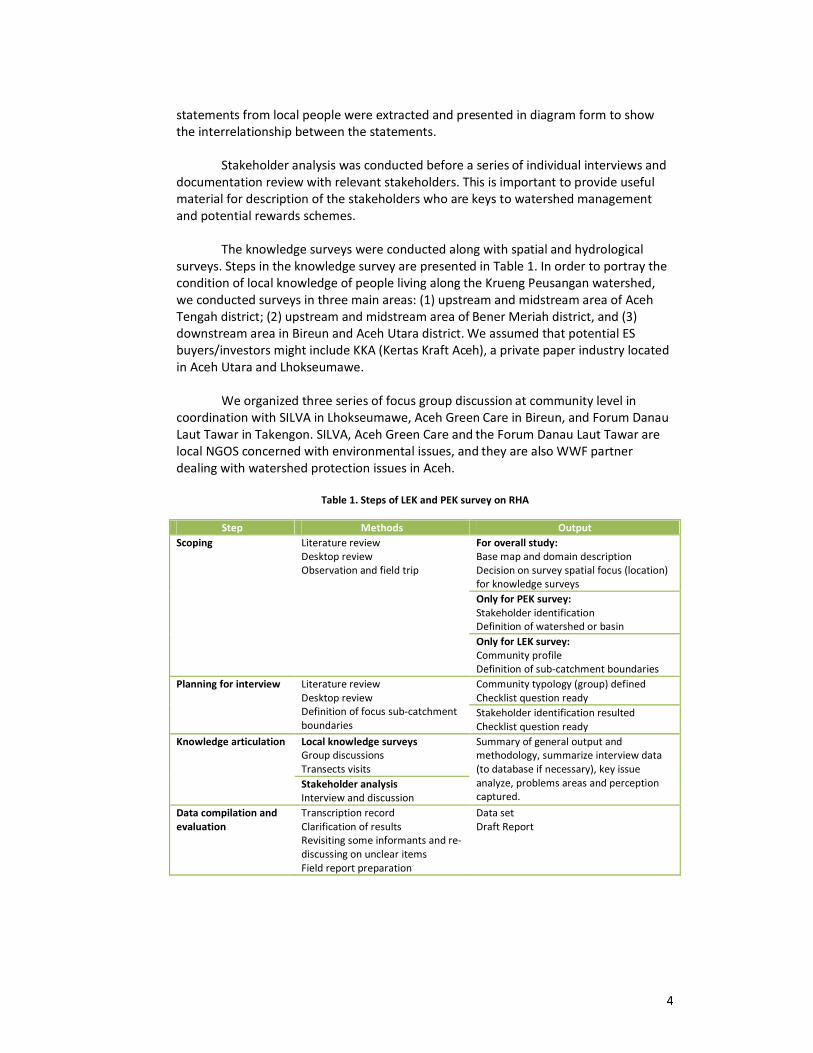
The knowledge surveys were conducted along with spatial and hydrological
surveys. Steps in the knowledge survey are presented in Table 1. In order to portray the
condition of local knowledge of people living along the Krueng Peusangan watershed,
we conducted surveys in three main areas: (1) upstream and midstream area of Aceh
Tengah district; (2) upstream and midstream area of Bener Meriah district, and (3)
downstream area in Bireun and Aceh Utara district. We assumed that potential ES
buyers/investors might include KKA (Kertas Kraft Aceh), a private paper industry located
in Aceh Utara and Lhokseumawe.
We organized three series of focus group discussion at community level in
coordination with SILVA in Lhokseumawe, Aceh Green Care in Bireun, and Forum Danau
Laut Tawar in Takengon. SILVA, Aceh Green Care and the Forum Danau Laut Tawar are
local NGOS concerned with environmental issues, and they are also WWF partner
dealing with watershed protection issues in Aceh.
Table 1. Steps of LEK and PEK survey on RHA
Step Methods Output
Scoping Literature review
Desktop review
Observation and field trip
For overall study:
Base map and domain description
Decision on survey spatial focus (location)
for knowledge surveys Only for PEK survey:
Stakeholder identification
Definition of watershed or basin Only for LEK survey:
Community profile
Definition of sub-catchment boundaries Planning for interview Literature review
Desktop review
Definition of focus sub-catchment
boundaries
Community typology (group) defined
Checklist question ready Stakeholder identification resulted
Checklist question ready Knowledge articulation Local knowledge surveys
Group discussions
Transects visits
Summary of general output and
methodology, summarize interview data
(to database if necessary), key issue
analyze, problems areas and perception
captured. Stakeholder analysis
Interview and discussion Data compilation and
evaluation Transcription record
Clarification of results
Revisiting some informants and re-
discussing on unclear items
Field report preparation
Data set
Draft Report

5
2.2. Analysis of Climate and Hydrology Data
We applied the GenRiver 2.0 to model the influence of current and future land
use change to watershed hydrological situation. The application of such model needs
minimum 20 years time-series climatic and hydrological data covering all sub-catchment.
Table 2 presented the available climatic and hydrological data of the Krueng Peusangan
watershed.
Table 2. Available data on climate and hydrology of the Krueng Peusangan watershed.
Data Source Series Coverage
area
Climate Daily rainfall Station meteorologi
Class III Lhokseumawe,
Malikussaleh Airport
1990 – 20091)
Downstream
Public Work Agency
Aceh province
2008 - 2009 Upstream
Agricultural Agency,
Takengon
2009 Upstream
Monthly rainfall Agricultural Agency,
Takengon
1993 - 2008 Upstream
Monthly rainfall www.worldclim.com Average data:
Current (1950 –
2000)
Future (>2000)1)
Krueng
Peusangan
watershed
Supporting climate
data: potential
evapotranpiration
Station meteorologi
Class III Lhokseumawe,
Malikussaleh Airport
1999 – 20091)
River flow Daily river flow of
Beukah station
PUSAIR, Bandung 1991 – 19971)
Krueng
Peusangan
watershed
Daily river flow of
Simpang Jaya station
1991 – 1997 Krueng
Peusangan
watershed
Data used for GenRiver model simulation
2.2.1 Analysis of Rainfall Data
The long-period daily rainfall data covering all sub-catchment of the Krueng
Peusangan watershed was not available (Table 2). As the solution, we generated the
data using the rainfall simulator model (van Noordwijk, in press) based on available
monthly rainfall data from Worldclim (www.worldclim.com) as an input for running
GenRiver model. The rainfall simulator model considers temporal autocorrelation of
rainfall, shape of daily rainfall, frequency distribution, seasonal pattern of wet and dry
months and annual rainfall.
The main input parameters of rainfall simulator model are:
1. Frequency distribution (number of rainy day per month); seasonal pattern of wet
and dry months; and annual mean rainfall for each year. Daily rainfall data of station
Meteorologi Class III Lhokseumawe, Malikussaleh Airport is used to generate these
input parameters.
2. Annual and monthly rainfall data. Average of annual and monthly rainfall data of
extracted from Worldclim from period 1950 – 2000 and current is used.

6
Coefficient correlation and bias analysis are used to evaluate the model
performance by comparing measured to predicted monthly and annual rainfall using
equation presented in Appendix 1.
2.2.2 Analysis of River flow Data
The river flow data is available for six years only. A series of test of consistency
of river flow data of Beukah station prior to the use of data as an input for running
GenRiver model include:
• Calculate the different of yearly total precipitation and river flow (ΣP - ΣQ), it gives
an estimate of total evapotranspiration. Values below 500 or above 1500 mm/year
are suspect. These may indicate errors in P or Q registration, error in the area or
deviation from the ‘closed catchment’ assumption (e.g. subsurface flows out of or
into the catchment are non-negligible).
• Plot ‘Double Mass’ curves of cumulative ΣQ versus ΣP during the year: large jumps
will require explanation.
• Plot flow persistence Qi+I versus Qi, it may indicate gaps in the data or ‘outliers’ that
indicate errors.
2.3. Analysis of Land Cover/Land Cover Change and Watershed
Characteristic
The way people manage their land will affect the hydrological characteristics of
a landscape. Therefore, understanding landscape composition, landscape configuration
and its dynamics over time and space is an important phase in RHA. The characteristic
of hydrological features within a watershed or catchment area can be defined by
observing several landscape components such as: land use composition, topography, soil
and geology.
On the other hand, information on land use configuration and its dynamics over
time and space provides an important proxy on the quality of the watershed. We use
spatial analysis to provide information, analyze landscape configuration and land use
dynamics in the Kreung Peusangan watershed. Our approach consist of three steps: (1)
spatial data acquisition, (2) terrain processing, and (3) analysis of land use/cover change
and trajectories (ALUCT).
2.3.1. Spatial data
Spatial analyses for RHA were conducted using several types of spatial data. In
general, three types of data are required: satellite image for land cover mapping, digital
elevation model for watershed characterization and thematic maps for analysis of
landscape configuration. Some of the data can be acquired from secondary sources, i.e.
government agency or research institution, while some had to be generated from
primary data sources.
a. Satellite image
Time series satellite images are required to produce a time series land cover
map of the Kreung Peusangan watershed. The land cover maps will provides estimation

on land use dynamics in the study area. We used 30
Earth Resource Observation and Science (EROS) Centre (
satellite image and its acquisition date is shown in Table
images are shown in Figure
Table 3. List of satellite images for
Satellite image
Landsat TM 1990 ‘s
Landsat ETM 2000’s
Landsat ETM SLC
Landsat ETM
Figure 3. Time series satellite image for
on land use dynamics in the study area. We used 30 m Landsat images acquired from
Earth Resource Observation and Science (EROS) Centre (http://eros.usgs.gov/
satellite image and its acquisition date is shown in Table 3. The time series satel
are shown in Figure 3.
. List of satellite images for the Krueng Peusangan watershed
Theme Path/Row Acquisition date
Satellite image
Landsat TM 1990 ‘s P130r056
P130r057
6 January 1990
6 January 1990
Landsat ETM 2000’s P130r056
P130r057
5 May 2000
5 May 2000
Landsat ETM SLC-off 2005’s P130r056
P130r057
7 January 2005
3 June 2006
Landsat ETM SLC-off 2009’s P130r056
P130r057
5 January 2010
24 April 2009
3. Time series satellite image for the Krueng Peusangan watershed
m Landsat images acquired from
http://eros.usgs.gov/). List of
. The time series satellite

8
b. Digital elevation model
Digital elevation model (DEM) provides information on elevation and
topographic feature of a landscape. In RHA, we use the DEM to delineate watershed and
catchment area. Shuttle Radar Topographic Mission (SRTM) data were used in this
process.
c. Thematic maps
To further understand landscape configuration of the Kreung Peusangan
watershed, datasets of thematic maps will be collected. The datasets consist of several
maps: administrative boundary, soil, geology, land designation and land use planning.
2.3.2. Terrain processing for watershed delineation
`
The main objective of terrain processing in RHA is to delineate watershed
boundary and identify stream network of the study area. SRTM digital elevation model
in 90 m spatial resolution is the primary data for this process. We conducted terrain
processing using ArcHydro
(http://www.crwr.utexas.edu/giswr/hydro/ArcHOSS/index.cfm), a Geographical
Information System (GIS) framework to model and analyze hydrological configuration
for this purpose. Two main datasets that will be derived from this phase are
watershed/catchment boundary delineation and routing distance of a stream to its
outlet. The datasets will be used in GenRiver model to further understand hydrological
process within study area. Terrain processing in ArcHydro consists of several processing
steps as showed in Figure 4.
Figure 4. Overall workflow of terrain processing for watershed and stream network delineation

2.3.3. Analysis of land use/cover change and trajectories
Analysis of land use/cover changes
to understand the land use dynamics over a landscape using
RHA application, ALUCT will produce three main outputs:
1. Time series land cover maps
2009’s.
2. Land cover change quantification of study area
3. Land cover trajectories
Two types of data are required to conduct ALUCT: (1) time series satellite image
and (2) ground truth data collected from fieldwork. Lands
resolution will be used in this phase, while ground truth data was collected during a
fieldwork in January 2010.
Before ALUCT implementation, it is required to conduct inventories and to
define classes of land use/cover in the st
they are recognizable from the satellite imageries and they embrace all the dominant
land-use/cover types that exist in the study area. A list of relevant land
developed through fieldwork in the
ALUCT workflow (Figure 5
processing, (2) Image classification
Image pre-processing, aims to rectify geometric distortion in satellite images using
ground control point (GCP) collected from
Landsat 1990 image from United Sta
data. Minimum of 20 GCP were used in geometric
precision of 0.5 pixel (<15
Figure 5. Overall work flow of analysis of land use/cover change and trajectories (ALUCT)
Analysis of land use/cover change and trajectories (ALUCT)
nalysis of land use/cover changes and trajectories (ALUCT) is a framework
to understand the land use dynamics over a landscape using remote sensing data
RHA application, ALUCT will produce three main outputs:
Time series land cover maps from covering period of 1990’s, 2000’s, 2005’s, and
Land cover change quantification of study area
Land cover trajectories for the period of analysis
Two types of data are required to conduct ALUCT: (1) time series satellite image
and (2) ground truth data collected from fieldwork. Landsat images in 30 m spatial
resolution will be used in this phase, while ground truth data was collected during a
fieldwork in January 2010.
Before ALUCT implementation, it is required to conduct inventories and to
define classes of land use/cover in the study area. The classes are designed such that
they are recognizable from the satellite imageries and they embrace all the dominant
use/cover types that exist in the study area. A list of relevant land-use classes was
work in the study area.
ALUCT workflow (Figure 5) can be classified into three stages: (1) Image pre
Image classification, and (3) Post interpretation analysis. The first stage,
aims to rectify geometric distortion in satellite images using
ground control point (GCP) collected from reference datasets. In this case, orthorectified
image from United States Geological Survey (USGS) is used as reference
20 GCP were used in geometric correction, ensuring geometric
m) for all images.
. Overall work flow of analysis of land use/cover change and trajectories (ALUCT)
is a framework used
remote sensing data. For a
005’s, and
Two types of data are required to conduct ALUCT: (1) time series satellite image
m spatial
resolution will be used in this phase, while ground truth data was collected during a
Before ALUCT implementation, it is required to conduct inventories and to
udy area. The classes are designed such that
they are recognizable from the satellite imageries and they embrace all the dominant
use classes was
Image pre-
. The first stage,
aims to rectify geometric distortion in satellite images using
reference datasets. In this case, orthorectified
is used as reference
correction, ensuring geometric
. Overall work flow of analysis of land use/cover change and trajectories (ALUCT)

10
The second stage of ALUCT is image classification. Its objective is to interpret
spectral information contained in satellite image into land use classes. Object-based
hierarchical classification approach is used in this stage. In this approach, image
classification began with an image segmentation process. The purpose is to produce
image objects, a group of pixels with a similar level of homogeneity in terms of spectral
and spatial characteristics. Image objects have to be able to represent the actual
landscape features in the satellite images. Several phases of segmentation were
conducted to get the required levels of detail. The outputs of these phases are called
multiresolution image segments, which serve as a basis for the hierarchical classification
system. The segmentation processes are illustrated in Figure 6.
Figure 6. Segmentation process
Following the segmentation process, image classification was conducted using
hierarchical structure showed in Figure 7. The hierarchy is divided into four levels, and in
each level, land cover types are interpreted using spectral and spatial rules. Details and
complexity of land cover types increasing in each level, therefore each of them has
different set of rules applied. Level 1 consists of general classes such as: Forest, Tree-
based system, Non tree based system and Non vegetation. These classes can be easily
distinguished using visual inspections and simple vegetation index. Vegetation index is a
ratio of spectral value between vegetation-sensitive channel (near infrared spectrum)
and non vegetation-sensitive channel (visible spectrum) in satellite image.
Result of Level 1 is further classified in Level 2, in this level, spectral value is not
the only parameters used, spatial characteristics such as oil palm map, field reference
and Nearest Neighborhood algorithm was used as a rule in classification. Nearest
Neighborhood algorithm in object-based hierarchical classification is conducted in two
steps: (1) Feature space optimization, and (2) Classification (Definiens, 2007). The first
step is conducted to calculate combination of object features that produces the largest
average minimum distance between the samples of the different classes.
The combination of object features is used in the second steps to classify all
objects into land cover classes in level 2. Level 2 consists of 10 land cover types:
undisturbed forest, logged over forest, pine forest, agroforest, monoculture tree based
system, shrub, cropland, grass, cleared land and settlement. Agroforest and monoculture
tree based system are classified into coffee agroforest, mixed garden, oil palm and
logged over pine in Level 3.

Image classification is followed by
of two processes, accuracy assessment
accuracy assessment is to test the quality of information derived from image
classification process. It is conducted by comparing field reference d
recent land cover map produced in each site. Minimum accuracy level should be above
80%. The last step in ALUCT is
Two form of land cover
based changes analysis and
analysis conducted by comparing total area o
analysis will conducted in 2 analysis windows: (1)
Peusangan watershed and
watershed. The result will show a clear indication of
in the study area. The last phase of ALUCT, t
spatially assess trend of land use/cover change over the period of analysis
2.4. Analyses of the Consequences of C
Change on Water Balance Including River Fl
A modeling approach is used to estimate
river flow, using GenRiver 2.0 (Generic River flow) model (van Noordwijk
GenRiver 2.0 is a simple model that translates a plot
The model can be used to explore
due to land cover/use change
Figure 7. Classification hierarchical scheme
Image classification is followed by Post classification analysis process. It consists
accuracy assessment and land cover change analysis. The objective of
is to test the quality of information derived from image
classification process. It is conducted by comparing field reference data with the most
recent land cover map produced in each site. Minimum accuracy level should be above
The last step in ALUCT is the land cover change analysis.
Two form of land cover change analysis is conducted for each study site:
and trajectories analysis. An area-based change is a simple
analysis conducted by comparing total area of land cover types in each period. This
analysis will conducted in 2 analysis windows: (1) catchment area of the Kreung
and (2) administrative area within the Kreung Peusangan
The result will show a clear indication of dominant type of land cover change
The last phase of ALUCT, trajectories analysis, is conducted
land use/cover change over the period of analysis.
the Consequences of Current and Future Land C
Change on Water Balance Including River Flow
modeling approach is used to estimate the landscape water balance including
GenRiver 2.0 (Generic River flow) model (van Noordwijk et al
simple model that translates a plot-level water balance to landscape
an be used to explore the understanding of historical changes in river flow
/use change.
process. It consists
The objective of
is to test the quality of information derived from image
ata with the most
recent land cover map produced in each site. Minimum accuracy level should be above
conducted for each study site: area-
a simple
period. This
Kreung
Kreung Peusangan
land cover change
is conducted to
and Future Land Cover
the landscape water balance including
et al., 2010).
to landscape.
in river flow

12
As is common in hydrology, the accounting of rainfall or precipitation (P) in the
landscape include evapotranspiration, E; river discharge, Q (summed over base flow, soil
quick flow and surface flow); and changes in soil and groundwater storage, ΔS (Figure 8).
P = Q + E + ∆S
The core of the GenRiver 2.0 model is a ‘patch’ level representation of a daily
water balance, driven by local rainfall and modified by the land cover and land cover
change and soil properties of the patch. The patch can contribute to three types of
stream flow: surface-quick flow on the day of the rainfall event, soil-quick flow on the
next day and base flow, via the gradual release of groundwater.
A river is treated as a summation of streams, each originating in a sub-
catchment with its own daily rainfall, yearly land cover fractions and constant total area
and distance to the river outflow (or measurement) point. Interactions between
streams in their contribution to the river are considered to be negligible (i.e. there is no
‘backflow’ problem). Spatial patterns in daily rainfall events are translated into average
daily rainfall in each sub-catchment. The sub-catchment model represents interception,
infiltration into soil, rapid percolation into subsoil, surface flow of water and rapid
lateral subsurface flow into streams with parameters that can vary between land cover
classes (Figure 8).
The modeling activity was carried out using the following steps:
1. Data preparation and model parameterization;
2. Model calibration including evaluation on model performance;
3. Assessment of hydrological situation of watershed;
4. Scenario development based on result analysis of LEK and PEK (section 2.1)
5. Model simulation based on scenarios developed in point 4 to understand the impact
of land use change on water balance and river flow.
Figure 8. Overview of GenRiver 2.0 model

13
2.4.1. Model parameterization
The data preparation for model parameterization including, analysis of climate
(rainfall and evapotranspiration) and hydrology (discharge) data (Section 2.2); and
processing spatial data: soil, land cover dynamic and watershed characteristic data
(Section 2.3) (Table 4).
Table 4. Input data for GenRiver 2.0 model
Data Source GenRiver Parameterization
1. Climate
data
Daily rainfall for 20 years (1990 -
2009)
Climatology station
and worldlim
Input data
Supporting data (monthly averaged
evapotranspiration) for 10 years
(2000 - 2009)
Input data
2. Discharge
data
Daily discharge data for 7 years
(1991 - 1997)
River station Model calibration
3. Spatial
data
Soil depth and type for 11 sub-
catchment
Existing soil maps - Input data
- Generating others input data
Land cover map at year 1990, 2000,
2005 and 2009
Image interpretation Input data
Land cover dynamic at the time
series
Image interpretation Input data
Catchment and 11 sub-catchment
boundary
DEM Input data
Distance to outlet (routing distance)
for 11 sub-catchment
Input data
4. Supporting
data
Lake volume Local exploration Storage volume, inflow and
outflow
Prior to the use of rainfall and discharge data as an input and validation model,
daily rainfall data that cover the Krueng Peusangan watershed was generated using
rainfall simulator model (Table 19) and a series of fine-tuning data of discharge need to
be done in order to get a good quality data (Figure 16 and 17). Monthly average of
potential evapotranspiration was calculated based on 2000 – 2009 available data (Figure
11). Daily pattern of potential evapotranspiration of each land cover type was
calculated by multiplying this monthly value to multiplier of each land cover type (Table
5).
Table 5. Multiplier of daily potential evapotranspiration for each land cover type
Land cover type Multiplier of Daily Potential Evapotranspiration
Jan Feb Mar Apr May Jun Jul Aug Sep Oct Nov Dec
Forest 0.80 0.80 0.80 0.80 0.80 0.80 0.80 0.80 0.80 0.80 0.80 0.80
Logged over forest 0.50 0.50 0.50 0.50 0.50 0.50 0.50 0.50 0.50 0.50 0.50 0.50
Pine forest 1.00 1.00 1.00 1.00 1.00 1.00 1.00 1.00 1.00 1.00 1.00 1.00
Logged over pine forest 0.80 0.80 0.80 0.80 0.80 0.80 0.80 0.80 0.80 0.80 0.80 0.80
Oil palm 0.50 0.50 0.50 0.50 0.50 0.50 0.50 0.50 0.50 0.50 0.50 0.50
Complex mixed tree crop 0.70 0.70 0.70 0.70 0.70 0.70 0.70 0.70 0.70 0.70 0.70 0.70
Monoculture tree 0.50 0.50 0.50 0.50 0.50 0.50 0.50 0.50 0.50 0.50 0.50 0.50
Horticulture 1.00 1.00 1.00 1.00 1.00 1.00 0.70 0.30 0.50 0.50 0.50 0.80
Rice field 1.00 1.00 1.00 1.00 1.00 1.00 1.00 1.00 1.00 1.00 1.00 1.00
Shrub and grass 0.60 0.60 0.60 0.60 0.60 0.60 0.60 0.60 0.60 0.60 0.60 0.60
Settlement 0.00 0.00 0.00 0.00 0.00 0.00 0.00 0.00 0.00 0.00 0.00 0.00

14
Ultisols and Inceptisols are major soil type in all sub-catchment (Table 6) with
low infiltration rate compared to other soil types. It is more than 80% of the total area.
The average of soil BD/BDref is range 0.8 (forest) – 1.3 (settlement) (Table 8).
Table 6. Soil type, area and distance to outlet for each sub-catchment
Sub-catchment Area
(km2)
Distance
to final
outlet
(km)
Alfisols Entisols Inceptisols Mollisols Ultisols
Down-
stream
LC1 135.79 91.71 0.00 0.00 9.34 0.00 90.66
LC2 305.44 63.68 0.00 0.00 42.38 0.00 57.62
LC3 185.71 73.96 0.00 0.00 63.07 0.00 36.93
LC4 67.22 23.77 0.00 0.09 66.06 0.00 33.85
Middle
stream
MC1 362.17 108.02 0.00 0.00 58.56 2.68 38.76
MC2 324.68 101.80 0.00 0.00 15.09 14.05 70.86
Upstream UC1 upper-part 197.79 153.24 0.20 0.00 34.05 51.10 14.65
UC1 lower-part 192.43 126.81 0.20 0.00 34.05 51.10 14.65
UC2 239.28 130.71 0.00 0.00 34.30 9.02 56.68
UC3 137.46 119.93 0.00 0.00 63.87 0.00 36.13
UC4 120.42 111.00 0.00 0.00 42.00 1.29 56.71
The model run in 11 land cover types, therefore re-classification of land cover
type of image analysis should be done prior to the use of data (Table 7). The re-
classification is based on its potential interception and rank of soil bulk density (Table 8).
For the last 20 years, forest type of cover 40 % declined with mainly being converted
into tree-based systems (Table 9).
Table 7. Land cover re-classification
No. Land cover type of image analysis Land cover type of GenRiver model
1. Undisturbed forest Forest
2. Logged over forest Logged over forest
3. Pine forest Pine forest
4. Logged over pine forest Logged over pine forest
5. Oil palm Oil palm
6. Mixed garden
Complex mixed tree crop 7. Coconut agroforest
8. Coffee agroforest
9. Areca catechu (pinang) monoculture
Monoculture tree 10. Rubber monoculture
11. Metroxylon sago (sagu) monoculture
12. Cropland Horticulture
13. Rice field Rice field
14. Shrub
Shrub and grass 15. Grassland
16. Cleared land
17. Settlement Settlement
Based on result of delineation of watershed and catchment area using DEM, the
Krueng Peusangan watershed consists of 11 sub-watersheds (Figure 18). Table 6
presented the area of each sub-watershed and its distance to outlet. The lake air tawar
occupied the upper part of the upstream area.

15
A number of non-measured parameters were used during model calibration
process. The parameters include potential canopy interception, relative drought
threshold per land cover type (Table 8) and a number of the catchment response
parameters such as rainfall intensity and maximum infiltration rate (Table 10).
Table 8. Input parameter BD/BDref, potential interception and relative drought Threshold
Land cover type Potential Interception (mm day-1
) Relative Drought Threshold BD/BDref
Forest 4.00 0.40 0.80
Logged over forest 3.00 0.50 1.08
Pine forest 5.00 0.40 1.15
Logged over pine forest 3.50 0.40 1.10
Oil palm 5.00 0.55 1.08
Complex mixed tree crop 3.00 0.60 1.00
Monoculture tree 4.00 0.55 1.08
Horticulture 3.00 0.70 1.10
Rice field 4.00 0.90 1.20
Shrub and grass 2.00 0.55 1.00
Settlement 0.05 0.01 1.30
Table 9. Presentation of land cover change
Land cover class Land cover change (all sub catchment)
1990 2000 2005 2009
Forest 39.66 26.06 23.55 22.21
Logged over forest 12.54 15.19 14.85 14.89
Pine forest 0.29 1.23 0.40 0.18
Logged over pine forest 1.87 1.41 1.18 1.62
Oil palm 0.00 0.00 1.05 2.98
Complex mixed tree crop 27.82 36.51 44.83 43.72
Monoculture tree 1.52 1.57 2.42 3.00
Horticulture 9.27 3.62 3.42 3.55
Rice field 3.05 3.70 2.13 2.57
Shrub and grass 3.93 10.63 5.97 4.76
Settlement 0.04 0.08 0.19 0.52
Total 100 100 100 100
Table 10. A number of non measured parameters
Acronym* Default Value Unit
RainInterceptDripRt (i) 10 30 mm
RainMaxIntDripDur (i) 0.5 0.7 mm
InterceptEffectontrans(i) 0.8 0.4 mm
RainIntensMean 30 30 mm day-1
RainIntensCoefVar 0.3 0.35 -
MaxInfRate (i) 720 400 mm day-1
MaxInfSubsoil (i) 120 100 mm day-1
PerFracMultiplier (i) 0.1 0.5 -
MaxDynGrWatStore (i) 300 300 mm
GWReleaseFracVar (i) 0.1 0.03 -
Tortuosity (i) 0.5 0.6 -
Dispersal Factor (i) 0.5 0.6 -
River Velocity (i) 0.4 0.7 m s-1
Initial Lake Volum 2,650,000,000 m3
* More detail definition of each parameter is list in Appendix 1 of GenRiver model manual

16
2.4.2. Model calibration and evaluation on model performance
Statistical indicators proposed by Nash and Sutcliffe (1970) (Appendix 2),
coefficient correlation (Appendix 1) and double mass cumulative rainfall - river flow
curve are used for checking the performance of the model. Model performance was
evaluated by comparing measured to simulated discharge.
2.4.3. Assessment of hydrological situation of watershed
The assessment of hydrological situation of watershed is determined by the
criteria and indicators of water transmission (total water yield per unit rainfall),
buffering capacity (relationship of peak river flow and peak rainfall, linked to flooding
risk) and gradual release of (ground) water in the dry season, based on recharge in the
rainy season (Appendix 3). These indicators all relate the flows of water to the preceding
rainfall and by doing so; allow the analysis of the relatively small land use effects,
superimposed on substantial year-to-year variation in rainfall.
2.4.4. Model simulation based on scenarios
Once the model produces satisfactory output, we explored five scenarios for 10
years period of simulation (Table 11). The scenarios was resulted based on (1) the
observations made during the LEK and PEK survey; (2) local community and stakeholder
perception on the causal factor of hydrological problems; and (2) spatial data analysis
and GenRiver model calibration and validation that proved the decreasing of tree cover
increases the total water yield as a fraction of total rainfall. The scenarios focus on
increasing tree based system in the landscape. The proportion of land use change for
each scenario was presented in Table 12.
Table 11. Scenarios to understand the impact of land use change
Scenarios Description
BAU Deforestation about 4% of total area
1 Grassland, cleared land, shrub, cropland and rice field in all sub-catchments
were converted to complex mixed tree crop.
2 Logged over forest in all sub-catchments were converted to pine forest.
3 Scenario 1 + 2
4 Cropland, rice field and monoculture tree (Areca catechu/betel nut and
Metroxylon sago/sagoo) in all sub-catchments were converted to complex
mixed tree crop.
Grassland, cleared land, shrub, logged over pine forest and logged over forest in
all sub-catchments were converted to forest.
5 Full natural forest cover in all sub catchments except for settlements (historical
reference, potential endpoint of best practice forest restoration)

17
Table 12. Percentage of land cover change for each scenario
Land cover class Land cover change (all sub catchment)*
2009 BAU 1 2 3 4 5
Forest 22.21 18.16 22.21 22.21 22.21 43.48 99.48
Logged over forest 14.89 18.94 14.89 0.00 0.00 0.00 0.00
Pine forest 0.18 0.18 0.18 15.07 15.07 0.18 0.00
Logged over pine forest 1.62 1.62 1.62 1.62 1.62 0.00 0.00
OilPalm 2.98 2.98 2.98 2.98 2.98 2.98 0.00
Complex mixed tree crop 43.72 43.72 54.60 43.72 54.60 51.13 0.00
Monoculture tree 3.00 3.00 3.00 3.00 3.00 1.71 0.00
Horticulture 3.55 3.55 0.00 3.55 0.00 0.00 0.00
Rice field 2.57 2.57 0.00 2.57 0.00 0.00 0.00
Shrub and grass 4.76 4.76 0.00 4.76 0.00 0.00 0.00
Settlement 0.52 0.52 0.52 0.52 0.52 0.52 0.52
Total 100 100 100 100 100 100 100
* red font: the area is decrease, blue font: the area is increase and black font: the area is remain the same
compare to the 2009.

18
III. RESULT
3.1. The Study Site
3.1.1. The Area
Geographically, the Krueng Peusangan watershed is situated between latitude
5.27839 – 4.51068 and longitude 96.4509 - 97.0476. The total area of the Krueng
Peusangan watershed is about 2268.4 km2 covering four districts: upstream area in Aceh
Tengah district, middle stream area in Bener Meriah district, and downstream area in
Bireun and Aceh Utara district (Figure 9). It is consist of 11 sub-watersheds and Lake Laut
Tawar (5887 m2) occupied the upper part of the watershed.
Figure 9. Study area of the Krueng Peusangan watershed
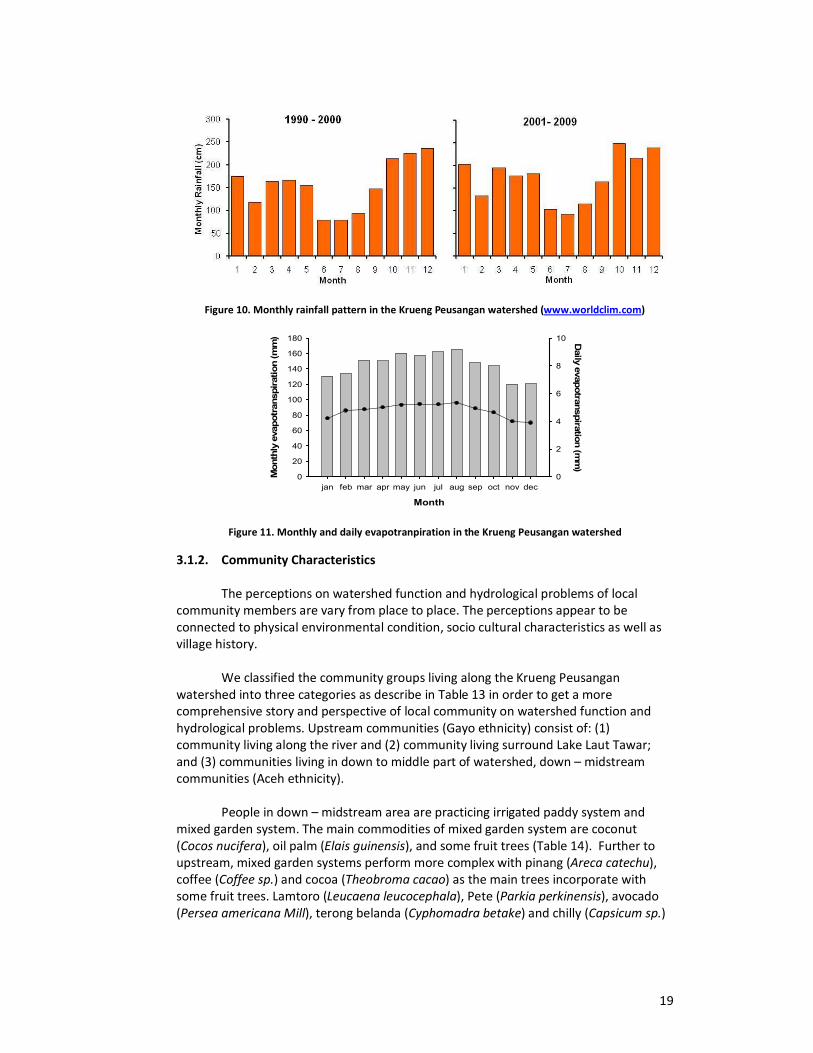
Based on rainfall data from www.worldclim.com for the period 1950 – present,
the annual rainfall in the Krueng Peusangan watershed varies between 1848 – 2055 mm
year-1
(Figure 10). Rainfall is distributed with a peak season in October - January and a
dry season in June – August. The monthly average of potential evapotranspiration
presented in Figure 11 with has a total amount of 1743 mm year-1
.
The soil types in the Krueng Peusangan watershed are Alfisols, Entisols,
Inseptisols, Ultisols, and Mollisols. Ultisols and Inceptisols are the two major soil types in
all sub catchment.
19
Figure 10. Monthly rainfall pattern in the Krueng Peusangan watershed (www.worldclim.com)
Figure 11. Monthly and daily evapotranpiration in the Krueng Peusangan watershed
3.1.2. Community Characteristics
The perceptions on watershed function and hydrological problems of local
community members are vary from place to place. The perceptions appear to be
connected to physical environmental condition, socio cultural characteristics as well as
village history.
We classified the community groups living along the Krueng Peusangan
watershed into three categories as describe in Table 13 in order to get a more
comprehensive story and perspective of local community on watershed function and
hydrological problems. Upstream communities (Gayo ethnicity) consist of: (1)
community living along the river and (2) community living surround Lake Laut Tawar;
and (3) communities living in down to middle part of watershed, down – midstream
communities (Aceh ethnicity).
People in down – midstream area are practicing irrigated paddy system and
mixed garden system. The main commodities of mixed garden system are coconut
(Cocos nucifera), oil palm (Elais guinensis), and some fruit trees (Table 14). Further to
upstream, mixed garden systems perform more complex with pinang (Areca catechu),
coffee (Coffee sp.) and cocoa (Theobroma cacao) as the main trees incorporate with
some fruit trees. Lamtoro (Leucaena leucocephala), Pete (Parkia perkinensis), avocado
(Persea americana Mill), terong belanda (Cyphomadra betake) and chilly (Capsicum sp.)
Month
jan feb mar apr may jun jul aug sep oct nov dec
Monthly evapotranspiration (mm)
0
20
40
60
80
100
120
140
160
180 Daily evapotranspiration (mm)
0
2
4
6
8
10

20
are the main valuable trees and crops incorporate within coffee system in surrounding
Lake Laut Tawar.
Irrigated paddy systems planted twice a year are very important for both
subsistence and commercial purposes in all sub-catchment. In some downstream area,
particularly nearby the ‘kuala’ or estuaria, instead of paddy systems there are ‘tambak’
or fishpond system with main products are udang windu (Penaeus monodon), bandeng
(Chanos chanos Forskal) and Nila (Oreochromis sp.).
Table 13. Community characteristics
Down – midstream Upstream along the river
Upstream surrounding
lake
Area
Kota Lhokseumawe,
Kabupaten Bireun,
Kabupaten Aceh Utara
Kabupaten Bener Meriah
Kabupaten Aceh Tengah
Related
watershed
Krueng Peusangan
Krueng Mane
Krueng Peusangan, Krueng
Jambo Aye, Krueng Pase,
Krueng Mane dan Krueng
Keureutoe
Krueng Peusangan
Community
characteristics
Fishing and farming
community
Farming – mixed garden community
Livelihood
source
- Paddy production
(twice per year)
- Coconut production
- Fishing (subsistence
need from the river, on
the sea for commercial
purpose)
- Paddy production
(twice per year)
- Pinang
- Coffee and cocoa
production
- Paddy and other
crop production
(twice per year)
- Arabica coffee
production
Land use - Mixed garden: coconut,
oil palm and fruit trees
- Irrigated paddy system
- Home and mixed
garden: Pinang
- Coffee agroforest
- Cocoa agroforest
- Irrigated paddy
system
- Coffee agroforest
(with lamtoro,
avocado, pete)
- Irrigated paddy
system
Riparian
vegetation
Bamboo, Grass, Waru
(Hibiscus tiliaceus L), Jaloh
(Salix tetrasperma Roxb)
Grass, Waru Paddy, coffee and
tobacco (Nicotiana
tabacum)
Ethnic Aceh Gayo Gayo
Water source Ground and surface water
Table 14. Riparian land use area in down to midstream

21
Floating net culture is important livelihood source for communities living in the
mid – upstream of the Krueng Peusangan watershed as well as in Lake Laut Tawar area
(Table 15). Nearly 40% of people living in those areas are relying on fishery sectors in the
river as well as attached in lake area.
Kawan (Poropuntius tawarensis), peres (Osteochilus kahayensis), mud (Clarias
batrachus), pedih (Neolissochilus sp), gegaring (Tor sp) and depik (Rasbora tawarensis)
are some native species commonly found in Lake Laut Tawar. Depik is considered as
critical endangered species with populations decreasing in recent years. In 1996, the
IUCN assessed this species as “vulnerable” in red list category. Lele dumbo (Clarias
gariepinus), ikan mas (Cyprinus carpio), mujair (Oreochromis mossambicus), nila (O.
niloticus) and grass carp (Ctenopharyngodon idella) (Muchlisin, 2008) are the
introduction species that were cultivated using floating net culture and pen culture
(kolam tancap).
Table 15. Land use in surrounding Lake Laut Tawar
3.2. Knowledge Surveys and Stakeholder Analysis
3.2.1. Knowledge and perspective of local community on hydrological problems
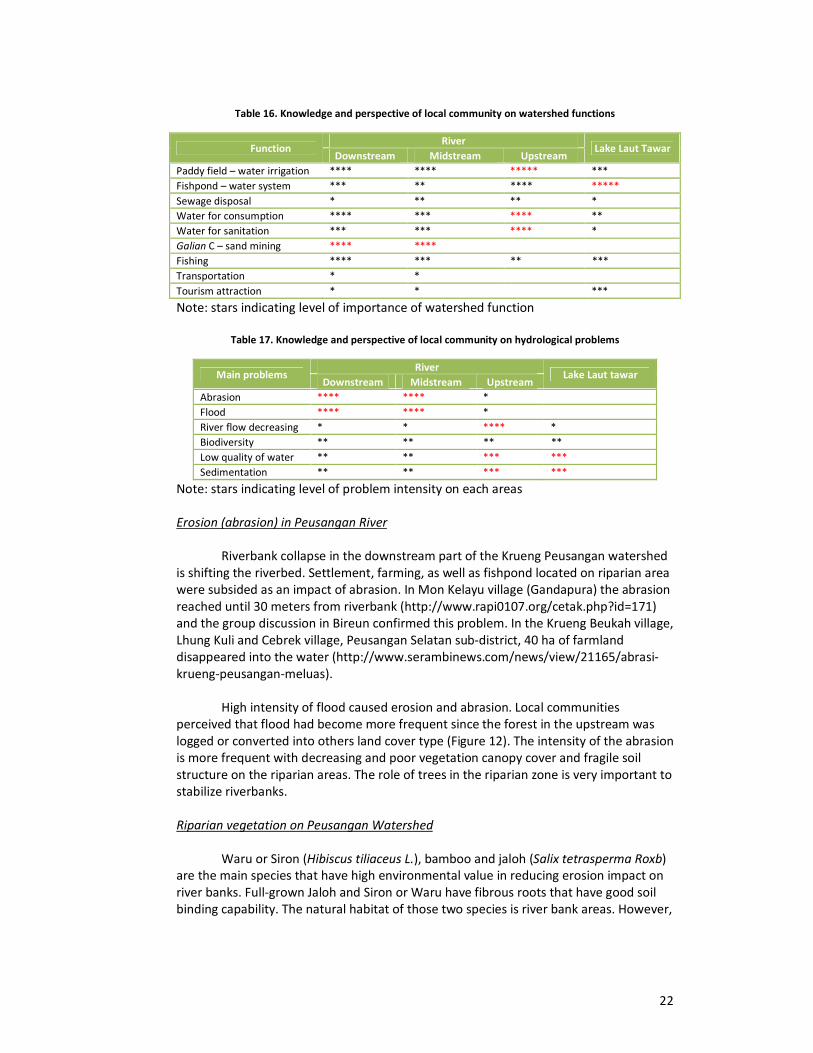
Knowledge surveys resulted on the importance of watershed functions and
hydrology problems for different community groups. Both downstream and upstream
communities considered that the river is an important not only as a source of water for
drinking and cooking, to irrigate their paddy fields, but also as a source of livelihood (fish
production) (Table 16). The local communities living surrounding the Lake Laut Tawar
mostly use the lake to cultivate fish (floating culture as well as fishpond) and a limited
extent to irrigate their paddy field.
Group discussion identified some hydrological problems faced by the
community and possible solution based on local perception and knowledge. Problems in
down to midstream areas are abrasion and floods (Table 17). Communities in upstream
found that decreasing river flow and sedimentation are important hydrological issues to
be solved. People surrounding Lake Laut Tawar observed that sedimentation was the
main problem.
22
Table 16. Knowledge and perspective of local community on watershed functions
Function River
Lake Laut Tawar Downstream Midstream Upstream
Paddy field – water irrigation **** **** ***** ***
Fishpond – water system *** ** **** *****
Sewage disposal * ** ** *
Water for consumption **** *** **** **
Water for sanitation *** *** **** *
Galian C – sand mining **** ****
Fishing **** *** ** ***
Transportation * *
Tourism attraction * * ***
Note: stars indicating level of importance of watershed function
Table 17. Knowledge and perspective of local community on hydrological problems
Main problems River
Lake Laut tawar Downstream Midstream Upstream
Abrasion **** **** *
Flood **** **** *
River flow decreasing * * **** *
Biodiversity ** ** ** **
Low quality of water ** ** *** ***
Sedimentation ** ** *** ***
Note: stars indicating level of problem intensity on each areas
Erosion (abrasion) in Peusangan River
Riverbank collapse in the downstream part of the Krueng Peusangan watershed
is shifting the riverbed. Settlement, farming, as well as fishpond located on riparian area
were subsided as an impact of abrasion. In Mon Kelayu village (Gandapura) the abrasion
reached until 30 meters from riverbank (http://www.rapi0107.org/cetak.php?id=171)
and the group discussion in Bireun confirmed this problem. In the Krueng Beukah village,
Lhung Kuli and Cebrek village, Peusangan Selatan sub-district, 40 ha of farmland
disappeared into the water (http://www.serambinews.com/news/view/21165/abrasi-
krueng-peusangan-meluas).
High intensity of flood caused erosion and abrasion. Local communities
perceived that flood had become more frequent since the forest in the upstream was
logged or converted into others land cover type (Figure 12). The intensity of the abrasion
is more frequent with decreasing and poor vegetation canopy cover and fragile soil
structure on the riparian areas. The role of trees in the riparian zone is very important to
stabilize riverbanks.
Riparian vegetation on Peusangan Watershed
Waru or Siron (Hibiscus tiliaceus L.), bamboo and jaloh (Salix tetrasperma Roxb)
are the main species that have high environmental value in reducing erosion impact on
river banks. Full-grown Jaloh and Siron or Waru have fibrous roots that have good soil
binding capability. The natural habitat of those two species is river bank areas. However,

23
during high intensity of flood or flow of river, in the area with young waru or siron the
role of ‘bronjong’ is also very important to protect the riverbank collapse.
Figure 12. Local community perspectives on the cause and impact of abrasion
River flow decreasing along the Peusangan river and siltation in Lake Laut Tawar
The forest in the upstream area that degraded into logged-over forest or was
converted into other land cover types not only have an effect on erosion and abrasion,
but also decreasing the quantity of river flow during the dry season and siltation into
Lake Laut Tawar. Local fisheries both using floating or pen culture, and fishing
communities are significantly affected (Figure 13).
Figure 13. Local community perspectives on the cause and impact of decreasing of river flow,
sedimentation and water quality

3.2.2. Knowledge of related stakeholder on hydrological problems
In this study, public perceptions were gathered mainly from district
provincial government staffs. Their
on some interviews and discussion with relevant stakeholder
documentation analysis. Some interviews with Agricultural and Forestry agency were
undertaken in upstream area (Aceh Te
Proceeding of Workshop on collaborative and sustainability management of
Peusangan watershed in Takengon on March 25, 2008 were also used as a basis of
stakeholder perception analysis.
Interview with stakeholders in down to mid
Krueng Peusangan watershed play
(irrigation), clean water provider,
living in surrounding Peusa
similar to local perception, abrasion, erosion, flooding, and sedimentation.
Forest clearing and small or large scale
causing the problems (Figure 14
forestry agency were wild forage systems of cow that
Aceh Utara, Aceh Tengah
Tengah, Aceh Utara, and Bener Meriah
structures and easily eroded.
Figure 14. Stakeholder perspectives on main hydrological problems and the
mid
In Lake Laut Tawar, sedimentation bec
of stakeholder (Figure 15) as well as local community. Sedimentation is the repository
for materials carried into the lake by erosion, and is subsequently transported by the
action of water. The quantity of sediment in
measured, but the phenomenon of se
from the changes of lake surface, turbidity, suspend solid, mud content, and depth of
lake.
Knowledge of related stakeholder on hydrological problems
In this study, public perceptions were gathered mainly from district and
government staffs. Their perception of hydrological issues was analyzed based
some interviews and discussion with relevant stakeholder, literature review and
Some interviews with Agricultural and Forestry agency were
undertaken in upstream area (Aceh Tengah), and Forest agency in provincial level.
Proceeding of Workshop on collaborative and sustainability management of the Krueng
atershed in Takengon on March 25, 2008 were also used as a basis of
stakeholder perception analysis.
stakeholders in down to midstream clearly indicated that
atershed played very important role on economic, farming
igation), clean water provider, and also provided ecological function for community
living in surrounding Peusangan River. Most of recognizing hydrological problems
local perception, abrasion, erosion, flooding, and sedimentation.
Forest clearing and small or large scales mining activities were the main factor
causing the problems (Figure 14). Other important issues that had mentioned by
wild forage systems of cow that were common in Pidie, Bireun,
(Takengon), and buffalo that were common in Pidie, Aceh
Bener Meriah (Bandar). Wild foraging caused the loose of
easily eroded.
Stakeholder perspectives on main hydrological problems and the causal factors on down
midstream of the Krueng Peusangan watershed
Laut Tawar, sedimentation became the main issues as perceived by most
) as well as local community. Sedimentation is the repository
for materials carried into the lake by erosion, and is subsequently transported by the
action of water. The quantity of sediment in the Lake Laut Tawar has yet to be
measured, but the phenomenon of sedimentation in the Lake Laut Tawar can be seen
from the changes of lake surface, turbidity, suspend solid, mud content, and depth of
and
analyzed based
literature review and
Some interviews with Agricultural and Forestry agency were
level.
the Krueng
atershed in Takengon on March 25, 2008 were also used as a basis of
that the
very important role on economic, farming
ecological function for community
ngan River. Most of recognizing hydrological problems was
the main factors
d mentioned by
common in Pidie, Bireun,
common in Pidie, Aceh
the loose of soil
causal factors on down –
the main issues as perceived by most
) as well as local community. Sedimentation is the repository
for materials carried into the lake by erosion, and is subsequently transported by the
Laut Tawar has yet to be
Laut Tawar can be seen
from the changes of lake surface, turbidity, suspend solid, mud content, and depth of

Low qualities of Lake
debate across stakeholder who concern
as the cause of water quality decre
without proper treatment;
aquaculture with high protein content (commercial pellets) and poison as other
pollutant.
Figure 15. Stakeholder perspectives on the hydrological problems and cause of
upstream of
3.3. Analysis of Climate and Hydrology Data
3.3.1. Analysis of Rainfall Data
Daily rainfall data that cover
based on monthly average data (
Meteorology Class III Lhoks
resulted very good predicted data (Tabl
3.3.2. Analysis of Rainfall
Three forms of river flow analysis by calculating total evapotrans
plotting cumulative Q versus
versus Qi gives consistence result
data result a good quality of rainfall
evapotranspiration and coefficient correlation
and 0.5, respectively (Table 1
indicate extreme slope changing in the plot and the graph of flow persistence Q
Qi confirmed the fact (Figure 1
Lake Laut Tawar water also became the main issues largely
debate across stakeholder who concern on the Lake Laut Tawar. Some factors
quality decreasing are household, hotels and resorts waste
without proper treatment; chemical and fertilizer used by agricultural activities;
aquaculture with high protein content (commercial pellets) and poison as other
Stakeholder perspectives on the hydrological problems and cause of Lake Laut Tawar and
upstream of the Krueng Peusangan watershed
Climate and Hydrology Data
Rainfall Data
Daily rainfall data that cover the Krueng Peusangan watershed was generated
based on monthly average data (www.worldclim.com) and daily rainfall data of
Class III Lhokseumawe, Malikussaleh Airport using rainfall simulator model
y good predicted data (Table 20).
Analysis of Rainfall – River Flow
forms of river flow analysis by calculating total evapotranspiration
plotting cumulative Q versus cumulative P during the year, plotting flow persistence Q
gives consistence result (Table 18, Figure 16 and 17). A series of fine
data result a good quality of rainfall – river flow data except for year 1996/1997.
and coefficient correlation of year 1996/1997 was below 500 mm
(Table 18). The graph of cumulative rainfall – river flow curve that
indicate extreme slope changing in the plot and the graph of flow persistence Q
confirmed the fact (Figure 16 and 17).
the main issues largely
Laut Tawar. Some factors identified
waste
cultural activities;
aquaculture with high protein content (commercial pellets) and poison as other
Laut Tawar and
generated
) and daily rainfall data of station
using rainfall simulator model
piration,
plotting flow persistence Qi+I
A series of fine-tuning
river flow data except for year 1996/1997. Total
of year 1996/1997 was below 500 mm
ow curve that
indicate extreme slope changing in the plot and the graph of flow persistence Qi+I versus

26
Table 18. Rainfall – River flow data analysis, ∑P-∑Q
Tahun Rainfall (P), mm Discharge (Q), mm ∑P-∑Q
1991/1992 2289 1358 931
1992/1993 1458 720 737
1993/1994 1459 689 770
1994/1995 2251 1343 908
1995/1996 1568 783 784
1996/1997 1121 642 478
Note: Rainfall data is predicted rainfall
Figure 16. Double mass cumulative rainfall – river flow curve.
1991/1992
0 500 1000 1500 2000 2500
Cum. Discharge (mm)
0
300
600
900
1200
15001992/1993
0 500 1000 1500 2000
0
200
400
600
800
10001993/1994
0 500 1000 1500 2000
0
200
400
600
800
1000
1994/1995
Cum. Rainfall (mm)
0 500 1000 1500 2000 2500
Cum. Discharge (mm)
0
300
600
900
1200
15001995/1996
Cum. Rainfall (mm)
0 500 1000 1500 2000
0
200
400
600
800
10001996/1997
Cum. Rainfall (mm)
0 300 600 900 1200 1500
0
200
400
600
800
1000

27
Table 19. Generated monthly rainfall data (1991 - 2009) using rainfall simulator
Year Month
Coefficient Correlation Bias (%) 1 2 3 4 5 6 7 8 9 10 11 12
1991 164.0 0.0 144.9 176.4 306.0 41.2 91.1 62.6 116.6 247.4 375.6 312.3 0.84 Satisfactory 10.26 Good
1992 202.8 58.5 50.5 213.1 368.1 119.6 79.6 115.4 146.3 81.7 351.2 171.0 0.41 Unsatisfactory 5.91 Very Good
1993 133.0 41.7 188.6 107.4 114.3 54.6 48.0 29.2 137.0 157.8 199.3 169.1 0.88 Satisfactory 25.34 Unsatisfactory
1994 168.6 230.1 124.7 78.3 90.7 62.4 29.4 11.5 137.1 277.5 201.6 127.7 0.62 Satisfactory 16.70 Satisfactory
1995 217.1 244.5 282.3 272.1 285.0 63.0 75.6 77.4 127.4 215.7 208.3 271.6 0.69 Satisfactory 26.59 Unsatisfactory
1996 86.5 80.2 2.3 242.1 54.3 165.2 70.1 81.1 90.3 207.3 152.8 84.9 0.21 Unsatisfactory 28.75 Unsatisfactory
1997 53.6 58.2 106.4 75.4 105.6 64.1 14.1 71.7 126.8 265.1 326.7 161.8 0.77 Satisfactory 22.67 Satisfactory
1998 157.9 266.9 170.2 206.7 105.5 149.7 89.5 60.4 112.3 331.5 276.7 290.4 0.72 Satisfactory 19.98 Satisfactory
1999 199.6 164.6 125.6 110.7 177.5 58.7 54.0 59.8 189.2 295.6 173.6 236.4 0.82 Satisfactory 0.17 Very Good
2000 398.4 69.6 169.8 180.8 93.9 67.4 119.1 79.0 115.2 351.1 228.9 324.1 0.77 Satisfactory 18.88 Satisfactory
WorldClim 174.8 117.4 164.0 166.1 154.6 79.3 78.9 92.7 147.1 213.1 225.1 235.1
2001 239.6 169.1 177.3 169.2 193.5 69.1 22.3 99.5 86.6 351.7 216.0 241.3 0.90 Satisfactory 1.00 Very Good
2002 332.5 85.0 156.8 21.2 42.5 41.4 77.5 20.3 48.7 429.3 313.6 266.7 0.78 Satisfactory 10.72 Good
2003 296.5 116.1 181.5 98.7 114.9 92.3 80.2 63.1 205.0 288.9 225.1 274.5 0.85 Satisfactory 0.92 Very Good
2004 150.6 128.6 126.4 142.3 184.6 105.5 54.6 84.6 109.3 155.0 228.0 253.9 0.80 Satisfactory 16.17 Satisfactory
2005 215.2 166.8 264.1 255.8 73.6 67.2 58.5 131.0 173.1 192.2 198.7 265.6 0.71 Satisfactory 0.29 Very Good
2006 242.7 134.1 217.3 147.5 140.5 126.2 86.6 84.0 88.1 173.8 181.1 219.5 0.76 Satisfactory 10.44 Good
2007 190.0 142.4 95.4 134.0 85.0 132.0 58.6 127.4 117.3 363.2 244.1 347.3 0.76 Satisfactory 0.93 Very Good
2008 128.7 188.7 273.4 226.3 179.4 91.1 67.1 205.0 208.5 366.5 229.9 202.1 0.70 Satisfactory 15.11 Satisfactory
2009 234.5 120.4 355.4 76.0 201.6 32.7 23.0 56.5 39.4 354.2 141.9 182.1 0.75 Satisfactory 11.59 Good
WorldClim 201.3 131.8 193.6 176.7 180.7 101.9 92.0 114.0 163.1 247.4 215.1 238.0

28
Figure 17. Flow persistence Qi+I versus Qi plots.
3.4. Spatial Analysis: Land Cover/Land Cover Change and
Watershed Characteristic Analysis
3.4.1. Terrain processing for watershed delineation
Terrain processing result showed that the Kreung Peusangan watershed consist
of 11 sub catchment. Based on elevation, the sub-catchments can be classified into four
upper catchments (UC), two middle catchments (MC) and 5 lower catchments (LC)
(Figure 18). More than 69% of the total area of the Kreung Peusangan watershed is
located in the higher elevation. Details on size and proportion of each sub-catchment
are showed in Table 20.
1991/1992
0 2 4 6 8 10
Qt+1
0
2
4
6
8
10
1992/1993
0 3 6 9 12 15
0
3
6
9
12
15
1993/1994
0 2 4 6 8 10
0
2
4
6
8
10
1994/1995
Qt
0 4 8 12 16 20
Qt+1
0
4
8
12
16
20
1995/1996
Qt
0 2 4 6 8 10
0
2
4
6
8
10
1996/1997
Qt
0 1 2 3 4 5
0
1
2
3
4
5

29
Figure 18. Sub-catchment of the Krueng Peusangan watershed
Table 20. Sub-catchment area of the Krueng Peusangan watershed
Sub-catchment Area (ha) Proportion
LC1 13,570.0 6%
LC2 30,551.0 13%
LC3 18,561.2 8%
LC4 6,723.1 3%
MC1 36,217.1 16%
MC2 32,473.5 14%
UC1a 19,799.5 9%
UC1b 19,239.4 8%
UC2 23,935.1 11%
UC3 13,742.9 6%
UC4 12,035.7 5%
3.4.2. Time series land cover maps of the Kreung Peusangan watershed
One of the crucial phases in ALUCT is defining land cover classification scheme
for satellite image interpretation. We defined our land cover classes based on field
observation conducted in January 2010. We found that the landscape of the Kreung
Peusangan is dominated by three types of land cover: (1) Forest classes, (2) Agroforest
classes and (3) Cropland. Forest classes can be divided into undisturbed and logged over
forest. Agroforest class consists of coffee agroforest, mixed garden and coconut
agroforest.

30
During field observations, we collected a number of GPS points for each land
cover classes. The data will serve (1) as sample for image interpretation process and (2)
as references for accuracy assessment. Figure 19 shows the collection GPS points.
Figure 19. GPS points for accuracy assessment
3.4.3. Time series land cover maps of the Kreung Peusangan watershed
We conducted accuracy assessment for 2009 land cover map using 260 GPS
points. The overall accuracy is 80.3%. Some misclassification occurred between classes
of mixed garden, coffee agroforest and coconut agroforest, which is mostly due to the
similarity of canopy covers. Accuracy for land cover classes is presented in Table 21.
The time series land cover maps in Figure 20 clearly show a different land use
composition in the upper, middle and lower catchment of the watershed. In the upper
catchment, patches of mosaics of coffee agroforest and pine forests are identified in the
surrounding area of Lake Air Tawar. Largest patches of forest and coffee agroforest are
located in the middle part of the watershed. In the lower catchment, the land use
composition consist of mixed garden, coconut, cropland and some patches of oil palm
plantation near the coastal land.
3.4.4. Land cover change and trajectories of Kreung Peusangan watershed
The overall of the Kreung Peusangan land cover change in 1990-2009 is
presented in Table 22. The data shows four type of trend: (1) decreasing area of forest
cover (2) increasing area of coffee agroforest, (3) increasing area of oil palm in the lower
catchment of the area, and (4) decrease of pine forest area. Undisturbed forest is

31
slightly decreased from 26% of total Kreung Peusangan watershed (67,597 ha) in 1990
to 13% (34,403 ha) in 2009. Logged over forest increase from 9% (23,951 ha) in 1990 to
11% (28,109. ha) in 2009. This can be an indication of natural forest degradation caused
by timber extraction activity.
On the other hand, coffee agroforest area increase from 14% (36,462 ha) in 1990 to 23%
(60,204 ha) in 2009. Most of the coffee agroforest area are located in the upper and
middle catchment of the Kreung Peusangan watershed. Oil palm plantations were
identified in the land cover map of 2000. The area are relatively small but rapidly
increase from 1% (2,612 ha) in 2005 to 2% (6,157 ha) in 2009. Oil palm area are located
in the lower part of the Kreung Peusangan watershed. Overall figure of land cover
changes in Kreung Peusangan can be seen in Figure 21.
Table 21. Accuracy assessment result
ID Classs name User's accuracy
1 Betel nut tree 90.0%
2 Cleared land 90.0%
3 Coconut agroforest 62.5%
4 Coffee agroforest 78.5%
5 Cropland 82.4%
6 Fish ponds 89.0%
7 Grass land 71.4%
8 Mixed garden 59.1%
9 Oil palm 69.2%
10 Logged over pine 84.6%
11 Pine forest 87.0%
12 Rice field 95.8%
13 Rubber monoculture 91.0%
15 Settlement 95.2%
16 Shrub 75.0%

Figure 20. Time series land cover maps of
. Time series land cover maps of the Krueng Peusangan watershed

33
Table 22. Area of change for each land cover type in the Kreung Peusangan watershed 1990-2009
Land cover type 1990 2000 2005 2009
Ha % Ha % Ha % Ha %
Undisturbed forest 67,597.2 26% 41,739.8 16% 36,929.6 14% 34,403.9 13%
Logged-over forest 23,951.8 9% 28,944.5 11% 28,306.4 11% 28,109.8 11%
Logged over pine 503.2 0% 2,299.5 1% 718.8 0% 344.7 0%
Mixed garden 12,572.4 5% 23,706.2 9% 24,519.2 10% 19,295.2 8%
Coconut agroforest 16,695.6 6% 10,465.7 4% 15,452.3 6% 19,698.3 8%
Rubber monoculture 1,715.5 1% 3,075.4 1% 3,144.9 1% 3,387.8 1%
Oil palm - 0% 5.0 0% 2,612.6 1% 6,157.4 2%
Coffee agroforest 36,462.2 14% 52,145.4 20% 61,637.4 24% 60,204.6 23%
Sagu 2,692.0 1% 1,531.6 1% 727.4 0% 2,436.4 1%
Pine forest 3,534.0 1% 2,634.4 1% 2,221.2 1% 3,046.5 1%
Betel nut tree - 0% 27.3 0% 1,351.4 1% 1,499.3 1%
Shrub 2,192.0 1% 11,443.8 4% 11,621.0 5% 3,626.6 1%
Cropland 23,518.3 9% 8,316.3 3% 7,717.1 3% 6,955.5 3%
Rice field 10,335.0 4% 9,443.9 4% 8,050.1 3% 10,545.9 4%
Grass land 4,396.5 2% 5,883.2 2% 1,057.3 0% 4,734.6 2%
Settlement 282.2 0% 626.2 0% 884.3 0% 1,957.9 1%
Cleared land 1,636.3 1% 5,676.4 2% 1,058.9 0% 1,423.8 1%
Fish ponds 1,980.7 1% 2,100.4 1% 2,055.2 1% 2,236.8 1%
Waterbody 8,014.2 3% 8,014.2 3% 8,014.2 3% 8,014.2 3%
No data 38,952.1 15% 38,952.1 15% 38,952.1 15% 38,952.1 15%
Grand Total 257,031.2 100% 257,031.2 100% 257,031.2 100% 257,031.2 100%

Figure 21. Overall land cover change of
Deforestation is one of dominant land cover change in the Kreung Peusangan
watershed. The highest rate of deforestation
an analysis of deforestation in the sub
watershed. The largest proportion of deforestation in 1990
and lower catchment. Deforestation is clearly slowed down in 2000
Figure 22
Based on land cover change data, we conducted
produce a simple summary of dominant land cover
watershed within the study period
summary of trajectories analysis is presented in Figure
0
10000
20000
30000
40000
50000
60000
70000
80000
0
5000
10000
15000
20000
25000
He
cta
re
. Overall land cover change of the Kreung Peusangan watershed
Deforestation is one of dominant land cover change in the Kreung Peusangan
ighest rate of deforestation occurred in 1990 – 2000. Figure 22
an analysis of deforestation in the sub-catchment area of the Kreung Peusangan
argest proportion of deforestation in 1990 – 2000 occurred in the upper
and lower catchment. Deforestation is clearly slowed down in 2000 – 2009.
ure 22. Deforestation in the Kreung Peusangan watershed
Based on land cover change data, we conducted a trajectories analysis of land
simple summary of dominant land cover changes in the Kreung Peusangan
within the study period. Trajectories map is shown in Figure 23 and
ummary of trajectories analysis is presented in Figure 24. It is shown that the dominant
1990 2000 2005
1990-2000 2000-2005 2005-2009
Lower Middle Upper
Deforestation is one of dominant land cover change in the Kreung Peusangan
2000. Figure 22 showed
Kreung Peusangan
occurred in the upper
trajectories analysis of land to
Kreung Peusangan
and
It is shown that the dominant
2009

trajectories in the Kreung Peusangan watershed are (1) natural forest
agroforest and (2) natural forest degra
located in the upper catchment, while natural forest co
in the middle catchment (Figure
Figure 23. Land use trajectories map of
Figure 24. Land use trajectories for each sub
0%
10%
20%
30%
40%
50%
60%
70%
80%
90%
100%
Lower
Catchment
trajectories in the Kreung Peusangan watershed are (1) natural forest conversion to
agroforest and (2) natural forest degradation. Natural forest degradation is mostly
located in the upper catchment, while natural forest conversion to agroforest is
dle catchment (Figure 24).
. Land use trajectories map of the Kreung Peusangan watershed
. Land use trajectories for each sub-catchment of the Kreung Peusangan watershed
Middle
Catchment
Upper
Catchment
Stable undisturbed forest
Stable tree crops
Stable agroforest
Others
No data
Natural forest degradation
Natural forest conversion to tree crops
Natural forest conversion to shrub
Natural forest conversion to permanent
croplandNatural forest conversion to grass
Natural forest conversion to agroforest
Conversion to non-land based
Agriculture intensification
annual crop
conversion to
mostly
nversion to agroforest is located
Kreung Peusangan watershed
Natural forest degradation
Natural forest conversion to tree crops
Natural forest conversion to shrub
Natural forest conversion to permanent
Natural forest conversion to grass
Natural forest conversion to agroforest
land based
Agriculture intensification-tree to

36
3.5. Analyses on the Consequences of Current and Future Land Cover
Change on Water Balance Including River Flow
3.5.3. Model calibration and validation
Model performance on river discharge
Model calibration and validation process use the six years available discharge
data. The cumulative values of daily discharge, in general showed a good agreement
between measurement and simulation (Figure 25). A more detail pattern is comparison
of plot flow persistence Qi+I versus Qi and a temporal trends (Figure 26 and 27). We
found a weak relationship for the lowest or the highest between measured and
simulated discharge on a daily basis. However, the statistical test for Figure 26 – 28
resulted a very good or good comparison (the biased less than 20%) except for year
1993/1994 (Table 23), hence, this difference is within acceptable limits.
Figure 25. Plot of cumulative rainfall vs cumulative discharge of simulation and measurement
1991/1992
0 500 1000 1500 2000 2500
Cum. Discharge (mm)
0
300
600
900
1200
15001992/1993
0 400 800 1200 1600 2000
0
200
400
600
800
10001993/1994
0 500 1000 1500 2000
0
200
400
600
800
1000
1994/1995
Cum. Rainfall (mm)
0 500 1000 1500 2000 2500
Cum. Discharge (mm)
0
300
600
900
1200
15001995/1996
Cum. Rainfall (mm)
0 500 1000 1500 2000
0
200
400
600
800
1000
Simulation
Measurement
1996/1997
Cum. Rainfall (mm)
0 300 600 900 1200 1500
0
200
400
600
800
1000

37
Figure 26. Flow persistence Qt+1 versus Qt plots
Figure 27. Hydrograph of simulation and measurement of discharge (mm)
1991/1992
0 5 10 15 20
Qt+1
0
5
10
15
201992/1993
0 3 6 9 12 15
0
3
6
9
12
151993/1994
0 2 4 6 8 10
0
2
4
6
8
10
Simulation
Measurement
1994/1995
Qt
0 4 8 12 16 20
Qt+1
0
4
8
12
16
201993/1994
Qt
0 2 4 6 8 10
Qt+1
0
2
4
6
8
101994/1995
Qt
0 2 4 6 8 10
0
2
4
6
8
10
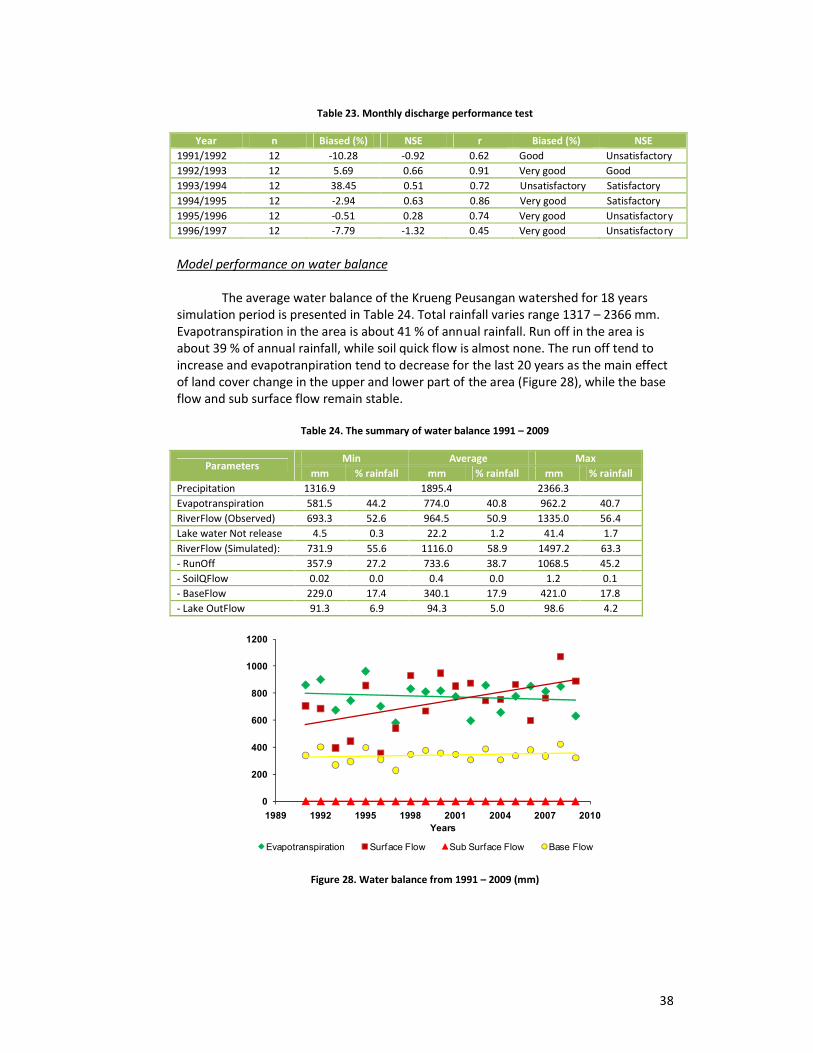
38
Table 23. Monthly discharge performance test
Year n Biased (%) NSE r Biased (%) NSE
1991/1992 12 -10.28 -0.92 0.62 Good Unsatisfactory
1992/1993 12 5.69 0.66 0.91 Very good Good
1993/1994 12 38.45 0.51 0.72 Unsatisfactory Satisfactory
1994/1995 12 -2.94 0.63 0.86 Very good Satisfactory
1995/1996 12 -0.51 0.28 0.74 Very good Unsatisfactory
1996/1997 12 -7.79 -1.32 0.45 Very good Unsatisfactory
Model performance on water balance
The average water balance of the Krueng Peusangan watershed for 18 years
simulation period is presented in Table 24. Total rainfall varies range 1317 – 2366 mm.
Evapotranspiration in the area is about 41 % of annual rainfall. Run off in the area is
about 39 % of annual rainfall, while soil quick flow is almost none. The run off tend to
increase and evapotranpiration tend to decrease for the last 20 years as the main effect
of land cover change in the upper and lower part of the area (Figure 28), while the base
flow and sub surface flow remain stable.
Table 24. The summary of water balance 1991 – 2009
Parameters Min Average Max
mm % rainfall mm % rainfall mm % rainfall
Precipitation 1316.9 1895.4 2366.3
Evapotranspiration 581.5 44.2 774.0 40.8 962.2 40.7
RiverFlow (Observed) 693.3 52.6 964.5 50.9 1335.0 56.4
Lake water Not release 4.5 0.3 22.2 1.2 41.4 1.7
RiverFlow (Simulated): 731.9 55.6 1116.0 58.9 1497.2 63.3
- RunOff 357.9 27.2 733.6 38.7 1068.5 45.2
- SoilQFlow 0.02 0.0 0.4 0.0 1.2 0.1
- BaseFlow 229.0 17.4 340.1 17.9 421.0 17.8
- Lake OutFlow 91.3 6.9 94.3 5.0 98.6 4.2
Figure 28. Water balance from 1991 – 2009 (mm)
0
200
400
600
800
1000
1200
1989 1992 1995 1998 2001 2004 2007 2010
Years
Evapotranspiration Surface Flow Sub Surface Flow Base Flow

39
Analysis on Indicators of Watershed Functions
The total water yield as a fraction of total rainfall tends to increase with average
value 0.59 (Table 25) for the last 20 years as the main effect of land cover change and
rainfall variation. The effect of rainfall variation and land cover change can be simply
assessed using indicator of watershed function and it is expressed to discharge fraction.
The run off (surface flow) and highest month fraction has positive correlation to
total water yield with average value 0.38 and 1.92, respectively. The lowest month
fraction, buffering indicator, buffering indicator relative and buffering peak event have
negative correlation to total water yield. The other indicators tended quite stable to the
discharge fraction over the years (Figure 29).
Figure 29. Indicator of watershed function for the last 18 years
Table 25. The summary of water balance 1991 – 2009
No. Indicators Min Average Max
1.1 Total discharge fraction 0.526 0.587 0.680
2.1 Buffering indicator 0.653 0.744 0.819
2.2 Relative buffering indicator 0.489 0.566 0.676
2.3 Buffering peak events 0.802 0.878 0.905
2.4 Highest monthly discharge relative to mean rainfall 1.516 1.920 2.605
2.5 Surface flow fraction 0.272 0.382 0.490
2.6 Sub surface flow fraction 0.000 0.000 0.001
3.1 Slow flow fraction 0.000 0.005 0.047
3.2 Lowest monthly discharge relative to mean rainfall 0.215 0.365 0.550
0.4 0.5 0.6 0.7
Indicator
0.0
0.2
0.4
0.6
0.8
1.0
Buffering indicator
Relative buffering indicator
Buffering peak
0.4 0.5 0.6 0.7
0.0
0.5
1.0
1.5
2.0
2.5
3.0 Highest month fraction
Lowest month fraction
Total Discharge Fraction
0.4 0.5 0.6 0.7
Indicator
0.0
0.2
0.4
0.6
0.8
1.0Surface flow fraction
Sub surface flow fraction
Total Discharge Fraction
0.4 0.5 0.6 0.7
0.0
0.2
0.4
0.6
0.8
1.0Slow flow fraction

40
3.5.4. Model scenarios
Water balance
Water balance of various explored scenarios is presented in Table 26 and Figure
30. After 10 years simulation, there was no significant different on water balance
between the first three scenarios, it is related to the small area (10 – 15% of total area)
that converted to tree based system. However, the increasing of tree cover contributes
to the decreasing of small amount or river flow compared to BAU condition.
The significant change is found in scenario 4 and 5. In scenario 5 where
reforestation is the main figure in all sub catchments, evapotranspiration was increase
about 50 % and river discharge was decrease about 25 %. The same trend was also
found in scenario 4 where monoculture crop and tree were converted to complex mixed
tree crop; reforestation in open area and logged over forest, but the increasing of
evapotranspiration and decreasing of river discharge is not as high as those scenario 5.
There is also a slight increase in soil base flow for both scenarios. It is imply that there is
transfer of runoff into soil base flow. Thus, the increase of tree cover in the landscape
suggest can prevent flooding as well as abrasion during high rainfall events. However,
the increase of tree cover did not change the amount of soil quick flow in any scenarios.
On the other hand, the lake volume is continuing decrease in any scenarios (Table 27).
Table 26. The summary of water balance for each scenario at year 2019
Parameters Scenarios
Actual BAU 1 2 3 4 5
Precipitation 1885.7 1885.7 1885.7 1885.7 1885.7 1885.7 1885.7
Evapotranspiration 745.8 727.3 755.4 780.0 789.9 850.6 998.1
Lake water not release 19.7 19.9 17.3 20.6 18.2 10.1 9.1
RiverFlow (Simulated) 1109.2 1127.5 1100.6 1080.8 1072.3 1014.8 901.7
- RunOff 756.4 780.2 739.3 758.4 741.8 617.4 498.3
- SoilQFlow 0.0 0.0 0.0 0.0 0.0 0.03 0.0
- BaseFlow 325.0 320.4 331.5 288.1 293.6 356.0 345.5
- Lake OutFlow 87.6 87.6 87.6 87.6 87.6 87.6 87.6
Figure 30. Water balance for each scenario compared to the 2009 condition
0%
20%
40%
60%
80%
100%
BaseFlow SoilQFlow RunOff Evapotranspiration

41
Tabel 27. Lake volume in any scenarios (m3)
Scenarios 2000 2019 Different
BAU 2,525,823,620 2,358,279,443 167,544,177 (6.63)
1 2,525,823,620 2,356,547,397 169,276,223 (7.02)
2 2,525,823,620 2,356,227,820 169,595,801 (6.70)
3 2,525,823,620 2,355,689,519 170,134,101 (6.71)
4 2,525,823,620 2,353,643,535 172,180,085 (6.74)
5 2,525,823,620 2,348,469,103 177,354,517 (6.82)
Analysis on Indicators of Watershed Functions
Change in watershed functions due to land cover change of various explored
scenarios is presented in Table 28. The watershed functions of the first three scenarios
still within the variation of BAU scenario. Significant change found in surface flow
fraction and total discharge fraction of scenarios 4 and 5. This result, confirm that the
increasing of tree cover in the landscape can prevent flash flood as well as abrasion
during high rainfall events.
Figure 31 presents the buffering indicator and it is expressed to its frequency.
Compared to BAU, shift in curve of buffering indicator is 0.8%, 3.4% and 6.6%,
respectively for scenario 1, 4 and 5, while its range between the best and the worse
years is 14.9 %, 15% and 13%, respectively for scenario 1, 4 and 5. The primary change
for the better land use thus is the shift in land use will help avoid 10%, 15% and 36%
(scenario 1, 4 and 5, respectively) of worst years under BAU.
Table 28. The summary of water balance 2000 – 2019
No. Indicators 2019 Scenarios
BAU 1 2 3 4 5
1.1 Total discharge fraction 0.59 0.60 0.58 0.57 0.57 0.54 0.48
2.1 Buffering indicator 0.79 0.79 0.80 0.79 0.79 0.82 0.85
2.2 Relative buffering indicator 0.65 0.64 0.65 0.64 0.64 0.66 0.68
2.3 Buffering peak events 0.87 0.87 0.87 0.87 0.87 0.88 0.89
2.4 Highest monthly discharge
relative to mean rainfall 1.59 1.60 1.58 1.60 1.59 1.54 1.48
2.5 Surface flow fraction 0.40 0.41 0.39 0.40 0.39 0.33 0.26
2.6 Sub surface flow fraction 0.00 0.00 0.00 0.00 0.00 0.00 0.00
3.1 Slow flow fraction 0.19 0.18 0.20 0.17 0.18 0.21 0.21
3.2 Lowest monthly discharge
relative to mean rainfall 0.53 0.52 0.53 0.52 0.52 0.53 0.53

42
Figure 31. Buffering indicator of scenario 1, 4 and 5 expressed to its frequency
0.60
0.65
0.70
0.75
0.80
0.85
0.90
0 0.2 0.4 0.6 0.8 1Buffering Indicator
Frequency
Scenario 1 Scenario 4 Scenario 5 BAU

43
IV. DISCUSSION
In general, the local community and stakeholder perceptions within the three
main locations (upstream, midstream and downstream) on hydrological problem are
similar: flooding, riverbank collapse or abrasion and soil erosion/sedimentation are the
main symptoms and the main causal factors are deforestation/logging and land
conversion (Figure 12 - 15). The result of land cover change analysis and GenRiver model
simulation confirm effects of land conversion in the context of local climate, its
variability and the topography of the area.
The main four types of land cover change are (1) decreasing area of forest cover,
(2) increasing area of coffee agroforest in the upper and middle catchment of the area,
(3) increasing area of oil palm in the lower catchment of the area, and (4) decrease of
pine forest area (Figure 21 - 22). The highest rate of deforestation occurred in 1990 –
2000 in the upper and lower catchment of the area and clearly slowed down in 2000 –
2009. The agroforest type of cover mainly derived from natural forest in the middle of
the catchment (Figure 23 - 24).
The decrease of tree cover in the landscape for the last 20 years is significantly
increases the total water yield as a fraction of total rainfall. The highest contribution to
this additional flow is run off (surface flow) especially during high rainfall events as
shown in Figure 30. The highest month fraction has positive correlation to total water
yield.
The perceptions of local community members and other key stakeholders on
what should be done to manage the current situation of the Krueng Peusangan
watershed is correspond to the result of model scenarios. It is listed on Table 29 and 30.
Based on perceptions of local community members and other key stakeholders
confirmed with model simulation result, an increase of tree cover in the landscape can
reduce the total water yield as implication of the transfer of surface runoff into soil base
flow during high rainfall events. Shifts in the pathway that water takes to reach the river,
from current surface flow to an increase in base flow will depend on the rate of recovery
of soil physical conditions.
Reforestation; planting valuable trees in mixed tree crop, coffee agroforest and
riparian area are strongly recommended by local community. It is seen as feasible
solutions. Some native fruit trees (avocado/Persea americana, durian/Durio zibetinus,
jackfruit/Artocarpus heterophyllus, guava/Psidium guava, jambu air, aren/nira) and
other trees species jeumpa/Michelia champaca LINN, pine, temor/Arenga pinnata,
beringin/Ficus Sp, light wood (temung/Clausena excavata BURM. f., pungkih), dedalu,
daling are the locally known by community and some stakeholder that might have good
value on water preservation. More in-depth study on critical point of abrasion and
needs on ‘bronjong’ establishment as well as planting valuable trees in riparian area.
Waru (Hisbiscus teleaceus) and bamboo were performing appropriate vegetation in
riverbank, however would need some elaboration on other economic valuable
vegetation, which has good ecological function.
While local community members seek location-specific solutions, public/policy
stakeholders refer to generic solutions in the form of forest protection and

44
rehabilitation through reforestation as important actions in responding to floods, soil
erosion and riverbank abrasion. The degree to which hydrological functions can be
improved within the economically important coffee agroforestry systems, rather than by
replacing these by ‘reforestation’ efforts will have to be a major issue in local discussions
on improving natural resource management.
Enhancing local capacity and environment awareness of fishery community in
practicing floating net, pen culture, and environmental friendly fishing both in river and
Lake Laut Tawar, will be very important to reduce the pressure from fishing activity that
lead to decreasing of water quality and biodiversity. Environment educations for young
generation are also mentioned by local NGOS concern to environment protection as one
of alternative to improve household and tourism waste management in riparian area as
well as in Lake Laut Tawar area.
Table 29. Local community perception on some action
Period Provider Activities Purpose Beneficiaries
Short
term
Downstream
community
along the
river
- Build ‘bronjong’
Reducing the impact of
abrasion
Downstream
community along
the river - Planting waru and bamboo
Long
term
Downstream
community
- Better waste management
Reducing the impact of
floods and abrasion
Enrich water quality
Reducing
sedimentation
- Downstream
community
along the river
- Private
companies in
Lhokseumawe
- Planting valuable trees on
‘kebun campur’, such as
nutmeg (Myristica
fragrans), rambutan
(Nephelium lappaceum),
rubber (Hevea
brasiliensis), durian, etc
- Planting valuable trees in
riparian area
Upstream
community
- Better waste management
Planting valuable trees on
‘kebun campur’, such as
nutmeg, rambutan,
rubber, durian, etc
- All community
- Private
companies in
Lhokseumawe
- Planting valuable trees on
coffee system, such as
nutmeg, rambutan,
durian, etc
- Planting valuable trees in
riparian area
Upstream
community
–
surrounding
Lake Laut
Tawar
- Planting valuable trees on
‘kebun campur’, such as
such as nutmeg,
rambutan, rubber, durian,
etc
- Planting valuable trees on
coffee system, such as
such as nutmeg,
rambutan, durian, etc
- Practicing steep land
conservation management
- Replanting pines areas
with pines
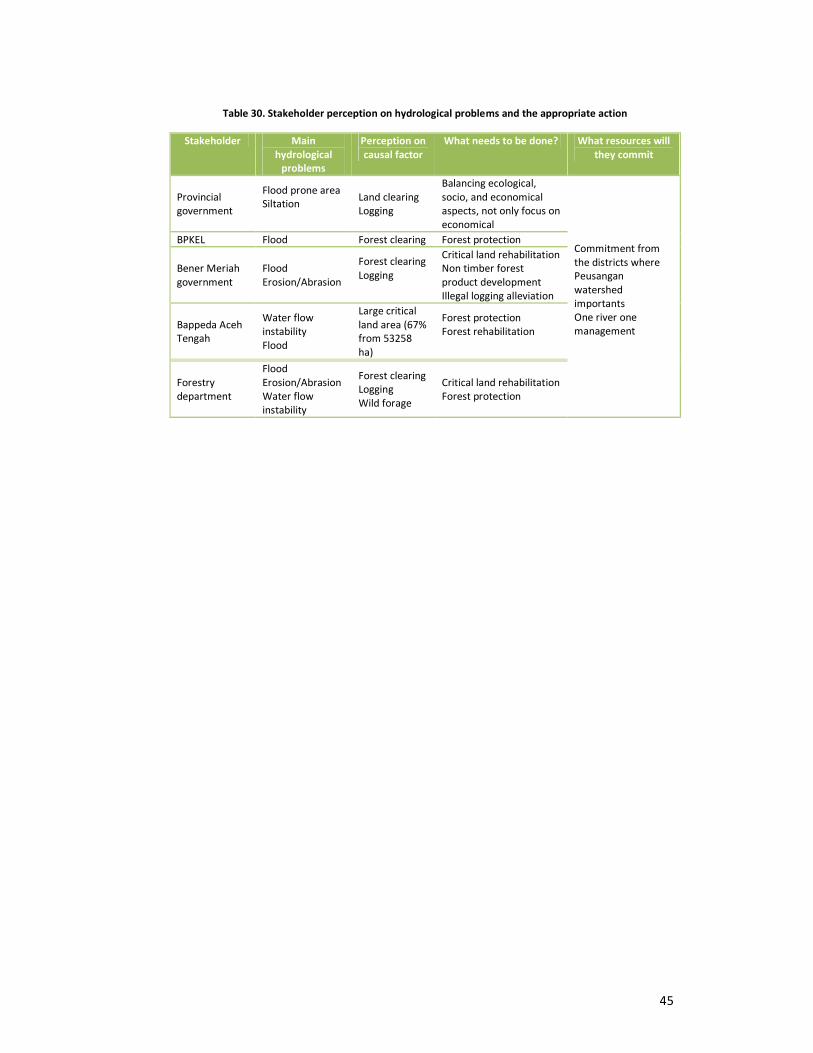
45
Table 30. Stakeholder perception on hydrological problems and the appropriate action
Stakeholder Main
hydrological
problems
Perception on
causal factor
What needs to be done? What resources will
they commit
Provincial
government
Flood prone area
Siltation
Land clearing
Logging
Balancing ecological,
socio, and economical
aspects, not only focus on
economical
Commitment from
the districts where
Peusangan
watershed
importants
One river one
management
BPKEL Flood Forest clearing Forest protection
Bener Meriah
government
Flood
Erosion/Abrasion
Forest clearing
Logging
Critical land rehabilitation
Non timber forest
product development
Illegal logging alleviation
Bappeda Aceh
Tengah
Water flow
instability
Flood
Large critical
land area (67%
from 53258
ha)
Forest protection
Forest rehabilitation
Forestry
department
Flood
Erosion/Abrasion
Water flow
instability
Forest clearing
Logging
Wild forage
Critical land rehabilitation
Forest protection

46
V. CONCLUSION
In general, the local community and stakeholder perceptions within the three
main locations on hydrological problem are similar: flooding, riverbank collapse or
abrasion and soil erosion/sedimentation are the main symptoms and the main causal
factors are deforestation/logging and land conversion. The result of land cover change
analysis and GenRiver model simulation confirmed effects of land conversion in the
context of local climate: its variability and the topography of the area.
The decrease of tree cover in the landscape for the last 20 years significantly
increased the total water yield as a fraction of total rainfall. The highest contribution to
this additional flow is run off (surface flow) especially during high rainfall events. The
highest monthly river flow fraction has a positive correlation to total water yield.
Based on perceptions of local community members and other key stakeholders
confirmed with model simulation result, an increase of tree cover in the landscape
prevent hydrological impacts as it can reduce the surface flow and increase base flow
during high rainfall events. Shifts in the pathway that water takes to reach the river,
from current surface flow to an increase in base flow will depend on the rate of recovery
of soil physical conditions.
Finally we recommend to (1) follow-up studies on the effects of coffee
agroforestry and other forest derived land uses on soil physical conditions, (2) explore
types of tress that both has ecological and economical functions, and (3) design any
rewards environmental services schemes that can accelerate the process of increasing
tree cover. This scheme may benefit downstream communities in Krueng Peusangan
watershed, including companies in Lhokseumawe.

47
REFERENCES
Jeanes K, van Noordwijk M, Joshi L, Widayati A, Farida and Leimona B. 2006. Rapid
Hydrological Appraisal in the context of environmental service rewards. Bogor,
Indonesia.World Agroforestry Centre - ICRAF, SEA Regional Office. 56 p.
Dixon HJ, Doores JW, Joshi L and Sinclair FL. 2001. Agroecological Knowledge Toolkit for
Windows: methodological guidelines, computer software and manual for AKT5 School of
Agricultural and Forest Sciences, University of Wales, Bangor.
Muchlisin Z.A. 2008. Ikan depik yang terancam punah. Bulletin Leuser,6(17): 9-12
van Noordwijk M, Widodo RH, Farida A, Suyamto D, Lusiana B, Tanika L, and Khasanah
N. 2010. GenRiver and FlowPer: Generic River Flow Persistence Models, User Manual
Version 2.0. World Agroforestry Centre (ICRAF), Bogor, Indonesia.
van Noordwijk M, Farida , Saipothong P, et al.. 2006. Watershed functions in productive
agricultural landscapes with trees. In: Garrity DP, Okono A, Grayson M and Parrott S,eds.
World Agroforestry into the Future. Nairobi, Kenya. World Agroforestry Centre - ICRAF.
P. 103-112.
van Noordwijk M, Widodo RH, Farida A, Suyamto D, Lusiana B, Tanika L, and Khasanah
N. 2010. GenRiver and FlowPer: Generic River Flow Persistence Models , User Manual
Version 2.0. World Agroforestry Centre (ICRAF), Bogor, Indonesia.
World Conservation Monitoring Centre 1996. Poropuntius tawarensis. In: IUCN 2009.
IUCN Red List of Threatened Species. Version 2009.2. <www.iucnredlist.org>.
Downloaded on 09 March 2010.
World Conservation Monitoring Centre 1996. Rasbora tawarensis. In: IUCN 2009. IUCN
Red List of Threatened Species. Version 2009.2. <www.iucnredlist.org>. Downloaded on
09 March 2010.
WWF. 2008. Laporan Pertemuan Antar Pemerintah Kabupaten/Kota Dalam Rangka
Pengelolaan Daerah Aliran Sungai (DAS) Peusangan Secara Kolaboratif dan
Berkelanjutan.
http://www.serambinews.com/news/view/24653/abrasi-krueng-peusangan-cemaskan-
warga
http://www.modusaceh.com/html/read/reportase/1224/mengais_rezeki_di_kreueng_p
eusangan.html/
http://www.rapi0107.org/cetak.php?id=171

48
APPENDIXES

49
Appendix 1. Performance evaluation of rainfall simulator model
1. Coefficient correlation analysis (R)
��� � � �� � �∑ ���
��� � � � � �∑ ��
��� � � � � �∑ ��∑ �
� � ����������
where, x is montly measured data, y is monthy predicted data and n is number of data.
Value > 0.65 is generarally viewed as satisfactory and value ≤ 0.65 as unsatisfactory.
2. Bias analysis (Bias, %)
���� � ∑� ��� � ���∑ ��� � 100%
where, yobs is montly measured data and ysim is monthy predicted data. Performance
evaluation criteria is presented as following Table.
Performance Rating Bias (%)
Very Good |Bias|< 10
Good 10 ≤ |Bias| < 15
Satisfactory 15 ≤ |Bias|< 25
Unsatisfactory 25 ≤ |Bias|

50
Appendix 2. Performance evaluation of GenRiver 2.0 model output
The Nash-Sutcliffe efficiency (NSE) is a normalized statistic that determines the
relative magnitude of the residual variance (“noise”) compared to the measured data
variance (Nash and Sutcliffe, 1970). NSE indicates how well the plot of observed versus
simulated data fits the 1:1 line.
��� � 1 � � ∑ !���� � !����"�#�$%∑ !���� � !�&'#"�#�$%
(
Where, Yiobs is the observation for the constituent being evaluated, Yisim is the simulated
value for the constituent being evaluated, Ymean is the mean of observed data for the
constituent being evaluated, and n is the total number of observations.
NSE ranges between -∞ and 1.0 (1 inclusive), with NSE = 1 being the optimal
value. Values between 0.0 and 1.0 are generally viewed as acceptable levels of
performance, whereas values < 0.0 indicates that the mean observed value is a better
predictor than the simulated value, which indicates unacceptable performance.
Performance of the model result will be evaluated annually, and will be accepted when
performed NSE criteria more than 0.50 as the following table (Moriasi, D.N. et. al.,
2007).
Performance Rating NSE
Very good 0.75 < NSE ≤ 1.00
Good 0.65 NSE ≤ 0.75
Satisfactory 0.50 NSE 0.65
Unsatisfactory NSE 0.5
<
< ≤
≤

51
Appendix 3. Indicator of watershed function
Criteria and indicators of watershed hydrological functions that relevant to downstream
stakeholders (Van Noordwijk, et al., 2006)
Criteria Indicator Quantitative Indicator Site
Characteristics
Relevant for
Water
transmition
Total water yield
(discharge) per unit
rainfall (TWY)
)*! � +, � -
Q = annual river flow
A = total watershed area
P = annual precipitation
Annuall rainfall
(mm year-1
)
Downstream
water user
Buffering
peak rain
event
Buffering indicator
for peak flows given
peak rain even (BI)
�. � 1 � +���_012, � -���_012
-���_012 � � 3���- � -�&'#, 0
+���_012 � � 3���+ � +�&'#, 0
Geomorphology Communities
living along
the river and
in flood
plains
Relative buffering
indicator, adjusted
for relative water
yield (RBI)
��. � 1 � 5 -�&'#+�&'# � +���_012-���_012 6
Buffering peak event
(BPE) �-� � 1 � max�:��; _+ � +�&'# , � max�:��; _- � -�&'#
Fraction of total river
discharge derived
from surface quick
flow (run off)
Direct output from model
Fraction of total river
discharge derived
from soil quick flow
Direct output from model
Gradual water
release (water
availability
during dry
season)
Lowest of monthly river discharge totals relative to mean monthly
rainfall
Soil type and
characteristics
Communities
who do not
own water
harvesting/st
oring systems
(lake,
embung)
Fraction of
dishcharge drived
from slow flow (> 1
day after rain event)
Direct output from model
Note: Q (mm.day-1
) = {[(m3.sec
-1) x 24 hour x 3600 sec.hour
-1]/ [A (km
2) x10
6 m
2.km
-2)]} x 10
3 (mm.m
-1)