a study of tensile and microhardness properties of m-lldpe ... · a study of tensile and...
TRANSCRIPT

A Study of Tensile and Microhardness Properties of
m-LLDPE/LDPE Blends
By
MOHAMMAD FAHEEM
A Thesis presented to the
DEANSHIP OF GRADUATE STUDIES
In Partial Fulfillment of the Requirements for the degree
MASTER OF SCIENCE
IN
MECHANICAL ENGINEERING
KING FAHD UNIVERSITY OF PETROLEUM AND MINERALS
Dhahran, Saudi Arabia
June 2003

In the Name of Allah, Most Gracious, Most Merciful.

KING FAHD UNIVERSITY OF PETROLEUM AND MINERALS DHAHRAN 31261, SAUDI ARABIA
DEANSHIP OF GRADUATE STUDIES
This thesis, written by MOHAMMAD FAHEEM under the direction of his Thesis
Advisor and approved by his Thesis Committee, has been presented to and accepted by
the Dean of Graduate Studies, in partial fulfillment of the requirements for the degree of
MASTER OF SCIENCE IN MECHANICAL ENGINEERING.
Thesis Committee ____________________________________ Dr. Khaled Mezghani (Advisor) ____________________________________ Dr. Nesar Merah (Member) ____________________________________ Dr. Ibnelwaleed A Hussein (Member) _____________________________ Dr.Faleh Al-.Sulaiman Department Chairman _____________________________ Prof. Osama A. Jannadi Dean of Graduate Studies _____________________________ Date

Dedicated to My Beloved Parents and Family Members whose constant prayers, sacrifice and inspiration led to this
wonderful accomplishment

v
ACKNOWLEDGEMENTS
All praises and thanks are due to Allah (subhana wa taala) for bestowing me with
health, knowledge and patience to complete this work. Thereafter, acknowledgement is
due to KFUPM for the support given to this research through its tremendous facilities and
for granting me the opportunity to pursue graduate studies with financial support.
I acknowledge, with deep gratitude and appreciation, the inspiration,
encouragement, valuable time and guidance given to me by my Committee Chairman,
Dr. Khaled Mezghani.
I am grateful to my Committee members, Dr. Nesar Merah and Dr. Ibnelwaleed A
Hussein for their constructive guidance and technical support. I also acknowledge the
sincere and untiring efforts of Engr. Mr. Latif Hashmi in preparing the experimental
program and set-ups utilized in this study. Thanks are also due to the laboratory
personnel, Mr. Othman Al-Thubaiti, Mr.Saleh and Mr.Zain who assisted me in the
experimental work and the Department secretaries, Mr. Lateef and Mr.Jameel for their
help and assistance.
Special thanks are due to my senior colleagues at the University, Mujtaba
Hussain, Salman A Gaffar, Abdul Baseer, Mohammad Ahsan, Ahmed Jamal, Ghulam
Arshed, Abdus Samad and Irfan S Hussaini who were always there to help me in my
work. I would also like to thank my friends Aurifullah Vantala, Syed Imran, Sohail
Anwar, Hameed Tayyab, Aurifusalam, Abdullah, Ali, Anwar, Omar Farooq, Fasi, Zahed,
Ameer, Hameeduddin, Jalal Shah, Majid, Abbas, Mujahid, Bilal, Hassan and all others
who provided wonderful company and good memories that will last a life time.
Finally, thanks are due to my dearest mother, late father, and all my family
members for their emotional and moral support throughout my academic career and also
for their love, patience, encouragement and prayers.
vi
TABLE OF CONTENTS
LIST OF TABLES...................................................................................... IX
LIST OF FIGURES......................................................................................X
ABSTRACT.............................................................................................. XIV
ABSTRACT (ARABIC) ............................................................................XV
CHAPTER 1
INTRODUCTION .........................................................................................1
1.1 BACKGROUND ............................................................................................... 1
1.2 POLYETHYLENE BLENDS .......................................................................... 6
1.3 CRYSTALLINITY DETERMINATION ..................................................... 10 1.3.1 Density measurements ................................................................................ 11 1.3.2 Thermal methods ........................................................................................ 11 1.3.3 X-ray methods............................................................................................. 12 1.3.4 Other methods............................................................................................. 12
1.4 THERMAL PROPERTIES ........................................................................... 12 1.4.1 Melting Range............................................................................................. 13 1.4.2 Heat of Fusion ............................................................................................ 14
1.5 MECHANICAL PROPERTIES.................................................................... 14 1.5.1 Tensile Properties....................................................................................... 15 1.5.2 Elastic Modulus .......................................................................................... 18 1.5.3 Yield Phenomena ........................................................................................ 18 1.5.4 Ultimate Tensile Stress ............................................................................... 19 1.5.5 Strain at break ............................................................................................ 20
1.6 MICROHARDNESS....................................................................................... 20 1.6.1 Correlation between microhardness and other physical and mechanical
properties.................................................................................................... 21
CHAPTER 2
LITERATURE REVIEW ...........................................................................23
2.1 METALLOCENE POLYETHYLENES ...................................................... 23
2.2 MECHANICAL AND THERMAL ANALYSIS OF PE BLENDS ............ 25

vii
2.3 STRUCTURE-PROPERTY RELATIONSHIP IN PE BLENDS .............. 35
2.4 CHARACTERIZATION OF PE BLENDS.................................................. 40
CHAPTER 3
EXPERIMENTAL PROCEDURE ............................................................43
3.1 MATERIALS CHARACTERISTICS .......................................................... 43 3.1.1 Preparation of blend samples..................................................................... 43 3.1.2 Preparation of discs.................................................................................... 45 3.1.3 Tensile Specimens....................................................................................... 48
3.2 MECHANICAL TESTING ........................................................................... 48 3.2.1 Tensile Testing Equipment.......................................................................... 48 3.2.2 Microhardness Testing ............................................................................... 50
3.3 THERMAL TESTING ................................................................................... 50 3.3.1 DSC Testing Equipment.............................................................................. 50
CHAPTER 4
EXPERIMENTAL RESULTS ...................................................................53
4.1 INTRODUCTION........................................................................................... 53
4.2 THERMAL ANALYSIS................................................................................. 53 4.2.1 DSC Scans of Pure Samples ...................................................................... 53 4.2.2 DSC scans of B-type blends....................................................................... 56 4.2.3 DSC Scans of O-type blends....................................................................... 56 4.2.4 DSC Scans of H-type Blends ...................................................................... 61
4.3 TENSILE RESULTS...................................................................................... 61 4.3.1 Pure Samples .............................................................................................. 63
4.4 EFFECT OF THE BRANCH TYPE OF M-LLDPE.................................... 63 4.4.1 B Type Blend System (B-LLDPE/LDPE).................................................... 63 4.4.2 H-type Blend System (H-LLDPE/LDPE).................................................... 75 4.4.3 O-type Blend System (O-LLDPE/LDPE).................................................... 75
4.5 MICROHARDNESS RESULTS ................................................................... 75 4.5.1 Blend Samples............................................................................................. 93 4.5.2 Effect of Indentation Time .......................................................................... 93
CHAPTER 5
DISCUSSION...............................................................................................98
viii
5.1 INTRODUCTION........................................................................................... 98
5.2 THERMAL ANALYSIS................................................................................. 99 5.2.1 DSC Scans of Pure Samples ...................................................................... 99 5.2.2 DSC Scans of B-type Blends..................................................................... 100 5.2.3 DSC Scans of O-type Blends .................................................................... 102 5.2.4 DSC Scans of H-type Blends .................................................................... 104
5.3 TENSILE RESULTS.................................................................................... 107 5.3.1 Pure Samples ............................................................................................ 107
5.4 EFFECT OF THE BRANCH TYPE OF m -LLDPE ON THE MECHANICAL PROPERTIES.................................................................. 107
5.4.1 Variation of Initial Modulus ..................................................................... 112 5.4.2 Variation of Yield Stress ........................................................................... 118 5.4.3 Variation of Tensile Strength.................................................................... 123 5.4.4 Variation of Strain at break...................................................................... 123
5.5 VICKER’S HARDNESS RESULTS........................................................... 130 5.5.1 Variation of VHN with Percent Crystallinity ........................................... 130 5.5.2 Correlation with Initial Modulus.............................................................. 134 5.5.3 Correlation with Yield Stress.................................................................... 134 5.5.4 Variation of VHN with Tensile Strength................................................... 139 5.5.5 Variation of VHN with Strain at Break .................................................... 142 5.5.6 Effect of Indentation time ......................................................................... 142
CHAPTER 6
CONCLUSIONS AND RECOMMENDATIONS ................................. 145
6.1 CONCLUSIONS ........................................................................................... 145
6.2 RECOMMENDATIONS.............................................................................. 147
BIBLIOGRAPHY..................................................................................... 148
ix
LIST OF TABLES
Table 3.1 Properties of Resins .......................................................................................... 44
Table 4.1 Thermal characterization data of pure polymers ............................................. 55
Table 4.2 Thermal characterization data of B-type blends ............................................... 58
Table 4.3 Thermal characterization data of O-type blends............................................... 60
Table 4.4 Thermal characterization data of H-type blends............................................... 62
Table 4.5 Mechanical properties of samples.................................................................... 68
Table 4.6 Summary of the mechanical properties of the samples ................................... 69
Table 4.7 Mechanical properties of B-type blends ........................................................... 76
Table 4.8 Mechanical properties of B-type blends ........................................................... 77
Table 4.9 Summary of the mechanical properties of B-type blends................................. 78
Table 4.10 Mechanical properties of H-type blends......................................................... 84
Table 4.11 Mechanical properties of H-type blends......................................................... 85
Table 4.12 Summary of the mechanical properties of H-type blends............................... 85
Table 4.13 Mechanical properties of O-type blends......................................................... 91
Table 4.14 Mechanical properties of O-type blends......................................................... 92
Table 4.15 Summary of the mechanical properties of O-type blends............................... 92
Table 4.16 Microhardness results for pure samples......................................................... 94
Table 4.17 Microhardness results for B-type blend samples............................................ 94
Table 4.18 Microhardness results for H-type blend samples............................................ 95
Table 4.19 Microhardness results for O-type blend samples............................................ 95
Table 4.20 VHN at different indentation times for pure LDPE sample ........................... 95
Table 4.21 VHN at different indentation times for pure B-LLDPE sample..................... 96

x
LIST OF FIGURES
Figure 1.1: Chemical Structure of pure polyethylene ........................................................ 5
Figure 1.2: Schematic representations of different classes of polyethylene. (a) High-
density polyethylene (b) Low-density polyethylene (c) Linear low-density
polyethylene ........................................................................................................ 5
Figure 1.3: Schematic illustration of a semi-crystalline structure showing lamellae
linked by ‘tie’ molecules through amorphous regions ........................................ 7
Figure 1.4: Tie chains and loops in the non-crystalline phases of polyethylene ............... 7
Figure 1.5: Idealized representation of a polyethylene lamella ......................................... 8
Figure 1.6: Schematic representation of a spherulite ......................................................... 8
Figure 1.7: Generic illustration of semi crystalline morphology ....................................... 9
Figure 1.8: Schematic representations of the phases present in solid polyethylene .......... 9
Figure 1.9: Effect of molecular weight on the mechanical properties of polymers ......... 17
Figure 1.10: Schematic of some failure modes of glassy polymers ................................ 17
Figure 1.11: Microhardness as a function of yield stress for PE ..................................... 22
Figure 2.1: Microhardness of melt crystallized blends of HD and LDPE as a function of
increasing weight concentration of LDPE. Curve A, slowly cooled samples;
curve B material measured at room temp. and B’ material measured
at 110°C ............................................................................................................. 27
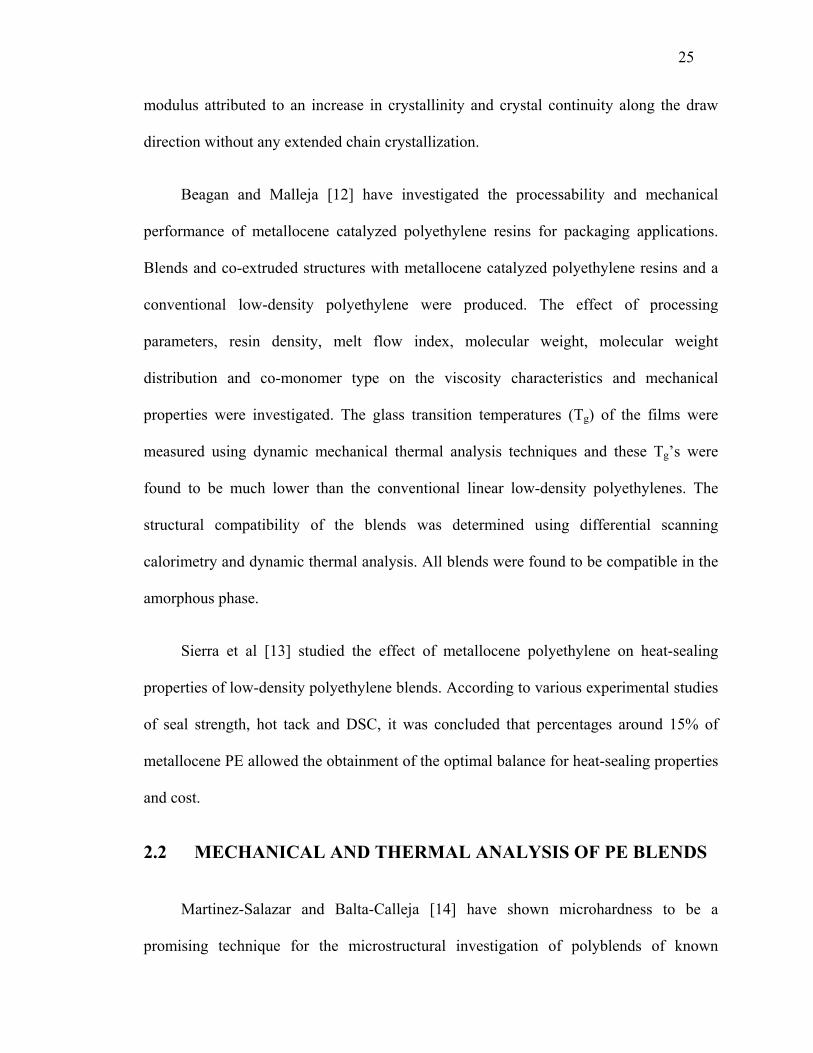
Figure 2.2: Typical stress- strain curves obtained at a strain rate of 50mm min-1 for the
LDPE/LLDPE blends (a) slowly cooled and (b) rapidly cooled.(1) 100/0, (2)
65/35 (3) 35/65 and (4) 0/100............................................................................. 31
Figure 3.1: Haake Polydrive Melt blender........................................................................ 46
Figure 3.2: Compression mold is being mounted on a hydraulic Carver press ................ 47
Figure 3.3: Tensile specimen as per ASTM D 638........................................................... 49
Figure 3.4: Instron 5567 equipped with Merlin Series IX for tensile testing ................... 49
Figure 3.5: Vickers Hardness Tester................................................................................. 51
Figure 3.6: Mettler DSC 822e Equipment ........................................................................ 52

xi
Figure 4.1: DSC scans of pure polymers showing the nature of the
melting peaks...................................................................................................... 54
Figure 4.2: DSC scans of B-type blends showing the nature of melting peaks at
different blend ratios........................................................................................... 57
Figure 4.3: DSC scans of O-type blends showing the nature of melting peaks................ 59
Figure 4.4: DSC scans of H-type blends showing the nature of melting peaks................ 62
Figure 4.5: Stress-strain curves for the pure LDPE samples ........................................... 64
Figure 4.6: Stress-strain curves for the pure B-LLDPE samples..................................... 65
Figure 4.7: Stress-strain curves for the pure H-LLDPE samples..................................... 66
Figure 4.8: Stress-strain curves for the pure O-LLDPE samples..................................... 67
Figure 4.9: Stress-strain curves for 10/90 blends (B-LLDPE/LDPE) .............................. 70
Figure 4.10: Stress-strain curves for 30/70 blends (B-LLDPE/LDPE) ............................ 71
Figure 4.11: Stress-strain curves for 50/50 blends (B-LLDPE/LDPE) ............................ 72
Figure 4.12: Stress-strain curves for 70/30 blends (B-LLDPE/LDPE) ............................ 73
Figure 4.13: Stress-strain curves for 90/10 blends (B-LLDPE/LDPE) ............................ 74
Figure 4.14: Stress-strain curves for 10/90 blends (H-LLDPE/LDPE) ............................ 79
Figure 4.15: Stress-strain curves for 30/70 blends (H-LLDPE/LDPE) ............................ 80
Figure 4.16: Stress-strain curves for 50/50 blends (H-LLDPE/LDPE) ............................ 81
Figure 4.17: Stress-strain curves for 70/30 blends (H-LLDPE/LDPE) ............................ 82
Figure 4.18: Stress-strain curves for 90/10 blends (H-LLDPE/LDPE) ............................ 83
Figure 4.19: Stress-strain curves for 10/90 blends (O-LLDPE/LDPE) ............................ 86
Figure 4.20: Stress-strain curves for 30/70 blends (O-LLDPE/LDPE) ............................ 87
Figure 4.21: Stress-strain curves for 50/50 blends (O-LLDPE/LDPE) ............................ 88
Figure 4.22: Stress-strain curves for 70/30 blends (O-LLDPE/LDPE) ............................ 89
Figure 4.23: Stress-strain curves for 90/10 blends (O-LLDPE/LDPE) ............................ 90
Figure 4.24: Effect of indentation time(s) on VHN.......................................................... 97
Figure 5.1: Thermal characterization of B-Type blends (a) Melting temperature versus
%LDPE (b) Endset melting temperature versus % LDPE (c) Crystallinity
versus % LDPE................................................................................................. 101
xii
Figure 5.2: Thermal characterization of O-Type blends (a) Melting temperature versus
%LDPE (b) Endset melting temperature versus % LDPE(c) Crystallinity
versus % LDPE................................................................................................ 103
Figure 5.3: Thermal characterization of H-Type blends(a) Melting temperature versus
%LDPE (b) Endset melting temperature versus % LDPE (c) Crystallinity
versus % LDPE................................................................................................. 106
Figure 5.4a: Stress-strain curves for all the samples...................................................... 108
Figure 5.4b: Magnification in the vicinity of the yield................................................... 109
Figure 5.5a: Stress-strain curves for the B-Type Blend system (B-LLDPE/LDPE) ...... 110
Figure 5.5b: Magnification in the vicinity of the yield for B-type Blend system........... 111
Figure 5.6a: Stress-strain curves for the H-Type blend system (H-LLDPE/LDPE)....... 113
Figure 5.6b: Magnification in the vicinity of the yield for H-type blend system ........... 114
Figure 5.7a: Stress-strain curves for the O-Type blend system (O-LLDPE/LDPE)....... 115
Figure 5.7b: Magnification in the vicinity of the yield for O-type blend system ........... 116
Figure 5.8: Initial modulus versus percent crystallinity of pure polymers ..................... 117
Figure 5.9: Initial modulus as a function of LDPE content for all the three blend systems
(a) B-Type (b) H-Type (c) O-Type .................................................................. 119
Figure 5.10: Variation of initial modulus versus percent crystallinity for the three blend
systems ............................................................................................................. 120
Figure 5.11: Yield stress versus percent crystallinity of pure polymers......................... 121
Figure 5.12: Yield stress as a function of LDPE content for all the three blend systems
(a) B-Type (b) H-Type (c) O-Type .................................................................. 122
Figure 5.13: Variation of the yield point versus percent crystallinity values ................. 124
Figure 5.14: Tensile strength versus percent crystallinity of pure polymers.................. 125
Figure 5.15: Tensile strength as a function of LDPE content for all the three blends
(a).B-Type (b) H-Type (c) O-Type .................................................................. 126
Figure 5.16: Variation of Tensile strength versus percent crystallinity values............... 127
Figure 5.17: Strain at break versus percent crystallinity of pure polymers .................... 128
Figure 5.18: Strain at break as a function of LDPE content for all the three blends
(a).B-Type (b) H-Type (c) O-Type .................................................................. 129
Figure 5.19: Variation of Strain at break versus percent crystallinity values................. 131

xiii
Figure 5.20: Variation of VHN versus % LDPE content for all the blend systems
(a)B-type (b) H-type (c) O-type ....................................................................... 132
Figure 5.21: Variation of VHN with percent crystallinity (DSC) .................................. 133
Figure 5.22: Variation of initial modulus with VHN for polymers ............................... 135
Figure 5.23: Correlation of initial modulus with VHN (a)B-type (b) H-type
(c) O-type.......................................................................................................... 136
Figure 5.24: Variation of yield stress with VHN for polymers ..................................... 137
Figure 5.25: Variation of yield stress with VHN for all the blend systems
(a) B-type (b) H-type (c) O-type ...................................................................... 138
Figure 5.26: Variation of tensile strength versus VHN for polymers............................ 140
Figure 5.27: Variation of tensile strength versus VHN for all the blend systems
(a) B-type (b) H-type (c) O-type ...................................................................... 141
Figure 5.28: Variation of strain at break versus VHN for polymers ............................. 143
Figure 5.29: Variation of strain at break versus VHN for all the blend systems
(a) B-type (b) H-type (c) O-type ...................................................................... 144

xiv
THESIS ABSTRACT
NAME: MOHAMMAD FAHEEM TITLE: A STUDY OF TENSILE AND MICROHARDNESS
PROPERTIES OF m-LLDPE/LDPE BLENDS
DEPARTMENT: MECHANICAL ENGINEERING
DATE: 4 JUNE, 2003
Polyethylene (PE) is the largest produced thermoplastic polymer and is highly used in packaging applications. There exist different types of PE polymers depending on the molecular architecture. The most common types are: Low-Density Polyethylene (LDPE); Linear Low-Density Polyethylene (LLDPE); and High-Density Polyethylene (HDPE). LDPE is produced from free-radical polymerization of ethylene, and it has broad molecular distribution and good processability but lower mechanical properties. LLDPE is produced from co-polymerization of ethylene and α-olefin (butene, hexene or octene) using metallocene catalyst, and it possesses better mechanical properties but lower processability. Usually, for a packaging application, LLDPE is favored for its mechanical properties; however, its processability is a disadvantage. An approach to over come this problem is to blend LLDPE with LDPE.
The main objective of this study is to investigate the influence of branch type (butene, hexene and octene) of LLDPE on the mechanical properties of its blends with LDPE. Three blend systems: B-type (B-LLDPE/LDPE), H-type (H-LLDPE/LDPE) and O-type (O-LLDPE/LDPE) were studied for tensile and microhardness. The results show that an addition of small amount (10%) of LDPE to LLDPE polymers produced a negligible effect on modulus of elasticity, yield and tensile strengths, and ductility of the blends. Whereas, the effect of the addition of small amount of LLDPE to LDPE depends on the type of blends and varies from one mechanical property to another. The correlation of Vickers hardness numbers with yield strength values was found to follow Tabor’s relationship for most of the blend systems. The mechanical properties and the microhardness results are well correlated with the amount of crystallinity in the studied samples.
MASTER OF SCIENCE DEGREE KING FAHD UNIVERSITY OF PETROLEUM AND MINERALS
Dhahran, Saudi Arabia
xv
رسالة الماجستير
محمد فهيم : االسم m-LLDPE/LDPEدراسة خواص مقاومة الشد و القساوة المصغرة للخالئط : العنوان
الهندسة الميكانيكية : قسم 2003-جوليو-4: التاريخ
يوجد انواع مختلفة من .بولي اتيلين هوالبوليمر االآثر انتاجا في العالم و اآثر استخداماته هي في عملية التغليف البولي اتيلين المنخفض الكثافة :واالنواع االآثر استخداما هي .البولي اتيلين وذلك بحسب الترآيب الكيميائي
(LDPE) , البولي اتيلين المنخفض الكثافة الخطي(LLDPE) و البولي اتيلين ذو الكثافة العالية (HDPE) . LDPE لكن , وتصنيع سهل ,ينتج من عملية البلمرة الراديكالية الحرة لالتيلين وهذه العملية تتميز بتوزيع ذري واسع
وتين بي( اولفين -ينتج من عملية البلمرة الراديكالية الحرة لالتيلين و الفا LLDPE .خصائصه الميكانيكية ضعيفة خواص ميكانيكية افضل لكن عملية تصنيعه LLDPEو لل ,ياستخدام المتلوسين آمحفز ) او االوآتين ,هيكسين ,
وآطريقة للتغلب على هذه السيئة هي .لطتبيقات التغليف رغم صعوبة تصنيعه , LLDPEيالعادة يشتخدم .اصعب هيكسين و ,بيوتين (LLDPEير انواع الهدف الرئيسي من هذه الدراسة هو بحث تاث .LDPE مع LLDPEخلط
.LDPEعلى الخواص الميكانيكية لخالئطه مع ) االوآتين
-H (Hالنوع , B (B-LLDPE/LDPE)النوع :خواص مقاومة الشد و القساوة المصغرة ثالث خالئط وقد درست LLDPE/LDPE) , النوعO (O-LLDPE/LDPE), 10 (والنتيجة اظهرت ان في حال اضافة آمية صغيرة (%
والمطاوعة و مقاومة الشد وقابلية السحب , هذا سينتج تاثير قليل جدا على معامل اللدونة LLDPE الى LDPEمن فان النتيجة ستتعلق بنوع الخالئط المستخدمة وتتغير الخواص LDPE الى LLDPEبينما عند اضافة .للخالئط
ن رقم قساوة فيكرز و قيم اجهاد الخضوع تتبع عالقة تابور وقد وجد ان العالقة بي .الميكانيكية من خلطة الى اخرى نتائج خواص مقاومة الشد و القساوة المصغرة تتعلق بشكل آبير بمدى البللورة في العينة المدروسة . لمعظم الخالئط
.
هذه الدراسة اعدت لنيل درجة الماجستير في العلوم في جامعة الملك فهد للبترول والمعادن
31261ان الظهر المملكة العربية السعودية

1
CHAPTER 1
INTRODUCTION
1.1 BACKGROUND
A polymer is a long molecule, which contains a chain of atoms held together by
covalent bonds. It is produced through a process known as polymerization whereby
monomer molecules react together chemically to form either linear chains or a three
dimensional network of polymer chains. If one type of monomer is employed to form the
polymer the resulting molecule is called a homopolymer. A copolymer is obtained by
using different types of monomer species.
Polymers can be separated into three groups; thermoplastics, rubbers and
thermosets. In addition, thermoplastics are separated into crystalline and amorphous
polymers. The ability of polymers to crystallize depends upon many factors such as the
degree of branching and the regularity of molecules. However, crystalline thermoplastics
are in general only semi-crystalline and do not crystallize completely when cooled from
the melt. Thermosets are heavily cross-linked polymers, which are normally rigid and
intractable. They consist of a dense three-dimensional molecular network and, like
rubbers, degrade rather than melt on the application of heat.
2
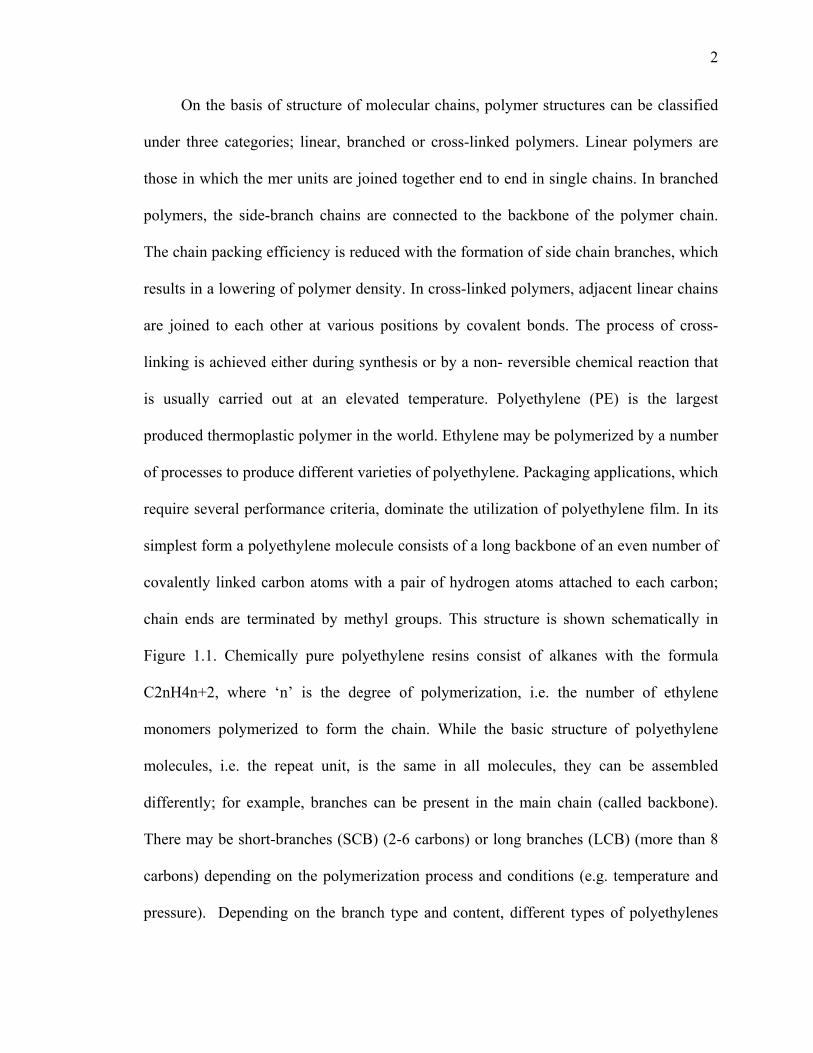
On the basis of structure of molecular chains, polymer structures can be classified
under three categories; linear, branched or cross-linked polymers. Linear polymers are
those in which the mer units are joined together end to end in single chains. In branched
polymers, the side-branch chains are connected to the backbone of the polymer chain.
The chain packing efficiency is reduced with the formation of side chain branches, which
results in a lowering of polymer density. In cross-linked polymers, adjacent linear chains
are joined to each other at various positions by covalent bonds. The process of cross-
linking is achieved either during synthesis or by a non- reversible chemical reaction that
is usually carried out at an elevated temperature. Polyethylene (PE) is the largest
produced thermoplastic polymer in the world. Ethylene may be polymerized by a number
of processes to produce different varieties of polyethylene. Packaging applications, which
require several performance criteria, dominate the utilization of polyethylene film. In its
simplest form a polyethylene molecule consists of a long backbone of an even number of
covalently linked carbon atoms with a pair of hydrogen atoms attached to each carbon;
chain ends are terminated by methyl groups. This structure is shown schematically in
Figure 1.1. Chemically pure polyethylene resins consist of alkanes with the formula
C2nH4n+2, where ‘n’ is the degree of polymerization, i.e. the number of ethylene
monomers polymerized to form the chain. While the basic structure of polyethylene
molecules, i.e. the repeat unit, is the same in all molecules, they can be assembled
differently; for example, branches can be present in the main chain (called backbone).
There may be short-branches (SCB) (2-6 carbons) or long branches (LCB) (more than 8
carbons) depending on the polymerization process and conditions (e.g. temperature and
pressure). Depending on the branch type and content, different types of polyethylenes

3
are available: (i) low-density polyethylene (LDPE); (ii) high-density polyethylene
(HDPE); (iii) linear low-density polyethylene (LLDPE). Also, ultra high-molecular
weight polyethylene (UHMWPE) exists for special applications.
The first commercial ethylene polymer (1939) was low-density, low-crystalline
(branched) polyethylene (LDPE), which is the largest of the thermoplastics produced in
the world. LDPE is produced by free radical bulk polymerization using traces of oxygen
or peroxide (benzoyl or diethyl) and sometimes hydroperoxide and azo compounds as the
initiator. This results in the production of branched polymer molecules. LDPE is a
partially crystalline solid with melting temperature range of 100 to 120˚C, densities
around 0.910-0.935 g/cm3 with crystallinities of 40-60 %. Branches act as defects, and as
such the level of side chain branching determines the degree of crystallinity, which in
turn affects polymer properties [2-7]. The number of branches in LDPE may be as high as
20 per 1000 carbon atoms. The first and predominant type of branching, which arises
from intermolecular chain transfer, consists of ethyl short-chain alkyl groups such as
ethyl or butyl. The second type of chain branching is produced by intermolecular chain
transfer. This leads to long chain branches that, on the average, may be as long as the
main chain. The physical properties of LDPE depend on three structural factors. These
are the degree of crystallinity (density), molecular weight (MW), and the molecular
weight distribution (MWD). The degree of crystallinity and therefore, density of
polyethylene is dictated primarily by the amount of short-chain branching. In the solid
state, branches and other defects in the regular chain structure limit the crystallinity level.
As the packing of crystalline regions is better than that of noncrystalline regions, the
overall density of a polyethylene resin will increase as the degree of crystallinity rises.
4
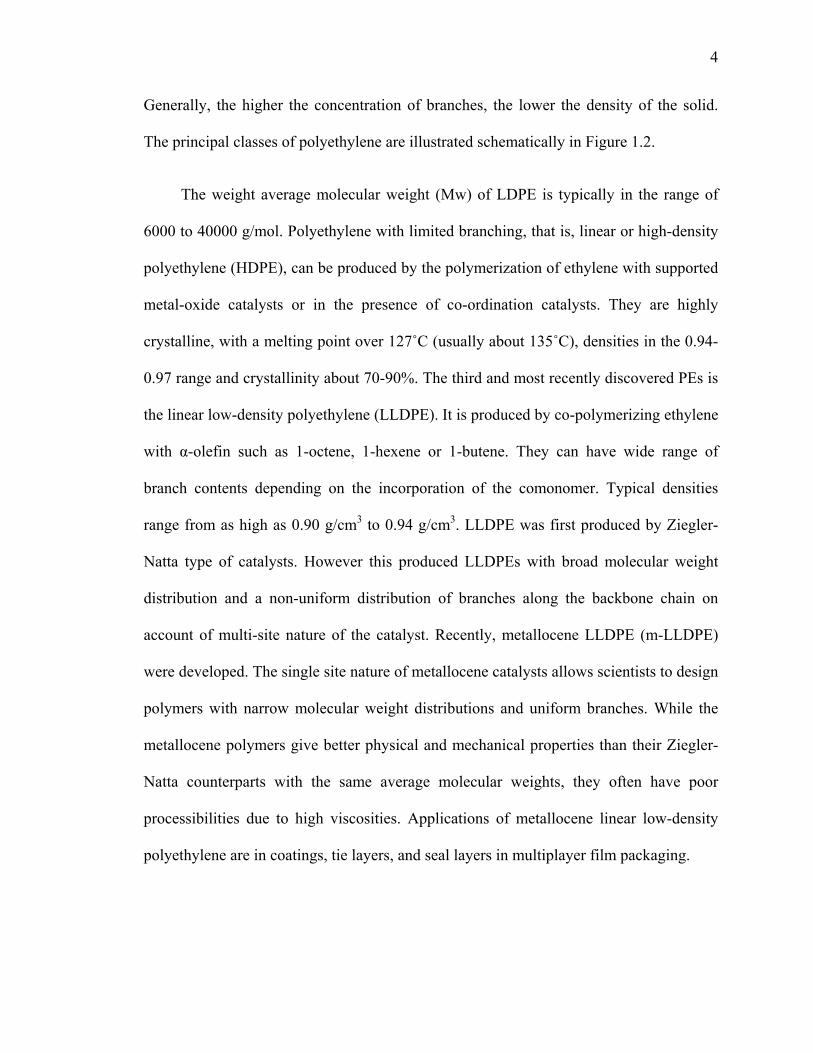
Generally, the higher the concentration of branches, the lower the density of the solid.
The principal classes of polyethylene are illustrated schematically in Figure 1.2.
The weight average molecular weight (Mw) of LDPE is typically in the range of
6000 to 40000 g/mol. Polyethylene with limited branching, that is, linear or high-density
polyethylene (HDPE), can be produced by the polymerization of ethylene with supported
metal-oxide catalysts or in the presence of co-ordination catalysts. They are highly
crystalline, with a melting point over 127˚C (usually about 135˚C), densities in the 0.94-
0.97 range and crystallinity about 70-90%. The third and most recently discovered PEs is
the linear low-density polyethylene (LLDPE). It is produced by co-polymerizing ethylene
with α-olefin such as 1-octene, 1-hexene or 1-butene. They can have wide range of
branch contents depending on the incorporation of the comonomer. Typical densities
range from as high as 0.90 g/cm3 to 0.94 g/cm3. LLDPE was first produced by Ziegler-
Natta type of catalysts. However this produced LLDPEs with broad molecular weight
distribution and a non-uniform distribution of branches along the backbone chain on
account of multi-site nature of the catalyst. Recently, metallocene LLDPE (m-LLDPE)
were developed. The single site nature of metallocene catalysts allows scientists to design
polymers with narrow molecular weight distributions and uniform branches. While the
metallocene polymers give better physical and mechanical properties than their Ziegler-
Natta counterparts with the same average molecular weights, they often have poor
processibilities due to high viscosities. Applications of metallocene linear low-density
polyethylene are in coatings, tie layers, and seal layers in multiplayer film packaging.

5
Figure 1.1: Chemical Structure of pure polyethylene [1]
Figure 1.2: Schematic representations of different classes of polyethylene. (a) High-
density polyethylene (b) Low-density polyethylene (c) Linear low-density
polyethylene [1]

6
PE is a semi-crystalline polymer whose properties are greatly influenced by its
crystallinity and relative amounts of amorphous phases. When grown from melts,
polyethylene molecules crystallize as lamellae where there will be some folding of the
molecules to allow re-entry into the crystallite but some molecules will link or ‘tie’
separate lamellae across amorphous regions which is shown schematically in the Figures
1.3 and 1.4.
The crystalline morphology consists of chain-folded lamellae (Figure 1.5) joined in
supermolecular structures called spherulites (Figure 1.6). In the case of semi-crystalline
polymers, regular crystalline units are linked by unoriented, random-conformation of
chains that constitute amorphous regions (Figure 1.7). The crystalline regions are usually
denser (about 10%) and harder than the amorphous polymer. Schematic representation of
the phases present in the solid polyethylene is clearly illustrated in Figure 1.8. The
presence of crystalline structure has a significant influence on the physical, thermal and
mechanical properties of polymer. The amorphous part provides the flexibility and high
impact strength.
1.2 POLYETHYLENE BLENDS
Polymer blends are of interest for generating mechanical properties that cannot be
obtained from single component materials. This field is driven commercially by the
demand for ever-increasing physical, mechanical, thermal and other properties. Faced
with this situation, there are two general responses. The first would be to synthesize a
new polymer to meet the desired specifications. This approach has two major drawbacks.

7
Figure 1.3: Schematic illustration of a semi-crystalline structure showing lamellae
linked by ‘tie’ molecules through amorphous regions [2]
Figure 1.4: Tie chains and loops in the non-crystalline phases of polyethylene [1]

8
Figure 1.5: Idealized representation of a polyethylene lamella [1]
Figure 1.6: Schematic representation of a spherulite [1]

9
Figure 1.7: Generic illustration of semi crystalline morphology [1]
Figure 1.8: Schematic representations of the phases present in solid polyethylene [1]

10
Firstly, polymer science has yet to reach the state of maturity that allows the design and
synthesis of materials with prescribed properties. The other problem is that the cost of
developing and manufacturing a new polymer from scratch is very high. The second
approach, which is less expensive, is to blend polymers, usually not more than two,
which provide the desired properties.
Polymer blends can be miscible, immiscible or partially miscible. The term
compatible is used to describe polymer blends that have useful practical properties,
regardless of whether they are miscible or immiscible whereas the term miscible is used
to describe polymer blends that have thermodynamic miscibility down to the segmental
level. For the components to be miscible, a necessary, but not sufficient condition is that
Gibbs free energy of mixing, ∆Gmix in the following equation must be negative.
mixmixmix STHG ∆−∆=∆ (1.1)
For polymers, enthalpy of the mixing, ∆Hmix is generally positive. The pair of
polymers is immiscible as the positive ∆Hmix term usually dominates the entropy of
mixing, T∆Smix term.
1.3 CRYSTALLINITY DETERMINATION
The three most popular methods for determining crystallinity are by density
measurements, thermal analysis, and X-ray methods. The different techniques do not give
necessarily the same value for the crystallinity since all three depend on different

11
properties of the pure crystalline polymer and these are often difficult to determine
exactly because of the difficulty in obtaining fully crystalline material.
1.3.1 Density measurements
The density of a semi-crystalline polymer will be between that of a fully crystalline
and amorphous sample. The basis of the density measurement is therefore to measure the
density of sample of interest and compare that with the published densities of fully
crystalline and amorphous samples. Defining ‘ρ’ as the measured density ‘ρa’ as the fully
amorphous density and ‘ρc’ as the fully crystalline density leads to an expression for Wc
the weight fraction degree of crystallinity [2]
)()(
11
11
ac
ac
ac
acW
ρρρρρρ
ρρ
ρρ−−
=−
−= (1.2)
1.3.2 Thermal methods
The thermal method depends on measurements of the heat of fusion ∆H of the
polymer of interest and a comparison of this value with the fully crystalline heat of fusion
∆HC. The weight fraction crystallinity Wc [2] is then given by
cc H
HW∆∆
= (1.3)
The heat of fusion is measured directly from a differential scanning calorimetry
(DSC), which involves heating a sample at a constant heat rate in the range of 5-

12
20°C/min and integrating under the heat flow rate against temperature curve to obtain the
heat of fusion.
1.3.3 X-ray methods
A crystalline sample will produce a sharp pattern with sharp well-defined peaks and
an amorphous sample broad diffraction ‘halos’ centered on the most probable atomic
spacings. The measured pattern is decomposed into amorphous and crystalline
components by comparison with a diffraction pattern taken from a fully amorphous
sample. The fractional crystallinity may be estimated from the expression
total
Atotalc I
IIW
−= (1.4)
Where ‘Wc’ is the fractional crystallinity and ‘IA’ the fully amorphous intensity,
and ‘Itotal’ is the measured sample intensity [2].
1.3.4 Other methods
Infra-red (IR) and Raman Spectroscopy can be adapted to determine crystallinity.
Nuclear Magnetic Spectroscopy (NMR) can in principle be used to measure crystallinity
but is rarely used.
1.4 THERMAL PROPERTIES
Semicrystalline polymers in general differ from most crystalline solids in that they
display a melting range rather than a discrete melting point. The melting range is a
consequence of the inevitable distribution of lamellar thickness in the solid state.

13
1.4.1 Melting Range
Polyethylene undergoes a transition from the semicrystalline to the molten state that
takes place over a temperature range that can span from less than 10°C up to 70°C. As it
passes through this transition the semicrystalline morphology gradually takes on more of
the characteristics of the amorphous state at the expense of the crystalline regions. The
melting range is broad because it consists of a series of overlapping melting points that
correspond to the melting of lamellae of various thicknesses. A dispersion of lamellar
thicknesses is a natural consequence of entanglements and chain branching that divides
chain backbones into a series of discrete crystallizable sequences with a distribution of
lengths. The broadest melting ranges occur in branched samples crystallized during rapid
cooling.
The melting characteristics of polymers are commonly investigated by means of
differential Scanning Caloriemetry (DSC). DSC provides a trace, called a thermogram
that consists of the instantaneous heat capacity of a specimen plotted as a function of
temperature. The greater the volume of crystallites that melt at a given temperature, the
higher the sample’s instantaneous heat capacity. There is an approximately inverse
relationship between the position of the peak maximum and the overall breadth of the
melting peak. Samples with lower molecular weights, lower levels of branching, and
slower crystallization rates tend to have narrower melting distributions and elevated peak
melting temperatures. The normalized area under the peak, which is a measure of degree
of crystallinity, can be approximately correlated with the temperature of the peak
maximum and the sharpness of the melting range.

14
1.4.2 Heat of Fusion
The heat of fusion (∆Hf) of a sample is a measure of the amount of heat that must
be introduced to convert its crystalline fraction to the disordered state. It is thus uniquely
dependent upon the degree of crystallinity of the sample and the theoretical heat of fusion
of a 100% crystalline sample. The heat of fusion (∆H) of 100% crystalline polyethylene
sample has been calculated to be 293.6 J/g.
100% ×∆
∆=
HH
ityCrystallin f
(1.5)
The factors that determine the actual degree of ordering realized, and hence the heat
of fusion, are principally the rate of crystallization and the degree of orientation. The
slower the crystallization process or the higher the degree of orientation, the greater will
be the heat of fusion.
1.5 MECHANICAL PROPERTIES
The mechanical properties of a polyethylene specimen can be defined as those
attributes that involve the physical rearrangement of its component molecules or
distortion of its initial morphology in response to an applied force. The nature of a
specimen’s response to applied stress can be correlated with its morphological and
molecular characteristics; it is these relationships that are emphasized in this work. The
mechanical properties of a specimen are controlled by its processing history within the
limits imposed by its molecular characteristics. The typical mode of polyethylene

15
deformation is one of yielding and necking followed by strain hardening. Localized
yielding is especially noticeable in samples with higher degrees of crystallinity.
The mechanical properties of polyethylene may be divided into two broad
categories :(1) low strain properties such as yield stress and initial modulus and (2) high
strain properties, typified by ultimate tensile strength and strain at break. To a first
approximation, the low strain properties are controlled by sample’s morphological
features and the high strain properties by its molecular characteristics.
1.5.1 Tensile Properties
Tensile properties of polymers are measured on instruments that record the force
required to elongate a sample as a function of applied elongation. It is common to plot the
load as “engineering stress”, that is, the force per unit area based upon the original cross-
section of the specimen as a function versus the engineering strain calculated as the
elongation divided by original gauge length. The polymer chain length and its
distribution are important molecular parameters in controlling the physical, mechanical
and processing characteristics of polymers. Tensile testing of the specimen is carried out
following the ASTM D 638 standard. Stress and strain are sample dependent. The stress
on any element of the sample is equal to the force experienced by the element divided by
its effective cross-sectional area. If the cross-sectional area of the specimen varies along
its length, the stress will vary accordingly, i.e., stress is not necessarily uniform along the
length or across the width of the specimen.
The strain and percent strain for any portion of a specimen are defined as

16
dimension originaldimension original-dimension samplecurrent Strain =
(1.6)
100dimension original
dimension original-dimension samplecurrent strain Percent ×= (1.7)
Most tensile samples start off as a “dogbone” (or dumbbell), the enlarged regions of
which are gripped by the jaws of the tensile tester. Initially the gauge region elongates
homogenously until it reaches a point at which one cross-sectional slice yields
independently of the rest of the specimen. The onset of heterogeneous elongation
corresponds to the yield point. As elongation continues, the incipient neck becomes better
established until it forms a sharply defined region. Upon further elongation the neck
propagates, growing to encompass the entire gauge length. The force required for neck
propagation is essentially invariant, resulting in a “plateau” in the force versus elongation
curve. Subsequent deformation, termed “strain hardening”, is homogenous, with the
necked region elongating uniformly until the sample breaks.
Depending on molecular weight (Mw) and its distribution (MWD), polyethylene
can exist under a variety of formulations, each one with tailored properties for specific
applications. The influence of Mw on mechanical properties is clearly depicted in the
Figure 1.9 [3]. It is also important to note that some polymers may have different failure
modes for different modes of deformation. In general all polymers at temperatures
significantly below their glass transition temperatures (Tg –T >100°C) undergo brittle
fracture. In the region above the brittle fracture regime, but below Tg polymers usually
yield and undergo plastic deformation as the modulus decreases. This is illustrated in the
bump that occurs in the stress-strain curves as shown in the Figure 1.10 [2].

17
Figure 1.9: Effect of molecular weight on the mechanical properties of polymers [3]
Figure 1.10: Schematic of some failure modes of glassy polymers [2]

18
1.5.2 Elastic Modulus
When a polyethylene sample is subjected to external stress there is an initial
deformation prior to yield that is homogenous and is largely recoverable when the stress
is removed. The value of elastic modulus is normally derived from the initial slope of the
stress versus strain plot. The elastic modulus of a sample is a measure of its rigidity; the
higher the modulus, the stiffer the sample. The two most commonly used units are
pounds per square inch (psi) and megapascals (MPa). For the majority of isotropic
samples, the increase of elastic modulus is approximately linear with the degree of
crystallinity.
1.5.3 Yield Phenomena
Yielding occurs in a polyethylene specimen when it ceases to deform
homogenously and starts to deform heterogeneously. Up to the yield point, deformation is
principally elastic, whereas afterwards the sample takes on a permanent set. The nature of
yield point varies greatly with the type of polyethylene examined and the conditions
under which it was crystallized. In linear low density and low-density polyethylene
samples, two distinct maxima may occur in close succession. In other cases an inflection
may be followed by a diffuse maximum. The mechanisms associated with multiple yield
peaks are the subject of speculation but may correspond to the yielding of bimodal
distributions of lamellar populations.

19
The sharpness of the yield peak exhibited during stress versus strain measurements
reflects the distinctness of the neck observed visually. Samples with very low levels of
crystallinity exhibit neither localized necking nor a distinct yield peak. For isotropic
samples the yield stress at room temperature is closely correlated with the degree of
crystallinity and thus with the sample density. The yield stress of a specimen is of great
interest from a practical point of view. In many cases it represents the maximum
permissible load that a sample can withstand while still performing its assigned role.
Once a sample has yielded, its dimensions are irrevocably changed, and it may no longer
meet the requirements for continued service. In cases, where there is a distinct yield
maximum in the stress versus strain curve, the force required to propagate a neck along
the length of a sample is lower than the yield stress. Once such a sample has yielded, it
will continue to elongate unless the applied load is removed.
1.5.4 Ultimate Tensile Stress
The ultimate tensile stress also known as the “tensile strength” of a sample is the
force required to break it divided by its original cross-sectional area. The values of
ultimate strength of low-density polyethylene samples are generally lower than that of
linear low-density polyethylene samples largely because of the higher percent elongation
values obtained for the linear low-density polyethylene samples. Actually, this is the
property that gives LLDPE an advantage over LDPE in blown film packaging
application.

20
1.5.5 Strain at break
This term refers to the strain of the sample at the point of tensile failure. The strain
at break of the polyethylene sample is a function of its molecular nature and its initial
orientation. The molecular characteristics that facilitate drawing are similar to those that
promote the development of high degrees of crystallinity. Features that hinder the
slippage of chains past one another during crystallization also inhibit the drawing
process. The two principal inhibitors to chain movement are entanglements and branch
points. Thus high molecular weight linear polyethylene resins and branched samples have
lower strain at break values than low molecular weight unbranched samples. For ductile
samples at a given molecular weight, the strains at break values fall as their comonomer
content increases. Similarly, for a given comonomer content, the strain at break of ductile
samples falls as the molecular weight increases. The molecular weight corresponding to
the transition between brittle and ductile behavior increases as the comonomer content
increases.
1.6 MICROHARDNESS
Hardness is defined as the resistance of a material against local surface deformation
and it is usually computed as the ratio of indentation load to the projected area of contact
between the indenter and the material in the plane of the deforming surface. The
deformation caused by the indenter involves rearrangement of the initial morphology and
hence depends on structural parameters similar to those involved in the short-range
tensile deformation of polyethylene. The microhardness of a sample is thus strongly

21
correlated with its tensile yield stress and elastic modulus and hence its degree of
crystallinity.
1.6.1 Correlation between microhardness and other physical and mechanical
properties
As in the case of metals, it has been shown that for polymers the microhardness (H)
is linearly related to the plastic stress (σo) with the ratio of H/σo approaching 3 for
crystalline polymers. Figure 1.11 shows data for the microhardness as a function of the
yield stress of polyethylene. The plot inset shows the variation of the ratio H/σo with the
degree of crystallinity. The non-crystalline part in the polymer plays a major role in
providing the elastic response of the material. A power law relation of the form given
below can relate the elastic modulus of polymers to the microhardness.
bEaH = (1.8)
Where ‘a’ and ‘b’ are constants and ‘E’ is the elastic modulus.
The microhardness of the polymers has also been related to the microstructural
parameters. The main factor that determines the hardness of polymers is the distribution
and the amount of crystalline and amorphous phases present in the polymer. The rule of
mixtures may be used to describe the microhardness of polymer with crystalline and
amorphous phases present. According to this rule,
)1( ββ −+= ac HHH (1.9)
Where Hc and Ha are the hardnesses of the crystalline and the amorphous phases
respectively and β is the volume fraction of the crystalline phase.

22
Figure 1.11: Microhardness as a function of yield stress for PE (●) [2]

23
CHAPTER 2
LITERATURE REVIEW
This chapter covers the essentials of work done by different researchers on the
tensile and microhardness properties of metallocene polyethylenes and their blends. First,
the literature survey on metallocene polyethylene is presented in section 2.1. Then the
mechanical and thermal analysis of PE blends is discussed in section 2.2 and their
structure-property relationships in section 2.3. Finally the survey on the characterization
of PE blends is presented in section 2.4. The summary regarding the survey and the
importance of the present study is given at the end of the chapter.
2.1 METALLOCENE POLYETHYLENES
A new family of metallocene polyethylene has an outstanding combination of
processability, toughness and stiffness. These provided an opportunity to downguage and
improved extrusion output in applications where blends of conventional Ziegler- Natta
catalyzed linear low-density polyethylene (ZN-LLDPE) and high-pressure low density
polyethylene (HP-LDPE) were used. The processability of metallocene polyethylene with
their Ziegler- Natta counter parts was compared by Lue and Ching-Tai [8].
24
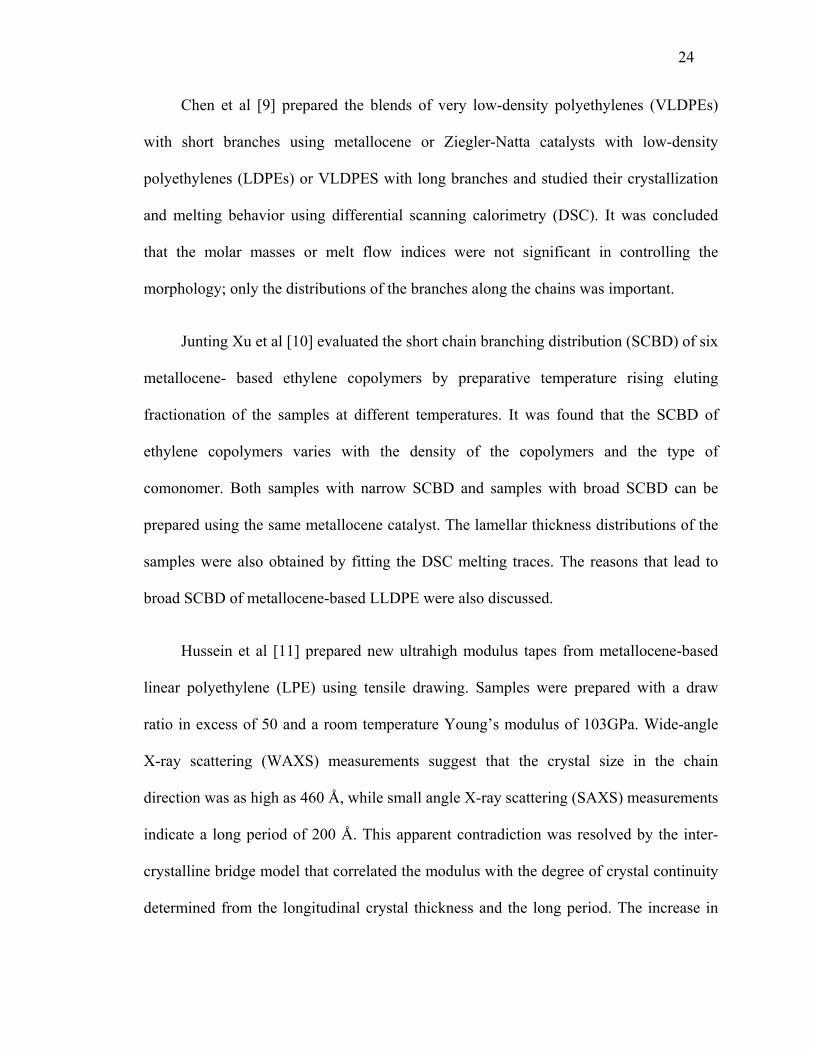
Chen et al [9] prepared the blends of very low-density polyethylenes (VLDPEs)
with short branches using metallocene or Ziegler-Natta catalysts with low-density
polyethylenes (LDPEs) or VLDPES with long branches and studied their crystallization
and melting behavior using differential scanning calorimetry (DSC). It was concluded
that the molar masses or melt flow indices were not significant in controlling the
morphology; only the distributions of the branches along the chains was important.
Junting Xu et al [10] evaluated the short chain branching distribution (SCBD) of six
metallocene- based ethylene copolymers by preparative temperature rising eluting
fractionation of the samples at different temperatures. It was found that the SCBD of
ethylene copolymers varies with the density of the copolymers and the type of
comonomer. Both samples with narrow SCBD and samples with broad SCBD can be
prepared using the same metallocene catalyst. The lamellar thickness distributions of the
samples were also obtained by fitting the DSC melting traces. The reasons that lead to
broad SCBD of metallocene-based LLDPE were also discussed.
Hussein et al [11] prepared new ultrahigh modulus tapes from metallocene-based
linear polyethylene (LPE) using tensile drawing. Samples were prepared with a draw
ratio in excess of 50 and a room temperature Young’s modulus of 103GPa. Wide-angle
X-ray scattering (WAXS) measurements suggest that the crystal size in the chain
direction was as high as 460 Å, while small angle X-ray scattering (SAXS) measurements
indicate a long period of 200 Å. This apparent contradiction was resolved by the inter-
crystalline bridge model that correlated the modulus with the degree of crystal continuity
determined from the longitudinal crystal thickness and the long period. The increase in
25
modulus attributed to an increase in crystallinity and crystal continuity along the draw
direction without any extended chain crystallization.
Beagan and Malleja [12] have investigated the processability and mechanical
performance of metallocene catalyzed polyethylene resins for packaging applications.
Blends and co-extruded structures with metallocene catalyzed polyethylene resins and a
conventional low-density polyethylene were produced. The effect of processing
parameters, resin density, melt flow index, molecular weight, molecular weight
distribution and co-monomer type on the viscosity characteristics and mechanical
properties were investigated. The glass transition temperatures (Tg) of the films were
measured using dynamic mechanical thermal analysis techniques and these Tg’s were
found to be much lower than the conventional linear low-density polyethylenes. The
structural compatibility of the blends was determined using differential scanning
calorimetry and dynamic thermal analysis. All blends were found to be compatible in the
amorphous phase.
Sierra et al [13] studied the effect of metallocene polyethylene on heat-sealing
properties of low-density polyethylene blends. According to various experimental studies
of seal strength, hot tack and DSC, it was concluded that percentages around 15% of
metallocene PE allowed the obtainment of the optimal balance for heat-sealing properties
and cost.
2.2 MECHANICAL AND THERMAL ANALYSIS OF PE BLENDS
Martinez-Salazar and Balta-Calleja [14] have shown microhardness to be a
promising technique for the microstructural investigation of polyblends of known
26
composition and it can provide information on the level of structural investigation.
Solution crystallized mixed polyblends of high density (HD) and low-density (LD) PE
with Mw of 50*103 g/mol have been prepared in various composition ranges. The samples
were crystallized in two modes: a) slow cooling at a rate of 0.2ºC/min; b) quenching to
room temperature. Leitz tester measured the microhardness (MH). Figure 2.1 shows, for
the materials slowly crystallized from the melt (curve A), the linear decrease of hardness
of the linear polymer with increasing concentration of the branched material from
80MNm-2 down to 30MNm-2 for 100% low-density component. The hardness of the
blends measured at higher temperatures showed substantially lower values. The hardness
of the studies PE blends can be explained in terms of a parallel simple additive system of
two independent components H1 and H2 (hardness values of the two independent
components). The hardness of the amorphous turned out to be of the order of 0.5MNm-2
yielding a ratio Hc/Ha of 200(approx.) for melt crystallized linear PE.
Flores et al [15] have explored the correlation between microhardness, MH, tensile
yield stress, Yt, and Young’s modulus, E, on various chain extended polyethylene (PE)
samples and compared to chain folded PE. The tensile yield stress, Yt, was shown to
correlate with hardness following H ≅ 3Yt while H ≅ Et/10 (Et is Young’s modulus
derived from tensile experiments).

27
Figure 2.1: Microhardness of melt crystallized blends of HD and LDPE as a function
of increasing weight concentration of LDPE. Curve A, slowly cooled samples; curve
B material measured at room temp. and B’ material measured at 110°C [14]

28
Rueda and Calleja [16] reported the data covering the physical properties of molten
and solid samples of two binary blends of recycled polyethylene wastes. While some
properties (density, fusion enthalpy) showed a linear behavior with composition. Other
properties (microhardness, yield stress) showed a deviation from linearity. Deviation of
microhardness additivity of the single components has been interpreted, after analysis of
DSC thermograms, as being due to segregation and recombination of molecular species
from both components during crystallization.
Zamfirova and Dimitrova [17] discussed some additional possibilities for
microhardness investigations of polymer materials using a standard Vickers
microhardness device. Two new investigation methods were suggested: determining the
impression size under load; obtaining penetration curves. The role of entanglements on
the microhardness of a series of melt-crystallized samples of linear polyethylene was
investigated by Calleja FJ et al [18]. They concluded that the chain defects are
responsible for the shearing mechanisms. A comprehensive review was presented of
microhardness tests applicable to plastics were presented by John Lopez [19]. The
methods were outlined and the effects of test variables were considered.
Fakirov et al [20] carried out microhardness model studies on branched
polyethylene. Model samples of polyethylene with different degrees of branching (up to
seven side groups, mostly of butyl type, at 100°C) are melt crystallized at two
undercoolings, 10°C and 68°C, in order to obtain samples with various crystalline
structures. The samples are characterized with respect to their density and microhardness
(H).

29
It was emphasized that crystal size reflects rather the effect of crystal perfection. Via the
extrapolation of H the equilibrium microhardness of PE crystals Hc = 160 MPa was
determined. It was demonstrated that the application of the additivity law to
multicomponent and/or multiphase systems was justified only in the case when all
components (phases) have a melting or glass transition temperature above the
temperature at which the H-measurements are carried out. In the case where the system
contains a liquid like component, its contribution to the overall H is by changing the
deformation mechanism and in order to apply the additivity law, H must be expressed as
[20]:
57197.1 −= gTH (2.1)
The effect of temperature on yield energy of polyethylene was studied by
conducting uniaxial tension tests by Bruce Hartman et al [21]. Yield energy was found to
be a linear function of temperature extrapolating to zero at the melting point (140ºC). The
ratio of yield stress to Young’s modulus is 0.021 at room temperature and increases to
0.059 at 117ºC.
Shishesaz and Donatelli [22] studied the tensile properties of binary and ternary
blends of low, medium and high-density polyethylene. The tensile properties of these
materials indicated that the blends formed either compatible or semicompatible mixtures.
Seguela and Reitsch [23] reported the occurrence of double yield in polyethylene.
According to these authors deformation takes place in two stages (i) Slip of crystal blocks
past each other and (ii) Homogenous shear of crystal blocks.

30
Balsamo and Muller [24] studied the rate dependence of double yielding in LDPE,
LLDPE (octane based, melt flow index of 1.0g (10min)-1, Mn=2.0*104 g/mol and
Mw=1.33*105 g/mol [26]) and their blends. The homopolymers and their blends were
compression molded at 190ºC into 0.5mm thick sheets, which were either rapidly or
slowly cooled. Figure 2.2 shows the typical stress-strain curves obtained at a strain rate of
50 mm min-1 for the blends. The arrows in this Figure show the first and second yield
points. The blends were found to be compatible in all of the composition range. Infact the
tensile moduli, yield stresses, yield strains, drawing stress and stress at break followed a
simple rule of mixtures or positive deviations from it.
Yamada et al [25] presented a superstructural description of deformation process in
uniaxial extension of pre-oriented isotactic polypropylene. The strains were separated
over the whole range of deformation into three categories: crystallite boundary slip,
uniform shear deformation of crystallites and restoration of molecular orientation from
the shear-deformed state. Double yields during the tensile deformation of the
polyethylenes and polytetramethylene terephthalate have been studied in a systematic
manner [26-29].
Krishnaswamy and Lamborn [30] have prepared various LLDPE resins that
encompassed those polymerized using Ziegler-Natta, metallocene and chromium oxide
based catalysts. These resins were blown into film at similar process conditions, and the
tensile properties of the resulting films were investigated in relation to the orientation
characteristics.
31
Figure 2.2: Typical stress- strain curves obtained at a strain rate of 50mm min-1 for
the LDPE/LLDPE blends [24]; (a) slowly cooled and (b) rapidly cooled.(1) 100/0, (2)
65/35 (3) 35/65 and (4) 0/100

32
The tensile properties were observed to be significantly different from those of
isotropic/un-oriented polyethylene specimens of similar density. These were explained in
terms of lamellar organization and orientation characteristics of LLDPE blown films.
Investigation of the temperature dependence (between –50ºC to +50ºC) of these tensile
properties indicated an increase in modulus, yield stress and break stress with decreasing
temperature pointing to the possible role played by the decreased mobility of the non-
crystalline phase at lower temperatures.
Jafari et al [31] have prepared morphologically distinct binary polymer blends by
melt mixing of HDPE and various LLDPEs for the entire range of blend composition
under identical processing conditions. The morphology of the tensile fracture surfaces of
blend, the parent polymers and their blends are quite interesting and show good
correlation with thermal and mechanical properties. The HDPE forms linear and
interpenetrating fibrils with a large number of interfibrillar separation, whereas, octane
containing LLDPE (OLLDPE) with almost equal number of branching to that of HDPE
shows nicely formed twisted fibrils. On the other hand, pentene containing LLDPE
(PLLDPE) manifests a straight fibrillar with well-defined boundary comprising many
thin fibrils with alternative thick and thin regimes and perfection, whilst butene
containing LLDPE (BLLDPE) showed thick comparatively smooth and well-defined
imperfect boundary of the tensile fracture.
Cho et al [32] investigated the melt rheology and mechanical properties of
LLDPE/LDPE, LLDPE/HDPE and HDPE/LDPE blends. All three blends were miscible
in the melt, but LLDPE/LDPE and HDPE/LDPE blends exhibited two crystallization and
melting temperatures, indicating that those blends phase separated upon cooling from the
33
melt. The melt strength of the blends increased with increasing molecular weight of
LDPE that was used. The mechanical properties of the LLDPE/LDPE blend were higher
than calculated from a simple rule of mixtures, while those of LLDPE/HDPE blend
conformed to the rule of mixtures, but the properties of HDPE/LDPE were less than that
predicted by the rule of mixtures
Muller et al [33] studied the miscibility of two types of LDPE/LLDPE by DSC.
DSC results suggested that the blends were partially miscible and phase separate in the
melt depending on temperature and blend composition. The blends that contained 25%
LLDPE ( rapidly from the melt) were found to be mechanically compatible, with tensile
properties that conform to a simple rule of mixtures or in some cases to positive
deviations from it, inspite of their two-phase structure.
A study on the mechanical properties of low density and linear low-density
polyethylene blends was carried out by La Mantia and D. Acierno [34]. They have
reported that semicompatible mixtures resulted in the solid state for different investigated
compositions. The mechanical properties of these blends were strongly influenced by
LLDPE > 25 %.
La Mantia et al [35] studied the influence of structure of linear low-density
polyethylene on the rheological and mechanical properties of blends with low-density
polyethylene. They reported that the influence of comonomer was negligible, while the
molecular weight exerted an important effect on properties.Datta and Birley [56]
developed a thermal analysis method for the assessment of LD and HD polyethylene
blends and LLD and HD polyethylene blends. LLDPE/HDPE blends were found to be

34
compatible where as LDPE/HDPE blends were found to be incompatible. These findings
have been supported by X-ray diffraction and mechanical property measurements.
Structure and mechanical properties for the binary blends of a linear low-density
polyethylene (LLDPE) (ethylene-1-hexene copolymer) were studied by Yamaguchi and
Shigehiko [36]. The crystallization temperature of LDPE was higher than that of the
LLDPE and was found to act as a nucleating agent for the crystallization of LLDPE.
Consequently, the melting temperature, degree of crystallinity and hardness of the blend
increased rapidly with increase in LDPE content in the blend.
Liu and Truss [37] studied the thin sheets of isotactic polypropylene and LLDPE
blends by tensile testing, optical microscopy and DSC. Eyrings two-process yielding was
used to analyze the data of yield stress as a function of strain rate and temperature and
satisfactory curve fitting results were obtained.
Wilkes et al [38] studied the influence of molecular weight and thermal history on
the thermal, rheological and mechanical properties of metallocene catalyzed linear
polyethylenes. Several linear polyethylene homopolymers of varied molecular weight (13
≤ Mw≤ 839 kg/mol) were synthesized with a metallocene catalyst and characterized. The
synthetic approach resulted in relatively narrow molecular weight distributions (2.3 ≤
Mw/Mn ≤ 3.6)) as measured by size exclusion chromatography. The small strain tensile
deformation properties, Young’s modulus, yield stress, and yield strain were directly
related to percent crystallinity, independent of molecular weight. The large strain
deformation properties, toughness and strain at break were influenced by the competing
effects of percent crystallinity and molecular weight.

35
A study on thermal characterization of blends of single site linear and branched
polyethylene was carried out by Tanem B.S. and A Stori [39]. They have reported that for
a low content of the linear blend component, even 1.8-mol% comonomer content in the
branched blend component was sufficient to create tow crystal populations during
crystallization. For higher amounts of the linear blend component 2.5-mol% comonomer
resulted in two crystal populations.
Lee et al [40] studied the crystallization behavior and mechanical properties of low-
density polyethylene and metallocene linear low-density polyethylene blends with short
branching content. Smaller 1-octene monomer content in m-LLDPE resulted in higher
crystallization temperature and higher crystallinity of blends. The elastic modulus
exhibited increasing behavior proportional to crystallinity, and the elongation at break of
the blends increased with increasing m-LLDPE composition.
2.3 STRUCTURE-PROPERTY RELATIONSHIP IN PE BLENDS
The influence of structural and morphological factors on the mechanical properties
of the polyethylenes was studied by Popli and Mandelkern [41]. They assessed the force-
length relations at ambient temperature for a set of polyethylenes. They have reported
that partial melting and recrystallisation process played an important role in the different
aspects of deformation process. The influence of molecular weight manifested itself in
the structure of interlamellar zone, which had major influence on the initial modulus and
the ultimate properties. Copolymers and branched polymers displayed quite different
behavior. The most striking difference was the invariance of the ultimate properties with
molecular weight, branching and level of crystallinity. They have reported the occurrence
36
of double yield points at room temperatures for branched and linear low-density
polyethylenes. These authors suggested that the phenomenon arose from a characteristic
feature of the above materials, namely the very broad distribution of crystalline lamellae
thicknesses.
La Mantia et al [35] studied the influence of structure of linear low-density
polyethylene on the rheological and mechanical properties of blends with low-density
polyethylene. They reported that the influence of comonomer was negligible, while the
molecular weight exerted an important effect on properties.
Structure and mechanical properties for the binary blends of a linear low-density
polyethylene (LLDPE) (ethylene-1-hexene copolymer) were studied by Yamaguchi and
Shigehiko [36]. The crystallization temperature of LDPE was higher than that of the
LLDPE and was found to act as a nucleating agent for the crystallization of LLDPE.
Consequently, the melting temperature, degree of crystallinity and hardness of the blend
increased rapidly with increase in LDPE content in the blend.
The force-length relations for a set of linear polyethylene fractions and polymers
having most probable molecular weight distributions, encompassing a wide molecular
weight range, have been investigated by Kennedy et al [42]. The polymers were
crystallized in such a manner as to develop as wide a range as possible in the values of
the independent structural variable that describes the crystalline state. The sharpness of
the transition from a brittle to ductile type deformation was established, as was its
dependence on molecular weight and certain key structural parameters. The ultimate
properties were found to depend only on the weight average molecular weight that

37
indicated the importance of noncrystalline regions. They have reported that different
portions of the stress-strain curves were governed by different structural and molecular
features, indicating the complexity of the process.
Martinez-Salazar et al [43] carried out a combined WAXD and DSC study on
blends on a series of commercial high density and low-density polyethylene samples that
were rapidly crystallized from the melt. The melting curves of the materials are
extensively analyzed and compared to those exhibited by individual components. The
results, besides being indicative of a full compatibility of the two components, allow one
to distinguish between a blend and LDPE having both the same average value of
branching.
A study of the phase behavior of polyethylene blends using micro-Raman imaging
was carried out by Hill et al [44]. Blends were crystallized to produce samples with large
domains that is rich in linear material surrounding by a matrix that are rich in branched
polymer. The micro-Raman imaging showed that the samples remixed to a homogenous
distribution by branch content within the expected time scale, as estimated from the
diffusion constants. However micro-Raman imaging can also be used to detect
crystallinity variations and it reveals a biphasic structure in blends that display a
morphological phase structure when examined in the transmission electron microscope.
Kristiansen et al [45] carried out isothermal crystallization of polyethylene
monitored by insitu NMR and analyzed within the Avrami’ model network. The
crystallization rate as a function of crystallization temperature was derived and the results
discussed within a thermodynamic framework. A slight increase in the molecular
38
correlation times with crystallization time was revealed for both the crystalline and
intermediate phases. In particular, the molecular mobility within the intermediate phase
was found to be approximately four times faster than in crystalline phase.
Hill et al [46] have studied the effect of cooling rate on two homogenously mixed
blends. The crystalline textures of a blend of linear PE with LDPE and blend of
deuterated linear PE with LDPE have been investigated as function of cooling rate from
the melt. DSC, FTIR and transmission electron microscopy have been used to study co-
crystallization and phase segregation. The degree of segregation was found to increase
with decreasing cooling rate. The results support the argument that those rapidly
samples, which contain two crystal types, do so because of phase separation in the melt
and not because of phase separation on crystallization. The composition dependence of β-
transition in ethylene copolymers has been reexamined by Popli and Mandelkern [47].
They showed that this transition was found in homopolymer linear polyethylene, and that
it was a reflection of segmental motions that take place within the interfacial region.
The effect of composition distribution on miscibility and co-crystallization
phenomena in the blends of LDPE with conventional and metallocene based ethylene-
butene copolymers was studied by Junting, Xu et al [48]. Three ethylene butene
copolymers and having different composition distributions were blended with LDPE in a
wide composition range. The blends were rapidly from the melts and co-crystallization
phenomena were investigated by DSC. The obtained results showed that composition
distribution has greater influence on co-crystallization.

39
Weignall et al [49] carried out the investigations of solid-state morphology of
blends of HDPE/LDPE by DSC, SANS (small angle neutron scattering) and SAXS
(small angle X-ray scattering). These tests showed that the blends were homogenous, but
may phase segregate on slow cooling due to structural and melting point differences
between HDPE and LDPE. For high concentrations of HDPE, high rates of crystallization
of the linear component led to the formations of separate stacks of HDPE and LDPE
lamellae. The blend morphology is a strong function of the cooling rate of the samples.
Drummond et al [50] examined the crystallization of series of LDPE and LLDPE
rich blends using DSC. DSC analysis after continuous slow cooling showed a broadening
peak with increasing concentration of LDPE. Melt endotherms following stepwise
crystallization detailed the effect of the addition of LDPE to LLDPE, showing a non-
linear broadening in the melting distribution of lamellae, across the temperature range 80-
140ºC, with increasing concentration of LDPE.
Gupta et al [51] conducted a study on crystallization behavior of HDPE/LLDPE
blend using DSC and X-ray diffraction methods. These blends were prepared by melt
mixing in an extruder in the entire range of blending ratio. Co-crystallization was evident
in the entire range of blend composition, from the single peak character in DSC
crystallization exotherms and melting endotherms and X-ray diffraction peaks. A detailed
analysis of DSC crystallization exotherms revealed a systematic effect of the addition of
LLDPE on nucleation rate and the subsequently developed crystalline morphology.

40
2.4 CHARACTERIZATION OF PE BLENDS
Utracki et al [52] carried out a study on compatibilisation of polymer blends. Most
blends are immiscible and need to be compatibilised. The compatibilisation must (1)
ascertain the optimum degree of dispersion (2) stabilize the morphology against the
possible damage during the subsequent processing stage and (3) secure good interfacial
interactions between phases in the solid state.
Stein et al [53] studied the characterization and properties of PE blends. Melting
and crystallization phenomena in blends of LLDPE (ethylene butene-1 copolymer) with a
conventional low-density branched polyethylene (LDPE) were explored with emphasis
on composition by DSC and light scattering (LS). Two endotherms were evident from
DSC studies for these blends suggesting the formation of separate crystals. Light
scattering studies indicate that the blend system is predominantly volume filled by the
LLDPE component whereby the LDPE component crystallized as a secondary process
within the domain of LLDPE spherulites.
Prasad A [54] has developed an accurate and rapid test scheme to identify the type
and composition of alpha-olefin in LDPE/LLDPE. This technique utilizes DSC and FTIR
techniques. Separate calibrations for butene-1, hexane-1 and octane-1 LLDPEs had been
developed to quantify the blend composition from DSC thermograms where the alpha-
olefin type was successfully identified by FTIR over the entire blend composition range.
Datta and Birley [55] developed a thermal analysis method for the assessment of
LD and HD polyethylene blends and LLD and HD polyethylene blends. LLDPE/HDPE
blends were found to be compatible where as LDPE/HDPE blends were found to be

41
incompatible. These findings have been supported by X-ray diffraction and mechanical
property measurements.
Lee and Denn M [56] employed rheological measurements of PE blends in the melt
and solid state, together with thermal analysis, to infer phase behavior. Partial-miscibility
in the melt was characterized by use of double-reptation model to define the complex
modulus of the continuous phase for input into the emulsion model for the blend; this
approach introduced a new fitting parameter, the fraction of the minor component
contained in the continuous phase. The results on binary systems suggested that the use
of HDPE as a compatibilizer for LLDPE/LDPE blends, apparently creating a fully
miscible ternary system.
Krishnaswamy et al [30] have explored the effects of blending metallocene
catalyzed LLDPE of reasonably differing molecular weights on the performance and
orientation characteristics of blown films. The presence of relatively longer molecules in
a metallocene catalyzed LLDPE resulted in blown films with relatively lower machine
direction (MD) tear resistance, lower impact strength and higher transverse direction
(TD) tear resistance. Morphological investigations of the blend films indicated the
potential significance of microstructural anisotropy on blown film impact performance.
From the literature survey it can be concluded that limited work has been reported
on either tensile or microhardness properties of m-LLDPE/LDPE blends; however, work
related to mechanical properties of pure polyethylene has been studied extensively.
Mechanical properties (tensile and microhardness) of PE blends have not been studied
comprehensively. The influence of branch type and branching distribution of m-LLDPE
42
on the tensile properties of m-LLDPE/LDPE blends have not been reported in literature.
The concept of double yield phenomena in polyethylene has not been comprehensively
studied. The work in this regard is of really great importance in understanding the
deformation characteristics of the tensile samples of m-LLDPE/LDPE blends. Several
important generalizations can be made from this study.
On the basis of literature survey conducted, it can be concluded that a study of
tensile and microhardness properties of m-LLDPE/LDPE blends is an open area of
research and the results of the study will be a useful addition to the existing literature and
will be much beneficial from the practical applications point of view.

43
CHAPTER 3
EXPERIMENTAL PROCEDURE
3.1 MATERIALS CHARACTERISTICS
Exxon Mobil Inc., and Nova Chemical Company supplied all the studied resins in
the form of extruded pellets. The resins were selected with similar molecular weight
(Mw), molecular weight distribution (MWD) and melt flow index (MFI) in order to study
the effect of branch type on the thermal and mechanical properties. GPC and NMR and
thermal analyses of the samples were done to determine the molecular constitution such
as Mw, MWD and branch content. The physical properties of the selected polymers are
listed in Table 3.1.
3.1.1 Preparation of blend samples
In this work, the eight polymers listed in Table 3.1 were studied for preliminary
results. The chosen m-LLDPE polymers differ in branch type with similar branch
content, which facilitated the study of the influence of branch type of m-LLDPE on the
thermal and mechanical properties of m-LLDPE/LDPE blends.

44
Table 3.1 Properties of Resins
Type Mn Mw Mz MWD=
Mw/Mn MI Density CH3/1000C*
LDPE 24.22 100.38 243.10 4.14 1.20 0.923 11.0**
LDPE 17.96 116.81 325.57 6.50 0.75 0.919 N/A
B-LLDPE 33.58 110.66 273.03 3.30 1.00 0.918 N/A
B-LLDPE 55.38 107.95 178.55 1.95 1.20 0.910 14.5
H-LLDPE 57.25 107.78 174.31 1.83 1.20 0.900 18.02
H-LLDPE 47.88 102.38 192.37 2.14 1.20 0.912 14.4
O-LLDPE 47.62 94.67 167.45 1.99 1.10 0.882 32.67
O-LLDPE 44.36 90.44 159.08 2.04 1.10 0.902 16.32
* 13C NMR, ** Total number of short and long branches
45
All the blend samples were prepared by melt-mixing the homopolymers in Haake
Polydrive melt blender as shown in Figure 3.1. The mixing conditions were 190°C, 50
rev/min and 10 min. The blends and as well as ‘pure’ polymers were conditioned in the
presence of adequate amounts of extra antioxidant (AO). 1000 ppm of Antioxidant (50/50
mixture of Irganox 1010 and Irgafos 168) was added to ensure that there is no thermal
degradation in the blends The pure polymers were also subjected to the same procedure.
The investigated compositions, are 0/100, 10/90, 30/70, 50/50, 70/30, 90/10 and 100/0 wt
% of m-LLDPE/LDPE.
3.1.2 Preparation of discs
The specimens differing in thermal history were prepared to study its influence on
mechanical properties. The polymers for this study were one sample of low-density
polyethylene (LDPE) and three samples of metallocene catalyzed linear low-density
polyethylene differing in the branch type (Table 3.1). For each composition, a 9 cm
diameter disc was prepared in a special mold cell mounted on Carver Laboratory Press as
shown in Figure 3.1. After melting the polymer inside the mold, a pressure of 1.5 MPa in
a Carver press was applied. The set of samples were prepared by holding at the pressure
of 1.5 MPa in a Carver press for about 15 min and then down to the room temperature by
water at a cooling rate of about 50°C/min. Then the specimen discs are taken out for
punching.

46
Figure 3.1: Haake Polydrive Melt blender

47
Figure 3.2: Compression mold is being mounted on a hydraulic Carver press

48
3.1.3 Tensile Specimens
Dumb-bell specimens (Figure 3.3) as per ASTM Standard D638 (Type-V) were cut
from these discs prepared for tensile testing. Six samples were punched out from the
prepared disc. All the tensile testing of the prepared samples were carried out according
to ASTM D 638 [61] procedure.
3.2 MECHANICAL TESTING
3.2.1 Tensile Testing Equipment
Stress-strain tests were carried out using an Instron Tensile testing machine model
5567. The controlling limits can be viewed on the digital control panel at any time during
the test along with other test variables (e.g. start and stop of the test, gauge length
adjustment etc.). The photograph of the testing equipment is shown in Figure 3.4. The
machine is equipped with manual gripping system. Any preloading induced during
clamping was adjusted to zero prior to testing by the recalibration of the load cell after
clamping. The Instron Series IX data acquisition, control and analysis software for
material testing was used. A PC, interfaced with the testing frame is required for using
this software.
This software provides position and corresponding load of the test with a constant
position increment till fracture at the ultimate tensile strength, which is logged along the
final position before fracture. The speed of testing for the samples was 125 mm/min
according to ASTM D638 [61]. The gauge length was 2.54 cm.

49
Figure 3.3: Tensile specimen as per ASTM D 638[61]
Figure 3.4: Instron 5567 equipped with Merlin Series IX for tensile testing

50
3.2.2 Microhardness Testing
Microhardness measurements were carried out using Vickers’s Hardness tester
(Figure 3.5) equipped with diamond indentor and a load of 10 gf was applied to obtain
the deformation pattern. All the measurements are averages of at least 5 measurements.
3.3 THERMAL TESTING
3.3.1 DSC Testing Equipment
Mettler DSC822e (Figure 3.6) was used in this work for the thermal analysis of the
prepared samples. Temperature calibration was made with indium. DSC samples were
prepared by cutting small samples from the prepared discs. They were sealed in an
aluminium pan and an empty aluminium pan was used as a reference. The crystalline
melting thermograms were obtained by heating the samples from 20°C to 140°C at a
programmed heating rate of 10°C/min. Crystallization thermograms were obtained by
heating the samples to a temperature of 180˚C and holding there for 10 minutes to
eliminate the thermal history in the prepared samples and then cooling down to the room
temperature at a cooling rate of 10˚C /min under nitrogen atmosphere.

51
Figure 3.5: Vickers Hardness Tester

52
Figure 3.6: Mettler DSC 822e Equipment

53
CHAPTER 4
EXPERIMENTAL RESULTS
4.1 INTRODUCTION
4.2 THERMAL ANALYSIS
The thermal analyses of all samples were conducted using the Mettler DSC822e.
The DSC instrument was calibrated with indium. The temperature and the heat of fusion
calibration have been checked at each start up of the instrument to ensure the accuracy of
the results. The crystalline melting thermograms were obtained by heating the samples
from 20°C to 140°C at a heating rate of 10°C/min.
4.2.1 DSC Scans of Pure Samples
DSC melting thermograms for all four polymers are shown in Figure 4.1. The
results of average DSC scans are summarized in Table 4.1. It is clear that the melting
peaks of all the m-LLDPE samples are lower than that of the LDPE. DSC scans of LDPE
and B-LLDPE reveal narrow melting behavior with peaks at 111°C and 107°C,
respectively; whereas, H-LLDPE and O-LLDPE show a relatively broader melting
behavior with peaks at 108°C and 98°C, respectively.
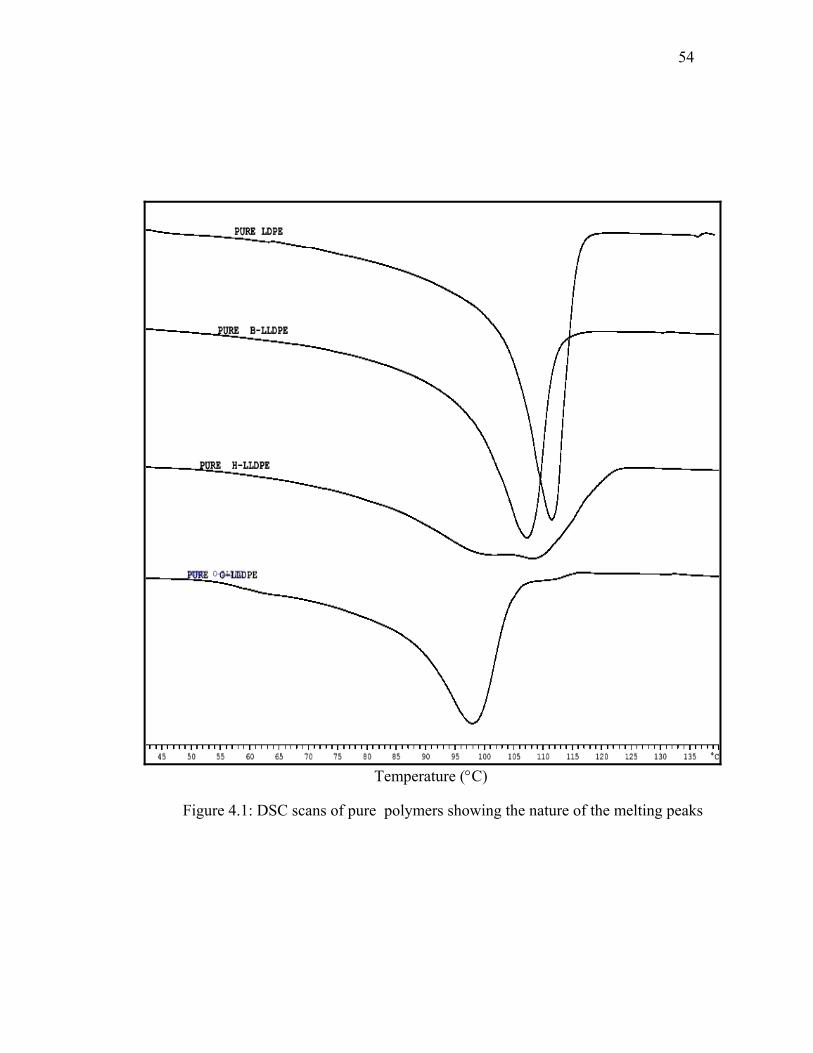
54
Temperature (°C)
Figure 4.1: DSC scans of pure polymers showing the nature of the melting peaks

55
Table 4.1 Thermal characterization data of pure polymers
POLYMER PEAK MELTING
TEMP, °C
ENDSET
MELTING TEMP,
°C
PERCENT
CRYSTALLINITY
LDPE 111 118 37
B-LLDPE 108 115 30
H-LLDPE 109 123 29
O-LLDPE 98 108 27

56
In addition, the DSC scan of H-LLDPE shows the existence of two broad melting
peaks at 99°C and 108°C. For the B-LLDPE, it is obvious that only a single melting peak
is observed. Figure 4.1 shows DSC melting thermogram for O-LLDPE. A similar
behavior in the melting peaks as that of the B-LLDPE is observed. When comparing the
crystallinity values of pure B-LLDPE to that of O-LLDPE, it is evident that the latter has
lower amount of crystallinity. It is also observed that the pure H-LLDPE shows a melting
behavior intermediate between pure B-LLDPE and O-LLDPE.
4.2.2 DSC scans of B-type blends
DSC melting thermograms for all the B-type blend systems are shown in Figure
4.2. It is clear that the melting peak of the B-LLDPE sample is lower than that of the
LDPE. It is obvious that only a single melting peak is observed in each blend;
irrespective of blend composition. The thermal characterization data for all the blend
ratios is reported in Table 4.2. It can be seen that there is a slight increase in the percent
crystallinity values of the blend samples with the increase of LDPE content. There is an
improvement in the melting peaks with the addition of LDPE for the blends.
4.2.3 DSC Scans of O-type blends
Figure 4.3 shows DSC melting thermograms for O-type blends. A similar behavior
in the melting peaks to that of the B-type is observed. The thermal characterization data
for all the blend ratios is reported in Table 4.3.

57
Temperature (°C)
Figure 4.2: DSC scans of B-type blends showing the nature of melting peaks at
different blend ratios
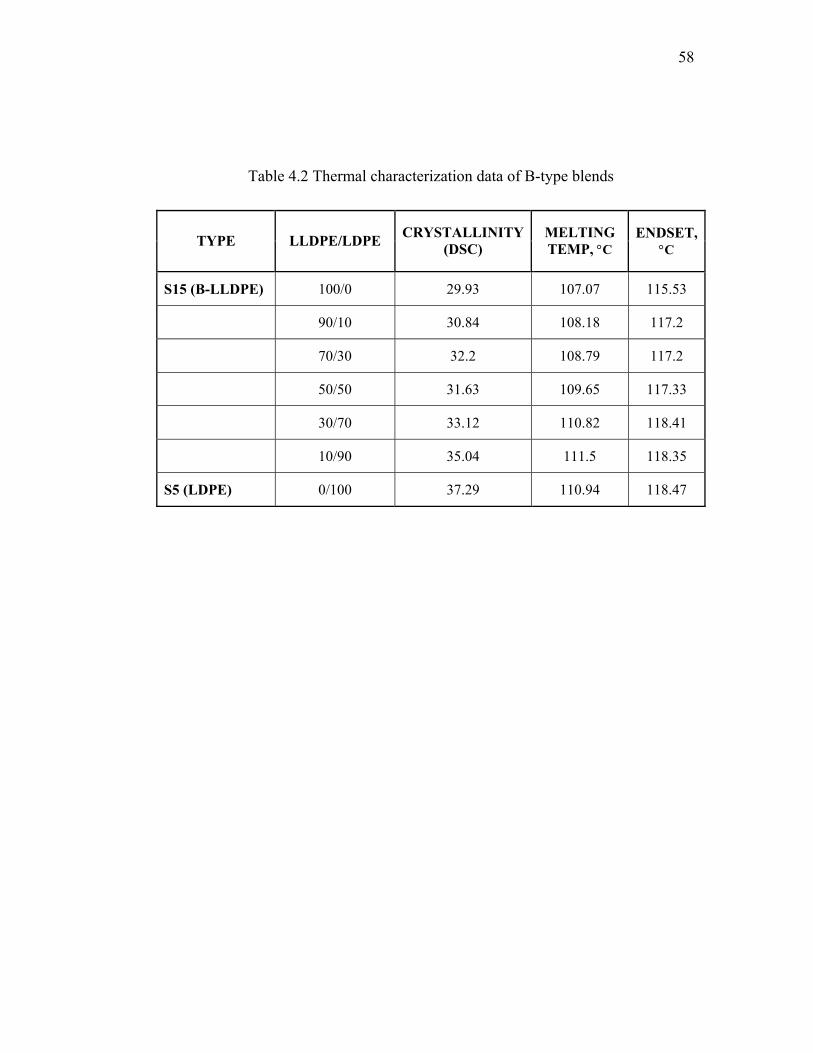
58
Table 4.2 Thermal characterization data of B-type blends
TYPE LLDPE/LDPE CRYSTALLINITY (DSC)
MELTING TEMP, °C
ENDSET, °C
S15 (B-LLDPE) 100/0 29.93 107.07 115.53
90/10 30.84 108.18 117.2
70/30 32.2 108.79 117.2
50/50 31.63 109.65 117.33
30/70 33.12 110.82 118.41
10/90 35.04 111.5 118.35
S5 (LDPE) 0/100 37.29 110.94 118.47

59
Temperature (°C)
Figure 4.3: DSC scans of O-type blends showing the nature of melting peaks
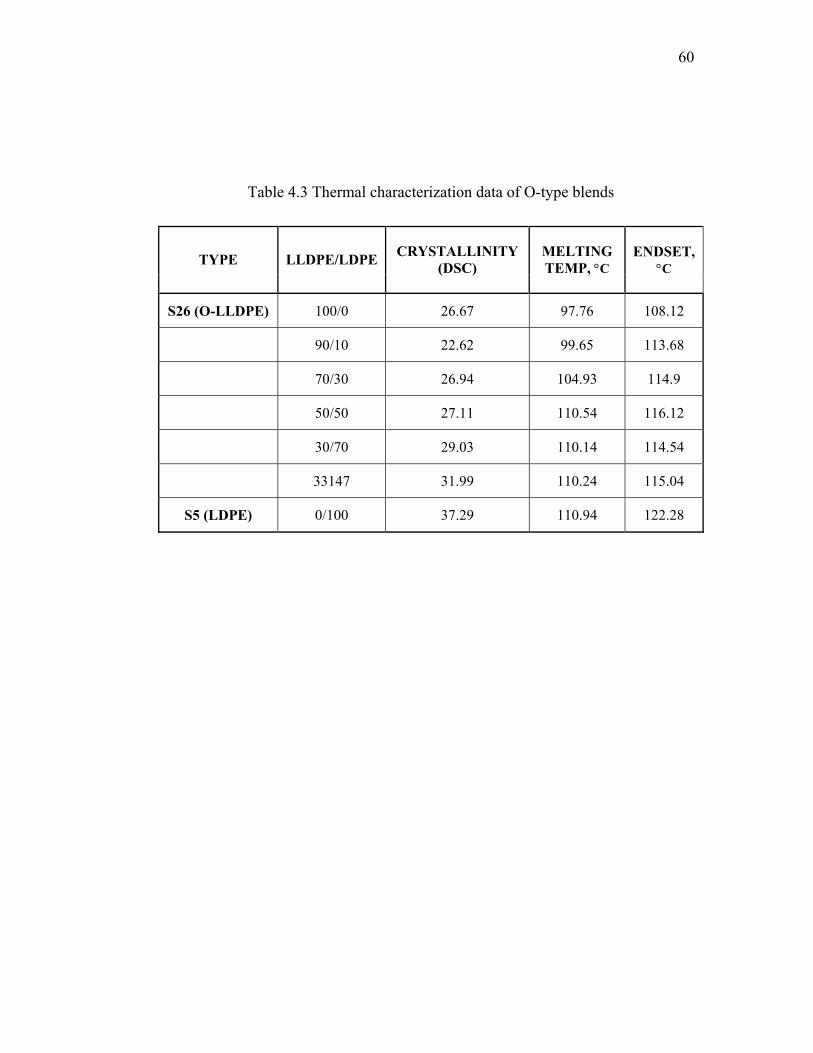
60
Table 4.3 Thermal characterization data of O-type blends
TYPE LLDPE/LDPE CRYSTALLINITY (DSC)
MELTING TEMP, °C
ENDSET, °C
S26 (O-LLDPE) 100/0 26.67 97.76 108.12
90/10 22.62 99.65 113.68
70/30 26.94 104.93 114.9
50/50 27.11 110.54 116.12
30/70 29.03 110.14 114.54
33147 31.99 110.24 115.04
S5 (LDPE) 0/100 37.29 110.94 122.28

61
4.2.4 DSC Scans of H-type Blends
DSC scans of H-type blends are presented in Figure 4.4. According to this figure,
pure H-LLDPE shows broad melting behavior with two shallow peaks at 99°C and
108°C. The DSC scans also reveal that the two peaks merge into a single higher value
melting peak when LDPE content is greater than 10% in the blend. With the increase in
LDPE composition of the blend, it is found that the broad shallow peaks in H-LLDPE
tend to become quite narrow in nature and the peak is shifted towards the higher value.
The thermal characterization data for all the blend ratios is reported in Table 4.4.
4.3 TENSILE RESULTS
All the mechanical property measurements were carried out ASTM D638 [61]
procedure. The yield point is defined as the point where, for a slight increase in strain
there is no change in the value of stress or the highest point on the stress-strain curve
before necking. The value of stress corresponding to the yield point is taken as the yield
stress of the polymer sample. The initial modulus of the sample is calculated from the
slope of the linear portion of the stress-strain curve. To ensure the accuracy of this
measurement, a trend line is drawn using the linear regression fit. The slope of this line is
taken as the initial modulus of the polymer sample. The speed of testing for all the
samples was 125 mm/min. The gauge length was 25.4 mm and all the results averages of
at least 4 measurements.

62
Temperature (°C)
Figure 4.4: DSC scans of H-type blends showing the nature of melting peaks
Table 4.4 Thermal characterization data of H-type blends
TYPE LLDPE/LDPE CRYSTALLINITY (DSC)
MELTING TEMP, °C
ENDSET, °C
S18 (H-LLDPE) 100/0 28.54 108.46 122.85
90/10 28.92 107.99 122.44
70/30 27.26 108.33 122.46
50/50 29.7 108.55 121.36
30/70 32.15 110.51 120.67
10/90 31.31 116.83 119.21
S5 (LDPE) 0/100 37.29 110.94 118.47

63
4.3.1 Pure Samples
We use engineering stress, σ and engineering strain, ε. Yield stress, σy, is defined
as the value obtained at the point where a distinct yield onset is observed. Stress-strain
curves for all the samples are reported in Figures 4.5-4.8. The characterization data for
the samples is reported in Table 4.5.
All the studied polymers display ductile behavior. The discussion regarding the
occurrence of double yield points and the explanation concerning it is dealt in the next
chapter. The summary of tensile results for all the samples is reported in Table 4.6.
4.4 EFFECT OF THE BRANCH TYPE OF M-LLDPE
It is important to investigate the influence of branch type of LLDPE on the thermal
and mechanical properties of m-LLDPE/LDPE blends. The selected polymers for this
study are: 1) low-density polyethylene (LDPE); 2) metallocene linear low-density
polyethylene (m-LLDPE) containing butene branches; 3) m-LLDPE containing hexene;
and 4) m-LLDPE containing octene branches. Hereby we designate the three blend
systems as B-type (B-LLDPE/LDPE), H-Type (H-LLDPE/LDPE) and O-type (O-
LLDPE/LDPE).
4.4.1 B Type Blend System (B-LLDPE/LDPE)
Stress-strain curves for all the pure cooled samples are reported in Figures 4.9-4.13
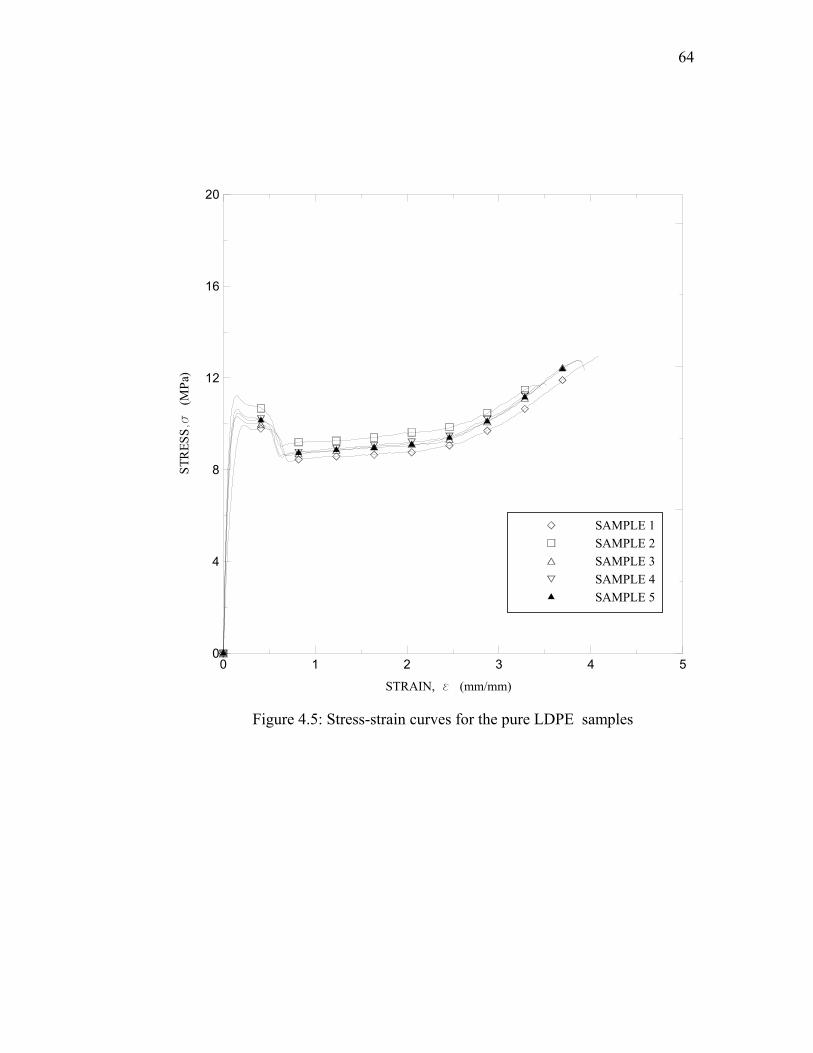
64
0 1 2 3 4 5
STRAIN, e (mm/mm)
0
4
8
12
16
20ST
RES
S,s
(MPa
)
SAMPLE 1SAMPLE 2SAMPLE 3SAMPLE 4SAMPLE 5
Figure 4.5: Stress-strain curves for the pure LDPE samples

65
0 2 4 6 8
STRAIN, e
0
10
20
30ST
RES
S, s
(MPa
)
SAMPLE 1SAMPLE 2SAMPLE 3SAMPLE 4SAMPLE 5
Figure 4.6: Stress-strain curves for the pure B-LLDPE samples

66
0 2 4 6 8
STRAIN, e
0
10
20
30
40ST
RES
S, s
(MPa
)
SAMPLE 1SAMPLE 2SAMPLE 3SAMPLE 4SAMPLE 5
Figure 4.7: Stress-strain curves for the pure H-LLDPE samples
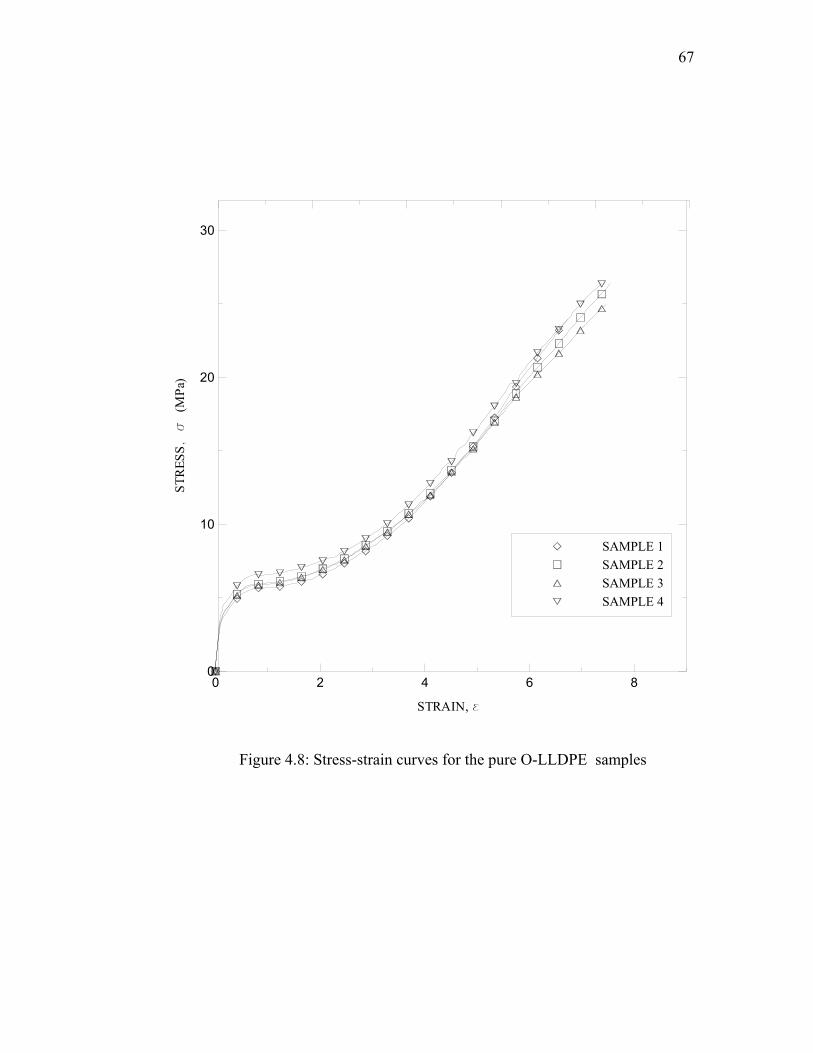
67
0 2 4 6 8
STRAIN, e
0
10
20
30
STR
ESS, s
(MPa
)
SAMPLE 1SAMPLE 2SAMPLE 3SAMPLE 4
Figure 4.8: Stress-strain curves for the pure O-LLDPE samples
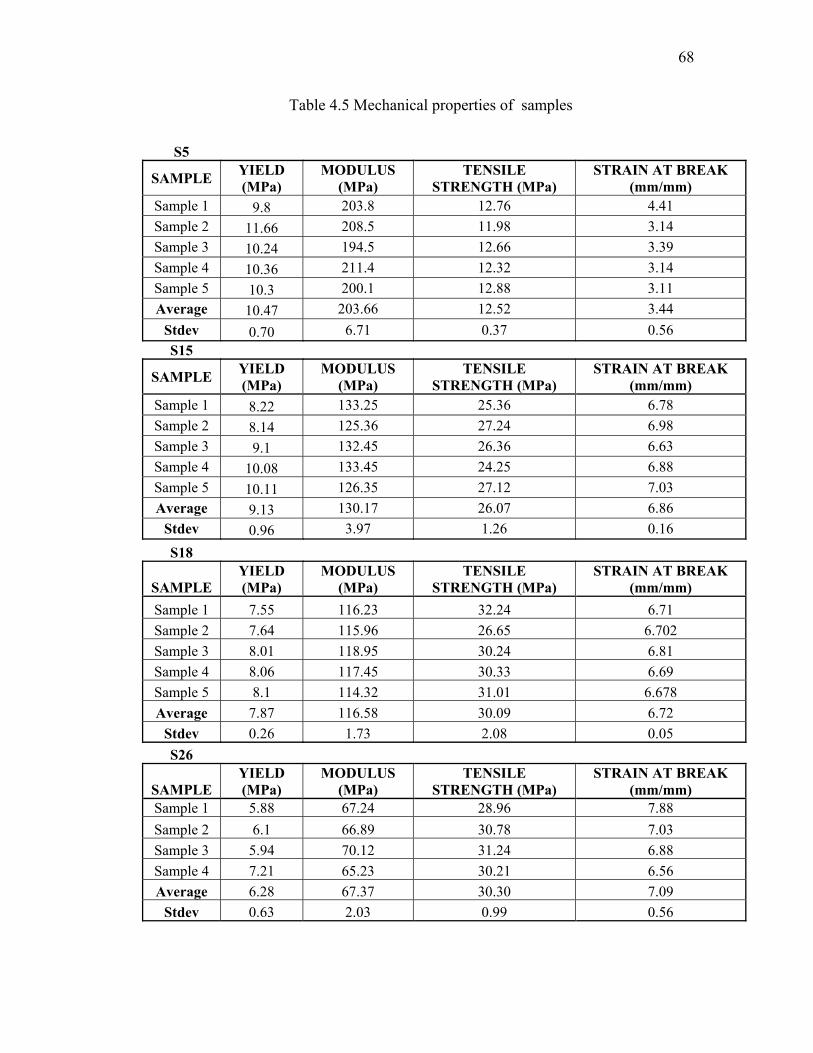
68
Table 4.5 Mechanical properties of samples
S5
SAMPLE YIELD (MPa)
MODULUS (MPa)
TENSILE STRENGTH (MPa)
STRAIN AT BREAK (mm/mm)
Sample 1 9.8 203.8 12.76 4.41 Sample 2 11.66 208.5 11.98 3.14 Sample 3 10.24 194.5 12.66 3.39 Sample 4 10.36 211.4 12.32 3.14 Sample 5 10.3 200.1 12.88 3.11 Average 10.47 203.66 12.52 3.44
Stdev 0.70 6.71 0.37 0.56 S15
SAMPLE YIELD (MPa)
MODULUS (MPa)
TENSILE STRENGTH (MPa)
STRAIN AT BREAK (mm/mm)
Sample 1 8.22 133.25 25.36 6.78 Sample 2 8.14 125.36 27.24 6.98 Sample 3 9.1 132.45 26.36 6.63 Sample 4 10.08 133.45 24.25 6.88 Sample 5 10.11 126.35 27.12 7.03 Average 9.13 130.17 26.07 6.86
Stdev 0.96 3.97 1.26 0.16
S18
SAMPLE YIELD (MPa)
MODULUS (MPa)
TENSILE STRENGTH (MPa)
STRAIN AT BREAK (mm/mm)
Sample 1 7.55 116.23 32.24 6.71 Sample 2 7.64 115.96 26.65 6.702 Sample 3 8.01 118.95 30.24 6.81 Sample 4 8.06 117.45 30.33 6.69 Sample 5 8.1 114.32 31.01 6.678 Average 7.87 116.58 30.09 6.72
Stdev 0.26 1.73 2.08 0.05 S26
SAMPLE YIELD (MPa)
MODULUS (MPa)
TENSILE STRENGTH (MPa)
STRAIN AT BREAK (mm/mm)
Sample 1 5.88 67.24 28.96 7.88 Sample 2 6.1 66.89 30.78 7.03 Sample 3 5.94 70.12 31.24 6.88 Sample 4 7.21 65.23 30.21 6.56 Average 6.28 67.37 30.30 7.09
Stdev 0.63 2.03 0.99 0.56

69
Table 4.6 Summary of the mechanical properties of the samples
POLYMER INITIAL
MODULUS (MPa)
YIELD STRESS (MPa)
TENSILE STRENGTH
(MPa)
STRAIN AT BREAK
(mm/mm)
LDPE 203 10.5 12.5 3.4
B-LLDPE 130 9.1 26.0 6.8
H-LLDPE 117 7.9 30.0 6.7
O-LLDPE 68 6.3 30.0 7.0

70
0 1 2 3 4 5
STRAIN, e
0
4
8
12
16
STR
ESS,s
(MPa
)
SAMPLE 1SAMPLE 2SAMPLE 3SAMPLE 4
Figure 4.9: Stress-strain curves for 10/90 blends (B-LLDPE/LDPE)

71
0 2 4
STRAIN, e
0
4
8
12
16
STR
ESS,s
(MPa
)
SAMPLE 1SAMPLE 2SAMPLE 3SAMPLE 4SAMPLE 5
Figure 4.10: Stress-strain curves for 30/70 blends (B-LLDPE/LDPE)
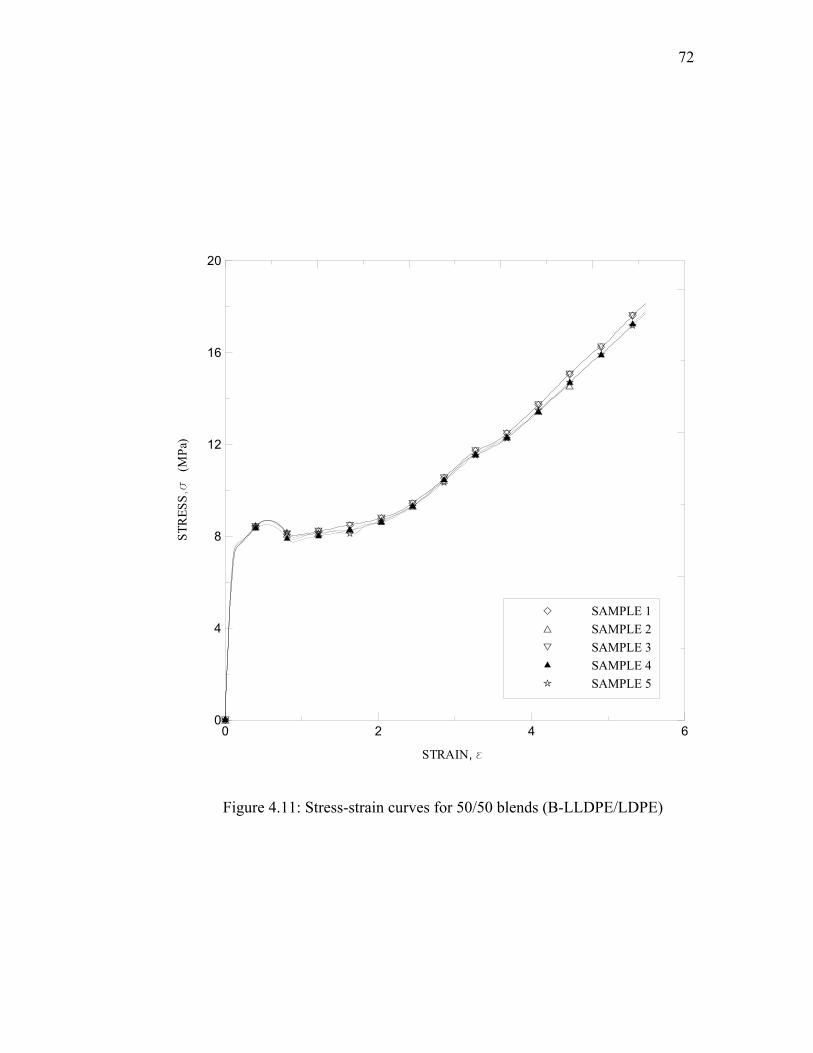
72
0 2 4 6
STRAIN, e
0
4
8
12
16
20
STR
ESS,s
(MPa
)
SAMPLE 1SAMPLE 2SAMPLE 3SAMPLE 4SAMPLE 5
Figure 4.11: Stress-strain curves for 50/50 blends (B-LLDPE/LDPE)

73
0 2 4 6
STRAIN, e
0
10
20
30
STR
ESS,s
(MPa
)
SAMPLE 1SAMPLE 2SAMPLE 3SAMPLE 4SAMPLE 5
B-Type (70/30) Testing Speed = 125 mm/minTemperature = 25 °C
Figure 4.12: Stress-strain curves for 70/30 blends (B-LLDPE/LDPE)

74
0 2 4 6
STRAIN, e
0
10
20
30ST
RES
S,s
(MPa
)
SAMPLE 1SAMPLE 2SAMPLE 3SAMPLE 4
Figure 4.13: Stress-strain curves for 90/10 blends (B-LLDPE/LDPE)

75
Tensile results of the B-type samples are reported in Tables 4.7 and 4.8. The
summary of the tensile results for B-type blends is reported in Table 4.9.
4.4.2 H-type Blend System (H-LLDPE/LDPE)
Stress-strain curves for all the H-type blend samples are reported in Figures 4.14-
4.18. The tensile results for the H-type blend samples are reported in Tables 4.10 and
4.11. The large-scale deformation properties like ultimate stress and strain at break are
higher for m-LLDPE compared to pure LDPE. The summary of the mechanical
properties is reported in Table 4.12.
4.4.3 O-type Blend System (O-LLDPE/LDPE)
Stress-strain curves for all the O-type blend samples are reported in Figures 4.19-
4.23. All the studied polymers display ductile behavior accompanied with the neck
formation at the yield point. The tensile results of the blend samples are reported in
Tables 4.13 and 4.14. The summary of the tensile results for the blends is reported in
Table 4.15.
4.5 MICROHARDNESS RESULTS
Vicker’s hardness tester is used for the microhardness measurement of the samples.
The results are presented in terms of Vickers hardness number (VHN). A pyramidal
diamond indenter with an included angle of 136° has been used.

76
Table 4.7 Mechanical properties of B-type blends
90/10 B-LLDPE/LDPE
SAMPLE YIELD (MPa)
MODULUS (MPa)
TENSILE STRENGTH (MPa)
STRAIN AT BREAK (mm/mm)
Sample 1 8.24 132.04 24.65 6.88
Sample 2 8.12 129.568 25.13 6.91
Sample 3 8.11 127.568 25.62 6.85
Sample 4 8.1 132.45 24.31 6.78
Average 8.14 130.41 24.93 6.86
Stdev 0.07 2.28 0.57 0.06
70/30
SAMPLE YIELD (MPa)
MODULUS (MPa)
TENSILE STRENGTH (MPa)
STRAIN AT BREAK (mm/mm)
Sample 1 8.41 150.26 23.4 6.31
Sample 2 8.32 162.34 24.13 6.24
Sample 3 8.38 150.12 23.14 6.28
Sample 4 8.36 148.9 20.36 6.55
Sample 5 8.3 146.31 21.44 6.18
Average 8.35 151.59 22.49 6.31
Stdev 0.04 6.22 1.55 0.14
50/50
SAMPLE YIELD (MPa)
MODULUS (MPa)
TENSILE STRENGTH (MPa)
STRAIN AT BREAK (mm/mm)
Sample 1 8.61 145.12 18.1 5.51
Sample 2 8.54 140.2 17.8 5.56
Sample 3 8.48 142.65 17.4 5.44
Sample 4 8.46 141.66 17.56 5.41
Sample 5 8.41 143.12 16.63 5.39
Average 8.50 142.55 17.50 5.46
Stdev 0.08 1.82 0.55 0.07

77
Table 4.8 Mechanical properties of B-type blends
30/70 B-LLDPE/LDPE
SAMPLE YIELD (MPa)
MODULUS
(MPa)
TENSILE STRENGTH
(MPa)
STRAIN AT BREAK
Sample 1 8.55 172.35 15.87 5.41
Sample 2 9.21 174.41 16.25 5.51
Sample 3 8.54 170.16 15.01 5.4
Sample 4 8.56 171.33 15.6 5.31
Sample 5 8.5 170.021 16.1 5.48
Average 8.67 171.65 15.77 5.42
Stdev 0.30 1.81 0.49 0.08
10/90 B-LLDPE/LDPE
SAMPLE YIELD
(MPa)
MODULUS
(MPa)
TENSILE
STRENGTH
(MPa)
STRAIN AT BREAK
Sample 1 9.1 184.5 14 5.11
Sample 2 9.12 184.23 14.5 5.16
Sample 3 9.14 181.14 13.94 5.18
Sample 4 9.21 186.31 13.85 5.13
Average 9.14 184.05 14.07 5.15
Stdev 0.06 2.62 0.08 0.04

78
Table 4.9 Summary of the mechanical properties of B-type blends
POLYMER INITIAL
MODULUS, MPa
YIELD STRESS,
MPa
TENSILE STRENGTH,
MPa
STRAIN AT BREAK, mm/mm
B-LLDPE 130 9.13 26.0 6.8
10/90 131 8.14 24.9 6.8
30/70 152 8.35 22.5 6.3
50/50 143 8.50 17.5 5.4
70/30 172 8.67 15.7 5.42
90/10 184 9.14 14.07 5.14
LDPE 203 10.47 12.52 3.44

79
0 1 2 3 4
STRAIN, e
0
4
8
12
16
STR
ESS,s
(MPa
)
SAMPLE 1SAMPLE 2SAMPLE 3SAMPLE 4
Figure 4.14: Stress-strain curves for 10/90 blends (H-LLDPE/LDPE)

80
0 2 4 6
STRAIN, e
0
10
20
STR
ESS,s
(MPa
)
SAMPLE 1SAMPLE 2SAMPLE 3SAMPLE 4
Figure 4.15: Stress-strain curves for 30/70 blends (H-LLDPE/LDPE)

81
0 2 4 6
STRAIN, e
0
10
20
30
STR
ESS,s
(MPa
)
SAMPLE 1SAMPLE 2SAMPLE 3SAMPLE 4
Figure 4.16: Stress-strain curves for 50/50 blends (H-LLDPE/LDPE)

82
0 2 4 6
STRAIN, e
0
10
20
30
STR
ESS,s
(MPa
)
SAMPLE 1SAMPLE 2SAMPLE 3SAMPLE 4
Figure 4.17: Stress-strain curves for 70/30 blends (H-LLDPE/LDPE)

83
0 2 4 6
STRAIN, e
0
10
20
30
STR
ESS,s
(MPa
)
SAMPLE 1SAMPLE 2SAMPLE 3SAMPLE 4
Figure 4.18: Stress-strain curves for 90/10 blends (H-LLDPE/LDPE)

84
Table 4.10 Mechanical properties of H-type blends
H-LLDPE/LDPE 90/10
SAMPLE YIELD (MPa)
MODULUS (MPa)
TENSILE STRENGTH
(MPa)
STRAIN AT BREAK
(mm/mm)
Sample 1 9.11 125.64 30.1 6.55
Sample 2 9 122.21 28.86 6.51
Sample 3 8.94 126.12 28.44 6.62
Sample 4 7.88 125 27.11 6.58
Average 8.73 124.74 28.63 6.57
Stdev 0.57 1.75 1.23 0.05
70/30
SAMPLE YIELD (MPa)
MODULUS (MPa)
TENSILE STRENGTH
(MPa)
STRAIN AT BREAK
(mm/mm)
Sample 1 9.11 160.12 26.1 6.55
Sample 2 9.14 164.25 26.65 6.61
Sample 3 9.1 161.24 24.5 6.64
Sample 4 9.2 163.36 24.98 6.51
Average 9.14 162.24 25.56 6.58 Stdev 0.05 1.90 0.99 0.06
50/50
SAMPLE YIELD (MPa)
MODULUS (MPa)
TENSILE STRENGTH
(MPa)
STRAIN AT BREAK
(mm/mm)
Sample 1 9.14 168.23 24.1 6.51
Sample 2 8.89 169.21 25.32 6.48
Sample 3 8.96 165.48 22.46 6.36
Sample 4 8.24 166.23 23.64 6.4
Average 8.81 167.29 23.88 6.44 Stdev 0.39 1.73 1.18 0.07

85
Table 4.11 Mechanical properties of H-type blends
30/70
SAMPLE YIELD (MPa)
MODULUS (MPa)
TENSILE STRENGTH
(MPa)
STRAIN AT BREAK (mm/mm)
Sample 1 10.08 162.5 22.31 6 Sample 2 9.88 164.32 20.34 6.1 Sample 3 9.94 166.31 21.34 5.89 Sample 4 9.82 167.81 21.14 5.94 Average 9.93 165.24 21.28 5.98
Stdev 0.11 2.32 0.81 0.09 10/90
SAMPLE YIELD (MPa)
MODULUS (MPa)
TENSILE STRENGTH
(MPa)
STRAIN AT BREAK (mm/mm)
Sample 1 10.24 166.45 14.5 4.41 Sample 2 9.98 168.27 12.99 4.11 Sample 3 9.68 167.31 12.54 4.31 Sample 4 9.78 169.01 13.1 4.38 Average 9.92 167.76 13.28 4.30
Stdev 0.15 0.85 0.30 0.14
Table 4.12 Summary of the mechanical properties of H-type blends
POLYMER MODULUS, MPa
YIELD STRESS,
MPa
TENSILE STRENGTH,
MPa
STRAIN AT BREAK, mm/mm
H-LLDPE 117 7.87 30 6.7
10/90 125 8.73 28.62 6.565
30/70 162 9.14 25.46 6.56
50/50 167 8.81 23.7 6.43
70/30 165 9.93 21.2 5.96
90/10 168 9.92 13.28 4.3
LDPE 203 10.47 12.52 3.44

86
0 1 2 3 4
STRAIN, e
0
4
8
12
16
20
STR
ESS,s
(MPa
)
SAMPLE 1SAMPLE 2SAMPLE 3SAMPLE 4
Figure 4.19: Stress-strain curves for 10/90 blends (O-LLDPE/LDPE)

87
0 2 4 6 8
STRAIN, e
0
5
10
15
20
25
STR
ESS,s
(MPa
)
SAMPLE 1SAMPLE 2SAMPLE 3SAMPLE 4
Figure 4.20: Stress-strain curves for 30/70 blends (O-LLDPE/LDPE)

88
0 2 4 6
STRAIN, e
0
10
20
STR
ESS,s
(MPa
)
SAMPLE 1SAMPLE 2SAMPLE 3SAMPLE 4SAMPLE 5
Figure 4.21: Stress-strain curves for 50/50 blends (O-LLDPE/LDPE)

89
0 2 4 6 8
STRAIN, e
0
10
20
30ST
RES
S,s
(MPa
)
SAMPLE 1SAMPLE 2SAMPLE 3SAMPLE 4SAMPLE 5
Figure 4.22: Stress-strain curves for 70/30 blends (O-LLDPE/LDPE)
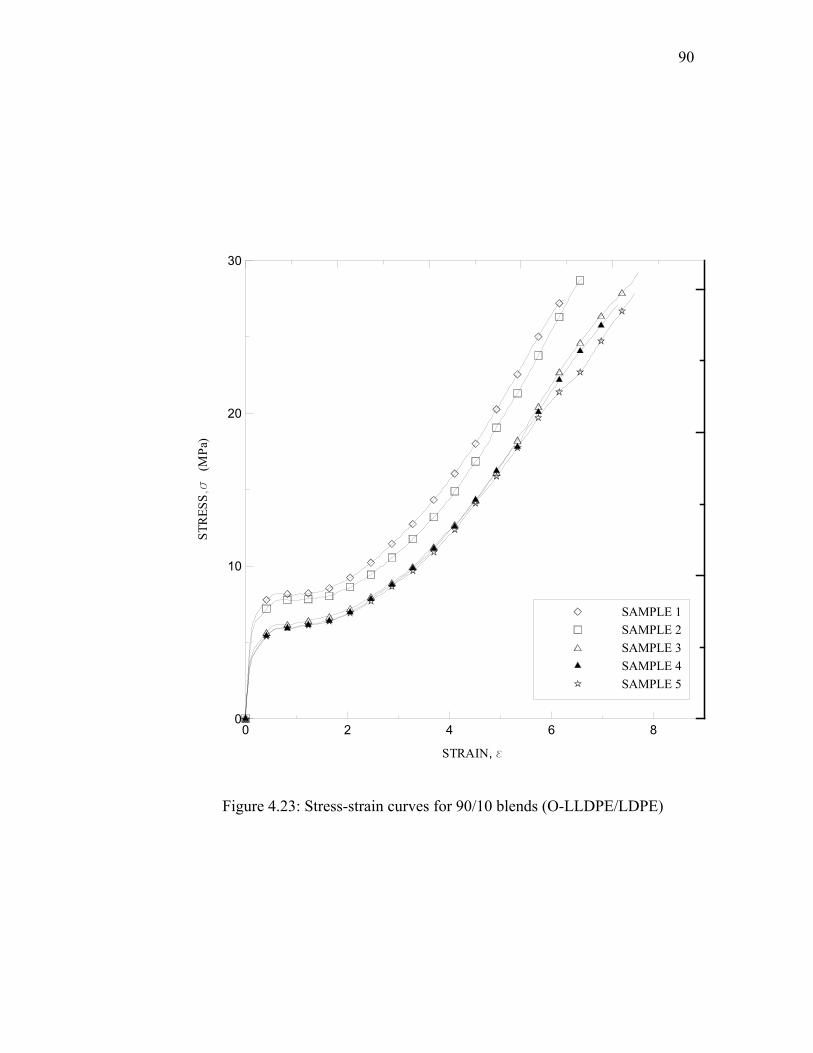
90
0 2 4 6 8
STRAIN, e
0
10
20
30
STR
ESS,s
(MPa
)
SAMPLE 1SAMPLE 2SAMPLE 3SAMPLE 4SAMPLE 5
Figure 4.23: Stress-strain curves for 90/10 blends (O-LLDPE/LDPE)

91
Table 4.13 Mechanical properties of O-type blends
90/10 O-LLDPE/LDPE
SAMPLE YIELD (MPa)
MODULUS (MPa)
TENSILE STRENGTH
(MPa)
STRAIN AT BREAK (mm/mm)
Sample 1 7.81 60.89 28.15 7.01
Sample 2 7.41 62.14 29.14 5.98
Sample 3 6.14 62.24 29 6.64
Sample 4 6.18 63.1 28.55 6.12
Sample 5 6.21 60.99 28.41 6.24
Average 6.75 61.87 28.65 6.40
Stdev 0.80 0.93 0.41 0.42 70/30
SAMPLE YIELD (MPa)
MODULUS (MPa)
TENSILE STRENGTH
(MPa)
STRAIN AT BREAK (mm/mm)
Sample 1 7.74 77.21 26.07 6.54 Sample 2 7.92 76.15 25.1 6.68 Sample 3 6.89 75.68 24.68 6.63 Sample 4 6.68 77.1 23.64 6.62 Sample 5 6.68 76.66 25.64 6.65 Average 7.18 76.56 25.03 6.62
Stdev 0.60 0.65 0.94 0.05 50/50
SAMPLE YIELD (MPa)
MODULUS (MPa)
TENSILE STRENGTH
(MPa)
STRAIN AT BREAK (mm/mm)
Sample 1 8.21 92.1 22.1 6.14 Sample 2 8.04 93.4 21.56 5.21 Sample 3 8 85.46 20 5.64 Sample 4 8.08 84.21 20.46 6.22 Sample 5 8.21 83.5 20.16 6.31 Average 8.11 87.73 20.86 5.90
Stdev 0.10 4.66 0.92 0.47

92
Table 4.14 Mechanical properties of O-type blends
30/70
SAMPLE YIELD (MPa) MODULUS (MPa)
TENSILE STRENGTH
(MPa)
STRAIN AT BREAK (mm/mm)
Sample 1 8.86 69.1 22.05 6.94 Sample 2 8.84 68.24 21.89 6.89 Sample 3 8.78 70.24 22.46 6.64 Sample 4 8.62 70.36 23 6.71 Average 8.78 69.49 22.35 6.80
Stdev 0.11 1.01 0.50 0.14 10/90
SAMPLE YIELD (MPa) MODULUS (MPa)
TENSILE STRENGTH
(MPa)
STRAIN AT BREAK (mm/mm)
Sample 1 10.33 108.64 14.1 3.99 Sample 2 10.24 109.21 14 4.04 Sample 3 10 107.36 12.68 4.06 Sample 4 10.15 107.11 12.4 3.98 Average 10.18 108.08 13.30 4.02
Stdev 0.14 1.01 0.88 0.04
Table 4.15 Summary of the mechanical properties of O-type blends
POLYMER MODULUS,
MPa
YIELD STRESS,
MPa
TENSILE STRENGTH,
MPa
STRAIN AT BREAK, mm/mm
O-LLDPE 68 6.28 30 7.00
10/90 62 6.75 29 6.40
70/30 77 6.68 25 6.62
50/50 88 8.11 20.85 5.91
70/30 69 8.78 22.4 6.82
90/10 108 10.18 13.3 4.01
LDPE 203 10.47 12.52 3.44
93
All the results are averages of at least six measurements. The indentation time was
10 seconds and the applied load is 10gf for all the samples tested.
4.5.1 Blend Samples
Microhardness results of samples are reported in Table 4.16. Microhardness results
of B-type, H-type and O-type blend samples are reported in Tables 4.17-4.19.
4.5.2 Effect of Indentation Time
To study the effect of indentation time on VHN, the tests are carried out different
indentation times as reported in Tables 4.20 and 4.21. These tests were carried out for the
samples of pure LDPE and pure B-LLDPE samples.
Figure 4.24 depicts the relationship between indentation times and VHN for the two
polymers (LDPE and B-LLDPE).

94
Table 4.16 Microhardness results for pure samples
Polymer Test 1 Test 2 Test 3 Test 4 Test 5 Test 6 Average Stdev
LDPE 2.50 2.50 2.40 2.60 2.60 2.60 2.53 0.08
B-LLDPE 2.10 2.20 2.00 2.00 2.00 2.00 2.05 0.08
H-LLDPE 1.90 1.70 1.80 1.90 1.80 1.90 1.83 0.08
O-LLDPE 1.50 1.40 1.50 1.40 1.50 1.40 1.45 0.05
Table 4.17 Microhardness results for B-type blend samples
Polymer Test 1 Test 2 Test 3 Test 4 Test 5 Test 6 Average Stdev
B-LLDPE 2.1 2.2 2 2 2 2 2.06 0.08
90/10 1.9 1.9 1.9 2 2 1.9 1.94 0.05
70/30 1.9 2.1 2.2 2 2.3 2.2 2.10 0.15
50/50 2.1 2.2 2.3 2.3 2.2 2.1 2.22 0.09
30/70 2.2 2.2 2.3 2.4 2.4 2.5 2.30 0.12
10/90 2.5 2.4 2.6 2.7 3 3.1 2.64 0.28
LDPE 2.5 2.5 2.4 2.6 2.6 2.6 2.52 0.08
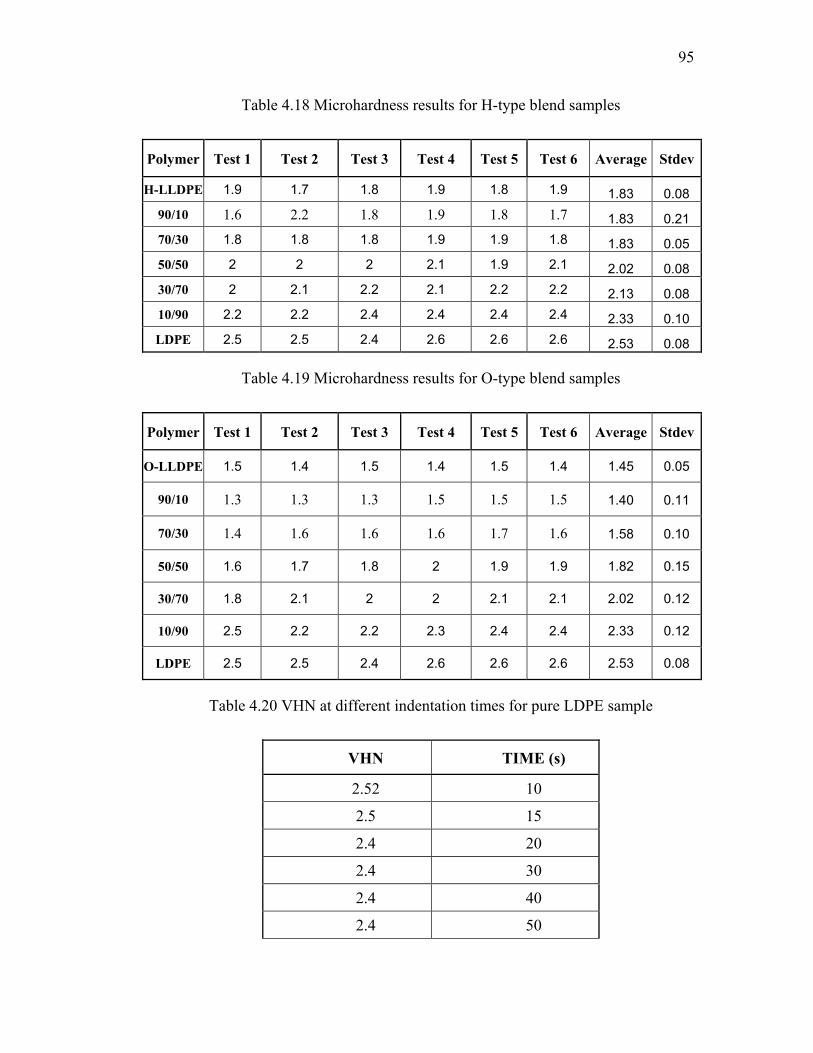
95
Table 4.18 Microhardness results for H-type blend samples
Polymer Test 1 Test 2 Test 3 Test 4 Test 5 Test 6 Average Stdev
H-LLDPE 1.9 1.7 1.8 1.9 1.8 1.9 1.83 0.08 90/10 1.6 2.2 1.8 1.9 1.8 1.7 1.83 0.21 70/30 1.8 1.8 1.8 1.9 1.9 1.8 1.83 0.05 50/50 2 2 2 2.1 1.9 2.1 2.02 0.08 30/70 2 2.1 2.2 2.1 2.2 2.2 2.13 0.08 10/90 2.2 2.2 2.4 2.4 2.4 2.4 2.33 0.10 LDPE 2.5 2.5 2.4 2.6 2.6 2.6 2.53 0.08
Table 4.19 Microhardness results for O-type blend samples
Polymer Test 1 Test 2 Test 3 Test 4 Test 5 Test 6 Average Stdev
O-LLDPE 1.5 1.4 1.5 1.4 1.5 1.4 1.45 0.05
90/10 1.3 1.3 1.3 1.5 1.5 1.5 1.40 0.11
70/30 1.4 1.6 1.6 1.6 1.7 1.6 1.58 0.10
50/50 1.6 1.7 1.8 2 1.9 1.9 1.82 0.15
30/70 1.8 2.1 2 2 2.1 2.1 2.02 0.12
10/90 2.5 2.2 2.2 2.3 2.4 2.4 2.33 0.12
LDPE 2.5 2.5 2.4 2.6 2.6 2.6 2.53 0.08
Table 4.20 VHN at different indentation times for pure LDPE sample
VHN TIME (s)
2.52 10
2.5 15
2.4 20
2.4 30
2.4 40
2.4 50

96
Table 4.21 VHN at different indentation times for pure B-LLDPE sample
VHN TIME(s)
2.06 10
2 15
2 20
1.8 30
1.9 40
1.9 60
1.7 80
1.7 90

97
0 20 40 60 80 100TIME, s
0
1
2
3
4
VH
N
LDPEB-LLDPE
Figure 4.24: Effect of indentation time(s) on VHN

98
CHAPTER 5
DISCUSSION
5.1 INTRODUCTION
The blend samples shall be discussed in terms of compatibility. Compatible can be
defined in terms of linear additive rule of mixtures, which can be given by
2211 mxmxM += (5.1)
Where ‘M’ is any mechanical property (Initial Modulus, Yield stress, Tensile
strength etc), ‘x1’ is the weight fraction of the component 1; ‘m1’ is the mechanical
property of the component. Similarly ‘x2’ and ‘m2’ for the component 2. Semi-
compatible, if the properties are intermediate to that of parent polymers but vary in non-
linear fashion and incompatible if the properties of the blend ratios show negative
deviations to the rule of mixtures.

99
5.2 THERMAL ANALYSIS
The thermal analyses of all the prepared samples were conducted using the Mettler
DSC822e. The crystalline melting thermograms were obtained by heating the samples
from 40°C to 140°C at a heating rate of 10°C/min.
5.2.1 DSC Scans of Pure Samples
DSC melting thermograms for all four polymers are shown in Figure 4.1. The
results of DSC scans are summarized in Table 4.1. Rana et al [58] investigated the
thermal and mechanical properties of the blends of ethylene 1-octene copolymer
synthesized by Ziegler-Natta and metallocene catalysts. Starck and Lofgren [59]
investigated the thermal properties of ethylene/long chain α- olefin copolymers produced
by metallocenes. Higher α- olefins were characterized by dynamic scanning caloriemeter
(DSC) and dynamic mechanical analysis (DMA). The DMA measurements confirmed the
decrease in crystallinity at increasing comonomer incorporation.
It is clear that the melting peaks of all the m-LLDPE samples are lower than that of
the LDPE. According to results of Table 3.1, the branch content of LDPE is lower than
that of m-LLDPE samples. As a result, thicker lamellae structure is more susceptible for
developing during the solidification process of LDPE. From previous studies, it is well
known fact that the melting behavior of polymers is proportional to the lamellae
thickness [60].It is observed that the thicker the lamellae, the higher the melting peak.
Consequently, high melting points are observed in the DSC scan of LDPE. DSC scans of

100
LDPE and B-LLDPE reveal narrow melting behavior with peaks at 111°C and 107°C,
respectively; whereas, H-LLDPE and O-LLDPE show a relatively broader melting
behavior with peaks at 108°C and 98°C, respectively. In addition, the DSC scan of H-
LLDPE shows the existence of two broad melting peaks at 99°C and 108°C. It is well
known that in polymers, there exists a distribution of molecular weights, chain lengths
and lamellae thickness. This existence of the two peaks in the melting behavior of the
pure H-LLDPE samples is most probably attributed to the bimodal (predominantly two
types) distribution of the lamellae thickness.
5.2.2 DSC Scans of B-type Blends
For the B-type blend system (Figure 4.2), it can be seen that only a single melting
peak is observed in each blend irrespective of blend composition. Figure 5.1 shows the
compositional dependence of melting temperature (Tm), endset temperature and percent
crystallinity for B-type blend system. The melting peaks and endset temperatures of the
blends are intermediate between those of the individual pure polymers. The increase in
melting temperature (Figure 5.1a) of the blend with the increase in LDPE can be
attributed to the development of thicker lamellae microstructure. A nearly compatible
behavior is resulted in this case. Figure 5.1(b) shows a little improvement in the endset
temperatures of blends with the LDPE content. The endset temperatures remains constant
after an initial improvement till 50% LDPE. At higher concentration of LDPE, the endset
temperature values of all the blends are closer to that of pure LDPE.

101
0 20 40 60 80 100% LDPE
25
30
35
40
45
% C
rysta
llini
ty
0 20 40 60 80 100% LDPE
100
104
108
112
116
T m (C
)
0 20 40 60 80 100% LDPE
112
116
120
Ends
et (C
)
(a) (b)
(c)
Figure 5.1: Thermal characterization of B-Type blends (a) Melting temperature
versus %LDPE (b) Endset melting temperature versus % LDPE (c) Crystallinity
versus % LDPE.

102
This indicates that thicker lamellae are growing in all the B-type blends. However,
this improvement in lamellae thickness did not enhance the amount of crystallinity.
According to Figure 5.1c, the percent crystallinity increased linearly with LDPE content
up to 30% LDPE. However, at higher % LDPE, the crystallinity is lower than that
expected from the rule of mixture. This fact is due to the branch content difference
between the two polymers. According to Table 3.1, LDPE has lower branched content
(11.0) compared to that of B-LLDPE (14.5). On one hand, at low concentration of LDPE,
the crystallization is improved because LDPE molecules have larger linear segments,
which are able to crystallize much easier. For example these segments can easily attach
themselves to smaller lamellae crystals. On the other hand, at concentration higher than
50% of LDPE (for example 30/70), the B-LLDPE molecules with smaller linear
segments will slow the nucleation as well as the crystal growth of LDPE molecules. This
results in lower crystallinity. Since the sample preparation is being conducted at very fast
cooling rate (200°C/min), there is not enough time for many LDPE crystals to grow. As a
consequence, lower crystallinity value is obtained.
5.2.3 DSC Scans of O-type Blends
A similar behavior in the melting peaks to that of the B-type is observed (Figure
4.2). The thermal characterization data for all the blend ratios of O-type blends is
reported in Table 4.3. It can be inferred from Figure 5.2a that the melting temperatures of
the blends increase rapidly for LDPE <50%, and then stabilize at the melting temperature
of pure LDPE

103
0 20 40 60 80 100% LDPE
20
25
30
35
40
45
% C
rysta
llini
ty
(c)
0 20 40 60 80 100% LDPE
90
100
110
120
T m (C
)
0 20 40 60 80 100% LDPE
105
110
115
120
Ends
et (
C)
(a) (b)
Figure 5.2: Thermal characterization of O-Type blends (a) Melting temperature
versus %LDPE (b) Endset melting temperature versus % LDPE(c) Crystallinity
versus % LDPE.

104
Figure 5.2b, which represents the endset melting temperature of O-type blends, indicates
that thicker lamellae structure is developed for all the blend ratios. This indicates that
LDPE is enhancing the development of large crystals. However, the amount of
crystallinity is not improving with the addition of LDPE up to 50% mixture. According to
Figure 5.2c, small addition of O-type LLDPE molecules to LDPE polymers results in
large decrease in crystallinity. This phenomenon can be explained with the fact that O-
type branch content is higher than that of LDPE, which results in smaller linear segments
in O-LLDPE molecules. As a consequence, O-LLDPE molecules will slow down the
nucleation and the crystal growth rates of LDPE molecules. This in turn will result in the
lower crystallinity. When comparing the crystallinity values of pure B-LLDPE to that of
O-LLDPE, it is clear that the latter has lower amount of crystallinity. This fact is due to
the octene branches being larger than the butene branches and also higher branch content
exists in O-LLDPE relative to the other m-LLDPE used in this study.
5.2.4 DSC Scans of H-type Blends
According to the Figure 4.4, pure H-LLDPE shows broad melting behavior with
two shallow peaks at 99°C and 108°C. The broad melting behavior of H-LLDPE sample
can be attributed to the existence of two types of lamellae thicknesses; one is thin, which
is responsible for the low-temperature melting peak, and a thicker one responsible for the
higher melting temperature. The existence of two different lamellar thicknesses in pure
H-LLDPE sample can be attributed to the existence of broad branching distributions in
the polymer molecules. Thinner lamellae may have been developed owing to the closer
arrangement of branches, and thicker lamellae from the wider arrangement of branches
105
along the main backbone chain. This result can also be confirmed by the nature of high
endset melting of H-LLDPE (Figure 4.5). It is found that, the endset melting temperature
is not sharp but it is rather diffuse indicating the existence of broad distribution of
lamellae thickness in the sample. The DSC scans also reveal that the two peaks merge
into a single higher value melting peak when LDPE content is greater than 10% in the
blend. With the increase in LDPE composition of the blend, it is found that the broad
shallow peaks in H-LLDPE tend to become quite narrow in nature and the peak is shifted
towards the higher value indicating the improvement of lamellae thickness. It is also
observed that the pure H-LLDPE shows a melting behavior intermediate between pure B-
LLDPE and O-LLDPE. This is probably due to the existence of mainly two types of
arrangements of branches along the main backbone chain as explained earlier. The high-
end melting temperature peak of the H-LLDPE blends is illustrated in Figure 5.3a.
According to this figure, the melting temperature remained almost constant at
108°C for blends up to 50% LDPE before it increases and stabilizes at 111°C for the
remaining blends. According to Figure 5.3b, endset temperatures are found to decrease
linearly with the addition of LDPE. Figure 5.3c shows a sharp decrease in crystallinity
when H-LLDPE molecules are added to LDPE. This decrease can be attributed to the
presence of O-LLDPE molecules with smaller linear segments that slow down the
nucleation as well as the crystal growth of LDPE molecules, which results in lower
crystallinity. This phenomenon has been observed with other types of m-LLDPE.

106
0 20 40 60 80 100% LDPE
24
28
32
36
40
44
% C
rysta
llini
ty
0 20 40 60 80 100% LDPE
116
120
124
128
132
Ends
et (C
)
0 20 40 60 80 100% LDPE
100
110
120T m
(C)
(a) (b)
(c)
Figure 5.3: Thermal characterization of H-Type blends(a) Melting temperature versus
%LDPE (b) Endset melting temperature versus % LDPE (c) Crystallinity versus %
LDPE

107
It can be concluded from the above discussion that an addition of small amount of
any branch type (B, H or O) of m-LLDPE to LDPE results in a sharp decrease of
crystallinity. Furthermore, an addition of small amount of LDPE to any type of m-
LLDPE does not improve the crystallinity of the blend.
5.3 TENSILE RESULTS
5.3.1 Pure Samples
One stress-strain curve of each polymer is plotted in the Figures 5.4a and 5.4b. All
the studied polymers display ductile behavior accompanied with the neck formation at the
yield point. The summary of tensile results for all the samples is reported in Table 4.5. It
was earlier believed that most of the polymers show a single yield point in the stress-
strain curve. But the double yielding phenomenon was found to exist in most of the
polymers. Popli and Mandelkern [41] attributed the double yielding phenomenon to the
broad distributions of relatively thin crystallites existing in the polyethylenes. According
to Seguela and Reitsch [23], two processes governed the yielding: (i) the slip of crystal
blocks; and (ii) the homogenous shear of the crystal blocks. Muller and Balsamo [24]
found that the double-yielding phenomenon was quite sensitive to the crystallization
conditions of the samples.
5.4 EFFECT OF THE BRANCH TYPE OF M -LLDPE ON THE
MECHANICAL PROPERTIES
Stress-strain curves for the B-type blend system are shown in Figures 5.5a and
5.5b.

108
0 2 4 6 8
STRAIN, e
0
10
20
30
STR
ESS,s
(MPa
)
LDPEB-LLDPEH-LLDPEO-LLDPE
Figure 5.4a: Stress-strain curves for all the samples

109
0 1 2 3
STRAIN, e
0
4
8
12
STR
ESS,s
(MPa
)
LDPEB-LLDPEH-LLDPEO-LLDPE
Figure 5.4b: Magnification in the vicinity of the yield
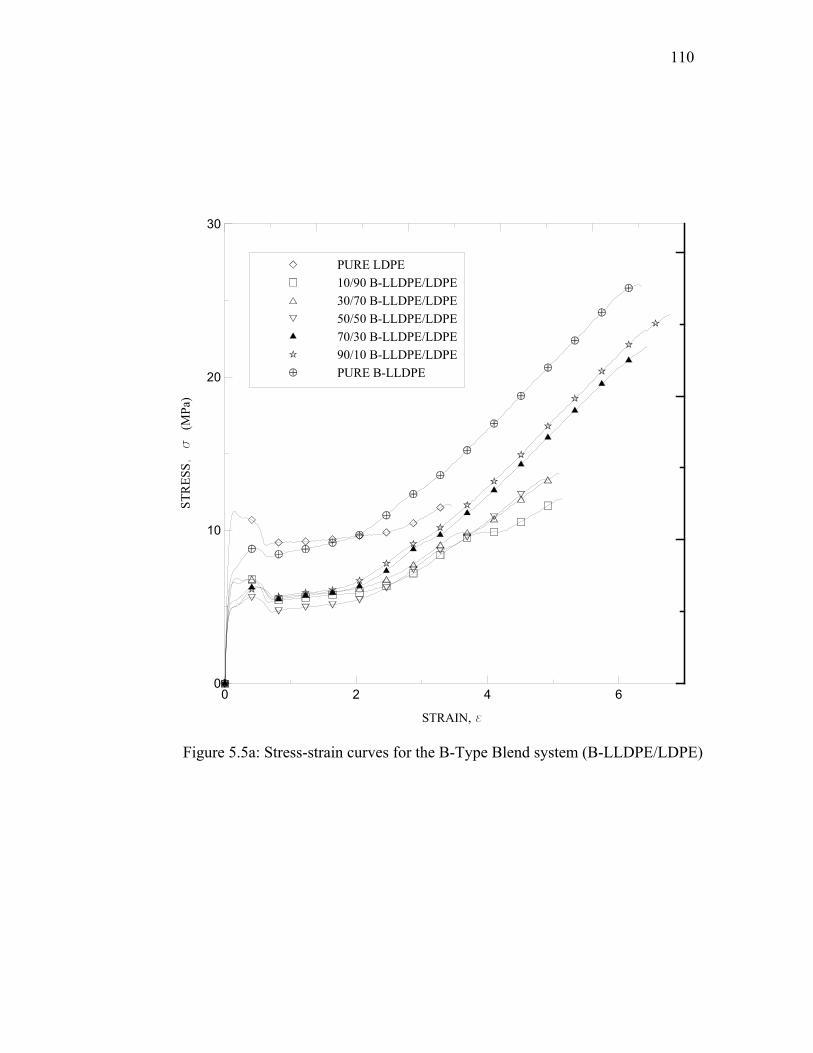
110
0 2 4 6
STRAIN, e
0
10
20
30
STR
ESS, s
(MPa
)
PURE LDPE10/90 B-LLDPE/LDPE30/70 B-LLDPE/LDPE50/50 B-LLDPE/LDPE70/30 B-LLDPE/LDPE90/10 B-LLDPE/LDPEPURE B-LLDPE
Figure 5.5a: Stress-strain curves for the B-Type Blend system (B-LLDPE/LDPE)

111
0 0.4 0.8 1.2
STRAIN, e
0
4
8
12
STR
ESS, s
(MPa
)
PURE LDPE10/90 B-LLDPE/LDPE30/70 B-LLDPE/LDPE50/50 B-LLDPE/LDPE70/30 B-LLDPE/LDPE90/10 B-LLDPE/LDPEPURE B-LLDPE
Figure 5.5b: Magnification in the vicinity of the yield for B-type Blend system
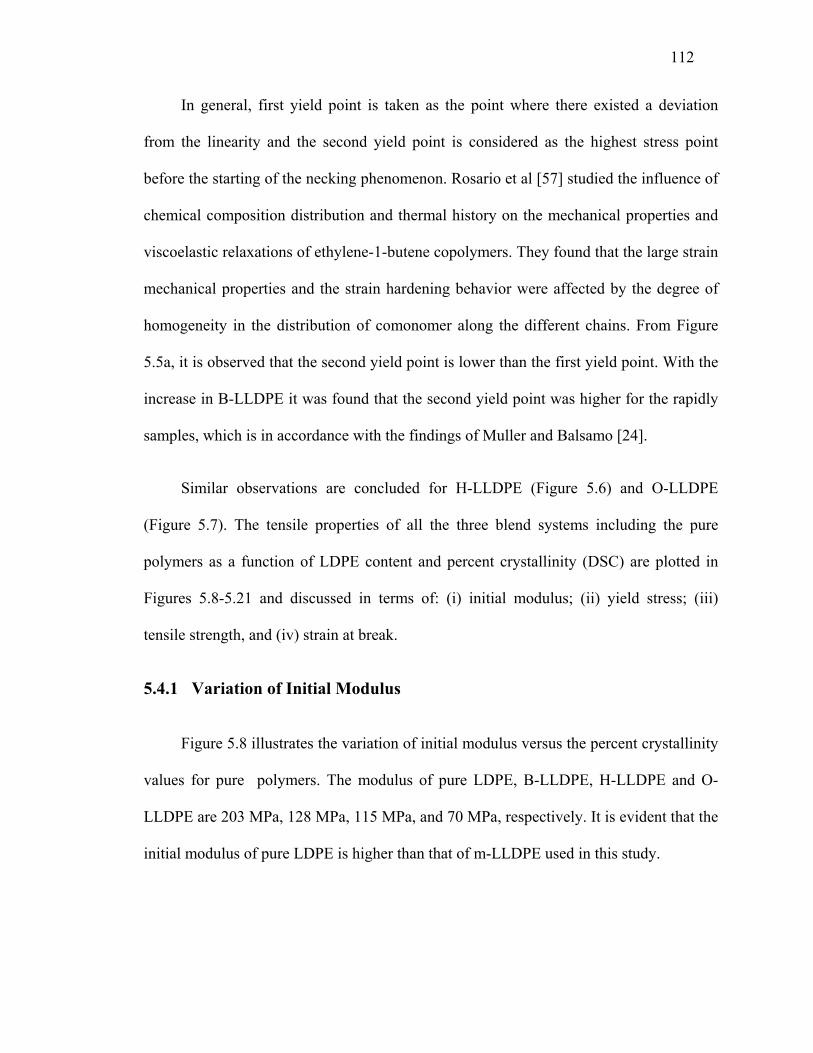
112
In general, first yield point is taken as the point where there existed a deviation
from the linearity and the second yield point is considered as the highest stress point
before the starting of the necking phenomenon. Rosario et al [57] studied the influence of
chemical composition distribution and thermal history on the mechanical properties and
viscoelastic relaxations of ethylene-1-butene copolymers. They found that the large strain
mechanical properties and the strain hardening behavior were affected by the degree of
homogeneity in the distribution of comonomer along the different chains. From Figure
5.5a, it is observed that the second yield point is lower than the first yield point. With the
increase in B-LLDPE it was found that the second yield point was higher for the rapidly
samples, which is in accordance with the findings of Muller and Balsamo [24].
Similar observations are concluded for H-LLDPE (Figure 5.6) and O-LLDPE
(Figure 5.7). The tensile properties of all the three blend systems including the pure
polymers as a function of LDPE content and percent crystallinity (DSC) are plotted in
Figures 5.8-5.21 and discussed in terms of: (i) initial modulus; (ii) yield stress; (iii)
tensile strength, and (iv) strain at break.
5.4.1 Variation of Initial Modulus
Figure 5.8 illustrates the variation of initial modulus versus the percent crystallinity
values for pure polymers. The modulus of pure LDPE, B-LLDPE, H-LLDPE and O-
LLDPE are 203 MPa, 128 MPa, 115 MPa, and 70 MPa, respectively. It is evident that the
initial modulus of pure LDPE is higher than that of m-LLDPE used in this study.

113
0 2 4 6 8
STRAIN, e
0
10
20
30
STR
ESS,s
(MPa
)
PURE LDPE10/90 H-LLDPE/LDPE30/70 H-LLDPE/LDPE50/50 H-LLDPE/LDPE70/30 H-LLDPE/LDPE90/10 H-LLDPE/LDPEPURE H-LLDPE
Figure 5.6a: Stress-strain curves for the H-Type blend system (H-LLDPE/LDPE)

114
0 0.4 0.8 1.2
STRAIN, e
0
4
8
12
STR
ESS,s
(MPa
)
PURE LDPE10/90 H-LLDPE/LDPE30/70 H-LLDPE/LDPE50/50 H-LLDPE/LDPE70/30 H-LLDPE/LDPE90/10 H-LLDPE/LDPEPURE H-LLDPE
Figure 5.6b: Magnification in the vicinity of the yield for H-type blend system

115
0 2 4 6 8
STRAIN, e
0
10
20
30
STR
ESS,s
(MPa
)
PURE LDPE10/90 O-LLDPE/LDPE30/70 O-LLDPE/LDPE50/50 O-LLDPE/LDPE70/30 O-LLDPE/LDPE90/10 O-LLDPE/LDPEPURE O-LLDPE
Figure 5.7a: Stress-strain curves for the O-Type blend system (O-LLDPE/LDPE)

116
0 0.4 0.8 1.2
STRAIN, e
0
4
8
12
STR
ESS,s
(MPa
)
PURE LDPE10/90 O-LLDPE/LDPE30/70 O-LLDPE/LDPE50/50 O-LLDPE/LDPE70/30 O-LLDPE/LDPE90/10 O-LLDPE/LDPEPURE O-LLDPE
Figure 5.7b: Magnification in the vicinity of the yield for O-type blend system

117
24 28 32 36 40% Crystallinity
40
80
120
160
200
240
Mod
ulus
, MPa
LDPEB-LLDPEH-LLDPEO-LLDPE
Figure 5.8: Initial modulus versus percent crystallinity of pure polymers

118
The effect of blend composition on the modulus of elasticity is shown in Figure 5.9.
The modulus values of the B-type blends show linear variation for most of the blend
ratios (Figure 5.9a). This indicates that B-LLDPE has good compatibility with LDPE.
The effect of H-type blends on modulus of elasticity is presented in Figure 5.9b. It is
evident that the addition of LDPE improves the modulus of the blends. For O-type blend
system, most blend compositions have similar modulus values to that of pure O-LLDPE.
It is observed that the addition of small amount of O-LLDPE to pure LDPE results in
large decrease of its modulus (Figure 5.9c). The variation of initial modulus with percent
crystallinity values is reported in the Figure 5.10. It can be seen that the initial modulus
values were found to decrease with percent crystallinity values (DSC) for all the blends.
5.4.2 Variation of Yield Stress
The yield point of pure polymers versus crystallinity is presented in Figure 5.11. It
can be inferred that pure m-LLDPE has lower yield stress value compared to pure LDPE.
Besides the crystallinity, the branch type, branch content and the branch size in a polymer
molecule significantly affect the yield stress. The compositional dependence of yield
stress for all the blend systems is shown in Figure 5.12. For the B-Type (Figure 5.12a), a
small addition of B-LLDPE to LDPE decreases its yield stress appreciably. For H-type
blend system (Figure 5.12b), it is observed that the yield stress values remained quite
close to that of pure H-LLDPE for LDPE ≤ 50%. The remaining blends have yield stress
values similar to that of pure LDPE. Similar behavior of yield stress with blend
composition results in O-type blend system (Figure 5.12c).

119
0 20 40 60 80 100
% LDPE
50
100
150
200
250
Mod
ulus
(MPa
)
0 20 40 60 80 100% LDPE
50
100
150
200
250
Mod
ulus
(MPa
)
0 20 40 60 80 100% LDPE
0
50
100
150
200
250
Mod
ulus
(MPa
)
(a) B-LLDPE/LDPE
(b) H-LLDPE/LDPE
(c) O-LLDPE/LDPE
Figure 5.9: Initial modulus as a function of LDPE content for all the three blend
systems (a) B-Type (b) H-Type (c) O-Type
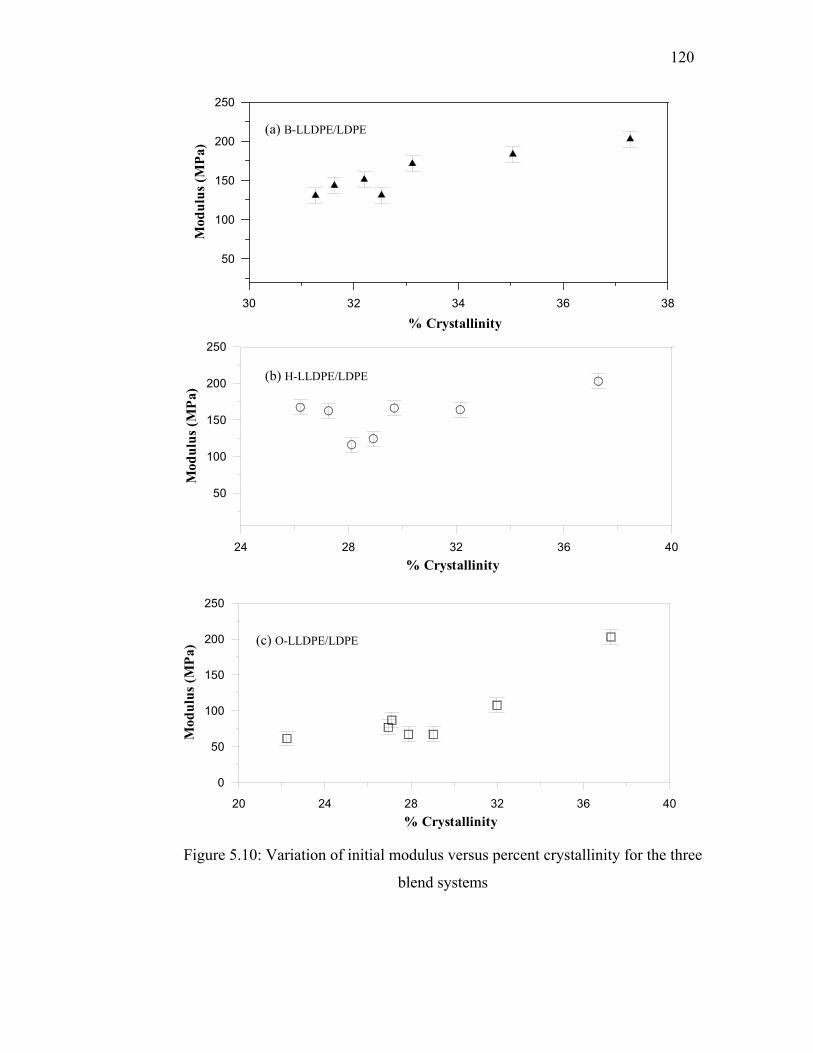
120
30 32 34 36 38
% Crystallinity
50
100
150
200
250
Mod
ulus
(MPa
)
24 28 32 36 40% Crystallinity
50
100
150
200
250
Mod
ulus
(MPa
)
20 24 28 32 36 40% Crystallinity
0
50
100
150
200
250
Mod
ulus
(MPa
)
(a) B-LLDPE/LDPE
(b) H-LLDPE/LDPE
(c) O-LLDPE/LDPE
Figure 5.10: Variation of initial modulus versus percent crystallinity for the three
blend systems
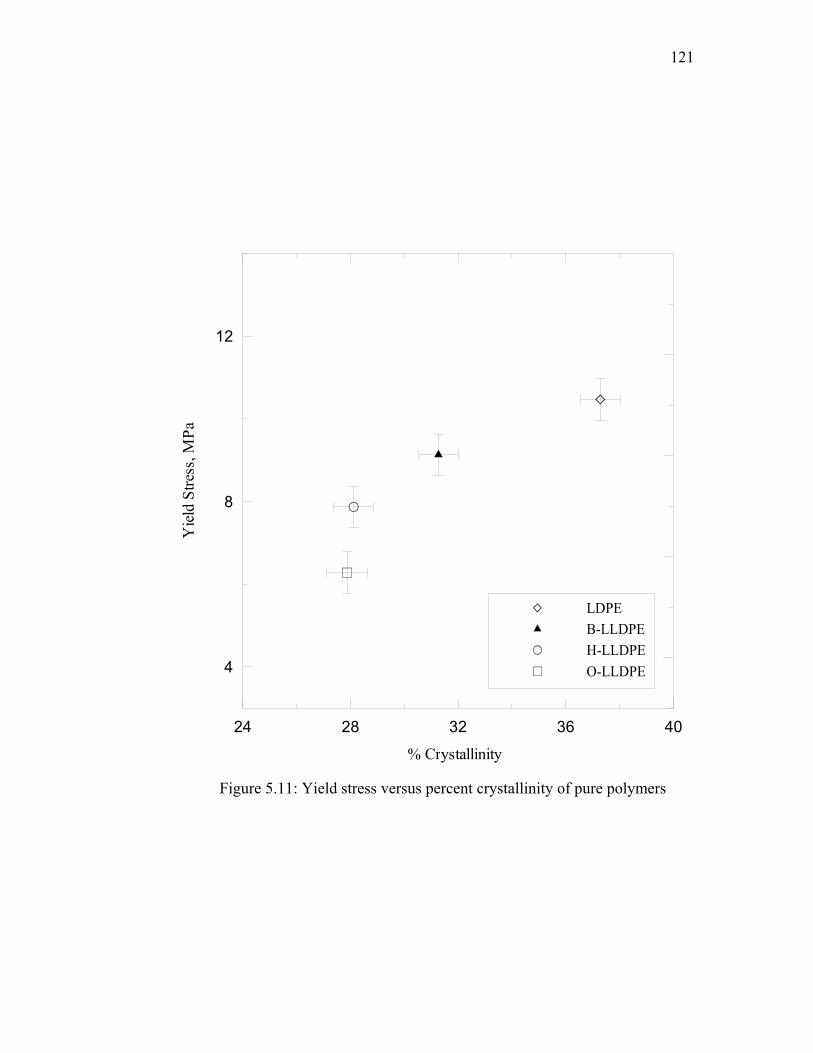
121
24 28 32 36 40% Crystallinity
4
8
12
Yie
ld S
tress
, MPa
LDPEB-LLDPEH-LLDPEO-LLDPE
Figure 5.11: Yield stress versus percent crystallinity of pure polymers

122
0 20 40 60 80 100% LDPE
0
4
8
12
YIE
LD S
TRES
S (M
Pa) (a) B-LLDPE/LDPE
0 20 40 60 80 100% LDPE
0
4
8
12
YIE
LD S
TRES
S (M
Pa) (b) H-LLDPE/LDPE
0 20 40 60 80 100% LDPE
0
4
8
12
YIE
LD S
TRES
S (M
Pa)
(c) O-LLDPE/LDPE
Figure 5.12: Yield stress as a function of LDPE content for all the three blend systems
(a) B-Type (b) H-Type (c) O-Type
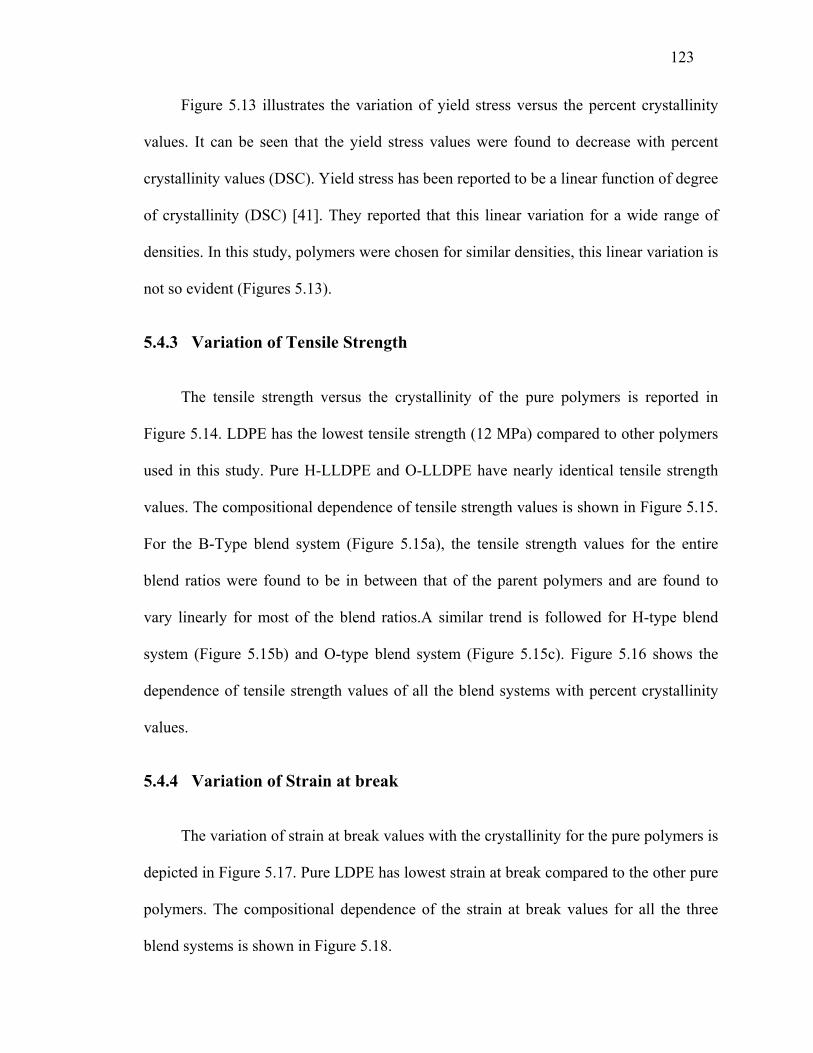
123
Figure 5.13 illustrates the variation of yield stress versus the percent crystallinity
values. It can be seen that the yield stress values were found to decrease with percent
crystallinity values (DSC). Yield stress has been reported to be a linear function of degree
of crystallinity (DSC) [41]. They reported that this linear variation for a wide range of
densities. In this study, polymers were chosen for similar densities, this linear variation is
not so evident (Figures 5.13).
5.4.3 Variation of Tensile Strength
The tensile strength versus the crystallinity of the pure polymers is reported in
Figure 5.14. LDPE has the lowest tensile strength (12 MPa) compared to other polymers
used in this study. Pure H-LLDPE and O-LLDPE have nearly identical tensile strength
values. The compositional dependence of tensile strength values is shown in Figure 5.15.
For the B-Type blend system (Figure 5.15a), the tensile strength values for the entire
blend ratios were found to be in between that of the parent polymers and are found to
vary linearly for most of the blend ratios.A similar trend is followed for H-type blend
system (Figure 5.15b) and O-type blend system (Figure 5.15c). Figure 5.16 shows the
dependence of tensile strength values of all the blend systems with percent crystallinity
values.
5.4.4 Variation of Strain at break
The variation of strain at break values with the crystallinity for the pure polymers is
depicted in Figure 5.17. Pure LDPE has lowest strain at break compared to the other pure
polymers. The compositional dependence of the strain at break values for all the three
blend systems is shown in Figure 5.18.

124
30 32 34 36 38% CRYSTALLINITY
0
4
8
12
YIE
LD P
OIN
T (M
Pa)
(a) B-LLDPE/LDPE
24 28 32 36 40% CRYSTALLINITY
0
4
8
12
YIE
LD P
OIN
T (M
Pa)
(b) H-LLDPE/LDPE
20 24 28 32 36 40% CRYSTALLINITY
0
4
8
12
YIE
LD P
OIN
T (M
Pa)
(c) O-LLDPE/LDPE
Figure 5.13: Variation of the yield point versus percent crystallinity values

125
24 28 32 36 40% Crystallinity
10
20
30
40
50
Tens
ile S
treng
th, M
Pa
LDPEB-LLDPEH-LLDPEO-LLDPE
Figure 5.14: Tensile strength versus percent crystallinity of pure polymers

126
0 20 40 60 80 100
% LDPE
0
10
20
30
40
Tens
ile S
tren
gth
(MPa
)
0 20 40 60 80 100% LDPE
10
20
30
40
Tens
ile st
reng
th (M
Pa)
0 20 40 60 80 100% LDPE
10
20
30
40
Tens
ile st
reng
th (M
Pa)
(a) B-LLDPE/LDPE
(b) H-LLDPE/LDPE
(c) O-LLDPE/LDPE
Figure 5.15: Tensile strength as a function of LDPE content for all the three blends
(a).B-Type (b) H-Type (c) O-Type

127
30 32 34 36 38% Crystallinity
0
10
20
30
40
50
Tens
ile S
treng
th(M
Pa)
24 28 32 36 40
% Crystallinity
10
20
30
40
50
Tens
ile S
treng
th (M
Pa)
20 24 28 32 36 40
% Crystallinity
0
10
20
30
40
50
Tens
ile S
treng
th (M
Pa)
(a) B-LLDPE/LDPE
(b) H-LLDPE/LDPE
(c) O-LLDPE/LDPE
Figure 5.16: Variation of Tensile strength versus percent crystallinity values

128
24 28 32 36 40% Crystallinity
3
4
5
6
7
8
Stra
in a
t bre
ak
LDPEB-LLDPEH-LLDPEO-LLDPE
Figure 5.17: Strain at break versus percent crystallinity of pure polymers

129
0 20 40 60 80 100
% LDPE
0
2
4
6
8
10
Stra
in a
t bre
ak (m
m/m
m)
0 20 40 60 80 100% LDPE
0
2
4
6
8
10
Stra
in a
t bre
ak (m
m/m
m)
0 20 40 60 80 100% LDPE
0
2
4
6
8
10
Stra
in a
t bre
ak (m
m/m
m)
(a) B-LLDPE/LDPE
(b) H-LLDPE/LDPE
(c) O-LLDPE/LDPE
Figure 5.18: Strain at break as a function of LDPE content for all the three blends
(a).B-Type (b) H-Type (c) O-Type

130
It can be inferred that the addition of m-LLDPE to LDPE improves the strain at
break value and also the ultimate strength for all the blend systems. B-type blends
showed a better compatibility than the other blend systems studied (Figure 5.18a). For H-
type blend system (Figure 5.18b), the strain at break values remained closer to that of
pure H-LLDPE for LDPE ≤ 70%. This trend can also be seen in O-type blend system
(Figure 5.18c). Figure 5.19 shows the variation of strain at break values versus the
percent crystallinity values for all the blends.
5.5 VICKER’S HARDNESS RESULTS
Vicker’s pyramidal diamond indenter is used because of the fact that square
indentation produced by the sharp diamond pyramid leads to an easy, accurate and above
all optimal measurement of microhardness. To ensure reliable measurement of
microhardness the volume of the material receiving the indenter must be free of external
stresses and the surface must be parallel with the base of the tester. The variation of
vicker’s hardness number versus LDPE content is depicted in the Figure 5.20.
All the blends followed the linear rule for the most of the blend ratios. This
indicates all the blends show better compatibility for microhardness values.
5.5.1 Variation of VHN with Percent Crystallinity
It is fundamental to know the influence of the structure on the microhardness
values, by analyzing the variation of microhardness with crystallinity for all the samples.
The VHN values correlated well with percent crystallinity values (Figure 5.21). It is
evident that the VHN values increased with an increase in percent crystallinity (DSC).

131
.
30 32 34 36 38
% Crystallinity
0
2
4
6
8
10
Stra
in a
t bre
ak
24 28 32 36 40
% Crystallinity
0
2
4
6
8
10
Stra
in a
t bre
ak
20 24 28 32 36 40
% Crystallinity
0
2
4
6
8
10
Stra
in a
t bre
ak
(a) B-LLDPE/LDPE
(b) H-LLDPE/LDPE
(c)O-LLDPE/LDPE
Figure 5.19: Variation of Strain at break versus percent crystallinity values

132
0 20 40 60 80 100
% LDPE
0
1
2
3
4
Vic
kers
Har
dnes
s, V
HN
0 20 40 60 80 100% LDPE
0
1
2
3
4
Vic
kers
Har
dnes
s, V
HN
0 20 40 60 80 100% LDPE
0
1
2
3
4
Vic
kers
Har
dnes
s, V
HN
(a) B-LLDPE/LDPE
(b) H-LLDPE/LDPE
(c) O-LLDPE/LDPE
Figure 5.20: Variation of VHN versus % LDPE content for all the blend systems
(a)B-type (b) H-type (c) O-type

133
24 28 32 36 40% Crystallinity
1
2
3
4
VH
N
LDPEB-LLDPEH-LLDPEO-LLDPE
Figure 5.21: Variation of VHN with percent crystallinity (DSC)

134
5.5.2 Correlation with Initial Modulus
The variation of initial modulus for the polymers is shown in Figure 5.22. Vicker’s
hardness number (VHN) of pure LDPE is 2.53. The VHN for B-LLDPE, H-LLDPE and
O-LLDPE are 2.05, 1.83 and 1.45 respectively. The higher value of pure LDPE can be
attributed to its higher value of crystallinity compared to the other m-LLDPE. The
influence of branch type and branch content on VHN is also evident. The correlation of
yield stress values with VHN for all the blend systems is shown in the Figure 5.23
For B-type blend system,
vt HE *87.70= (5.2)
Similarly for H-type and O-type blend systems is given by
vt HE *1.76= (5.3)
vt HE *84.52= (5.4)
Where ‘a’ and ‘b’ are constants and ‘E’ is the elastic modulus.
5.5.3 Correlation with Yield Stress
The variation of yield stress with VHN for the polymers is shown in Figure 5.24.
The higher value of yield stress of pure LDPE can be attributed to its higher value of
crystallinity compared to the other m-LLDPE. The correlation of yield stress values with
VHN for all the blend systems is shown in the Figure 5.25.

135
0 1 2 3VHN
0
50
100
150
200
250
MO
DU
LUS,
MPa
LDPEB-LLDPEH-LLDPEO-LLDPE
Figure 5.22: Variation of initial modulus with VHN for polymers

136
1.8 2 2.2 2.4 2.6 2.8
VHN
0
100
200
300
Mod
ulus
, MPa
1.6 1.8 2 2.2 2.4 2.6VHN
0
100
200
300
Mod
ulus
, MPa
1.2 1.6 2 2.4 2.8VHN
0
50
100
150
200
250
Mod
ulus
, MPa
(a) B-LLDPE/LDPE
(b) H-LLDPE/LDPE
(c) O-LLDPE/LDPE
Et = 70.87 * VHN R 2= 0.99
Et = 76.1 * VHN R2 = 0.99
Et = 52.84 * VHNR2 = 0.91
Figure 5.23: Correlation of initial modulus with VHN (a)B-type (b) H-type (c) O-type

137
0 1 2 3VHN
0
4
8
12
YIE
LD S
TRES
S, M
Pa
LDPEB-LLDPEH-LLDPEO-LLDPE
Figure 5.24: Variation of yield stress with VHN for polymers
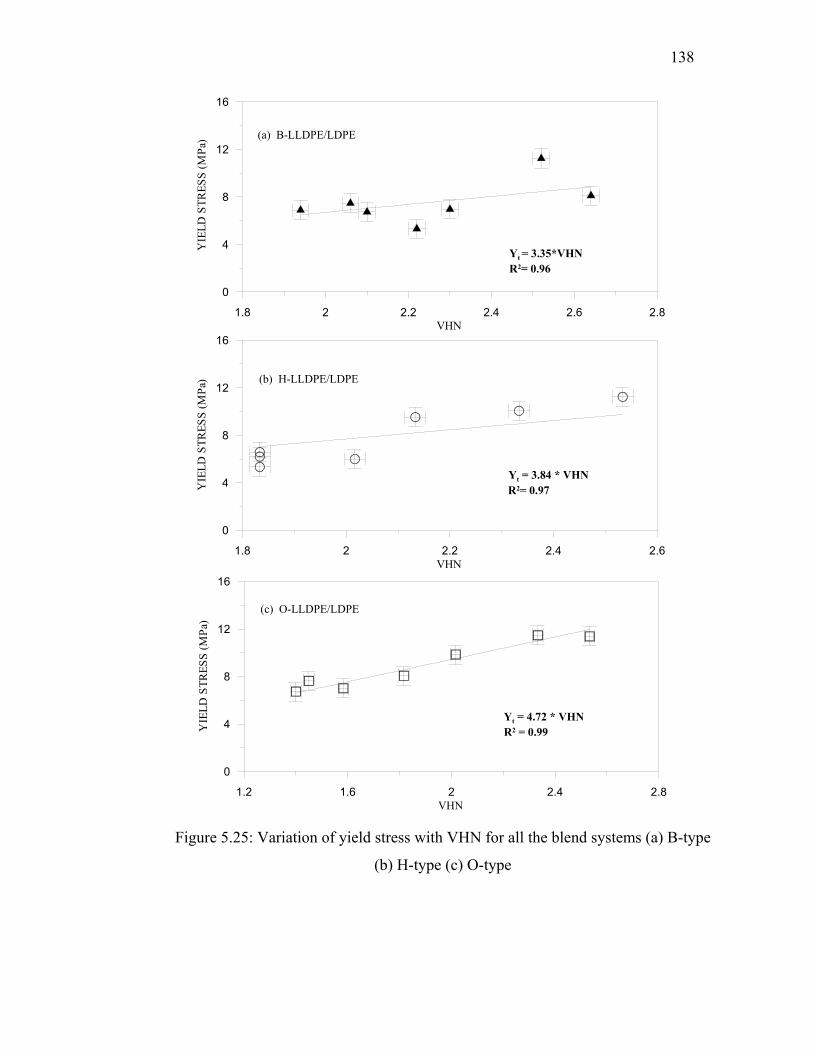
138
1.8 2 2.2 2.4 2.6 2.8VHN
0
4
8
12
16
YIE
LD S
TRES
S (M
Pa) (a) B-LLDPE/LDPE
1.8 2 2.2 2.4 2.6VHN
0
4
8
12
16
YIE
LD S
TRES
S (M
Pa) (b) H-LLDPE/LDPE
1.2 1.6 2 2.4 2.8VHN
0
4
8
12
16
YIE
LD S
TRES
S (M
Pa)
(c) O-LLDPE/LDPE
Yt = 3.35*VHN R2= 0.96
Yt = 3.84 * VHN R2= 0.97
Yt = 4.72 * VHNR2 = 0.99
Figure 5.25: Variation of yield stress with VHN for all the blend systems (a) B-type
(b) H-type (c) O-type

139
Correlation of yield stress with VHN for B-type blend system can be given as
VHY ∗= 35.3 (5.5)
Similarly for H-type and O-type blend systems is given by
vHY ∗= 87.3 (5.6)
vHY ∗= 72.4 (5.7)
According to classical theory of plasticity, the expected indentation hardness value
for a Vicker’s indentor is approximately one-third the yield stress (Tabor’s relationship).
Equations 5.4 and 5.5 for B-type and H-type blend reveal that this relationship is well
established. For O-type blend system, this relationship is not well established. This can be
readily explained in the terms of crystallinity. It has already been established from the
thermal analysis that O-type blends do have lower crystallinity values compared to other
blend systems studied. However, systems of high crystallinity values will approximate to
Tabor relationship that is evident from the above relationships.
5.5.4 Variation of VHN with Tensile Strength
The variation of tensile strength with VHN for the polymers is shown in Figure
5.26. Though LDPE has highest VHN, it displays lowest tensile strength on account of
higher crystallinity. The variation of tensile strength values with VHN for all the blend
systems is shown in the Figure 5.27. The tensile strength values decreases with VHN for
all the blend systems.

140
1.2 1.6 2 2.4 2.8VHN
0
10
20
30
40
50
TEN
SILE
STR
ESS
LDPEB-LLDPEH-LLDPEO-LLDPE
Figure 5.26: Variation of tensile strength versus VHN for polymers

141
1.8 2 2.2 2.4 2.6 2.8
VHN
0
10
20
30
40
Tens
ile S
treng
th, M
Pa
1.6 1.8 2 2.2 2.4 2.6VHN
0
10
20
30
40
Tens
ile S
treng
th, M
Pa
1.2 1.6 2 2.4 2.8VHN
0
10
20
30
40
Tens
ile S
treng
th, M
Pa
(a) B-LLDPE/LDPE
(b) H-LLDPE/LDPE
(c) O-LLDPE/LDPE
Figure 5.27: Variation of tensile strength versus VHN for all the blend systems (a) B-
type (b) H-type (c) O-type

142
5.5.5 Variation of VHN with Strain at Break
The variation of tensile strength with VHN for the polymers is shown in Figure
5.28. Pure LDPE, which has highest VHN, has the lowest strain at break value. Pure m-
LLDPE (B, H or O-type) has higher strain at break values on account of their lower
crystallinity values. This reveals the importance of non-crystalline portions of the
polymer. The variation of strain at break values with VHN for all the blend systems is
shown in Figure 5.29. It is evident that the strain at break values decreased with
increasing VHN for most of the blend ratios.
5.5.6 Effect of Indentation time
It is well known that most of the plastics exhibit visco-elastic behavior. Due to the
creep effect, an increase in the dimensions of the impression with longer indentation time
is observed and consequently a lower microhardness value is obtained. At different
indentation times, hardness number is reported for pure LDPE and B-LLDPE (Figure
4.24).

143
1.2 1.6 2 2.4 2.8VHN
0
2
4
6
8
10
STR
AIN
AT
BR
EAK
LDPEB-LLDPEH-LLDPEO-LLDPE
Figure 5.28: Variation of strain at break versus VHN for polymers

144
1.8 2 2.2 2.4 2.6 2.8
VHN
0
2
4
6
8
10
Stra
in a
t bre
ak
1.6 1.8 2 2.2 2.4 2.6VHN
0
2
4
6
8
10
Stra
in a
t bre
ak
1.2 1.6 2 2.4 2.8VHN
0
2
4
6
8
10
Stra
in a
t bre
ak
(a) B-LLDPE/LDPE
(b) H-LLDPE/LDPE
(c) O-LLDPE/LDPE
Figure 5.29: Variation of strain at break versus VHN for all the blend systems (a) B-
type (b) H-type (c) O-type

145
CHAPTER 6
CONCLUSIONS AND RECOMMENDATIONS
6.1 CONCLUSIONS
In this work the effect of thermal history and the branch type of m-LLDPE on the
thermal and mechanical properties of m-LLDPE/LDPE blends are investigated.
Mechanical testing included both the tensile testing and microhardness testing of the
prepared samples. Tensile tests were carried out at 125 mm/min at room temperature.
Microhardness testing was carried out using Vickers hardness machine. Thermal analyses
of the sample were carried out at a heating rate of 10°C/min.
For isothermal cooled samples, the occurrence of multi peaks in this DSC scan of
pure H-LLDPE is attributed to the growth of different crystal populations from the melt.
Pure LDPE and pure H-LLDPE had similar melting points indicating the growth of
thicker lamellae microstructure. Though the branch content of H-LLDPE had lower
branch content than LDPE, the similar melting temperature of former as that of latter is
attributed to the existence of branch distributions in pure H-LLDPE. Pure O-LLDPE has
lowest melting peak indicating the growth of thinner lamellar microstructure. For
samples, the occurrence of high melting points for LDPE is attributed to the
146
growth of the thicker lamellar structure. DSC scans for B-LLDPE and O-LLDPE
revealed similar behavior. The existence of two broad melting peaks in the case of pure
H-LLDPE is most probably attributed to the bimodal distribution of the lamellae
thickness. The diffuse nature of endset melting temperature of pure H-LLDPE also
supported this observation.
All the studied polymer blends displayed ductile behavior accompanied with the
neck formation at the yield point. Double yield points were evident in the Figure shown.
The modulus of elasticity increased with the amount of crystallinity of pure polymers. At
the molecular level, these results indicated the effect of branch content and the side chain
length on the modulus of elasticity. An addition of small amount (10%) of LDPE to m-
LLDPE results in a negligible effect on the modulus of elasticity, whereas; the addition of
10% m-LLDPE to LDPE results has a more pronounced effect. There are two competing
factors that govern the molecular mobility and consequently the yield point. These factors
are the branch size and the amount of crystallinity. It can be concluded that all the three
blend systems studied showed better compatibility for tensile strength values. The
addition of m-LLDPE to LDPE improves the strain at break values for all the blend
systems. B-type blends showed a better compatibility than the other blend systems
studied. The correlation of vicker’s hardness numbers with yield strength values was
found to follow Tabor’s relationship for most of the blend systems. The correlation of
Vickers hardness numbers with initial modulus values were found to follow a power law
relation as discussed in the literature earlier.

147
6.2 RECOMMENDATIONS
Following are some of the recommendations for any future work to be carried out
on m-LLDPE/LDPE blends.
The effect of strain rate and temperature on the tensile properties of m-
LLDPE/LDPE blends can be a useful extension to the present work. These results
can be useful in predicting the mechanical behavior of the plastics at different
working environments.
The occurrence of double-yielding phenomenon for these blends needs further
investigation.
Wide-angle X-ray diffraction studies can be carried out for the samples to confirm
the structure existing in the material.
Microhardness testing of the samples at different indentations can be a useful
contribution in understanding the elasto-plastic process.
Useful correlations of Vickers hardness number with mechanical properties can
be really productive for the practical applications such as the prediction of the
service lifetime of prosthetic thermoplastics against a simulated human body
environment.
Impact testing of the m-LLDPE/LDPE blend samples can furnish useful
information which can be really helpful in a successful design of PE pipe.

148
BIBLIOGRAPHY
1. Peacock AJ, Handbook of Polyethylene, Structures, Properties and Applications, Marcel Dekker Inc., New York. Basel.
2. Swallowe GM, “Mechanical Properties and Testing of Polymers: An A-Z Reference”, Polymer Science and Technology, 1999.
3. Ward IM and Hadley DW, “An Introduction to the Mechanical properties of Solid Polymers”, Wiley, Chichester, 1993.
4. Nielsen LE, “Mechanical Properties of Polymers”, Van Nostrand Reinhod Co., New York, Cincinnati, London, Melbourne.
5. Arridge, “Mechanics of Polymers”, Clarendon Press, Oxford.
6. Seymour RB and Charles EC, “Structure-Property Relationships in Polymers”, Plenum Press, New York and London, 1984
7. Young RJ, “Introduction to Polymers”, Chapman and Hill, London, New York, 1980.
8. Lue, Ching T, “Easy processing metallocene polyethylene”, Journal of Plastic Film and Sheeting, vol 15, No 2, 1999, pp 131-139.
9. Chen F; Shanks R; Amarasinghe G, “Miscibility behavior of metallocene polyethylene blends”, Journal of Applied Polymer Science, Vol 81, No 9, pp 2227-2236.
10. Junting Xu, Xurong Xu, Feng L, “Short chain branching distributions of metallocene based ethylene copolymers”, European Polymer Journal, 1999, pp 685-693.
11. Hussein M, Davies GR, and Ward IM, “Preparation of ultra high modulus materials from metallocene based linear polyethylenes”, Polymer, Vol 42, 2001, pp 3679-3686.
12. Beagan and Malleja C, “The extrusion, performance and characterization of metallocene-catalyzed polyethylene based packaging films”, DAI-C 61/104, Winter 2000, p.1091.
13. Sierra, Juan D; Noriega P, Maria; Osswald, Tim A, “ Effect of metallocene polyethylene on heat sealing properties of low-density polyethylene blends”, Journal of Plastic film and Sheeting, 2000, Vol 16, No 1, pp 33-42.

149
14. Salazar JM and Calleja B, “Mechanical model on polyethylene blends as revealed by microhardness”, Journal of Material science letters, Vol 4, 1985, pp 324-326.
15. Flores A, Calleja B and Bassett DC, “Microhardness studies of chain-extended PE: I. Correlations to Microstructure”, Journal of Polymer Science: Part B: Polymer Physics, Vol 337, pp 3151-3158 (1999).
16. Rueda DR and Calleja B, “Study of blends based on recycled polyethylene wastes. Part I. Variation of mechanical properties with composition”, Journal of Materials science, Vol 29, pp 1109-1114(1994).
17. Zamfirova and Dimitrova A, “Some methodological contributions to the Vickers microhardness technique”, Polymer Testing, Vol 19, pp 533-542 (2000).
18. Calleja FJ, Santa Cruz, Bayer RK and Kilian HG, “Microhardness and surface free energy in linear polyethylene: The role of entanglements”, Colloid and Polymer Science, Vol 268, pp 440-446(1990).
19. Lopez J, “Microhardness Testing of Plastics: Literature Review”, Polymer Testing, Vol 12, pp 437-458(1993).
20. Fakirov S, Krumova M and Rueda DT, “Microhardness model studies on branched polyethylene”, Polymer, Vol 41, pp 3047-3056(2000).
21. Hartman B, Gilbert FL, and Richard FC, “Tensile yield in Polyethylene”, Polymer Engineering and Science, Vol 26, 1986, pp 554-559.
22. Shishesaz MR and Donatelli AA, “Tensile Properties of Polyethylene Blends”, Polymer Engineering and Science, Vol 21, No 13, pp 869-872(1981).
23. Seguela R and Reistch F, “Double-yield point in polyethylene under tensile loading”, J. Materials Science letters, Vol 9, pp 46-47 (1990).
24. Balsamo V and Muller AJ, “The phenomenon of double-yielding under tension in low-density polyethylene and their blends”, Journal of Materials science letters, Vol.12, pp 1457-1459(1993).
25. Yamada K and Takayanagi M, “Superstructural Description of Deformation Process in Uniaxial Extension of Preoriented Isotactic Polypropylene”, Journal of Applied Polymer Science, Vol 24, pp 781-799 (1979).
26. Lucas JC, Failla MD, Smith FL, Mandelkern L and Peacock AJ, “The Double Yield in the Tensile Deformation of the Polyethylenes”, Polymer Engineering and Science, Vol 35, No13, pp 1117-1123 (1995).
27. Muramatsu S, Lando JB, “Double yield points in Poly(tetramethylene terephthalate) and its copolymers under tensile loading”, Polymer Engineering and Science, Vol 35, No13, pp 1077-1085 (1995).

150
28. Plaza AR, Ramos E, Manzur A, Olayo T, and Escobar A, “Double-yield points in triblends of LDPE, LLDPE and EPDM”, Journal of Materials science, Vol 32, pp 549-554(1997).
29. Seguela R and Darras O., “Phenomenological aspects of the double-yield of polyethylene and related copolymers under tensile loading”, Journal of Materials science, Vol 29, pp 5342-5352(1994).
30. Rajendra K; Lamborn J, “Tensile properties of linear low-density polyethylene (LLDPE) blown films”, Polymer Engineering and Science, Vol 40, No 11, 2000, pp 2385-2396.
31. Jafari S, Rana, Surya K., “Tensile fracture morphology/properties correlation of high-density/linear low-density polyethylene blends”, Iranian Polymer journal, Vol 9, No 3, 2000, pp 133-142.
32. Cho K; Lee BH; Hwang K; Lee H; Soonja C, “Rheological and mechanical properties in PE blends”, Polymer Engineering and Science, Vol 38, No 12, 1998, pp 1969-1975.
33. Muller AJ, Balsamo V and Rosales CM, “On the miscibility and mechanical Compatibility of Low density and Linear low density polyethylene blends”, Polymer Networks and Blends, Vol 2, No 4, pp 215-223(1992).
34. La Mantia FP and Acierno D, “Mechanical properties of blends of low density with linear low-density polyethylene”, European Polymer Journal, Vol 21, No 9, pp 811-813(1985).
35. Mantia FP, Valenza A and Acierno D, “Influence of the structure of linear density polyethylene on the rheological and mechanical properties of blends with low density polyethylene”, European Polymer Journal, Vol 22, No 8, pp 647-652(1986).
36. Yamaguchi M, Shigehiko A, “LLDPE/LDPE Blends .I. Rheological, Thermal and Mechanical Properties”, Journal of Applied Polymer Science, Vol 74, pp 3153-3159(1999).
37. Liu Y, and Truss R, “Tensile yielding and microstructures of blends of isotactic polypropylene and LLDPE”, Journal of Polymer Physics: part B, Vol 33, 1995, pp 813-822.
38. Wilkes GL, Jordens K, Janzen J, Rohlfing DC, Welch MB, “The influence of molecular weight and thermal history on the thermal, rheological, and mechanical properties of metallocene catalysed linear polythylenes”, Polymer, Vol 41, pp 7175-7192.
39. Tanem BS and Stori A, “Blends of single-site linear and branched polyethylene. I. Thermal characterization”, Polymer, Vol 42, pp 5389-5399(2001).

151
40. Lee, Sang-Won; Kim, Jang-Yup; Hyun, Uk; Huh, Wansoo, “Crystallisation behavior and mechanical properties of low-density polyethylene and metallocene linear low-density polyethylene blend”, American Chemical Society, Polymer preprints, Division of Polymer chemistry, Vol 40, No 2, 1999, pp 776-777.
41. Popli R, and Mandelkern L, “Influence of Structural and Morphological Factors on the Mechanical Properties of the Polyethylenes”, J.Polym.Sci. Part B: Polym.Phys, Vol 25, pp 441-483(1987).
42. Kennedy MA, Peacock AJ and Mandelkern L, “Tensile Properties of Crystalline Polymers: Linear Polyethylene”, Macromolecules, Vol 27, pp 5297-5310 (1994).
43. Alizadeh A, Escalona M, Lafuente P, Ramos G, Salazar JM, “Structure and melting of blends of linear and branched polyethyenes crystallized at high under cooling”, Polymer, Vol 38, No 5, 1997, pp 1207-1214.
44. Morgan, RL; Hill, MJ; Barham, PJ; Kip, BJ, “Study of the phase behavior of PE blend using micro-Raman imaging”, Polymer, Vol 42, No 5, 2001, pp 2121-2135.
45. Kristiansen PE; Hansen EW; Pedersen B, “Isothermal crystallization of PE by in situ NMR and analyzed within the Avrami’ model framework”, Polymer, Vol 42, No 5, 2001, pp 1969-1980.
46. Morgan RL; Hill, MJ; Barham, “Morphology, melting behavior and co-crystallisation in PE blends: the effect of cooling rate on two homogenously mixed blends”, Polymer, Vol 40, No 2, 1999, pp 337-348.
47. Popli R, and Mandelkern L, “The transition in Ethylene copolymers: The β-transition”, Polymer Bulletin, Vol9, pp 260-267 (1983).
48. Junting Xu; Xurong Xu; Chen L, “Effect of composition distribution on miscibility and co-crystallisation phenomena in the blends of LDPE with conventional and metallocene-based ethylene-butene copolymers”, Polymer, Vol 42, No 8, 2001, pp 3867-3874.
49. Weignall GD.; Londono JD; Lin, JS, “Morphology of blends of linear and long chain branched polyethylenes in the solid state: a study by SANS, SAXS and DSC”, Macromolecules, Vol 28, NO 9, 1995, pp 3156-3167.
50. Drummond, Kate M.; Hopewell, Jefferson l.; Shanks, Robert A., “Crystallisation of LDPE and LLDPE rich blends”, Journal of Applied Polymer Science, Vol 78, No 5, 2000, pp 1009-1016.
51. Gupta AK, Rana SK and Deopura BL, “Crystallization behavior of HDPE/LLDPE blend”, Journal of Applied Polymer Science, Vol 44, 1992, pp 719-726.

152
52. Utracki, Abdellah LA, “Compatibilisation of polymer blends”, Progress in Rubber and Plastics Technology, Vol 33, No 3, 1997, pp 153-188.
53. Stein K, Shi RH and Richard S, “Characterization and properties of PE blends”, Journal of polymer science part B: polymer physics, Vol 25, 1987, pp 89-103.
54. Prasad A, “Quantitative analysis of LDPE and LLDPE blends by DSC and Fourier transform infrared spectroscopy methods”, Polymer Engineering and Science, Vol 38, No 10, 1998, pp 1716-1728.
55. Datta NK, Birley AW, “Thermal Analysis of Polyethylene Blends”, Plastics and Rubber Processing and Applications, Vol.2, 237-245(1982).
56. Lee HS, and Denn MM, “Blends of linear and branched polyethylenes”, Polymer Engineering and Science, Vol 40, 2000, 1132-1142.
57. Rosario, Perena JM, Antonio B, and Perez E., “Influence of chemical composition distribution and thermal history on the mechanical properties and viscoelastic relaxations of ethylene-1-butene copolymers”, J. Mat. Science letters, Vol 25, pp 4162-4168 (1990).
58. Rana D, Cho K, Woo T, Lee BH and Choe S., “Blends of Ethylene 1-otene copolymer synthesized by Ziegler-Natta and Metallocene catalysts. I. Thermal and Mechanical Properties”, Journal of Applied Polymer Science, Vol 74, pp 1169-1177(1999).
59. Starck P, and Lofgren B, “Thermal Properties of ethylene/long chain α-olefin copolymers produced by metallocenes”, European Polymer Journal, Vol 38, pp 97-107(2002).
60. Mezghani K, Campbell RA, Phillips PJ, “Lamellar thickening and the equilibrium melting point of polypropylene”, Macromolecules, Vol 27, pp 997-1002(1994).
61. ASTM Handbook for Plastics, Vol. 8.01.

VITA
NAME: Mohammad Faheem
PLACE OF BIRTH: Warangal, INDIA.
ADDRESS: H No.5-2-28, Kothur Street,
Hanamkonda,
Warangal (AP) -506001,
INDIA.
E-MAIL: [email protected]
EDUCATIONAL QUALIFICATION:
M.S (Mechanical Engineering)
June 2003
King Fahd University of Petroleum and Minerals
Dhahran, Saudi Arabia.
B.E (Mechanical Engineering)
May 1999
Osmania University
Hyderabad, India.