a study of textile & clothing supply chain in...
TRANSCRIPT
A STUDY OF TEXTILE & CLOTHING
SUPPLY CHAIN IN PAKISTAN
Deedar Hussain1, Manuel Figueiredo2, Anabela Tereso3, Fernando Ferreira4
1 NED University, Karachi, Pakistan and University of Minho, Braga, Portugal,
[email protected] University of Minho, School of Engineering, Braga, Portugal, [email protected]
3 University of Minho, School of Engineering, Braga, Portugal, [email protected] University of Minho, School of Engineering, Braga, Portugal, [email protected]
1
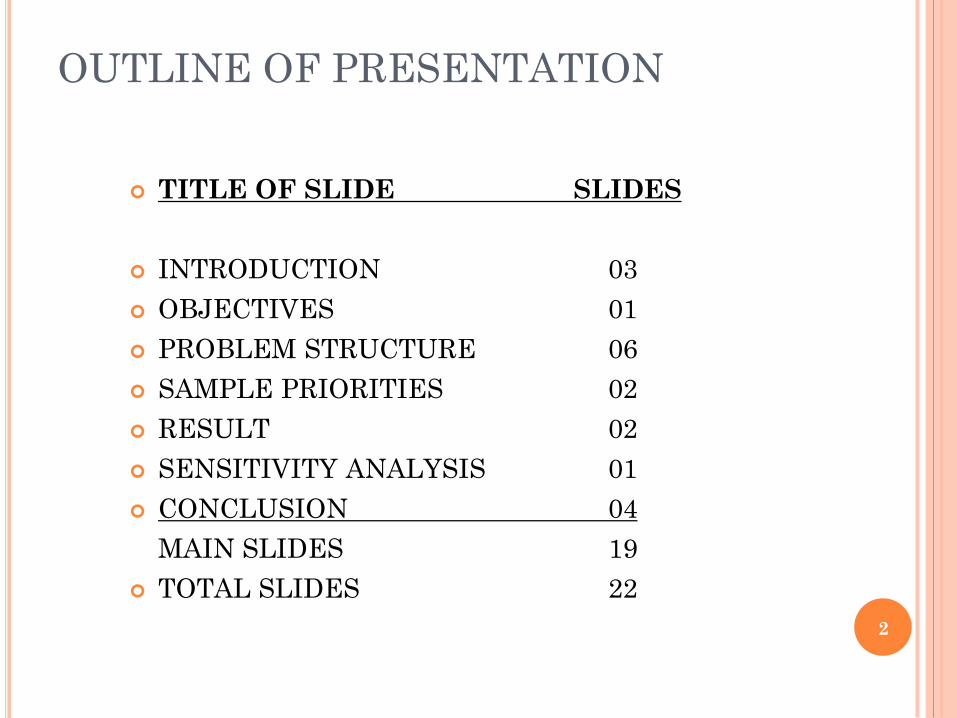
OUTLINE OF PRESENTATION
TITLE OF SLIDE SLIDES
INTRODUCTION 03
OBJECTIVES 01
PROBLEM STRUCTURE 06
SAMPLE PRIORITIES 02
RESULT 02
SENSITIVITY ANALYSIS 01
CONCLUSION 04
MAIN SLIDES 19
TOTAL SLIDES 22
2

INTRODUCTION
Textile and clothing supply chains are complex
chain of activities which are scattered around
the world and linked virtually. Every entity or
group of entities manage their functions to
respond customer demand.
The skills and technology required for standard
products are easy to adopt and this nature of
the business has helped its dispersion
worldwide. 3

INTRODUCTION
The end of the quota regime has geared-up its manufacturing in Asian and Far East regions which are well suited to their low
cost production because of lower wages and indigenous natural fibers.
The phenomenon of this industrial shift towards low labor wage economies is
discussed by Loo (2002) and Bolisani and Scarso (1996).
4

INTRODUCTION
Expansion of textile and clothing chain in the
Asian region has increased competition and
consequently the need for improving
integration in the chain.
Strategies are being designed to improve
competitiveness and responsiveness of the
chains with increasing diversification of
products.
5

OBJECTIVES
Priorities strategies
formulated by experts
to improve competitiveness
in textile and clothing supply chain
in Pakistan
Using Saaty´s ANP
and
study their effects
6

PROBLEM STRUCTURE
The problem is converted into a hierarchical
decision problem for experts from case supply
chain to prioritize competitive strategies.
Inner dependence of the criteria, that was
initially ignored, is introduced here. Thus, the
overall priorities are revised taking into account
these inner dependencies.
The results of both cases are compared and
conclusions are drawn.
7
PROBLEM STRUCTURE
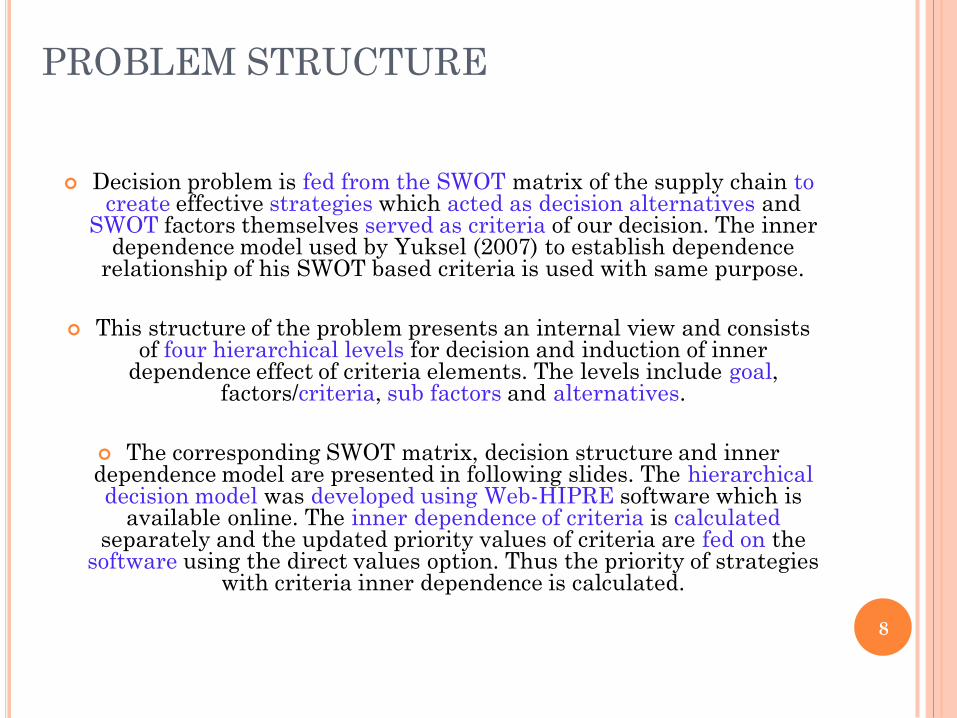
Decision problem is fed from the SWOT matrix of the supply chain to create effective strategies which acted as decision alternatives and
SWOT factors themselves served as criteria of our decision. The inner dependence model used by Yuksel (2007) to establish dependence
relationship of his SWOT based criteria is used with same purpose.
This structure of the problem presents an internal view and consists of four hierarchical levels for decision and induction of inner
dependence effect of criteria elements. The levels include goal, factors/criteria, sub factors and alternatives.
The corresponding SWOT matrix, decision structure and inner dependence model are presented in following slides. The hierarchical decision model was developed using Web-HIPRE software which is
available online. The inner dependence of criteria is calculatedseparately and the updated priority values of criteria are fed on the
software using the direct values option. Thus the priority of strategies with criteria inner dependence is calculated.
8

PROBLEM STRUCTUREInternal Factors
Strengths Weaknesses
S1 - Indigenous cotton crop
S2 - Low wages/labor costs S3 - Strong investment in textiles &
made-ups
S4 - Skills in ICT
S5 - Skills in chemistry (for textile &
clothing chemical industry)
W1 - Limited base of non
cotton fibers W2 - Weak ginning sector
W3 - Lower cotton yield (per acre)
W4 - Low application & usage of ICT
W5 - Non competitive behavior of
entrepreneurs
W6 – Skills
W7 - Distance to marketsW8 - Underdeveloped logistics
W9 - Market awareness W10 - Input´s costs and continuity
W11 - Low Foreign Direct Investment (FDI)
Opportunities SO Strategy WO Strategy
Ex
tern
al
Fa
cto
rs
O1 - Technical Textile
O2 - Value added products (fashion,
children clothing & home
textiles)
O3 - Close to future marketsO4 - Government support for R&D
O5 - Dyes & chemical manufacturing
O6 - Machine manufacturing
O7 - Logistic link for Far East
to European Markets
SO1 - Diversification of product range
SO2 - Establishing industrial-parks with
common facilities of design &
development centers, ICT application
centers, effluent treatment, etc
SO3 - Applying export incentives
SO4 - Establishing downstream
links/facilities in competing regions
(Turkey, Egypt, Bangladesh &
Mexico...)
SO5 - Improving domestic chemical industry
WO1 - Skill development programs
WO2 - Expanding non cotton fibers base
WO3 - Improving logistics
WO4 - Developing effective linkage between
industry, academia and R&D
institutes
WO5 - Developing domestic engineering
industry
Threats
T1 - Political instabilityT2 - Regional competitors
ST Strategy
ST1 - Development of markets access
strategies
ST2 - Establishing down-stream facilities in
stable, near-to-market and competing
regions
WT Strategy
WT1 - Work in collaboration with
competitors
WT2 - Development and implementation of
long-term and coordinated policies
WT3 - Introduction of industry relief
packages
9
PROBLEM STRUCTURE
10
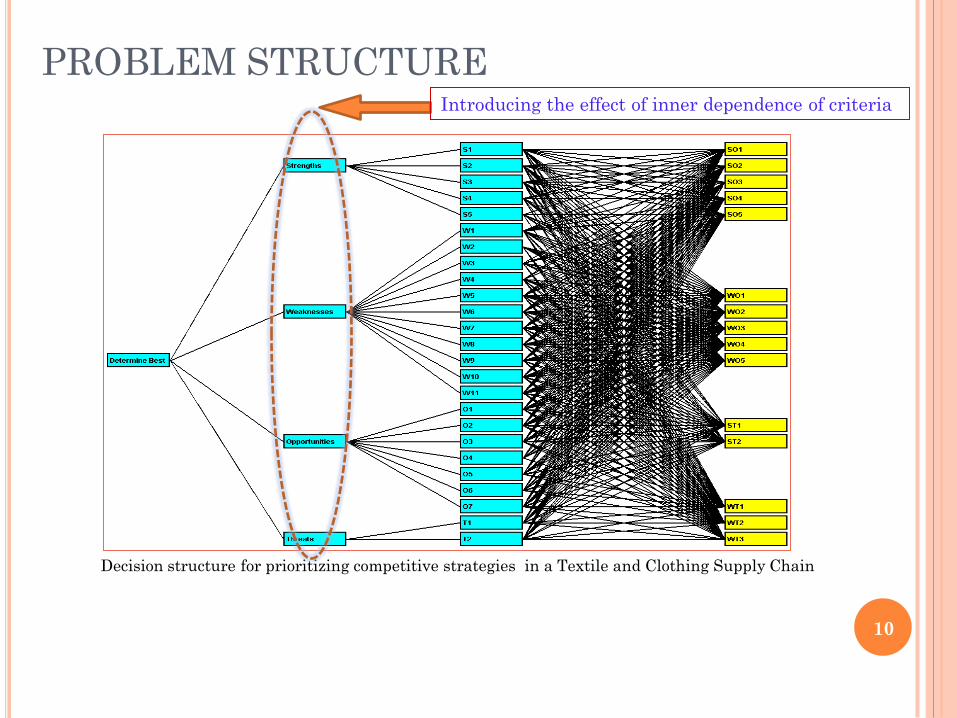
Decision structure for prioritizing competitive strategies in a Textile and Clothing Supply Chain
Introducing the effect of inner dependence of criteria

11
PROBLEM STRUCTURE
SWOT Criteria inner-dependence model Yuksel (2007)

PROBLEM STRUCTURE
12
After developing decision
structure, pair wise
comparison matrices were
constructed to introduce
preferences between
elements of the same
level in achieving the
criteria in the level
immediately above them
by using Saaty´s
fundamental scale of
absolute numbers.
Intensity of importance
Definition Explanation
1 Equal importance
Two activities
contribute equally to
theobjective
2 Weak or slight
3 Moderate importance
Experience and judgment
slightly
favor one activity over
another
4 Moderate plus
5 Strong importance
Experience and judgment
strongly favor one activity
over another
6 Strong plus
7Very strong or demonstrated
importance
An activity is favored very
strongly over another; its
dominance demonstrated in
practice
8 Very, very strong
9 Extreme importance
The evidence favoring one
activity over another is of the
highest possible order of
affirmation
Reciprocals of
above
If activity i has one of the
above nonzero numbers
assigned to it when compared
with activity j, then j has the
reciprocal value when
compared with i
A logical assumption
DECISION ELEMENTS PRIORITIES
13
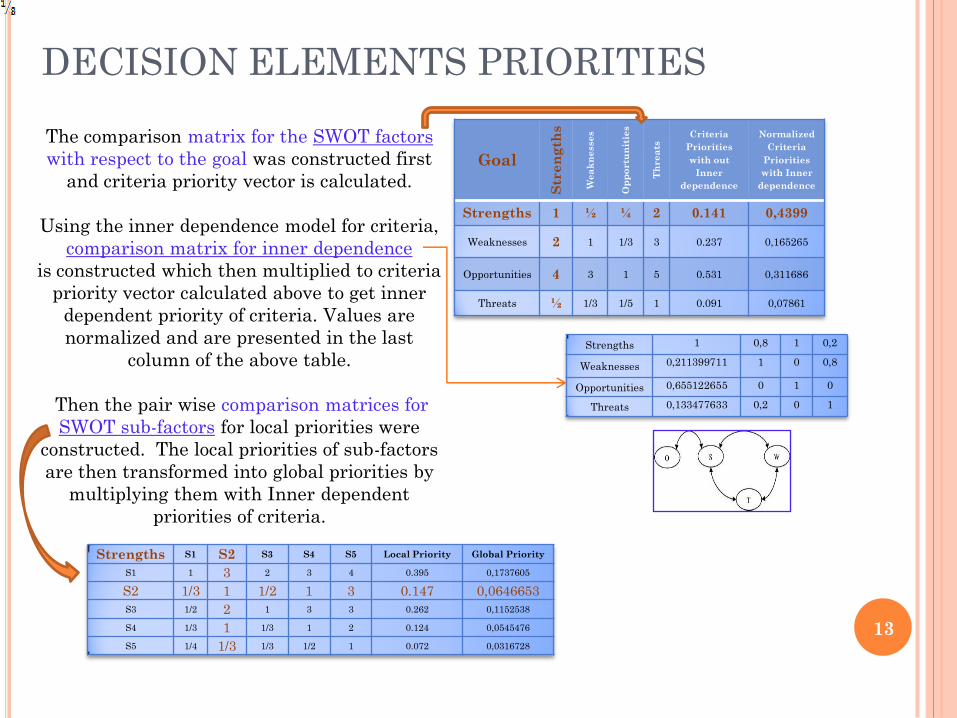
The comparison matrix for the SWOT factors
with respect to the goal was constructed first
and criteria priority vector is calculated.
Using the inner dependence model for criteria,
comparison matrix for inner dependence
is constructed which then multiplied to criteria
priority vector calculated above to get inner
dependent priority of criteria. Values are
normalized and are presented in the last
column of the above table.
Then the pair wise comparison matrices for
SWOT sub-factors for local priorities were
constructed. The local priorities of sub-factors
are then transformed into global priorities by
multiplying them with Inner dependent
priorities of criteria.
Goal
Str
en
gth
s
We
ak
ne
sse
s
Op
po
rtu
nit
ies
Th
re
ats
Criteria
Priorities
with out
Inner
dependence
Normalized
Criteria
Priorities
with Inner
dependence
Strengths 1 ½ ¼ 2 0.141 0,4399
Weaknesses 2 1 1/3 3 0.237 0,165265
Opportunities 4 3 1 5 0.531 0,311686
Threats ½ 1/3 1/5 1 0.091 0,07861
Strengths S1 S2 S3 S4 S5 Local Priority Global Priority
S1 1 3 2 3 4 0.395 0,1737605
S2 1/3 1 1/2 1 3 0.147 0,0646653
S3 1/2 2 1 3 3 0.262 0,1152538
S4 1/3 1 1/3 1 2 0.124 0,0545476
S5 1/4 1/3 1/3 1/2 1 0.072 0,0316728
Strengths 1 0,8 1 0,2
Weaknesses 0,211399711 1 0 0,8
Opportunities 0,655122655 0 1 0
Threats 0,133477633 0,2 0 1
14
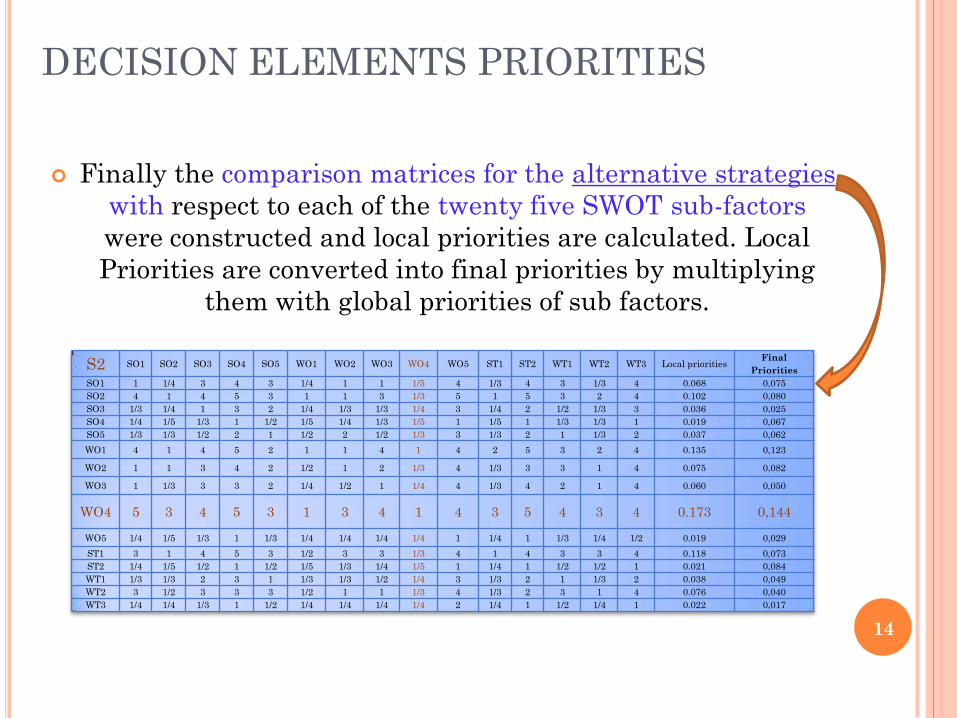
Finally the comparison matrices for the alternative strategies
with respect to each of the twenty five SWOT sub-factors
were constructed and local priorities are calculated. Local
Priorities are converted into final priorities by multiplying
them with global priorities of sub factors.
DECISION ELEMENTS PRIORITIES
S2 SO1 SO2 SO3 SO4 SO5 WO1 WO2 WO3 WO4 WO5 ST1 ST2 WT1 WT2 WT3 Local prioritiesFinal
Priorities
SO1 1 1/4 3 4 3 1/4 1 1 1/5 4 1/3 4 3 1/3 4 0.068 0,075
SO2 4 1 4 5 3 1 1 3 1/3 5 1 5 3 2 4 0.102 0,080
SO3 1/3 1/4 1 3 2 1/4 1/3 1/3 1/4 3 1/4 2 1/2 1/3 3 0.036 0,025
SO4 1/4 1/5 1/3 1 1/2 1/5 1/4 1/3 1/5 1 1/5 1 1/3 1/3 1 0.019 0,067
SO5 1/3 1/3 1/2 2 1 1/2 2 1/2 1/3 3 1/3 2 1 1/3 2 0.037 0,062
WO1 4 1 4 5 2 1 1 4 1 4 2 5 3 2 4 0.135 0,123
WO2 1 1 3 4 2 1/2 1 2 1/3 4 1/3 3 3 1 4 0.075 0,082
WO3 1 1/3 3 3 2 1/4 1/2 1 1/4 4 1/3 4 2 1 4 0.060 0,050
WO4 5 3 4 5 3 1 3 4 1 4 3 5 4 3 4 0.173 0,144
WO5 1/4 1/5 1/3 1 1/3 1/4 1/4 1/4 1/4 1 1/4 1 1/3 1/4 1/2 0.019 0,029
ST1 3 1 4 5 3 1/2 3 3 1/3 4 1 4 3 3 4 0.118 0,073
ST2 1/4 1/5 1/2 1 1/2 1/5 1/3 1/4 1/5 1 1/4 1 1/2 1/2 1 0.021 0,084
WT1 1/3 1/3 2 3 1 1/3 1/3 1/2 1/4 3 1/3 2 1 1/3 2 0.038 0,049
WT2 3 1/2 3 3 3 1/2 1 1 1/3 4 1/3 2 3 1 4 0.076 0,040
WT3 1/4 1/4 1/3 1 1/2 1/4 1/4 1/4 1/4 2 1/4 1 1/2 1/4 1 0.022 0,017
RESULTS
15
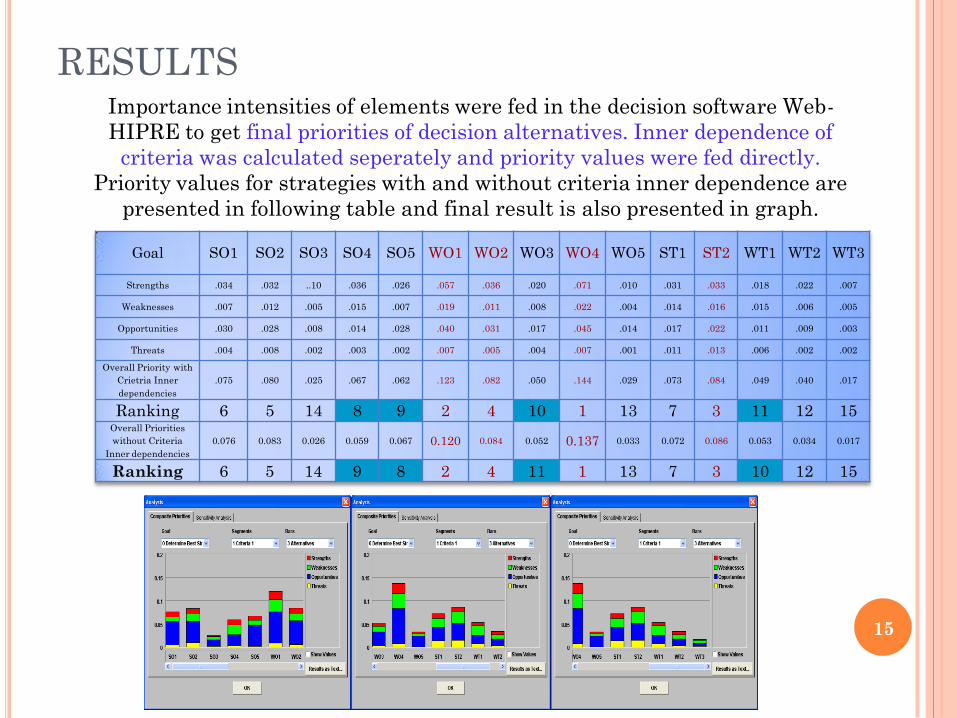
Importance intensities of elements were fed in the decision software Web-
HIPRE to get final priorities of decision alternatives. Inner dependence of
criteria was calculated seperately and priority values were fed directly.
Priority values for strategies with and without criteria inner dependence are
presented in following table and final result is also presented in graph.
Goal SO1 SO2 SO3 SO4 SO5 WO1 WO2 WO3 WO4 WO5 ST1 ST2 WT1 WT2 WT3
Strengths .034 .032 ..10 .036 .026 .057 .036 .020 .071 .010 .031 .033 .018 .022 .007
Weaknesses .007 .012 .005 .015 .007 .019 .011 .008 .022 .004 .014 .016 .015 .006 .005
Opportunities .030 .028 .008 .014 .028 .040 .031 .017 .045 .014 .017 .022 .011 .009 .003
Threats .004 .008 .002 .003 .002 .007 .005 .004 .007 .001 .011 .013 .006 .002 .002
Overall Priority with
Crietria Inner
dependencies
.075 .080 .025 .067 .062 .123 .082 .050 .144 .029 .073 .084 .049 .040 .017
Ranking 6 5 14 8 9 2 4 10 1 13 7 3 11 12 15Overall Priorities
without Criteria
Inner dependencies
0.076 0.083 0.026 0.059 0.067 0.120 0.084 0.052 0.137 0.033 0.072 0.086 0.053 0.034 0.017
Ranking 6 5 14 9 8 2 4 11 1 13 7 3 10 12 15
RESULTS
16
2nd Group of Strategies
Rank Strategy
Priorities
With
Criteria
Inner
dependenc
ies
Without
Criteria
Inner
dependenc
ies
5th
SO2: Establishing Industrial Parks
with Common Facilities of Design &
Development Centers, ICT
Application Centers & Effluent
Treatment Plants etc
.0800.083
6 thSO1: Diversification of Product
Range
.0750.076
7th ST1: Development of Market Access
Strategies.073 0.072
9th SO5: Improving Domestic Chemical
Industry.062 0.067
8thSO4: Establishing Downstream
Facilities in Competing Regions.067 0.059
11thWT1: Work in Close Collaboration
with Competitors.049 0.053
10thWO3: Improving Logistics
.050 0.052
Overall Group Priority 0.456 0.462
1st Group of Strategies
Rank Strategy
Priorities
With
Criteria
Inner
dependenci
es
Without
Criteria
Inner
dependenci
es
1st
WO4: Developing Effective Linkage
between Industry, Academia and R&D
Institutes
.144 0.137
2ndWO1: Skill Development Programs
.123 0.120
3rd
ST2: Establishing Down Stream
Facilities in Stable, Near to Market
and Competing Regions .084 0.086
4th
WO2: Expanding Non-cotton Fiber
Base .082 0.084
Overall Group Priority 0.433 0.427
3rd Group of Strategies
Rank Strategy
Priorities
With
Criteria
Inner
dependen
cies
Without
Criteria
Inner
dependen
cies
12th
WT2: Development and
Implementation of Long-term &
Coordinated Policies
.040 0.034
13thWO5: Developing Domestic
Engineering Industry.029 0.033
14thSO3: Applying Export Incentives
.025 0.026
15th
WT3: Introduction of Industry
Relief Packages .017 0.017
Overall Group Priority 0.111 0.11

SENSITIVITY ANALYSIS
17
Sensitivity analysis of results shows that the
effectiveness of strategies is sustained for different
degrees of importance of factors, strengths,
weaknesses, opportunities and threats

CONCLUSION
18
Strategies developed for achieving competitiveness in
textile and clothing supply chain in Pakistan and
their potential effects were studied here.
Our study is mainly focused to textile and clothing
SC but some of the strategies are also found relevant
in general economic status and business environment
in the country as discussed by Schwab (2009) in The
Global Competitiveness Report.
That report identifies the most problematic factors
and include among others:
Political/Government Stability, Inadequate Supply of
Infrastructure, Inadequately Educated Work Force
and Policy Instability.
CONCLUSION
This study directs our intention to analyze these
strategies with an external view with more
generalized criteria as is familiar in supply chain
competitive scenario. Here the criteria were viewed
internally and the problem was formulated based on
SWOT factors.
We based our decision structure on Saaty´s AHP
with four hierarchical levels of goal, criteria, sub-
criteria and alternatives. Then we introduced the
effects of inner dependence of criteria elements and
we found that the priority of criteria is slightly
drifted in favor of strengths instead of heavily
focusing on opportunities and weaknesses in
prioritizing competitive strategies.
19
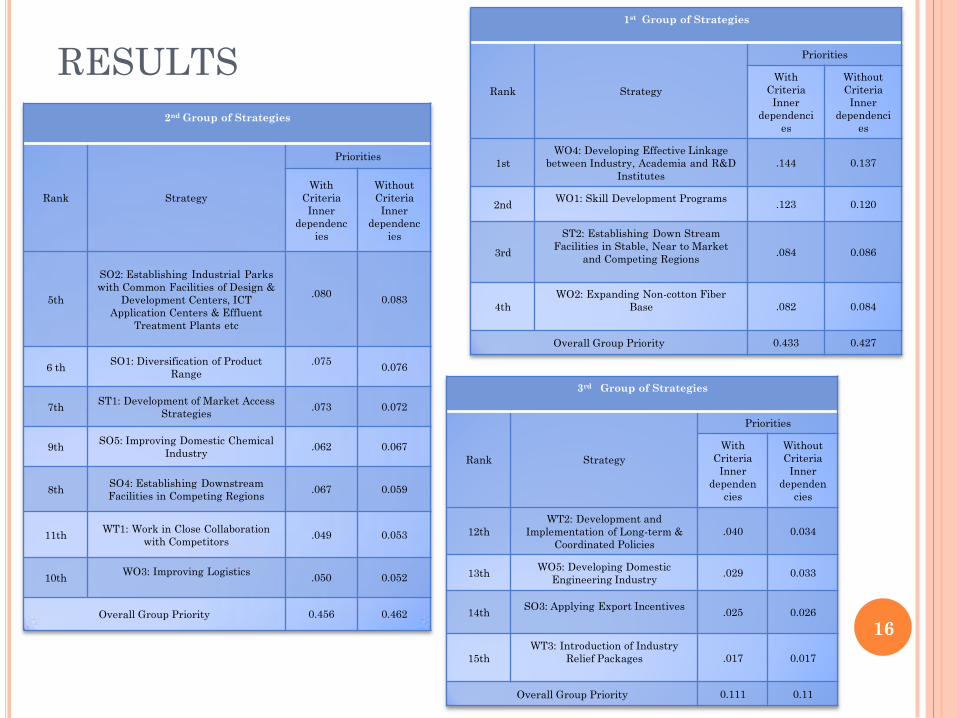
There apears a little change in priority values but the overall
result which was acheived without inner dependence of criteria
still valid.
Ranking of first group stratgies is not changed at all. In second
group which consists seven strategies, ranking of 9th and 11th
have improved as they occupied new ranks of 8th and 10th
respectively.
This seems logical as improving logistics for existing cotton based
chain can improve it´s responsiveness and improving presence in
competing regions can help improve market awareness which are
both lacking in existing scenario when market potential exists
(especialy in fashion market) but competition is sever.
The inner dependence at sub-criteria and alternative level is
logical expansion of this study but presents a complex situation
and a lot of inputs from experts and definitely much time
consuming.20
CONCLUSION
CONCLUSION
The results can be utilized for resource allocation
and policy diversion in favour of specific
developments and for other strategic decision
related to the supply chain.
&
These strategies can be applied in parallel by
different sources involved in the chain as
government agencies, academic and research
institutes, industrial associations and individual
industries.
21

THANKS
Questions are welcome...
22