a study of the ash constituents of apple fruits during the
TRANSCRIPT

BULLETIN 619 FEBRUARY, 1933
A Study of the Ash Constituents of Apple Fruits During the
Growing Season
E. F. Hopkins and J. H. Gourley
OHIO
AGRICULTURAL EXPERIMENT STATION
Wooster, Ohio
1111111
3

This page intentionally blank.
CONTENTS
Introduction . . . . . . . . . . • . . . . . . . . . . . . ................ , . . . . • . . . . . . . • . . .. 3 Methods of Sampling and Analysis . . . . . . . . . . . . . . . . . . . . . . . . . . . . . . . . . . . . 4 Results of the Analyses . . . . . . . . . . . . . . . . . . . . . . . . . . . . . . . . . . . . . . . . . . . . . . 5
Experiment 1. Fertilizer Test, East Orchard, Variety Stayman . . . . . . 6 Experiment 2. Varietal Test, West Orchard . . . . . . . . . . . . . . . . . . . . . . . 8 Experiment 3. Comparison of Stayman Fruits From the Main and
East Orchards ................................................ 10 Experiment 4. A Test of Fruit From Individual Trees From the East
Orchard ..................................................... 11 Discussion of Laboratory Analyses . . . . . . . . . . . . . . . . . . . . . . . . . . . . . . . . . . . . 11 The Storage Results . . . . . . . . . . . . . . . . . . . . . . . . . . . . . . . . . . . . . . . . . . . . . . . . . . 12 Conclusions . . . . . . . . . . . . . . . . . . . . . . . . . . . . . . . . . . . . . . . . . . . . . . . . . . . . . . . . . 14 Literature Cited . . . . . . . . . . . . . . . . . . . . . . . . . . . . . . . . . . . . . . . . . . . . . . . . . . . . . . 14 Appendix Tables . . . . . . . . . . . . . . . . . . . . . . . . . . . . . . . . • . • . . . . • • . . . . . . . • . . . • 15
(1)

This page intentionally blank.
A STUDY OF THE ASH CONSTITUENTS OF APPLE FRUITS DURING THE GROWING SEASON
E. F. HOPKINS AND J. H. GOURLEY
The factors influencing the keeping quality of apples continue to command the attention of both those who produce and those who dispose of this crop. For several years this Station has been studying the effects of various fertilizer treatments upon the composition and storage value of apples. Physiological breakdown has been particularly observed, since it is not caused by a pathogene but by some abnormal condition within the fruit itself; the causes and prevention of breakdown are, therefore, more obscure than if this condition were caused by the attack of some organism from without.
In a previous bulletin (5) the authors reported upon the nitrogen content of fruit produced on trees fertilized with various amounts of that element. Although apples contained considerably more total nitrogen if Chilean nitrate of soda had been applied to the trees, yet there was no correlation between the keeping quality of the fruit and the amounts of fertilizer applied to the trees.
The next problem was to determine whether the apples contained phosphorus and potassium in larger amounts if these elements had been used in the fertilizer treatment and whether the content of these elements, as well as other mineral constituents of the ash, bore any relation to the amount of breakdown which occurred when such apples were held in common or cold storage throughout the winter season. In all cases, only the flesh of the apples was used in analyses, since breakdown is a conspicuous phenomenon of the fleshy portion and does not seem to be associated with the seeds. The results of the analyses show the variations in total ash and the various constituents: (1) During the development of the fruit, (2) for various fertilizer treatments, (3) for different varieties, ( 4) for fruit from trees under the same fertilizer treatments, and (5) for fruit from individual trees under the same fertilizer treatment from the same orchard.
The fruit used in these studies was obtained from the orchards of the Ohio Agricultural Experiment Station at Wooster, Ohio. A description of these orchards is given in Bulletin 479 (5).
The storage data are for the season 1931-1932, this apple crop being the one on which the analyses in this bulletin are based. These data are given on Pages 12-14 and in Tables 32 and 33.
(3)
4 OHIO EXPERIMENT STATION: BULLETIN 519
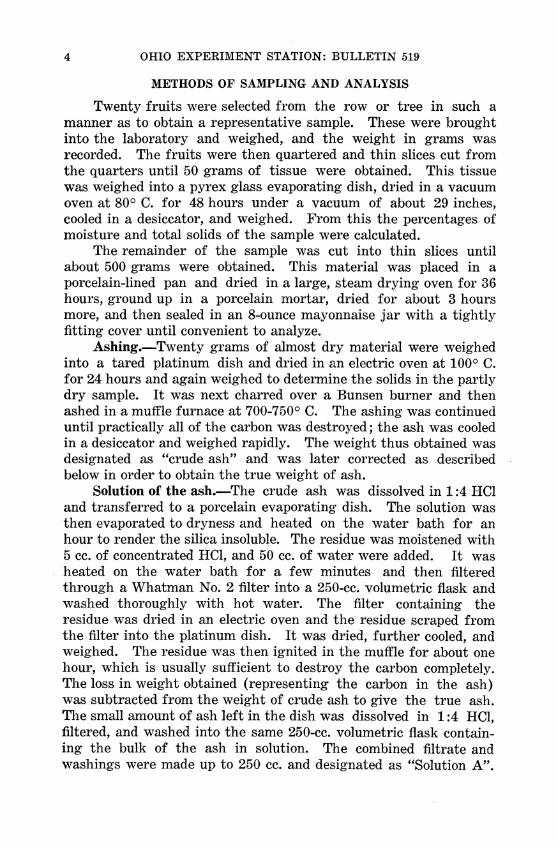
METHODS OF SAMPLING AND ANALYSIS
Twenty fruits were selected from the row or tree in such a manner as to obtain a representative sample. These were brought into the laboratory and weighed, and the weight in grams was recorded. The fruits were then quartered and thin slices cut from the quarters until 50 grams of tissue were obtained. This tissue was weighed into a pyrex glass evaporating dish, dried in a vacuum oven at 80° C. for 48 hours under a vacuum of about 29 inches, cooled in a desiccator, and weighed. From this the percentages of moisture and total solids of the sample were calculated.
The remainder of the sample was cut into thin slices until about 500 grams were obtained. This material was placed in a porcelain-lined pan and dried in a large, steam drying oven for 36 hours, ground up in a porcelain mortar, dried for about 3 hours more, and then sealed in an 8-ounce mayonnaise jar with a tightly fitting cover until convenient to analyze.
Ashing.-Twenty grams of almost dry material were weighed into a tared platinum dish and dried in an electric oven at 100° C. for 24 hours and again weighed to determine the solids in the partly dry sample. It was next charred over a Bunsen burner and then ashed in a muffle furnace at 700-750° C. The ashing was continued until practically all of the carbon was destroyed; the ash was cooled in a desiccator and weighed rapidly. The weight thus obtained was designated as "crude ash" and was later corrected as described below in order to obtain the true weight of ash.
Solution of the ash.-The crude ash was dissolved in 1 :4 HCl and transferred to a porcelain evaporating dish. The solution was then evaporated to dryness and heated on the water bath for an hour to render the silica insoluble. The residue was moistened with 5 cc. of concentrated HCl, and 50 cc. of water were added. It was heated on the water bath for a few minutes and then filtered through a Whatman No. 2 filter into a 250-cc. volumetric flask and washed thoroughly with hot water. The filter containing the residue was dried in an electric oven and the residue scraped from the filter into the platinum dish. It was dried, further cooled, and weighed. The residue was then ignited in the muffle for about one hour, which is usually sufficient to destroy the carbon completely. The loss in weight obtained (representing the carbon in the ash) was subtracted from the weight of crude ash to give the true ash. The small amount of ash left in the dish was dissolved in 1 :4 HCI, filtered, and washed into the same 250-cc. volumetric flask containing the bulk of the ash in solution. The combined filtrate and washings were made up to 250 cc. and designated as "Solution A".

ASH CONSTITUENTS OF APPLE FRUITS 5
Calcium.-Calcium was precipitated as the oxalate from an aliquot portion of Solution A and titrated with N/20 KMn04 according to the usual procedure.
Phosphorus.-This determination was made on an aliquot portion of Solution A by means of the colorimetric Bell-Doisy-Briggs Method (7). A 5-cc. aliquot sufficed for the analysis.
Potassium.-The filtrate from the calcium determination was used for this estimation. After the removal of iron, aluminum, and magnesium, the potassium was precipitated as the perchlorate and weighed on a Gooch crucible.
lron.-A 10-cc. aliquot of Solution A was used in this case, and the determination made according to the method of Stokes and Cain ( 6), with slight modifications.
Manganese.-Manganese was determined by oxidation with potassium periodate according to the procedure given in the "Official Methods" (1).
Sodium.-This element was determined in one sample by weighing the combined N aCl and KCl; the sodium was then determined by difference after the potassium determination was made.
Magnesium.-The magnesium was precipitated as ammonium magnesium phosphate and the phosphorus in the precipitate determined colorimetrically, as above, by the Bell-Doisy-Briggs Method.
RESULTS OF THE ANALYSES
Few analyses of the ash constituents of apple fruits have been reported. Browne (4) in 1901 reported the ash content of the flesh of ripe apple fruits to be 0.3 per cent, distributed as follows: K20, 55.94 per cent; Na20, 0.31 per cent; CaO, 4.43 per cent; MgO, 3.78 per cent; FeC03 , 0.95 per cent; Al20 3 , 0.8 per cent; Cl, 0.39 per cent; Si02 , 0.4 per cent; S03 , 2.66 per cent; P 20 5 , 8.64 per cent; and C021
21.6 per cent. Analyses of both green and ripe apples are given by Miss Brown (2, 3).
In the present work the ash obtained was light gray in color, showed a marked alkaline reaction to litmus when moistened with distilled water, and evolved C02 when treated with dilute hydrochloric acid. On evaporating the hydrochloric acid solution of the ash to dryness in a porcelain dish, a marked yellow ring was observed, indicating the presence of iron.
The analysis of a preliminary sample given in Table 1 will show the order of magnitude of the various constituents determined. This sample of the variety Ohio Nonpareil was taken from the Main
6 OHIO EXPERIMENT STATION: BULLETIN 519
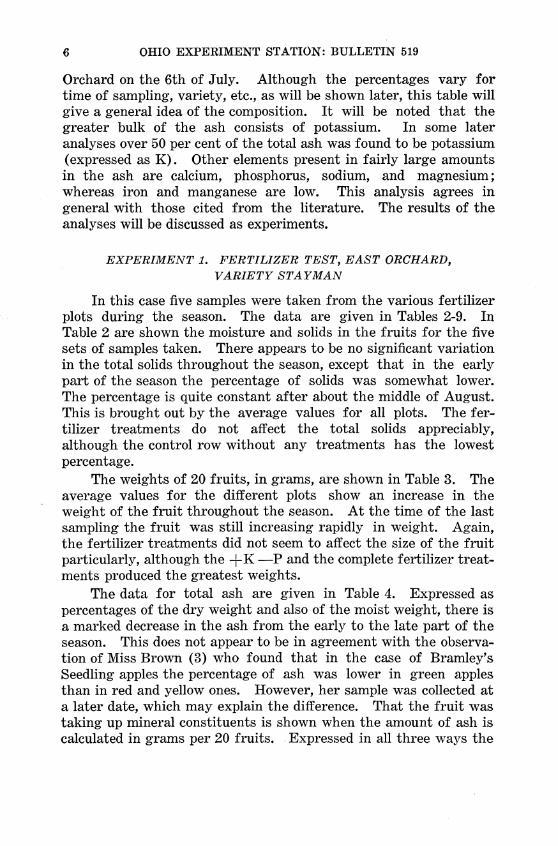
Orchard on the 6th of July. Although the percentages vary for time of sampling, variety, etc., as will be shown later, this table will give a general idea of the composition. It will be noted that the greater bulk of the ash consists of potassium. In some later analyses over 50 per cent of the total ash was found to be potassium (expressed as K). Other elements present in fairly large amounts in the ash are calcium, phosphorus, sodium, and magnesium; whereas iron and manganese are low. This analysis agrees in general with those cited from the literature. The results of the analyses will be discussed as experiments.
EXPERIMENT 1. FERTILIZER TEST, EAST ORCHARD, VARIETY STAYMAN
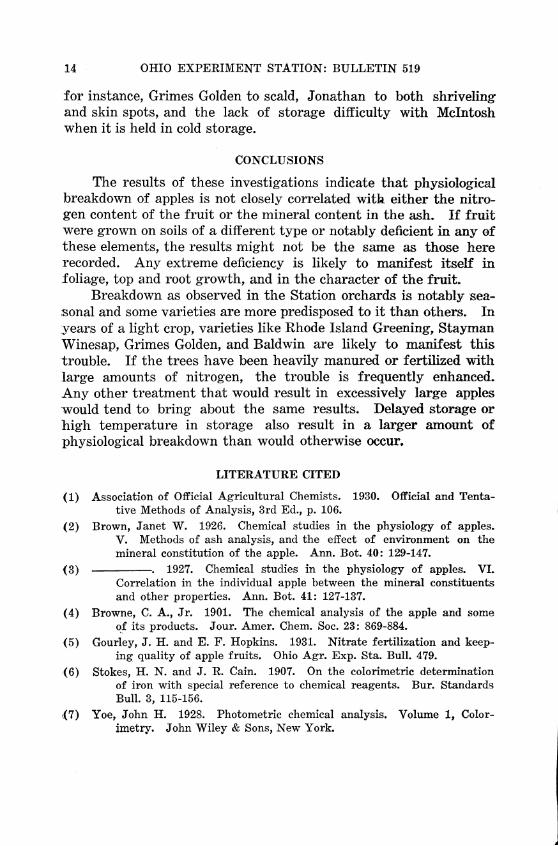
In this case five samples were taken from the various fertilizer plots during the season. The data are given in Tables 2-9. In Table 2 are shown the moisture and solids in the fruits for the five sets of samples taken. There appears to be no significant variation in the total solids throughout the season, except that in the early part of the season the percentage of solids was somewhat lower. The percentage is quite constant after about the middle of August. This is brought out by the average values for all plots. The fertilizer treatments do not affect the total solids appreciably, although the control row without any treatments has the lowest percentage.
The weights of 20 fruits, in grams, are shown in Table 3. The average values for the different plots show an increase in the weight of the fruit throughout the season. At the time of the last sampling the fruit was still increasing rapidly in weight. Again, the fertilizer treatments did not seem to affect the size of the fruit particularly, although the +K -P and the complete fertilizer treatments produced the greatest weights.
The data for total ash are given in Table 4. Expressed as percentages of the dry weight and also of the moist weight, there is a marked decrease in the ash from the early to the late part of the season. This does not appear to be in agreement with the observation of Miss Brown (3) who found that in the case of Bramley's Seedling apples the percentage of ash was lower in green apples than in red and yellow ones. However, her sample was collected at a later date, which may explain the difference. That the fruit was taking up mineral constituents is shown when the amount of ash is calculated in grams per 20 fruits. . Expressed in all three ways the
ASH CONSTITUENTS OF APPLE FRUITS 7
amount of ash is highest in the row receiving complete fertilizer minus phosphorus, low for the rows receiving sodium nitrate only and complete fertilizer minus potassium, and intermediate for the complete fertilizer and the control.
The results of the calcium determinations are given in Table 5. The percentage of calcium in the ash decreases markedly from July 9 to September 5. In general, the percentage of calcium in the ash is low where the percentage of ash is high and vice versa. The +K -P plot shows the lowest percentage of calcium in the ash; whereas the normal nitrate rows and the -K +P plot are high. The percentages calculated on the dry basis and moist basis show little difference for the six plots. However, the percentage of calcium both on the dry and moist basis shows a marked decrease as the season advances. Although the grams of calcium per 20 fruits show a striking increase, there is no significant variation in the different plots on this basis.
The data for phosphorus are given in Table 6. As is the case with calcium, the percentage of phosphorus in the ash decreases as the season advances, but the decrease is not nearly as great as in the former ca:se. The percentage of phosphorus in the ash is lowest in the +K -P plot and highest in the -K +P plot. Percentages on the dry and moist basis also show marked decreases as the season progresses; whereas the grams of phosphorus in 20 fruits show a rapid increase. These values are practically the same for all plots in the test.
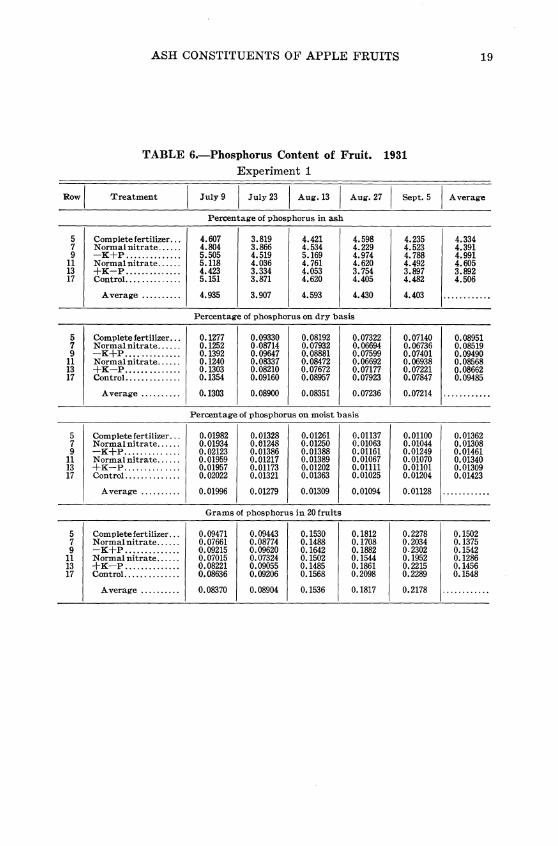
The data for potassium are given in Table 7. As mentioned before, the percentage of potassium in the ash is high. It is usually more than 40 per cent of the total ash. In this case it is interesting that, instead of the percentage decreasing throughout the season as is true of calcium and phosphorus, there is a marked increase from July 9 to July 23; from then on until September the percentage of potassium in the ash is fairly constant or increases only slightly. This will possibly explain the decrease in the percentage of calcium and phosphorus in the ash, since the calculation of these two elements on the basis of grams per 20 fruits shows that the fruit was taking up calcium and phosphorus throughout the season. The percentage of potassium in the ash from the +K -P plot was markedly higher than in the other cases, The complete fertilizer row was next; the control, the two normal nitrate rows, and the -K +Prow were low. Based on the dry weight and on the moist weight, the percentages of potassium decreased throughout the season, as was true of the other elements. It might be well to state here that these decreases are easily explained on the basis of the
8 OHIO EXPERIMENT STATION: BULLETIN 519
increase of the size of the fruit and the accumulation of carbohydrates so that while the fruits are continually taking up these mineral constituents the greater increase in weight of the fruit more than offsets the amounts of them found per 100 grams, thus causing the percentages to decrease. The same has been reported by us (5) for nitrogen.
Based on grams per 20 fruits, the amount of potassium increases greatly from July 9 to September 5. Calculated in all three ways the potassium variation in the six different rows gives the same picture. It is highest in the +K -P row, the complete fertilizer and the control rows are next and about the same, and the two normal nitrate rows and the -K +Prow are low.
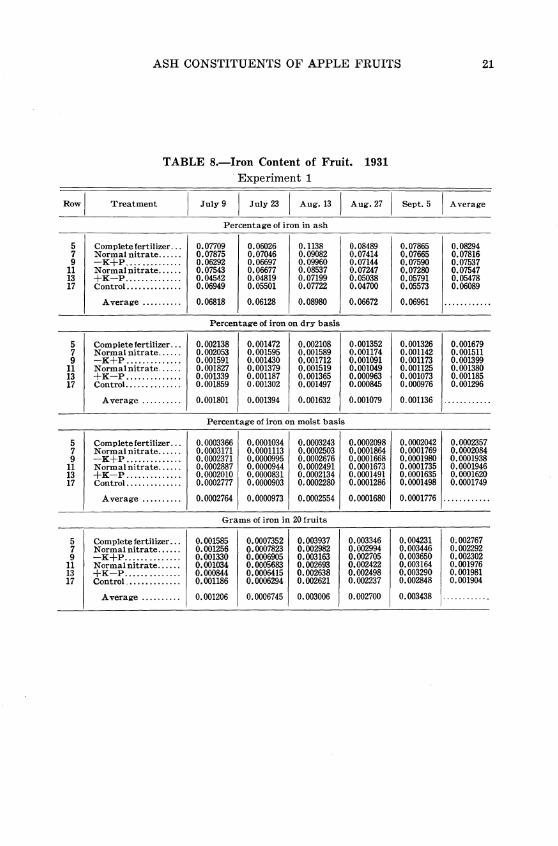
Since the amounts of iron are much lower than the other elements, it is possible that the results are not quite as dependable, although the determinations were very carefully made. The data are given in Table 8. The percentage of iron in the ash is quite uniform throughout the season. The percentage is highest in the complete fertilizer row, lowest in the +K -Prow, with intermediate values for the other treatments. On the basis of dry weight and moist weight there is the usual decrease as the season progresses in the percentage of iron as in the case of the other elements discussed. Here also the iron is lowest in the +K -P row and highest in the case of the complete fertilizer. In general, the grams of iron per 20 fruits increase from July 9 to September 5. On this basis no significant differences appear in the various plots except that the complete fertilizer treatment again shows the highest amount.
Because of the small amounts of manganese in the ash, this determination was discontinued after the second set of samples. There appear to be no significant differences between the two dates of sampling or between the different treatments. The data are presented in Table 9 to show the order of magnitude of the amounts of manganese in apple fruits.
EXPERIMENT 2. VARIETAL TEST, WEST ORCHARD
In this experiment two sets of samples were taken from rows of trees in the West Orchard under the same fertilizer treatments. Each of the six rows sampled is a different variety. The data are given in Tables 10-17.
From Table 10 it is seen that there is considerable variation in the percentage of solids, the Mcintosh variety being especially low, the Grimes and Winesap high, and the other varieties in between.

ASH CONSTITUENTS OF APPLE FRUITS 9
The weight in grams in 20 fruits also shows considerable difference between varieties as shown in Table 11. Mcintosh shows the greatest weight and Winesap the lowest; Jonathan is also quite low and the others intermediate. These differences may be partly varietal but, undoubtedly, are partly due to differences in the state of maturity of the fruits.
The percentages of ash and the grams of ash per 20 fruits are shown in Table 12. The percentages on the dry basis show no distinct differences, although that for Mcintosh is low. As might be expected because of the greater size of the fruit, the percentage of ash on the moist basis is especially low in the case of Mcintosh. The varieties Grimes and Winesap, on the other hand, show a high percentage of ash on the moist basis. Expressed as grams of ash per 20 fruits, Winesap and Jonathan are low and Mcintosh and Grimes high.
The data for calcium will be found in Table 13. The percentages in the ash, on the dry basis and moist basis, are lowest again in the case of the Mcintosh variety. This is especially true when calculated on the moist basis. The variety Winesap, on the other hand, shows the greatest amounts of calcium. Calculated as grams of calcium per 20 fruits, the variety Arkansas Black shows the greatest accumulation of calcium, with Stayman next. Jonathan is lowest and Mcintosh next lowest. The result for Mcintosh is interesting, since it shows that, even with the more rapid increase in the size of the fruit of this variety, the accumulation of calcium is relatively less.
The results for phosphorus are presented in Table 14. Expressed as the percentage of the ash, phosphorus is highest in the Mcintosh variety. This is just the reverse of what was found for the calcium. Jonathan, Stayman, and Grimes show fairly low percentages of calcium in the ash; whereas the other varieties are in between. On the dry basis the data do not show any definite trend, although the percentage in the case of Mcintosh is high and of Jonathan low.
On the moist basis, Jonathan and Mcintosh are low and the other varieties higher and about the same; expressed as grams per 20 fruits, Mcintosh is highest, Winesap and Jonathan low, and the others in between.
Table 15 shows the results for potassium. Grimes and Mcintosh have the highest percentage of potassium in the ash, Stayman, Arkansas Black, and Winesap are low, and Jonathan is intermediate. This shows an inverse relationship to the percentage of calcium in the ash. On the dry basis the percentages of
10 OHIO EXPERIMENT STATION: BULLETIN 519
potassium are about the same. On the moist basis Mcintosh and Jonathan are low, Grimes is high, and the others intermediate. The grams of potassium in 20 fruits are lowest in Jonathan and Winesap and highest in Mcintosh and Grimes.
The data for iron are given in Table 16. The percentage of iron in the ash is lowest for the variety Winesap and high for Jonathan and Mcintosh. The same holds true when expressed as percentages of the dry weight. On the moist basis there is considerable variation, but Winesap is the lowest, as is also true of iron per 20 fruits.
Table 17 shows that Mcintosh is especially low in manganese and that the other varieties show a rather uniform amount.
EXPERIMENT 3. COMPARISON OF STAYMAN FRUITS FROM THE MAIN AND EAST ORCHARDS
Two sets of samples were taken, one on August 6 and one on September 1, to see if differences in the soil or other factors would influence the ash content or the percentage of its various constituents. The results are set forth in Tables 18 to 26. Two trees from the Main Orchard and two rows from the East Orchard were used. The trees were all approximately the same age and had received the same fertilizer treatment.
On both dates of sampling the content of solids (Table 18) and the weight of the fruit (Table 19) were higher in the case of fruit from the East Orchard, indicating a somewhat more advanced state of maturity. This is also borne out by the percentages of ash (Table 20) on both the dry and moist basis. The grams of ash per 20 fruits were about the same, except that Row 1 from the East Orchard was slightly lower than the others. The percentages of calcium in the ash were lower in the case of the East Orchard (Table 21). The percentages on the dry basis, on the moist basis, and the total grams of calcium in 20 fruits were strikingly lower in the fruit from the East Orchard. The two samples from a given orchard were in each case very close to one another.
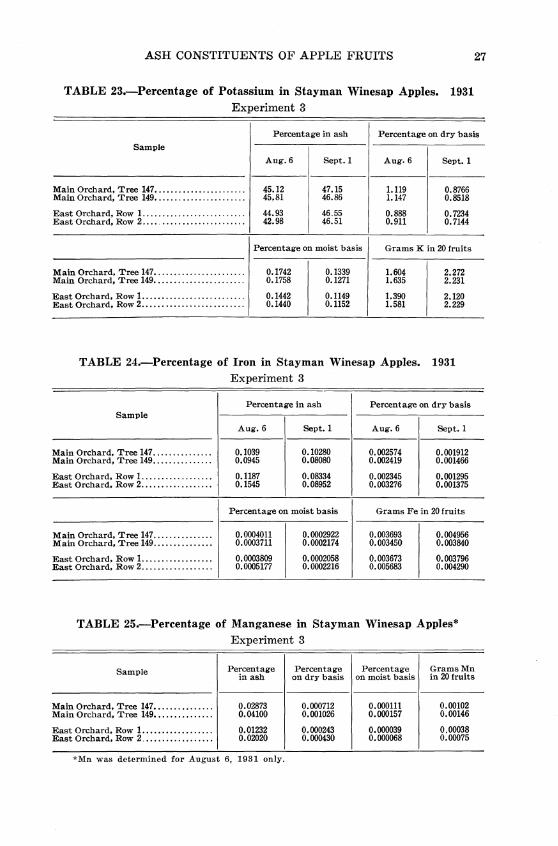
Phosphorus (See Table 22) in the ash was the reverse of calcium, there being a higher percentage in fruit from the East Orchard. Expressed on the dry basis and on the moist basis, the percentages are slightly higher for the East Orchard. As grams in 20 fruits the phosphorus is higher also in fruit from the East Orchard. The data for potassium (Table 23) show that the percentage in the ash is higher in fruit from the Main Orchard. The percentages on the dry and on the moist basis are also higher for this orchard, as are the amounts of potassium per 20 fruits.
ASH CONSTITUENTS OF APPLE FRUITS 11
The values for iron shown in Table 24 are variable, and no conclusions can be drawn from them.
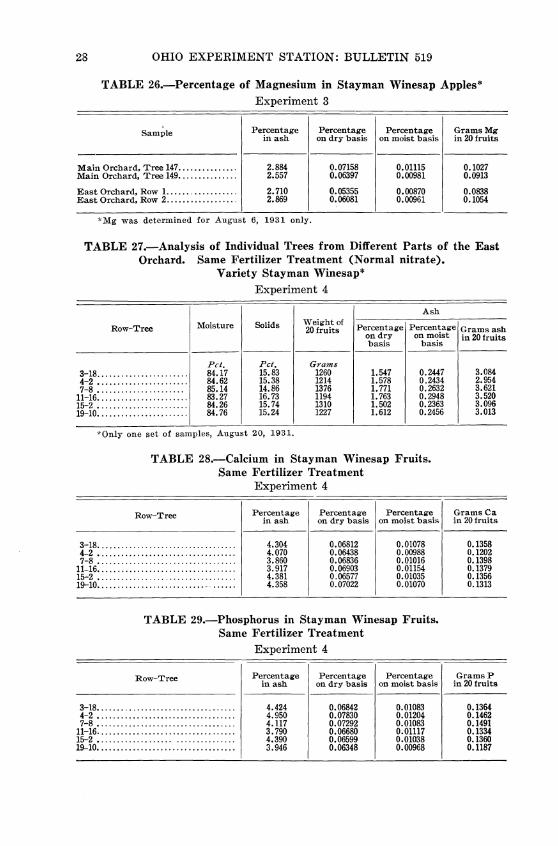
The one set of analyses for manganese (Table 25) show a much higher amount in fruit from the Main Orchard, however expressed. Magnesium (Table 26) also appears to be higher in the case of the Main Orchard, but the difference is not striking.
EXPERIMENT 4. A TEST ON FRUIT FROM INDIVIDUAL TREES FROM THE EAST ORCHARD
The trees for this study were selected so as to give a good distribution throughout the orchard. They were of the Stayman Winesap variety and had received the same fertilizer treatmentnamely, normal1 applications of sodium nitrate. The place of the trees in the orchard can be determined from the row and tree numbers given in Tables 27-31. The purpose of the test was to find out how the fruit from individual trees might vary in ash content and its various constituents.
As will be seen from Table 27 there is some fluctuation in the percentage of solids and the weight of 20 fruits, and these two things are correlated inversely. With the exception of Tree 8 in Row 7 there is shown an inverse correlation between the percentage of ash and the weight of the fruit, although the percentages of ash do not vary greatly.
The percentages of calcium (Table 28) are about the same for all six trees. The percentage of calcium in the ash is inversely related to the percentage of ash. The percentage of phosphorus in the ash (Table 29) shows considerable fluctuation but has no particular trend. On the dry and on the moist basis there is little variation.
The data for potassium and iron are given in Tables 30 and 31. Although there is some variation for the different trees, the data show no definite trend and will not be discussed further.
DISCUSSION OF LABORATORY ANALYSES
Besides giving a general idea as to the percentage composition of the ash and of its components in apple fruits, the preceding data. show several things about the variations in ash and ash composition under different conditions ·and also the changes which occur as the fruit matures. From Experiments 1 and 4, and possibly from Experiment 3, it is apparent that with increasing size or maturity <>f the apples, the percentage of total solids decreases, the percent-
'One-fourth pound for each year of tree's age.

12 OHIO EXPERIMENT STATION: BULLETIN 519
age of ash decreases, and also the percentages of calcium, phosphorus, potassium, and iron (as based on the dry and on the moist weight). This is due, as has been mentioned, to the greater increase in size of the fruit as compared to the uptake of these elements. On the other hand, the increases per apple show that
. these mineral constituents continue to be taken in by the fruit while it is developing.
As the fruit increases in size, the percentage of calcium in the ash decreases rapidly, phosphorus decreases less rapidly, and potassium increases.
The most interesting facts are in connection with the effect of fertilizer treatments on the ash composition. Fertilizers containing potassium result in an increase in the percentage of total ash and an increase in the amount of potassium in the ash. This is especially true when phosphorus is omitted. At the same time, the percentages of calcium and phosphorus in the ash are low. It appears that under these conditions the greater intake of potassium causes a decrease in these other elements when expressed as percentage of the ash, since, expressed as percentages of the dry weight of tissue, the percentages of both calcium and phosphorus are very nearly the same for all treatments. In general, a high ash content is associated with a high percentage of potassium in the ash.
The ash analysis of six varieties of apples is somewhat difficult to interpret because differences in the state of maturity may be a factor. It would perhaps show more in regard to varietal differences if all varieties were analyzed at full maturity or at picking time. The variety Mcintosh is quite distinct from the others in being exceptionally low in ash and calcium and high in phosphorus.
Distinct differences may occur in the ash composition of fruits from different localities, as shown by the data for Experiment 3. These differences seem to be associated partly with the soil, but it is possible that other factors may be concerned. In this case a high percentage of ash is associated with high percentages of calcium and potassium and low phosphorus.
Variation in the ash content of fruit from individual trees from the same orchard is also shown in Experiment 4.
THE STORAGE RESULTS
The 'ultimate answer to the question involved in these studies is to be found in the storage behavior of the apples; that is, does any given fertilizer treatment affect favorably or adversely the keeping quality of the fruit? However, the explanation of this
ASH CONSTITUENTS OF APPLE FRUITS 13
behavior must come from the laboratory. In this paper only the storage results for the storage season 1931-1932 are given, since it was in the growing season of 1931 that the ash analyses were made. Analyses are reported of apples collected in the Main Orchard, but no storage records are included for apples from these trees. This is because certain comparisons were desirable between apples grown on trees of different ages and on different soils and, also, of some other varieties than those included in the main experiment.
In observing the storage behavior of the apples, data upon the following were recorded: Physiological breakdown, decay (from any cause), shriveling, scald, and skin spots. Although these records were taken monthly, only the percentages for the storage season are given.
The cold storage varied in temperature from 32° F. to 34° F. and the common, or air-cooled, storage from 65° F. or higher at the beginning of the season to from 32° F. to 35° F. during the winter. A temperature of 35° F. was reached by November. In the latter storage the cement floor was kept moist, and fans were used to accomplish forced ventilation, except during the coldest periods. While a uniform temperature would be more desirable, especially for experimental purposes, the conditions represented those found on most fruit farms in Ohio.
It will be noted from Table 32 that little breakdown occurred in 1931, but the highest amount, 7.4 per cent, was recorded in the untreated plot and not in the one receiving the most nitrogen. This tendency has prevailed throughout these experiments. Furthermore, the plots receiving phosphorus or potassium, or both, showed a very small amount of breakdown, just as did those receiving nitrogen only.
There was practically no decay throughout the season in any of the plots. Shriveling of this variety did not occur until late in the season and then it was slight. Scald has usually been notably worse on the apples from the high nitrogen plot No. 1 and slight on those from the untreated No.9, but this did not obtain in 1931-1932. We have no data that would allow an interpretation as to the differences in scald upon the basis of fertilizer treatments in this year's results. No skin spots developed on Stayman, such as are characteristic of some other varieties.
Fruit from the West Orchard showed very little breakdown as did that from the East Orchard, already noted (Table 32). Therefore, no conclusions can be drawn except that, in the year 1931, breakdown was not induced by any fertilizer combination used. The results do emphasize varietal susceptibility to other troubles;
14 OHIO EXPERIMENT STATION: BULLETIN 519
for instance, Grimes Golden to scald, Jonathan to both shriveling and skin spots, and the lack of storage difficulty with Mcintosh when it is held in cold storage.
CONCLUSIONS
The results of these investigations indicate that physiological breakdown of apples is not closely correlated witb. either the nitrogen content of the fruit or the mineral content in the ash. If fruit were grown on soils of a different type or notably deficient in any af these elements, the results might not be the same as those here recorded. Any extreme deficiency is likely to manifest itself in foliage, top and root growth, and in the character of the fruit.
Breakdown as observed in the Station orchards is notably sea:sonal and some varieties are more predisposed to it than others. In years of a light crop, varieties like Rhode Island Greening, Stayman Winesap, Grimes Golden, and Baldwin are likely to manifest this trouble. If the trees have been heavily manured or fertilized with large amounts of nitrogen, the trouble is frequently enhanced. Any other treatment that would result in excessively large apples would tend to bring about the same results. Delayed storage or high temperature in storage also result in a larger amount of physiological breakdown than would otherwise occur.
LITERATURE CITED
(1) Association of Official Agricultural Chemists. 1930. Official and Tentative Methods of Analysis, 3rd Ed., p. 106.
(2) Brown, Janet W. 1926. Chemical studies in the physiology of apples. V. Methods of ash analysis, and the effect of environment on the mineral constitution of the apple. Ann. Bot. 40: 129-147.
(3) . 1927. Chemical studies in the physiology of apples. VI. Correlation in the individual apple between the mineral constituents and other properties. Ann. Bot. 41: 127-137.
(4) Browne, C. A., Jr. 1901. The chemical analysis of the apple and some <!f its products. Jour. Amer. Chern. Soc. 23: 869-884.
(5) Gourley, J. H. and E. F. Hopkins. 1931. Nitrate fertilization and keeping quality of apple fruits. Ohio Agr. Exp. Sta. Bull. 479.
(6) Stokes, H. N. and J. R. Cain. 1907. On the colorimetric determination of iron with special reference to chemical reagents. Bur. Standard,; Bull. 3, 115-156.
,(7) Yoe, John H. 1928. Photometric chemical analysis. Volume 1, Colorimetry. John Wiley & Sons, New York.

ASH CONSTITUENTS OF APPLE FRUITS 15
TABLE 1.-Ash Analysis of Ohio Nonpariel Preliminary sample, Tree Number 183, Main Orchard. July 6, 1931
Weight 20 fruits, grams .............. . Moisture ............................. . Solids ................................. . Ash ................................. . Ca •.................................... P ..................................... . K ..................................... . Fe .................................... . Mn ................................... . *Na •.................................. *Mg ................................. .
Per cent of ash
. . . . . . . . . . . . . . . .
...............
. . . . . . . . . . . . . . . .
... ··3:469"" ... 3.558
41.895 0.2885 0.02527 5.392 2.884
Percent on dry basis
·············· ··············· ····s:o59 ... · · · ·
0.1061 0.1086 1.281 0.008824 0.0007731 0.1372 0.07158
*These determinations were made on another sample.
Per cent on moist basis
· .. sur······ 13.86 0.4237 0.01471 0.01509 0.1776 0.00122 0.000107 0.02269 0.01115
Grams per 20 fruits
791 . ............... .. .. i35i .......
0.1164 0.1186 1.404 0.00965 0.0008463 0.1131 0.1027
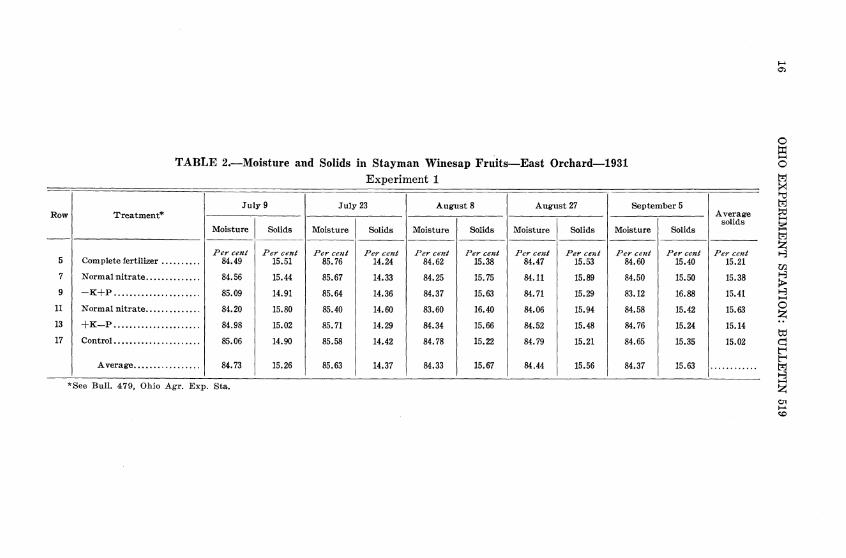
TABLE 2.-Moisture and Solids in Stayman Winesap Fruits-East Orchard-1931 Experiment 1
July9 July 23 August 8 August 27 September 5 Row Treatment*
Moisture I Solids Moisture Solids Moisture Solids Moisture Solids Moisture Solids
Per cent Per cent Per cent Per cent Per cent Per cent Per cent Per cent Per cent Per cent 5 Complete fertilizer .......... 84.49 15.51 85.76 14.24 84.62 15.38 84.47 15.53 84.60 15.40
7 Normal nitrate .............. 84.56 15.44 85.67 14.33 84.25 15.75 84.11 15.89 84.50 15.50
9 -K+P ...................... 85.09 14.91 85.64 14.36 84.37 15.63 84.71 15.29 83.12 16.88
11 Normal nitrate .............. 84.20 15.80 85.40 14.60 83.60 16.40 84.06 15.94 84.58 15.42
13 +K-P ...................... 84.98 15.02 85.71 14.29 84.34 15.66 84.52 15.48 84.76 15.24
17 Control. ..................... 85.06 14.90 85.58 14.42 84.78 15.22 84.79 15.21 84.65 15.35
Average ................. 84.73 15.26 85.63 14.37 84.33 15.67 84.44 15.56 84.37 15.63 ----- -- - - -- ---- ----
*See Bull. 479, Ohio Agr. Exp. Sta.
Average solids
Per ceut 15.21
15.38
15.41
15.63
15.14
15.02
............
f-.' 0>
0 l:Ii ...... 0 trj ><: tg ~ ...... ~ trj z >-3 UJ.
~ >-3 ...... 0 z to q t'" t'" trj >-3 ...... z <!ll .... <C

Row
5 7 9
11 13 17
5 7 9
11 13 17
5 7 9
11 13 17
5 7 9
11 13 17
ASH CONSTITUENTS OF APPLE FRUITS
TABLE 3.-The Weight of Twenty Fruits, in Grams, from Fertilizer Plots. 1931
Experiment 1
Treatment July 9 July 23 Aug.13
------
Complete fertilizer 478 711 1214 Normal nitrate .... :::::::::::::::::::::: 396 703 1191 -K+P .......... 434 694 1182 Normal nitrate .... :::::::::::::::::::::: 358 602 1081 +K-P ............................... 420 772 1236 Control .................................. 427 697 1150
Av .................. ................ 419 696 1177
TABLE 4.-Total Ash Content of Fruit. 1931 Experiment 1
Aug. 27
---
1595 1606 1622 1447 1676 1741
1614
Treatment I July 9 I July 23 I Aug. 131 Aug. 271 Sept. 5 I Percentage of ash on dry basis
Complete fertilizer ............... 2. 773 2.443 1. 852 1.593 1.686 Normal nitrate .................. 2.607 2.263 1. 750 1.583 1.489 -K+P .................... 2.527 2.135 1. 719 1.528 1.547 Normal nitrate .............. :::: 2.423 2.065 1. 780 1.448 1.546 +K-P ......................... 2.946 2.462 1.893 1.912 1.852 Control .......................... 2.675 2.367 1.942 1. 798 1. 752
Average ..................... 2.658 2.289 1.823 1.644 1.645
Percentage of ash on moist basis
Complete fertilizer •............. 0.4301 0.3479 0.2850 0.2472 0.2596 Normal nitrate .................. 0.4025 0.3243 0.2757 0.2516 0.2303 -K+P ......................... 0.3769 0.3066 0.2686 0.2335 0.2610 Normal nitrate .................. 0.3828 0.3016 0.2917 0.2336 0.2382 +K-P ......................... 0.4426 0.3519 0.2964 0.2959 0.2824 Control .......................... 0.3997 0.3413 0.2955 0.2734 0.2687
Average ..................... 0.4057 0.3289 0.2855 0.2559 0.2567
Grams of ash in 20 fruits
Complete fertilizer •.............. 2.056 2.474 3.459 3.942 5.377 Normal nitrate .................. 1.593 2.280 3.274 4.039 4.496 -K+P ......................... 1. 636 2.128 3.176 3. 787 4.809 Normal nitrate .................. 1.371 1. 816 3.154 3.341 4.346 +K-P ......................... 1.859 2. 716 3.663 4.960 5.681 Control .......................... 1. 707 2.379 3.349 4. 761 5.108
Average .... ................ 1. 704 2.299 3.354 4.063 4.9£9
17
Sept. 5
---
2072 1948 1843 1825 2012 1901
1933
Average
2.169 1.936 1.891 1.852 2.213 2.106
0.3140 0.2969 0.2893 0.2896 0.3338 0.3157
..........
3.462 3.136 3.107 2.806 3. 776 3.471

18
Row!
5 7 9
11 13 17
5 7 9
11 13 17
5 7 9
11 13 17
5 7 9
11 13 17
OHIO EXPERIMENT STATION: BULLETIN 519
TABLE 5.-Calcium Content of Fruit. 1931 Experiment 1
Treatment July 9 I July 23 I Aug. 13 Aug. 27 I Sept. 5 I Average
Percentage of calcium in ash
Complete fertilizer .. 5.274 4.684 4.155 3.954 3.716 4.357 Normal nitrate ...... 5.996 4. 762 4.580 3.842 4.033 4.643 -K+P .............. 5.665 5.588 4.597 4.078 4.219 4.829 Normal nitrate ...... 6.561 5.679 4.460 4.323 4.244 5.053 +K-P .............. 5.513 4.298 4.577 3.007 3.194 4.118 Control .............. 5.853 5.156 4.387 3.920 4.078 4.679
Average ............. 5.8103 5.028 4.459 3.854 3.873 ············ Percentage of calcium on dry basis
Complete fertilizer .. 0.1462 0.1145 0.07698 0.06295 0.06262 0.09265 Normal nitrate ...... 0.1563 0.1077 0.08012 0.06083 0.06006 0.09300 -K+P .............. 0.1432 0.1193 0.07900 0.06230 0.06522 0.09380 Normal nitrate ...... 0.1589 0.1173 0.07936 0.06262 0.06559 0.09675 +K-P .............. 0.1623 0.1059 0.08664 0.05749 0.05917 0.0943 Control ..........•..• 0.1566 0.1220 0.08509 0.07380 0.07141 0.1018
Average ........... 0.1539 0.1144 0.08120 0.06333 0.06401 ............ Percentage of calcium on moist basis
Complete fertilizer .. 0.02268 0.01629 0.01184 0.009773 0.009644 0.01404 Normal nitrate ... ... 0.02413 0.01545 0.01263 0.009662 0.009310 0.01370 -K+P .............. 0.02135 0.00713 0.01235 0.009522 0.01101 0.01427 Normal nitrate ...... 0.02511 0.01713 0.01301 0.009986 0.01011 0.01507 +K-P .............. 0.02438 0.01512 0.01357 0.008900 0.009018 0.01420 Control .............. 0.02340 0.01760 0.01295 0.01122 0.01096 0.01523
Average ........... 0.02351 0.01645 0.01272 0.009844 0.01001 . ............ Grams of calcium in 20 fruits
Complete fertilizer .. 0.1084 0.1158 0.1437 0.1558 0.1998 0.1447 Normal nitrate ...... 0.0955 0.1086 0.1504 0.1552 0.1814 0.1382 -K+P .............. 0.0927 0.1190 0.1460 0.1544 0.2029 0.1430 Normal nitrate ...... 0.0899 0.1031 0.1407 0.1445 0.1848 0.1324 +K-P .............. 0.1023 0.1168 0.1677 0.1491 0.1814 0.1435 Control .............. 0.0999 0.1227 0.1489 0.1954 0.2084 0.1551
Average ........... 0.0981 0.1143 0.1496 0.1691 0.1931 ............
5 7 9
11 13 17
5 7 9
11 13 17
5 7 9
11 13 17
5 7 9
11 13 17
ASH CONSTITUENTS OF APPLE FRUITS
TABLE G.-Phosphorus Content of Fruit. 1931 Experiment 1
19
Treatment July 9 I July 23 I Aug. 13 Aug. 27 I Sept. 5 I Average
Percentage of phosphorus in ash
Complete fertilizer ... 4.607 3.819 4.421 4.598 4.235 4.334 Normalnitrate ...... 4.804 3.866 4.534 4.229 4.523 4.391 -K+P .............. 5.505 4.519 5.169 4.974 4.788 4.991 Normal nitrate ...... 5.118 4.036 4. 761 4.620 4.492 4.605 +K-P .............. 4.423 3.334 4.053 3.754 3.897 3.892 Control .............. 5.151 3.871 4.620 4.405 4.462 4.506
Average .......... 4.935 3.907 4.593 4.430 4.403 . ...........
Percentage of phosphorus on dry basis
Complete fertilizer •.. 0.1277 0.09330 0.08192 0.07322 0.07140 0.08951 Normal nitrate ...... 0.1252 0.08714 0.07932 0.06694 0.06736 0.08519 -K+P .............. 0.1392 0.09647 0.08881 0.07599 0.07401 0.09490 Normal nitrate ...... 0.1240 0.08337 0.08472 0.06692 0.06938 0.08568 +K-P .............. 0.1303 0.08210 0.07672 0.07177 0.07221 0.08662 Control. ............. 0.1354 0.09160 0.08957 0.07923 0.07847 0.09485
Average .......... 0.1303 0.08900 0.08351 0.07236 0.07214 . ........... Percentage of phosphorus on moist basis
Complete fertilizer ... 0.01982 0.01328 0.01261 0.01137 0.01100 0.01362 Normal nitrate ...... 0.01934 0.01248 0.01250 0.01063 0.01044 0.01308 -K+P .............. 0.02123 0.01386 0.01388 0.01161 0.01249 0.01461 Normal nitrate ...... 0.01959 0.01217 0.01389 0.01067 0.01070 0.01340 +K-P .............. 0.01957 0.01173 0.01202 0.01111 0.01101 0.01309 Control .............. 0.02022 0.01321 0.01363 0.01025 0.01204 0.01423
Average .......... 0.01996 0.01279 0.01309 0.01094 0.01128 . ........... Grams of phosphorus in 20 fruits
Complete fertilizer ... 0.09471 0.09443 0.1530 0.1812 0.2278 0.1502 Normal nitrate ...... 0.07661 0.08774 0.1488 0.1708 0.2034 0.1375 -K+P .............. 0.09215 0.09620 0.1642 0.1882 0.2302 0.1542 Normal nitrate ...... 0.07015 0.07324 0.1502 0.1544 0.1952 0.1286 +K-P .............. 0.08221 0.09055 0.1485 0.1861 0.2215 0.1456 Control .............. 0.08636 0.09206 0.1568 0.2098 0.2289 0.1548
Average .......... 0.08370 0.08904 0.1536 0.1817 0.2178 . ...........

20
5 7 9
11 13 17
5 7 9
11 13 17
5 7 9
11 13 17
5 7 9
11 13 17
OHIO EXPERIMENT STATION: BULLETIN 519
TABLE 7.-Potassium Content of Fruit. 1931 Experiment 1
Treatment I July 9 I July 23 I Aug. 131 Aug. 271 Sept. 5 I Percentage of potassium in ash
Complete fertilizer ......•........ 38.61 44.20 44.68 48.50 45.94 Normal nitrate ...... ............ 38.15 44.69 43.33 46.13 44.88 -K+P ......................... 39.77 42.32 43.20 44.38 44.10 Normal nitrate .................. 37.36 40.04 43.81 44.44 44.49 +K-P ........................ 52.02 47.84 44.08 47.23 46.66 Control .......................... 38.60 47.15 43.67 35.89 44.51
Average ..................... 40.75 44.37 43.79 44.43 45.10
Percentage of potassium on dr:v basis
Complete fertilizer ............... 1.071 1.080 0.8277 0. 7723 0. 7745 Normal nitrate .................. 0.9947 1.012 0. 7582 0. 7304 0.6681 -K+P ......................... 1.005 0.9035 0. 7257 0.6781 0.6818 Normal nitrate .................. 0.9051 0.8269 0. 7797 0.6437 0.6874 +K-P .......... 1.533 1.179 0.8342 0.9030 0.8644 Control ............ :::::::::::::: 1.033 1.116 0.8467 0.8145 0. 7796
Average ..................... 1.0802 1.0196 0. 7953 0. 7570 0. 7426
Percentage of potassium on moist basis
Complete fertilizer . .............. 0.1661 0.1538 0.1273 0.1199 0.1193 Normal nitrate ...... ............ 0.1536 0.1450 0.1195 0.1161 0.1036 -K+P ...... 0.1498 0.1297 0.1134 0.1032 0.1151 Normal nitrate::::::~::::::::::: 0.1430 0.1208 0.1278 0.1026 0.1060 +K-P ......................... 0.2302 0.1684 0.1307 0.1398 0.1317 Control .......................... 0.1543 0.1609 0.1289 0.1238 0.1196
Average ..................... 0.1661 0.1464 0.1246 0.1176 0.1159
Grams of potassium in 20 fruits
Complete fertilizer .............. 0. 7939 1.093 1.546 1.912 2.471 Normal nitrate .................. 0.6082 1.020 1.426 1.863 2.017 -K+P ......................... 0.6503 0.9003 1.341 1.681 2.121 Normal nitrate ......... ... 0.5119 0. 7271 1.382 1.485 1.934 +K-P ................. ::·· 0.9668 1.300 1.616 2.342 2.651 Control ..................... : : : : : 0.6588 1.121 1.482 2.157 2.275
Average ..................... 0.6983 1.0269 1.4655 1.9067 2.245
Average
44.39 43.44 42.75 42.03 47.57 41.96
0.9041 0.8327 o. 7948 o. 7684 1.0627 0.9180
..........
0.1363 0.1296 0.1222 0.1200 0.1602 0.1375
..........
1.563 1.387 1.339 1.208 1. 775 1.539
5 7 9
11 13 17
5 7 9
11 13 17
5 7 9
11 13 17
5 7 9
11 13 17
ASH CONSTITUENTS OF APPLE FRUITS
TABLE 8.-Iron Content of Fruit. 1931 Experiment 1
21
Treatment July 9 I July 23 I Aug. 13 I Aug. 27 I Sept. 5 I Average
Percentage of iron in ash
Complete fertilizer ... 0.07709 0.06026 0.1138 0.08489 0.07865 0.08294 Normal nitrate ...... 0.07875 0.07046 0.09082 0.07414 0.07665 0.07816 -K+P .............. 0.06292 0.06697 0.09960 0.07144 0.07590 0.07537 Normal nitrate ...... 0.07543 0.06677 0.08537 0.07247 0.07260 0.07547 +K-P .............. 0.04542 0.04819 0.07199 0.05038 0.05791 0.05478 Control. ............. 0.06949 0.05501 0.07722 0.04700 0.05573 0.06089
Average .......... 0.06818 0.06128 0.08980 0.06672 0.06961 . . . . . . . . . . . .
Percentage of iron on dry basis
Complete fertilizer ... 0.002138 0.001472 0.002108 0.001352 0.001326 0.001679 Normal nitrate ...... 0.002053 0.001595 0.001589 0.001174 0.001142 0.001511 -K+P .............. 0.001591 0.001430 0.001712 0.001091 0.001173 0.001399 Normal nitrate ...... 0.001827 0.001379 0.001519 0.001049 0.001125 0.001380 +K-P .............. 0.001339 0.001187 0.001365 0.000963 0.001073 0.001185 Control. ............. 0.001859 0.001302 0.001497 0.000845 0.000976 0.001296
Average .......... 0.001801 0.001394 0.001632 0.001079 0.001136 ............
Percentage of iron on moist basis
Complete fertilizer ... 0.0003366 0.0001034 0.0003243 0.0002098 0.0002042 0.0002357 Normal nitrate ...... 0.0003171 0.0001113 0.0002503 0.0001864 0.0001769 0.0002084 -K+P .............. 0.0002371 0.0000995 0.0002676 0.0001668 0.0001980 0.0001938 Normal nitrate ...... 0.0002887 0.0000944 0.0002491 0.0001673 0.0001735 0.0001946 +K-P .............. 0.0002010 0.0000831 0.0002134 0.0001491 0.0001635 0.0001620 Control. ............. 0.0002777 0.0000903 0.0002280 0.0001286 0.0001498 0.0001749
Average .......... 0.0002764 0.0000973 0.0002554 0.0001680 0.0001776 . ...........
Grams of iron in 20 fruits
Complete fertilizer ... 0.001585 0.0007352 0.003937 0.003346 0.004231 0.002767 Normal nitrate ...... 0.001256 0.0007823 0.002982 0.002994 0.003446 0.002292 -K+P .............. 0.001330 0.0006905 0.003163 0.002705 0.003650 0.002302 Normal nitrate . ..... 0.001034 0.0005683 0.002693 0.002422 0.003164 0.001976 +K-P .............. 0.000844 0.0006415 0.002638 0.002498 0.003290 0.001981 Control .............. 0.001186 0.0006294 0.002621 0.002237 0.002848 0.001904
Average .......... 0.001206 0.0006745 0.003006 0.002700 0.003438 . ...........

22 OHIO EXPERIMENT STATION: BULLETIN 519
TABLE 9.-Manganese Content of Fruit. 1931
Experiment 1
Percentage of manganese Percentage of manganese
Row Treatment in the ash on dry basis
July9 July 23 July 9 July 23
5 Complete fertilizer ........... 0.04044 0.03141 0.001121 0.000767 7 Normal nitrate .............. 0.04015 0.03045 0.001047 0.000689 9 -K+P ..................... 0.02511 0.02197 0.000635 0.000469
11 Normal nitrate ............. 0.02774 0.03057 0.000672 0.000631 13 +K-P .................... 0.02530 0.02548 0.000745 0.000627 17 Control ...................... 0.01194 0.021S4 0.000321 0.000572
Average ................. 0.02845 0.02695 0.000757 0.000626
Percentage of manganese Grams of manganese on moist basis in 20 fruits
---5 7 9
11 13 17
Complete fertilizer ........... 0.000174 0.0001092 0.0008216 Normal nitrate .............. 0.000162 0.0000988 0.0006415 -K+P ..................... 0.0000946 0.0000673 0.0004106 Normal nitrate .............. 0.0001060 0.0000922 0.0006795 +K-P ....... 0.0001120 0.0000896 0.0004703 Control ...................... 0.0000479 0. 0000745 0.0002045
Average .......... ...... 0.0000657 0.0000886 0.0005371
TABLE 10.-Moisture and Solids in Various Varieties of Apples-West Orchard-1931
Experiment 2
0.0007764 0.0006947 0.0004671 0.0005550 0.0006916 0.0005193
0.0006173
July 6 July 30 Variety
Grimes Golden .. .. .. . .. . . . ......................... .. Arkansas Black ..................................... . Mcintosh ............................................ . Jonathan ............................................. . Stayman Winesap . . . . . . . . . . . . . . . . . . . . . . . . . . . . . . .... . Winesap ............................................ .
Moisture
Per cellt 83.47 84.06 87.03 86.24 84.37 83.96
Solids
Pe,. ce11t 16.53 15.94 12.97 13.76 15.64 17.04
Moisture
Pe1' ceut 83.62 84.67 87.27 85.98 85.24 84.82
TABLE 11.-Weight of Twenty Fruits, in Grams. 1931
Experiment 2
Variety
Grimes Golden . .. . . . .. . ............................................ .. Arkansas Black . .. .. . . .. . . ......................................... . Mcintosh ............................................................. . Jonathan ............................................................ .. Stayman Winesap . . . . . . . ........................................... . \Vinesap .............................................................. .
July 16
578 523 802 424 509 378
Solids
Per cent 16.38 15.33 12.73 14.02 14.76 15.18
July 30
955 893
1310 733 930 648

ASH CONSTITUENTS OF APPLE FRUITS 23
TABLE 12.-Percentage of Ash in Fruits, Varietal Test-West Orchard-1931 Experiment 2
Percentage on dry Percentage on moist Grams of ash in basis basis 20fruits
Variety
July 16 July 30 July 16 July30 July 16 July 30
Grimes Golden ................ 2.545 2.282 0.4207 0.3738 2.431 3.570 Arkansas Black .............. 2.503 2.324 0.3990 0.3562 2.086 3.181 Mcintosh ......... ............ 2.319 2.214 0.3009 0.2818 2.413 3.692 Jonathan .........•.•.......... 2.687 2.223 0.3698 0.3117 1.568 2.284 Stayman Winesap ............ 2.563 2.346 0.4007 0.3463 2.040 3.221 Winesap .......... ............ 2.455 2.412 0.4182 0.3661 1.581 2.372
TABLE 13.-I ercentage of Calcium in Fruits, Varietal Test. 1931 Experiment 2
Percentage in ash Percentage on dry basis Variety
July 16 July30 JulY 16 July30
Grimes Golden ............ ............. 3.376 3.651 0.08592 0.08304 Arkansas Black •......... ............. 5.069 4.863 0.1269 0.1130 Mcintosh ................. ············ 3.238 3.230 0.07511 0.07150 Jonathan .............................. 4.559 4.636 0.1226 0.1030 Stayman Winesap ...... ............. 4.889 4.606 0.1253 0.1081 Winesap •................. ............. 5.500 5.383 0.1350 0.1298
Percentage on moist basis Grams Ca in 20 fruits
Grimes Golden ............ ........... 0.01420 0.01360 0.08208 0.1299 Arkansas Black ....................... 0.02022 0.01732 0.1058 0.1547 Mcint""h ................. ............ 0.009743 0.00910 0.07814 0.1192 Jonathan ................. ············ 0.01686 0.01445 0.07150 0.1059 Stayman Winesap ....... ············ 0.01959 0.01595 0.06291 0.1484 Winesap •.......... ...... ............ 0.02300 0.01971 0.08694 0.1277
TABLE 14.-Pe rcentage of Phosphorus in Fruits, Varietal Test. 1931 Experiment 2
Percentage in ash Percentage on dry basis Variety
July 16 July30 July 16 July30
Grimes Golden •.•......... ............ 5.360 3.689 0.1365 0.08322 Arkansas Black ......... ............ 5.672 3.749 0.1420 0.08712 Mcintosh ................. ............ 5.835 4.233 0.1354 0.09367 Jonathan ................. ............ 4.776 3.776 0.1283 0.08395 Stayman Winesap ....... ............ 5.126 3.758 0.1314 0.08818 Wmesap ................. ............ 5.554 3.583 0.1363 0.08644
Percentage on moist basis Grams P in 20 fruits
Grimes Golden ............ ............ 0.02256 0.01363 0.1304 0.1302 Arkansas Black .......... ........... 0.02282 0.01336 0.1184 0.1192 Mcintosh ................. ············ 0.01756 0.01192 0.1408 0.1563 Jonathan ................. ............ 0.01766 0.01177 0.0749 0.0863 Stayman Winesap ....... ............ 0.02054 0.01302 0.1070 0.1121 Winesap .................. ............ 0.02323 0.01312 0.0878 0.0850

24 OHIO EXPERIMENT STATION: BULLETIN 519
TABLE 15.-Percentage of Potassium in Fruits, Varietal Test. 1931 Experiment 2
Variety
Grimes Golden ....................... . Arkansas Black ...................... . Mcintosh ........................... . Jonathan ............................. . Stayman Winesap .................. . Winesap .................. ......... .
Grimes Golden ....................... . Arkansas Black ...................... . Mcintosh ............................. . Jonathan ............................. . Stayman Winesap . . . . . . . . . . . ...... . Winesap .............................. .
Percentage in ash
July 16
44.92 41.55 44.53 42.63 41.36 41.60
July 30
47.01 42.47 46.31 43.31 43.14 42.38
Percentage on moist basis
0.1890 0.1658 0.1340 0.1576 0.1658 0.1740
0.1737 0.1513 0.1305 0.1350 0.1494 0.1552
Percentage on dry basis
July 16 July 30
1.144 1.060 1.040 0.987 1.033 1.025 1.146 0.963 1.060 1.013 1.021 1.022
Grams K in 20 fruits
1.092 0.8672 1.075 0.6683 0.8439 0.6577
1.659 1.351 1. 710 0.989 1.390 1.006
TABLE 16.-Percentage of Iron in Fruits, Varietal Test. 1931 Experiment 2
Percentage in ash Percentage on dry basis Variety
I July 16 July 30 July 16 July 30
Grimes Golden ..... .................... 0.07398 0.1109 0.002224 0.002502 Arkansas Black ....................... 0.09173 0.1066 0.002296 0.002478 Mcintosh .............................. 0.08882 0.1452 0.002060 0.003214 Jonathan .............................. 0.08945 0.1421 0.002404 0.003159 Stayman Winesap .................... 0.07863 0.1155 0.002015 0.002712 Winesap ...... .............. .......... 0.06741 0.0889 0.001655 0.002144
I Percentage on moist basis Grams Fe in 20 fruits I Grimes Golden •....................... ·I 0.0003676 0.0004099 0.002124 0.003913 Arkansas Black ....................... 0.0003660 0.0003798 0.001914 0.003392 Mcintosh ............................. 0.0002673 0.0004091 0.002144 0.005359 Jonathan ..............................
1
0.0003308 0.0004428 0.001403 0.003245 Stayman Winesap .................... 0.0003152 0.0004003 0.001604 0.003723 Winesap ............................... 0.0002819 0.0003255 0.001065 0.002109
TABLE 17.-Percentage of Manganese in Fruits, Varietal Test* Experiment 2
Variety Percentage Percentage Percentage GramsMnin in ash on dry basis on moist basis 20 fruits
Grimes Golden ........................ 0.01891 0.0004814 0.00007958 0.0004601 Arkansas Black . ..... 0.02106 0.0005271 0.00008403 0.0004395 Mcintosh .............. :::::::::::::::: 0.00921 0.0002137 0.00002772 0.0002223 Jonathan ............................. 0.01909 0.0005131 0.00007060 0.0002993 Stayman Winesap .................... 0.01946 0.0004887 0.00007802 0.0003971 Winesap ............................... 0.02174 0.0005335 0.00009090 0.0003437
*These are analyses for July 16, 1931 only.

ASH CONSTITUENTS OF APPLE FRUITS 25
TABLE lB.-Comparison of Stayman Winesap Fruits from the Main and East Orchards under Similar Fertilizer Treatments. 1931
Experiment 3
August 6 September! Sample
Moisture Solids Moisture Solids
Per cent Per cent Per cent Per ce1zt Main Orchard, Tree 147 .............. 84.42 15.58 84.72 15.28 Main Orchard, Tree 149 ....•.....••.• 84.66 15.34 85.17 14.83
East Orchard, Row 1. 00 00 00 00 00 00 00 00 • 83.76 16.24 84.12 15.88 East Orchard, Row 2oo .... oo oo .. oo. oo 84.20 15.80 83.88 16.12
TABLE 19.-Weight of Twenty Fruits, in Grams, Stayman Winesap. 1931 Experiment 3
Sample August 6
Main Orchard, Tree 147 ... 00 00 .. 00 . 00 ••• 00 00 ••••••••••••••••••• 00 • • • • • 921 Main Orchard, Tree 14900 ....... 00 •• 00 00 00 00 00 00 00 00. 00 00 00 00 00 00. 00.. 930
East Orchard, Row 1. 00 00 00. 00 00 00 00 00 .. 00 00 00 00 00 00 00 00 00 00 00 00 00 00 964 East Orchard, Row 2. 00 .... 00 00 ••••••••••••• 00 •• 00 ••••• 00 00 00........ 1097
September 1
1697 1767
1844 1936
TABLE 20.-Percentage of Ash in Stayman Winesap Apples. 1931 Experiment 3
Percentage on Percentage on Grams of ash in dry basis moist basis 20 fruits
Sample
1 Sept. 1 Aug.6 Sept.1 Aug. 6 Sept. 1 Aug.6
------ ------Main Orchard, Tree 147 •.............. 2.478 1.860 0.3861 0.2843 3.556 4.819 Main Orchard, Tree 149 •••••.......... 2.502 1.818 0.3839 0.2696 3.571 4.763
East Orchard, Row 1. 00 ••••••••••••••• 2.103 1.556 0.3415 0.2469 3.293 4.552 East Orchard, Row 2 oo oo 00 00 00 00 00 00 00 2.119 1.536 0.3350 0.2476 3.676 4.794

26 OHIO EXPERIMENT STATION: BULLETIN 519
TABLE 21.-Percentage of Calcium in Stayman Winesap Apples. 1931 Experiment 3
Percentage in ash Percentage on dry basis Sample
Aug.6 Sept. 1 Aug.6 Sept. 1
Main Orchard, Tree 147 ............... 4.549 3.978 0.1236 0.07399 Main Orchard, Tree 149 ••..........•.. 4.872 4.037 0.1219 0.07342
East Orchard, Row 1. ................. 4.494 3.456 0.0888 0.05370 East Orchard, Row 2 .................. 5.128 3.460 0.0863 0.05317
Percentage on moist basis Grams Ca in 20 fruits
Main Orchard, Tree 147 ••.•........... 0.01925 0.01130 0.1768 0.1917 Main Orchard, Tree 149 ............... 0.01869 0.01088 0.1739 0.1924
East Orchard, Row 1. ................. 0.01439 0.008532 0.1389 0.1573 East Orchard, Row 2 .................. 0.01363 0.008568 0.1492 0.1658
TABLE 22.-Percentage of Phosphorus in Stayman Winesap Apples. 1931 Experiment 3
Percentage in ash Percentage on dry basis Sample
I Aug.6 Sept. 1 Aug.6 Sept. 1
Main Orchard, Tree 147 ••...... 2.671 3.094 0.06619 0.05754 Main Orchard, Tree 149 •• ,, ..... :::::::::::::: 2.282 3.184 0.05712 0.05789
East Orchard, Row 1 .......................... 3.732 3.904 0.07374 0.06067 East Orchard, Row 2 .......................... 3.831 4.467 0.08121 0.06861
Percentage on moist basis Grams P in 20 fruits
Main Orchard, Tree 147 ....................... 0.01031 0.008790 0.09486 0.1491 Main Orchard, Tree 149 ....................... 0.00876 0.008584 0.08185 0.1517
East Orchard, Row 1. ......................... 0.01198 0.009638 0.1157 0.1777 East Orchard, Row 2 .......................... 0.01283 0.0106 0.1405 0.2141
ASH CONSTITUENTS OF APPLE FRUITS 27
TABLE 23.-Percentage of Potassium in Stayman Winesap Apples. 1931 Experiment 3
Percentage in ash Percentage on dry basis Sample
Aug.6 Sept.1 Aug. 6 Sept. 1
Main Orchard, Tree 147 ....................... 45.12 47.15 1.119 0.8766 Main Orchard, Tree 149 ....................... 45,81 46.86 1.147 0.8518
East Orchard, Row 1. ......................... 44.93 46.55 0.888 0. 7234 East Orchard, Row 2 .......................... 42.98 46.51 0.911 0. 7144
Percentage on moist basis Grams K in 20 fruits
Main Orchard, Tree 147 ....................... 0.1742 0.1339 1.604 2.272 Maln Orchard, Tree 149 ....................... 0.1758 0.1271 1.635 2.231
East Orchard, Row 1. ......................... 0.1442 0.1149 1.390 2.120 East Orchard, Row 2 .......................... 0.1440 0.1152 1.581 2.229
TABLE 24.-Percentage of Iron in Stayman Winesap Apples. 1931 Experiment 3
Percentage in ash Percentage on dry basis Sample
Aug. 6 Sept. 1 Aug.6 Sept. 1
Main Orchard, Tree 147 ............... 0.1039 0.10280 0.002574 0.001912 Main Orchard, Tree 149 •.............. 0.0945 0.08080 0.002419 0.001466
East Orchard, Row 1. ................. 0.1187 0.08334 0.002345 0.001295 East Orchard, Row 2 .................. 0.1545 0.08952 0.003276 0.001375
Percentage on moist basis Grams Fe in 20 fruits
Main Orchard, Tree 147 ............... 0.0004011 0.0002922 0.003693 0.004956 Maln Orchard, Tree 149 ............... 0.0003711 0.0002174 0.003450 0.003840
East Orchard, Row 1. ................. 0.0003809 0.0002058 0.003673 0.003796 East Orchard, Row 2 .................. 0.0005177 0.0002216 0.005683 0.004290
TABLE 25.-Percentage of Manganese in Stayman Winesap Apples* Experiment 3
Sample Percentage Percentage Percentage GramsMn in ash on dry basis on moist basis in 20 fruits
Main Orchard, Tree 147 •.............. 0.02873 0.000712 0.000111 0.00102 Main Orchard, Tree 149 •.............. 0.04100 0.001026 0.000157 0.00146
East Orchard, Row 1. ................. 0.01232 0.000243 0.000039 0.00038 East Orchard, Row 2 .................. 0.02020 0.000430 0.000068 0.00075
*Mn was determined for August 6, 1931 only.
28 OHIO EXPERIMENT STATION: BULLETIN 519
TABLE 26.-Percentage of Magnesium in Stayman Winesap Apples* Experiment 3
Sample Percentage
I Percentage Percentage GramsMg
in ash on dry basis on moist basis in 20 fruits
Main Orchard, Tree 147 ............... 2.884 0.07158 0.01115 0.1027 Main Orchard, Tree 149 ............... 2.557 0.06397 0.00981 0.0913
East Orchard, Row 1. ................. 2. 710 0.05355 0.00870 0.0838 East Orchard, Row 2 .................. 2.869 0.06081 0.00961 0.1054
*Mg was determined for August 6, 1931 only.
TABLE 27.-Analysis of Individual Trees from Different Parts of the East Orchard. Same Fertilizer Treatment (Normal nitrate).
Variety Stayman Winesap*
Experiment 4
Ash
I Row-Tree Moisture Solids Weight of Percentage Percentage 20 fruits Grams ash
on dry on moist basis basis
Pel. Pet. Grams 3-18 ....................... 84.17 15.83 1260 1.547 0.2447 4-2 ....................... 84.62 15.38 1214 1.578 0.2434 7-8 ...................... 85.14 14.86 1376 1.771 0.2632
11-16 ....................... 83.27 16.73 1194 1. 763 0.2948 15-2 ....................... 84.26 15.74 1310 1.502 0.2363 19-10 ....................... 84.76 15.24 1227 1.612 0.2456
*Only one set of samples, August 20, 1931.
TABLE 28.-Calcium in Stayman Winesap Fruits. Same Fertilizer Treatment
Experiment 4
Row-Tree
3-18 .................................. . 4-2 .................................. . 7-8 ................................. ..
11-16 .................................. . 15-2 .................................. . 19-10 ................................. .
Percentage in ash
4.304 4.070 3.860 3.917 4.381 4.358
Percentage on dry basis
0.06812 0.06438 0.06836 0.06903 0.06577 0.07022
Percentage on moist basis
0.01078 0.00988 0.01016 0.01154 0.01035 0.01070
TABLE 29.-Phosphorus in Stayman Winesap Fruits. Same Fertilizer Treatment
Experiment 4
Row-Tree
3-18 •.................................. 4-2 .................................. . 7-8 .................................. .
11-16 .................................. . 15-2 ................................. . 19-10 •..................................
Percentage in ash
4.424 4.950 4.117 3. 790 4.390 3.946
Percentage on dry basis
0.06842 0.07830 0.07292 0.06680 0.06599 0.06348
Percentage on moist basis
0.01083 0.01204 0.01083 O.Oll17 0.01038 0.00968
in 20fruits
3.084 2.954 3.621 3.520 3.096 3.013
GramsCa in 20 fruits
0.1358 0.1202 0.1398 0.1379 0.1356 0.1313
GramsP in 20 fruits
0.1364 0.1462 0.1491 0.1334 0.1360 0.1187

ASH CONSTITUENTS OF APPLE FRUITS
TABLE 30.-Potassium in Stayman Winesap Fruits. Same Fertilizer Treatment
Row-Tree
3-18 ... 00 00 •• 000 •••••• 0 ••••••• 0 00.00 ••
4-2 0 •••••••• 0 •••••••••••••••••••••••••
7-8 0 •••••••••••• ••••••• •••••••••••••••
11-16. 0 •• 0 ••• 0. 0 •• 0 0 0 0 • 0. 0 •• 0 0. 0 ••••• 0 0
15-2 •.... 0 •• 0 0. 0 ••••• 0 0. 0 ••••••••••• 0 0 0
19-10 •. 0 0. 0. 0 0 •• 0 •• 0 0 0 0 0 0 0 0 0. 0 0 0. 0 0. 0 0 0 0
Experiment 4
Percentage in ash
45.38 44.62 43.92 45.16 42.97 41.48
Percentage on dry basis
o. 7017 0. 7057 0. 7779 0. 7960 0.6452 0.6684
Percentage on moist basis
0.1111 0.1085 0.1156 0.1331 0.1016 0.1018
TABLE 31.-Iron in Stayman Winesap Fruits. Same Fertilizer Treatment
Row-Tree
3-18 .................................. . 4-2 .................................. . 7-8 ................................. ..
11-16 .. 0 0 ••••• 0. 0 ••••• 0 •• 0 0 •••••••••••• 0
15-2 .................................. . 19-10 •. 0 ••••• 0. 0 ••••••• 0 •••• 0. 0. 0 0 0 0 0 •• 0
Experiment 4
Percentage in ash
0.1041 0.1077 0.0996 0.0761 0.0925 0.0799
Percentage on dry basis
0.001609 0.001704 0.001724 0.001341 0.001389 0.001287
Percentage on moist basis
0.0002548 0.0002622 0.0002562 0.0002442 0.0002187 0.0001961
29
GramsK in 20 fruits
1.399 1.317 1.591 1.589 1.331 1.250
Grams Fe in 20fruits
0.003210 0.003183 0.003526 0.002678 0.002864 0.002002
TABLE 32.-Storage Record of East Orchard, Stayman Winesap November 5, 1931-April 1, 1932
Plot Treatment for tree-1931 Break- Decay Shrivel- Scald Skin down ing spots
-- ----
Pet, Pet. Pet. Pet. Pet, 1 Nitrate of soda, 7% lb •.......... 1.6 0.0 5.2 10.7 0.0
2 Nitrate of soda, 2% lb ........... 0.5 0.0 5.5 15.1 0.0
31 Nitrate of soda, 2% lb ......... 1
0.6 0.8 4.5 16.8 0.0 Superphosphate, 2% lb ........ ( Muriate of potash, 1~ lb .......
4 Nitrate of soda, 2% lb •.......... 0.0 0.0 2.1 15.5 0.0
5 { Nitrate of soda, 2% lb ......... I Superphosphate, 2% lb ........ f 0.3 0.0 0.5 9.3 0.0
6 Nitrate of soda, 2% lb ........... 0.8 0.0 4.2 7.4 0.0
7{ Nitrate of soda, 2% lb •........ 1. Muriate of potash, 1~ lb ....... I 3.0 0.0 2.4 10.3 0.0
8 Nitrate of soda, 2% lb •.......... ............ ............ No records . ........... ············ 9 Untreated ....................... 7.4 0.8 I 3.8 I 14.8 0.0
10 Nitrate of soda, 2% lb ........... ........... ............ No records . . . . . . . . . . . 1··· .........

30
Plot I
1 2 3 4 5 6
7 8
1 2 3 4 5 6
7 8
1 2 3 4 5 6
7 8
1 2 3 4 5 6
7 8
OHIO EXPERIMENT STATION: BULLETIN 519
TABLE 33.-Storage Record of West Orchard October 30, 1931-April 1, 1932
Treatment for tree-1931 I Breakdown I D~cay I Shriveling I Scald Pet. Pet. Pet. Pet.
Stayman Winesap, Common storage
Nitrate of soda, 2% lb., April •...... 0.0 0.3 9.8 2.5 Untreated ...... , ................... 0.0 0.3 13.6 3.1 Nitrate of soda, 2% lb., April ....... 0.3 0.3 16.5 5.5 Nitrate of soda, 2% lb., August ..... 1.6 0.0 14.1 2.9 Nitrate of soda, 2% lb., April •...... 0.3 0.6 24.8 5.0 Nitrate of soda, April1~ lb., Au-
gust 1~ lb ....................... 0.8 0.2 22.7 5.1 Nitrate of soda, 5% lb., April ....... 0.9 0.0 14.9 0.4 Nitrate of soda, 2% lb., September .. 0.3 0.3 11.3 1.4
Grimes Golden, September 30, 1931-March 9, 1932, Cold storage
Nitrate of soda, 2% lb., April ....... 1.9 0.5 0.3 23.0 Untreated •......................... 3.1 0.0 0.0 45.7 Nitrate of soda, 2% lb-, April ....... 0.7 0.5 0.3 28.1 Nitrate of soda, 2% lb., August. .... 2. 7 0.0 0.2 41.2 Nitrate of soda, 2% lb., April •..... 1.0 0.0 0.0 44.4 Nitrate of soda, April!~ lb., Au-
gust 1~ lb ....................... 3.8 0.3 0.0 43.8 Nitrate of soda, 2% lb., April •..... 3.6 0.0 0.0 45.8 Nitrate of soda, 2% lb., September .. 1.3 0.0 0.3 44.0
Mcintosh, September 16, 1931-February 12, 1932, Cold storage
Nitrate of soda, 2% lb., April •...... 0.0 0. 7 0.0 0.2 Untreated ........................... 0.0 0.0 0.8 0.0 Nitrate of soda, 2% lb., April ....... 0.0 0.2 0.4 0.0 Nitrate of soda, 2% lb., August. .... 0.0 0.0 1.8 0.0 Nitrate of soda, 2% lb., April •...... 0.0 0.5 0.4 0.0 Nitrate of soda, April!~ lb., Au-
gust 1~ lb ...................... 0.0 0. 7 0.2 0.0 Nitrate of soda, 2% lb., April ....... 0.0 1.2 0.0 0.3 Nitrate of soda, 2% lb., September .. 0.0 0.2 0.5 0.0
Jonathan, October 6, 1931-March 9, 1932, Common storage
Nitrate of soda, 2% lb., April ....... 0.0 o.o 19.9 0.0 Untreated .......................... 0.0 0.2 15.0 0.0 Nitrate of soda, 2% lb., April. ...... 0.0 o.o 14.3 0.0 Nitrate of soda, 2% lb., August. .... 0.2 0.2 11.2 0.0 Nitrate of soda, 2% lb., April ....... 0.0 0.2 14.2 0.0 Nitrate of soda, A prill~ lb., Au-
gust 1~ lb ....................... 0.0 0.3 21.5 0.0 Nitrate of soda, 2% lb., April •...... 0.0 0.0 10.1 0.0 Nitrate of soda, 2% lb., September .. 0.2 0.2 6.4 0.0
Skin spot Pet.
0.0 0.0 0.0 0.0 0.0
0.0 0.0 0.0
0.8 0.3 0.0 3.6 1.2
0.3 4.0 0.8
0.0 0.0 0.0 0.0 0.0
0.0 0.0 0.0
43.7 56.5 66.7 56.2 61.5
50.5 60.6 76.5