a study of the dairy industry in china and ...vuir.vu.edu.au/17898/1/liang_1993compressed.pdf5.4...
TRANSCRIPT

FACULTY OF BUSINESS VICTORIA UNIVERSITY OF TECHNOLOGY
MELBOURNE AUSTRALIA
A STUDY OF THE DAIRY INDUSTRY IN CHINA AND AUSTRALIA'S EXPORT
POTENTIAL
A Thesis Submitted for the Degree of
Master of Business
by
ZHU LIANG b o m 24-09-1965 Beijing, P R . China
Submitted: 1st September, 1993, Melbourne, Australia

FTS THESIS 382.4170951 ZHU 30001005370293 Zhu, Liang A study of the industry i n Ch.
dairy
£.,_«- , i n C h i n a - and Australia's export potential

ACKNOWLEDGMENTS
I wish to extend my grateful thanks to the following people for their kind assistance and guidance extended to me over the past two years: Mr. Peter Irwin, Mr. Robert Howard, Mrs Hilary McCarthy, Professor Keith Lansley, Dr. Ken Wei son, Mr. Geoff Cox and Dr. Jadu Pradhan. In addition, I would like to express my appreciation to the staff of Murray Gcmlburn Co-operative Company Limited in particular Mr. Graeme Wren and Patrick Flynn for their expert advice and consideration. Finally, I would like to express my deep gratitude to Dr. Madeleine Hamon for her help and continued encouragement during the writing of this thesis.

STATEMENT OF AUTHORSHIP
Except where reference is made in the text of the thesis, this thesis contains no material published elsewhere or extracted in whole or in part from a thesis presented by me for another degree or diploma.
No other person's work has been used without due acknowledgment in the main text of the thesis.
This thesis has not been submitted for the award of any other degree or diploma in any other tertiary institution.
September, 1993
Zhu Liang

CONTENTS
Page
1. General Introduction 1
2. Literature Review 19
3. The Chinese Dairy Industry - A Brief Introduction . . 29
4. The Chinese Dairy Industry - Demand for. and Supply of Products 67
5. The Australian Dairy Industry in the International Arena 123
6. An Analysis of China's Dairy Consumption and Australia's Export Potential 142
7. Discussion 210
8. Addendum 281
9. Appendixes 288
10. Bibliography 312
i

DETAILED CONTENTS
Page
General Introduction
1.1 Rationale 2 1.2 Aims 8 1.3 Delimitation and Definitions 9
. Dairy Products
. MiIk/Product Conversions
. China
. Australian Dairy Industry
. Statistical Data
. Cultural Differences 1.4 Methodology 11 1.5 Organisational Structure 16 Literature Review
2.1 World Food Markets 21 2.2 World Trade and the GATT 22 2.3 Economies of the Asia-Pacific Region 24 2.4 Comparative Studies of China's Reform 2 5 2.5 Australia's Position in the North-East Asian Area 2 6 2.6 Statistical Data 27
The Chinese Dairy Industry - A Brief Introduction
3.1 General Background . Introduction 3 0 . Production Statistics 32 . Dairy Animal Resources and their Distribution 3 4
. Favourable Development Factors 38 . Existing Specialised Dairy Herd and Extension Services
. Feed and Fodder Availability
. Milk Processing Facilities
. Government Support . Development Constraints 43
. Shortage of Concentrates and High Quality Fodder
. Deficiencies in Extension Services
. Problems of Management and Training
. Outdated Processing Equipment
. Insufficient Quality Control
. Inexperience in Marketing and Selling
. Shortage of Investment Funds
. Milk Prices . Conclusion 48 ii

3.2 Development of the Dairy,Processing Industry
. Introduction 51
. Ownership 55
. Infra-structure 56 . Milk Collection and Product Delivery System
. City Milk Plants
. Milk Powder Factories
. Yoghurt and Ice-cream Factories
. Cheese Factories . Technology 60
. Production
. Packaging and Handling
. Environmental Issues 3.3 Development of the Dairy Manufacturing
Industry . Introduction 62 . Current Situation ; 63 . Dairy Machinery and Equipment Plants . . . . 64 . Technical Level of Equipment 64 •. Problems of Dairy Manufacturing Plants . . . 65 . Regional Distribution 65
4. The Chinese Dairy Industry - Demand for and Supply of the Products
4.1 Farms . Introduction 68 . Ownership 71 . Production System 73 . Animal Health 7 6 . Milk Handling Technology 78 . Economic Analysis 79
. Introduction
. Cost Structure
. Cost of Milk
. Farmgate Price
. Comparison of Farmgate price in Australia and China
. Projected Milk Production 85 4.2 Products
. Introduction 90
. Dairy Product Consumption by Region . . . . 92 . Urban Areas . Rural Pastoral Areas . Rural Agricultural Areas
. Dairy Product Proportion of Diet 98
. Dairy Consumption and Income Level 99
. Future Trends in Dairy Consumption . . . . 101
. Dairy Product Supply Analysis 103
. Price Considerations 105 iii

. International Trade and Financial Assistance 107
. Dairy Products
. Livestock and Equipment 4.3 Merchandising
Domestic Transactions 110 . Organisation . Distribution Network for Liquid Milk
. International Transactions 114 . Organisation . Import Application Procedure . Customs Duty on Dairy Products . Industrial Dairy Products
. Milk Powder
. Whey Powder
. Butter
. Skim Milk Powder . Retail Dairy Products
. Future Trends ' 119
. Distribution System for Imported Dairy Products 120
5. The Australian Dairy Industry in the International Arena
5.1 International Dairy Trade 124
5.2 Australia's Dairy Industry in the World Context 127
5.3 Trade Flows of Major Products 131
5.4 International Prices for Dairy Products .... 133
5.5 Trends in the Dairy Industry 136
6. An Analysis of China's Dairy Consumption and Australia's Export Potential
6.1 Liquid Milk 143 . Products on the Chinese Market 144
. Local
. Imported
. Industrial . Product Quality 145 . Consumer Profile 145
. Introduction
. Method of Use
. Consumer Knowledge of Product
. Product Preference . Seasonality and-Climate 146 . Packaging 147 . Market Analysis 148
. Total Raw Milk Production
. Total Dairy Consumption iv

. Total Liquid Milk Consumption
. Liquid Milk Market Segment . Price Analysis 152 . Volume and Value of Australian Exports to China 153
. Opportunities for Export of Australian Products 155
6.2 Milk Powder 156 . Products on the Market 157
. Local
. Imported
. Industrial . Product Quality 158
. Local
. Imported . Consumer Profile 159
. Introduction
. Method of Use
. Consumer Knowledge of Prdduct
. Product Preference . Seasonality and Climate 160 -. Packaging 161 . Market Analysis 161 . Price Analysis 164 . Volume and Value of Australian Exports to China 165
. Opportunities for Export of Australian Products 167
6.3 Butter 167 . Products on the Market 169
. Local
. Imported
. Industrial . Product Quality 170
. Local
. Imported . Consumer Profile 171
. Introduction
. Method of Use
. Consumer Knowledge of Product . Packaging 171 . Market Analysis 172 . Price Analysis 174 . Volume and Value of Australian Exports to China 174
. Opportunities for Export of Australian Products 176
6.4 Yoghurt 177 . Products on the Market 178
. Local
. Imported . Product Quality 178 . Consumer Profile 178 . Introduction . Method of Use
v

. Consumer Knowledge of Product
. Product Preference . Seasonality and Climate 179 . Packaging 179 . Market Analysis 180 . Price Analysis 182 . Opportunities for Export of Australian Products 182
Ice-cream 183 . Products on the Market 184
. Local
. Imported . Product Quality 184 . Consumer Profile 184
. Introduction
. Method of Use
. Consumer Knowledge of Product
. Product Preference . Seasonality and Climate ..." 186 . Packaging 18 6 . Market Analysis 187 •*. Price Analysis 188 . Opportunities for Export of Australian Products 189
Cheese 189 . Products on the Market 19 0
. Local
. Imported
. Industrial . Product Quality 191 . Consumer Profile 191
. Introduction
. Method of Use
. Consumer Knowledge of Product
. Product Preference . Seasonality and Climate 192 . Packaging 192 . Market Analysis 192 . Price Analysis 194 . Volume and Value of Australian Exports to China 194
. Opportunities for Export of Australian Products 196
Whey Powder 196 . Products on the Market 197
. Local
. Industrial . Product Quality 19 9 . Consumer Profile 199
. Introduction
. Method of Use
. Consumer Knowledge of Product
. Product Preference . Seasonality and Climate 200 . Packaging 2 01
vi

. Market Analysis . 201
. Price Analysis 202
. Volume and Value of Australian Exports to China 203
. Opportunities for Export of Australian Products 205
6.8 Sweetened Condensed Milk 205 . Products on the Market 205
. Local
. Imported . Product Quality 206 . Consumer Profile 206
. Introduction
. Method of Use
. Product Preference . Seasonality and Climate 206 . Packaging 2 07 . Market Analysis 207 . Price Analysis '. 209 . Opportunities for Export of Australian Products 2 09
6.9 Summary 2 09 7. Discussion 7.1 China's Dairy Industry - Factors Influencing
Consumption and Import Demand 211
. Trends in Per Capita Income 214 . Income Distribution 215 . Income Elasticity of Demand 216 . Taste Preference 216 . Product Preference 216 . Geographic and Climatic Effects 217 . Population 218
. Annual Growth Rate
. Age Distribution
. Age Preference . Relative Price to Consumers 22 0 . Relative Price to Producers 222 . Prices Paid to Producers 223 . Government Policy 224 . Investment by Foreign Companies 22 5 . China's Geography and Natural Resources . 22 6 . Trade Policy 227
7.2 Australia's Dairy Industry - Factors Influencing Ability to Supply the Chinese Market 229
. General Agreement on Tariffs and Trade . . 230 . China's Trade Barriers 235 . International Trade Groupings 237 . Behaviour of Competitors 240 . Future Trends in Product and Process Technologies 245 vii

. Future Trends in Transport 246
. Physical Limitations 249
. Economic Limitations 250
. Deregulation of the Australian Dairy Industry 253
7.3 Forecasts for the Dairy Industry - Australian and International 256
. Australian Bureau of Agricultural and Resource Economics (ABARE) 257
. Ma and Garnaut 2 60
. Tyers and Anderson 261
. Roningen et al 268 7.4 Summary of Findings of this Study 270
7.5 Conclusion 275
8. Addendum
8.1 The Chinese Dairy Industry 282 . Dairy Production in China . Consumer Product Preference . One Regional Dairy Production Forecast
8.2 The Australian Dairy Industry 282 . Dairy Production in Australia . Butter Exports to China . Dairy Production Forecasts for Australia . Australian Joint-Ventures in China
8.3 World Trade Regulation, Regionalism and Alliances 283 . GATT and the WTO . GATT's Impact on Agriculture . Trade Regionalism . Trade Alliances
8.4 Outlook for World Dairy Markets 285 . Milk Sales in Asia . European Union . USA . Russia
8.5 Some Recent Publications 286
9. Appendix 288
10. Bibliography 312
viii

LIST OF TABLES Page
4-1-0 Population of China's Provinces and Other Administrative Areas (1990 year end) 68
4-1-1 Proportionate Ownership of Dairy Cattle in China 7 3
4-1-2 Costs Differences between Different Production Systems in 1989 8 0
4-1-3 Stockfeed Price Comparison 1987-1988 81
4-1-4 Farm Management Cost Comparison between 1987 and 1988 82
4-1-5 Milk Costs in China 1988-1990 82
4-1-6 Comparison between Cost of Milk and Farmgate Price in 1988 8 3
4-1-7 Farmgate Comparison between Australia and China 1988-1992 84
4-1-8 Cattle Distribution in China 85
4-1-9 Projected Numbers of Dairy Animals in China to the Year 2000 86
4-1-10 Projected Dairy Animal Numbers in China and Production to the Year 2000 87
4-2-1 Dairy Product Consumption in China (1978-1992) 92
4-2-2 Dairy Product Consumption by Region in China in 1986 93
4-2-3 Consumption Pattern of Various Food Items in China in 1986 and Projections to the year 2000 96
4-2-4 Average Dietary Intake of Various Food Items in China 1978-1988 98
4-2-5 Proportion of Annual Income Spent on Dairy Products in China 1978-1992 99
4-2-6 Projected Percentage of Dairy Product Consumption in China to the Year 2000 103
4-2-7 Expected Production Targets of Three different Market Segments in the Year 2000 . . 105
ix

Page
4-2-8 Agricultural Product Price Indices (Yuan) 1952-1988 (1950=100) 106
4-3-1 Customs Duties on Dairy Products in China in 1992 117
5-2-1 Australian Dairy Product Exports by Weight 1986-1991 129
6-1-1 Liquid Milk Consumption in China 1978-1992 . . 150
6-1-2 Liquid Milk Consumption per Capita in China 1978-1992 151
6-1-3 Analysis of Retail Liquid Milk Prices in China 1988-1992 152
6-1-4 Volume and Value of Australian Liquid Milk Exports to China 1987-1992 153
6-2-1 Prices of different Milk Powders in Five Regions of China in 1989 157
6-2-2 Milk Powder Consumption in Six Cities of China 1982-1989 162
6-2-3 Milk Powder Consumption per Capita in China 1978-1992 163
6-2-4 Price Analysis of Milk Powder in China 1988-1992 164
6-2-5 Volume and Value of Australian Milk Powder Exports to China 1987-1992 165
6-3-1 Butter Consumption in China 1978-1992 172
6-3-2 Butter Consumption per Capita in China 1978-1990 173
6-3-3 Butter Prices in Australia and China (Exchange rates 1988-1992 are Real Values) . . 174
6-3-4 Volume and Value of Australian Butter Exports to China 1987-1992 174
6-4-1 Estimated Yoghurt Consumption in China 1978-1992 180
6-4-2 Estimated Yoghurt Consumption per Capita in China 1978-1992 181
6-4-3 Estimated Yoghurt Price in Australia and China 1988-1992 182
x

Page
6-5-1 Estimated Total Volume of Ice-cream Consumption in China 1978-1992 187
6-5-2 Estimated Ice-cream Consumption in per Capita in China 1978-1992 188
6-5-3 Comparison of Estimated Ice-cream Price (USD) in Australia and China 1988-1992 . . . . 188
6-6-1 Cheese Consumption in China 1978-1992 192
6-6-2 Cheese Consumption per Capita in China 1978-1992 193
6-6-3 Comparison of Estimated Cheese Prices , (USD) in Australia and China 1988-1992 . . . . 194
6-6-4 Volume and Value of Australian Cheese Exports to China 1988-1992 . . . ' 194
6-7-1 Estimated Whey Powder Consumption irf China 1978-1992 201
6-7-2 Estimated Whey Powder Consumption per Capita in China 1978-1992 202
6-7-3 Comparison of Estimated Whey Powder Price (USD) in Australia and China 1988-1992 2 02
6-7-4 Volume and Value of Australian Whey Powder Exports to China 1988-1992 203
6-8-1 Estimated Condensed Milk Consumption in China 1978-1992 207
6-8-2 Estimated Condensed Milk Consumption per Capita in China 1978-1992 208
6-8-3 Comparison of Estimated Condensed Milk Prices (USD) in Australia and China 1988-1992 . . . . 209
xi

LIST OF FIGURES Page
1-4-1 Factors Influencing Consumption and Import Demand 14
3-1-1 Map of China Showing Dairy Belts and Dairy Bases 1988 33
3-2-1 Ownership of Milk Processing Factories in China Expressed as a Percentage, 1992 55
4-1-1 Map of China Showing Population Density, 1992 . . 70
4-3-1 Administrative Control of Dairy Factories in China 1992 112
4-3-2 Liquid Milk Distribution System in China 1992 . 113
4-3-3 Dairy Product Import Procedure in Shanghai 1992 116
4-3-4 Organisations Involved in Dairy Imports to China 1992 12 0
5-1-1 Australian Dairy Areas Showing Percentages of National Production 1990-1991 126
5-1-2 Australian Dairy Exports 1986-1991 13 0
6-1-1 Australian Liquid Milk Exports to China 1988-1992 154
6-2-1 Australian Milk Powder Exports to China 1987-1992 166
6 6-3-1 Australian Butter Exports to China 1988-1992 . 175
6-6-1 Australian Cheese Exports to China 1988-1992 . 195
6-7-1 Australian Whey Powder Exports to China 1990-1992 204
xii

APPENDIXES Page
Appendix 1 Milk Products Yield Conversion 282
Appendix 2 Dairy Experts Interviewed in China .... 283
Appendix 3 Cattle Distribution in China 290
Appendix 4 Goat and Sheep Distribution in China ... 291
Appendix 5 Milk Composition in the Provinces in China 292
Appendix 6 Regional Distribution of Dairy Equipment Factories in China in 1988 293
Appendix 7 Dairy Equipment Factory Locations in China 1988 294
Appendix 8 "* Cost Structure of Urban Dairy Farms in 1988 295
Appendix 9 Cost Structure of Dairy Farms in Pastoral Areas in 1988 296
Appendix 10 Cost Structure of Dairy Farms in Agricultural Areas in 1988 297
Appendix 11 Yuan and AUD Exchange Rate against USD 1978-1992 298
Appendix 12 World Exports of Dairy Products (provisional data for leading countries) in 1990 . . . 299
Appendix 13 Typical Farmgate Milk Prices 1987-1991 in Australia 3 00
Appendix 14 Farmgate Milk Prices in 1990 - Selected Countries 301
Appendix 15 Liquid Milk Consumption in Six Cities in China 1982-1989 302
Appendix 16 Comparison of Milk Prices in Eight Cities in China in 1988 303
Appendix 17 Milk Powder Consumption in Six Cities in China 1982-1989 304
xiii

ABBREVIATIONS
ABARE
ABC ADC AFS AHB Al AMF ATM BMP BRW BSF CAHIT CBE
CDDSSG CIS CMT CNSB CSICSC DFAT DPIE EC GATT G.CAHIT GB MAA MOA MOFERT NCE
NFIO RCC SEC SH SMP S&MC SNF SPC SSB UHT Milk UN US VT WMP WPC
Australian Bureau of Agricultural and Resource Economics Agricultural Bank of China Australian Dairy Corporation Australian Friesian-Sahiwal Animal Husbandry Bureau Artificial Insemination Anhydrous Milkfat Agricultural Trade Market Buttermilk Powder Business Review Weekly Bureau of State Farms (Provincial) Corporation for Animal Husbandry, Industry and Trade Commercial Butter Equivalent. Unit of Conversion of AMF to butter (1 kg butter = 0.805 kg AMF) China Dairy Development Strategy Study Group Commonwealth of Independent States California Mastitis Test China National Statistics Bureau China Statistical Information and Consultancy Service Centre Department of Foreign Affairs and Trade Department of Primary Industry and Energy European Community General Agreement on Tariffs and Trade General Corporation for Animal Husbandry, Industry and Trade (Beijing) Grain Bureau Market Administration Agency Ministry of Agriculture Ministry of Foreign Economic Relations and Trade Natural Cheddar Equivalent. Unit of conversion of processed Cheddar, pastes and spreads to natural Cheddar (1 kg processed product weight = 0.806 kg natural Cheddar) National Feed Industry Office Rural Credit Cooperatives State Economic Commission Specialised Household Skim Milk Powder Supply and Marketing Cooperatives Solids Non Fat State Planning Commission State Statistical Bureau (P.R. China) Milk subject to Ultra Heat Treatment United Nations United States Veterinary Technician Wholemilk Powder Whey Protein Concentrate
xiv
1
GENERAL INTRODUCTION
"There is no finer investment for any community than putting milk into babies."
Winston Churchill 1874-1965 Radio Broadcast 21 March 1943

l.l Rationale
2
In the last eight years, there has occurred an unprecedented
increase in international trade. However, today, there is a
global climate of uncertainty consequent upon revolutionary
changes in Russia and Eastern Europe and heightened by the
stalled Uruguay round of GATT talks, the economic recession of
the western world, and the crippling debt of Third World
countries.
The situation in Australia reflects both recession and the
debt. However, geographically Australia lies on the doorstep
of the one bright light in an otherwise gloomy international
scenario, the East and South-East Asian region, where in the
last decade, seven countries (Malaysia, Thailand, South Korea,
Taiwan, Singapore, Indonesia and Hong Kong) have leapt from
Third to Second World economic status. Current annual growth
rates range from 5.4% in Hong Kong to 8.6% in Thailand (Taber,
1992, p. 29).
As Mr. Taber described in Time magazine, this is the most
rapid spurt of economic growth ever recorded in history and is
likely to continue. Millions of East Asian consumers are
enjoying the new found affluence they have produced and are
creating a renewed boom. Some 70% of the population of the so-
called "Seven Little Dragons" is under 30 and they are
voracious consumers of everything from the latest electronic
wizardry to cars (Taber, 1992, p. 32). The secret of

3
economic success in Asia is an increase in intra-regional
trade driven by industrial specialisation and investment,
especially by Japan and Taiwan, and flexible policy responses
to external events. In 1991, intra-regional exports among East
Asian countries expanded 10% from the previous year (Taber,
1992, p. 31).
Total trade of the Seven was $784 billion in 1992. Their
biggest partner by far was Japan to whom they exported $27.3
billion and from whom they imported nearly USD 68 billion.
Overseas Chinese industries, especially from Hong Kong, have
also contributed to the success of the Seven and one-third of
the foreign investment in Malaysia, Thailand and Indonesia
comes from the original four "Dragons": Taiwan, South Korea,
Singapore and Hong Kong. The economic experiments of the Seven
have spilled over into Vietnam and southern China which are
adopting many aspects of their economic development programs.
Growth rates of these two countries now exceed those of the
Dragons, although they are starting from lower levels (Taber,
1992, p. 30).
In Australia, the dynamism so obvious in east Asia is lacking.
For example, in the second quarter of 1992, GDP in Australia
grew only 0.6% on an annualised basis which was down from 1.6%
in 1991 (Deans, 1992, p. 96). Australia's largest export
earner, coal, has played a major role in the development of
South East Asia and Australia possesses the primary products
and agricultural and engineering technology that Asia needs.

4
The stage is set for Australia to enter this extraordinarily
dynamic arena in which agriculture should play an important
part.
It is estimated that over the next decade, the food industry
in Japan and East and South Asia will grow by US$100 billion
(A$138.9 billion) compared with US$6 billion (A$8.3) in
Australia and New Zealand. Food imports in South Korea swelled
18% over the three years ending 1990, in Japan by almost 14%
and in Hong Kong by 12%. The percentage of processed food, a
by-product of affluence, is rapidly rising. The New Zealand
Dairy Board has acted quickly and already captured a third of
Japan's imported cheese market (Stretton, 1992, p. 82-83).
The very high penetration of television in Asian households
ranging from 99% of South Korea and Japan to 40% in the
backblocks of the Philippines is broadening the East's
exposure to Western-style food. Meanwhile tariffs on food
imports are being lowered in many countries. This should
provide unprecedented market entry opportunities for
Australian food marketers. If they can establish preferred
supplier status with expanding convenience store and
supermarket companies such as 7-Eleven, Makro and Wellcome,
they can "ride" on these retailers' growth. Another strategy
could be to consider off-shore operations to capture lower
production costs, create insider status and gain greater
market access.

5
Like almost every other industry in Australia today, the dairy
industry is currently experiencing a revolutionary awakening.
Major changes in policy in Canberra towards zero tariff levels
and the possibility of deregulation pose considerable
challenges.
It is said that in the future "China will not only be the
growth engine for Asia, but for the world" (Rennie, 1992, p.
95). In 1991 her exports grew by 15.8% to US$71.91 billion
(CMN, 1992, p. 17). China now accounts for 2% of world trade
making it the world's 13th largest trader (Australia is the
22nd). In January 1991, China stopped issuing subsidies to
foreign trade corporations and this did not affect its exports
adversely. The foreign trade system has now liberalised with
three sets of import tariff reductions affecting 43 types of
import commodities. The reductions in January and June of 1991
applied mostly to industrial and agricultural chemicals, the
one in 1992 affected 225 types of goods including food stuffs,
raw materials, and medical instruments (CMN, 1992, p. 18).
China's economic performance in the fourteen years since the
policies of Mr Deng Xiao-ping were adopted in 1978 has brought
about one of the biggest improvements in human welfare
anywhere at any time. Real GNP has grown by an average of
almost 9 per cent a year (Rohwer, The Titan Stirs. 1992, p.3).
The success of Mr Deng's policies and the enormous desire of
the Chinese population to modernise provides a potential
market for every imaginable technology and product.

6
Professor Ross Garnaut reported in 1989 that: "Demand for
agricultural produce - not only grain and fibre, but also
sugar, fats and oils and a range of other products - has been
growing more rapidly in China than in any other economy over
the past decade (Garnaut, 1989, p. 196) . In a more recent
publication with Mr. Ma Gou-nan, he stated that China's
reported GDP would need to be raised by a factor of three to
maintain its food consumption patterns which do not conform to
the group of poorest 25 world economies often characterised by
famines and financial bankruptcy. Overall consumption of high-
value foods enjoyed by an average Chinese consumer in the late
1980s had already reached Taiwan's level in the mid-1960s (Ma
and Garnaut, 1992, p. 3).
The performance of agriculture in China since 1978 as measured
by growth of production across a broad front has been
remarkable. Tyres and Anderson (1992, p.277) remark that the
striking feature of the 1980s was the initial rise in
agriculture's share of net material product from 33% in 1978
to 40% in 1984 before it fell back to 34% in 1987. This
reflects the fact that China's reforms were implemented to a
much greater degree in rural than in urban areas. In
particular farm product prices rose much more substantially
than the general level of producer prices during that decade.
Agricultural output by 1988 was 83% above the 1978 level
leading to a reversal of the long-run decline in agriculture's
share of national product in the early 1980s.

7
The important question facing China and other food exporting
countries is to what extent is China's food and feed
production growth likely to diverge from consumption growth in
the 1990s and what will be the consequences for world food
markets. Optimists like Garnaut believe a repeated doubling
of incomes in China would be possible in the 1990s if economic
reform continues (Tyres and Anderson, 1992, p.281) What is
unknown is how agriculture's share of the Chinese economy may
change by the year 2 000.
The Chinese, and Han people in particular, are not traditional
consumers of milk products. In fact as recently as 1950, the
vast majority of Chinese had never tasted milk. However, by
1979 per capita consumption of milk from cattle had increased
to 1.1kg and from then to 1985 it more than doubled to 2.4kg
(Simpson, 1988, p.25)
There is a widespread misconception in the West that all
Asians are lactose intolerant. In fact this problem affects
only about 40 per cent of any population.
Although China increased production of milk from 6.4 million
pounds to 9.3 million pounds between 1986 and 1990 and the
number of dairy cows increased from 1.85 million head in 1986
to 2.53 million in 1989 (Carlson, 1991), average milk
consumption is still very low by European standards.
Availability averages about 2 litres of milk per head per year
compared with 300 litres in northern Europe (Commodities and
Agriculture: China's dairy shake-up has a long way to go,
8
Financial Times, 1992, p. 4). However, demand for dairy
products in China is growing. Ice-cream which originated in
China in 1000 BC, is becoming popular and profitable as is
yoghurt and yoghurt drinks. On the other hand, the Chinese
dairy industry is unlikely to be able to meet consumer needs
in the near future and the system will take quite a few years
to change.
Australia is strongly advocating and promoting the concept of
co-production with China which would involve upgrading work on
traded products carried out at both the export and import
ends. This is the latest attempt by Australian authorities to
achieve greater Australian input in commodity based exports to
Asia. According to Mr. Alan Reid, Australia's Trade
Commissioner in Beijing:
"The Australia-China economic connection has turned hot, together with the pace of Chinese economic activity. The "big-sleeper" is food processing, with a number of major deals under negotiation at the moment. There is a constant stream of Chinese delegations going to Australia. I'm working 14 to 15 hours a day. It's quite extraordinary" (Byrnes, 1992, p. 7).
Given the above, this research focuses on the potential demand
for dairy products in China and Australia's ability to meet
this demand for the benefit of both countries.

1.2 Aims
9
The aim of the study is to develop an understanding of
production and demand of dairy related products in China with
a view to providing a basis to determine the export potential
of dairy products from Australia. In order to achieve this
aim, the following specific objectives were addressed.
. To provide an outline of the Chinese dairy industry
including favourable developmental factors and
developmental constraints. Ti
. Taking into account the influence of history, culture and
dietary preference on production and consumption, to
examine how current demand for dairy products in China
has been met through local production and or imports.
. To develop an understanding of the Australian dairy
industry and its capacity to satisfy any existing
shortfall in supply or contribute to any future growth in
demand for dairy products which is unlikely to be met
through China's domestic dairy industry.
1.3 Delimitations and Definitions
Dairy Products:
For the purpose of this study, the term dairy products refers
only to milk and milk products obtained from cattle. Such
products include pasteurised ready drinking milk, butter, milk
powder, yoghurt, ice cream, cheese and whey powder.

10
Milk/Product Conversions
The milk product yield conversion standards are those
formulated by the Australian Dairy Corporation. Details of
these are contained in Appendix 1.
China:
The research was restricted primarily to the People's Republic
of China with emphasis on Han residential areas.
Australian Dairy Industry:
The characteristics of the Australian dairy industry which
influence international marketing strategies related to
exportable dairy products have been included.
Statistical Data:
With the exception of Tables 4-1-1, 4-1-9, 4-1-10, 4-2-3,
4-2-4, 4-2-6, 4-2-7 and 6-1-1 which include official projected
data, in this study all data prior to 1991 are official
figures. Figures for 1991 and 1992 are estimates and for
1993-2000 are projections which have been made using
fundamental and technical analyses and relying heavily on
field research and the opinions of experts. Please note there
are doubts about the validity of some of the Chinese figures.
Cultural Differences:
A knowledge of the culture of a country including business
etiquette is of utmost importance in establishing
international trading relationships. This topic is not
covered in great detail in this thesis.

1.4 Methodology
11
Contrary to the predictions of Malthus and Ricardo, population
pressure in the world to this point in time has not lead to
rising prices for agricultural products (Tisdell, 1974, p.63).
This has been due largely to technological progress which has
enabled the output from the available land to be vastly
expanded. However, the developing economies of the countries
of Asia with their large populations may see the "Malthus-
Ricardo" trend yet asserting itself.
There are many ways of analysing data: demand schedules,
supply schedules, market demand schedules, indifference
curves, the Cobweb Model (involving lagged reactions and thus
with particular application to agricultural markets but
possibly unrealistic due to simplicity), consumer's
equilibrium, income consumption curves, Engle Curves which
show that the proportion of personal expenditure devoted to
necessities decreases as income rises and is relevant to food
products. This income elasticity of demand, however, depends
on whether the product is deemed superior or inferior.
The Hicksian approach to determining the demand for a product
estimates market demand curves on the basis of empirically
obtained preference relationships for each consumer in the
market. It adds together the demand curves which individual
consumers have for a product. However, it is impractical as
it does not take into account social factors such as bandwagon

12
and snob effects which influence the market demand curve
(Tisdell, 1974, p.95).
The econometric approach relies on the assumption that market
equilibrium is achieved (or virtually achieved) in each
observation period. When this is not so, for example because
Cobweb relationships are important, the method is inadequate.
Traditional demand theory ignores group and social influences.
Traditional economic theory assumes that consumers are well
informed and rational, at least on the whole. It is evident
that some consumers are in fact poorly informed and that the
majority of consumers are comparatively ignorant about the
properties of many new and complex products (Tisdell, 1974,
p.99).
The situation with a product such as milk is further
complicated by the fact that the demand for milk for liquid
consumption is relatively insensitive to price giving it a
steep demand curve, whereas the demand for milk for
manufacture is much more price sensitive (Hill, 1990, p.103).
In the 1980s many different models for farm economies were
developed. The most recent ones try to incorporate all
factors in the system and are extremely complex. They have
been reviewed by Tyres and Anderson (1992, p.157) and are
outlined in the discussion of this work.
Any attempt to analyse and forecast aspects of China's food

13
market in the present period of enormous change in the
country's economic system is a considerable challenge. This
is particularly so when the foremost authors on the subject
have stated that "official figures for China make no real
sense and that China's GNP is underestimated by a factor of
three" (Ma and Garnaut, How Rich is China, 1992, p. 3) and "How
production and consumption will respond as the Chinese economy
reforms is very difficult to predict..." (Tyers and Anderson,
"Disarray in World Food Markets" 1992, p.295).
There were several alternative ways to approach this study of
China's dairy market and Australia's ability to supply, among
them the established agricultural model employed by the F.A.O.
based on incomes, income elasticities, population, etc. or an
opportunity analysis or a survey of new business development.
Given that much of the data are difficult to evaluate, income
elasticities are irrelevant in situations where demand for
product outstrips supply, opportunity costs are not relevant
in countries which desire to maintain self-sufficiency in food
production, and new business development is under the auspices
of central planning, a simpler model (Figure 1-4-1 pers. conn.
Dr W. Schroder, Syme Business School, Melbourne) is employed.
Put simply, consumption less local supply equals import
demand. The various factors involved are considered. Mention
is made both to opportunity analysis with relation to trade
liberalisation in world food markets in the discussion
(section 7.2) and new business development is mentioned with
regard to milk processing facilities (section 3.1).

14
Income, Income Income elasticity distribution
CONSUMPTION
Less
Government Policy <- LOCAL SUPPLY
/ /
Prices
Supplier-Specific Demand Factors
Supplier-Specific Demand Factors
Equals
IMPORTS
Trade Policy
(Investment)
Australia
(Investment)
Competing Suppliers
Figure 1-4-1 Factors Influencing Consumption and Import Demand Source: D r W.R. Schroder, Syme Business School, Melbourne.(pers. comm.)

15
In this study, data has been collated and forecasts
extrapolated from recent historical trends. This was
considered to be the most suitable approach given for example
that figures for per capita income, a benchmark macro-economic
variable in estimating trends in economic change, in China do
not reflect reality as it exists today.
Seventy five selected Chinese dairy industry experts were
contacted in person and interviewed. Similar interviews were
held with 20 authorities in the Australian dairy industry. The
author was given particular assistance in this area of the
study by Murray Goulburn Co-operative Limited and the
Department of Primary Industry and Energy in Australia.
Dairy farms both in Australia and China were visited to obtain
a clear picture of the industry. Visits were also made to
dairy processing factories to gain a better understanding of
processing technology both in Australia and China and to
enable appropriate comparisons to be made.
In addition, several visits were made to the Melbourne Royal
Agricultural and Industrial Exhibition and Brisbane
Agricultural Exhibition to establish contacts with producers.
Desk research carried out in China included analysis of
published resources, published surveys, market research
projects, experiments and case studies. Access was also
provided to formal unpublished reports provided by officials
16
associated with the Chinese dairy industry. This was conducted
in conjunction with some sampling (7 cities in China and 5
cities in Australia), interviewing and consulting (about 100
Chinese dairy industry authorities and experts, see Appendix
2), statistical measures (with China's Ministry of
Agriculture), and systematic data collection (yearbooks, CD-
ROMs and relevant literature) both in Australia and China. The
review of literature for the purpose of gaining an insight
into the Australian dairy industry included secondary sources
from Victorian based libraries and official reports.
Dairy Industry Visit to China
In view of the author's prior knowledge and experiences in
China's agricultural industry, in November, 1992, the author
was invited to join an Australian Dairy Industry Trade Mission
to the People's Republic of China. The purpose of this Mission
was to obtain first hand experience of the market structure
and access primary source data concerning the current status
of the dairy industry. The author was one of the four members
responsible for preparing the mission report - "China's Dairy
Industry" which was submitted to the Department of Primary
Industry and Energy on 15th December, 1992.
1.5 Organisational Structure
A brief review of the literature is given in Chapter 2. Four
seminal texts are considered in detail in the Discussion.
17
In Chapter 3, the emphasis of the research is on dairy
production in China, the cost of which is fundamental to the
economics of the dairy industry.
Chapter 4 details the production and consumption patterns in
different areas of China and at different income levels. It
includes a description of the distribution system and
substantial data analysis of relevant aspects of China's dairy
industry.
A brief introduction to the Australian dairy industry is
presented in Chapter 5 and comparisons are made with the
internat i ona1 industry.
Chapter 6 gives a detailed analysis of China's dairy
consumption by product: liquid milk, butter, cheese, whey
powder, milk powder, yoghurt and ice cream. Australia's
potential to supply various segments of the Chinese dairy
market is also included.
Finally, Chapter 7 includes a discussion of factors
influencing consumption and import demand in China; factors
influencing Australia's ability to supply the Chinese market;
forecasts for the dairy industry (Australian and
international); a summary of the findings of this study and
how Australia might best formulate a strategy to participate
in the Chinese market.

18
This research offers a substantial analysis of the dairy
industry in China, which is still little known
internationally. It also provides a good starting point for
future research of the Chinese dairy industry.

2
LITERATURE REVIEW
Excerpt from Marco Polo's "Description of the World"
"You must know that, when a traveller leaves Yang-chau (Yang Zhou) and continues south-eastwards for fifteen miles, he reaches a city called Sinju (I-ching), which is of no great size but is a busy Presort of ships and merchandise. The people are idolaters and subject to the Great Khan. Their money is of paper. This city stands on the biggest river in the world, which is called Kiang (Yang Zi Jiang = Chang Jiang). In some places it is ten miles wide, in some eight, in others six, and in length it extends to 100 days' journey. Thanks to this river it is a city of innumerable ships, carrying quantities of goods and merchandise, and consequently a great source of revenue to the Great Khan.
I assure you that this river runs for such a distance and through so many regions and there are so many cities on its banks that truth to tell, in the amount of shipping it carries and the total volume and value of its traffic, it exceeds all the rivers of the Christians put together and their seas into the bargain. I give you my word that I have seen in this city fully 5,000 ships at once, all afloat on this river. Then you may reflect, since this city, which is not very big, has so many ships, how many there must be in the others. For I assure you that the river flows through more than sixteen provinces, and there are on its banks more than 200 cities, all having more ships on than this. This excludes the cities and territories situated on rivers flowing into the main stream, which also carry much shipping. And all these ships carry goods to this city of Sinju (I-ching) and back again. The chief article of commerce on the river is salt,
which traders load at this city and carry throughout all the regions on the river and also up-country away from the main stream along the tributaries, supplying all the regions through which they flow. For this reason salt is brought from a log stretch of the sea-coast into Sinju and there it is put on board ship and transported into all these regions. The same ships also carry iron. On the return journey downstream they bring into this city wood, charcoal, hemp, and many other articles on which the coastal regions are dependent. Even so, the shipping does not suffice to carry everything; a great many wares are transported on rafts. Hence this port or city provides the Great Khan with a substantial income."
R. Latham, "The Travels of Marco Polo", Harmondsworth, 1958, p. 175.

20
China is part of the dynamic growth area of North-East Asia, a
region described as "by far the most important food market for
Australia ... in the next several decades" (Garnaut, R.
"Australia and the North-East Asian Ascendancy", 1989, p.193).
In fact, primary products comprised 65 per cent of Australia's
exports to North-East Asia in 1990 (DFAT East Asia Analytical
Unit, "Australia and North-East Asia in the 1990s.
Accelerating Change", 1992, p.4). More specifically China has
been projected "to remain dependent on imports of wheat,
coarse grain, dairy products and sugar and to become a net
importer of rice" in the future (Anderson, K. and Tyers, R.
"Economic Growth and Market Liberalisation in China:
Implications for Agricultural Trade", 1987, p.140).
Despite the fact that, of the rural industries in Australia,
dairying ranks fourth, after wheat, wool and beef, in terms of
value of production and employs a considerable number of
people in related down-stream manufacturing and processing
establishments, a search of the literature reveals that very
little work has been published specifically analysing the
prospects of the Australian dairy industry in the Chinese
market. This situation is possibly due to the reputed "milk-
intolerance" of Asians, the fact that dairy products are not a
traditional part of the Asian diet, the complexity of the
Chinese market and lack of accurate statistics on agriculture
(remarked upon by Barker, R. and Sinha, R. in "The Chinese
Agricultural Economy", 1982, p. 1), and an underestimation of
the development of diet diversity which accompanies a rising
standard of living.

21
2.1 World Food Markets:
The seminal agricultural economics text on world food markets
is D.G. Johnson's "World Agriculture in Disarray" published in
1973 when the world was experiencing a "food crisis". A
second edition was printed in 1991. Other texts on the
subject which include the dairy industry (except Wen, S.) are:
Anderson, K. and Tyers, R. (1987) "Economic Growth
and Market Liberalisation in China. Implications
for Agricultural Trade." The Developing Economies
25, (2) June, pp. 124-151;
Roningen, V.O., Dixit, P.M. and Seeley, R. (1989)
"Agricultural Outlook for the year 2000: some
alternatives." in Maunder, A. and Valdes, A.
(Editors) "Agriculture and Governments in an
Interdependent World";
Wen, S. (1990) "Government Policies and Food
Sector Performance: The Chinese Experience" in
Tyagi, D.S. and Vyas, V.S. (Editors) "Increasing
Access to Food. The Asian Experience";
Tyers, R. and Anderson, K. (1992) "Disarray in
World Food Markets. A quantitative assessment";
Carr, E. (1992) " A Survey of Agriculture
Grotesque." The Economist, Dec. 12, pp. 1-18.
Recognised as the most comprehensive and detailed text to
date, Tyers and Anderson's 1992 work introduces a behavioural
model of world food markets which formalises the relationships
between structural changes and food policies on the one hand
and their production, consumption, price, trade and welfare
consequences on the other. It examines seven food groups

22
including dairy products in a special partial equilibrium
model and also considers China. These authors state that "the
important question now facing the food exporting countries
not to mention China itself - is: to what extent is China's
food and feed production growth likely to diverge from
consumption growth in the 1990s, and what will be the
consequences for world food markets?" (p. 279).
The afore-mentioned texts are especially pertinent to this
thesis and the findings of several of them are summarised and
related to this work in the discussion (Chapter 7).
2.2 World Trade and the GATT:
The future of world trade today revolves around the outcome of
the Uruguay Round of GATT negotiations which is focused on
banking, investment, intellectual properties and
telecommunications but also includes textiles and agriculture.
The talks were suspended in December 1990 over the issue of
European government subsidies for agricultural products.
Talks have resumed but are at present still unresolved. When
this Round of negotiations began in September 1986, the levels
of protection for agricultural products were greater than when
the first of the three Rounds, the Dillon Round negotiations,
started (D.G. Johnson, 1991, pp. 308-309).
A number of texts discuss the details and implications for
Australia and China of agricultural trade reform by the GATT
notably :
Horridge, M., Pearce, D. and Walker, A. (1990)
"World Agricultural Trade Reform: Implications for
23
Australia", The Economic Record 66, pp. 235-248;
Goldin, I. and Knudsen, 0. (Editors) (1990)
"Agricultural Trade Liberalisation. Implications
for developing countries" OECD, Paris;
Tyers, R. and Anderson, K. (1992) already cited;
Drysdale, P. and Elek, A. (1992) "China and the
International Trading System." Pacific Economic
Papers No. 214, Dec. 1992. Australia-Japan Research
Centre.
It is generally agreed that Australia's rural industries will
benefit in the medium and long term from a successful GATT
outcome (ABARE, Australian Resources Quarterly (ARQ) (1992) p.
50) .
Factors relating to China's membership of the GATT and future
possible outcomes however are extremely complex and
multifaceted. China is a very large country but still a
relatively small trader (Drysdale and Elek (1992) p. 9) As
mentioned, the effect of China's expected future trade
expansion is causing concern to all exporting countries but it
is likely that there would also be positive effects on exports
to the Chinese market and consumers in world markets. China's
penetration of world markets and the consequent need for
adjustment by others will be concentrated in the sectors where
its comparative advantage lies. It will be economically
efficient for China to import an increasing share of land-
intensive products such as grain for human and animal
consumption as well as an increasing range of meat products
(Drysdale and Elek, 1992, p. 13).

24
The uncertainties caused by China's non-participation in the
GATT are perhaps most vividly illustrated by the annual
tensions surrounding the renewal of China's "most favoured
nation" (MFN) status by the US. China's resumption of
participation in the GATT would be very helpful in reducing
such uncertainties - full participation would ensure, for
example, that China could receive automatic MFN treatment from
all other contracting parties to the GATT. China would also
have the right to appeal against any arbitrary actions such as
unjustified anti-dumping measures, and selective import
safeguards, which might be taken in response to increased
exports by China (Drysdale and Elek, 1992, p. 15).
2.3 Economies of the Asia-Pacific Region:
There is a considerable amount of literature on the analysis
of the economies of the Asia-Pacific region since its major
importance to the world economy became evident. These studies
include distinguishing the policies which have contributed to
the rapid growth of the successful economies in East Asia.
Most notable is the World Bank's study entitled "The East
Asian Miracle" (1993) which concluded that success was due to
superior accumulation of physical and human capital and the
ability to allocate physical and human resources to highly
productive investments and to acquire and master technology.
It concludes that there is no single "East Asian Model". The
eight high-performing Asian economies (HPAEs) (Hong Kong,
Singapore, Indonesia, Japan, Korea, Malaysia, Thailand and
Taiwan) studied used different and changing sets of policies
to achieve rapid growth with equity (p. 347) .

25
Some key aspects of these market-friendly policies which have
played a crucial role in the rapid growth of the HPAEs are:
Ensuring low inflation and competitive exchange rates;
Building human capital;
Creating effective and secure financial systems;
Limiting price distortions;
Absorbing foreign technology; and
Limiting the bias against agriculture (World Bank, 1993,
pp. 347-352)
The authors stress however the importance of good
macroeconomic management and broadly based educational systems
(p. vi). China, as a latecomer, has the benefit of seeing the
outcomes of the HPAEs choices and can profit from their
experience in her own future policy decisions.
.2.4 Comparative studies of China's Reforms:
A number of texts deal with a comparative study of China's
reforms and the role of government and trade liberalisation in
the different countries of the Asian region, notably:
Garnaut, R. and Liu, G-G. (Editors) (1992) "Economic
Reform and Internationalisation: China and the
Pacific Region";
Sicular,T (Editor) (1989) "Food Price Policy in
Asia. A comparative study";
Garnaut, R. (1989) "Australia and the North-East
Asian Ascendancy".
Garnaut and Liu's book details the ways in which China is
similar to and different from various economies with which it
is commonly compared - especially in the Pacific and Eastern

26
Europe and focuses on the important question at the centre of
China's reforms - the respective roles of the market and the
state in sustained economic growth - drawing experience in
East Asia and the once-communist countries (p. 8) . These
concerns are beyond the scope of this thesis.
2.5 Australia's Position in the North-East Asian Area:
Australia's position in the North-East Asian area is
considered by:
Garnaut, R. (1989) already cited, and
The Department of Foreign Affairs and Trade
(Australia) DFAT East Asia Analytical Unit (1992)
"Accelerating Change".
DFAT's East Asia Analytical Unit stresses the fact that
"North-East Asia is so dynamic that continual assessments of
economic trends are necessary and that Australia needs to be
alert and responsive to the big changes occurring there" (p.
10) .
The majority of texts dealing with the food industry are
general and those which are specific to the dairy industry are
indeed few in number. The main issues in the Chinese dairy
industry today are: how to increase the local production of
milk powder and how to improve the quality of its dairy
products. A major issue for the Australian dairy industry is
how to provide a reliable supply to export market demand.
There is no detailed study of Australia's potential to supply
the dairy market in the P.R. China. In undertaking this study

27
detailed basic information of both the Australian and Chinese
dairy industries are brought together. The work fills a void
in the literature, and aims to provide mutual understanding of
the two industries.
2.6 Statistical Data:
Statistical data relating to the Chinese dairy industry is
available in various publications of the China Ministry of
Agriculture, Beijing, and especially of the China Dairy
Development Strategy Study Group.
Statistical data on the Australian Dairy industry and figures
on international trade are published in ABARE's Agricultural
Resources Quarterly, (1992) and Commodity Statistical Bulletin
(1992); also in the Australian Dairy Corporation's Dairy
Compendium (1991).
In addition to published data, this study emphasises field
work and has placed importance on discussions with people at
diverse levels of the dairy industry for their views on the
industry's future. It includes opinions that are not in
centrally formulated statistics and attempts to bring these
together with data banks.
This thesis provides a starting point for further research
into the potential for specific products of the Australian
dairy industry e.g. SMP, whey powder, cheese and ice-cream
pre-mix, in the Chinese market. Its aim is to make a
contribution to Australia's knowledge of the market potential
for dairy products which will assist Australian companies in

28
decision-making and thus successfully compete in the
extraordinary dynamic market opportunity which exists in China
today.

3
THE CHINESE DAIRY INDUSTRY - A BRIEF INTRODUCTION
"When the sun stood at midday, the Divine Husbandman held a market. He caused the people of the world to come together and assembled the riches of all under Heaven. There they exchanged with one another and then returned home, each thing having found its appropriate place."
I-ching (Book of Changes)

3.1 General Background
30
Introduction
China's landmass encompasses a climate of great diversity
ranging from sub-arctic to tropical. Formidable physical
barriers have isolated China from easy contact with other
major cultures and these barriers also resulted in the border
regions of China being inhabited by unassimilated non-Han
populations.
China's dairy industry has a long history. About five thousand
years ago, minority nationalities in Northern and Western
China already had the custom of milking cows and yaks. Dairy
products formed an important part of the diet. Historic
records contain many passages describing the drinking of fresh
milk and the eating of cheese which was regarded as a
nutritious delicacy. Marco Polo, the famous Italian traveller,
wrote in his travel journal that the Mongol cavalry used milk
powder as rations. Over the last century or so, with the
introduction of Friesian, Simmental, Swiss Brown, British
Shorthorn and other premier breeds of dairy cattle and milking
goats, dairy farms and small scale processing factories were
established in and around the coastal cities to supply fresh
milk to foreign residents, needy babies, the ill, and wealthy
Chinese. After 1949, the people's living standard rose, and,
as part of the development of the food industry, the dairy
sector gradually extended geographically (China's Dairy
Development Strategy Study Group, 1988, pp. 35-40).

31
However premature collectivisation of agriculture in the late
1950s, the policies adopted in 1958 which were followed by
three years of famine and then the regrettable consequences of
the Cultural Revolution of 1966-76 badly disrupted China's
economic progress. After 1976 Mr Deng's first reforms
concentrated on creating a market economy in food, initially
by freeing prices for most food except grain (and milk) and
eventually by abolishing the agricultural communes as the unit
of production and replacing them with what were basically
family farms (Rohwer, The Titan Stirs, 1992, p.6).
These two moves brought about an enormous increase in farm
production, resulting in a surplus of rural savings necessary
to finance the industrialisation of China. The political
genius of the reforms was that they captured this surplus not
by milking the countryside as Stalin did in the USSR, but by
making farmers richer. Mr Deng's second element of early
reform was the "open-door policy". This eliminated the
central government's monopoly over foreign trade by
establishing special economic zones. These drew in foreign
capital, companies and expertise mainly from the ethnic
Chinese businessmen of Hong Kong and Taiwan (Rohwer, The Titan
Stirs, 1992, p.7). These policies resulted in a change from a
situation where per capita consumption of food fluctuated
around a stagnant general tendency (1952-1978) to an
acceleration of per capita outcome and income growth which has
fluctuated around a strong upward trend ever since (Ma and
Garnaut, 1992 p.7).

32
Production Statistics
According to various issues of China's Yearbook published by
the Chinese Bureau of Statistics, the total production of
cattle and goat milk has increased 18 fold in the 39 years
since the founding of new China. During these 39 years, from
1949 to 1988, the total dairy cattle population, including
premier breed cows and approved crossbred animals, increased
from 120,000 to 2.22 million head. Milk goats increased from
170,000 to 3.22 million head, representing an average annual
growth rate of 7.8%. During the same period, the total
production of cow and goat milk increased from 217,000 tons to
4.189 million tons, an average annual growth rate of 7.9%.
From 1949 to 1987, dairy cattle numbers increased at an
average annual rate of 4.9%. During the most rapid development
period from 1979 to 1985, the average annual growth rate for
dairy cattle was 19.1%, while that of milking goats was only
6.5%. The total milk production during the period increased at
an annual rate of 16.9%.
From 1986-1988, the annual growth rate of dairy cattle numbers
was 9.7% while that of milk goats was 17.5%. The total milk
output for this period increased by an average annual rate of
12.2%. This indicates a significant increase in the milk
production per cow during these three years, since 1988, the
number of cows and cow milk production have shown a tendency
to stagnate and decline (China's Dairy Development Strategy
Study Group, 1988, pp. 35-40).

33
u Q
:=«ii! _ w
5 *
pSSSS
.V'-«) l - ^
•st 5a tv.«c: —«_s
b) Hi!
*&r_
_ —- i*c ». »•
2§§fSS
«• S4*J •-*•*• H 5 *
- n ,5Si-:>-»lic,.'2'2
C «£ *•" £Q —!
34
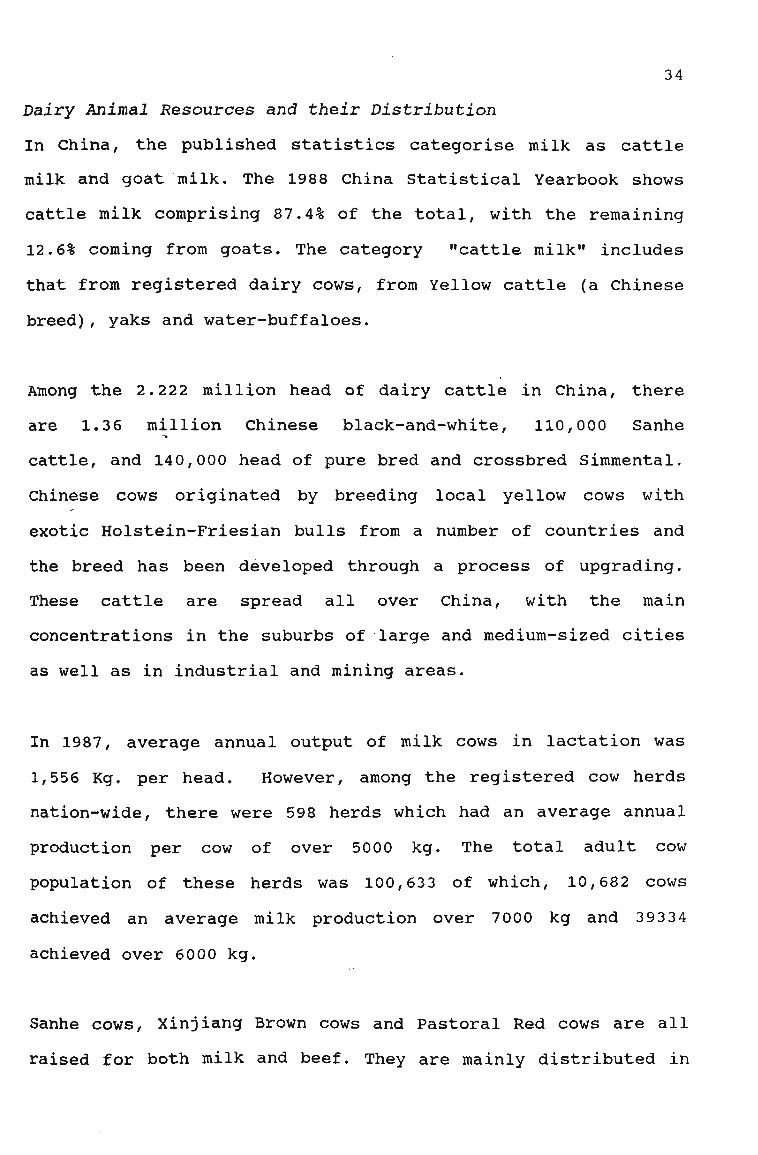
Dairy Animal Resources and their Distribution
In China, the published statistics categorise milk as cattle
milk and goat milk. The 1988 China Statistical Yearbook shows
cattle milk comprising 87.4% of the total, with the remaining
12.6% coming from goats. The category "cattle milk" includes
that from registered dairy cows, from Yellow cattle (a Chinese
breed), yaks and water-buffaloes.
Among the 2.222 million head of dairy cattle in China, there
are 1.36 million Chinese black-and-white, 110,000 Sanhe
cattle, and 140,000 head of pure bred and crossbred Simmental.
Chinese cows originated by breeding local yellow cows with
exotic Holstein-Friesian bulls from a number of countries and
the breed has been developed through a process of upgrading.
These cattle are spread all over China, with the main
concentrations in the suburbs of large and medium-sized cities
as well as in industrial and mining areas.
In 1987, average annual output of milk cows in lactation was
1,556 Kg. per head. However, among the registered cow herds
nation-wide, there were 598 herds which had an average annual
production per cow of over 5000 kg. The total adult cow
population of these herds was 100,633 of which, 10,682 cows
achieved an average milk production over 7000 kg and 39334
achieved over 6000 kg.
Sanhe cows, Xinjiang Brown cows and Pastoral Red cows are all
raised for both milk and beef. They are mainly distributed in

35
the rural and pastoral regions in Mongolia, Xinjiang, Jilin,
Heilongjiang and Hebei provinces and in some other areas.
Given favourable conditions, the lactation yield of these
types of cow is generally between 1500-3500 kg.
The ownership of registered dairy cattle is divided as
follows: one third is owned by the State and two thirds by
collective farms or individuals. Overall, some 50% of the
dairy cattle are owned by individuals but this percentage
varies greatly from city to city. For example, the percentage
of private ownership is as high as 92% in the city of Fuzhou
in 1987.
There are 60.659 million head of Yellow cattle in China, among
which 24.793 million are production cows. There are over ten
different varieties including Qinghua cattle, Nanyang cattle,
Luxi cattle and Yanbian cattle. These are mainly distributed
in rural and pastoral regions. The areas with a stock of over
one million head of production cows are the Autonomous Regions
of Guangxi, Inner Mongolia and Xinjiang. The Mongolian cattle
are seasonal producers of milk with an annual production of
around 500 kg.
The country has 14 million yaks, 4.62 million of which are
production animals. After a resource survey, 10 high quality
breeds were identified and selected: Maiwa Yak in Yinchuan,
Tianzhu White Yak in Gansu, Huanhu Yak in Qinghai, Jiali Yak
in Tibet, Bazhou Yak in Sichuan, Qinghai plateau Yak, Yadong

36
Yak in Tibet, Sibu Yak in Qinghai and Tibet, and Zhongdian Yak
in Yunnan. These are mainly distributed in the south-west and
north-west plateau pastures of the Provinces of Gansu,
Qinghai, Sichuan, Yunnan and the Autonomous Regions of Tibet
and Xinjiang. Of the total, 92.2% are concentrated in Qinghai,
Tibet and Sichuan.
Production yaks have a unit milk production of 250 Kg
annually, with a fat content of 6.5-7.5% and a dry matter
content of 17.3-18.4%. Yak milk provides 90% of the milk
products in Tibet, 80% in Qinghai and over 70% in Sichuan.
There are 21.067 million water buffaloes in China, among which
8.042 million are production buffaloes. Water buffaloes in
China are the marshland type, and have traditionally been used
as draft animals. They are mostly found in the central-south
and south-west regions, where 84% of the country's total stock
is concentrated. The better known breeds are the Haizi water
buffalo in Jiangsu, Dehong water buffalo in Yunnan, Dechang
water buffalo in Sichuan, Binhu water buffalo in Hubei and
Hunan, and Xinglong buffalo in Guangdong. A production buffalo
cow produces, during one lactation, 500-1000 Kg of milk, with
a fat content of 7-11% and a dry matter content of 17-21%.
In the 1950s, the Mora buffalo was introduced from India, and
later the Neri-Rafi buffalo was also introduced from Pakistan.
They were used for crossbreeding with Chinese water buffaloes.
At present, there are 150,000 hybrid water buffaloes in

37
various parts of China, with each mature buffalo cow capable
of producing 1500-2000 Kg of milk during one lactation.
According to preliminary statistics, there are about 4,000
water buffaloes at present which are actually being milked.
There are 3.22 million milk goats in China, with 2.252 million
head of production Nanny goats. They consist mainly of hybrids
from crosses between Saanen goats and various local breeds,
resulting in Xinong Saanen goats, Laoshan mountain milk goats,
Hongdong milk goats and Guanzhong milk goats. Between 60-70%
of the country's total goat stock are descended from the
Xinong Saanen goat.
A production Nanny goat of this type produces 2 3 5-600 Kg. of
milk annually. Their main distribution areas are the provinces
of Shanxi with 828,000 head, Shandong with 801,000 head, Henan
with 410,000 head and Hebei with 328,000 head, making up a
total of 2.367 million head, the equivalent of 73.6% of the
total stock in the country. They have a combined milk
production of 402,000 tons which represents 75.8% of the
national goat milk production.
Appendix 3, Appendix 4 and Appendix 5 show cattle, goat and
sheep distribution and milk production composition in
different provinces in 1991.

38
Favourable Development Factors
Existing Specialised Dairy Herd and Extension Services
According to China's Dairy Industry Report compiled by the
Ministry of Agriculture (China), in 1988, there were 1.21
million adult dairy cows and 1.02 million heifers giving a
total herd of 2.22 million dairy cattle. More than half of the
cattle are China Black and White (CBW) derived from
Holstein/Friesians and there are significant numbers of high
yielding cattle of other exotic breeds such as the Simmental.
Because of the size of the herd and its potential for natural
increase, the expansion in dairy cattle numbers can now be
achieved from domestic sources. \
Artificial Insemination (Al) is widely accepted and practised
on farms in China. There are many high quality imported bulls
and the local semen supply- is supplemented by imported frozen
semen. This is being used both to upgrade the potential of the
existing CBW herd and in a program of crossbreeding with the
local Yellow cattle. Crossbreeding involves some three million
cows per year - two thirds to enhance dairy production and one
third for beef production.
Third generation dairy crossbreds with a production of more
than 3,000 litres of milk per lactation can he classified as
CBW cattle and the crossbreeding program has permitted a
faster rate of growth of the dairy herd than would have been
possible from the natural increase in the established CBW
herd. Between 80,000 and 100,000 crossbreed animals are

39
introduced to the dairy herd each year.
In the southern provinces there are 8.04 million buffalo cows.
A breeding program has commenced with some 4,000 milk
buffaloes which should provide a basis for a significant
expansion of buffalo milk production in the longer term.
In certain areas, Saanen goats and their crossbreeds are the
dominant source of milk. Within China 64 base counties have
been designated as centres of dairy goat production and these
are supported by research centres and breeding farms. Goats
have the advantages of needing a lower percentage of
concentrates in their diet, strong disease resistance and
rapid reproduction rates. With a low initial capital
investment they are particularly suitable for milk production
on small farms in rural areas.
Feed and Fodder Availability
The technique of silage making to provide winter feed is
widely practised and there is an experimental program on the
ammonisation of straw to improve the feed value of some of the
crop residues and to provide a cheaper alternative to some of
the poorer quality hays used on urban dairy farms. The total
quantity of straw ammoniated and otherwise chemically treated
in 1988 was 1.5 million tons and there are plans to establish
pilot ammonisation stations in Hebei, Henan and the Xinjiang
Uygur Autonomous Region.
40
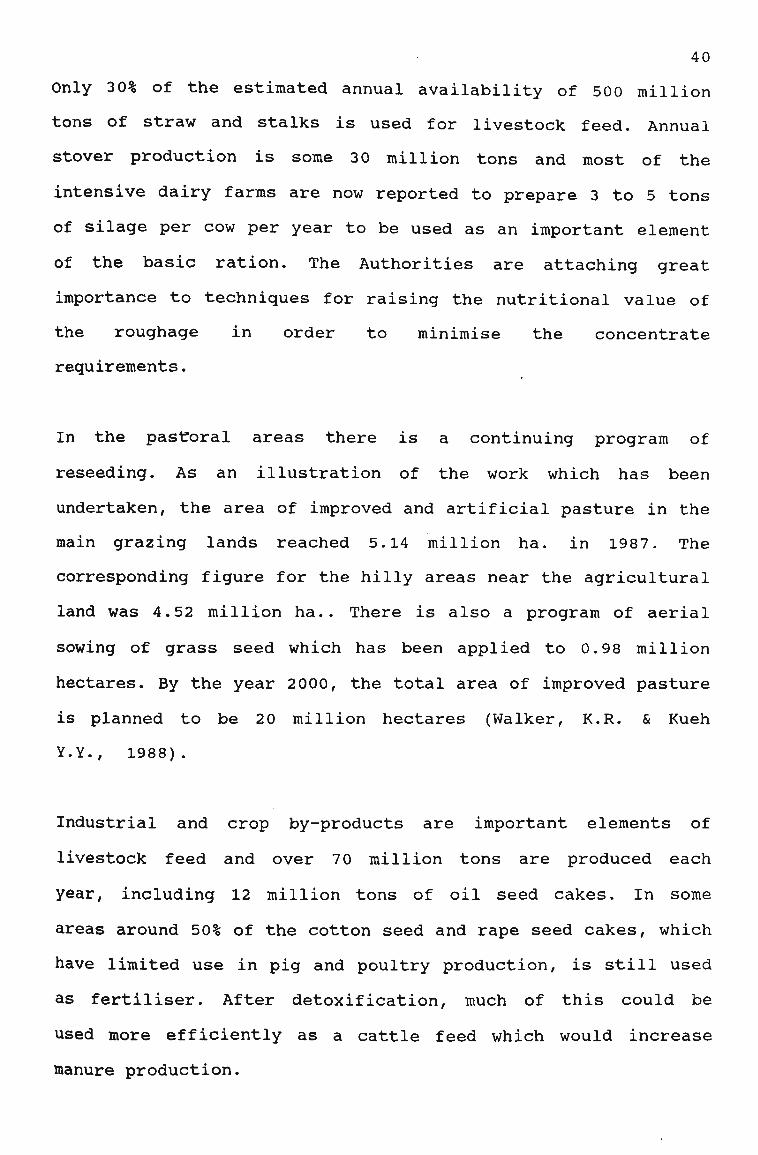
Only 30% of the estimated annual availability of 500 million
tons of straw and stalks is used for livestock feed. Annual
stover production is some 30 million tons and most of the
intensive dairy farms are now reported to prepare 3 to 5 tons
of silage per cow per year to be used as an important element
of the basic ration. The Authorities are attaching great
importance to techniques for raising the nutritional value of
the roughage in order to minimise the concentrate
requirements.
In the pastoral areas there is a continuing program of
reseeding. As an illustration of the work which has been
undertaken, the area of improved and artificial pasture in the
main grazing lands reached 5.14 million ha. in 1987. The
corresponding figure for the hilly areas near the agricultural
land was 4.52 million ha.. There is also a program of aerial
sowing of grass seed which has been applied to 0.98 million
hectares. By the year 2000, the total area of improved pasture
is planned to be 20 million hectares (Walker, K.R. & Kueh
Y.Y., 1988).
Industrial and crop by-products are important elements of
livestock feed and over 70 million tons are produced each
year, including 12 million tons of oil seed cakes. In some
areas around 50% of the cotton seed and rape seed cakes, which
have limited use in pig and poultry production, is still used
as fertiliser. After detoxification, much of this could be
used more efficiently as a cattle feed which would increase
manure production.

41
Dairy cattle in 1988 consumed an estimated 700,000 tons of
grain which represents less than 10% of the total of 99.4
million tons used as livestock feed. In some regions where the
length of the growing season does not permit the production of
maize grain as a second or third crop it may be possible to
raise the production of the agricultural land by introducing a
crop of fodder maize.
For compound feed, there are factories which manufacture pre-
mixes, supplements and concentrates. The feed milling
industry, which is mainly concerned with the production of pig
and poultry feed does have excess capacity in many areas which
could be used to improve the availability of compound feed.
Milk Processing Facilities
During the field trip to China in late 1992, Mr. Greame Wren
(technical expert, Murray Goulburn Ltd.) gave the following
accurate description of the present situation:
"In many areas there is a substantial under-utilisation of
dairy processing capacity. Some apparent excess capacity is
necessary to cope with seasonal variations in milk supply and
to allow for growth in milk production. Additional milk supply
could be processed with only minimal additional capital
investment and an improvement in the overall plant utilisation
would improve the profitability."
The local dairy machinery industry has invested in the
capacity to produce a wide range of dairy equipment. This

42
local manufacture will reduce the need for foreign exchange
payments for the establishment of new processing works.
Many of the more progressive processing organisations have
product development teams to introduce new product
specifically for the Chinese market. These will help to expand
the total market for dairy products and should improve the
overall profitability of milk processing. Special training
centres have been established, sometimes with the support of
other countries including Denmark, Finland and Sweden. This
investment can help ensure a supply of trained personnel for
existing and new dairy enterprises.
Government Support
Various measures have been introduced by the Authorities to
make it easier for farms to start dairy enterprises and to
improve the financial returns from milk production. These
measures include the provision of long-term loans at low
interest rates and the making available of supplies of
compound feed and concentrates at State listed prices.
Incomplete statistics show that in the last ten years the
agricultural banks have provided some 300 million Yuan of
loans in the dairy sector of which 130 million Yuan were
provided in Heilongjiang. In a few areas, land for fodder
production is also allocated to farmers starting dairy
production. Various subsidies are also made available to the
processing enterprises, including the remission or reduction
of taxes.

43
Dairy development was included in the 1988 "Vegetable Basket
Project" and has been given a high priority in the planning of
the development of supplies of meat, vegetables and other non-
staple foodstuffs.
Development Constraints
Shortage of Concentrates and High Quality Fodder
On a per capita basis the land area in China suitable for
intensive agricultural production is very limited and for the
past five years the national grain production has fluctuated
around 400 million tons. After meeting the direct human
consumption requirements only around 20% of the cereal
production is available for livestock feed. The demand for pig
and poultry meat has been rising rapidly and the consumption
trend is towards leaner meat. Pig and poultry farmers are
seeking increasing quantities of grain and other concentrates
which has caused a rapid increase in "negotiated" prices. This
is causing some farmers to reduce cattle feeding and results
in lower milk yields. Unless policies can be introduced to
increase the quantity of concentrates used by the dairy
industry, the industry will stagnate and the national feed
grain to animal protein conversion rate will decrease.
Arrangements of the provision of compound feed are inadequate
in many areas.
Deficiencies in Extension Services
Although there is a good network of veterinary centres, dairy
cattle represent such a small percentage of the livestock
population that the experience of the technical personnel in
many areas is limited. Farmers in areas with a low

44
concentration of dairy cattle may have to travel considerable
distances to obtain specialist assistance for both Al and
veterinary services. Minor diseases, particularly mastitis and
hoof and limb diseases are widespread in many cities and will
require corrective measures.
In many areas there is no adequate cattle insurance system.
This exposes dairy farmers, particularly individual owners, to
high financial risks.
Milk is a highly perishable product. In many areas the network
of collection centres is inadequate and farmers may have to
travel considerable distances to deliver their milk.
Particularly in hot weather, delays in getting the milk to a
refrigerated centre have an adverse effect on the quality of
the milk and, in extreme cases, may cause it to go bad.
Problems of Management and Training
Although the past few years have shown considerable
improvements in the skills of farm and processing works
management there is still a great variation in levels of
skills. Training at all levels from advanced management
techniques to the basic practice of cow feeding and milking
are important for future development. For maximum efficiency
the management must be able to respond quickly to changed
circumstances and the effectiveness is reduced if the decision
making process is too long.

45
Outdated Processing Eguipment
There is no unified policy making body to guide management of
the industry. As a result there has been inefficiency in
investment, particularly in the processing sector where there
has been a significant duplication and an irrational location
of new plants and collection centres.
Many of the older milk plants are unable to meet the strict
standards necessary for the production of high quality
products. In addition, the dairy machinery industry is
currently unable to supply the numbers and types of test
equipment necessary for a national milk quality improvement
program.
The over capacity of processing equipment means that the total
energy consumption is higher than necessary and the cash
generation is generally inadequate to provide for replacement
of equipment at the end of its useful life or to undertake
necessary maintenance. The small size of many of the older
plants makes it impossible for them to devote adequate
resources to the introduction of new products for their local
markets.
Insufficient Quality Control
The aforementioned problems have had an adverse effect on the
quality of milk and dairy products. In many areas the quality
control on these products is inadequate or ineffective. This
has permitted widespread adulteration of milk and
contamination with penicillin which makes much of the milk

46
unsuitable for the production of yoghurt. Improved quality
would require adequate training and supervision of all
involved, from milking, through collection and processing to
distribution and selling. Investment is also required in test
equipment and refrigeration.
Inexperience in Marketing and Selling
Although the nutritional value of milk has been well
recognised by the Chinese people, the sales, particularly of
pasteurised milk, are restricted by the inconvenience to the
consumer of "selling arrangements. When sales were severely
limited by low production, priority was rightly given to the
simplest and cheapest distribution and selling methods. As the
milk supply improves more emphasis must be placed on consumer
convenience, including improved packaging, if the full market
potential is to be achieved.
Shortage of Investment Funds
Compared with most other farming activities, the dairy
industry is capital intensive. In order to help control
inflation the Authorities have restricted the supply of
credit. It is now more difficult to obtain loans and interest
subsidies which play an important part in enabling farmers to
start or expand^dairy production. Financial limits are also
restricting the amount municipalities are able to invest in
state dairy farms. Particularly in dairy developing areas,
such farms may play an important role in acting as nucleus
farms and in providing support services for local individual
farmers.

47
Milk Prices
The farmgate price for raw milk has not kept pace with the
prices of other livestock products or with that of
concentrated feed at "negotiated" (free market) purchases. In
the period 1984-1988, the farmgate price of raw milk lagged by
approximately 12% behind increases in meat, eggs, poultry and
grain prices (CDDSSG 1988). This reduced the profitability of
dairy production and in some areas, some of the State farms,
even with substantial feed and other subsidies, are at present
making losses. When there are changes in production costs,
official milk price adjustment decisions must be made very
quickly because small farmers, in particular, lose confidence
very fast and recent history shows that they start selling and
sometimes slaughtering their cows at short notice.
In 1988, the milk price was increased by 1.78%, but this did
not compensate for production cost increases and a serious
decline in viability took place in the first half of 1989.
Particularly in the private sector, many farmers responded to
the decline in profitability by reducing their herds or even
quitting dairy operations altogether.
The price for the consumer, since milk is regarded as a health
commodity, has always been strictly controlled and fixed at a
permanently low level. In 1992, a general trend to abolish
price fixing occurred since with fixed prices, it is extremely
difficult to react adequately to changes in production costs
have taken place during the last few years.

48
To maintain standards for the urban consumers, milk should be
treated in plants which require relatively high volumes for
efficient operation. In the past, this inhibited the
development of a free market and made the dairy industry more
reliant than other livestock industries on the level of prices
set by the authorities. The processing profit margins were
restricted to the point where pasteurised milk often provided
little profit or even, in some cases, made losses. This
inhibited sales development.
In several cities the equivalent price of milk powder was
higher than that of liquid pasteurised milk, which stimulated
milk powder production rather than the processing of liquid
milk.
Conclusion
A foundation has already been laid for extension and
production support services. There are over two hundred
agricultural universities and colleges such as Beijing
Agricultural University in the country, most of which have
departments of animal husbandry and veterinary science. Some
have special courses on dairy cattle and milking goats and are
equipped with research facilities for these subjects. Some
offer special courses in dairy processing. Among the secondary
level agricultural schools, 40 have departments of animal
husbandry. There are ten dairy cattle research centres nation
wide, and five dairy industry training centres and new product
development centres that are open to students from all over
the country. There are six organisations with the

49
responsibility for technical co-ordination and breeding
including: the Dairy Association of China; Commissions on
breeding each of the following: Sanhe cattle, Xinjiang Brown
cattle, Pasture Red cattle, Simmental cattle, Yellow cattle,
water buffaloes and yaks; and the National Scientific and
Technical Coordination Group on Milk Goats and Goat Milk
Processing. Sixty nine cattle breeding stations have been
established as well as 251 Black-and-white dairy breeding
farms and eight Saanen goat farms. These are generally
relatively large farms producing high quality animals.
A four-level, i.e. provincial, county, township and village,
network for livestock health care has now been established
although the coverage is still being improved. There are 3200
county level veterinary stations with a total staff numbering
over 100,000 people. There are also 59,600 township level
Veterinary Stations staffed by 310,000 people. Some of these
stations have developed into multi-purpose service centres for
livestock procurement, disease prevention and treatment and
for the collection of milk and the distribution of feed. These
organisations are working actively in the vast rural and
pastoral regions to provide multi-stage services for the
development of the dairy industry.
At present, artificial insemination is widely used throughout
the public sector farm system in the country. In counties
which have been chosen as Yellow cattle improvement bases,
artificial insemination is now used in over forty per cent of
cases. Embryo transplant research and experimental programs

50
have been undertaken in a number of centres. Consideration is
now being given to the practical application of this
technique.
The two major diseases of dairy cattle, tuberculosis and
brucellosis, have been effectively controlled and all the
cattle on the farms in Beijing, Shanghai, Tianjin, Shenyang,
Harbin and other cities are free of major diseases.
In the past few years, dairy cattle feeding practices have
improved considerably and the use of silage as become
widespread. Research has been undertaken into the ammonisation
of straw to improve the feeding quality of some of the
roughage and to provide an alternative to some of the poorer
quality hay in the diet.
Calf feeding practices have also been improved significantly
and the quantity of milk fed per calf has approximately been
halved on the better farms. The authorities have estimated
that when this technique is applied throughout the industry
the saving, which can be sold as commercial milk, will be
approximately 30,000 tons.
The vigorous development in livestock raising, dairy
processing and dairy machinery manufacturing industries as
well as the extension of various appropriate technologies,
since the founding of new China, has provided a good base for
the further development of China's dairy industry. However,
many weak points still exist. Only by recognising them and

51
taking appropriate corrective action can a continuous, steady
and coordinated development for China's dairy industry be
achieved (China's Dairy Development Strategy Study Group,
1988, pp. 90-97).
3.2 Development of the Dairy Processing Industry
Introduction
The dairy processing industry has undergone a comparatively
rapid development in China. There are 760 dairy processing
factories, 3% of which have daily capacities of over 100 tons
of fresh milk. Another 40% of the factories each has a
capacity of processing around 50 tons of fresh milk per day.
The remaining 57% have daily capacities of less than twenty
tons. The province with the largest processing capacity is
Heilongjiang, which also has the largest production of milk.
It has 143 processing factories, with a combined capacity of
3700 tons of fresh milk a day. Over half of the country's
total milk collection is sold as pasteurised milk; the balance
undergoes further processing (CDDSSG 1988).
According to the China National Statistics Bureau (C.N.S.B.),
China's Yearbook (1990), the total production of dried dairy
products was 294,000 tons in 1988. Over 70% was in the form of
milk powder and the balance comprised relatively small
quantities of cream, cheese, casein and lactose. This
production represented an increase 5.4 times (540%) over the
1978 figure of 46,000 tons (China's Yearbook (1990) p.256).

52
The provinces, autonomous regions and cities that produce over
10,000 tons of dairy products annually include Heilongjiang,
Zhejiang, Inner Mongolia, Guangdong, Shaanxi, Shanxi and
Shanghai. In order to satisfy the consumer demand and the
needs of the food processing industry, a considerable amount
of dairy products is imported from abroad every year.
Published statistics show that 390,000 tons of milk powder and
10,600 tons of condensed milk were imported during the period
1979-1986.
In 1988 the' situation in China showed that of raw milk
produced, cow's milk comprises 4,157,000 tons, and goat's milk
606,000 tons, totalling 4,763,000 tons, of which 60% is
pasteurised for drinking and 40% is for further processing to
milk powder or condensed milk. The total number of personnel
is 100,000 staff, 3.5% of which are technical people.
Every province in China has at least one processing factory
and Heilongjiang and Shaanxi have the highest number of these.
Production of dairy products (pasteurised milk, yoghurt, milk
drinks, ice cream) in 1949 was more than 600 tons and had
increased in 1987 to 272,000 tons.
In the early 1950's, there were only 8 different kinds of
products, today, there are 30 kinds. Milk powder, used for
infants, old people and pregnant women, comprises 70% of all
dried milk products.

53
China has three dairy training centres: Beijing, Harbin and
Shanghai. In addition, most of the light industry colleges
have dairy science courses, as do most of the agricultural
universities and schools. In 1986, China introduced a national
standard for dairy products and set up a national dairy
quality control centre. China has a huge population but a
comparatively tiny dairy production, thus has been a dairy
importer for a long time.
Improvement in China's dairy technology has occurred over the
last decades." The improvement of equipment and new technology
applications is dated as follows: in 1950s, evaporation by pan
type drying was widely applied; in 1960s, spray drying became
popular; in 1970s, spray drying was widely used; and in 1990s,
China can design 50-100 ton milk powder plants by itself,
including evaporators, homogenisers, milk tanks and cleaning
systems. The sequence of product development is as follows: in
the 1950s, whole milk powder reached families; in the 1970s,
formula products became popular; in the 1980s, infant formulae
and soya bean products predominate the market.
Today the dairy service systems in China include: dairy
training schools; the Dairy Industry and Academic Association;
the tertiary dairy education system; the Dairy Industry Design
Institute; dairy technology development centres; dairy
technology and information exchange agents; the Dairy Enzyme
Supply Centre; dairy industry machinery factories; dairy
instrument factories; dairy industry journals; and the
national dairy supply network.

54
Current problems of the dairy industry include the following:
. a scarcity of dairy resources causing demand to outstrip
supply. Many factories operate at only 1/3 of their
capacity;
. a scarcity of technical personnel in that only 3.5% of
the Chinese dairy staff are technically qualified;
. out of date equipment which is not fully automatic is
common and productivity reaches only 6 tons of dairy
products per dairy worker per annum;
. an almost total ignorance of diversification of products
with customers having little choice;
. insufficient quality control; and
. poor management of dairy factories because they can be
under a wide variety of departments e.g. local
government, light industry, agriculture, commerce and
trade.

55
Ownership
The ownership of milk processing factories in China is shown
in a generalised form in Figure 3-2-1.
Ministry of Light Industry Food Machinery Division
Ministry of Commerce The Second Commerce Bureau (specialising on food whole sale and retail)
10%
5%
60%
Ministry of Agriculture Animal Husbandry Bureau & Agriculture Reclaimant Bureau
Local Governments
New Joint-ventures with Some Foreign Companies
•
Milk Processing Factories
iDt
10%
Figure 3-2-1 ownership of Milk Processing Factories in China
Note: . At present there are no privately owned milk processing factories but as China increases its open policy this situation may change.
. It is the opinion of many people in the industry that privately owned factories will eventually comprise at least 50% of the total.
. Joint-ventures will undoubtedly play a major role in these changes.

56
Infrastructure
Milk Collection and Product Delivery System
Most of the dairy farms in China have no freezing equipment
available for cooling the milk or what they have is
insufficient. The alternative solution is to either transport
the milk somewhere to be processed or consume or process
locally. In the remote areas, dairy farmers have to dry the
milk locally and then transport the powder out of the area. In
the areas where a transportation service Is available, the
milk tankers come to the collecting spots village by village
regularly. All the work including evaluating the quality of
milk, weighing the volume and paying for the milk has to be
done on the spot. In the suburbs of big cities, fresh milk is
transported mainly by tankers from specialised State and
Collective farms to city milk plants. Some seven per cent of
the total comes from private farms.
The collected milk has to be grossly filtered and then mixed
with some re-constituted milk before the combined product is
pumped into the processing line for pasteurising, packing and
delivery. Pasteurising is mainly done by normal heat treatment
but some factories do have UHT pasteurisation facilities.
Fresh milk is available in towns in remote areas thanks to
milk powder from grazing areas and international imports.
Pasteurised, plastic bagged, or bottled milk is distributed in
Beijing, Shanghai, and other large cities. Supplies are
limited to children under three years, sick or elderly people
and foreigners. In Shanghai, milk is supplied to 460,000

57
families of the total 7,220,000 population. Distribution is in
0.25 kg bottles or plastic bags through 120 centres and 700
distribution points. At present, marketing remains very
largely on this special commodity basis.
Citv Milk Plants
These plants were built mainly to supply fresh milk to city
residents. Most are located in the suburbs or even in the
centre of the cities themselves.
There are two methods available for the production of liquid
milk in the plants. The first is to use fresh milk transported
mainly by tankers from specialised State and Collective farms.
This milk is subjected to routine testing and pasteurisation.
The second method is to use skimmed milk powder and butter or
butteroil. The normal re-combining procedure is that firstly
the milk powder and butter are diluted with water and blended
by mixers. The blended mix is then pumped to the liquid milk
tanks for further blending with some fresh milk. The blended
milk also has to be pasteurised before being packaged in
plastic bags or glass bottles.
Since China has a milk voucher system in the main big cities
(standing voucher orders are purchased by individual citizens,
such voucher guarantees at least one month's liquid milk
supply in advance) , the demand volume of milk in each city is
quite stable. The plants just have to know the amount of daily
milk collected from the farms (this figure fluctuates
seasonally) , then the volume of milk powder and butter can

58
easily be calculated from the difference between the collected
amount and the required voucher volume. The fresh milk is
normally collected by the plants in the morning and the packed
liquid milk is available in the late afternoon. The milk is
standardised at a fat level of 3%.
City milk plants all belong to the Agriculture and Reclamation
Bureau, of the Ministry of Agriculture. According to the
planned economy in China, the Agricultural Bureau takes the
major responsibility for liquid milk transactions in China.
Milk Powder Factories
Because of transportation problems and the scarcity of
freezing facilities, 40% of total milk production is converted
into milk powder. There are no geographical barriers for milk
powder factories so long as fresh milk is available. They can
be located in the remote regions or the suburbs of cities.
The technology in these milk powder factories is not very
advanced because of long time neglect in the food industry,
especially dairying. The city plants are comparatively better
equipped and possess a higher capacity than those in the
remote areas. Their equipment includes driers (mostly spray
driers) , pasteurising equipment and packing tools. Almost all
of the milk powder produced in this way is packed in plastic
bags to minimise costs.

59
The main product of the remote milk powder factories is full
cream milk powder as there is no market for butter since the
Chinese use vegetable oil for cooking.
Yoghurt and Ice-Cream Factories
China has produced yoghurt and ice cream for many years. The
popularity of these two products has boomed in the last decade
in many of the large and medium sized cities.
Because of the difficulty of transportation and the local milk
subsidy policy, there are very few inter-city transactions.
Most of the factories in a city belong to the local government
and the aim of the investment by local government is mainly to
raise the standard of living of local people.
Yoghurt and ice-cream factories are all located in the cities.
The facilities of the factories include freezing and
fermenting equipment. Except in the big cities such as
Beijing, Shanghai and Tianjin, the varieties of yoghurt and
ice-cream are limited.
Consumers can purchase yoghurt or ice-cream at any time in
normal shopping hours as shops possess some freezing
facilities. Small private retailers go to the factories in the
early morning to buy their products which are then available
on the streets by mid morning.
In the 198 0s, the Chinese government imported sophisticated
dairy processing equipment aiming to promote the availability
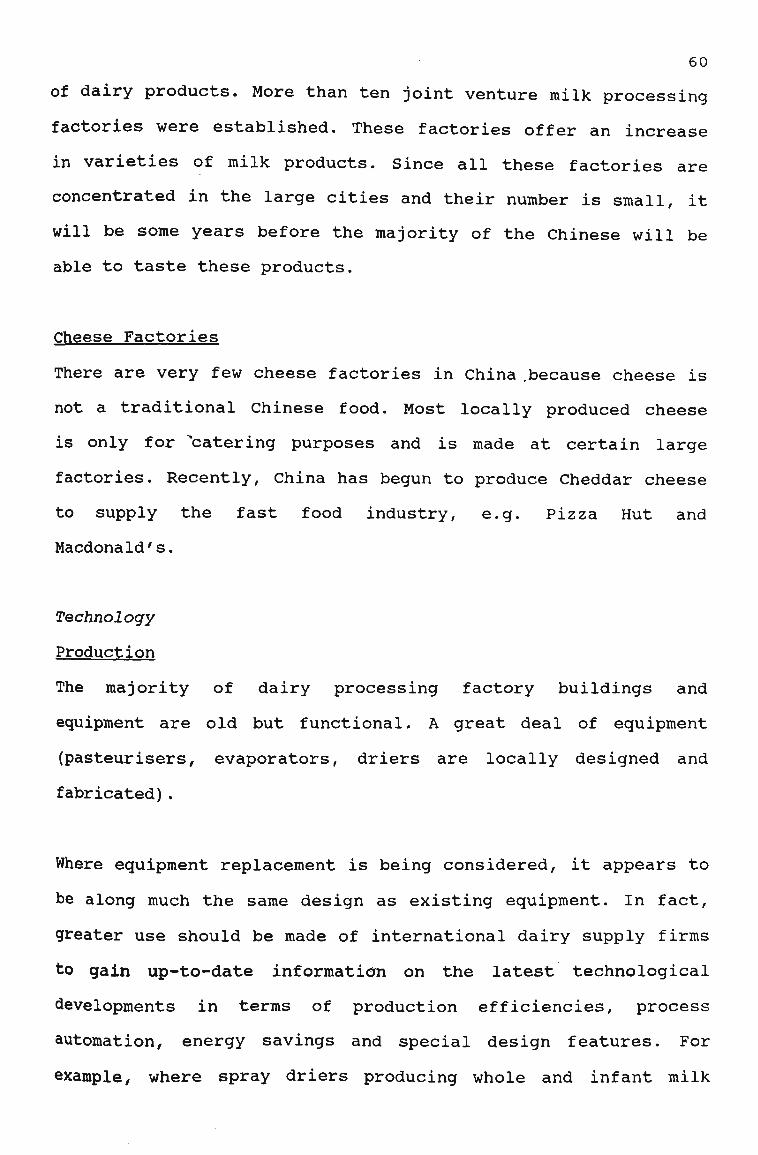
60
of dairy products. More than ten joint venture milk processing
factories were established. These factories offer an increase
in varieties of milk products. Since all these factories are
concentrated in the large cities and their number is small, it
will be some years before the majority of the Chinese will be
able to taste these products.
Cheese Factories
There are very few cheese factories in China .because cheese is
not a traditional Chinese food. Most locally produced cheese
is only for "catering purposes and is made at certain large
factories. Recently, China has begun to produce Cheddar cheese
to supply the fast food industry, e.g. Pizza Hut and
Macdonald's.
Technology
Production
The majority of dairy processing factory buildings and
equipment are old but functional. A great deal of equipment
(pasteurisers, evaporators, driers are locally designed and
fabricated).
Where equipment replacement is being considered, it appears to
be along much the same design as existing equipment. In fact,
greater use should be made of international dairy supply firms
to gain up-to-date information on the latest technological
developments in terms of production efficiencies, process
automation, energy savings and special design features. For
example, where spray driers producing whole and infant milk

61
powders are being replaced, consideration should be given to
equipment that is capable of producing a true instantised
powder providing a marketing edge in what is a very
competitive product, this is more or less restricted by the
availability of foreign currency and the skills which local
workers can obtain.
Packaging and Handling
In China consumer packaging and handling is now well advanced
regarding design and materials for both liquid and dried milk
products.
However, there is always cause for concern when pasteurised
liquid milk products are stored under less than ideal
conditions at milk vendor outlets and markets. The dangers of
rapid deterioration of such products when exposed to light and
temperature need to be well understood.
An opportunity exists at all powder factories to achieve more
efficient outputs of consumer packs by installing simple
automatic filling machines to replace the labour intensive
manual system. If this were done, the risk of product
contamination due to excessive handling would be reduced.
Environmental Issues
Environmental contamination in China will no doubt become an
issue in the future.

62
Close monitoring and identification of product losses from
both liquid and dry processes will be necessary. This will
result in greater financial returns and reduce the risk of
contaminating the environment.
In some factories, over-exposed production areas are subject
to pathogen contamination of the final product. Tighter
environmental controls and regular maintenance of buildings,
floors and drains would reduce this risk. In addition to this,
a tighter process control and final product testing and
clearance prdgram would assist in improved management.
3.3 Development of the Dairy Manufacturing Industry
Introduction
Before 1949, the dairy machinery manufacturing industry was
virtually non-existent in China. A few dairy factories in
coastal cities introduced some more advanced machinery and
equipment on a piecemeal basis but other dairy factories
generally used simple indigenous equipment. After the founding
of new China, especially since 1979, along with the rapid
development in cow and goat milk production and the growth in
market demand for dairy products, there has been a large
increase in the demand for dairy machinery. A manufacturing
industry has emerged to meet this requirement.

63
The early factories included the Shanghai Beverage Machinery
Factory which produced separators and the Shanghai Tobacco
Machinery Factory for high pressure pumps. Specialised
factories included the Shanghai Dairy Machinery Factory and
the An Da Machinery Factory in Heilongjiang.
More recently, the technology in these factories has been
updated and they now offer their Chinese compatriots turn-key
processing factories with a capacity ranging from 10 tons to
50 tons per shift.
New factories include: Ning Bo Food Equipment Factory
(Zhejiang Province) which can provide UHT machines; Da Cheng
Dairy Processing Equipment Factory (Shaanxi Province); and
Tianjin Aero Electrical Component Factory which offers soft
packaging machinery.
Thus, the manufacturing plants have progressed from producing
single machines to producing complete sets of equipment and
are now able to meet many of the requirements of the dairy
processing industry.
Current Situation
At the moment, there are over 700 milk processing factories in
China with a total capacity in 1989 estimated at 287,000 tons
(dry product). In 1985 alone, 56 new projects were set up.
Almost all these factories use equipment made in the 30 or so
dairy machinery equipment factories in China.

64
Dairy Machinery and Equipment Plants
Most of these factories belong to the Department of Light
Industry, Machinery and Agriculture, while a few come under
the Departments of Aviation and Aerospace Industries, Shipping
and Armaments Industries, and Commercial or Medical
departments.
Overall they have about 30 years experience in this field. The
huge, increase in milk processing plants over the last decade
has provided a wealth of expertise and today they are highly
specialised and highly efficient.
Technical Level of Equipment
Most of the machinery produced in the plants has a small
capacity. They are of practical design but are not precision
made; Stainless steel is the most widely used material and
overall the machines cost as little as one fifth of those
purchased from overseas.
Different machines provide capacities of 5 tons, 10 tons, 2 0
tons and 50 tons. Some larger ones (100 tons per eight hours),
are also available. In all, the equipment can produce products
which may be grouped in 18 categories (e.g. full cream milk
powder, yoghurt, butter, cheese, etc.) with 63 varieties (e.g.
flavoured milk, agitated yoghurt, etc.) and 264 specific
formulae (e.g. strawberry milk-; banana yoghurt, etc.).
The machines include equipment for milking and transport, for
the storage of milk and for milk collection; equipment for

65
high-pressure homogenisation, heat exchangers, evaporators and
driers, equipment for producing condensed milk, cream, ice
cream and malt and milk extracts, as well as packaging
equipment. Some of the products, including series plate heat
exchangers, a double effect evaporator and an ultra high
temperature steriliser, have won the State's gold medal for
quality, and the medal for outstanding new products.
Problems of Dairy Manufacturing Plants
Because of the situation that the plants are administered by
at least five" different departments, a uniform policy is very
difficult to put in place. In addition, as mentioned, most of
the factories are small and incapable of renewing machinery
and implementing new technology, so the demand for innovative
machines is low.
The weakest point has been the inability of the factories to
provide a quality testing device to processing plants. In
addition most of the processing equipment has a high energy
consumption rate.
Finally, the fact that 90% of all milking in China is carried
out by the traditional hand method poses a major restriction
on the purchase of milking machines.
Regional Distribution
Appendix 6 and Appendix 7 show the regional distribution of
dairy equipment plants in 1988.

66
In fact, Shanghai and Heilongjiang dominate the southern and
northern Chinese markets respectively whereas Beijing,
Liaoning, Shaanxi, Jiangsu, Guangdong and Zhejiang have strong
and promising industry capability for the future.

4
THE CHINESE DAIRY INDUSTRY - DEMAND FOR AND SUPPLY OF PRODUCTS
"When the sun stood at midday, the Divine Husbandman held a market. He caused the people of the world to come together and assembled the riches of all under Heaven. There they exchanged with one another and then returned home, each thing having found its appropriate place."
I-ching (Book of Changes)

68
4.1 Farms
Introduction
Population distribution and the cultural diversity of china's
minority groups originally determined the extent and location
of dairy production. China's population is 1.143 billion
(1990), the world's largest, and population density is 118
persons per square kilometre. Eighty per cent of the
population is classified as rural. The bulk of the population
resides on the alluvial and coastal plains (10% of China's
land surface).
The general distribution of population is illustrated in Table
4-1-0 below:
Table 4-1-0 The Population of China's Provinces and other Administrative Areas (1990 year end)
Source: China Brief (1991) Canberra
Anhui Beijing Fuj ian Gansu Guangdong Guangxi Guizhou Hebei Heilongjiang Henan Hubei Hunan Inner Mongolia Jiangsu Jiangxi
(million) 56.8 10.9 30.4 22.6 63.5 32.7 32.7 61.6 35.4 86.5 54.5 61.3 21.6 67.7 38.1
Jilin Liaoning Ningxia Qinghai Shaanxi Shandong Shanghai Shanxi Sichuan Tianjin Tibet Xinjiang Yunnan Zhej iang Armed Forces
(mill 24.8 39.7 4.7 4.5 33.2 84.9 13.4 28.0 108.0 8.8 2.2 15.3 37.3 41.7 3.2
Total 1.143 billion

69
Approximately six per cent of the population is comprised of
non-Han minorities, the largest of which are as follows
(Department of Foreign Affairs and Trade, China Brief, 1991,
p.7):
Zhuang (Guangxi Autonomous Region) Mongol (Inner Mongolia and Xinjiang Autonomous Region) Hui (Guizhou) Miao (Guizhou) Manchu (Manchurian Region) Bu Yi (Guizhou) Korean (Manchurian Region)
Because of cultural diversities and the relative numerical
insignificance of these groups in China's overall economic
development, they have been excluded from detailed discussion
in this study.

70
'm
STAN:-
w''.*'> - ; ,v^ **''.i j. /,
'RU'SSIA.:
««H«J3
»«&•?'
*•'-
XINJIANG
C_E_
r J*" UAONING
INNER MONGOLIA
NINGXIA
'GANSO^x
E__I3 (SHAANXI
E_E_
,JMM
311
NORTH "f KOtfcEJ
SOUTH KOREA'
Yellow §IA}*GSU Sf«
•
"I.V .'te.
»rSu^^W>HAN G H A I E5Z3 : ^^^_ B . HiyitJ:::;v:::
'GUIZHOU nr ~ * l v EE__
FUJIAN
• n___
* Population, million | Over 100
_ § 75-99
IK) 50-74 J • 25-49 ( |under25
BEE3 GNP per person yuan, 1990
Km 800 I
Source: China Statistical Yearbook
* ^ «
s^^.:yf^H4rM^:"'-r^
YUNNAN GUANGXI AWSOQNG 'AN
> H O N G KONG
8» %
(. '•:•• /HAINAN V^E_E_
t. South China
Sea
. ,a:THAIEANr».. .
V-— • < ^ }-->i>jyiETNAM t,; V*> ;•-'• •$£' •£: - **s '^>-w»-i-vi' p ~ r ' [ *%fc • A
PHILIPPINES
Figure 4-1-1 Map of China showing Population Density, 1992 Source: Rohwer, J. (1992) "The Titan Stirs",
The Economist. 28 Nov., p. 3.

71
As mentioned, the Chinese, and Han people in particular, are
not traditional consumers of milk products, however from 1979
to 1985 consumption of milk from cattle more than doubled to
2.4 kg per capita per annum. By contrast, in 1985 Japan's per
capita consumption was 60.8 kg compared with 104.0 Kg in
Australia. This would indicate that with the general growth
and development in the economy and increase in the purchasing
power of the Chinese people, the dairy industry in China has a
great potential for growth in the future.
Although China covers an area of 9,571,300 sq.Km. (almost 3.7
million square miles), and is the third largest country in the
world, there were only approximately 20,000 to 30,000 head of
specialised dairy cattle in 1950. By 1981, the national
inventory had reached 700,000 head with an output of l.l
million metric tons of milk per annum. By 1987, the inventory
stood at 2.1 million head whilst output was 3.2 million tons
per annum. Average annual output per head of milk cows in
lactation was about 1,570 Kg in 1981 and 1,556 Kg in 1987.
This decline was due to rapid growth in dual purpose cows.
Ownership
Administratively, China is divided into 24 provinces
(including Taiwan); 5 autonomous regions (A.R.) and three
municipalities, all of which are directly under the Central
Government (= State). There are over 2,000 counties and
cities, which are subdivided into 74,000 people's communes.
Other organisational structures such as macro-economic and

72
military regions may embrace several provinces, while urban
street organisations complete the administrative framework.
Almost all the state owned dairy farms and their relevant
distribution systems belong to China's Ministry of
Agriculture. Among these, 80% belong to China National
Agriculture, Industry and Commerce Corporation (Agriculture
Reclaimant Division of Ministry of Agriculture), the remainder
belong to China's National Animal Husbandry, Industry and
Commerce Corporation (Animal Husbandry Division of Ministry of
Agriculture). Most of the State owned dairy farms and their
relevant distribution systems are controlled by the provincial
Agriculture, Industry & Commerce Bureau or the provincial
Animal Husbandry, Industry & Commerce Bureau. Each of these
organisations have their own county level equivalent which
actually operates the farms. In fact, the Agriculture,
Industry & Commerce Bureau monopolises the dairy producing
industry and most of the fresh milk distribution systems in
China. The majority of collective farms belong to the county
level local governments. These are usually very small. Private
dairy farms are owned by individual farmers, each farm having
5 to 25 dairy cows. These probably represent the future of
China's dairy industry.
China is changing towards a market economy. From official
forecasts made by Ministry of Agriculture, the ownership
structure of dairy farms is predicted to undergo changes in
the period 1988-2000 as shown in Table 4-1-1.

73
Table 4-1-1 Proportionate Ownership of Dairy Cattle in China
Source: Development Strategy for China's Dairy Industry (1989) Hubei, China
YEAR 1988
ITEMS
State Owned Dairy Farms
Collective Dairy Farms
Private Dairy Farms
Total
NO. OF DAIRY COWS
710000
330000
1118000
2158000
PROPORTION OF THE TOTAL NATION (X)
32.90
15.29
51.81
100.00
NO. OF PRODUCTION COUS
390000
180000
650000
1220000
PROPORTION OF THE TOTAL NATION (X)
31.97
14.75
53.28
100.00
YEAR 2000
ITEMS
State Owned Dairy Farms
Collective Dairy Farms
Private Dairy Farms
Total
NO. OF DAIRY COWS
1100000
660000
3740000
5500000
PROPORTION OF THE TOTAL NATION (X)
20.00
12.00
68.00
100.00
NO. OF PRODUCTION COUS
610000
360000
2060000
3030000
PROPORTION OF THE TOTAL NATION (X)
20.13
11.88
67.99
100.00
Table 4-1-1 indicates that the Government intends the size and
the number of private dairy farms to increase markedly in the
coming years.
Production Systems
There are four major milk production systems in China, one of
which is pastoral based and provides milk for family use. This
is a subsistence level type operation. The second type, which
is also a subsistence type, involves very small private
producers, usually with 1-4 cows in lactation. In this
agricultural area based system, producers frequently herd
their animals alongside roads or in communal grazing areas
when forage is available. These producers also cut and carry
forage and, during winter, feed stored forage. A third,
emerging type of production system consists of small private

74
producers with 5 to 25 cows in which the animals are
maintained almost exclusively in barns and exercise yards.
This semi-intensive type of enterprise is usually part of an
agricultural operation where the producer grows his or her own
feedstuffs (Simpson, 1988, pp. 25-32).
The last system, which is likely to become most important in
the future, includes the State farms and, to a lesser extent,
the collective (communal) farms. These intensive type
production units are rather homogeneous in most of China and
centre around substantial brick buildings with large upright
silos. The barn usually has a central walkway with cows tied
on a gently sloping pad on each side.
The basic roughage in most areas is maize silage, but a wide
variety of seasonal feedstuffs, such as surplus vegetables,
sweet potato vines, fresh forage and hay along with crop
residues like maize stover and rice bran, cottonseed meal,
soybean meal and spent brewers grains are also commonly fed.
State and Collective farms produce the bulk of their own feeds
such as green chopped rye, barley and maize, and to a lesser
extent alfalfa and clover. They also contract with surrounding
villages or private producers primarily for root crops,
surplus vegetables, sweet potato vines and fresh grass. Hay is
a basic feedstuff for dairy cattle around the world,
especially in colder areas, but it is in short supply in
China's major specialised dairy cattle areas due to land
75
constraints. Some attempt is made to bring hay from pastoral
areas, but high transportation costs limit this activity.
A serious problem is the widespread practice of simply feeding
what is available without consideration of nutritive values or
compatibility with other feedstuffs. In addition, forages
found in communal areas or alongside roads are low quality and
inferior to improved grass and legume varieties now readily
available internationally. Variable feed quality also affects
animal health.
Medium and large dairy producers usually mill their own maize,
and just add a pre-mix or other ingredients to make a compound
feed. Sometimes these producers will purchase maize to mix
with compound feed. Small producers will buy either a complete
mix or a simple mixed feed from one of the State owned feed
mills. In both cases, a production subsidy is often provided
by permitting them to buy maize at the State controlled price
in proportion to the amount of milk delivered to milk
processing plants. In addition, some provinces, such as
Shanghai, have, on occasion, even provided some feedstuffs
free of charge on a proportion basis. Previously, a typical
subsidy of this type was 1 Kg of crop by-product for each 2.5
Kg of milk supplied. The amount for grain was 1 Kg of grain
for 4 Kg of milk delivered. In practice, State farms had first
access to available subsidised feed supplies. Collectives and
small producers sometimes had to buy on the free market, which
had considerable impact on their profits.

76
Specialised (very small) dairy producers often milk their cows
four times per day or at least three times. Collective and
State farms almost always milk three times a day. Virtually no
one milks twice daily. In addition, there is little use of
milking machines except in very large operations. The reason
for frequent milking, and by hand, is abundance of very cheap
labor. In addition, milking machines are best justified when a
completely modern milking parlour is introduced. It should be
noted that the incidence of mastitis is increased when milking
machines are used. Finally, although introduction of such
machines may be economically beneficial in some completely new
operations, it would seem that a real push for their
installation will only come when emphasis is placed on
improving sanitary standards. At present, somatic cell counts
are seldom made in milk plants. (The aforementioned comments
were made to the author during his research trip in China.)
Animal Health
According to the FAO's Animal Health Yearbook, 1985, China has
one of the world's lowest incidences of animal disease. The
only dairy cattle related disease reported is contagious
bovine pleuropneumonia. However, personal interviews conducted
during visits throughout China indicate that bovine
tuberculosis and Johne's disease are found among dairy cattle.
There are no reports of brucellosis. Some foot and leg
problems characteristic of cattle maintained for long periods
on concrete and in muddy exercise yards do occur (FAO, 1985,
pp. 154-145).

77
Mastitis is not considered a problem, mainly because of hand
milking. Most farms experience disease incidence of 5% or
less, but there are reports of 20% clinical mastitis on some
large farms which would be normal in high yielding herds
milked by machine. Improved udder washing with salt water has
reduced the problem in small herds. Most large farms use drugs
more specific to this end.
Calf mortality is very low on most farms, usually about 3-5%.
One main reason seems to be the introduction of the
responsibility system in which one labourer is assigned to
half a dozen or more calves and a bonus or deduction given
based on death loss. This system is widely used in China.
Another reason is that newborn calves are usually held
individually in very clean small pens for up to a week during
which time they are fed colostrum milk.
Despite the generally low level of disease, reproductive
disorders are common. For example, there is a high incidence
of retained placenta (up to 20% of calving on some farms) and
conception rates to first insemination are as low as 3 0-35%
(FAO, Animal Health Yearbook, 1983, pp. 247-289).
Internal parasites are not a problem and cattle are not
drenched because they are maintained in barns. External
parasites are not treated for in the north, but some fly
control along with parasite treatment is practiced in the
south.

78
Milk Handling Technology
Almost all milk which is sold is required to be marketed
through the State. Exceptions are the Communes and Collective
farms which may sell to members when output and distance to
market are prohibitive and thus do not warrant transportation
to processing plants. Municipal governments usually collect,
process and distribute milk. Provincial governments set
prices.
Milk is picked up directly from larger farms and via
collection station from small farmers. Raw milk, mainly
transported in cans, is often picked up three times daily in
summer and twice a day in winter as there are virtually no
cooling systems either on farms or at collection points.
Despite this, severe losses of raw milk have been recorded,
especially in the summer (Gartner & Krostitz, 1984, 35-43).
There are no can washers in most milk plants and washing is
usually done on farms by hand in cold or lukewarm water, thus
adding to sanitation problems.
As of 1984, there were a total of about 400 milk processing
factories in China. Most were small, with production
capacities of less than 10 tons per day. By 1988 about 3 0-40
new plants with a daily capacity of 500-1,000 tons had been
inaugurated. The larger ones not only process milk for liquid
consumption, but also manufacture milk powder, condensed milk,
malted milk powder and some butter. Legal standards for
pasteurised milk are a minimum of 3% fat and 11.2% total milk

79
solids. A number of medium to large processing plants have
been built in the past few years.
Economic Analysis
Introduction
For a long period the Chinese Government did very little to
develop the dairy industry. The reasons being the self-supply
system in the pastoral areas and the fact that dairy products
are a very small proportion of traditional Chinese cuisine.
However, because the Chinese regard milk as a healthy (curing)
food, the government gave comparatively large subsidies and
fixed the price of milk for almost 30 years (1950-1980) . For
the benefits of children, the government even decreased the
milk price several times during this period.
After 1980, China introduced an open market economy and the
price of milk began to reflect demand and supply.
Cost Structure
Appendix 8, Appendix 9 and Appendix 10 show the different
costs experienced by the three different production systems
which respectively are (1) urban dairy farms (2) dairy farms
in pastoral areas (3) dairy farms in agricultural areas. Among
these three, dairy farms in pastoral areas bear losses because
they are far from the market in the urban areas.

80
Costs Differentials between Production Systems in 1988 are
shown in Table 4-1-2.
Table 4-1-2
Source:
Costs Differentials between Production Systems in 1988 China's Dairy Development Strategy Study Group (1988) Development Strategy for China's Dairy Industry, Hubei, China
State Owned Dairy Farms
%
Collective Dairy Farms
%
Private Dairy Farms
%
Weighted Mean
%
TOTAL COSTS PER COW (YUAN)
4386.92
100.00
34|7.14
100.00
2938.61
100.00
3401.28
100.00
MILK PRODUCTION PER COW (KG)
6631.01
5063.03
4838.02
5309.79
FEED EXPENSES
2544.42
58.00
1952.80
56.00
1866.02
63.50
2043.77
60.09
SALARIES (YUAN)
386.05
8.80
484.71
13.90
493.69
16.80
444.14
13.06
OTHER COSTS (YUAN)
1456.45
33.20
1049.63
30.10
578.90
19.70
913.36
26.85
MILK COSTS (YUAN/KG)
0.6616
0.6887
0.6074
0.6406
From the table, it can be seen that the cost of milk
production in China is greatly affected by the price of animal
feedstuffs to the extent of up to 60% (cf. approximately 40%
in Europe). Furthermore, the private dairy farms were the most
efficient producers in China.

81
Cost of Milk
The cost of milk production is related to two major factors:
. Ownership: The cost of milk production on private dairy
farms is the lowest with the cost of feed representing
63.5% of the total. This is typical in China because of
the huge cheap labour force.
. Cost of Feed and Management: This cost has been
increasing since 1988 when China withdraw most of the
subsidies on feed to dairy farmers, leading to a sharp
increase in the stock feed prices as the following table
shows. ,
Table 4-1-3 Stockfeed Price Comparison 1987-1988 Source: Ministry of Agriculture (1988) The Report of
Dairy Projects in the Cities in China, Beijing, China.
YEAR
Bean Cake
Maize
Rice
Wheat
Rye
Carrot
Silage
Maize Straw
Grass
Bean Residue
Rice Straw
1987
0.320
0.343
0.410
0.420
0.060
0.112
0.070
0.014
0.014
0.050
0.044
1988
0.740
0.600
0.560
0.580
0.090
0.180
0.200
0.064
0.018
0.080
0.082
PRICE INCREASE (X)
131.250
74.927
36.585
38.095
50.000
60.714
185.714
357.143
30.000
60.000
86.364

82
Table 4-1-4 Farm Management Cost Comparison between 1987 and 1988
Source: Ministry of Agriculture (1988) The Report of Dairy Projects in the Cities in China, Beijing, China.
ITEM
Price Increase
COAL
40-80
ELECTRICITY
28-40
PETROL
40
MEDICINES
35
SALARIES
20
OTHERS
50
It extremely difficult to calculate accurately the rate of
increase in the production cost of milk, because China is
currently developing very rapidly and concomitantly converting
to a market economy. The virtual complete deregulation of the
industry makes it almost impossible to predict the rate of
price increase. For the year 1988, the MOA figures for price
increases for some farm input costs are shown in Table 4-1-4.
A weighted mean of these cost increases gives an estimate of
the annual increase in milk production costs of 12%. This
estimate was substantiated as reasonable by a number of
experts in the field in China. When applied to the 1988
figures it allows projection forward of milk production costs
to 1993 (Table 4-1-5).
Table 4-1-5 Milk Costs in China 1988-1990
YEAR
1988
1989
1990
1991
1992
1993
STATE FARM MILK COSTS (YUAN)
0.6616
0.7410
0.8299
0.9295
1.0410
1.1660
COLLECTIVE FARM MILK COSTS (YUAN)
0.6887
0.7713
0.8639
0.9676 •
1.0837
1.2137
PRIVATE FARM MILK COSTS (YUAN)
0.6074
0.6803
0.7619
0.8534
0.9558
1.0704
WEIGHTED MEAN OF MILK COST (YUAN)
0.6377
0.7132
0.7978
0.8923
0.9981
1.1164

Farmgate Price
83
To the producers, the farmgate price should be sufficiently
high to provide incentive to continue in the industry.
In 1988, the Ministry of Agriculture (MOA) did a survey of the
ratio between the cost of milk, and the farmgate price in 8
cities. This is shown in Table 4-1-6.
Table 4-1-6 Comparison between Cost of Milk and Farmgate " Price in 1988
Source: China's Dairy Development Strategy Study Group (1988) Development Strategy for China's Dairy Industry, Hubei, China
CITY
Beijing
Shanghai
Tianjin
Nanjing
Xian
Guangzhou
Hangzhou
Changsha
Average
Weighted Mean
WEIGHTED MILK COSTS
0.567
0.663
0.498
0.672
0.518
0.891
0.637
0.677
0.640
0.611
WEIGHTED FARMGATE PRICE
0.660
0.692
0.640
0.735
0.580
1.050
0.713
0.800
0.734
RATIO BETWEEN FARMGATE PRICE AND MILK COST
1.1640
1.0437
1.2851
1.0938
1.1197
1.1785
1.1193
1.1817
1.1469
If farmer's profit is taken as the excess of farmgate price
over the cost then the above table calculates the average
profit for farmers for the regions covered in the survey as
15%.

84
Comparison of Farmgate Price in Australia and China
As shown in Appendix 11, in the official foreign exchange swap
market in China at the end of 1992, the exchange rate Yuan/USD
reached 7.2962. Many economic analysts believe that the rate
of devaluation of the Chinese Yuan is 10% per annum. Using
these figures to convert the respective farmgate prices to
USD, it is possible to compare the farmgate prices both in
China and Australia. It would seem that the farmgate
manufactured milk price per litre in Australia will remain
comparatively stable, and in fact is very similar to the
Chinese farmgate price which will be slightly higher, but the
difference will be minimal as shown in Table 4-1-7.
Table 4-1-7 Farmgate Price Comparison between Australia and China 1988-1992
Source: C.N.S.B. China's Yearbooks, 1985-1990, Beijing
YEAR
1988
1989
1990
1991
1992
FARMGATE PRICES IN CHINA
(YUAN/KG)
0.7314
0.8180
0.9150
1.0234
1.1447
EXCHANGE RATE
(USD/YUAN)
3.7220
4.7220
5.2220
5.3560
5.7662
FARMGATE PRICES IN AUSTRALIA (AUD/KG)
0.1830
0.2230
0.2420
0.2140
0.2274
EXCHANGE RATE (USD/AUD)
1.1689
1.2651
1.2932
1.2900
1.4500
FARMGATE PRICE IN CHINA
(USD/KG)
0.1965
0.1732
0.1752
0.1911
0.1985
FARMGATE PRICE IN AUSTRALIA (USD/KG)
0.1566
0.1763
0.1871
0.1659
0.1568

85
Projected Milk Production
The population of dairy livestock in China is shown in Table
4-1-8.
Table 4-1-8 Cattle Distribution in China Source: China's Dairy Development Strategy Study Group
(1988) Development Strategy for China's Dairy Industry, Hubei, China
CATEGORY
Total Large Ruminants
Other Cattle
Dairy Cattle
Water Buffalo
Yak
Milk Goats
TOTAL POPULATION ('000 HEAD)
97950
58437
2222
21067
14000
3218
PRODUCTION LIVESTOCK ('000 HEAD)
30000
24793
1220
8040
4620
2252
Although the main increase in milk production will come from
specialised dairy cattle herds, the other milking animals are
likely to play an important role, particularly in limited
areas to which they are well adapted.

86
Based upon reviews which have been undertaken of the potential
for production in particular areas, a number of specialised
papers have been published such as UN's Livestock Yearbook of
China. The conclusions of these papers indicate possible
growth projections for the different species. These are
summarised in Table 4-1-9.
Table 4-1-9 Projected Numbers of Dairy Animals in China to the year 2000
Source: China's Dairy Development Strategy Study Group (1988) Development Strategy for China's Dairy Industry, Hubei, China
YEAR
1988
1989
1990
1991
1992
1993
1994
1995
1996
1997
1998
1999
2000
REGISTERED DAIRY CATTLE
('000 HEAD)
1220
1257
1295
1334
1375
1510
1658
1820
2015
2232
2471
2736
3030
ANNUAL MILK YIELD (KG)
2664
2689
2714
2739
2764
2769
2775
2780
2785
2791
2796
2802
2807
MILK BUFFALOES ('000 HEAD)
4
6
8
11
15
21
29
40
52
68
88
115
150
ANNUAL MILK YIELD (KG)
800
816
832
849
866
877
889
900
900
900
900
900
900
MILK YAKS ('000 HEAD)
2050
2070
2090
2110
2130
2153
2176
2200
2220
2239
2259
2280
2300
ANNUAL MILK YIELD (KG)
200
200
200
200
200
200
200
200
200
200
200
200
200
MILK GOATS ('000 HEAD)
2252
2288
2325
2362
2400
2465
2532
2600
2670
2742
2816
2892
2970
ANNUAL MILK YIELD (KG.)
235
239
242
246
250
254
258
262
278
294
312
330
350

87
These livestock population projections have been used to
estimate future milk production and the results are summarised
in Table 4-1-10.
Table 4-1-10 Projected Dairy Production by Different Animal Resources in China to the year 2 000
Source: China's Dairy Development Strategy Study Group (1988) Development Strategy for China's Dairy Industry, Hubei, China
YEAR
1988
1989
1990
1991
1992
1993
1994
1995
1996
1997
1998
1999
2000
REGISTERED DAIRY MILK PROO. ('000 TON)
3250.08
3379.72
3514,53
3654.72
3800.50
4180.86
4599.29
5059.60
5613.45
6227.93
6909.67
7666.04
8505.21
PERCENT OF TOTAL MILK PROD. (X)
77.52
77.80
78.06
78.31
78.53
79.55
80.50
81.39
82.00
82.56
83.06
83.50
83.88
MILK PROD. OF BUFFALOES ('000 TON)
3.20
4.54
6.45
9.15
12.99
18.25
25.63
36.00
46.89
61.08
79.56
103.64
135.00
PERCENT OF TOTAL MILK PROD. (X)
0.08
0.10
0.14
0.20
0.27
0.35
0.45
0.58
0.69
0.81
0.96
1.13
1.33
MILK PROD. OF YAK ('000 TON)
410.00
413.94
417.92
421.94
426.00
430.62
435.28
440.00
443.93
447.89
451.89
455.93
460.00
PERCENT OF TOTAL MILK PROD. (X)
9.78
9.53
9.28
9.04
8.80
8.19
7.62
7.08
6.48
5.94
5.43
4.97
4.54
MILK PROD. OF GOATS ('000 TONS)
529.22
546.09
563.50
581.46
600.00
625.93
652.98
681.20
741.28
806.67
877.82
955.24
1039.50
PERCENT OF TOTAL MILK PROD. (X)
12.62
12.57
12.52
12.46
12.40
11.91
11.43
10.96
10.83
10.69
10.55
10.40
10.25

88
In these projections, milk production will continue to be
dominated by classified dairy cows and the percentage of milk
from this source is expected to rise from 78% in 1988 to 83%
in the year 2000.
With efficient farm management, the natural increase in the
number of classified dairy cattle could be sustained at a rate
as high as 12% per annum. The national milk production targets
could therefore be reached with a lower rate of growth of the
other animals and a higher rate for the classified dairy cows.
There is, therefore, little doubt that the overall target
production levels are physically feasible.
With regard to goat milk projections, it has been assumed that
there will be a relatively low rate of growth, similar to that
achieved during the past few years. This is partially because
goat milk is currently perceived by many consumers to be of a
lower quality than cow's milk. However, in some countries,
such as the United Kingdom, a premium image for goat milk has
been successfully promoted. Another reason for the
historically low rate of increase in goat milk production has
been that in the rural areas, which contain most of the dairy
goat production, fewer official incentives have been applied
for goat milk than for cow's milk. If, as recommended in this
strategy, the same incentives are applied to all types of
dairy animals, goat milk production is likely to expand more
rapidly than assumed in the previous tables.

89
In the pastoral areas away from the towns and cities, most of
the milk is being produced by cows which are not classified as
dairy animals. The potential for expanding the milk
production in these areas e.g. Inner Mongolia is probably
substantially greater than is shown in the statistics.
As a result of a crossbreeding program in agricultural areas
and in pastoral and agricultural areas near the cities, a
significant quantity of milk is being produced from Fl and F2
crosses which are not classified as dairy animals. If this
breeding program is continued, it is likely that the quantity
of milk from this source will increase. There are no national
statistics on the total quantity of milk produced from such
animals, but in some agricultural areas the percentage of the
commercial milk from such animals could approach 25%. However,
the national figure is likely to be no higher that 10%.
The buffalo milk projections are based on a dramatic rate of
growth. This is partially because of the very small number of
buffaloes which are currently milked. The experience of one
village has shown that a local demand for buffalo milk at very
high prices can be developed. If this proves to be more than
an isolated instance, farmers would be expected to respond
very rapidly to this high profit potential.
Another reason for encouraging buffalo milk production is to
counter the sharp fall in buffalo numbers in certain areas.
The Chinese traditionally use their buffalo only as a draught
90
animal. Today they are being displaced by increasing
mechanisation (China's Dairy Development Strategy Study Group,
1988, pp. 105-109). The current plan of the Ministry of
Agriculture is for farmers to convert their female draught
animals into a dairy source. The intention is to use high milk
yield Al semen to produce a hybrid dairy animal. If this plan
is successful buffalo milk could contribute a high proportion
of total national milk production.
4.2 Products
Introduction
China is a multicultural nation and there is a wide variety of
traditions and hence traditional foods.
In the north-west and northern pastoral areas, dairy products
have always been an important part of the herdsman's diet.
In the large urban areas dairy products are now no longer
regarded as merely health foods but are becoming part of the
general diet.
However, in agricultural areas, which account for 80% of the
total population of China (S.S.B., China Statistical Yearbook,
1991); the diet remains traditional; that is to say, very
little milk is consumed and protein is sourced from meat,

91
poultry, eggs, fish and shell-fish. In these areas, formula
milk is the extent of people's knowledge of dairy products.
In the 1980s with increased income resulting from an expanding
economy, the demand for dairy products showed a marked
increase. This also occasioned a 53% annual increase in
imported dairy goods.
Since then, the original healthy concept of' dairy foods has
been developed further so that milk is now regarded as a daily
necessity.
The annual per capita consumption of liquid milk in China has
increased over the past decade (Ministry of Agriculture, Dairy
Projects Report, 1989):
1970
0.9 Kg
1978
1.0 Kg
1980
1.4 Kg
1985
2.7 Kg
1986
3.2 Kg
1987
3.5 Kg
1988
3.9 Kg
This reveals a 280% increase over the decade 1978-88. Even so,
this consumption rate is very low compared with an average per
capita dairy consumption in the other developing countries
over the same period of 36.6 Kg. and the average consumption
in the developed countries of 103 Kg. (Australia's consumption
was 101.7 Kg. in 1988)

92
Table 4-2-1 Dairy Product Consumption in China (1978-1992) Source: Statistical Yearbook of Asia and the Pacific
(1990) United Nations
YEAR
1978
1979
1980
1981
1982
1983
1984
1985
1986
1987
1988
1989
1990
1991
1992
TOTAL MILK CONSUMP. ('000 TON)
997
1190
1380
1561
2465
2588
3100
3501
4000
413T
4274
4471
4875
4914
5332
POPULATION (MILLION)
958.10
969.01
981.24
1006.91
1020.18
1029.85
1040.04
1051.27
1067.93
1079.47
1100.86
1130.00
1143.61
1156.57
1169.67
TOTAL DAIRY PRODUCT CONSUMP. (KG/CAPITA)
1.04
1.23
1.41
1.55
2.42
2.51
2.98
3.33
3.75
3.83
3.88
3.96
4.26
4.25
4.56
PER CAPITA DAIRY PRODUCT CONSUMP. INCREASE (X)
18.01
14.52
10.23
55.86
4.00
18.61
11.73
12.47
2.32
1.30
1.91
7.74
-0.33
7.29
Dairy Product Consumption by Region
In China there are three distinct geographical market
segments:
- urban,
- rural pastoral, and
- rural agricultural.
The urban segment includes 67 cities; the rural pastoral
segment includes: Xinjiang, Inner Mongolia, Qinghai and Tibet
together totalling 2 0% of the rural population; and the
remainder which comprises the rural agricultural segment
supporting 80% of the rural population.
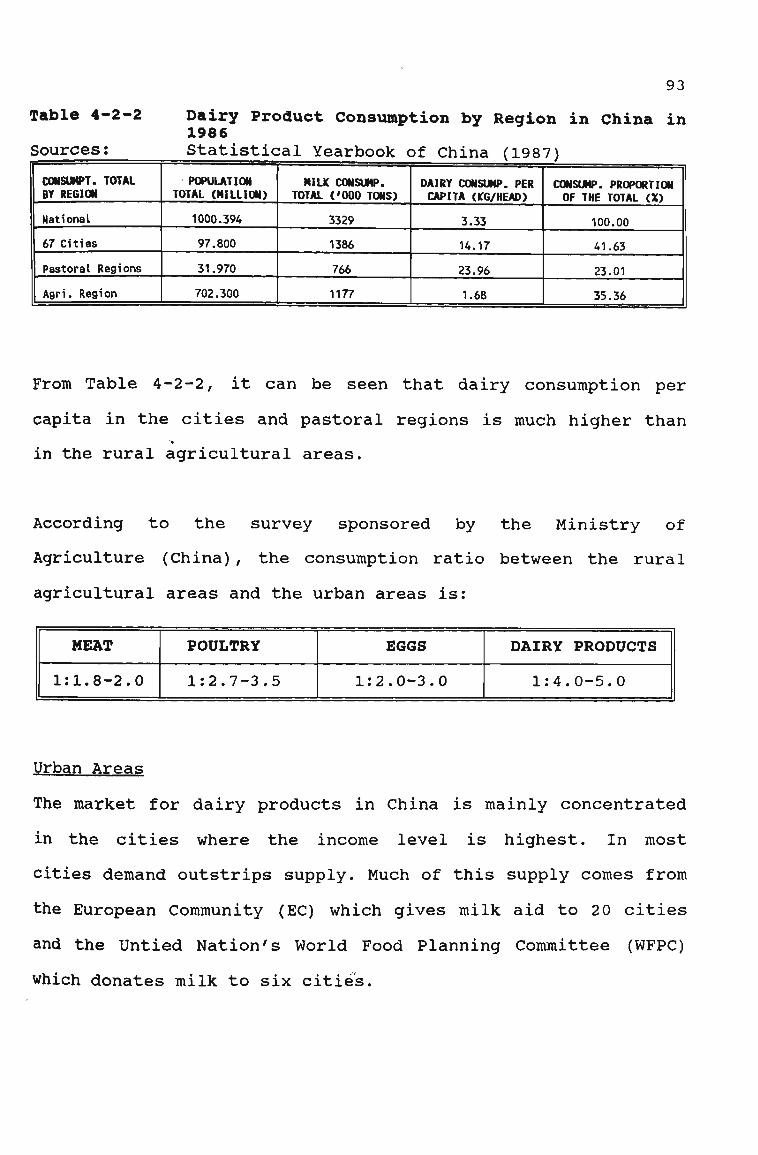
93
Table 4-2-2 Dairy Product Consumption by Region in China in 1986
Sources: Statistical Yearbook of China (1987) CONSUMPT. TOTAL BY REGION
National
67 Cities
Pastoral Regions
Agri. Region
POPULATION TOTAL (MILLION)
1000.394
97.800
31.970
702.300
MILK CONSUMP. TOTAL ('000 TONS)
3329
1386
766
1177
DAIRY CONSUMP. PER CAPITA (KG/HEAD)
3.33
14.17
23.96
1.68
CONSUMP. PROPORTION OF THE TOTAL (X)
100.00
41.63
23.01
35.36
From Table 4-2-2, it can be seen that dairy consumption per
capita in the cities and pastoral regions is much higher than
in the rural agricultural areas.
According to the survey sponsored by the Ministry of
Agriculture (China), the consumption ratio between the rural
agricultural areas and the urban areas is:
MEAT
1:1.8-2.0
POULTRY
1:2.7-3.5
EGGS
1:2.0-3.0
DAIRY PRODUCTS
1:4.0-5.0
Urban Areas
The market for dairy products in China is mainly concentrated
in the cities where the income level is highest. In most
cities demand outstrips supply. Much of this supply comes from
the European Community (EC) which gives milk aid to 20 cities
and the Untied Nation's World Food Planning Committee (WFPC)
which donates milk to six cities.

94
WFPC and EC milk recipient cities are: . Beijing . Shanghai . Tainjin . Wuhan . Nanjing . xian
A further fourteen cities receive free milk from the EC: . Guangzhou . Shenyang . Chengdu . Chongqing . Qingdao . Fuzhou . Hangzhou . Hefei . changsha . Nanchang . Dalian . Guilin . Suzhou . Wuxi
These cities represent the capital cities of most of China's thirty one provinces.
In 1986, Milk consumption was:
Beijing
31.1 Kg/head
Shanghai
22.5 Kg/head
Tianjin
15.8 Kg/head
Nanjing
11.1 Kg/head
Xian '
22.8 Kg/head
Uuhan
13.9 Kg/head I
In the cities dairy products have become regarded as daily
essential items. Of the consumption in Beijing in 1986, the
following data was recorded for different age groups:
YEARS
(%)
0-3
19%
4-18
20%
19-60
33%
>60
28%
Milk consumption in Beijing in 1985 was mainly by foreign
residents and tourists and some high ranking Chinese
intellectuals. By 1987, this situation had changed and milk
products reached a much greater range of the population:
SEGMENT
(%)
INTELLECTUALS
8%
WORKERS
14%
CARDERS
9%
STUDENTS
14%
INFANTS
31%
RETIRED PEOPLE
24% |
Concomitant with this increased consumption has been a change
in attitude in that previously some people only consumed milk
95
either when they were ill or during the winter months. In
1987, 86% of families purchased milk throughout the twelve
months of the years.
Also, in the urban areas a marked increase in variety of dairy
products has become available e.g. flavoured yoghurt and ice
creams which were unheard of previously.
Rural Pastoral Areas
This classification includes Xinjiang, Inner Mongolia,
Qinghai, Tibet and parts of Gansu, Ningxia, Heilongjiang,
Sichuan and Hebei provinces. It encompasses a total of 119
counties and a population of 10,927,000.
In these regions milk is an important traditional food. For
example, in Tibet province in 1987, milk production totalled
185,000 tons and average per capita consumption was 95 Kg. In
Qinghai province, the consumption in the same year was only 45
Kg, explained by the province's mixed population of Tibetans
and Han Chinese, in that the former are traditional milk
drinkers and the latter are not.
In Inner Mongolia average milk consumption was the highest of
all provinces at 179.41 Kg accounting for 16.7% of total
expenditure on food.
In these pastoral areas, milk is self-supplied due to the vast
distances and difficulties in transportation and

96
communication. However the people are accustomed to home-made
cheese, butter and even a milk brewed wine, in their diets.
Their supply is individually regulated by milking from their
animals only that which is required daily.
Rural Agricultural Areas
Because milk is not a traditional Han or Manchu Chinese food,
its consumption is minimal in these areas.
The farmers are not accustomed to lactose in their diet and
most prefer products derived from home-grown beans. Their
limited income has long restricted their purchasing power.
Table 4-2-3 Projected Consumption Pattern of Various Food Items in China 1986 and Projections to the year 2000
Sources: . C.N.S.B. Urban Statistics Yearbook (1987) China, and . M.O.A. "Vegetable Basket Project Report" (1988) Beijing, China
ITEM
City Province 1986 (%)
Pastoral Cities 1986 (X)
Southwest Cities 1986 (%)
Coastal Cities 1986 (%)
Quantity Nationwide 1988 (Kg/head)
Food Proportion Nationwide 1988 (%)
Estimated Quantity Nationwide 2000 (Kg/head)
Estimated Proportion of Dairy/Total Animal products Nationwide 2000 (%)
TOTAL ANIMAL FOOD
100
100
100
100
42.6
100
63
100.
DAIRY PRODUCTS
25
54
7
4
42.6
8.9
8
12.7
MEAT PRODUCTS
27
30
78
28
3.81
53.5
28
44.4
EGG PRODUCTS
25
13
9
9
22.8
15
12
27.9
AQUATIC PRODUCTS
23
3
6
59
6.4
22.5
15
23.8

97
The national figures shown in Table 4-2-3 are averages and do
not give a clear picture of the consumption in different
regions or an indication of the marked differences between
urban and rural consumption. A particular feature of milk
consumption is that, apart from the minority populations in
pastoral areas, milk only plays a significant part in the diet
of urban residents. The China National Statistics Bureau,
Urban Statistics Yearbook for 1987 shows that the per capita
availability of milk ranged from 1.7 Kg in ' the rural areas,
through 14.2 Kg in 67 large and medium sized cities to 23.3 Kg
in the pastoral areas. Since the herdsmen in the pastoral
areas represent less than 20% of the total population of those
areas, the actual consumption by the herdsmen is considerably
higher than the reported average.
In the calculation of the projected consumption patterns in
Table 4-2-3, the Ministry of Agriculture has used figures from
current plans and projections for the various livestock
products. The figures for dairy products were based on a per
capita milk production of approximately 8 Kg.
In absolute terms, over the period 1988 to the year 2000,
total per capita consumption of milk is expected to increase
by approximately 50% while that of dairy products should more
than double.
Although in absolute terms milk will remain a relatively minor
part of the diet, the relationship of milk and meat is

98
expected to improve substantially from less than 17% to more
than 29% of the total diet.
Dairy Product Proportion of Diet
The Chinese traditionally eat cereals as staple food, animal
products only representing accompaniments. Among the latter,
pork is the most commonly used followed by beef, mutton,
poultry products and aquatic products. During the last 10
years, the proportion of dairy products in the diet has been
increasing as shown in Table.
Table 4-2-4 Average Dietary Intake of various Food Items in China 1978-1988
Source: . China Statistical Yearbook (1988) and Back Issues
. M.O.A. "Vegetable Basket Project Report" (1988) Beijing, China
YEAR
1978
1978
1985
1985
1986
1986
1987
1987
1988
1988
Annual increase (%)
. 2000 (projected Kg.)
2000 (projected %)
Annual Increase (projected %)
TOTAL ANIMAL
FOOD (KG)
15.37
100.00
30.10
100.00
32.00
100.00
33.00
100.00
33.89
100
63
100
DAIRY (KG)
1.00
6.50
3.30
11.00
3.80
12.10
4.10
12.80
4
12.1
0.56
8
12.9
0.0667
MEAT (KG)
8.90
58.00
16.90
56.10
17.50
54.60
17.69
54.00
18.25
53.9
-0.41
28
,. 44.4
-0.7917
EGG (KG)
12.80
1.94
5.00
16.60
5.30
16.50
17.00
5.60
5.81
17.1
1.52
12
19
0.1583
AQUATIC (KG)
3.50
22.70
4.90
16.30
5.40
16.80
5.54
16.20
5.73
16.8
-0.59
15
23.8
0.5833
ANNUAL CEREAL (KG)
195.46
254.35
256.00
251.44
ANNUAL VEGE. OIL
(KG)
1.60
5.13
5.24
5.66

99
Dairy Consumption and Income Level
Table 4-2-5
Source:
Spent on Dairy Proportion of Annual Income Products in China 1978-1992 S.S.B., China Statistical Yearbook (1988)
YEAR
1978
1979
1980
1981
1982
1983
1984
1985
1986
1987
1988
1989
1990
1991
1992
GDP PER CAPITA (IN 1987 USD)
315.00
346.00
376.00
397.00
422.00
463.00
545.00
668.00
737.00
859.00
1066.00
1178.00
1271.00
1414.97
1575.26
FOOD GRAIN (KG)
167.30
191.00
222.30
247.30
268.80
295.70
339.50
626.00
477.30
550.20
699.50
773.00
810.00
914.48
1032.45
ADJUSTED FOOD GRAIN
(KG)
0.56
0.69
0.84
1.03
1.25
1.54
1.88
3.03
3.61
4.21
5.15
6.30
7.71
9.43
11.54
DAIRY CONSUMPTION OF AVERAGE INCOME
(X)
0.18
0.20
0.22
0.26
0.30
0.33
0.34
0.45
0.49
0.49
0.48
0.54
0.61
0.67
0.73
DAIRY CONSUMPTION OF AVERAGE TOTAL EXPENDITURE (X)
0.33
0.36
0.38
0.41
0.47
0.52
0.55
0.48
0.76
0.77
0.74
0.82
0.95
1.03
1.12
The average expenditure figure is obtained from the following
equation based on the 1988 price of milk expressed in constant
money terms: Average expenditure = (Liquid milk consumption x
Average liquid milk retail price) + (average manufactured
dairy product consumption x average price of milk powder)
As can be seen from Table 4-2-5, the expenditure on dairy
products represents an extremely small proportion of total
expenditure.

100
With the developing economy in China, the per capita income,
based on a constant 1988 US dollar rate is expected to rise to
USD 800 by the year 2000. These figures indicate a possible
fall in the percentage of expenditure on dairy products.
However, experience has shown that the 1988 price levels were
too low to sustain an expansion of the dairy industry. In
addition, the widening of the range of dairy products
available to the Chinese people is changing the pattern of
consumption towards higher value-added products such as
yoghurt. Detailed calculations on the possible market for
diversified products are unavailable but it is probable that
an 8 Kg per capita consumption will include an increase over
the 1988 figure for the percentage spent on dairy consumption.
In the calculations in Table 4-2-5, it is assumed that the
average household expenditure will continue to represent 66%
of per capita income. The official estimates (MOA) yield an
expected per capita expenditure of 1,964 Yuan in the year
2000. Thus at current real prices the average expenditure on
dairy products would represent only 0.65% of total
expenditure.
Because of this low statistical weighting in the price index
statistics, changes in milk prices would have a negligible
effect on overall price indices and the reported rate of
inflation.

101
Future trends in Dairy Consumption
In general, it is predicted that as China's economy develops
further the gap between demand and supply of dairy products
will increase.
The first priority of the dairy industry is thus to provide
sufficient liquid milk to the cities. As the supply increases
the industry needs to emphasise liquid milk's importance in
the general diet and convince the population that it is a
daily requirement. This is especially important in rural
agricultural areas because 80% of the Chinese population
resides there, and thus that is where the dairy industry's
future market lies.
In the self-supplied pastoral areas, marketing concepts can be
introduced to encourage herdsmen to process their surplus
milk. Once the dairy industry has established its market
share, it should diversify the products to meet different
demands from different groups: fruit flavoured yoghurt,
flavoured ice-creams, calcium enriched milk and Cheddar
cheese.
Once the consumer demand reaches a certain level, the dairy
industry can start to provide industrial dairy products, e.g.
for the confectionery and bakery industries. These will
eventually comprise about one third of all dairy production.

102
There is a current trend in those cities which already have a
significant per capita milk supply for a greater percentage of
incremental supplies to be used in this way.
The 1988 statistics for 20 cities showed that 17.5% of the
milk was used for milk powder production and 15% for the
production of yoghurt, condensed milk, cream, soft drinks with
milk, crystallised malted milk and cheese. The production of
yoghurt also increased rapidly and reached 407,000 tons,
accounting of 4.76% of the total milk production.
Taking account of these trends, an estimation of the likely
structure of the dairy product market in the year 2000 has
been made. It is shown in Table 4-2-6 with an indication of
the likely division of the production quantities between the
industries in the suburban, agricultural and pastoral areas.
Note that the condensed milk market is confined largely to the
southern coastal provinces where it is often used in place of
milk powder due to climatic conditions.

103
Table 4-2-6 Projected Percentage of Dairy Product Consumption in China to the Year 2000
Source: China's Dairy Development Strategy Study Group (1988) Development Strategy for China's Dairy Industry. Hubei, China
National Total
Drinking Milk
Yoghurt
Milk Powder
Condensed Milk
Ice-cream
Cheese
Soft Drinks with Milk
j Other
TOTAL VOLUME ('000 TON)
10240
4185
865
331
300
290
316
730
244
PERCENT OF
TOTAL (X)
100.00
40.87
8.45
3.23
2.93
2.83
3.09
7.13
2.38
CONSUMP. IN URBAN REGIONS ('000 TON)
3040
1885
365
304
50
70
76
260
30
PERCENT OF
TOTAL (X)
100.00
62.01
12.01
10.00
1.64
2.30
2.50
8.55
0.99
CONSUMP. IN
PASTORAL REGIONS ('000 TON)
1480
870
220
148
100
100
42
PERCENT OF
TOTAL (X)
100.00
58.78
14.86
10.00
0.00
6.76
6.76
0.00
2.84
CONSUMP. IN AGRI. REGIONS
('000 TON)
5720
1430
280
2860
250
120
140
470
17
PERCENT OF
TOTAL (X)
100.00
25.00
4.90
50.00
4.37
2.10
2.45
8.22
0.30
The major growth is expected to be in yoghurt and other
fermented products, causing the percentage of milk supply to
almost double, and in the production of soft drinks with milk.
The sales of soya milk mixed with 10% cows milk showed a
dramatic growth in Guangzhou in 1986 and Beijing launched a
new range of milk soft drinks in 1988.
Dairy Product Supply Analysis
It is a major objective of the dairy industry in China that
the production basis in and around the cities supply liquid
milk while the essential milk powder is produced mainly in the
agricultural and pastoral areas for export to other provinces,
particularly those in southern China.

104
This would represent a reinforcement of the existing pattern
whereby pasteurised milk represents a major component of the
processing works' production in the urban areas but a much
smaller component in the major milk exporting provinces such
as Heilongjiang and Inner Mongolia. The 1986 national
statistics reported that 65.1% of the total milk supply was
consumed as raw liquid milk whereas an analysis of the data
from 20 large cities in 1988 showed that 67.5% of the
production was sold as pasteurised milk.
The major differences in the per capita consumption of dairy
products by urban dwellers, the rural population and the
herdsmen in pastoral areas is based on historical differences
resulting largely from the supply limitations in the various
regions. However, even after catering for taste preference,
change tends to be a relatively slow process. Because the
availability of fresh milk has been more limited
geographically than that of most other products there may be
more significant differences between the actual consumption
pattern and the demand. It is also difficult to gain a true
picture of regional dairy product consumption because reliable
statistics are not available on the consumption of milk powder
and condensed milk, for which there is a substantial inter
regional trade.

105
Based on the difference in demand in the three area
classifications, a summary of the likely production
requirements is shown in Table 4-2-7.
Table 4-2-7 Expected Production Targets of Three different Market Segments in the year 2 000
Source: China Statistical Yearbook (1990) Beijing, China
REGION
100 Major Cities
Pastoral Regions
Agricultural Regions
POPULATION (MILLION)
152.0
42.2
1085.8
MILK PRODUCTION ('000 TON)
3040
1477
5720
MILK PRODUCTION QUANTITY PER CAPITA (KG)
20.0
35.0
5.2
POPULATION GROWTH RATE (X)
2.0
1.4
Price Considerations
All price statistics show that since 1980 the price of milk
relative to those of other livestock products, and
particularly to grain and feedstuff prices, has been
declining. For some years this effect was largely compensated
by improvements in the technical efficiency of dairy cattle
management and feeding so that it was possible for the farms
to maintain good or adequate profitability. Some of the dairy
farms have now achieved high technical standards and good
yields even by the standard of countries with highly developed
dairy industries. Especially for the farms that have already
reached a high level production, the possibilities for further
improvement and technical progress in the short term are
limited.

106
The main problem recognised by the dairy farmers is the rapid
increase in negotiated feed prices and fodder prices,
particularly those for concentrates. The figures in Table 4-2-
8 show that since 1950 grain prices have increased by a factor
of seven whereas the average milk price has increased by only
47%.
Table 4-2-8 Agricultural Product Price Indices (Yuan) 1952-1988 (1950=100)
Source: China's Statistical Yearbook (1990) Beijing, China
YEAR
1952
1978
1980
1985
1987
1988
AGRICULTURAL PRODUCTS
121.6
217.4
284.4
382.9
432.4
551.9
CEREALS
121.4
258.9
364.6
522.2
619.8
710.3
MEAT
102.7
200.2
257.5
328.1
408.1
608.5
EGGS
104.7
217.4
264.6
368.3
510.8
606.3
RAW MILK
100
79
94
106
134
147
It is estimated that to return to the pre-1987 position when
the farmers had great enthusiasm for expanding dairy
production, a price increase of 15% or more would be required.
From the analysis of some monthly accounts of a small number
of State farms in 1989, an increase of around 15-2 0% would in
fact be required to provide a reasonable return on the capital
invested. Since there are substantial differences in price
levels in different areas this is only a general indication
which should be reviewed on a case by case basis.

107
During the field research in China, discussions with consumers
and dairy corporation personnel in a number of cities indicate
that milk is regarded as a relatively cheap, healthy food and
that a retail price increase of 10-15% would have a negligible
effect on sales.
The equivalent price of milk powder is generally higher than
that of liquid milk. This encourages the demand for liquid
milk in the cities, where the higher nutritional value of
pasteurised milk is already recognised, and discourages
consumption of milk powder. For the rural people, the
relatively high prices for milk powder may reduce the demand
for dairy products. While this price relationship, continues,
urban dairy factory management will have an incentive to
maximise the production of powder at the expense of
pasteurised milk.
International Trade and Financial Assistance
Dairy Products
China has been a net importer of dairy products for several
years. Recent official trade statistics are not available but
it is estimated that between 1979 and 1986, China imported a
total of 390,000 tons of milk powder and 10,600 tons of
condensed milk. Annual figures for this period, although
incomplete, indicate that major imports started in 1982 and
have since represented up to 20% of the total national milk
supply. A significant percentage of dairy product imports have
been associated with the WFP and the EC support programs but

108
the major part has been commercial imports both for retail
sale and for manufacturing (C.D.D.S.S.G., Development Strategy
Study of China's Dairy Industry, 1988).
Despite the sharp increases in the world market prices for
dairy products and China's tighter foreign exchange policy,
substantial quantities of imported powders are still available
in the shops. Particularly in the southern coastal cities
consumers are still prepared to pay a substantial premium for
high quality imported products.
Between 1979 and 1986, 51,760 tons of fresh milk were exported
to Hong Kong and Macao from China. The volume of this trade is
tending to increase as the demand for milk in those areas
develops. As part of compensation trade arrangements China
also exported small quantities of milk powder to Romania and
Japan.
In the foreseeable future, the policy will be to maximise the
percentage of the milk which is produced within the country.
It is likely that imports of high quality products will
continue to be necessary to meet special consumer needs such
as those of the developing tourist industry. However, there
must be some controls to ensure that any future reduction in
world market prices does not lead to a flood of imports which
could damage the market for the local industry.

109
Through the year 2000, China is expected to remain a net
importer of dairy products. However, there is the possibility
of generating some foreign exchange by small export values of
high priced, traditional speciality products which include
milk in the formulation. An example is the "imperial milk
cakes" recently exported to Japan.
The policy to maximise the percentage of domestic milk
production will continue whilst China debates to what extent
to be self-sufficient in agriculture. Whilst China still
feels vulnerable to political pressure from outside the self-
sufficiency argument will apply (Tyers and Anderson, 1992, p.
294) as it has done for 50 years in the EC. Later the
opportunity cost of being able to feed a population
approaching 1.2 billion may well change this policy and
provide opportunities for Australia.
Livestock and Equipment
During the 1980s a total of 10,808 head of dairy cattle and
430 milk goats were introduced into the country. These
included both grants from overseas countries and commercial
imports. These imports played an important role in helping
develop the dairy industry through an improvement in quality
and quantity.
In the future, the import of live animals is only anticipated
in exceptional circumstances. The existing stock of dairy cows
is sufficient to support the proposed development program and

110
the main emphasis will be on selection within the herd.
Imported frozen semen, and possibly embryos, will be used to
introduce new blood lines as a relatively small supplement to
the production from the existing network of bull stations.
Although the industry has made great progress, foreign
technical assistance and equipment such as is being provided
by the EC and other donors still has a major role to play in
the expansion of the industry and the introduction of new
techniques to improve quality and technical efficiency.
4.3 Merchandising
In parallel with the marked increase in milk production,
especially through the development of collective and private
rearing of cattle, a multi-channel management of sales and
purchasing of dairy products is being developed in China.
Domestic Transactions
Organisation
The major relevant organisations involved in domestic dairy
product transactions in each city are as follows:
. Sugar & Wine Company (SWC) . Non-staple Food Company (NSF) . Animal Husbandry, Industry & Commerce Corporation (AHICC) . Agricultural, Industry & Commerce Corporation (AICC) . China Food Industry Supply and Marketing Company (CFISMC)
AHICC and AICC are owned by the Ministry of Agriculture (MOA).
They control the local dairy plants whose production is 45-50%
liquid milk and 45-50% manufactured dairy products.

Ill
These local dairy plants furnish all liquid milk on the market
and 90% of all manufactured dairy products. The MOA owns the
entire distribution network for liquid milk. The corporations
(AHICC & AICC) deal in not only local dairy products but also
the products from outside the area and sometimes deal in
imported products.
The entire production of CFISMC which is owned by the Ministry
of Light Industry, supplies 10% of manufactured dairy
products.
The SWC and NSF are owned by the Ministry of Commerce and they
own all local shops (State). They distribute 90% of all
manufactured dairy products sourced from the dairy plants via
their local shops.
V

112
Ministry of Agriculture (AHICC & AICC)
Local Dairy Plants
Manu f actu red Dairy Product84*
(45-50% Production)
Ministry of Commerce SCW & NSF
Local
Shops
Manufactured -. Dairy Products^
(90-100% of Production)
Ministry of Light Industry (CFISMC)
Dairy
Plants
Small Milk Outlets
Liquid Milk 45-50% of^ Production
Consumers
Figure 4-3-1 Administrative Control of Dairy Factories in China 1992
Figure 4-3-1 shows the inter-relationship of the organisations
concerned with dairy product transactions.
Distribution Network for Liquid Milk
Fresh milk is delivered to dairy plants where it is
pasteurised, blended with no more than 50% of re-combined milk
and packaged in bottles or plastic sachets. The milk is then
delivered to milk delivery centres.
Milk distribution centres act as wholesalers. They distribute
liquid milk to retail shops, selling stalls and milk delivery
outlets. As seen in Figure 4-3-2, milk delivery outlets serve

113
the consumers who have standing voucher orders for pasteurised
milk, while retail shops and selling stalls sell certain
amounts of pasteurised milk and yoghurt to the consumers who
have no standing voucher orders.
Note: Standing voucher orders are purchased by individual
citizens. Such voucher guarantees at least one month's liquid
milk supply in advance.
"1
Dairy Farms
> ,
Dairy Plants
/fs
EC Re-combined Milk
t / •
«i
\
-- • ••/
-
7
Retail Shops Selling Stalls
Milk Distribution Centres
Milk Delivery Spots
Figure 4-3-2 Liquid Milk Distribution System in China 1992
114
International Transactions
Currently, China is an importer of dairy products and the
volume imported is likely to increase in the future.
Organisation
Major Importers of Dairy Products
. China Oil Foodstuff Import & Export Corporation (COFCO)
is an important importer of dairy products. Their
division, China Foodstuff and Beverage Import & Export
Company, specialises in dairy product trading, especially
in whey powder. Most of the time, COFCO has adequate
foreign currency and good commercial skills.
. Provincial Foodstuff Import & Export Companies are the
major local importers of dairy products. They formerly
belonged to COFCO, but are now completely independent in
international transactions of dairy products.
. The Ministry of Light Industry owns 10% of advanced dairy
factories nation-wide and takes most of the
responsibilities for dairy equipment, manufacturing and
dairy product quality control. In order to maintain and
develop baby foods, such as infant formula milk powder,
the central government allocates a certain amount of
foreign exchange quota to the Ministry of Light Industry.
. The Ministry of Commerce controls most of the retailing
and wholesale organisations for manufactured dairy
products. They are also involved in importing
manufactured dairy products.

115
. The Ministry of Agriculture has some companies which can
make deals on the import and export of foreign dairy
products.
. Most joint venture enterprises also have their own import
and export rights on the relevant products they are
producing. Joint-venture enterprises also enjoy some
favourable tariff reductions.
. Some additional import & export companies have been
organised by each city or region. These companies can
also import and export dairy products but they are not
very skilful at this.
. Trading companies in special economic zones (SEZs) such
as Guangzhou, Shenzhen, Xiamen make full use of
favourable government economic policies and usually pay
lower customs duty and taxes and sell the imported dairy
products nationally. They usually make little profit in
this business transaction.

116
Import Application Procedure
Import application procedure as exemplified by a Shanghai
dairy processing plant is shown in Figure 4-3-3.
Shanghai Light Industry Bureau
4-Consent
Shanghai Municipal Economic & Planning Commission
^Consent
Shanghai Second Commerce Bureau
Request «
Consent >
Local Dairy Factory (Purchase Section)
Request ^and later Payment
Shanghai Food Import & Export Company
4/Order
Foreign Producers
Figure 4-3-3 Dairy Product Import Procedure in Shanghai 1992
At the preliminary stage, the purchasing section of a local
dairy factory, e.g. of the Sugar & Dairy Products of Shanghai
SWC Corp., drafts a report to apply for importing a milk
product usually in powder form. The report has to be approved
by each level of the administrative hierarchy and finally by
the Municipal Economic & Planning Commission. They then give
consent to the Commerce Bureau. Meanwhile the Local Dairy has
requested an Import/Export Company to import a product for
them. The Second Commerce Bureau gives consent to the
Import/Export Company and the Local Dairy pays the
Import/Export Company.

117
Customs Duty on Dairy Products
Table 4-3-1 Customs Duties on Dairy Products in China in 1992
Source: The Import Duty Handbook of People's Republic of China, 1989, Beijing, pp. 35-78.
ITEMS
Lowest Tariff
Common Tariff
Tax of Industry, Commerce & | Administration
MILK POWDER (%)
30
40
10
BUTTER (%)
70
90
5
WHEY POWDER (%)
20
30
5
Note:
. Some taxes may be deducted for special industries, such
as the baby food industry.
. China is applying to join GATT and it is possible that
most tariffs will be discontinued in 1993.
Industrial Dairy Products
Milk Powder
Large industrial users have direct access to the supply of
industrial raw materials. However, they have to obtain their
sugar supply from the Industrial Raw Material Section of the
national SWC Corp. Some large users have no storage facilities
for keeping the milk powder fresh, therefore, they have to
leave a part of their order at SWC's warehouse even though
the price is little bit higher.
Small and medium industrial users usually have direct business
connections with local dairy factories. When there is a
shortage in production of local milk powder, the users

118
increase their orders of milk powder from SWC Corp. and the
local Foodstuffs Industry Corp.
Whey powder
At present, the only users of whey powder are the dairy
factories. Either the dairy factories which produce infant
formula milk powder, or local dairy corporations have direct
business connections with the importers. Until now, all whey
powder consumed in China was imported. Apart from central
government imports, local foreign import and export companies
also trade in whey powder such as Jilin Import & Export
Company.
Butter
Large users can buy directly from suppliers, or from the SWC
Corp. Small and medium sized factories buy from local
manufactures or from distributors such as SWC Corp. and other
trading companies. A relatively small quantity of butter both
foreign aided and imported is shipped to China annually. Note
that there is no foreign made margarine on the Chinese Market.
Skim milk powder (SMP) is imported by central government dairy
factories and both local and foreign trading companies.
Retail Dairy Products
The sale of imported dairy products in China requires a
persistent marketing program. Most of this activity is
concentrated in southern China where the economy is very

119
volatile. The importers have to lobby the department stores
and big hotels to persuade their customers to buy. At the
moment, there are a lot of imported dairy products on the
shelves especially in southern China.
Future Trends
Skimmed milk powder (SMP) would have a huge potential market
in China if the EC milk aid program was terminated. The
present trend of exporting bakery and confectionary products
will cause an increasing demand for industrial dairy
products.
Imported retail dairy goods are still beyond the reach of
ordinary Chinese because of their high price. This situation
will remain for a long time or until the income level of the
Chinese reaches a threshold level (e.g. USD 1,000 per capita
per annum) or import duties are decreased which seems unlikely
in the foreseeable future.
There are relatively large quantities of infant formula milk
powder and cheese imported. This situation will persist for
several years and then it is probable that most of these
products will be replaced by joint-venture production or local
production in northern China.

120
Distribution System for Imported Dairy Products
At the moment, China allows a whole range of dairy products to
be imported including UHT milk. The import channels are as
shown in Figure 4-3-4.
• *
Foreign Suppliers 7—
COFCO
Provincial Foodstuff I/E Co.
Local Import & Export Companies
Ministry of Agriculture
Ministry of Commerce
Ministry of Light Industry
Joint Venture Enterprises
Trading Companies in SEZs
•
Wholesalers
l
.
s
. I
Retailers
/
s ^
/
1
1 Dairy • Factories
Figure 4-3-4 Organisations involved in dairy imports to China 1992
121
Throughout China's history communications have been a great
problem. Today, with China's rapidly expanding economy
enormous strains have been placed on its transport
infrastructure. This strain is evident in port congestion,
inadequacies in the rail and road systems, constraints on the
movement of coal, and logistical problems in moving and
expanding agricultural production to markets. In 1987 it was
estimated that China's transport system will have to carry 45%
more freight by 1990 and so the development of transport
capacity was^ a key priority of China's Five-Year Plan for the
period 1986-90. (Tyrchniewicz et al. 1987, p.264)
The current transport situation in China not only affects the
development of China's agricultural sector but also affects
the distribution of imported agricultural commodities.
Figures based on government agencies' grain transports in
China showed that 85% of transport was intraprovincial and 15%
interprovincial (Tyrchniewicz et al. 1987 p. .266). Road
accounted for 62% of long distance movements and virtually all
of it was intraprovincial. Rail accounted for 25% and inland
waterways in South China for 13%. Congestion on the north-
south railway lines indicated that greater use should be made
of coastal shipping.
A further major constraint is the availability of transfer and
storage facilities. Increasing imports of grain into China
place an even greater strain on port storage facilities;

122
demurrage charges for foodstuffs were estimated at almost USD
200 million in 1982. (Tyrchniewicz et al. 1987 p.267).
Infrastructure requirements are two-fold: improvements and
strengthening of major intercity highways and bridges, and the
development and expansion of rural road networks. In 1987 the
pace of new road construction declined with cost being the
main reason. The World Bank has estimated that the cost of
upgrading existing infrastructure in China (apart from the
construction of new roads) would be approximately USD 10-15
billion (Tyrchniewicz et al. 1987, p. 267). These figures
give an indication of the size of the infrastructure problem
facing China which exporters also face in trading with China.

5
THE AUSTRALIAN DAIRY INDUSTRY IN THE INTERNATIONAL ARENA
"What would this island be without foreign trade, but a place of confinement to the inhabitants, who (without it) could be but a kind of hermites, as being separated from the rest of the world; it is foreign trade that renders us rich, honourable and great, that gives us a name and esteem in the world."
Charles Molloy D e Jure Maritimo et Navale, 1676

124
It is important to review the Australian dairy industry and
its role in the international market in order to elucidate any
similarities and differences in the dairy industries of the
two nations under consideration.
5.1 International Dairy Trade
According to the various issues of the World Trade Statistical
Yearbook published by the United Nations, only a small
proportion of world milk production is traded in international
markets each year. The major dairy trade items are bulk
butter, cheese, milk powder and condensed milk. Annual trade
in these products (excluding intra-EC trade) is approximately
25-30 million tonnes on a milk equivalent basis, or about 6%
of total world milk output.
This trade scene reflects the fact that in most countries
dairy production is geared to the promotion of domestic self-
sufficiency and this has supported artificially high domestic
prices paid to farmers. This has lead over the past 20 years
to increasing restrictions on access to international markets.
A significant proportion of current trade is transacted under
direct bilateral quota arrangements or other quantitative
import controls. Much of the trade in cheese is subject to
such agreements. Currently Australia has bilateral quota
access to the EC for 3,000 tonnes of Cheddar cheese and to the

125
USA for 4,000 tonnes of cheese, 600 tonnes of SMP and small
volumes of other minor dairy products. These arrangements
cover around 10% of Australian traditional export volumes of
cheese but less than 1% of exports of the other products
mentioned (ADC, Dairy Compendium, 1991, p. 53).
In addition, although many countries operate under protective
arrangements which boost domestic supply, only a few are
significant exporters.
The EC is the major exporter of dairy products accounting for
slightly over half of all export sales. The world's largest
producer, the Commonwealth Independent States (CIS), has
remained a net importer of dairy products to date. Its import
purchases have helped balance world supply and demand in
recent years, particularly in the case of butter. The other
major producer, the USA, has been more concerned to restrict
import access to its domestic market. However, the USA has
regularly disposed of its government stocks of skim milk
powder (SMP) and butter in international dairy markets through
subsidised sales and food aid programs (ADC, Dairy Compendium,
1991, p. 54).

126
CENTRAL 1%
SOUTH EAST 8%
NORTHERN 6%
SOUTHERN
GIPPSLAND
V I C ( 6 1 % ) 19%
£? T A S ( 6 % )
Figure 5-1-1
Source:
Australian Dairy- Areas showing Percentages of National Production, 6,401 million litres in 1990-91. Australian Dairy Corporation (1991) "Dairy Compendium", p.6.

127
5.2 Australia's Dairy Industry in the World Context
As mentioned, the EC countries supply over 50% of dairy
products on the international market. Although it accounts
for only 2% of world milk output, New Zealand is the second
largest supplier of manufactured products to the world market.
It accounts for about 20% of total sales on a milk equivalent
basis. The large majority (over 80%) of New Zealand production
is dedicated to export sales. Australia, which accounts for
just over 1% of world milk output, accounts for between 6% and
7% of export sales (ADC, Dairy Compendium, 1991, p. 54).
The remainder of the international market has traditionally
been supplied by subsidised exports from developed economies
such as Canada and the non-EC countries of Western Europe with
some milk powders supplied by Eastern European countries such
as Poland and Czechoslovakia. In 1989 and 1990, export
surpluses from Eastern Europe rose sharply after they removed
long-standing consumer subsidies on dairy products. This
greatly disrupted traditional trade flows. Cuts in domestic
production, particularly in Poland, in the past year have
reduced the size of these surpluses. However, both Poland and
Czechoslovakia should remain active in world markets.
Australia currently exports around 30% of its annual milk
production (over 40% of its output of manufactured products).
Its principal export products in both value and volume are SMP
and cheese, with butter and wholemilk powder also being major
contributors to export sales. Over the past three years SMP

128
has increased significantly in exported volume. In recent
years long-life milk has also been exported in increasing
volumes to the growing retail markets of Asia (ADC, Dairy
Compendium, 1991, p. 53). The value of Australian dairy
exports in 1989-90 was approximately AUD 700 million, an
increase of 8% on the previous year (Office of Trade and
Investment, Victorian State Government, Milk Production -
Australian Context, 1992, p.255).
The direction of Australian export sales differs from the
general pattern of international trade flows. Australian
exports are concentrated in South-East Asia, Japan, Taiwan and
the Middle East with only limited industry involvement in the
North African and American markets. It is also influenced by
the extent to which Australia is excluded from other major
markets by direct restrictions (as in the case of the EC and
the USA) or by the impacts of the export subsidy programs of
major competitors (Australian Dairy Corporation, 1991, p. 56).
Japan remains the largest single market for exports followed
by ASEAN nations such as the Philippines, Singapore, Thailand
and Malaysia. Saudi Arabia remains the largest single market
in the Middle East. Taiwan and North Asia remain the principal
destinations for export sales of wholemilk powder.
The pattern of product sales also varies between regions.
Japan remains the major market for Australian cheese.
Traditionally this trade was dominated by sales of Cheddar for
processing but in recent years there has been strong growth in
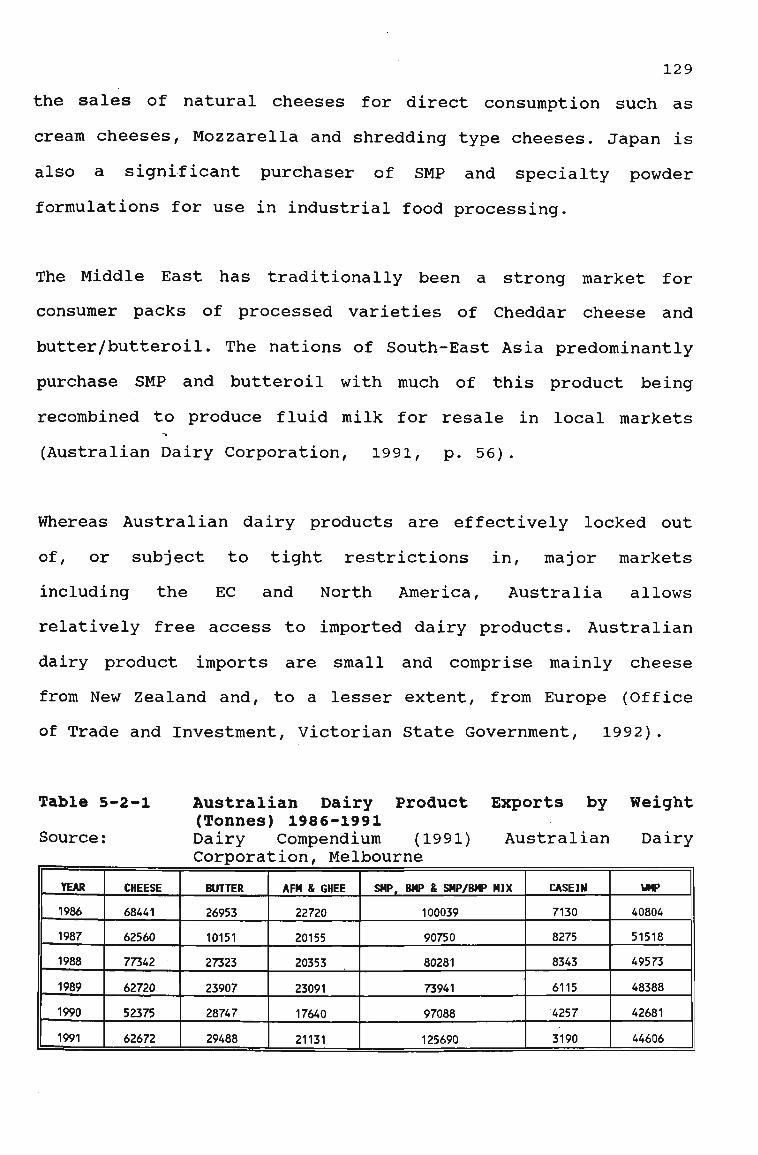
129
the sales of natural cheeses for direct consumption such as
cream cheeses, Mozzarella and shredding type cheeses. Japan is
also a significant purchaser of SMP and specialty powder
formulations for use in industrial food processing.
The Middle East has traditionally been a strong market for
consumer packs of processed varieties of Cheddar cheese and
butter/butteroil. The nations of South-East Asia predominantly
purchase SMP and butteroil with much of this product being
recombined to produce fluid milk for resale in local markets
(Australian Dairy Corporation, 1991, p. 56).
Whereas Australian dairy products are effectively locked out
of, or subject to tight restrictions in, major markets
including the EC and North America, Australia allows
relatively free access to imported dairy products. Australian
dairy product imports are small and comprise mainly cheese
from New Zealand and, to a lesser extent, from Europe (Office
of Trade and Investment, Victorian State Government, 1992).
Table 5-2-1
Source:
Australian Dairy Product Exports by Weight (Tonnes) 1986-1991 Dairy Compendium (1991) Australian Dairy Corporation, Melbourne
YEAR
1986
1987
1988
1989
1990
1991
CHEESE
68441
62560
77342
62720
52375
62672
BUTTER
26953
10151
27323
23907
28747
29488
AFM & GHEE
22720
20155
20353
23091
17640
21131
SMP, BMP & SHP/BMP NIX
100039
90750
80281
73941
97088
125690
CASEIN
7130
8275
8343
6115
4257
3190
UMP
40804
51518
49573
48388
42681
44606

130
cn
a cn
d) -cn co
0 -CO CO
cn
l
-J CO
/ / /
' CD £ I-J
/ * 2-<
_
a u
co cn
4 -co CO 01 - •
o in c
D a m
^BUUO-;) spuesnom
9\ o\ H 1 VO CO -1
H
01 •P
K O o. X H
H 0> cn H
e s •H
>i~: M •H nJ Q
a id •H r-l id M •P
ca
. ft g 0 u >1
u •H
(0 Q
CJ 3 Q d <
CM 1 H 1 in
a) u 3
Q) 0 M
0> 3 •H 0 PM W

131
There are significant differences in average milk yields and
production costs between countries. Efficient producers such
as New Zealand, Australia and Argentina largely rely on low
cost, seasonally-based pasture feeding techniques (ADC, Dairy
Compendium, 1991, p. 31).
As an efficient producer of dairy products the Australian
industry stands to gain significantly from any initiative
towards competitive disciplines and a successful conclusion to
the Uruguay round of GATT talks. Although a medium-sized dairy
produce trader, Australia is a price-taker on world markets.
5.3 Trade Flows of Major Products
Outside bilateral trade arrangements between Western
economies, the major end user markets for diary products are
the Middle East, Central and South America, North Africa and
South-East Asia (ADC, Dairy Compendium, 1991, p. 55).
The major exporters of butter are the EC and New Zealand. The
EC is itself a major destination for New Zealand exports under
a bilateral quota arrangement between New Zealand and the UK.
In recent years the CIS has been the major purchaser of
butter, accounting for around 35% to 45% of traded volumes.
North African countries such as Algeria and Morocco, and the
Gulf states of the Middle East, are more traditional end users
of butter/butteroil.

132
The EC, New Zealand and Australia are major exporters of
cheese. The USA is a major market taking up to 111,000 tonnes
annually under bilateral quota arrangements. A significant
proportion of this access is restricted to subsidised exports
from the EC (48,000 tonnes) and other Western European
countries (25,000 tonnes). Other key export markets included
Japan, the Middle East and North Africa.
The EC is a major supplier of SMP to world markets followed by
New Zealand and Australia. Recently, Eastern European
suppliers have also traded significant volumes. The USA
traditionally supplies significant quantities of SMP to
Central and South America under food aid programs. A
considerable proportion of internationally traded SMP is sold
as stock feed to countries such as Japan. The EC and Eastern
Europe are major suppliers to this market segment. The
traditionally important end user markets of SMP for human
consumption are in Central and South America and North Africa.
Wholemilk powder is used in a wide variety of end user markets
but is often sold in instantised forms in consumer packs for
retail sale in countries which lack widespread refrigeration.
The Middle East, Africa, Central and South America are the
major markets for this product in world terms while the EC and
New Zealand are the major suppliers.
Casein exports are dominated by New Zealand and the EC, with
Ireland being the major supplier within the EC. Japan and the

133
United States remain key end user markets for this product.
5.4 International Prices for Dairy Products
Domestic prices for milk and dairy products vary markedly
between countries in line with differences in the costs
associated with production and domestic price support
arrangements (ADC, Dairy Compendium, 1991, pp. 71-72).
In the same way, returns from export sales can vary
considerably between markets, depending upon whether market
access is arranged through bilateral quotas or is subject to
global competition. Returns from sales to quota markets are
generally influenced by the domestic price structure in the
importing country and tend to be well above the prevailing
international price.
International prices in non-quota markets are more uniform and
are largely determined by the policy initiatives of major
Western producers. Owing to its dominant position in terms of
supply volumes for most major products, the EC tends to set
traded prices in those international markets which are not
subject to quota restrictions. Typically, export prices in
non-quota markets tend to equate to the internal supported
price for products in the EC less the available EC export
refund.

134
Other factors which can influence international market price
movements include:
. the level of government held stockpiles of surplus
product in the USA and EC;
. changes in regulations relating to internal disposals of
surplus product in these countries; and
. the seasonality of product availability from Southern
Hemisphere producers.
The periodic disposal of US product surpluses in world markets
(either as food aid or through subsidised commercial sales)
also has a destabilising influence on trade and prices. To a
large extent, however, US support arrangements have acted more
to limit the extent of increases in international prices for
products such as SMP than affect day to day market pricing.
While New Zealand supplies a significant share of world
exports, it is dependent on export markets for a large
proportion of its sales because of the absence of a
significant domestic market. Consequently, it tends to be a
price-taker in world markets for dairy products.
International budgetary pressures within the EC led to a
reduction in export subsidies in 1988 and 1989. These cuts, in
conjunction with the decline in international stocks of butter
and SMP during these years, allowed world dairy prices to rise
substantially. However, this trend was reversed in 1990, when
a combination of increased production and static consumption
in the EC gave rise to a renewed emphasis on export sales.

135
EC export refunds for all major products other than cheese
were increased by around USD 300 per tonne in 1990 and
international prices fell accordingly. Exchange rate movements
in early 1991 forced the EC to cut refund rates for butter,
butteroil and wholemilk powder to ensure that its export offer
prices did not fall below the minimum export price established
under the GATT International Dairy Arrangement. However,
refunds for butter and butteroil were increased in September
1991 following a realignment in exchange .rates. EC export
refunds in September 1991 were equal to 70% of the
international* traded price for SMP and 170% of the traded
price for butter.
The US also expanded the range of dairy products able to be
exported at subsidised prices under its Dairy Export Incentive
Program in 1991 to include Cheddar cheese. Previously, this
scheme had covered the subsidised sales of butter, butteroil
and SMP.
Despite the higher export subsidises, international prices for
most major dairy products, and particularly milk powders,
increased in the second half of 1991. This mainly reflects a
short-term improvement in the supply and demand balance for
these products in countries such as the EC and Japan, which
has pushed up internal wholesale prices. However, producer
returns for exports remain below those prevailing in the early
1980s in both nominal and real terms (see Appendix 12).
It is of interest to compare farmgate milk prices both within

136
Australia and internationally. in Australia in 1991,
Queensland farmers received the highest price for market milk
at 47.4 cents per litre with prices decreasing to 38.4
cents/litre in Victoria, the lowest.
For manufacturing milk, Queensland received the second lowest
price at 20.9 cents/litre only 0.5 cents up on the Tasmanian
price. In NSW, farmers received 24.3 cents/litre and Victorian
farmers, 21.1 cents/litre.
In 1990, Switzerland's farmers received the highest price of
all for milk at AUD 92.45 per kilogram, thereafter followed
Finland with AUD 82.70, Japan with AUD 73.32 and Sweden with
AUD 61.58. Danish farmers were paid AUD 53.38, Canadian AUD
51.49, French AUD 40.24; the USA price was AUD 38.36 and in
the UK AUD 37.92. Australia's average price was AUD 26.20 per
kg. twice that paid in New Zealand at AUD 13.90 (ADC, Dairy
Compendium, 1991, pp. 17 and 42) (see also Appendix 13 and
Appendix 14) .
5.5 Trends in the Dairy Industry
There has been a shift away from wholemilk toward low fat milk
which, with the introduction of ultra-filtration, has greatly
improved in taste in most of the Western nations.
To the health conscious consumers of today, the ideal food has
little or no fat or salt and is high in fibre. Milk contains

137
up to 4% saturated animal fat and cholesterol which has been
one of the dairy industry's greatest problems.
There are three kinds of fat:
saturated as in animal fat and chocolate; . polyunsaturated as in vegetable oils; and
mono-unsaturated as in olives, almonds, macadamia nuts, rape-seed oil.
Australian Co-operative Foods (ACF) is a NSW company which
supplies 60% of the requirements (fresh milk) of the city of
Sydney. Previously they had produced four kinds of milk in
response to the rising demand for a low fat product. They
contained 3.8%, 1.4%, 0.15% and 0.01% fat, the last being skim
milk. The problem with skim milk is that it has practically no
taste.
Recently, ACF has made a breakthrough with its new product
"Farmer's Best" which contains 1.35% mono-unsaturated fat and
only 0.1% saturated fat. The process, which has been patented,
involves the removal of the natural fat from milk and its
replacement by 1.35% fat obtained from rape-seed (canola)
which is said to have a beneficial effect on the body (ABC
Television, "Landline" 12.00am, 27th Sept. 1992).
ACF sees a bright future both on the domestic front where
consumers are quite willing to pay an increased price for this
ideal product, no fat but taste, and on the foreign market
where it intends to license the technology. They intend to
target the markets in Asia, North America and Europe and

138
estimate returns of the order of AUD 80 million.
Demand has also increased for fat protein-modified yoghurt in
Australia (Office of Trade and Investment, Victorian State
Government, 1992). Total yoghurt sales are around 60,000
tonnes per annum with low fat products representing 46% of
sales.
Australian butter consumption has declined steadily over the
years. Total domestic consumption has not kept pace with
population growth reflecting not only health concerns but also
the relatively high price of butter compared with its main
substitute, margarine.
Butter is a key ingredient in ice-creams, confectionery and
bakery lines, and significant growth in sales of there items
has occurred in the non-retail sector.
Australian per capita consumption of ice-cream and frozen
confections grew strongly during the 1960s and early 1970s but
declined during the 1980s. In volume terms, 1988-89 ice-cream
and frozen confection production was estimated at over 270
million litres and per capita ice-cream consumption
approximately 18 litres. This is the third highest in the
world, exceeded only by the USA (22.5 litres) and New Zealand
(19 litres) (ADC, Ice-cream Leaflet, 1989).

139
The Australian ice-cream and frozen confection industry
produces principally for the local market with only a very
small amount of ice-cream mix being exported. Imports are
similarly small. However, the Japanese ice-cream market, which
is no longer restricted by import quotas should offer
Australian producers new opportunities.
Apart from fresh milk, cheese is the major dairy product sold
in Australia. Growth in speciality and low/reduced fat cheese
sales has been dramatic. The proportion of milk production
used to produce cheese has increased from approximately 14% in
the early 1970s to over 30% by 1988-89.
In 1989-90, the total domestic cheese market was 151,747
tonnes. Cheddar type cheese now represents 58% of total sales,
down from 72% in 1980. Australian cheese has approximately 86%
of the domestic market, with other main suppliers being New
Zealand and the EC.
The retail sector accounts for around 92,000 tonnes, with the
balance of cheese being used in food service and food
ingredient applications. Increasingly popular fast food
outlets represent an important market.
Milk is being incorporated into more and more food products.
Already these include: milk based baby foods, canned cream,
milk-based health, infants and invalids beverages, liquid or
dried ice-cream mix, lactose, malted milk powder, milk and

140
coffee mixtures, thick shake milk-based mixes, canned liquid
milk, condensed or concentrated milk, evaporated milk, canned
liquid milk and cream, full cream milk powder, and sugar of
milk.
There is, in fact, a secular decline in the real price of food
which reveals ever-rising farm productivity due to better
machinery, management, fertilisers and crops.
For example three decades ago in the US, 20 million cows
produced 125 billion pounds (57 million tonnes) of milk a
year; today 10 million cows produce 150 billion pounds. Milk
yields are climbing by 2.5% a year (America's Farm Subsidies.
The trough., The Economist, June 27, 1992, p. 21).
The market in food is dynamic constantly reflecting new
trends, fashions and propaganda. Today consumers demand fresh
nourishing convenient foods.
A new category of health oriented products termed "functional
foods" (Shoebridge, BRW, Aug. 7, 1992, p.85) is currently in
vogue. These foods perform a specific health function and act
in some way to promote health. They are different from food
ingredients that have therapeutic applications such as
vitamins, minerals and anti-oxidants. They are big news in
Japan where the category has grown from zero in 1987 to
projected sales of AUD 3 billion in 1992 and are tipped soon
to account for 5% of the total Japanese food market.

141
Examples of functional foods include those that enhance the
body's immune system, prevent or control disease, aid recovery
from disease, regulate body rhythms and suppress ageing, e.g.
. oat-bran which has cholesterol-lowering benefits;
. baked beans and wheat-bran which reduce the risk of bowel
cancer; and
. EAC Plumrose's Yoplus yoghurt which contains acidophilus
and bifidus, two live bacterial cultures that aid
digestion.
A new set of rules is being devised for functional and medical
foods which will dramatically change the food marketing
industry.
Supercritical extraction, a process which is able to remove
cholesterol from milk fat, offers the possibility of improving
butter's competitive position relative to margarine (Office of
Trade and Investment, Victorian State Government, 1992).
Consumers, also, have been responsive to marketing focusing on
milk and milk products as a way of overcoming calcium
deficiency and osteoporosis.
Finally, we are entering an era of genetically engineered
foods, dubbed "Franked foods" by some scientists such a
Professor Rong Yi, which doubtless will provide adventurous
products appropriate to the 21st century (Guilliatt, BRW,
1992, p. 60).
AN ANALYSIS OF CHINA'S DAIRY CONSUMPTION AND AUSTRALIA'S EXPORT POTENTIAL
Trace Science then, with Modesty thy guide-First strip off all her equipage of Pride, Deduct what is but Vanity, or Dress, Or Learning's Luxury, or Idleness; Or tricks to shew the stretch of human brain. Mere curious pleasure, or ingenious pain: aExpunge the whole, or lop th 'excrescent parts, Of all, our Vices have created Arts: Then see how little the remaining sum, Which serv'd the past, and must the times to cornel
Alexander Pope 1733

6.1 Liquid Milk
143
Milk provides a wide variety of nutrients essential to the
human diet. It is outstanding for its supply of protein,
calcium, vitamin A, riboflavin, thiamine and niacin.
For preservation, milk is usually heat treated. This may be
done in two ways:
. Pasteurisation - All milk sold in Australia is
pasteurised which prevents the growth of bacteria and
ensures its safety for human consumption. It is heated
rapidly to 72°C (162°F) for at least 15 seconds and then
cooled rapidly; flavour and food value are unaffected.
. UHT (Ultra Heat Treatment) - Sometimes called "long-life"
milk, UHT milk has been sterilised by heat. It is packed
under sterile conditions, usually in laminated cardboard
cartons, and may be stored without refrigeration for 2 to
3 months, or longer. (Under extreme heat, refrigeration
will extend its life.) (ADC, Dairy Compendium, 1989)
In fact, the demand for milk shows great elasticity,
especially in the cities. If average income increases, as it
has recently, most people will want to consume milk.
In 1987, the Ministry of Agriculture (MOA) calculated the
income elasticity of food in China in major cities. They found

144
that income level had a direct effect on dairy product demand
as follows:
Food
0.69
Milk
1.62
Cereal
-0.005
Pork
0.9
Beef & Mutton
0.47
Poultry
1.63
Eggs
1.14
Aquatic Products
..... ._ .._ . 1.32
Soya bean milk has been used by many people in China for many
years instead of dairy milk. It has a particular odour which
many people dislike and also provides different nutritional
elements, e.g. it contains less calcium.
Products on the Chinese Market
Local
Products and retail prices in 1992 were:
. pasteurised milk in glass bottles:
. pasteurised milk in sachets:
. pasteurised milk in cartons:
Yuan 1.56/Kg
Yuan 1.68/Kg
Yuan 1.58/Kg
Imported
Products and retail price in 1992 were:
. UHT (Australia) in Tetrapak cartons
. UHT (Holland) in Tetrapak cartons
. UHT (Singapore) In Tetrapak cartons
Yuan 8.50/Kg
Yuan 8.30/Kg
Yuan 8.80/Kg
Industrial
These products are sold wholesale:
If there is a surplus in the local liquid milk supply it
is directly delivered to the ice-cream and yoghurt
factories for further processing at the same farmgate
price as paid for pasteurised milk.

145
Product Quality
Most of the dairy farms and dairy factories in China are not
as clean as those in Western countries. There are two main
reasons for this. First, the dairy industry is not a
traditional industry in China and has been ignored for a long
time. Secondly, the Chinese always boil milk prior to
drinking. It is almost impossible to find a Chinese who drinks
"fresh" milk.
The quality of milk in China is not standardised because most
dairy factories lack testing facilities. In addition,
sometimes the fresh milk is diluted with water by the dairy
farmers to increase their production volume. Some retail
liquid milk contains less than 1% fat.
As mentioned previously, the demand for milk is much higher
than supply so there is no need for the dairy factories to
promote any brand name or image. Furthermore, limited
transportation facilities restrict any long distance fresh
milk delivery with the cheapest package protection and, in any
case, packaging and packing are minimal.
Consumer Profile
Introduction
Under the regulations of some cities, only children under a
certain age and old people above a certain age qualify to
obtain milk quota which is subsidised by the government.
Everyone else, who wants to drink milk has to either buy at

146
high prices or use milk powder which is not subsidised as
highly as fresh milk.
Method of Use
The Chinese believe that all milk should be boiled before it
is consumed so very few people drink raw milk.
Consumer Knowledge of Product
The Chinese desire to drink milk is related mostly to its
reputation as a food of high nutritional value.
Product Preference
The Chinese think the milk is good if a thin layer of fat
forms on the top when it is boiled. This means that there is a
high milk fat content and the nutritional value is high. If
this is not the case they complain about the quality of the
product.
Under Chinese dairy quality regulations, buyers can demand a
replacement of equal volume, free of charge if they find any
residues in the milk or if it is contaminated.
Seasonality and Climate
Since there is a high percentage of recombined milk in the
liquid milk market under normal circumstances, when the fresh
milk supply drops seasonally, the amount of milk powder used
in recombination is increased.

147
China is a very large country and has many different climates.
However, the peak milk periods differ between the north and
the south thus reducing the effects of seasonality.
In fact, consumers actually prefer to buy milk powder, which
they regard clean and easy to transport, and recombine it at
home. However, this is a more costly method than purchasing
liquid milk.
In hot weather, the Chinese drink less milk than in cold
weather, because of their custom of boiling. In addition it is
thought that milk increases body heat so it is avoided in the
summer months.
Packaging
Most liquid milk is packaged in 0.25 Kg units. There are four
types of packaging of local milk:
. plastic sachets,
. glass bottles,
. plastic bottles, and
. cartons.
These different packs are available only in the cities. In the
rural agricultural areas, the people use milk powder. Plastic
sachets are the most common packaging form because of their
low cost. They, like glass and plastic bottles, show no
product description, merely the production date.

148
Cartons possess a certain design indicating product name,
producers's name, trade mark, a brief description of the
product, contents, instructions, date of production and shelf-
life.
Market Analysis
Total Raw Milk Production
The average increase in raw milk production over the decade
1978-88 in China was 16.3% per annum. In recent years, the
real GDP growth rate has been 10% per annum. It is generally
accepted that the increase in total raw milk production will
be approximately 10% over the next decade.
Total Dairy Consumption
The average increase in total dairy consumption from 1978-88
was 18.9% per annum, 2.6% higher than that of raw milk
production. This 2.6% difference was serviced by imports.
The average annual increase in net imports of dairy products
was 53% in the same period, revealing previous trade isolation
and a very low starting figure.
It has been estimated that the rate of increase in total
national dairy consumption will approximate 10% per annum for
the next decade.

149
Total Liquid Milk Consumption
This figure is directly related to population and per capita
consumption. The Ministry of Agriculture (MOA) has estimated
that China's population in the year 2000 will be 1.28 billion
and per capita consumption 4 Kg per annum.
Liquid Milk Market Segment
This figure concerns total dairy consumption and liquid milk
consumption. It is estimated that the demand for a variety of
dairy products will increase faster than the demand for liquid
milk. According to the data and projection done by Ministry of
Agriculture (MOA), in 1992, the market segment for liquid milk
was 53%; it is predicted that this will decrease to about 4 0%
in the year 2000.
In 1989, Ministry of Agriculture made a survey on the liquid
milk consumption in six cities in China from 1982 to 1989, the
result shows that, on average, liquid milk consumption is
increasing at 16.2% per annum (see Appendix 15). This may be
regarded as a reasonably accurate reflection of increased
liquid milk consumption by the entire population.

150
Table 6-1-1 Liquid Milk Consumption in China 1978-92 Source: S.S.B., China Statistical Yearbook various
Issues YEAR
1978
1979
1980
1981
1982
1983
1984
1985
1986
1987
1988
1989
1990
1 1991
1992
TOTAL DAIRY CONSUMP. ('000 TON)
997
1190
1380
1561
2465
2588
3100
3501
4000
"* 4137
4274
4471
4875
4914
5332
GROWTH RATE (X)
19.36
15.97
13.12
57.91
4.99
19.78
12.94
14.25
3.43
3.31
4.61
9.04
0.80
8.50
LIQUID MILIC CONSUMP. ('000 TON)
686
779
857
917
1365
1346
1643
1996
2604
2605
2604
2635
2779
2710
2844
GROWTH RATE (X)
13.52
10.00
6.99
48.86
-1.39
22.09
21.46
30.49
0.05
-0.06
1.19
5.48
-2.49
4.96
MARKET SEGMENT (X)
68.83
65.46
62.10
58.73
55.37
52.00
53.00
57.00
65.10
62.97
60.92
58.93
57.00
55.14
53.34
Table 6-1-1 indicates a reduction of the market segment held
by liquid milk from 68.83% in 1978 to 53.34% in 1992.

151
Table 6-1-2 Liquid Milk Consumption per Capita in China 1978-1992
Source: S.S.B., China Statistical Yearbook various issues
YEAR
1978
1979
1980
1981
1982
1983
1984
1985
1986
1987
1988
1989
1990
1991
1992
LIQUID MILK CONSUMP. ('000 TON)
686
779
857
917
1365
1346
1643
^ 1996
2604
2605
2604
2635
2779
2710
2844
GROWTH RATE (X)
13.52
10.00
6.99
48.86
-1.39
22.09
21.46
30.49
0.05
-0.06
1.19
5.48
-2.49
4.96
POPULATION (MILLION)
958.10
969.01
981.24
1006.91
1020.18
1029.85
1040.04
1051.27
1067.93
1079.47
1100.86
1130.00
1143.61
1156.57
1169.67
LIQUID MILK CONSUMP. PER CAPITA (KG)
0.72
0.80
0.87
0.91
1.34
1.31
1.58
1.90
2.44
2.41
2.37
2.33
2.43
2.34
2.43
GROWTH RATE (X)
12.24
8.63
4.26
46.93
-2.32
20.89
20.16
28.45
-1.02
-2.00
-1.42
4.22
-3.58
3.78
Table 6-1-2 suggests that the per capita consumption of liquid
milk will only increase to 2.43 Kg per annum in 1992. This
represents a growth rate of 3.8%. This consumption volume is
extremely low when compared with that of western countries. It
is very interesting to see the annual growth rate was "very"
high during 1978-1986, and then the annual growth rate
suddenly dropped dramatically during 1987-1992. There are
plenty of reasons to explain these changes, such as changes in
the Chinese government's rural policy, food price fluctuations
and consumer reactions to dairy products. In the view of the
author, variations in dairy production figures reflect
alternative methods applied to statistical data by the Chinese

152
government. However, the fact remains that there is more milk
available on the market for the ordinary Chinese to consume in
1993 than there has been in previous years. Please note that a
detailed study of discrepancies in these figures is not
covered in this research.
Price Analysis
Table 6-1-3 Analysis of Retail Liquid Milk Prices in China 1988-1992
Source: Field Research and Personal Communications (see Appendix 2, Ref. No. 1, 3, 4, 8, 32 and 38)
YEAR
1988
1989
1990
1991
1992
FARMGATE PRICE IN CHINA
(YUAN/KG)
0.7314
0.8180
0.9150
1.0234
1.1447
LIQUID MILK RETAIL PRICE IN CHINA
(YUAN/KG)
1.0473
1.1713
1.3102
1.4654
1.6391
LIQUID MILK RETAIL PRICE IN AUSTRALIA (AUD/KG)
0.8375
0.8513
0.8650
0.9263
0.9700
AVE. ANNUAL EXCHANGE RATE
(YUAN/USD)
3.7220
4.7220
5.2220
5.3560
5.7662
AVE. ANNUAL EXCHANGE RATE
(AUD/USD)
1.1689
1.2651
1.2932
1.2900
1.4500
LIQUID MILK RETAIL PRICE IN CHINA
(USD/KG)
0.2814
0.2481
0.2509
0.2736
0.2843
LIQUID MILK RETAIL PRICE IN AUSTRALIA (USD/KG)
0.7165
0.6729
0.6689
0.7180
0.6690
In 1988, MOA (Ministry of Agriculture) made a survey on the
milk prices in eight cities (Beijing, Shanghai, Tianjin,
Nanjing, Xian, Guangzhou, Hangzhou and Changsha) in China (see
Appendix 16). It can be seen that the difference i.e. factory
profit, between farmgate price and retail liquid milk price is
43% which is approximately half the corresponding Australian
figure.

153
Volume and Value of Australian Exports to China
Table 6-1-4 Volume and Value of Australian Liquid Milk Exports to China 1987-1992
Source: . Export Division, ADC (1993) Melbourne, . ABARE's Commodity Statistical Bulletin (1992) Canberra. Note: Figures in 1988, 1989 and 1990 are estimates by the author
YEAR
1987
1988
1989
1990
1991
1992
AUSTRALIAN UHT MILK VOLUME EXPORTED TO CHINA (TONNE)
0.2640
0.6115
1.4163
3.2805
7.5983
40.7640
LIQUID MILK RETAIL PRICE IN AUSTRALIA (AUD/T0NN3
838
851
865
926
970
AVE. ANNUAL EXCHANGE RATE (AUD/USD)
1.1689
1.2651
1.2932
1.2900
1.4500
VALUE OF EXPORTED MILK (AUD '000)
512
1206
2838
7038
39541
VALUE OF EXPORTED MILK (USD '000)
438
953
2194
5456
27270

154
a in
o o • CM
CM o\ ON H 1 00 CO cn H
id C •rl JC
at c ^ 3 0
O X
0 H 0)
•P s
m •P H 0
•» r> cn
Quai X H * H •H
H
*.
u a
s *«: •0 •rl
3 *. c D1 0
•H J
C id •H H id M p n 3
•H W •H
> -H D
•p
M 0 a X
rt w
i \o
a> M 3
• • <D 0 u b»3
•H 0 l>« 00

155
As can be seen from Table 6-1-4 and Figure 6-1-1, Australia's
exports of UHT milk to China demonstrated a dramatic increase
in 1992. This represents a major effort to obtain market share
for Australia in an enormous potential market. However, the
profit margin on the exercise is suspect under present
conditions which must take into consideration transport costs,
import duty, storage costs and the financial capability of the
Chinese consumers.
Opportunities^ for Export of Australian Products
From the previous analysis it has been shown that
opportunities for exports of liquid milk to China are doubtful
due to price factors.
In recent years, some Australian UHT milk has been exported
but this would seem also to be not a viable proposition for
the future because of the costs required for effective
marketing.
Already in Hong Kong and Macao, many people are buying Chinese
liquid milk, because of its low price. It would appear that
the only perceived future for Australia is to export UHT
technology for which it is well placed. Another possible
avenue would be to export milk supplements such as milk
calcium and lactose enzymes. Finally there is a very small
niche market for UHT milk for foreign residents in China and
international hotels.

6.2 Milk Powder
156
There are two types of milk powder:
. Full cream milk powder which is whole milk with the water
completely removed by spray drying and which retains its
original food value when mixed with water in the
proportion directed; and
. Non-fat skim milk powder in which the cream layer of the
milk is removed by a mechanical separator. The milk is
then spray dried to produce a powder. Some skim milk
products* are treated to make them readily soluble in cold
water. The food value of non-fat milk is equal to whole
milk, apart from cream and the soluble vitamins A and D.
This makes it lower in calorie content (ADC, Dairy
Compendium, 1989).
Milk powder is a very popular product in China because of its
healthy image and ease of transportation. Most of the milk
powder is for recombination into liquid milk for drinking.
Soya bean powder is a relatively new product in China.
However, since early times soya beans have been ground by
family groups to produce a meal paste. This was then boiled
with water for at least 10 minutes to produce a drink. Soya
bean powder is a possible strong competitor for dairy milk
powder in the future.

157
Products on the Market
Local:
. sweetened full cream milk powder;
. unsweetened full cream milk powder;
. skim milk powder;
. fortified milk powder;
. milk formula for infants;
. longevity milk powder for the elderly; and
. milk powder with special flavours.
Imported:
. Nespray "• Switzerland
. Anchor New Zealand
. Dutch Lady Holland
. Xinmeili Taiwan
. Power Taiwan
Table 6-2-1 shows the prices of various milk powder products
in five different regions of China.
Table 6-2-1
Source:
Prices of different Milk Powders in Five Regions of China in 1989 Field Research and Personal Communications (see Appendix 2, Ref. No. 2, 10, 11, 17, 33, 34 and 38)
MILK POUDER BRAND
_ Haihe
_ Songhua Lake
Bright
YangziJiang
Nespray
__ Nespray
Lactogen
GEOGRAPHIC SEGMENT
Tianjin
Tianjin
Wuhan
Wuhan
Beijing
Tianjin
Shanghai
PRODUCTION PLANT SITE
Tianjin
Heilongjiang
Wuhan
"Wuhan
Switzerland
Switzerland
Holland
WHOLESALE PRICE (YUAN)
3.50/lb
4.00/lb
2.30/lb
2.30/250g
13.39/500g
14.00/450g
43.20/Kg
RETAIL PRICE (YUAN)
3.93/lb
4.80/lb
2.50/lb
2.50/250g
15.00/500g
15.41/450g
48.00/Kg

158
Industrial:
Industrial milk powder is mostly imported and is chiefly
used to make recombined liquid milk. Donations from the
EC aid program supplies 20 cities in China with skim milk
powder and butter for recombination to form liquid milk.
Locally produced Chinese milk powder is marketed under
more than a hundred different brand names. Of these the
most popular are Haihe, Songhuahu, Bright and
Yangzijiang.
Product Quality
Local
. Most local milk powders can not be dissolved in water
easily. In addition, local milk powders are very sweet
because manufacturers add a lot of sugar as a
preservative. Some people would prefer that this did not
occur because they want milk powder not what they regard
to be sugar milk powder.
. There is a high degree of foreign matter in some of the
milk powders, e.g. grit and plastic threads which leads
to a slight cloudiness.
. Of the local producing joint venture plants Nestle milk
powder is regarded as the best by the Chinese public.

159
Imported:
These products are at present superior to the local ones
because of:
. better dissolution index;
. consistent quality; and
. product diversity.
Field research and market investigation shows that Nestle
virtually dominates the milk powder import market in China. It
is estimated that it accounts for 70-80% of the total retail
market.
Consumer Profile
Introduction
Market research shows that the majority of consumers of local
milk powder are young women with young children and middle
aged people. Imported milk powder is mainly bought by young
couples. These include single child families, high income
families and the intelligentsia. Intellectuals, especially
those who are single and on a higher income are mainly
concerned with the quality and taste of the product. Compared
with other consumer groups the life style of these people is
more westernised. They believe the quality and taste of
foreign milk powder is superior to that of domestic products.
Method of Use
Milk powder is recombined with boiled water to give liquid
milk.

160
Consumer Knowledge of Product
A survey was carried out by the Ministry of Agriculture (MOA)
in six cities giving the following criteria on which to judge
products:
. price;
. brand name;
. packaging;
. prize winning record;
. recommendation by friends, and
. desire to sample a new product.
The most important criteria were: brand name and prize winning
record. Almost all customers had a limited knowledge of the
product they wanted to buy. Most could not differentiate
between whole milk products and skim milk products and at the
point of purchase were more concerned with the date of
production and the condition of the packaging.
Product Preference
Consumers prefer powders with a strong milk taste and a high
dissolution index. They also prefer simple packs because
otherwise they think they are being charged extra for special
packaging.
Seasonality and Climate
The consumption of dairy products in China shows unclear
seasonal fluctuations. People consume slightly more dairy
products during the cold season and less in the summer months.

161
According to traditional Chinese medical science, dairy
products may induce excessive internal heat. However babies
are born in all seasons in China so the consumption of milk
powder as well as of liquid milk also occurs between June and
September.
Fashions also affect product sales. For example, in 1982-84,
malted milk was very popular. This triggered a higher demand
for milk powder especially in the city of Wuhan in Hubei
province where the maximum output of malted milk powder
reached 20,000 mt. in 1984. Since then the market has changed
and experienced a dramatic decrease of 50-80%.
Packaging
There are three kinds of packaging for consumer milk powder on
the market:
. polyethylene bags: 250g, 454g or 500g;
. multi-layer compound bags: 250g, 454g or 500g; and
. metal tins 454g, 900g or lOOOg.
The domestic product is mostly packed in bags, either
polyethylene or compound. The most popular brands of milk
powder are packed in polyethylene bags. Imported milk powders
are packed in compound bags or tins.
Market Analysis
In 1989, the Ministry of Agriculture made a survey of milk
powder consumption in six cities of China (Beijing, Shanghai,
Tianjin, Wuhan, Nanjing and Xian) for the period from 1982 to

162
1989. The result shows the annual increase in sales of milk
powder in six Chinese cities over the period 1982-1989. The
average growth rate was 10.74 but reached 55% in Beijing and
22% in Nanjing (see Appendix 17) .
Table 6-2-2 Milk Powder Market Analysis 1978-1992 Source: S.S.B., China Statistical Yearbook various
issues. YEAR
1978
1979
1980
1981
1982
1983
1984
1985
1986
1987
1988
1989
1990
1991
1992
TOTAL DAIRY CONSUMP. ('000 TON)
997
1190
1380
1561
2465
2588
3100
3501
4000
4137
4274
4471
4875
4914
5332
GROWTH RATE (X)
19.36
15.97
13.12
57.91
4.99
19.78
12.94
14.25
3.43
3.31
4.61
9.04
0.80
8.50
MILK POWDER CONSUMP. ('000 TON)
43
48
51
54
79
77
86
90
95
92
88
92
105
111
126
MILK EQUIVALENT ('000 TOM)
411
456
491
516
756
737
820
860
913
877
841
879
1003
1058
1200
GROWTH RATE (X)
10.85
7.70
5.05
46.65
-2.50
11.24
4.88
6.10
-3.95
-4.06
4.55
14.07
5.45
13.51
MARKET SEGMENT (X)
41.24
38.30
35.56
33.03
30.67
28.49
26.45
24.57
22.81
21.19
19.68
19.66
20.57
21.52
22.51
Table 6-2-2 shows that, on average, milk powder consumption is
increasing at 13.5% per annum, more or less reflecting the
increased rate of consumption of milk powder by the
population. It is predicted by the Chinese dairy experts from
the Ministry of Agriculture interviewed in Beijing such as Mr.
Yin Cheng Wen through their surveys that milk powder sales
will enjoy a high growth rate in the coming years as income

163
level increases in the country areas and cold store facilities
are still inadequate.
Table 6-2-3 Milk Powder Consumption per capita in China 1978-1992
Source: S.S.B., China Statistical Yearbook various issues
YEAR
1978
1979
1980
1981
1982
1983
1984
1985
1986
1987
1988
1989
1990
1991
1992
TOTAL MILK POWDER CONSUMP. ('000 TON)
43.02
47.69
51.36
53.95
79.12
77.14
85.81
90.00
95.49
91.72
88.00
92.00
104.94
110.66
125.61
GROWTH RATE (X)
10.85
7.70
5.05
46.65
-2.50
11.24
4.88
6.10
-3.95
-4.06
4.55
14.07
5.45
13.51
POPULATION (MILLION)
958.10
969.01
981.24
1006.91
1020.18
1029.85
1040.04
1051.27
1067.93
1079.47
1100.86
1130.00
1143.61
1156.57
1169.67
MILK POUDER CONSUMP. PER CAPITA (G)
44.90
49.21
, 52.34
53.58
77.55
74.90
82.51
85.61
89.42
84.97
79.94
81.42
91.76
95.68
107.39
GROWTH RATE (X)
9.60
6.35
2.37
44.74
-3.41
10.15
3.76
4.45
-4.98
-5.92
1.85
12.71
4.27
12.24 J
Table 6-2-3 anticipates that, if per capita consumption level
reaches 270g per annum, each individual will consume an extra
2.5 litres of recombined milk annually.

164
Price Analysis
Table 6-2-4 Price Analysis of Milk Powder in China 1988-1992
Source: Field Research and Personal Communications (see Appendix 2, Ref. No. 18)
YEAR
1988
1989
1990
1991
1992
FARMGATE PRICE IN CHINA
(YUAN/TON)
731
818
915
1023
1145
MILK POWDER WHOLESALE PRICE IN CHINA
(YUAN/TON)
7996
8943
10003
11188
12514
AUSTRALIAN MILK POWDER
PRICE (AUD/TON)
1399
2245
2341
1784
1953
AVE. ANNUAL EXCHANGE RATE
(YUAN/USD)
3.7220
4.7220
5.2220
5.3560
5.7662
AVE. ANNUAL EXCHANGE RATE
(AUD/USD)
1.1689
1.2651
1.2932
1.2900
1.4500
MILK POWDER
WHOLESALE PRICE IN CHINA
(USD/TON)
2148
1894
1916
2089
2170
AUSTRALIAN MILK POWDER EXPORT PRICE
(USD/TON)
1197
1775
1810
1383
1347
Table 6-2-4 shows the different prices for milk powder in
China and Australia. Australian milk powder is around 50%
cheaper than the Chinese milk powder. It also indicates that
the Chinese are used to consuming re-combined milk; it is
obvious that milk powder has been the dominant imported dairy
product in China. This market has been monopolised by the EC's
free aid milk powder (around 200 million US dollars a year)
for five years which makes it impossible for Australian dairy
exporters to enter this market.

165
Volume and Value of Australian Exports to China
Table 6-2-5 Volume and Value of Australian Milk Powder Exports to China 1987-1992
Source: . Export Division, ADC, 1993, Melbourne . ABARE's Commodity Statistical Bulletin (1992) Canberra. Note: Figures for 1988 to 1990 and 1992 are estimates by the author
YEAR
1987
1988
1989
1990
1991
1992
AUSTRALIAN MILK POWDER VOLUME EXPORTED TO CHINA (TONUS)
1526.00
1005.99
663.18
437.19
190.00
125.25
AUSTRALIAN MILK POWDER EXPORT PRICE (AUD/TONNt)
1133
1399
2245
2341
1784
1954
AVE. ANNUAL EXCHANGE RATE (AUD/USD)
1.1689
1.2651
1.2932
1.2900
1.4500
VALUE OF MILK POWDER EXPORT (AUD '000)
1407
1489
1023
339
245
VALUE OF MILK POWDER EXPORT (USD '000)
1204
1177
791
263
169

CM
m m
o 0 o CM
a a in
- •
m 0)
D cn cn
cn co cn
co co cn - •
co cn
o o D
D D If)
id a •rl A
c ^ 3 0
O Xi
0 H 01
P a m P n 0
». ro cn
Oicn X w M d) •d
H
*.
u Q
> < 0 ft
* H •rl £
PI id •H H
•>. C 0 •H (/] •H > •H
a A -P M P 0) 3
^ 0 a X
rt w
H 1 CM 1 vo
0) U P
• t
a) u >-(
t~ 3 •H 0 fc w

167
Table 6-2-5 and Figure 6-2-1 reveal a declining trend in
Australia's exports of milk powder to China in reverse to
market demand.
Opportunities for Export of Australian Products
Australia has a great potential opportunity to export milk
powder to China. However, if international subsidies prevail
and Australia is forced to sell at present prices which are
below production costs, there is a problem.
Australia can export SMP and butter for the recombined liquid
milk market in most large Chinese cities. This is possible
because once landed transportation is cheap and inaccessible
markets can be reached from county processing plants.
6.3 Butter
Butter is a natural product, churned from cream, and is one of
the most highly concentrated of all dairy foods. It has a
minimum of 80% butterfat and not more than 16% water and 2% of
other milk solids.
Butter contains energy giving butterfat and fat soluble
vitamins of which vitamin A is the most important.

168
There are a several types of butter:
. Creamy butter:
. Salted: the salting of butter dates back to the time
when salt was used as a natural preservative.
(Australians have developed a natural preference for
salted butter made from sweet fresh cream.)
. Unsalted: this is butter made from fresh cream
without the addition of salt.
. Cultured butter: this butter has a cultured flavour. A
selected bacterial culture is added to the cream to give
a milk acidity and enhance the butter flavour. (This type
is increasing in popularity in Australia due to the
influence of European migrants.)
. Salted: the salt level is usually less than that of
normal butter.
. Unsalted: most cultured butter is unsalted. It is
often referred to as Danish type.
. Soft butter: there are several ways of improving the
spreadability of butter. One is the Modified Alnarp
Treatment which heats then cools the cream under
controlled conditions before churning. Re-working butter
before packing may also be used to obtain this
consistency.
. Clarified butter: this is also known as butteroil or ghee
and is traditionally used for cooking in India. Its use
is now increasing because is contains no salt or
moisture and does not spatter or foam when melted. Water
and non-fat solids are removed by centrifuging and the

169
fat is cooled slowly. It will keep without refrigeration.
. Butter concentrate: it is composed of non-fat milk
solids. It is used mainly in tropical climates (Butter
Leaflet, Australian Dairy Corporation, 1989).
There are some other butter related dairy products on the
market e.g. a mixture of butter and margarine, however, the
demand for these products is low.
Dairy products in China have always been and still remain
scarce. Traditional Chinese cooking is based on vegetable oils
(peanut, sunflower, rape seed, sesame, soya bean and maize)
and they provide an age old substitute for butter. The Chinese
consume on average 5.66 Kg of vegetable oil per capita per
annum.
The likelihood of changing this tradition seems extremely
remote, since not only does oil not require refrigeration but
also is a much cheaper product.
(Note: coffee whitener is produced from vegetable oils)
Products on the Market
Local
In China the consumption of butter and cream is a foreign
habit. There is only one local butter in the market place. It
is an unsalted type manufactured in Inner Mongolia and sells
for 30 Yuan/Kg. There is equally only one type of cream. It is
manufactured in Shanghai and retails at 20 Yuan/Kg.

170 Imported
There are many imported brands of butter available to
foreigners in China. These products service the diplomatic and
foreign business communities and foreign hotels. Anchor is the
most successful brand. Most butters retail at about 60
Yuan/Kg. There are also several brands of margarine available
to the same market segment. The Chinese population do not buy
either of these products.
Industrial
Industrial butter is mainly imported from the US, New Zealand,
Holland and Australia. It is used in bakeries and
confectionary products. Industrial butter is also used in
recombination with skim milk powder to boost the liquid milk
volume when required, as previously mentioned (section 6.2 on
milk powder).
Product Quality
Local
Most Chinese do not eat butter so are quite unable to judge
its quality. In fact, the local product which is unsalted is
quite unsophisticated as might be expected.
Most dairy factories do not have separator facilities which
precludes the production of cream and hence butter. The main
reasons for this is the priority given by the central
government for the production of pasteurised liquid milk and
the fact that there is no local market for the product.

171
Imported
All imported butter is tested by the National Quality Control
Bureau to prevent adulterated products entering the market.
Consumer Profile
Introduction
Imported butter and margarine are purchased by urban Chinese
who return home after long periods posted abroad.
Method of Use
. Coffee whitener (non dairy) is popular amongst the
Chinese who drink coffee confirming their preference for
dried products.
. Butter and other foreign products have also now assumed a
prestige level amongst Chinese consumers.
Consumer Knowledge of Product
The majority of Chinese have no knowledge of butter and would
be unable to distinguish it from margarine.
Industrial butter is purchased by large Chinese bakeries and
by import/export companies both of whom have a reasonable
knowledge of the product.
Packaging
Local butter is packaged in 50g lots in foil. Local cream is
packed in 50g plastic containers. Coffee whitener (non dairy)
is marketed in glass bottles.

172
Market Analysis
Table 6-3-1 Butter Consumption in China 1978-1992 Source: . S.S.B., China Statistical Yearbook various
issues . Statistical Yearbook for Asia and the Pacific (1990) United Nations
YEAR
1978
1979
1980
1981
1982
1983
1984
1985
1986
1987
1988
1989
1990
1991
1992
TOTAL DAIRY CONSUMP. ('000 TON)
997
1190
1380
1561
2465
2588
3100
3501
4000
4137
4274
4471
4875
4914
5332
GROWTH (X)
19.36
15.97
13.12
57.91
4.99
19.78
12.94
14.25
3.43
3.31
4.61
9.04
0.80
8.50
BUTTER CONSUMP. ('000 TON)
10.52
15.82
18.68
26.68
31.42
33.44
33.57
29.42
33.31
34.33
39.90
42.74
43.69
41.29
42.00
MILK EQUIVALENT ('000 TON)
63
94
111
159
187
199
200
175
198
204
238
254
260
246
250
GROWTH (X)
50.39
18.06
42.81
17.78
6.41
0.41
-12.36
13.21
3.07
16.23
7.10
2.23
-5.50
1.72
MARKET SEGMENT (X)
3.91
4.05
4.20
4.35
4.50
4.66
4.83
5.00
5.18
5.37
5.56
5.69
5.34
5.00
4.69
Butter consumption in China is directly linked to liquid milk
consumption as butter is a prime constituent of recombined
whole milk. Thus, as milk becomes a more acceptable dietary
item, butter consumption will increase. It is thought that
table spreads will have little potential but butter
consumption will also increase in relation to both the
confectionary and fast food industries.

173
Table 6-3-2 Butter Consumption per Capita in China 1978-1992
Source: S.S.B., China Statistical Yearbook various issues
YEAR
1978
1979
1980
1981
1982
1983
1984
1985
1986
1987
1988
1989
1990
1991
1992
BUTTER CONSUMP. ('000 TON)
10.52
15.82
18.68
26.68
31.42
33.44
33.57
29.42
33^31
34.33
39.90
42.74
43.69
41.29
42.00
GROWTH RATE (X)
50.39
18.06
42.81
17.78
6.41
0.41
-12.36
13.21
3.07
16.23
7.10
2.23
-5.50
1.72
POPULATION (MILLION)
958.10
969.01
981.24
1006.91
1020.18
1029.85
1040.04
1051.27
1067.93
1079.47
1100.86
1130.00
1143.61
1156.57
1169.67
BUTTER CONSUMP, PER CAPITA (G)
10.98
16.33
19.04
26.49
30.80
32.47
32.28
27.99
31.19
31.80
36.25
37.82
38.20
35.70
35.91
GROWTH RATE (X)
48.70
16.59
39.17
16.25
5.41
-0.58
-13.30
11.45
1.96
13.97
4.34
1.01
-6.55
0.58
Figures shown in Table 6-3-2 indicate that per capita
consumption of butter in China increased only at a very low
rate per annum over the past decade.

174
Price Analysis
Table 6-3-3 Butter Prices in Australia and China 1988-1992 (Exchange rates 1988-1992 are real values)
Source: Field Research and Personal Communications (see Appendix 2, Ref. No. 1, 2, 7, 10, 15, 25, and 34)
YEAR
1988
1989
1990
1991
1992
FARMGATE PRICE IN CHINA
(YUAN/TON)
731
818
915
1023
1145
BUTTER WHOLESALE PRICES IN CHINA
(YUAN/TON)
4982
5572
6232
6971
7797
EXPORT BUTTER PRICE
(AUD/TON)
1399
2245
2341
1784
1953
AVE. ANNUAL EXCHANGE RATE
(YUAN/USD)
3.7220
4.7220
5.2220
5.3560
5.7662
AVE. ANNUAL EXCHANGE RATE
(AUD/USD)
1.1689
1.2651
1.2932
1.2900
1.4500
WHOLESALE BUTTER PRICE IN CHINA
(USD/TON)
1338
1180
1193
1301
1352
AUSTRALIAN BUTTER EXPORT PRICE
(USD/TON)
1197
1775
1810
1383
1347
Table 8-3-3 shows that the prices of Australian export butter
and the local Chinese product were approximately equal in
1992. In fact, the Chinese price does not reflect market
forces because the amount consumed is negligible.
Volume and Value of Australian Exports to China
Table 6-3-4 Volume and Value of Australian Butter Exports to China 1987-1992
Source: . Export Division, ADC, 1993, Melbourne . ABARE's Commodity Statistical Bulletin
Note: All data from 1989 to 1990 are estimates by the author
YEAR
1987
1988
1989
1990
1991
1992
AUSTRALIAN BUTTER VOLUME EXPORTED TO CHINA (TONttE)
948.55
404.30
322.51
257.27
105.76
244.42
BUTTER EXPORT PRICE FROM AUSTRALIA (AUD/TOMMe)
1638
1765
2259
1811
1921
AVE. ANNUAL EXCHANGE RATE (AUD/USD)
1.1689
1.2651
1.2932
1.2900
1.4500
VALUE OF EXPORTED
BUTTER (AUD '000)
662
569
581
192
470
VALUE OF EXPORTED
BUTTER (USD '000)
567
450
449
148
324

175
O
m a o
•
m D o rn
D in CM
D D CM
D in
o a
(M o\ 9\ H 1 CO CO o\ c •H H +
a) Id r c •H A o 0 p
rH 3 CQ
rH id 0 •H
n -P P u W •H
O P a to x P w H W >i
0) +J •P •H •P 73 3 «
C id •H
H id u •p (0
0 @
0 u w »* w
s 3 CQ 4 <C
m 1 vo a) M 3
• • a) u u tn
•H 0 h W

176
As Table 6-3-4 shows Australian butter exports to China in
1992 totalled 244.42 tons, an increase of 100% on the previous
year. This was due to the combination of two factors: a
decrease in export market demand and historical events at that
time.
Opportunities for Export of Australian Products
It will be difficult for Australia to sell butter in China for
the recombined milk market because this is related to supplies
of SMP and the market is dominated by subsidised EC products.
With regard to exports for the burgeoning confectionary trade,
Australia could aim for a market share. Two facts should,
however, be kept in mind:
. butter does not feature in traditional Chinese cuisine,
and
. China could easily produce butter cheaply with the
introduction of simple technology.

6.4 Yoghurt
177
Yoghurt is a natural cultured milk product made with special
strains of acid-producing bacteria to give it a mildly acid
flavour.
There are several types of yoghurt:
. Set yoghurt: The culture is added to the milk in the
container in which it will be sold. The texture resembles
that of junket.
. Stirred yoghurt: This is made before packaging. The
junket-like curd is stirred to give a soft custard
consistency.
. Flavoured yoghurt: This has flavouring and sugar added
prior to the addition of the culture, and then is set or
stirred.
. Fruited yoghurt: This is usually a stirred type with
fresh fruit pieces and sugar added.
Since extra milk solids are added, yoghurt is more
concentrated than milk and has 25% more food value than whole
milk (ADC, Dairy Compendium, 1989).
In the last few years, there has been a strong demand for
yoghurt and supply has not been able to meet this in China.
This has led to inelasticity of demand. There are no
substitutes for yoghurt and no cream cheese, or "fromage
frais" desserts on the market.
178
Products on the Market
Local
There are three types of yoghurt available in China: set,
stirred and fruited. The average price is about 4 Yuan/Kg.
Note that there is also an enzyme milk beverage (yoghurt
drink) locally produced for the Chinese market which is based
on a European formula.
Imported
There are no imported yoghurts in China, however several
European and American dairy companies have set up joint
venture production plants e.g. Nestle in Sichuan. These
products sell for around 6 Yuan/Kg.
Product Quality
The Chinese have never traditionally produced yoghurt. Its
advent came with the Europeans and has only been produced in
its modern form locally for about 3 0 years. However the
quality of the local products is very good.
Consumer Profile
Introduction
The consumers are mostly urban young people and children in
the major cities, and large towns. Yoghurt is inexpensive and
thus accessible to the general populace.

179
Method of Use
yoghurt is consumed mostly as a refreshing social drink in the
summer months in the North and all year round in the South.
Consumer Knowledge of Product
The Chinese are well aware of the quality of set yoghurt,
however stirred varieties are a more recent addition on the
market and consumers have very little knowledge in them.
Product Preference
Market surveys have shown a preference for strong vanilla-
flavoured rich smooth soft yoghurt. Joint venture products are
also preferred because of the reputation of the foreign
companies involved.
Seasonality and Climate
In summer there is an increase in yoghurt consumption because
it is regarded as a refreshing social drink. In Southern China
there is a considerably higher consumption rate than in the
North due to climatic differences.
Packaging
The overwhelming majority of Chinese people prefer simple
packaging. Yoghurt is packaged in several ways: plastic
bottles, glass bottles and earthenware pots, all of which are
acceptable.
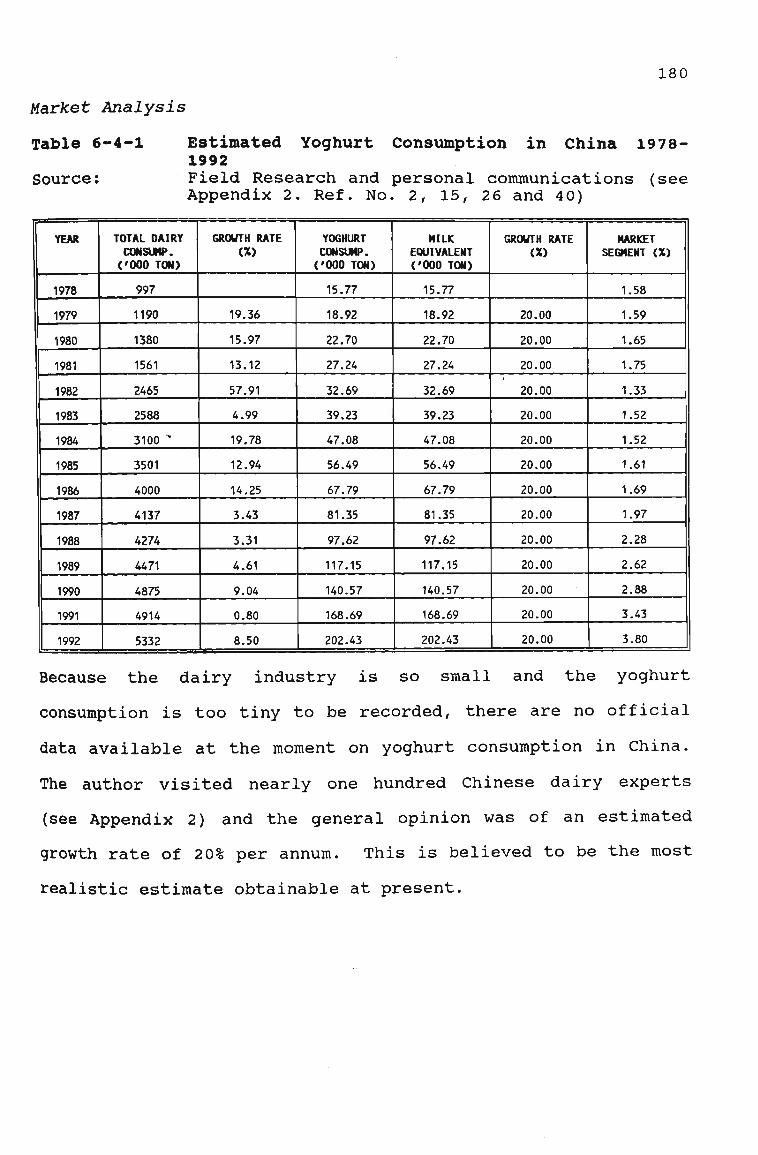
180
Market Analysis
Table 6-4-1 Estimated Yoghurt Consumption in China 1978-1992
Source: Field Research and personal communications (see Appendix 2. Ref. No. 2, 15, 26 and 40)
YEAR
1978
1979
1980
1981
1982
1983
1984
1985
1986
1987
1988
1989
1990
1991
1992
TOTAL DAIRY CONSUMP. ('000 TON)
997
1190
1380
1561
2465
2588
3100 "*
3501
4000
4137
4274
4471
4875
4914
5332
GROWTH RATE (X)
19.36
15.97
13.12
57.91
4.99
19.78
12.94
14.25
3.43
3.31
4.61
9.04
0.80
8.50
YOGHURT CONSUMP. ('000 TON)
15.77
18.92
22.70
27.24
32.69
39.23
47.08
56.49
67.79
81.35
97.62
117.15
140.57
168.69
202.43
MILK EQUIVALENT ('000 TON)
15.77
18.92
22.70
27.24
32.69
39.23
47.08
56.49
67.79
81.35
97.62
117.15
140.57
168.69
202.43
GROWTH RATE (X)
20.00
20.00
20.00
20.00
20.00
20.00
20.00
20.00
20.00
20.00
20.00
20.00
20.00
20.00
MARKET SEGMENT (X)
1.58
1.59
1.65
1.75
1.33
1.52
1.52
1.61
1.69
1.97
2.28
2.62
2.88
3.43
3.80
Because the dairy industry is so small and the yoghurt
consumption is too tiny to be recorded, there are no official
data available at the moment on yoghurt consumption in China.
The author visited nearly one hundred Chinese dairy experts
(see Appendix 2) and the general opinion was of an estimated
growth rate of 20% per annum. This is believed to be the most
realistic estimate obtainable at present.
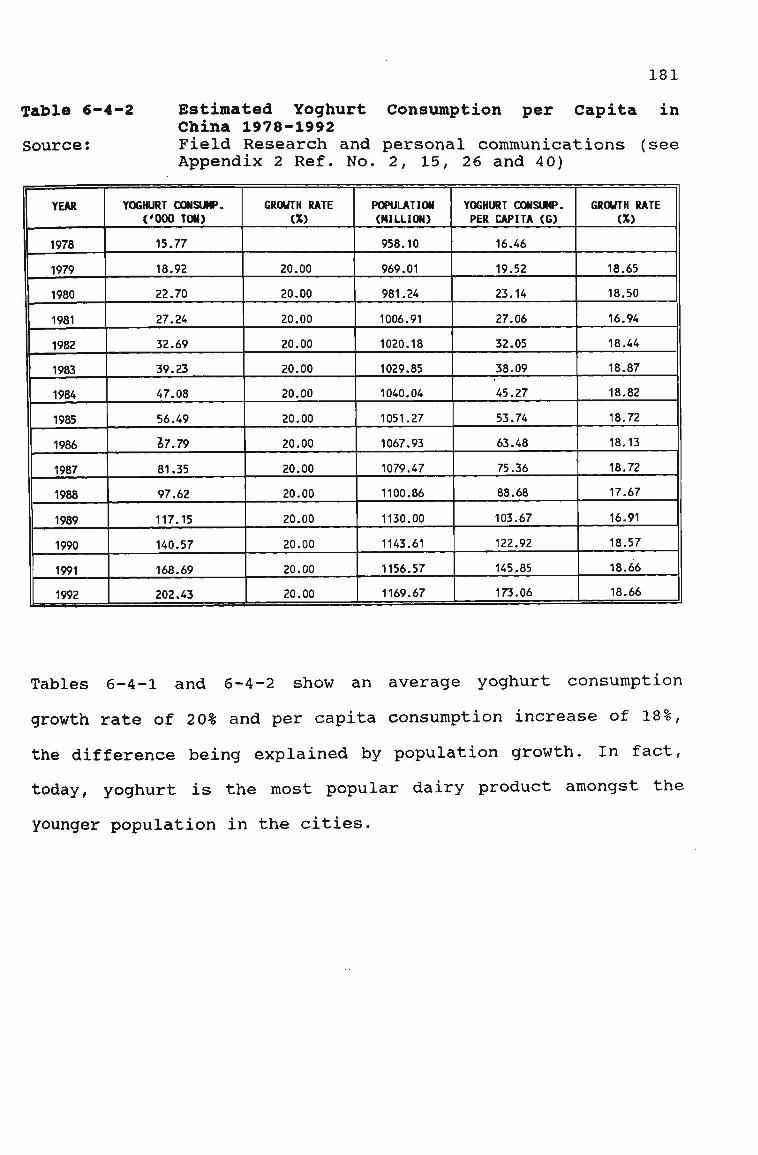
181
Table 6-4-2 Estimated Yoghurt Consumption per Capita in China 1978-1992
Source: Field Research and personal communications (see Appendix 2 Ref. No. 2, 15, 26 and 40)
YEAR
1978
1979
1980
1981
1982
1983
1984
1985
1986
1987
1988
1989
1990
1991
1992
YOGHURT CONSUMP. ('000 TON)
15.77
18.92
22.70
27.24
32.69
39.23
47.08
56.49
27.79
81.35
97.62
117.15
140.57
168.69
202.43
GROWTH RATE (X)
20.00
20.00
20.00
20.00
20.00
20.00
20.00
20.00
20.00
20.00
20.00
20.00
20.00
20.00
POPULATION (MILLION)
958.10
969.01
981.24
1006.91
1020.18
1029.85
1040.04
1051.27
1067.93
1079.47
1100.86
1130.00
1143.61
1156.57
1169.67
YOGHURT CONSUMP. PER CAPITA (G)
16.46
19.52
23.14
27.06
32.05
38.09
45.27
53.74
63.48
75.36
88.68
103.67
122.92
145.85
173.06
GROWTH RATE (X)
18.65
18.50
16.94
18.44
18.87
18.82
18.72
18.13
18.72
17.67
16.91
18.57
18.66
18.66
Tables 6-4-1 and 6-4-2 show an average yoghurt consumption
growth rate of 20% and per capita consumption increase of 18%,
the difference being explained by population growth. In fact,
today, yoghurt is the most popular dairy product amongst the
younger population in the cities.

182
Price Analysis
Table 6-4-3 Estimated Yoghurt Price in Australia and China 1988-1992
Source: Field Research and personal communications (see Appendix 2. Ref. No. Ref. No. 2, 15, 2 6 and 40)
YEAR
1988
1989
1990 '
1991
1992
FARMGATE PRICE IN CHINA
(YUAN/TON)
731
818
915
1023
1145
YOGHURT WHOLESALE PRICE IN CHINA
(YUAN/TON)
3450
3859
4316
4828
5400
AUSTRALIAN EXPORT YOGHURT PRICE
(AUD/TON)
1987
2158
2214
2216
2500
AVE. ANNUAL EXCHANGE RATE
(YUAN/USD)
3.7220
4.7220
5.2220
5.3560
5.7662
AVE. ANNUAL EXCHANGE RATE
(AUD/USD)
1.1689
1.2651
1.2932
1.2900 •
1.4500
WHOLESALE YOGHURT PRICE IN CHINA
(USD/TON)
927
817
827
901
936
AUSTRALIAN YOGHURT EXPORT PRICES
(USD/TON)
1700
1706
1712
1718
1724
Table 6-4-3 shows that the significant difference in price
between the Australian exported product and locally made
Chinese one will remain more or less constant.
Opportunities for Export of Australian Products
The export of yoghurt to China would seem not to be a feasible
proposition due to transport costs and the time involved.
However, the newly developed extended life yoghurt with a
shelf life of 10 weeks is a possible export product.
In fact, joint ventures using Australian technology, formulae
and various additives, would be the most effective route to
penetrate the Chinese market.

183
6.5 Ice-cream
The Australian Dairy Corporation describes ice-cream as a food
and hence its production is closely regulated by law. It must
meet exacting standards for texture, body, colour, flavour and
taste.
According to these laws, the basis of ice cream must be dairy
products (whole milk, cream, skim milk, milk fat) and it must
contain at least 10% milk fat. It may contain other wholesome
foods such as sugar or glucose. It may also contain permitted
stabilisers, colourings and flavourings. However, under
Australian law, these additives are very closely policed -
only those on the Government's permitted list can be used, all
others are automatically banned.
As well as ensuring not less than 10% milk fat, the rules also
require ice cream to contain at least 168 grams of food solids
per litre (Ice-cream Leaflet, Australian Dairy Corporation,
1989) .
Currently the demand for ice-cream is growing dramatically
showing a 50% increase in sales annually in China. This
additional consumption is most evident in Southern China.
There are some water-ice products with various fruit flavours
but these occupy only 10% of the market. They sell for 1
Yuan/Kg.

184
Products on the Market
Local
There are many kinds of local ice-cream products including
flavoured (chocolate, vanilla and fruit) in China. Several of
the larger local ice-cream producers add Swedish ice-cream
pre-mix to their product. The average cost of ice-cream is 3
Yuan/Kg.
Imported
There are no imported brands in the local market place,
however, some imported ice-cream is available in the
international hotels. Some joint venture plants have been set
in Southern China e.g. with American and Swedish companies.
Their products retail at around 6 Yuan/Kg.
In addition, ice-blocks containing a small amount of milk are
widely available to the general populace. They cost less than
1.5 Yuan/Kg and occupy 80% of street sales.
Product Quality
China has a long history of ice-cream consumption compared
with other dairy products. The quality of local ice-cream is
reasonably good.
Consumer Profile
IntrodutrH nr,
Buyers are mostly teenagers, at present income levels, ice
cream is available to everyone, at least in the major cities

185
and medium sized towns. Home ice-cream consumption is limited
to those in the population who own refrigerators.
Method of Use
Ice-cream is enjoyed in the hot summer months, especially by
people in the streets and parks in their leisure hours. It is
reported that ice-cream sales are higher in winter because the
climate facilitates street sales.
Home consumption is usually from 1 Kg plastic bags. These are
purchased from confectionary stores where the product is kept
at -18°C enabling it to be taken home by bicycle, a relatively
slow mode of transportation.
Consumer Knowledge of Product
Most of the Chinese have a limited knowledge of ice-cream,
because for many years the few products available have
remained virtually unchanged.
Product Preference
Taste preference is for rich, smooth and soft ice-cream
flavoured with either vanilla or chocolate. Note that green
tea ice-cream is currently being marketed in Japan, and it is
assumed that it would be most acceptable also in China (Rees,
1992, pp. 79-80).

186
Seasonality and Climate
As previously mentioned, there is some contention between
whether ice-cream sales increase in winter or summer. In
general, the Chinese believe ice-cream is advantageous to
their health in summer for its cooling properties. However,
climate facilitates sales in the winter months.
Packaging
There are two kinds of packaging of domestic ice-cream in
China: 1 Kg plastic bags and 1 Kg plastic buckets. Consumers
prefer the plastic bag packs because they are cheaper. Joint
venture ice-cream products are only packed in 500g plastic
buckets. Street sales are based on corn cones.
A estimate of the price of ice-cream in China in 1992 is shown
in Table 6-5-3. Please note that these figures are only
estimates based on field research.

187
Market Analysis
Table 6-5-1
Source:
Estimated total volume of Ice-cream Consumption in China 1978-1992 Field Research and personal communications (see Appendix 2. Ref. No. 2, 3, 14, 17, 25 and 37)
YEAR
1978
1979
1980
1981
1982
1983
1984
1985
1986
1987
1988
1989
1990
1991
1992
TOTAL DAIRY CONSUMPTION ('000 TON)
997
1190
1380
1561
2465
2588
3100
3501
4000
4137
4274
4471
4875
4914
5332
GROWTH RATE (X)
19.36
15.97
13.12
57.91
4.99
19.78
12.94
14.25
3.43
3.31
4.61
9.04
0.80
8.50
ICE-CREAM CONSUMPTION ('000 TON)
2.78
3.34
4.01
4.81
5.77
6.92
8.31
9.97
11.96
14.36
17.23
20.67
24.81
29.77
35.72
MILK EQUIVALENT ('000 TON)
2.78
3.34
4.01
4.81
5.77
6.92
8.31
9.97
11.96
14.36
17.23
20.67
24.81
29.77
35.72
GROWTH RATE (X)
20.00
20.00
20.00
. 20.00
20.00
20.00
20.00
20.00
20.00
20.00
20.00
20.00
20.00
20.00
MARKET SEGMENT (X)
0.28
0.28
0.29
0.31
0.23
0.27
0.27
0.28
0.30
0.35
0.40
0.46
0.51
0.61
0.67
Tables 6-5-1 and 6-5-2 show ice-cream consumption in China
will increase by 20% annually reflected in an 18% increase in
per capita consumption. This is similar to the estimated
growth rate in sales of yoghurt by the Chinese dairy authority
experts such as Mr. Zhou Ding Nian (ex-director of China's
National Dairy Association) in Beijing (see Appendix 2) since
there are no official data available at the moment.

188
Table 6-5-2 Estimated Ice-cream Consumption per Capita in China 1978-1992
Source: Field Research and personal communications (see Appendix 2 Ref. No. 2, 3, 14, 17, 25 and 37)
YEAR
1978
1979
1980
1981
1982
1983
1984
1985
1986
1987
1988
1989
1990
1991
1992
ICE-CREAM CONSUMPTION ('000 TON)
2.78
3.34
4.01
4.81
5.77
6.92
8.31
9.97
11.96
14.36
17.23
20.67
24.81
29.77
35.72
GROWTH RATE (X)
*
20.00
20.00
20.00
20.00
20.00
20.00
20.00
20.00
20.00
20.00
20.00
20.00
20.00
20.00
POPULATION (MILLION)
958.10
969.01
981.24
1006.91
1020.18
1029.85
1040.04
1051.27
1067.93
1079.47
1100.86
1130.00
1143.61
1156.57
1169.67
ICE-CREAM CONSUMPTION PER CAPITA (G)
2.90
3.45
4.08
4.77
5.66
6.72
7.99
9.48
11.20
13.30
15.65
18.29
21.69
25.74
30.54
GROWTH RATE (X)
18.65
18.50
16.94
18.44
18.87
18.82
18.72
18.13
18.72
17.67
16.91
18.57
18.66
18.66
Estimated figure by the Chinese dairy expert - Mr. Zhou Ding Nian (see Appendix 2, Ref. No. 4)
Price Analysis
Table 6-5-3 Comparison of Estimated Ice-cream Prices (USD) in Australia and China 1988-1992
Sources: Field research and personal communications (see Appendix 2 Ref. No. 2, 3, 14, 17, 25 and 37)
YEAR
1988
1989
1990
1991
1992
FARMGATE PRICE IN CHINA
(YUAN/TON) *
731
818
915
1023
1145
ICE-CREAM WHOLESALE PRICES IN CHINA
(YUAN/TON)
1342
1501
1679
1877
2100
AUSTRALIAN ICE-CREAM WHOLESALE
PRICE (AUD/TON)
351
383
395
397
450
AVE. ANNUAL EXCHANGE RATE
(YUAN/USD)
3.7220
4.7220
5.2220
5.3560
5.7662
AVE. ANNUAL EXCHANGE RATE
(AUD/USD)
1.1689
1.2651
1.2932
1.2900
1.4500
WHOLESALE ICE-CREAM PRICE IN CHINA
(USD/TON)
361
318
321
351
364
AUSTRALIAN WHOLESALE ICE-CREAM PRICE
(USD/TON)
300
303
305
308
310
Table 6-1-3, p. 152.
Prices shown in Table 6-5-3 predict an increased trend in cost
in China, while the Australian cost, which is lower, will
remain relatively stable.
189
Opportunities for Export of Australian Products
It would not be feasible to export Australian manufactured
ice-cream to China under present or projected economic
scenarios. Ice-cream pre-mix, however, has an excellent
potential in the Chinese market. It has every advantage:
excellent quality, ease of transport, minimal storage
requirement and elementary production technique.
Flavours may be added to suit local tastes and quality can be
varied depending on milk/water additions to suit consumer
income.
Already, joint venture projects are also very successful. They
are today, as mentioned, the easiest method of accessing the
Chinese market.
UHT soft serve and UHT yoghurt soft serve are also potential
export earners for Australia.
6.6 Cheese
Cheese is milk in concentrated form. It takes about 10 litres
of milk to make 1 kg of cheese. A large percentage of milk is
moisture and this must be removed before cheese is made from
the remaining solids. Although each variety of cheese is made
in a special way, there are basic steps common to all cheese
making. The milk is pasteurised, warmed and a starter culture

190
added to turn lactose into lactic acid. Rennet is added to set
the milk into a curd, which is then cut into small blocks to
release the Whey. The curd is manipulated to develop the
characteristics of a chosen variety, shaped, pressed and left
to mature.
Cheese provides a large number of daily nutrient needs in some
countries. It provides more protein than the same weight of
meat, fish or eggs. It is highly digestible and contains one
third water, one third protein and one third fat plus minerals
and vitamins (ADC, Dairy Compendium, 1989).
Currently, there is no real demand for cheese so the majority
of people are unaware of price changes. Demand centres on the
fast food industry and is increasing, but so is consumer
awareness and a preference for fast foods. So the demand is
quite elastic.
Products on the Market
Local
The only locally produced cheese type on the Chinese market is
Cheddar. This is available only in the major cities and then
only in a few stores. There is very little information
available about cheese in China. Two major centres are the
Shanghai Dairy Research and Training Centre and the Huaguan
Dairy Factory in Beijing. The latter is the largest and the
major supplier for the Pizza Hut and Macdonalds chains.

191
Different varieties of European cheeses are being produced in
some dairy research institutes in China but are not yet on the
market.
Imported
Almost all internationally known cheeses are available in
certain stores for Europeans in the large capital cities.
Industrial
All industrial Cheddar cheese is locally produced. This is
used in the rapidly expanding fast food industry (Macdonalds,
Pizza Hut).
Product Quality
The locally produced Cheddar cheese lacks subtlety, but is
reasonably good in both taste and texture.
Consumer Profile
Introduction
In China, very few people eat cheese. Only those returning
from overseas postings have acquired this habit.
Method of u-.-
Cheese is used almost exclusively in the fast food industry.
Consumpr Knowledge of Product
Most Chinese people have very limited ideas if any about
cheese.

192
Product Preference
In the future, if cheese becomes more widely acceptable by the
Chinese, they would probably prefer an unsalted variety with
high moisture content.
Seasonality and Climate
These factors do not affect the fast food industry.
Packaging
Industrial cheese, prior to packaging, is sliced or shredded,
then delivered in bulk to the fast food outlets.
Market Analysis
Table 6-6-1 Cheese Consumption in China 1978-1992 Source: . Statistical Yearbook for Asia and the Pacific
(1990) United Nations and Various Issues . Field Research and personal communications (see Appendix 2. Ref. No. 2, 3 and 7)
YEAR
1978
1979
1980
1981
1982
1983
1984
1985
1986
1987
1988
1989
1990
_ 1991
1992
TOTAL DAIRY CONSUMP. ('000 TON)
997
1190
1380
1561
2465
2588
3100
3501
4000
4137
4274
4471
4875
4914
5332
GROWTH RATE (X)
19.36
15.97
13.12
57.91
4.99
19.78
12.94
14.25
3.43
3.31
4.61
9.04
0.80
8.50
CHEESE CONSUMP. ('000 TON)
26.70
31.33
47.31
58.25
63.44
144.94
127.07
134.99
80.38
91.72
95.73
89.16
79.03
75.41
MILK EQUIVALENT ('000 TON)
159
187
282
347
378
863
757
804
479
546
570
547
484
462
GROWTH RATE (X)
17.33
51.01
23.12
8.92
128.47
-12.33
6.23
-40.45
14.11
4.38
-4.12
-11.36
-4.59
MARKET SEGMENT (X)
73.65
61.82
51.88
43.55
36.55
30.68
25.75
21.61
18.14
15.22
12.78
12.75
11.21
9.86
8.67

193
Table 6-6-2 Cheese Consumption per Capita in China 1978-92 Source: Statistical Yearbook for Asia and the Pacific
(1990) United Nations various issues Field Research and Personal Communication (see Appendix 2. Ref. No. 2, 3 and 7)
YEAR
1978
1979
1980
1981
1982
1983
1984
1985
1986
1987
1988
1989
1990
1991
1992
CHEESE CONSUMP. ('000 TON)
10.52
26.70
31.33
47.31
58.25
63.44
144.94
127.07
134.99
80.38
91.72
95.73
89.16
79.03
75.41
GROWTH RATE (X)
153.79
17.33
51.01
23.12
8.92
128.47
-12.33
6.23
-40.45
14.11
4.38
-6.87
-11.36
-4.59
POPULATION (MILLION)
958.10
969.01
981.24
1006.91
1020.18
1029.85
1040.04
1051.27
1067.93
1079.47
1100.86
1130.00
1143.61
1156.57
1169.67
CHEESE CONSUMP. PER CAPITA (G)
10.98
27.55
31.93
46.99
57.10
61.60
139.36
120.87
126.41
74.46
83.32
84.72
77.96
68.33
64.47
GROWTH RATE (X)
150.93
15.87
47.16
21.52
7.89
126.23
-13.27
4.58
-41.09
11.89
1.68
-7.97
-12.35
-5.66
Note: The figures in Table 6-6-2 significantly veer up and
down. The author believes that there must have been
some calculation errors from the UN data.
Alternatively, different methods have been used by
different people to calculate statistics. (Please
see p. 151).

194
Price Analysis
Table 6-6-3
Source:
Comparison of Estimated Cheese Prices (USD) in Australia and China 1988-1992 Statistical Yearbook for Asia and the Pacific United Nations various issues Field Research and personal communications (see Appendix 2. Ref. No. 2, 3 and 7)
YEAR
1988
1989
1990
1991
1992
FARMGATE PRICES IN CHINA
(YUAN/TON)
731
818
915
1023
1145
CHEESE WHOLESALE PRICES IN
CHINA (YUAN/TON)
6697
7489
8378
9370
10481
AUSTRALIAN CHEESE EXPORT PRICE
(AUD/TON)
2732
2999
3461
3203
3317
AVE. ANNUAL EXCHANGE RATE
(YUAN/USD)
3.7220
4.7220
5.2220 j
5.3560
5.7662
AVE. ANNUAL EXCHANGE RATE
(AUD/USD)
1.1689
1.2651
1.2932
1.2900 •
1.4500
WHOLESALE CHEESE
PRICES IN CHINA
(USD/TON)
1799
1586
1604
1749
1818
AUSTRALIAN CHEESE EXPORT PRICE
(USD/TON)
2337
2371
2676
2483
2288
Table 6-6-3 would indicate that locally produced Chinese
Cheddar is cheaper than imported cheese at present. It must be
noted that most of the Chinese population tried cheese for the
first time only when the Western fast food industry entered
the Chinese market five years ago. Also that the above figures
are unreliable and cannot show the real price of industrial
cheese production.
Volume and Value of Australian Exports to China
Table 6-6-4 Volume and Value of Australian cheese Exports to China 1988-1992
Source: Field Research and personal communications (see Appendix 2. Ref. No. 2, 3 and 7)
YEAR
1988
1989
1990
1991
1992
AUSTRALIAN CHEESE VOLUME EXPORTED TO
CHINA (TONNE)
5.657
2.025
17.07
0.909
17.543
CHEESE EXPORT PRICE FROM AUSTRALIA
(AUO/TONW)
2732.00
2999.00
3461.00
3203.00
3317.00
AVE. ANNUAL EXCHANGE RATE
(AUD/USD)
1.1689
1.2651
1.2932
1.2900
1.4500
VALUE OF EXPORTED BUTTER
(AUD '000)
15
6
59
3
58
VALUE OF EXPORTED CHEESE
(USD '000)
13
5
46
2
40
*

195
Q CM
in ID
CM o> <T> H 1 CO CO cn H
CD
c M 3 0 X}
Id r~ fl QJ •H !K A o 0 •p
n 4J
u 0
s-
W
m cn cn H
v
o Q w <
0 n <u a> A o a id
.. C 0 •H
10 -H > •H
•H Q H id + J M •P
m 3
^ O a X
tf H
vo 1 V0
01 U 3
• •
cu 0 M
tn 3 •H 0 fa CO

196
Opportunities for Export of Australia Products
There is a market for both sliced and shredded Cheddar cheese
in China, for the fast food industry. It is quite possible
also that sliced Cheddar cheese could be introduced to the
domestic market for use in sandwiches if bread is accepted as
a daily food item. This would depend on a considerable
westernisation of Chinese eating habits and a successful
marketing program. Soft cheese could also become acceptable
for desserts e.g. cheesecake and "fromage frais". Price would
be a major factor in the success of this (ADC, Dairy
Compendium, 1989) .
6.7 Whey Powder
Whey is the serum or watery part of milk that separates from
the curds in the process of making cheese. It is the largest
by-product of the Australian dairy industry, and used to be
one of the most troublesome by-products produced by any
industry. It is now having considerable impact and value as a
food ingredient.
There are two kinds of whey:
. sweet, the effluent from whole milk used to make natural
or processed cheeses such as Cheddar; and
. acid, the effluent from skim milk which is used to make
cottage cheese.
Sweet whey has a pH of 5 to 7 and is relatively easy to spray

197
dry. Acid whey has a pH between 4 and 5, possesses a pungent
smell, and is more difficult to dry. There is little
difference between the dried whey powders produced from sweet
and acid whey (ADC, Dairy Compendium, 1989).
These is no appropriate substitute for whey powder at the
moment. No other product approaches the high calorific level
of lactose contained in whey. For this reason it is used in
infant formulae and because of the single' child policy in
China parents are willing to pay almost anything to provide
their child with the best of everything. This results in
strict inelasticity.
Products on the Market
Local
China produces 150,000 tons of cheese and theoretically should
obtain roughly 80,000 tons of whey powder. However, because
this cheese is mainly produced in the pastoral regions, and
the technological and transportation infrastructure is totally
inadequate, there is no way that whey powder can be available
for processing into other products on the domestic market.
Industrial
There are three kinds of whey powder on the market and all are
used industrially. They are as .follows:
. non-hygroscopic whey powder (ash content < 8.5%). This is
used as a milk replacer for piglets. China produces over
300 million pigs annually and they require approximately

198
200,000 tons of this powder. If the powder is available
at an acceptable price on the international market,
suckling of piglets is interrupted after a week or ten
days and the milk replacer used. By this method, the
breeding program can be accelerated.
. 40% de-mineralised whey powder (ash content < 5.5%). This
is a food additive used in the bakery, confectionary and
sweets industries. All of these industries are currently
undergoing rapid expansion in China and' hence the market
for D-40 whey powder is very strong. The Chinese have
readily accepted the use of this powder in these products
which include chocolate and ice-cream.
. 70% de-mineralised whey powder (ash content < 3%) . This
is an ingredient of infant formula. All factories
producing this formula use imported whey powder due to
the scarcity of the domestic product. It retails at about
30 Yuan/Kg. China's population growth rate is now 2-3%
annually which means at least 20 million new babies every
year. Current market demand for D-70 whey powder solely
for infant formula stands at 20,000 tons annually.
Sources of imported whey powder include: the US, Australia,
Finland, Holland, Denmark, New Zealand, the CIS and Poland.
Besides the aforementioned, there are some fully imported
infant formula mixes on the market. These retail at about 45
¥uan/Kg and brands include: Lactogen, Neslac, SMA and
Prodislac.

199
Product Quality
Imported industrial whey powders exhibit different qualities.
Some of them are very white in colour and some are cream which
is preferred by the Chinese. Some of the powders are very
fine, some more coarse; of these the latter is better because
it is has been subjected to a superior method of drying.
The powders also exhibit differences in solubility, the more
easily dissolved ones being preferred. Ash content also varies
from 2-9% and the lower the ash content, the higher the grade
of powder. The various infant formulae show the same
variations as mentioned above, except that ash content must be
less than 3%.
Consumer Profile
Introduction
The major consumers of whey powder are local Chinese factories
and joint venture plants. Although the majority of the
factories are equipped with testing facilities, all imports
must be sampled by China's Commodity Inspection Bureau on
arrival in the country.
Method of Use
Whey powder is used as a component of:
. stockfeed for piglets;
. bread, confectionary, sweets and ice-cream to provide a
milky taste; and
. infant formulae

200
Consumer Knowledge of Product
The technical staff of the local factories and joint venture
plants are well-versed in the requirements for whey powder
despite the brief period (5-10 years) of this product's
exposure on the market. Many young couples purchase infant
formula for their children believing it to be health
promoting.
Product Preference
The Chinese prefer whey powder imported from Australia, New
Zealand, Holland, the USA and Canada to that of Poland and the
CIS because the product quality is uniform and the powder easy
to use.
Reiterating the preferences already mentioned, they are: cream
colour, coarse form and good solubility. With regard to infant
formulae as with many countries, there are conflicting factors
influencing choice of purchase e.g. some mothers will choose
the most expensive product, believing it to be the best,
others, on a lower income will choose the cheapest.
Seasonality and Climatic
Whey powder is used as a food ingredient in a broad spectrum
of products. The demand is constant and has been increasing
steadily over the past five years and shows no significant
influence by either seasons or climate.

201
Packaging
Most whey powders are sold in bulk and thus not packaged. They
are packed for transport in 25 Kg polyethylene-lined multi-
wall pinch bottom bags.
Market Analysis
Table 6-7-1 Estimated Whey Powder Consumption in China 1978-1992
Source: Field Research and personal communications (see Appendix 2. Ref. No. 1, 2, 14,. 20 and 30)
YEAR
1978
1979
1980
1981
1982
1983
1984
1985
1986
1987
1988
1989
1990
1991
1992
TOTAL DAIRY CONSUMP. ('000 TON)
997
1190
1380
1561
2465
2588
3100
3501
4000
41?7
4274
4471
4875
4914
5332
GROWTH RATE (X)
19.36
15.97
13.12
57.91
4.99
19.78
12.94
14.25
3.43
3.31
4.61
9.04
0.80
8.50
UHEY POUDER CONSUMP. ('000 TON)
2.85
• 3.44
4.04
4.62
7.37
7.82
9.47
10.82
12.50
13.07
13.65
16.24
17.90
18.25
20.01
MILK EQUIVALENT ('000 TON)
13
16
18
21
33
36
43
49
57
59
62
74
81
83
91
GROWTH RATE (X)
20.67
17.24
14.36
59.65
6.15
21.10
14.18
15.51
4.56
4.45
19.00
10.24
1.91
9.69
MARKET SEGMENT (X)
1.30
1.31
1.33
1.34
1.36
1.37
1.39
1.40
1.42
1.43
1.45
1.65
1.67
1.69
1.71
Tables 6-7-1 and 6-7-2 show a 9% increase in consumption of
whey powder in China over the past years. These growth rates
in sales of whey powder were estimated by the Chinese food
authority expert Mrs Mu Jing Ju (Chief director of China Food
Industry Supply and Marketing Co.) in Beijing (see Appendix 2)
since there are no official data available at the moment.

202
Table 6-7-2 Estimated Whey Powder Consumption per Capita in China 1978-1992
Source: Field Research and personal communications (see Appendix 2. Ref. No. 1, 2, 14, 20 and 30)
YEAR
1978
1979
1980
1981
1982
1983
1984
1985
1986
1987
1988
1989
1990
1991
1992
UHEY POUDER CONSUMP. ('000 TON)
2.85
3.44
4.04
4.62
7.37
7.82
9.47
10.82
12.50
13.07
13.65
16.24
17.90
18.25
20.01
GROWTH RATE (X)
20.67
17.24
14.36
59.65
6.15
21.10
14.18
15.51
4.56
4.45
19.00
10.24
1.91
9.69
POPULATION (MILLION)
958.10
969.01
981.24
1006.91
1020.18
1029.85
1040.04
1051.27
1067.93
1079.47
1100.86
1130.00
1143.61
1156.57
1169.67
UHEY POUDER CONSUMP. PER CAPITA (G)
2.98
3.55
4.11
4.59
7.23
7.60
•9.11
10.29
11.70
12.10
12.40
14.37
15.66
15.78
17.11
GROWTH RATE (X)
19.31
15.78
11.45
57.57
5.15
19.92
12.96
13.71
3.45
2.42
15.93
8.92
0.77
8.47
Price Analysis
Table 6-7-3 Comparison of Estimated Whey Powder Prices (USD) in Australia and China 1988-1992
Source: Field Research and personal communications (see Appendix 2. Ref. No. 1, 2, 14, 20 and 30)
YEAR
1988
1989
1990
1991
1992
FARMGATE PRICE IN CHINA
(YUAN/TON)
731
818
915
1023
1145
UHEY POUDER
UHOLESALE PRICE IN CHINA
(YUAN/TON)
1917
2144
2398
2682
3000
AUSTRALIAN UHEY POUDER EXPORT PRICE
(AUD/TON)
490
500
510
520
530
AVE. ANNUAL EXCHANGE RATE
(YUAN/USD)
3.7220
4.7220
5.2220
5.3560
5.7662
AVE. ANNUAL EXCHANGE RATE
(AUD/USD)
1.1689
1.2651
1.2932
1.2900
1.4500
UHOLESALE UHEY POUDER PRICE IN CHINA
(USD/TON)
515
454
459
501
520
AUSTRALIAN UHEY POUDER EXPORT PRICE
(USD/TON)
490
495
500
510
515

203
Table 6-7-3 and Figure 6-7-1 anticipate that there will be an
opportunity for Australia to export whey powder to China
because of the widening price differential of the product in
the two countries.
Volume and Value of Australian Exports to China
Table 6-7-4 Volume and Value of Australian Whey Powder Exports to china 1988-1992
Source: . Export Division, ADC, 1993, Melbourne, . Field Research and personal communications (see Appendix 2. Ref. No. 1, 2, 14', 20 and 30)
YEAR
1988
1989
1990
1991
1992
VOLUME OF AUSTRALIAN UHEY POUDER EXPORTED TO CHINA (TONHO
528.5
912
462.604
AUSTRALIAN UHEY POUDER EXPORT PRICE (AUD/TONWj
510.00
520.00
530.00
AVE. ANNUAL EXCHANGE RATE (AUD/USD)
1.1689
1.2651
1.2932
1.2900
1.4500
VALUE OF UHEY -POUDER EXPORTS (AUD '000)
0
0
270
474
245
VALUE OF UHEY POUDER EXPORTS (USD '000)
0
0
208
368
169

204
a a o r
a o
D O CD
•
o D D CO
a a in
a a
CM as I o CA cn H
id a •H XX
CD C ^ 3 0
O X
0 H OJ
•P s m •P
M 0
•» m 0>
0»<n X W
u ai TJ
H
*t
u Q fr < 0 &<
«t
>iC 0) Xi *
fi id •H
rH
0 •H co -H > •H
Q
id -P M P m 3
^ 0 & X
*C w
H 1 r-I vo a) u § •H
• • . 0
' 3 0
PM W

205
Opportunities for export of Australian Products
In the long term, China will continue to import whey powder
because of its very small national cheese production. Major
opportunities thus exist and many Australian dairy companies
have successfully entered the market over the last 6-7 years.
The market for infant formula is likewise very promising and
there is currently some room for new suppliers.
6.8 Sweetened Condensed Milk
Sweetened condensed milk is milk with part of the water
removed and sugar added, to act as a preservative and offset
the need for sterilisation. It will keep indefinitely without
refrigeration in a sealed can. Sweetened condensed milk
contains all the food value of whole milk in a more
concentrated form plus added sugar (ADC, Dairy Compendium,
1989) . The demand for the product is decreasing and it is
thought will eventually be completely replaced by milk powder.
Products on the Market
Local
There are a number of small factories producing sweetened
condensed milk in China. It is a product which has gone out of
fashion, but one which is simple to make and has an excellent
storage life. Today not many Chinese in urban areas consume
this product.

206
Imported
No data was available on sweetened condensed milk imports
although some sources estimate the volume imported in 1986 to
have been 11,800 tons (Rees, 1992, pp. 79-80).
Product Quality
The quality of the local sweetened condensed milk is good and
has been being produced for several decades.
Consumer Profile
Introduction
Most consumers are in village areas as the product is out of
fashion in the cities. People from Southern China consume more
condensed milk than those from the North.
Method of Use
Condensed milk serves the same purpose as milk powder, being
recombined for use as liquid milk for drinking.
Product Preference
The product is very sweet and non palatable to many Chinese.
However, those who do enjoy it prefer the very sweet and very
viscous types.
Seasonality and Climate
Previously, sweetened condensed milk served to eliminate
seasonal production variations. Surplus milk in high

207
production time was converted into condensed form and used to
boost low production periods.
Packaging
The product is packaged in 100-4OOg glass bottles with screw
tops.
Market Analysis
Table 6-8-1 Estimated Condensed Milk Consumption in China 1978-1992
Source: Field Research and personal communications (see " Appendix 2. Ref. No. 1, 2, 33 and 36)
YEAR
1978
1979
1980
1981
1982
1983
1984
1985
1986
1987
1988
1989
1990
1991
1992
TOTAL DAIRY CONSUMP. ('000
TON)
997
1190
1380
1561
2465
2588
3100
3501
4000
4137
4274
4471
4875
4914
5332
GROWTH RATE (X)
19.36
15.97
13.12
57.91
4.99
19.78
12.94
14.25
3.43
3.31
4.61
9.04
0.80
8.51
CONDENSED MILK CONSUMP. ('000
TON)
125.30
130.32
135.53
140.95
146.59
152.45
158.55
164.89
171.49
178.35
185.48
192.90
200.62
208.64
216.99
MILK EQUIVALENT ('000 TON)
125.30
130.32
135.53
140.95
146.59
152.45
158.55
164.89
171.49
178.35
185.48
192.90
200.62
208.64
216.99
GROWTH RATE (X)
4.01
4.00
4.00
4.00
4.00
4.00
4.00
4.00
4.00
4.00
4.00
4.00
4.00
4.00
MARKET SEGMENT (X)
12.57
10.95
9.82
9.03
5.95
5.89
5.11
4.71
4.29
4.31
4.34
4.31
4.12
4.25
4.07

208
Table 6-8-2 Estimated Condensed Milk Consumption per Capita in China 1978-1992
Source: Field Research and personal communications (see Appendix 2. Ref. No. 1, 2, 33 and 36)
YEAR
1978
1979
1980
1981
1982
1983
1984
1985
1986
1987
1988
1989
1990
1991
1992
CONDENSED MILK CONSUMP. ('000 TON.)
125.30
130.32
135.53
140.95
146.59
152.45
158.55
164.89
171.49
178.35
185.48
192.90
200.62
208.64
216.99
GROWTH RATE (X)
4.01
4.00
4.00
4.00
4.00
4.00
4.00
4.00
4.00
4.00
4.00
4.00
4.00
4.00
POPULATION (MILLION)
958.10
969.01
981.24
1006.91
1020.18
1029.85
1040.04
1051.27
1067.93
1079.47
1100.86
1130.00
1143.61
1156.57
1169.67
CONDENSED MILK CONSUMP. PER CAPITA (G)
130.78
134.49
138.12
139.98
143.69
148.03
152.45
156.85
160.58
165.22
168.49
170.71
175.43
180.40
185.51
GROWTH RATE (X)
2.84
2.70
1.35
2.65
3.02
2.98
2.89
2.38
2.89
1.98
1.32
2.76
2.83
2.84
Tables 6-8-1 and 6-8-2 indicate a possible market segment for
condensed milk of 2.84% in the year 2000. The growth rate is
predicted to reach 4% annually (China Ministry of Agriculture
(MOA), 1988, Beijing). The growth rate was also estimated in
sales of condensed milk by the Chinese specialised dairy
trading experts such as Mrs. Li Zhi Ru and Mr. Zhu Pin Xian
(executive directors of Cenoway Ltd. Co.) in Beijing (see
Appendix 2. Ref. No. 2) since there are no official data
available at the moment.
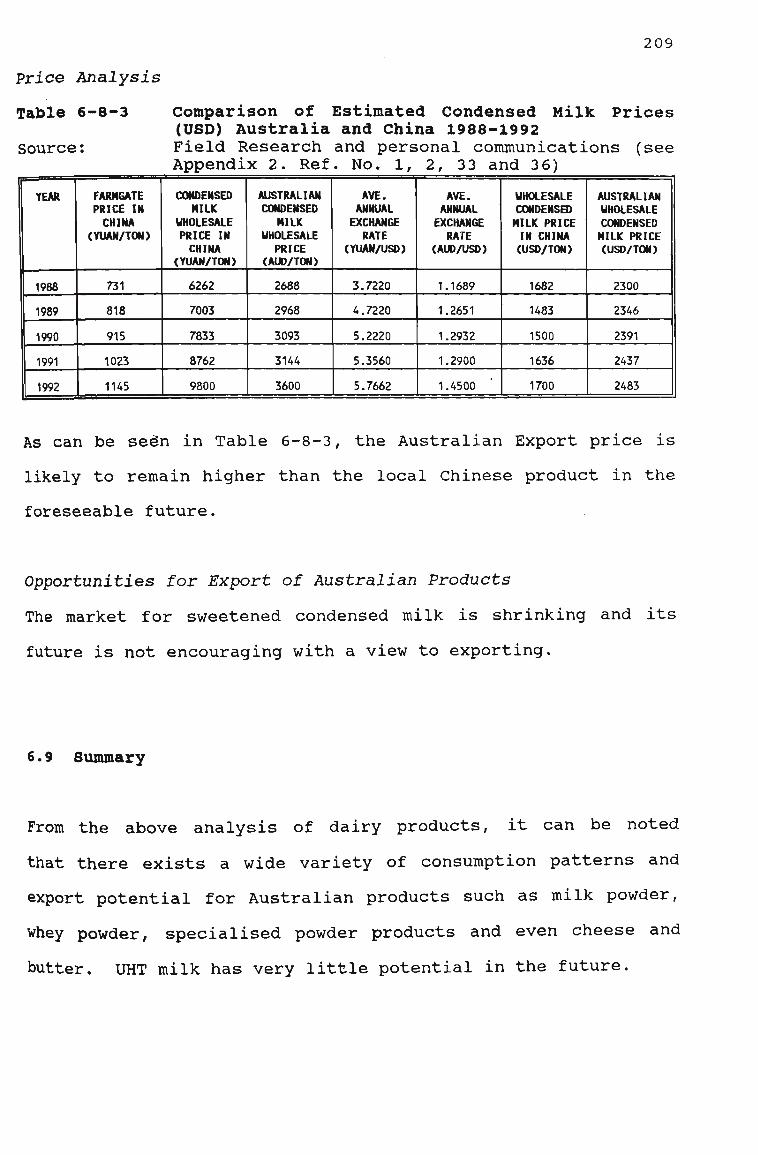
209
Price Analysis
Table 6-8-3 Comparison of Estimated Condensed Milk Prices (USD) Australia and China 1988-1992
Source: Field Research and personal communications (see Appendix 2. Ref. No. 1, 2, 33 and 36)
YEAR
1988
1989
1990
1991
1992
FARMGATE PRICE IN CHINA
(YUAN/TON)
731
818
915
1023
1145
CONDENSED MILK
UHOLESALE PRICE IN CHINA
(YUAN/TON)
6262
7003
7833
8762
9800
AUSTRALIAN CONDENSED
MILK UHOLESALE
PRICE (AUD/TON)
2688
2968
3093
3144
3600
AVE. ANNUAL EXCHANGE RATE
(YUAN/USD)
3.7220
4.7220
5.2220
5.3560
5.7662
AVE. ANNUAL EXCHANGE RATE
(AUD/USD)
1.1689
1.2651
1.2932
1.2900
1.4500
UHOLESALE CONDENSED MILK PRICE IN CHINA (USD/TON)
1682
1483
1500
1636
1700
AUSTRALIAN WHOLESALE CONDENSED MILK PRICE (USD/TON)
2300
2346
2391
2437
2483
As can be see"n in Table 6-8-3, the Australian Export price is
likely to remain higher than the local Chinese product in the
foreseeable future.
Opportunities for Export of Australian Products
The market for sweetened condensed milk is shrinking and its
future is not encouraging with a view to exporting.
6.9 Summary
From the above analysis of dairy products, it can be noted
that there exists a wide variety of consumption patterns and
export potential for Australian products such as milk powder,
whey powder, specialised powder products and even cheese and
butter. UHT milk has very little potential in the future.

7
DISCUSSION
"The public buys its options as it buys its meat, or takes in its milk, on the principle that it is cheaper to do this than to keep a cow. So it is, but the milk is more likely to be watered."
Samuel Butler (1835-1902) "Life and Love"

211
7.1 China's Dairy Industry - Factors Influencing Consumption
and Import Demand
The origin of the foreign trade of China is shrouded in the
mists of remotest antiquity. As early as the beginning of the
classical Zhou Dynasty (B.C. 1122-249) there were eight
neighbouring foreign nations whose merchants came to Canton
(Guang Zhou) bringing their goods to exchange for products of
the Celestial Empire (See, 1970, p. 15).
From the works of Pliny and Ptolemy we know of active
commercial intercourse between Alexandria and the Far East for
several hundred years before Christ, and Chinese silks reached
the Roman Empire by way of the Central Asian caravan routes
which were later followed by the Polo brothers and their
nephew, Marco (Morse, 1966, p. 270) .
Originally the Chinese were not exclusive but on the contrary
assumed a liberal attitude toward foreign trade. They welcomed
embassies from neighbouring countries and dispatched missions
abroad to foster trade and other relations (Morse, 1966, p.
270). The portals were thrown wide open. Foreigners were
admitted everywhere and even high official positions were
available to strangers from afar; witness Marco Polo who is
said to have been the Governor General of Yang Zhou.
The whole policy was one of "open door" in the truest sense of
the term. However, the situation was entirely transformed at

212
the beginning of the sixteenth century with the arrival of the
Europeans. Events compelled China to abandon her original
attitude and replace it by a rigid policy of surveillance and
exclusion (Morse, 1966, p. 270). In recent times, after 40
years of relative isolation from the rest of the world, China
once again has an open door policy. This comes at a time when
a new imperialism of political control through economic power
is occurring. A tide of private-enterprise ideology swept the
world in the 1980s, from the shores of Margaret Thatcher's
Britain and Ronald Reagan's US to Mikhail Gorbachov's Soviet
Union and on into Asia (Rowley, 1992, p. 66).
China too was affected and current elder statesman Mr. Deng
Xiao-ping's plans include:
. the creation of several "Hong Kongs" along China's coast;
. a cut of one-third in the 3 million strong armed forces;
. controls being lifted on most agricultural commodities,
including staple foodstuffs such as grain and oil; and
. management and other reforms being introduced to force
loss-making enterprises to be responsible for their
bottom-line performance (Rowley, 1992, p. 66).
He warns recalcitrant conservatives that "whoever does not
reform will have to leave the stage". Deng Xiao-ping aims to
make China rich. With GNP growth climbing towards double
digits, healthy foreign exchange reserves and an RMB 1
trillion (USD 180 billion) cushion of bank deposits, some say
the only thing keeping China's economic policy makers awake at

213
night is the spectre of inflation which could undermine rising
living standards (Kaye, 1992, p. 66).
inflation must indeed by one of the major factors influencing
Chinese government policy, which Cyril Lin, an Oxford
economist, terms "open-ended reform". The driving force in
this "method" of experiment, diversity and decentralisation
has been competition: between regions, firms, foreign
investors and styles of industrial organisation (Rohwer, The
Titan Stirs, 1992, p.18).
The fact that what is occurring in China today has never taken
place before, namely the rapid transition from a centrally
planned economy to a free market one in a vast country with
until recently a traditional culture of Confucianism, would
indicate that application of the traditional Western
parameters to assess consumption and import demand for
products - let alone dairy products which do not form part
of traditional Han Chinese diets - is fraught with
difficulties.
A significant problem in any attempt at analysis is the
unreliability of some of the statistical data for China,
another is the enormous size of the country and its population
such that most analysts focus on only one province in any
attempt to carry out a market feasibility study.

214
It must also be borne in mind that separating out demand for
individual dairy products is complicated by the fact that milk
powder and butter in China are used for the liquid
recombination milk sector. The amount used in this fashion is
seasonally affected and involves EC subsidies to the extent of
a virtual monopoly. Product demand is also influenced in
China at the present stage by the development of new Western
industries such as the fast food industry. Butter and cheese
consumption for example have increased in relation to this
development.
Using the previously mentioned model (Figure 1-4-1) each of
the factors is considered. Firstly factors influencing
consumption. These include trends in per capita income,
income distribution, income elasticity of demand, taste
preferences, population and relative prices to consumers.
Trends in per capita income: There is a very strong link
between national income and consumer demand. The World Bank's
published GDP per capita for China in 1990 was USD 370. This
figure has been disputed and, for example, Ma and Garnaut
(1992, pp. 3-7) argue that the figure should be increased by a
factor of three (e.g. to USD 1110). Another unconfirmed
estimate calculated on the basis of PPP (purchasing power
parity) puts China's 1990 GDP per capita at USD 1950. These
figures differ enormously but whichever ones are taken into
account the trend in per capita income is upwards which
impacts in a positive way on consumption.

215
To obtain accurate figures for income distribution in China in
the current transitional phase is almost impossible. It is
known that the distribution of income and wealth in an economy
affects the overall demand for goods and services. It has
been suggested that an increase in the proportion of national
income going to people on lower incomes will increase national
demand by a greater amount than if it went to those on higher
incomes (Bennett 1992, p.240). In China, many factors are
involved which affect people's income e.g. the different
opportunities in urban and rural areas and the different
productivity of different provinces. For example China's
richest province, Jiangsu, has a total productivity 67 times
greater than the poorest, Tibet (Sivin et a. 1988, p.108).
Within rural households, the proportion of middle income (200
to 500 RMB p.a.) almost doubled between 1980 to 1986. In 1987
wages were apportioned as follows:
Agricultural workers 98.08 yuan p.a.
Manufacturing industry workers 118.08 yuan p.a.
Construction workers 13 6.08 yuan p.a.
Transport and communication workers 133.67 yuan p.a.
(UN Statistical Yearbook for Asia and the Pacific 1990 p.87)
More recently the population drift from rural to urban areas,
the establishment of more Special Economic Zones, and the
relative freeing up of the economy including the farming
sector are but a few of the factors which would make more
recent figures difficult to obtain.

216
Studies carried out on income elasticities of demand with
regard to milk indicate that this is very high (1.62)
especially in the cities (CNSB, Urban Statistics Yearbook,
1987). This would be anticipated as income elasticity of
demand varies with income level which is increasing. In China
today as the people's income increases, they want to consume
milk and already demand is much higher than supply. Likewise
for cheese, due to the development of the fast food industry
demand is quite elastic.
It is a well established fact that food items enjoy some
increased demand when the economy grows but proportionately
not as much as the growth of average incomes (Bannock et al.
1987, p.196). This does not apply to China at present because
demand for milk outstrips supply.
In the dairy industry there are significant changes in taste
preference which occur over time and which reduce consumption
of some products and increase production of others. If there
were adequate milk supply at affordable prices the Chinese
would currently show a preference for milk with a high fat
content.
With regard to product preference, the widening range of dairy
products is changing the pattern of milk consumption towards
higher value-added products such as yoghurt. However,
detailed calculations on the possible market for diversified

217
product are unavailable at this point in time. In general,
milk powder is preferred to liquid milk. This is, however,
not a preference in the usual Western sense but one based on
the fact that milk powder has a healthy image and
transportation is easier.
There is a preference for foreign yoghurt because of the
reputation of foreign companies. This reflects product
novelty and possibly snob factor as Chinese stirred yoghurt is
an excellent^ product, a fact frequently remarked upon by
foreigners.
There are also geographical and climatic effects on
consumption. Dairy consumption per capita varies in the three
regions already described (urban, rural pastoral and rural
agricultural) being much higher by a factor of three in the
cities and rural pastoral regions than in the rural
agricultural areas. The market for dairy products is chiefly
concentrated in the cities where the income level is highest.
Consumption in the rural pastoral regions is by minority
populations which are self-sufficient.
The total dairy product consumption in 1987 was on average
3.83 Kg per capita. Regional variation included 179.41 Kg in
Inner Mongolia, 95 Kg in Tibet and 45 Kg in Qinghai, all with
considerable minority populations. The provincial capitals of
these provinces (Hohhot, Lhasa and Xining) are for this reason
not recipients of the free EC or UN milk programs.

218
Climatic conditions are also pertinent to consumption, e.g.
temperature leads to a higher consumption of yoghurt and ice
cream in southern China whereas the increased consumption of
sweetened condensed milk in the same reagion is due to high
humidity and ease of product storage.
Population growth is an important factor influencing economic
growth. It has two effects - it provides labour and human
talent thus adding to GNP, but it is also the main charge on
GNP. As mentioned, the population of China is the largest in
the world at 1.143 billion in 1990. Six municipalities and
provinces (including Beijing) have a population density
exceeding 500 persons per square kilometre (DFAT, China Brief
1991, p.7) . Even excluding the 80 per cent of China's
population which is classed as rural the market potential
opportunities are enormous. However, to many, population
growth is a spectre because when population increases faster
than GNP, real income per head falls. Population also
contributes to pollution, congestion and exploitation of non
renewable resources.
Since 1984 China has had an official "one-child policy" which
should result in a slow decline in growth rate. However annual
growth rate of the population in 1989 was 2%, markedly higher
than the 1.1% for the previous year (UN Statistical Yearbook
for Asia and the Pacific 1990, p.78). One estimate for
average rate of increase over the period 1990-1995 is 1.43%
(UN Population Fund, 1992). Life expectancy is 69 years and

219
taking into account all these figures there will be another
180 million people added to the labour force between now and
2000 (Rohwer, The Titan Stirs, 1992, p.28). This coupled with
the negative environmental issues poses major problems for the
Chinese government and will impact on allocation of land for
agriculture and capacity to feed the population.
Projected population figures from 1980 to the year 2000
indicate not only a growth in numbers but a marked change in
age distribution. In 1980 the percentage of under 15 year-
olds was 35.7% and for over 65 year-olds was 4.6%. These
percentages are predicted to change to 21% of under 15 year-
olds and 7.9% of over 65 year-olds by the year 2000 i.e. the
younger generation will reduce by approximately one third and
the elderly will increase by about two thirds.
Normally, a population with a decreasing proportion of young
people will have a decreased demand for consumer goods. In
China at present two factors would initially mask this effect
with regard to milk demand: the lack of adequate supply and
the subsidised allocation of milk to both the young and the
aged group which latter will have increased to a greater
extent and so offset the fall in the younger group.
With regard to age preference, consumption of milk by parents
with young children and the elderly is not a preference but a
situation which is encouraged by the government as a health
measure. Yoghurt is most popular with young people in the

220
cities and likewise ice-cream. However, ice-cream is only
available in the major cities and towns so this statement is
not a general one. As young adults receive sufficient
disposable income for the first time they will be able to
impulse buy e.g. ice-cream; when they marry and have a child
they will increase the infant formula market for example.
Given the aforementioned subsidies for women with young
children, the sex ratio of the population is a factor at
present as to who has better access to milk supplies and thus
milk consumption. This is however an artificial situation.
According to the UN Statistical Yearbook of Asia and the
Pacific 1990 (page 78) the masculinity ratio of the total
population in China in 1987 was l : 0.963; in urban regions it
was l : 0.960 and in rural regions it was 1 : 0.959. However,
there is generally thought to be a higher masculinity ratio in
the countryside than in the cities contrary to the above
figures.
In China, the provincial governments set the price for milk to
the consumer at a strictly controlled fixed low level.
Relative pricing does not affect milk consumption firstly
because at present demand is greater than supply and secondly
because there is no real substitute for milk once it is
accepted into one's diet. (Soya milk provides different
nutritional elements and has an unpleasant odour to some
consumers.)
221
Milk powder:
Butter:
Cream:
In China, however, prices may be compared for the local
product, the product of Joint-Venture (J-V) projects and the
imported product. All of these products supply individual
niche markets. Figures used are taken from this text and are
only approximations:
. Milk: The local product sells at 1.60 yuan/Kg,
imported milk at about 8.53 yuan/Kg;
Local product sells at 10 yuan/Kg,
imported product at about 39 yuan/Kg;
Only local production in Inner Mongolia
priced at 30 yuan/Kg;
Only one producer in Shanghai priced at 2 0
yuan/Kg;
Yoghurt: Local product sells for 4 yuan/Kg, none
imported, J-V product sells at 6 yuan/Kg;
Ice-cream: Local product priced at 3 yuan/Kg, J-V
products retail at about 6 yuan/Kg
Cheese: Local Cheddar supplies fast food chains,
imported products only for European
hotels;
Whey powder: (Used in industry) Local product not
processed into infant formula, imported
ones are and retail at about 30 yuan/Kg
Sweetened
condensed milk: Local product produced in a small number
of factories, no data on imported
products.

222
As can be seen at present, milk consumption (demand) cannot
really be linked to demand factors and the price of milk is
not determined in accordance with traditional economic theory
i.e. that the price of a commodity is determined by the
interaction of supply and demand and that changes in supply
and demand conditions will be resolved through price change
and thus price accounts for everything.
The price of milk in China does not reflect the distillation
of cumulative buying and selling forces in the market at any
one moment, it is distorted by government price fixing,
various national subsidies to farmers and manufacturers, the
EC free milk aid program to 2 0 cities and the UN's WFPC
donations to 6 cities, a virtual monopoly of the milk powder
sector for recombined milk and infant formula production, and
product scarcity necessitating liquid milk quotas. The
availability of milk per capita in China ranges from 1.7 Kg in
rural agricultural areas through 14.2 Kg in large and medium
sized cities to 23.3 Kg in pastoral areas (the latter having
large minority populations).
Relative prices also play an important role in production
(supply) as they can give or take away incentive to local
producers. In recent years in China, farmgate prices have not
kept pace with the prices of other livestock products or with
that of concentrated feed on the "free market". From 1984 to
1988 the farmgate price lagged behind that of other products
by an estimated 12%. In 1988 price levels were too low to

223
sustain an expansion in the dairy industry and cow milk
production has tended to stagnate and decline ever since
(China Dairy Development Strategy Study Group, 1988 pp. 35-
50) .
Cost structure varies with the three different production
systems (urban, rural pastoral and rural agricultural).
Putting aside the rural pastoral areas, the cost of milk is
greatly affected by the price of animal feedstuffs to the
extent of 60% compared with about 40% in Europe. A major
problem Chinese farmers face is the rapid increase in
negotiated feed and fodder prices especially those for
concentrates. An example of the effect of relative prices was
demonstrated when in several cities the equivalent price of
milk powder was higher than that of liquid pasteurised milk
and this stimulated the production of milk powder.
Factors influencing local product supply include: price to
producers, subsidies, investment by competing foreign
suppliers, geographic and climatic issues and natural
resources.
There are substantial regional differences in prices paid to
producers and as aforementioned the farmgate prices have not
kept pace with prices of other livestock products. Production
costs have changed markedly over the last few years and there
have been changes in distribution systems and rural
institutions (Ma and Garnaut 1992, p. 8) . In 1992, there was

224
a general trend to abolish price fixing for milk because of
the difficulty in reacting adequately to these changes.
For any given level of production there is a close inter
relationship between government economic policy and prices
required by farmers to produce that output. In China today,
milk is perceived as a product of importance to health but as
it has not been a traditional part of the Han Chinese diet
there is a shortage of supply. Per capita income in China is
also low and these facts have resulted in government subsidies
being given to local producers and manufacturers. These
subsidies take various forms e.g. :
Dairy producers (large, medium or small) may receive a
production subsidy based on the amount of milk delivered
to milk processing plants permitting them to buy maize
from state controlled feed mills.
In some provinces e.g. Shanghai, some feedstuffs are
provided free of charge on a proportional basis. State
farms have first access to these subsidised supplies;
Various subsidies including remission or reduction of
taxes and land allocation are available to Chinese
processing factories.
In 1988 the Chinese government began to withdraw subsidies on
feed to dairy farmers.
Government policy for dairy factories is complex because
management of the factories may be under a wide range of
departments e.g. local government departments, or the

225
Departments of Light Industry, Agriculture or Commerce and
Trade. In addition the Ministry of Agriculture owns the
entire distribution for liquid milk. The Ministry of Commerce
and Trade owns all local state shops and distributes all
manufactured dairy products from dairy plants through their
local shops.
A further issue is that governments often perceive the
existence of domestic food processing industries as necessary
for food security reasons. Current government policy uses tax
incentives to encourage foreign companies to set up joint
venture projects. The policy regarding infant formula milk
powder and cheese is for import replacement by further joint
venture projects.
Making agriculture the foundation of the economy is a key
element to basic national policy. The plan of the Central
Committee is for agriculture to achieve two major transitions
by 2000: the transition from a self-sufficient or semi-self
sufficient economy to a commodity economy, and the transition
from traditional agriculture to modern agriculture.
In accord with government policy investment by foreign
companies takes the form of joint ventures. These projects
influence the volume of local supply of the product and often
the products profit from the reputation of having a higher
quality than the local ones and supply the upper end of the
market. To date several European companies have set up joint

226
venture factories in China notably Nestle, Kraft, Danone and
Wei Quan.
China's geography with its seven different climatic zones and
natural resources is enormously varied as might be expected.
However only 11% of land is capable of being cultivated so
China is extremely poorly endowed with agricultural land per
capita. Yet this 11% which comprises some 7% of the world's
cultivated land supports more than 20% of the world's human
population in almost all its needs for food and clothing
(Sivin, 1988, p. 154). Two key factors make this achievement
possible the availability of a huge labour force and the high
quality of much of the cultivable land. About 50% of the
agricultural land in China, mainly in the subtropical south,
is of excellent quality. Much of the rest is fertile lowland
which can produce good crops provided it is not affected by
drought or flood. For example the loess plateau in the
eastern steppe zone (Mongolia and Shanxi) needs little or no
fertiliser and very little tillage, the only limiting factor
is annual rainfall.
However, with the continuing increase in population and
urbanisation, valuable land formerly used for agriculture is
being diverted to housing. This can be countered with
increases in production efficiency but not indefinitely and
environmental issues are already posing major problems for
China. Soil erosion due to destruction of original vegetation
affects an area of 1.5 million square kilometres (He, 1991,

227
p.29). It has been estimated that since 1985 over 4.1 million
acres of arable land have been lost every year. Industrial
construction alone has claimed 1.5 million acres yearly while
residential construction in the countryside took another
82,500 acres (He, 1991, pp.32-33).
The usual equation that consumption less local supply equals
import demand does not easily fit with the present situation
in China where trade policy is a major factor. In China,
however, there is now a clear trend towards balanced trade
with the trade surplus contracting from USD 3.81 billion in
the last quarter of 1990 and USD 2.25 billion in the first
quarter of 1991 to USD 1.42 billion in the second quarter of
1991. Import restrictions imposed in 1989 were relaxed in
1991 due to increasing pressure from countries such as the US
and Japan both of which have huge deficits in their trade with
China (DFAT, China Brief Dec. 1991 p. 34) .
China's policy in general is one of import replacement and
thus a preference for joint venture projects over foreign
imports. However, imported dairy goods do reach China. They
are still beyond the reach of the ordinary people because of
their high price. Some think that this situation will remain
for a long time or until the income of the Chinese reaches a
threshold level (e.g. USD 1,000 per capita) or there is a
reduction in import duties. Ma and Garnaut (1992 p.2)
consider that the published World Bank estimates of the
Chinese national GDP for 1990 at USD 370 should be adjusted

228
upwards by a factor of three. This would arrive at a GDP of
USD 1110 possibly not too far off the required threshold
level. If China is to gain membership of GATT, more
liberalisation of trade is required which will reduce the
price of imported goods.
In the market for dairy goods in China, Australia's
competitors are the UK, the EC (Switzerland, Denmark, France,
Holland, Germany,) and New Zealand. The author's personal
experience with the activities of these countries is as
follows:
. UK and New Zealand very strong and forceful marketers of
all dairy goods;
Denmark and Holland very strong in all types of cheese;
Germany, Switzerland very strong in yoghurts;
France strong both in cheese and yoghurts.
"It is evident that the determination of consumer demand is
fairly complex and still not fully understood." (Bennett,
1992, p.242). This remark was made about market economies.
The situation is even more complex with regard to China.
However, it would seem that even with the predicted 12%
increase in cow numbers the gap between the demand for dairy
products and supply will increase as the economy develops.
The decade to 1988 saw dairy consumption in China increase by
280% and occasioned a 53% annual increase in imported dairy
foods. This situation will possibly continue to the year
2000.

229
7.2 Australia's Dairy Industry - Factors Influencing
Ability to Supply the Chinese Market
Australia is classed as a mixed economy based on the free
market system. However it has to contend with large companies
which dominate many markets, strong trade unions and
professional associations; and widespread government
intervention in business. There is extensive government
involvement in production (approximately 23% of the total), in
redistribution of income, in regulation of activity in the
private sector, in assistance and protection of many sections
of the economy, and, by reason of its efforts to manage the
level of production, in employment and pricing (Bennett.
1992, p. 27).
Australians have had very good luck with resources and a high
standard of living. Now they have to find the means to sustain
this. The only way is to globalize, to become much more
market-oriented and to start offering professional services
because they are very high value added (Bennett, 1992, p.
27) .
Both major Australian political parties share the common aim
of making Australia an open, competitive economy that can
prosper as Asia's "odd man in" (The Economist, p. 7).
In line with its policy to make Australia "an outward-looking
community, enmeshed with the dynamism of the Asia Pacific

230
Region", the current Labour government is committed to cutting
the average tariff for most of its imports to 5% by 2000,
compared with 20% when Labour won power in 1983 (The
exceptions being cars, textiles, clothing and footwear.)
(Rohwer, Odd man In, 1992, p. 9). Under these conditions, for
Australian industries to remain viable it is essential that
they become internationally competitive. The ability of
Australia's dairy industry to supply the Chinese market
depends greatly on this but also upon China's trade barriers
to processed agricultural products (ABARE ARQ 1992, p. 570).
Factors which influence this ability to' supply include:
international trade policy and more precisely the outcome of
the GATT talks, China's trade barriers, international trade
blocs, the behaviour of Australia's competitors, likely
changes in product and process technologies, likely trends in
transport, physical and economic limitations to expansion of
the Australian industry, and deregulation in the industry
itself.
Perhaps the most vital factor for Australia is the successful
outcome of the Uruguay Round of multilateral trade
negotiations under the General Agreement on Tariffs and Trade
(GATT) due to be concluded over the next few months.
In December 1991, Arthur Dunkel (Director General of GATT) in
response to the continued failure of the negotiations, put
forward a package of reform proposals which if implemented

231
would see a useful rise over the medium term in the prices of
grain and other agricultural products of importance to
Australia (ABARE, ARQ, 1992, p. 50).
market access:
The Dunkel package contains commitments for reductions in
support to be implemented over six years from 1993 to 1999 in
three areas:
Non-tariff barriers e.g. quotas to be
converted to tariff equivalents and
these tariffs to be reduced from the
base level of 1986-88 by an average
of 35% (minimum for each tariff line
of 15%);
Total value of domestic support by
trade distorting measures to be
reduced by 2 0% from base level of
1986-88;
Budget outlays on export subsidies
would be reduced by 3 6% and volumes
of subsidised exports by 24% from
their 1986-90 averages.
(ABARE, ARQ, 1992, pp.197-199)
domestic support
export subsidies:
In January 1992, participating countries agreed that the
Dunkel package provided a basis for completing the GATT
negotiations. in May 1992 the EC announced a reform package
for agriculture and the US has foreshadowed measures to move
into effect in the first half of 1993. A recent study of the

232
benefits of a half-successful Round concluded that America
would gain an annual USD 35 billion, Japan and Europe nearly
USD 3 0 billion a piece and the rest of the world about USD 2 5
billion; a global gain of roughly USD 120 billion a year and
these estimates are regarded as conservative (Freer Trade with
Luck, The Economist, 1992, p.12).
Using the SWOPSIM world agricultural trade model recent
estimates of the effects of liberalising trade in accordance
with the Dunkel package, taking into account some of the
limits that individual countries would like to see, include
increases in the price of butter by 19%, of cheese by 29% and
of milk powders by 24% (ABARE,ARQ, 1992, p.202).
The increase in the world butter price is caused by reduced
exports from the US (about 45%) Australia (24%) and the EC
(4%) (ABARE, ARQ, 1992, p.203). The reduction in US exports
results from the required 20% reduction in internal support.
This leads to a reduction in the internal US price and to a
decline in domestic production and an increase in consumption.
As a result, US butter exports decline by more than the 24%
required under the export subsidy component of the Dunkel
package.
Similarly the reduction in EC butter exports results from the
reduction in internal prices which flows from the reduction in
EC tariff equivalents. The reduction in domestic prices leads
to a small increase in consumption and a reduction in exports.

233
This is despite the fact that the EC butter exports are
already more than 24% below the average level for the 1986-90
base period.
For cheese, the increase in world prices results from a 24%
reduction in exports from both the EC and Australia, combined
with a 15% increase in US imports. The reduced exports from
the EC and Australia result from implementation of the export
subsidy commitments under the Dunkel package, while the
increase in US imports arises from the required 2 0% reduction
in domestic support (ABARE, ARQ, 1992, p.203).
A number of points must be taken into consideration when
interpreting the results of this study:
The analysis employed a static partial equilibrium
modelling framework confined to the agricultural
sector. Thus it needs to be kept in mind that:
No time path for agricultural commodity prices
during the phase-in period (1993-99) could be
estimated;
No account was taken of the impacts on production
and consumption of changes in productivity and
tastes over time; and
Developments in other sectors of the economy were
not taken into account.
The Uruguay Round reforms encompass resources,
services and manufacturing and, if implemented,
changes in these sectors would have an impact on

234
variables such as the overall rate of income growth,
the exchange rate, the price level and the level of
utilisation of various resources in countries which
are participating in the Round. These changes would
in turn impact on the agricultural sector of these
countries. Conversely, changes in the structure of
farm production and in producer incomes resulting
from agricultural policy changes would also be
likely to affect other sectors of the economy.
No account is taken of the widespread changes occurring
in Eastern Europe and the CIS which may result in prices,
production, consumption and trade in these countries that
are significantly different from those used in the study.
Commodities in the model are assumed to be homogenous
which might not be an accurate representation.
Agreement on the Dunkel package is far from the complete trade
liberalisation that Australia has been striving to achieve but
it is a move in the right direction. It would place binding
constraints on the extent to which countries, particularly the
EC, could protect their agricultural sectors and subsidise the
disposal of surpluses on world agricultural markets. The
potential increases in world market prices for agricultural
products would be significant (ABARE, ARQ, 1992 p. 196) . In
fact, the largest increases in world prices are estimated to
be for dairy products (over 20%) and grains (about 10%) with
smaller increase for livestock products and other crops
(ABARE, ARQ, 1992 p. 196). The extent of these increases for

235
dairy products reflects the small size of world trade relative
to production and consumption in major countries. Small
policy induced changes in both production and consumption can
markedly affect world import supplies and demand, thereby
greatly affecting world prices. (ABARE, ARQ, 1992 p. 204) .
It is unlikely, however, that the Dunkel package will result
in any immediate boost in rural prices but if agreement is
reached to significantly reduce barriers to world agricultural
trade there will be benefits for Australian agriculture over
the medium to longer term.
China's trade barriers between the domestic economy and
international markets were, to a large extent, set up by other
nations. Prior to the early 1970s when the US and China began
to normalise their diplomatic relations, the US has led many
other Western nations in a general embargo on trade with China
(Sicular, 1989, p.283). Today China's barriers include both
tariffs and non-tariffs. Tariff levels are a major problem
for countries seeking GATT entry but for China non-tariff
barriers are an even greater problem. China applied to join
the GATT in 1986 and hopes to be accepted by early 1993 but
many think this is impossible (Goldstein & Baum, 1992, p.57).
In 1990, China had average ad valorem nominal tariffs on
lightly processed dairy products of 52%, and on highly
processed dairy products an average of 65%. In addition there
is a wide range of non-tariff barriers which affect trade in
agricultural commodities. Both types of processed foods are

236
affected by the fact that dairy products are controlled by the
State Trading Monopoly. The Chinese government can influence
production and imports through its procurement and pricing
policies. The government controls producer prices through its
own purchasing policies and it controls consumer prices
through a rationing system. In some cases the government has
subsidised consumers by selling domestically produced
agricultural products to urban consumers at below world market
prices (ABARE, ARQ, 1992, p. 581)
As already mentioned, procurement policies can be in the form
of contract procurement under which farmers are requested to
sell a certain portion of their output to the state at
contract prices determined before planting or through
negotiated procurement under which commodities are purchased
from farmers at prices negotiated after harvest.
Imports to China can also be constrained by foreign exchange
limitations.
Government pricing policies for agricultural inputs have both
positive and negative effects on agricultural products in
China. For example, credit is provided in some instances at
concessional rates for infrastructure developments affecting
agricultural industries, particularly for projects in poorer
regions. This would have the effect of increasing production
and reducing import requirements. On the other hand, state
determined prices for chemical fertilisers and fuel generally

237
exceed world prices so have the effect of reducing production.
The conditions laid down for China's entry into GATT include a
liberalisation of trade (which would speed up internal
reforms) an end to copyright infringement and a freer system
in general. China in its present transitional state to a
market economy has requested extra protection from imports for
its industries and plenty of time to tighten its slack system
of intellectual property protection. It has allowed some
liberalisation of foreign exchange controls and of foreign
investment but still has a way to go.
In fact the benefits to China in joining GATT would be mainly
political. It would represent an affirmation by the
international community of China's reform process. On the
economic side there are few benefits given that China's
exports already enjoy most favoured nation (MFN) tariff status
in all of its major markets (Goldstein and Baum, "Outside
GATT's door, 1992, pp. 57-58). China has, in the view of the
US, "a capitalist export regime and a socialist import
regime". To allow China into GATT without regard to the
principles of open trade would send false signals to other
applicants such as the CIS and the Ukraine.
Trade groupings (blocs) are formed to facilitate freer trade
between member nations. The two most common are free trade
associations e.g. EFTA formed in 1959, ASEAN (1967) and LAIA
(1980) and common markets e.g. the EEC (1957), ANCOM (1961)

238
and the Arab Common Market (1964). Recent alliances include
ANZCERTA (1983) involving Australia and New Zealand and
replacing NZAFTA (1965), MERCOSUR (1991) and the Free Trade
Agreement of Central America (1992) (Cooke, 1991, pp.4-5).
There are many bilateral agreements as well. This economic
regionalism has only been possible because GATT in 1957, in
contravention of its charter of laissez-faire economics,
permitted the formation of the EEC which in 1993 will join
EFTA to form the EU a grouping of 19 nations.'
On January 1st. 1993 the ASEAN nations commenced a scheme of
tariff cuts to continue for 15 years with a view to setting up
the Asian Free Trade Area (AFTA) . The key ingredient is to
introduce a Common Effective Preferential Tariff of 5% for
processed agricultural and manufactured goods made and traded
within the grouping (Tigliao, 1992, p.50).
The recently formed NAFTA (1992) currently awaiting
ratification before the US senate was a reaction to the action
of the EC traders. NAFTA is a natural association of
neighbours and is an enormous market stretching from Alaska to
the Yucatan peninsula. Barriers to trade between the US,
Canada and Mexico will be phased out over a period of 15 years
(Awanohara et al., 1992, p. 50).
NAFTA is of paramount interest to all nations outside the
NAFTA and EC blocs and it is hoped that the regional
arrangement will lead to a global free trade one. EFTA and

239
ANZCERTA in fact have shown that regional groupings do
stimulate trade and create pressures for further trade
liberalisation (Hooper, BRW, 1992, p. 32).
In 1990, the Malaysian Prime Minister proposed a plan for an
East Asian Economic Caucus (EAEC) which includes Japan and
Korea but excludes Australia i.e. an exclusively Asian trade
club (Arbouw, ABM, 1992, p. 125). Japan's response to EAEC
was to say that it is not easy in a region as diverse as East
Asia and that threats of trade blocs in other regions of the
world made it imperative for East Asian co-operation to remain
characterised by "diversity and openness" (Vatikiotis, 1993,
p.11).
On the other hand, a regional free trade grouping based on the
Asia Pacific Economic Co-operation Process (APEC) (1990) would
have many advantages for Australia as nearly 70% of
Australia's exports are absorbed by the APEC membership (Gill,
Financial Review, 1992, p. 3). Australia has placed great
emphasis on APEC which includes, in addition to the EAEC
members, Australia and the US. APEC's focus is on :
. customs reforms,
. lowering administrative barriers to market access,
. developing data-bases on tariffs,
. pilot projects on electronic data interchange (EDI) and
. a guide to the investment regulatory procedures of member
countries.
(Hooper, 1992, p.32)

240
Australian businessmen fear that trade blocs will divert
commerce and investment away from the West Pacific and are
especially concerned about the local content rules of NAFTA
(62.5% of value of product must be local content for duty free
access) (Awanohara, 1992, p. 73). Many feel that Fortress
Europe and Fortress New World will leave Asia Pacific
countries little choice but to band together in a defensive
action and that it is essential for Australia's voice to be
heard in APEC and her influence towards a free trading world
continue to be heard. If this does not occur there is little
future for her dairy producers in the long term.
The behaviour of Australia's competitors is also very
important with regard to Australia's ability to compete
internationally. The two major players in international
agricultural trade are the EC and the US which practise, in
the views of some people, "a lethal combination of
protectionism at home and predatory pricing abroad". As
Australia is now part of the global economy the actions of
both these trading groups is of great importance.
With regard to the EC, after Britain joined in 1973, the high
internal support prices and import barriers of the EC's Common
Agriculture Policy (CAP) first squeezed Australia's food
products out of a British market it had supplied for over a
century and then started squeezing them out of third markets
as well. Today, in an attempt to reduce their agricultural
stockpiles, the EC dumps them on world markets at prices

241
subsidised to an extent which eliminates their unsubsidised
competitors. This policy takes the form of the free milk
program extended to China monopolising the milk powder market.
If the Dunkel package succeeds, there will still be
considerable hurdles to overcome with regard to the EC. For
example the EC does not define the tariff equivalent of its
non-tariff barriers as the difference between its internal
prices and world prices but adds a loading of 10% ("community
preference") on top of its international prices in determining
its base period tariff equivalents. This could result in a
response to add "fat" into their own tariff equivalents by
other countries.
At present the CAP is under pressure from two sides: the farm
lobby will not allow the EC to lower guaranteed prices but
equally budgetary pressures mean it can no longer afford
unlimited spending (Carr, 1992, p. 17). The compromise is to
maintain prices but to restrict volume of production on which
those prices are paid. Quotas for milk (and sugar) already
exist. This legislation, however, does not destroy the
capacity to produce and as productivity improves the original
dilemma returns and the government must either tighten the
constraint more or reduce the price. The EC also has to
contend with the emergence of Eastern Europe and the desire of
many of the recently independent members to join the EC.
When the Eastern block countries became independent and

242
abandoned collectives some concessions were extended to them
from the EC. However, many people fear that the EC will dump
products in Eastern Europe hindering the recovery of their
agricultural industries. They also believe that Europe's
recent CAP reform is almost unworkable in the extra
supervision of farmers that it demands (Carr, 1992, p. 13).
Prior to World War II, the Ukraine was Europe's granary. Its
soil and the density of its population today put it on a level
with the North American prairies. Because farming is usually
one of the first industries to return to health after economic
collapse, the rest of Eastern Europe may also be hoping to
export farm produce (Carr, 1992, p. 17).
With regard to the developing countries, the effect of trade
liberalisation by the EC may be summarised as follows: in
terms of equivalent income, consumption and number of people
hungry, they lose whereas the developed countries gain
(Goldin and Knudsen, 1990, p.233)
In Russia about one-third of farm output goes to waste because
distribution is inefficient (Carr, 1992, p. 17). Instead of
posing a threat as a competitor, at present there is a
continued deterioration of the CIS economies. The former USSR
traditionally accounted for about 50% of the world's trade in
butter. The financial crisis which has enveloped the region
has reduced CIS purchases and imports have only occurred in
the form of aid. In the long term, with reform and released
from EC dumping the CIS should become not only self-sufficient

243
in food but has the potential to be able to export.
With regard to the US, it has an Export Enhancement Program
(EEP) under which it can "out-subsidise the EC on grains"! It
has also shown itself to be determined to stave off the threat
of open markets for its internationally uncompetitive farmers
which include dairy farmers (Odd Man In, The Economist, 1992,
p. 14)
Australian exports of dairy products to the US are limited by
quotas and Australia exports very little dairy products to
either the US or Mexico. Australia does not compete with the
US in the Mexican market for farm products to any significant
extent (although it does supply beef and sugar to the US
market as does Mexico but the quantity of exports from Mexico
is relatively small). Mexico is a net importer of dairy
products (principally butter and cheese) (ABARE, ARQ, 1992, p.
362) . The effect of NAFTA will be that whereas trade in
agricultural products between the US and Mexico is likely to
increase significantly it is likely to have only a small
effect on world agricultural prices and trade.
A unilateral trade liberalisation by the US would result in a
substantial change in the trade pattern of dairy products.
The US becomes an importer and the export share of the US is
largely gained by the EC and by New Zealand the latter
exporting an additional 1.3 million tonnes of dairy products
(Goldin and Knudsen, 1990, p.235).

244
There are also other participants in global agricultural trade
which will be affected by a successful outcome to the GATT
e.g. Argentina, which should also be taken into account.
Farm protection which exists in both rich and poor countries,
is so intricate and pervasive that it is not easy to work out
who pays how much to whom (Carr, 1992, p.5). Since the 1980s,
modelling of farm economies using computers has been most
valuable in transforming the debate about' subsidies. The
studies differ but all agree that the cost of protection is
high and getting higher (Carr, 1992, p.7).
In their study of opportunity costs, Anderson and Tyres found
in Australia, for example, that for every dollar reaching
producers 37 cents are wasted. This, when extrapolated world
wide, amounts to $60 billion of waste for developed countries.
This waste occurs because food is being grown in the wrong
place, with a needlessly expensive mix of land, labour and
agri-chemicals (Carr, p.7). If poor farmers are the real
target for subsidies, the waste is even greater. The poorest
third of farmers produce only a tenth of the output, so most
of the money that reaches farmers falls wide of the mark.
Less than $1 in $10 reaches needy farmers. Because payment is
linked to production, the rich collect enormous sums from the
state.
Studies by the Centre for International Economics in Canberra
tried to look at the effects of farm policies on employment

245
and wages in the rest of the economy e.g. if money spent on
farm policies were injected into the most profitable part of
the economy or if money was taken from inefficient industries
and given to efficient farmers. They estimated that if the
CAP policies of the EC were abolished, 2 million more jobs
would be created (Carr, p.8). Not everyone agrees with the
figures but in the view of Carr, "their message is
indisputable: farm policies have effects that are large enough
for consumers, companies and the unemployed to care".
Future trends; in product and process technologies will also
influence Australia's ability to compete internationally.
Australia's traditional emphasis on agricultural research has
been and will continue to be of great value to its farmers.
Traditional dairy product lines (milk, butter and cheese) are
readily recognisable by consumers. However with process
technologies increasing, dairy products are used in numerous
industrial products which include for example:
detergents and cosmetics (whey protein
concentrates),
fertilisers, fermentation of alcohol (liquid
whey),
plastics (buttons), stabiliser for rubber tyres
(casein/caseinates),
mirror silvering, toothpaste (lactose) ,
pharmaceutics (peptides and lacto-ferins), and
food preservation (lactoperoxidase and lacto-
ferin).

246
The future direction for value-adding to milk and milk
products lies in its fractionation which yields a range of
products with high value in specialised markets (Dionysius,
1991, pp. 88-89) . In addition, dairy cows are seen as an
ideal animal for use as recipients (transgenics) for genetic
engineering purposes. In this case the cows produce proteins
which can be purified from the milk.
Future trends in transport and infrastructure capacity are
important to servicing a market. In Australia a decline in
infrastructure has become a big obstacle to the country's
drive to become internationally competitive and create an
export oriented economy (Stevens, 1992, p. 80). Since 1985
the freight moved around Australia by sea has declined from a
high of 32 million tonnes to 28 million tonnes. Freight moved
by rail has grown steadily from 7 million tonnes to 11 million
tonnes whereas the trucking industry carried an estimated 15
million tonnes in 1991.
Of the three modes of transport, sea and rail are limited by
restrictive union practices especially on the waterfront and
by lack of investment in infrastructure particularly in rail.
The trucking industry alone has been flexible with the
introduction of new technology, the employment of logistics
consultants and the installation of computerised warehousing
systems (Stevens, 1992, p. 83). Recently the federal

247
government allocated AUD 600 million for rehabilitation of the
national road system over the next two years.
As already mentioned, in China at present, the transport
infrastructure is under enormous strain and despite government
action this situation is likely to remain for some time to
come. A major constraint is the availability of transfer and
storage facilities and logistical problems in moving
agricultural products to markets. (Tyrchniewicz et al., 1987,
p. 267) .
China's present infrastructure projects include:
. a new airport at Shen Zhen (30 km north of Hong Kong)
(Westlake, 1992, p. 58);
. a doubling of handling capacity to 1.25 billion tonnes at
sea ports by 2000;
. building an extra 9,000 km of inland shipping channels
(Yu, 1992, China Economic News 34, p. 3);
. a quadrupling of the road mileage by the year 2 000 (Yu,
1992 (34) , p. 3) ;
. Hutchison Whampoa has recently acquired 50% share of
Shanghai's container terminals and plans to build new
ones needed to keep up with expanding foreign trade (USD
1.1 billion over 8 years) (Goldstein, 1992, p. 60);
. Guang Zhou recently has a new bonded area, six more are
to be built in China (Li, 1992, China Economic News 29.
P- 2)

248
In addition two Beijing backed corporations (CNAC and CTS)
will acquire a 10% stake in Hong. Kong's Cathay Pacific in
which China's CITIC already holds 12.5% (Kaye, 1992, p. 49).
Ocean shipping is said to be on the verge of a new era of
innovative technology with the development of the "Yamato 1"
or "Rocketing Whale" the world's first ship powered by super
conducting magnets a concept as revolutionary as the invention
of the first steamship. For example it is predicted that this
will cut the Tokyo-Los Angeles crossing to 42 hours
(Revolution on the High Seas, Asia Inc, 1992, Sept, p. 10)
Another future entrant on the scene is the Russian boat-plane,
originally designed for military purposes, it is an enormous
aircraft which cruises at very low altitudes just above sea-
level. It has extensive capacity and the potential to make a
major contribution to freight services.
However, with regard to air freight, airport hubs in the Asia
Pacific region are already under enormous pressure. IATA
thinks that only two (Singapore and Taipei) of the seven major
airport hubs will be able to cope with future expansion and
the rest will suffer from growing log-jams of passengers and
planes (Westlake, 1992, Sept. 24, p. 86)
Doug Shears of ICM Australia and a member of the Agri-Food
Council, a body set up by the federal government in July 1992
to boost the export skills of Australian food makers and

249
promote the marketing of Australia in Asia, says "If
Australian food manufacturers are serious about going offshore
they must develop an infrastructure overseas in terms of
distribution, packaging and marketing, etc." (Shoebridge, BRW,
1992, Oct.23, p. 28). In short, China's infrastructure is a
major hurdle for product distribution.
Physical limitations to Australia's ability to supply export
markets should also be taken into consideration. In 183 6,
Charles Darwin wrote of Australia's fragile agricultural soils
and predicted that: "Agriculture, on account of the droughts,
can never succeed on an extended scale: therefore so far as I
can see, Australia must ultimately depend upon being the
centre of commerce for the southern hemisphere, and perhaps on
her future manufactories." Andrew Campbell (1991, pp. 1-2)
stresses that "The inherent productivity of much of our
farmland is very low." However Australia enjoyed enormous
prosperity from her agriculture in the 1950s and 1960s. Only
now in the 1990s the extent of the impact of inappropriate
European systems and the long-term cost have been made aware
to policy and decision makers in Australia and sustainable
development is now a catchphrase. Even so the pressure of
intensive practices in agriculture must always be kept in mind
when future projections of ability to supply markets are made.
The Australian farming community is well-educated and has been
exposed to real market forces for a considerable period of
time. The acceptance of sustainable treatment of the land is

250
being now imposed upon them and there has been and will
continue to be rationalisation in the industry. One of
Australia's marketing strategies is to stress its green image.
This is most justifiable and appropriate as there is now
environmental awareness amongst consumers and heightened
concern about food safety (Tyers and Anderson, 1992, p. 315).
On the other hand, in other parts of the world, there is every
sign in the opinion of some that environmental ism will become
the next pretext for protecting farmers. It will keep trade
barriers standing and it will make a mockery of economics by
subsidising farmers not only for environmental services that
would exist in an unsubsidised world, but also for polluting
less (Carr, 1992, p. 18). Thus the environment may be a double
edged sword.
In the long term, the prime economic limitation to the ability
of Australia's farmers to supply markets is the level of farm
income. At the moment the macroeconomic indicators of 1990-91
and 1991-92 are encouraging. They show a major reduction in
inflation (from 5.3% to 1.9%) and short and long term interest
rates (12.2% and 12.1% respectively down to 8.1% and 9.9%) and
a turn around in the growth of real GDP (-0.5% to 0.2%). This
was against a background of almost identical trade weighted
indices (58.9 and 58.2). The effective exchange rate was 8 6.6
in 1990-91 and 83.5 in 1991-92 and the domestic price index
149.1 in 1990 and 154.5 in 1991-92 (ABARE, CSB, p. 11).
In the period 1990-91 to 1991-92, the Australian trade balance

251
on goods and services increased for imports from AUD 65,522
million to 67,395 million and for exports from 65,379 million
to 69,034 million. The current account balance decreased from
AUD -15,629 million to -11,861 million. The terms of trade
decreased from 101.5 to 99.4 (ABARE, CSB, p.15). However, for
a population of 17.2 million, foreign debt climbed from AUD
137,210 million in 1990-91 or 36.3% of GDP to AUD 150,050
million in 1991-92 or 39.0% of GDP (ABARE, CSB, p.15).
The Australian economy is predicted to strengthen during 1992-
93 with inflation remaining low because of the presence of
excess capacity. The AUD and prime interest rates are
presumed to remain around current levels for the period 1992-
93. The overall economy is assumed to grow by 0.7% in 1991-92
and 4.8% in 1992-93, a remarkable turn around. The short term
outlook for the world economy is very uncertain with the major
economies being at critical turning points. However, the world
economy is assumed to recover slightly in 1992 buoyed by
continual strong growth (around 7%) in 1992-93 in South-East
Asia. (ABARE, CSB, p.12)
In Australia, the value of rural exports is forecast to rise
further by 5% to AUD 15.5 billion nearly AUD 680 million more
than in 1991-92.
Over the period 1990-91 to 1991-92 farm costs in Australia
fell from AUD 20,111 million to AUD 18,994 million
(preliminary figure) and the net value of farm production

252
increased from AUD 1,023 million to AUD 1,473 million. The
price index received by farmers for market milk increased from
114 to 120 and for manufacturing milk from ill to 116. The
total number of dairy cattle decreased from 2.43 million to
2.41 million (preliminary figure) and for dairy cows
specifically from 1.637 million to 1.629 million. Australian
statistics are also not easy to interpret at times as e.g. the
manner of calculating the figures in these two financial years
differs (ABARE, CSB, pp.23 and 79). Production of whole milk
increased from 6,403 ML to 6,732 ML and manufactured dairy
products, except for reduced milk, all exhibited an increase
in production (ABARE, CSB, p.82). Consumption in Australia
showed a notable increase for WMP (from 12.4 kt to 16.0 kt)
and SMP (from 37.7 kt to 40.7 kt) . Export prices FOB for the
same period for butter rose from AUD 1811/tonne to 1921/tonne
and for cheese from AUD 3203/tonne to 3317/tonne (1991-92
figures are preliminary) (ABARE, CSB, p.79).
In Australia, total farm costs are forecast to increase by
about 3% to AUD 19.6 billion in 1992-93 with new investment in
plant and structures expected to be 10% higher than in 1991-92
(ABARE, ARQ, p. 167) In contrast, farm income is forecast to
rise by only 2%. Farmers' terms of trade in 1992-93 are
expected to be little different from their relatively low
1990-91 and 1991-92 levels. (ABARE, ARQ, p.5). Nevertheless,
because of a forecast rise in volume of rural production in
1992-93, especially in the Queensland and northern NSW grain
belt, aggregate net farm cash income in 1992-93 is forecast to

253
rise by 27% to AUD 4.45 billion. Taking into account
depreciation of farm capital equipment, the net value of farm
production, of which dairy products represent about 6.5%, in
1992-93 is forecast to rise by nearly AUD 1 billion to AUD 1.7
billion (ABARE, ARQ, p.9).
In the late 1980s, there were significant moves towards
deregulation of Australia's dairy industry though even in 1991
there were still important quota and price support schemes in
the various states. These changes, centred on supply
restrictions, kept up the price of milk (by a decreased
amount) but not the price of dairy produce such as cheese.
(Bennett, 1992, p.366) All states have limited milk support
schemes and the export prices for dairy products are also
underwritten by the Commonwealth government. In effect, milk
prices underwrite the returns for cheese and other dairy
products on both the domestic and international markets. Due
to falling farm incomes in 1990-91 the federal budget
allocated AUD 146 million to subsidise the dairy industry. In
1991-92, despite the prolonged drought, the government
proposed to reduce the AUD 2.4 billion assistance to
Australian agriculture and pastoral industries to AUD 1.9
billion. These funds were spent on general measures such as
water development, land development, produce inspection
services and a variety of other specific measures.
In the opinion of Mr Ian Langdon, chairman of the Australian
Co-operative Foods, "one of the greatest hurdles which has to

254
be overcome is the cocooning of our agricultural sector in co
operatives". (Goodward, 1992, p.9). According to Mr Raymond
Bennett (1992, p. 370) if Australia is to cope with the world
economic conditions, reform changes should include the
following:
. Artificial schemes that support the dairy producers
should be reformed and completely abolished;
. Government subsidies need either to be phased out or at
least made more public and have a sunset clause in them;
. The transport, handling and distribution system for farm
produce needs to be dramatically overhauled and made more
efficient;
. Much more effort needs to go into developing new products
and markets, in particular very high quality cheese,
etc.;
. The most important problems facing agriculture - soil
erosion and water supply misuse - need to be urgently
addressed since other crises about markets and costs
become irrelevant if the means of production are lost;
. The efforts by the government in recent years to lower
tariff levels have gone part - but only part - of the
way to reducing the cost-price squeezes faced by
Australian farmers. More needs to be done; and
. Australia's farmers need special loans and financial
assistance if they are to adjust to the new conditions.
In the long term, support schemes largely based on supply
quotas will soon almost completely be eliminated and even

255
import restrictions totally lifted. This could mean that
within a few years most of Australia's milk will come from New
Zealand (Bennett, 1992, p.366).
Taking all these factors into account, it is difficult to
forecast more than in the short term the prospects of the
Australian dairy industry. In summary, the successful
outcome of the Dunkel package for the GATT talks is vital for
a less costly international food economy. China's agricultural
land area is finite and her trade barriers will not be able to
be maintained once she has achieved GATT membership. However,
Australia's agricultural land is fragile and much less able to
support increased production demands than that of most of her
competitors. The various geographical trade groupings will
hopefully first promote freer exchange between members and
eventually lead to the adoption of an international free trade
market in food products. This cannot be achieved in the short
term, even for NAFTA with just three member countries the time
scale is 15 years. Australia's proximity to East Asia is an
advantage and her membership of APEC and new trends in
transport will assist in access to Asia however the trans-
Siberian rail line is an equal facility for the Europeans.
Australia's ongoing reforms within the dairy industry and
microeconomic reform (labour market, transport sector,
electricity generation, etc.) will be important in enhancing
the competitiveness of the food industry. New products and
product technologies are well within Australia's capabilities
and with her newfound awareness of the complexities of the

256
international scene, the value of sustainable agriculture and
the necessity for adaptability, the Australian dairy industry
will, the author believes, be capable of meeting the
exigencies of the world market in the future.
7.3 Forecasts for the Dairy Industry - Australian and
International
Although China has a continuous history of more than 5000
years and a vast population of 1,2 00 million people, the
Chinese dairy industry is still in its infancy. In 1990, milk
production in China totalled 4,3 00,000 tons being an average
milk production per capita of a mere 3.5 kilograms per year
(China's Yearbook, China's National Statistic Bureau, 1990,
pp. 65 & 87) .
In contrast Australia, to which cattle were only introduced
200 years ago and with a population of only 17 million,
possesses a well-developed dairy industry. In 1990, milk
production in Australia totalled 6,413,000 tons and average
milk production per capita was 377.2 kilograms, more than 100
times as much as Chinese consumption per capita. The dairy
industry is Australia's third largest agricultural industry in
terms of wholesale value with a total revenue of over AUD
4,000 million, some two and a half times its farmgate value.
This illustrates the dairy industry's pre-eminent position as
a value-adding rural industry in Australia.

257
These figures indicate that China is, and will continue to be,
a major potential market for Australian dairy produce, and
taking into consideration factors already discussed, that
demand should escalate over a protracted period.
Forecasting market trends is both an art and a science. Formal
methods of forecasting include fundamental analysis which
relies on analysis of a country's economic fundamentals and
technical analysis which is based on the historical trading
action of a market itself (Brown et al., 1989).
There are four valuable publications regarding forecasts for
the dairy industry which include Australia and the
international scene. They are:
. ABARE's Agricultural and Resources Quarterly, 1992;
. Ma and Garnaut, How Rich is China: Evidence from the
Food Economy, 1992;
. Tyers and Anderson, Disarray in World Food Markets,
1992; and
. Roningen et al., Agricultrural Outlook for the year
2000: some alternatives, 1989.
ABARE uses the general EMABA (Elasticity Modelling Australian
Broadacre Agriculture) Model which " incorporates Australian
macroeconomic indicators (population, exchange rates, etc.)
and livestock numbers, crop prices, current production levels
etc.. In addition to current figures, historical data and
trends, other factors e.g. existing weather conditions, are

258
entered into a spreadsheet. Information of the international
scene is taken from historical data in publications such as
Agri-Europe, OECD statistics and IDA (International Dairy
Association). Finally individual analysts use their own
judgement to reach the final forecasts. Short term forecasts
for the dairy industry by ABARE, ARQ, are as follows:
The international scene: Good seasonal conditions in most
dairy regions are likely to result in a 'rise in domestic
production in 1991-1992. The improvement in world dairy
product prices seen so far in 1991-92 is expected to be
maintained in 1992-93. The SMP and WMP prices are forecast to
average USD 1535/t and USD 1530/t respectively in 1992-93
representing increases of just over 10% for both products from
1990-91 prices. WMP and SMP consumption have risen as a
result of aid packages and increased use of SMP as calf feed.
In addition to renewed strong demand, declining production in
the EC and Eastern Europe has meant that world prices have
strengthened. Further declines in milk production are
forecast for these regions in 1992-93 (p.20).
For the Australian domestic scene: Market milk prices are
forecast to rise in 1992-93 by 2% to 44.3c/L. Depending on
how they are calculated, manufacturing milk prices are
forecast to rise slightly to 22.6c/L (p. 158) or by a
significantly higher 6% to 25c/L (p. 319) in 1992-93 after
rising by almost 5% in 1991-92. The increase in manufacturing
milk prices in 1991-92 was a direct result of price

259
improvements on world markets due largely to the decline in EC
production, and a firmer domestic and export demand for most
products, and in particular milk powders. However, world
stocks of butter remain high enough to dampen price rises (p.
158) .
Australian milk production is estimated to have reached 6,600
ML in 1991-92 a rise of just over 3% from 1990-91. This is
the highest level of national production since 1973-74. Most
of the increased production was channelled into the export
market which boosted export earning in 1991-92. Unless the
exceptionally favourable seasonal conditions experienced since
November 1991 are maintained, domestic milk production is
forecast to fall in 1992-93 and value of dairy exports to
decline by 5% to AUD 779 million (p.158)
The availability of manufacturing milk is expected to fall by
about 4%. Domestic demand for manufactured products is likely
to remain steady in 1992-93. Butter sales are likely to
decline because of the continuing trend towards lower fat
products but cheese sales are expected to improve slightly
despite strong import competition especially from New Zealand.
Liquid milk sales are forecast to rise by around 1% to 1785 ML
in 1992-93 (p.319).
Australia's export prospects: Prospects for most exported
dairy products are favourable especially for milk powders.
Reduced availability of product for export from drought

260
affected northern hemisphere producers (Germany, UK and
Denmark) coupled with the seasonal supplies from Australasia
are expected to lead to improved milk powder prices in 1992-
93. Prices for SMP are forecast to average USD 1780/t in
1992-93, 16% up from the average in 1991-92. The concurrence
of stronger world prices and a lower value of the AUD is
likely to more than offset the expected decline in exports
resulting from lower milk production in 1992-93. Hence the
value of the Australian dairy exports is forecast to rise by
13% to AUD 902 million in 1992-93 (p.319).
With regard to the Chinese economy, Ma and Garnaut (1992) in
their attempt to rationalise conflicting data, focus on
China's per capita income, one of the most basic economic
indicators. They take into consideration other key economic
and social variables such as demography, trade and consumer
durables, and point out that China's subsidised health care
and public housing further complicate income measures of GNP,
as do self-constructed housing in rural areas.
Ma and Garnaut (pp.3-7) emphasise convincingly that China's
GDP per capita figures need revision upwards by a factor of
approximately three. They base their approach on the
following points:
. mismatch between income levels and life expectancy,
. high export share of GDP, and
. ratio of real purchasing power to GDP.

261
They raise doubts about the whole statistical basis of the
understanding of China's growth performance in the era of
reform asking : "Have the economists of the IMF, the World
Bank and the world's main centres of scholarship been
duped...?" Ma and Garnaut (p.7) state that consumption
quantities of food are a more reliable measure of the standard
of living than GDP especially in developing countries. In
China, growth rates in consumption of many food products do
not accord with published growth rates of incomes. Ma and
Garnaut (pp.9-10) base their analysis of per capita food
consumption on a comparison with Taiwan in the 1960s revealing
that China's late 1980s figures relate to Taiwan's level of
the mid-1960s. This upward adjustment of China's GDP would
make it the world's fourth largest economy a touch behind
Germany with a foreign trade ratio about two thirds that of
the US with both output and foreign trade ratio rising rapidly
(P-13).
In their 1987 publication (p.197), Anderson and Tyres made a
considerable contribution to the rationalisation of Chinese
data and forecasts for future agricultural trade. They used a
simulation model of the international agricultural economy to
project the impact of economic growth in China on world
markets.
Assuming an annual population growth of 1.2%, real national
income growth of 6.3% annually and real domestic prices at the
levels of the early 1980s, the model projects among other

262
things that dairy imports will rise from negligible levels to
almost 8 million tonnes a year. Assuming no impact on world
prices, these combined agricultural imports would require 4%
of the Chinese GDP by 1995 compared with 2% of the GDP in the
early 1980s. Such a large increase in import demand would
raise world prices unless there were compensating changes
elsewhere in the international agricultural economy e.g. in
the US and successful reform in the USSR.
In their most recent publication (1992), the authors underline
the distortions in world food market figures and stress the
short-comings of multi-commodity models employed to capture
the interaction in production and consumption between the
traded food staples under consideration (p.156).
Tyers and Anderson review agricultural models to date as
follows (1992, p.157): "Usually the general equilibrium (GE)
model of the world economy, the type used by Whalley (1984) is
typically short on commodity detail and hence represents only
crudely the commodity interactions within sectors such as
agriculture. In the model used by Loo and Tower (1989) for
example agriculture is one undifferentiated sector. Burniaux
et al. (1988) devised a model with two sub-sectors for
agriculture plus three processed food sectors within
manufacturing. This economy-wide model was adopted by the
OECD. Another earlier GE model with two farm sectors each
producing multiple products (Burniaux and Waelbroeck, 1985)
had each of the divisions within these two sectors based on

263
the assumption that elasticities of transformation are
constant across all pairs of products (pp. 156-157).
"In addition to the GE models, there are several partial
equilibrium models of world food markets which incorporate
considerable commodity detail. These include Zietz and Valdes
(1985) from the International Food Policy Research Institute,
Ronningen (1986) from the US Department of Agriculture, Parikh
(1988) from the International Institute for Applied Systems
Analysis and^ the OECD model (1987) from the Agricultural
Directorate of the OECD Secretariat" (p.157).
While Tyers and Anderson draw on modelling results to provide
an indication of the possible price and quantity effects that
China's growth (among others) may have in the 1990s, they have
sought to improve the previous models by incorporating
production uncertainty characteristic of agricultural markets,
risk-spreading agents such as stockholders and a
differentiation between short-run and long-run responsiveness
of agents e.g. farmers. A welfare analysis is also included
in the model.
The model is restricted to major traded food staples (wheat,
coarse grain, rice, meat of ruminants (cattle and sheep), meat
of non-ruminants (pigs and poultry), dairy products and
sugar). These seven commodity groups account for about half
of world food trade and one tenth of global trade in all
commodities. The model is a partial equilibrium one but its

264
special features include notably:
. global coverage (30 countries);
. incorporation of cross-effects in both production and
consumption between interdependent markets;
. two models, a dynamic mode and a static equilibrium mode;
. stochasticity (randomness) in that production uncertainty
is included via probability distributions associated with
each commodity's production levels;
. stockholders' behaviour (empirical analysis of public and
private stock level responses to prices and quality
changes);
. policy e.g. price transmission equations are used to
incorporate the two key features of each country's food
price policies (protection and insulating components)
(p.158).
Their chapter on "Economic Reform in the Centrally Planned
Economies" is qualified as "The Great Enigma". These
countries (which include P.R. China) in the mid-1980s
accounted for more than one-third of world food production and
consumption and one quarter of world food imports. They thus
play an important role in the world food economy and changes
in their policies can impact significantly on world markets
for farm products. These economies have traditionally
discriminated heavily against their agricultural sectors,
particularly by setting producer and consumer prices of food
relative to industrial products well below international
levels (measured at shadow exchange rates) (p.274). These two

265
authors (1992, pp.274-276) state that: "Unfortunately, it is
not possible to estimate even roughly the effects of the
policy distortions in the CPEs for several reasons:
. Numerous prices often operate simultaneously with
restriction on inter-regional trade enabling prices to
differ also across regions within a country;
. Quantitative restrictions affect producer and consumer
activities much more in these than in other economies
e.g. food queues at food shops are a dear manifestation
of rationing on the consumer side;
. The currencies of these countries are typically not
convertible and the official prices for foreign exchange
are usually grossly overvalued;
. Gross distortions to prices and qualities in markets for
non-food products to the extent to which agriculture is
discriminated against (or favoured) is even more
difficult to ascertain than in developing countries.
"Thus to say the very least, modelling the response of agents
to price or policy changes in these countries is somewhat
problematic."
Despite this, Tyres and Anderson (1992, pp.282-288) apply
their world food model to China under various assumptions and
two different growth scenarios. Their conclusions are as
follows:
If real incomes per capita grow at the conservative rate of

266
4.3% per year between 1986 and the end of the century the
regression equations project agriculture's shares of
employment and GDP to fall to 50% and 25% respectively.
However, if a growth rate of per capita incomes of 7.7% is
maintained agriculture's shares would be as low as 43% of
employment and 20% of GDP. This implies that real
agricultural GDP would grow at 2.8% (conservative scenario) or
4.4% (optimistic scenario).
The four specific assumptions for the optimistic scenario as «
compared with the conservative one for the 1990s are:
. national output and hence income to grow 50% faster;
. food productivity growth to be 50% faster (except for
rice) ;
. population to grow at a slower (1.3% p.a.) rate than 1.7%
p.a. ;
. the proportion of livestock grainfed to be somewhat
higher.
In both scenarios real domestic food prices in the 1990s are
presumed to remain unchanged from their 1990 level. The
impact made by faster growth on China's food economy would be
considerable. Overall self-sufficiency in the seven food
groups is projected to continue its decline of the 1970s and
1980s to 90% by the year 2000 in both scenarios. The
projected effects of faster economic growth in China on
international food prices would be higher (by 3%) in the
optimistic scenario.

267
"In conclusion, the development of the Chinese economy is
almost certain to lead to an increasing demand for food (and
especially feed) imports, during the next decade and beyond.
These demands will become even more pressing as
industrialisation proceeds rapidly and the government lags
behind in allowing domestic food prices to rise towards
international levels." (p. 294)
It seems likely that agriculture will become a relatively much
smaller part of a growing Chinese economy contributing by 1995
perhaps only three-fifths of employment, one quarter of GDP
and one-sixth of exports (excluding some "processed
agricultural exports"); and that China's importance in world
agricultural exports will grow little in aggregate, while its
importance in agricultural imports will more than double
during the 1980s (1987, p.130).
With regard to policy implications for industrial countries
like Australia, liberalising their agricultural policies as is
the policy of the GATT Uruguay meeting will not only reduce
the enormous cost of present protectionist policies but also
encourage developing and centrally planned economies to reform
their policies (1992, p.308).
In the view of these two authors, formerly centrally planned
economies have much to gain from opening up and relying more
on markets than planning. Even if they were to become large
importers of food as a result, as would be the case in the

268
optimistic scenario for China, the impact on international
food prices and hence on per unit price of their imports need
not be very large due to the flexibility of the world food
market even in the presence of current insulation policies.
For this to happen, however, two sets of assurances might be
sought by such countries as they embark on their economic
reforms: one is that food exporting countries agree not to use
food export embargoes as a political or economic weapon and
the other is that industrial countries' markets be open to the
exports of these reforming economies; without the latter, they
would not have the hard currency to purchase imports from the
West (p.310). In other words, the best of all possible
worlds.
Further comments on the outlook for agriculture in the year
2000 are furnished by Roningen et al. (1989 pp. 615-626) whose
conclusions are as follows:
The secular decline in real agricultural prices that we have
observed over the last few decades will continue to the end of
the century the exceptions being that of ruminant meat and
dairy products whose prices will rise slightly. (This will be
due to the high income elasticity of demand for animal
products and the rapid population and income growth in most
developing countries (p.619)). This trend, however, could be
reversed under two conditions: a breakthrough in GATT
negotiations that could lead to substantial policy reforms in
developed countries or accelerated economic growth as occurred

in the early 1970s.
269
The picture for the developing countries over the next decade
is problematic. Rapid increases in population are likely to
create expansions in demand that would outpace growth in
supply, increasing developing countries' food import costs.
Small changes in population are not likely to change the
outlook substantially. Self-sufficiency in agricultural
products for developing countries would be lower in the year
2000 (p.620). Their projected growth in supply would be
unable to keep up with their expansion in demand.
These countries, however, would be better off if developed
countries liberalised their agricultural policies. If
developed countries multilaterally eliminated all assistance
to agriculture and liberalised their agricultural markets by
the year 2000, they would gain nearly USD 27 billion annually
(pp.620-622). Their farmers would suffer real income losses
because increases in prices would not be sufficient to
compensate for the loss of government assistance. However,
developing countries would be more self-sufficient in
agricultural products and would improve their agricultural
balance of trade substantially (p.623).
They note that trade liberalisation and changes in economic
growth influence world agriculture much more than slight
changes in the assumed rate of population growth (p. 625).

270
7.4 Summary of Findings of this Study
In this study data prior to 1990 are official figures as are some
projections. For others fundamental analysis and technical
analysis of both price change and volume of transactions using
historical trading, trends and weighted averages were used. In
addition, due to the complexity of the topic and the uncertainties
of virtually every factor examined, the author has included
experience gained from field research, personal communications
with leading figures in the industry, and first-hand knowledge of
the market's practical reality.
In 1992 China was Australia's second largest food export
destination.
By the year 2000, it is estimated by the MOA that:
. China will have increased her dairy herd to 5,500,000;
. The number of privately owned dairy farms will have increased
by approximately 8%;
Basing projections on various ratios of farmgate to retail price,
the following proportions of the dairy market segment in the year
2000 were obtained:
. liquid milk 40.00% . milk powder 32.00% . butter 0.58% • yoghurt 8.50% . ice-cream 1.50% . whey powder 1.8 6% . cheese 3.10% • condensed milk 2.90% • dairy food ingredients 9.56%

271
In a similar manner, per capita consumption estimates were as follows:
. liquid milk 2835.07g p.a. . milk powder 22 68.06g p.a. . butter 41.11g p.a. . yoghurt 602.45g p.a. . ice-cream 106.32g p.a. . whey powder 131.83g p.a. . cheese 219.72g p.a. . condensed milk 2 05.54g p.a. . dairy food ingredients 677.58g p.a.
These per capita estimates total 7,087.68g per annum. Based on
present conditions and assuming a static population of 1.2 billion
this figure gives a total domestic consumption of 8,505.216 g per
annum in agreement with the milk production estimate of 8,505,210
tons (Table 4-1-10) . However the estimates are based on the same
data and do not take into consideration the fact that there is
currently a scarcity of liquid milk in China, that GDP per capita
is rising, that the Western food fashion is becoming more and more
popular and that the population is not static but increasing, and
so there will be, as now, a shortfall in product available which
will be met by imports.
In the opinion of all the people interviewed in the course of this
research, China will continue to invest in her present system of
intensive dairy farming. This will involve cattle breeding
programs with careful genetic selection and artificial
insemination techniques. This program will include not only semen
straw imports but also live cattle including dairy cows and
Australian Friesian Sahiwal (AFS) breed stock.
Intensive dairy management relies on vast quantities of grain and
fodder crops in which Australia can act as a prime supplier. Feed

272
additives will become increasingly important as management becomes
more aware of their potential. Australia is also eminently able to
provide these.
There will be a strong market for milk handling equipment, such as
milking machines, refrigerated milk vats, pumps and milk tankers
which Australia is well placed to supply in this expanding market.
Increased dairy consumption will also require the establishment of
an increased number of small processing factories. This will give
rise to a strong market for milk processing machinery. Much of
this market will be able to be provided by Chinese local light
industrial plants or joint venture plants. However Australia could
participate, even now, and achieve a market share.
As management increases in expertise, quality controls will assume
a more important role. Laboratory equipment and facilities will be
required and there will be a big demand for milk analysis,
antibiotic detectors and pollution indicators.
With regard to final products, Australia already exports UHT milk,
milk powder, whey powder, butter and cheese to China.
As mentioned, there are no major opportunities in the future for
Australia to export UHT milk to China. The international hotel
milk market is very small and the trend is very much in favour of
joint ventures. However, there will be a strong market for milk
supplements (calcium and lactose).

273
Much of China's population are accustomed to using milk powder
(WMP or SMP) in their homes to provide liquid milk for drinking.
Processing factories also use SMP and butter in re-combined liquid
milk to supplement low production in the off-season. This product
is mixed with fresh milk before retailing. It has been estimated
that there will be a 2% annual increase in imports of SMP in the
coming years.
It is also possible that China will reduce her import tariff on
SMP which will enhance the opportunities for Australian producers.
As discussed, at present the EC milk aid program virtually
dominates the Chinese large city markets. If this program ceases
there will be a vacuum for competitive products like those of
Australia.
Australian expertise in formula diversification would be another
avenue for export. Creation of products which suit the Asian
palate e.g. fruit and coconut flavourings have great promise for
the future. This should be done in joint venture projects.
The butter exports to China are for the production of recombined
liquid milk, confectionary and the international hotel trade. The
former presents a considerable market volume but purchases are
dependent upon sales of SMP in conjunction with the butter.
Australia is currently exporting extended life yoghurt which has a
shelf life of 10 weeks. It would be possible to penetrate the

274
Chinese market (international hotels and supermarkets in Southern
China) with this product.
There is a large market for yoghurt cultures and flavourings.
Australia, in contrast to New Zealand, has a wide variety of
flavourings which could be promoted whilst others could be
developed specifically for Chinese taste preferences.
Ice-cream pre-mix is currently being exported to Hong Kong. There
would be an enormous market for this product in China. This also
applies to UHT soft serve and UHT yoghurt soft serve which are
newcomers to the market.
The fast food industry is rapidly developing in China at the
moment. These outlets require a high volume of shredded Cheddar
cheese. Australian cheese is extremely competitively priced and
there is no doubt of the success of this export to China in the
1990s.
China already imports an enormous quantity of whey powder for use
in feed ingredients and infant formulae. It is estimated that
demand for whey powder will increase at a rate of 2 0% annually
over the next decade.
Overall the market for sweetened condensed milk is in decline,
however there is still a market for flavoured sweet condensed
varieties in small towns.

275
In summary, as the level of technology improves and the resulting
product sophistication is accepted by the populace the demand for
dairy products like milk powder, yoghurt, ice-cream and cheese
will soar. This will shift the import volume of dairy products to
China to a much higher level.
In addition to the sale of pure dairy products, whey powder,
butter and milk powder will all feature strongly as good
ingredients for bakery and confectionary lines and in the
stockfeed industry.
The total consumption of dairy products in China is forecast to
continue to increase at the rate of 8% annually. Local milk
production is increasing at only 5.5% leading to a 2.5% gap which
currently can only be filled by imported products.
The import market value for dairy goods has been estimated at USD
100 million per annum indicating a bright future for the industry.
7.5 conclusion
In 1993 the European Community (EC) and European Free Trade Area
(EFTA) will join to form European Union (EU) , a group of 19
nations and 380 million people, said to be the world's largest
single market... but is it?
To date China, now regarded as the "Japan of the 1950s', remains a
bloc of more than 1 billion people offering extraordinary

276
opportunities for skilful marketing strategies.
In almost every economic publication perused today one reads of
China as being:
. "the fastest growing economy on earth" (Worthy, 1992, p.
18) (Shepherd, 1992, p. 64);
. "the greatest investment story in the world right now"
(Friedland, 1992, p. 47);
. "the single big Asian market that we should all put our
effort into" (Gilchrist, 1992, p. 53);
and so on.
Likewise reminders of what Australia's role should or could be in
the area of trade with the booming Asian economies abounds:
"Australia's main task over this decade is to fit into Asia"
("Odd Man In", The Economist, 1992, p. 3);
"Australia has the chance to be the lucky country all over
again" (Austrade's Export Report, in BRW, 1992, p. 65);
"by 1994 about 75% of Australia's overall increase in export
growth will be in the North and South-East Asia (Tucker, The
Voice of Business, 1992, p. 12).
Trade between Australia and China has grown significantly over the
last decade. This trade was inevitable for each country possesses
what the other lacks, namely a highly developed agricultural and
mining sector in Australia and a huge low-cost labour force in
China. in addition, at present Australia has a comparative
advantage in minerals, energy and agriculture and China has a
277
comparative advantage in manufacturing (textiles, clothing and
footwear).
A country's comparative advantage in agriculture is usually
measured by agriculture's share of exports from the country
concerned relative to the share of agriculture in world exports.
According to Anderson and Tyres (1987, p. 128) the so-called index
of "revealed" comparative advantage for China fell in the period
1970-1980. Its "revealed" comparative disadvantage is projected
to rise. In addition, trade theory suggests that the lower a
country's land/labour ratio the weaker is likely to be its
agricultural comparative advantage to that of other countries with
similar capital/labour ratios. If the strategy of exploiting
comparative advantage was applied throughout the economy, the
manufacturing sector would expand its exports of labour-intensive
products which would provide the foreign exchange to purchase food
and feed imports (Anderson and Tyres, 1987, p.145).
The same authors (1992) predict that Chinese agricultural imports
will more than double in the 1980s and there will be an increase
in Chinese dairy imports of 8 million tonnes p.a. which will cause
an increase in world prices if the USSR has still not undergone
agricultural reform. Roningen et al. (1989) while predicting a
secular decline in real agricultural prices excludes dairy
products "whose prices will rise slightly". ABARE predicts a rise
m both international production and international demand; further
that Australian domestic production will fall but the value of
Australian dairy exports will rise by 13% in 1993-94.

278
It appears that there is a general consensus that in developing
countries self-sufficiency in agricultural products will decline
and that demand for dairy products will increase to the year 2000
and this in particular in China. The key to success for Australia
in penetrating this market lies, apart from successful
deregulation of its own industry, in understanding the Chinese
market and in adopting a long-term strategy. The importance of a
successful outcome to the GATT talks on which the actions of the
EC and US depend is vital to Australia's future. In addition, it
is imperative to be flexible for the time scales for many of the
factors discussed are unknown e.g. for China's decision on whether
to remain self-sufficient in agriculture, for a change in
government policy concerning trade restrictions (acceptance as a
member of GATT) and domestic pricing, for GDP per capita to reach
a certain threshold; for recovery in Eastern Europe and the CIS;
for infrastructure improvements in China, for reduced land
availability and environmental effects to make a serious impact,
for increasing population to impact on policy, and for foreign
investment in joint ventures to impact more fully on the Chinese
market.
In the point of view of this study, the most successful strategy
would be to export a number of value-added products emphasising
Australia's healthy and clean environment to test the market and
gain product brand recognition. Long-term benefits will only
eventuate if Australia then sets up joint-venture projects in
China or enters into co-production agreements since this is stated
Chinese foreign policy.

279
The products which have greatest chance of success include whey
powder, Cheddar cheese and skim milk powder.
Direct trade can also succeed with value-added products like ice
cream pre-mix, UHT soft serve and "fromage frais", which also
eventually could enter into joint-venture projects. The recent
success of dairy desserts like: Fruche and Pietit Miam in
Australia which latter increased sales from AUD 10 million in 1989
to AUD 80 million in 1992 (Shoebridge, 1993', p. 59) could also
be achieved in China.
Australia has well-known inventive skills which could be tapped in
the development of new products to maintain direct trade.
Australian technology and expertise can also be exported to China.
At the moment, this is extremely expensive for China's budget but
this cost could be greatly reduced by entering into barter
arrangements. In the long term it is believed that income from
Australian dairy technology will outstrip • that for her dairy
products.
In conclusion, taking into consideration all of the factors
examined and mindful of the forecasts of the experts, China will
continue to be a huge potential market for the Australian dairy
industry in manufactured goods and joint ventures in the short
term and technology in the longer term. However, it is crucial
that exporters and planners keep in mind what will happen when
China, one fifth of mankind and already the biggest producer of
280
large numbers of industrial and food products, really starts
industrialising and exporting (Rohwer, 1992 "The Titan Stirs", p.
18); keep in mind also Napoleon's prediction that "When China
wakes it will shake the world".

8
ADDENDUM
The World Bank thinks that by 2000 fully half of the growth of the world economy will come from East Asia. If the past decade's ferocious pace keeps up, this could soon be the world's richest region, prompting proud talk of a "Pacific Century".
"East Asia's wobbles." The Economist Jan. 5, 1996 p.27

282
DEVELOPMENTS IN THE FIELD SINCE THE ORIGINAL SUBMISSION OF THIS THESIS (1st September 1993):
8.1 The Chinese Dairy Industry:
Dairy Production in China: China's dairy industry increased its production capacity to 4,500,000 tons in 1994 worth 5.23 billion yuan In 1994, China had 500 dairy enterprises includinq 150 comparatively large scale ones. China has invested in making dairy machines and has 6 0 such enterprises able to manufacture 102 types of equipment ranging from milking machines, evaporators and ice-cream machines to packaging machinery. (Xinhua News Agency, Beijing, 6 July, 1995)
Consumer Product Preference: High calcium, non-fat milk powders are popular with health-conscious Chinese because they help reduce osteoporosis. (National Business Review, 25, Aug. 1995)
One Regional Dairy Corporation Forecast: T n e Shanghai Dairy Corporation intends to establish ten dairies each with between 400 to 500 cows each year over the next three years to meet local demand for fresh milk and dairy products. The programme seeks to create a mass supply of milk and dairy products for city-wide distribution by 1998. (P. Chen, Shanghai Star, 8, Sept. 1995) By the year 2 000, the Shanghai Dairy Corporation expects to be the largest dairy producer in the country. (Shanghai Star, 2, Feb. 199 6)
8.2 The Australian Dairy Industry: Dairy Production in Australia:
In Australia domestic milk production in 1992-93 was 7,327 million litres an increase of 8.9% compared with 1991-92; Average production per dairy cow was 4,318 litres in 1992-93. (ABS, Year Book Australia 1995, 77, p. 491)
Butter Exports to China: Australia exported 44 tonnes of butter to China in 1993 and the provisional figure for 1994 is 100 tonnes. (ADC, Dairy Compendium, 1994 p.60)
Dairy Production Forecasts for Australia: In 1995-96, Australian milk production is forecast to rise by 5% to 8,600 million litres. The average Australian manufacturing milk price is forecast to increase by 16% in 1995-96. The value of Australian product exports is forecast to rise by 39% to AUD 1,925 million in 1995-96. ("ABARE Economics, Australian Commodities 2 (4) Dec 1995 p. 446)

283
Australian Joint-Ventures in China: To date there are five companies/associations in Australia involved/interested in joint ventures in China.
OUF Industries. a Queensland company, took over Associated Dairies of Victoria who had started negotiations for a joint-venture with the Shanghai Yong An Dairy Company. The joint-venture was established in 1993-94. The processing factory uses local milk to produce liquid milk, UHT milk and yoghurt. Victorian Dairy Industry Authority is associated with the Tianjin State Farm Bureau. They process local milk in small UHT 250 ml tetrapaks with flavourings (chocolate and strawberry) imported from Australia. The object is to establish the flavoured milk brand name "Big M". Sales cover the Tianjin, Beijing and Dalian region. Murray-Goulburn Co-operative has a joint venture with the Tianiin Dairy Corporation, registration certificate dated May 1995. The factory, now called, "Tianjin Murray-Goulburn Dairy Company", produces series whey powder and formulated WMP by dry-blending 100% imported Murray-Goulburn milk powder. Ausdairy, a subsidiary of the Australian Dairy Corporation, has a memorandum of understanding (1995) with the Hangzhou Food Factory in Zhejiang province to set up a multi-disciplinary factory producing milk powder, ice cream, UHT milk and yoghurt. Their aim is to establish Australia as a preferred supplier of dairy raw materials for repacking in China with value added dairy products. Since 1994, Bonlac Foods has been interested in setting up a joint venture in Tianjin or Guangzhou. They are currently exporting branded product to China.
8.3 World Trade Regulation, Regionalism and Alliances:
GATT and the World Trade Organisation (WTO): 15th December 1993, after seven years of negotiations, the Uruguay Round of GATT ended successfully bringing agriculture under its ambit. (The Economist, Dec. 18, 1993 pp. 9-10) The outcome is a complex set of new undertakings and agreements which will govern global trade in the future. The GATT aims to provide a collective protection for all countries, and in particular small and medium-sized countries. 1st. January 1995 the WTO took over from GATT. It provides a dispute settlement process and ensures that these countries are sufficiently protected against unilateral action by the major economic powers. It is the first time that agriculture and textiles are to be fully integrated under GATT. The treaty is scheduled to come into effect during 1995 with many of its key provisions to be phased in over six years. (ABS, Yearbook Australia 1995, 77, p. 465) More than two dozen countries, from China to Vanuatu, are in the queue to join the WTO. Most face a long wait. ("World Trade. Knock, knock" The Economist, Jan. 13, 1996 pp. 80-81)

284
GATT's Impact on Agriculture: The OECD estimates that the outcome on agricultural and industrial products alone will provide a boost to the global economy of AUD 418 billion by the year 2002. The Australian Industry Commission, has estimated that the long-term effects of the Round will eventually be an annual increase in Australia's exports of over AUD 5 billion and an increase in Australia's GDP of around AUD 3.7 billion per year. All sectors of the Australian economy stand to benefit, especially agriculture. (ABS, Yearbook Australia 1995, 77, p. 465) The key result for the dairy sector will be a reduction in export subsidies. Both the US and the EU will be cutting sales of subsidised SMP while the EU will also cut subsidised cheese. There will be access into the US, EU and Asian markets with quotas being increased and tariffs being reduced. This will allow a more predictable, environment for Australia to trade in. However, there needs to be restructuring of the Australian industry's market support system. Under present 'arrangements, Australian exports are classified as subsidies under the terms of the agreement and the volume of subsidised exports will have to be reduced for Australia to comply with the limits on volumes of subsidised exports. (ABS, Yearbook Australia 1995, 77, p. 467) China will be one of the world's biggest gainers from the Uruguay Round, if it gets in. That is because its export growth has centred on manufacturing, and textiles in particular. The Uruguay round liberalised trade in manufacturing more sweepingly than trade in the primary products that make up a larger share of other poor countries exports. The World Bank estimates that China's exports to America, the EU and Japan would increase by 40% under a post-Uruguay GATT. The average poor country would enjoy only a 15% rise. (China wants to join the club." The Economist, May, 14, 1994, p.29)
Trade Regionalism: There is a big trend in the world economy towards "regionalism" and the reassertion of economic geography. More than half of Asian countries' trade is now with other Asian countries, catching up with the 60% of the EU's trade that is internal. China's rapid strides towards a market economy are transforming it from Asia's outsider to its core: at almost USD 200 billion a year in exports and imports, China is gaining fast on the world's top ten traders. ("The trade winds shift." The Economist, Nov. 20, 1993, pp. 13-14)
Trade Alliances: 1st January 1993 the EC officially became a "single market" granting capital, goods, services and people free movement within its borders and heralding the birth of the European Union (EU) on 1st November 1993. (Not the union they meant" The Economist, Nov. 6, 1993, pp. 56-57)

285
1st January 1995 the EU admitted Austria, Finland, Sweden and Norway, increasing its membership from 12 to 16. ("The door opens." The Economist, May, 7, 1994, pp. 84-85) 17th November 1993 the US House of Representatives approved the North American Free Trade Agreement (NAFTA). ("The trade winds shift" The Economist, Nov. 20, pp. 13-14) . 1st January 1994 NAFTA came into being. 18-20th November 1993 the Asia Pacific Economic Cooperation forum (APEC) (comprising 18 countries) met in Seattle, USA. Agreement to create a "community of Asia Pacific Economies" ("The trade winds shift" The Economist, Nov. 20, 1993, pp. 13-14) November 1994 APEC meeting in Jakarta, Indonesia. "Commitment to free and open trade and investment" in the region by 2 010 for the industrial nations that make up 85% of regional trade and 2020 for the rest. November 1995 APEC meeting in Osaka, Japan. "Action agenda" to begin implementation of their commitment on 1st January 1997. ("The case for APEC. An Asian push for world-wide free trade." The Economist Jan. 6, 1996, pp. 76-77)
To date APEC has worked surprisingly well. There is virtually no secretariat and the Brussels bureaucracy is viewed as a nightmare to be avoided at all costs.
The history of other successful regional organisations, and the dynamics of the region's private sector suggest that APEC may achieve its goals well before the agreed dates of 2010 and 2020. There is good reason to believe that it will represent the first big international institutional success of the post-cold-war era. ("A case for APEC", The Economist, Jan. 6, 1996, pp. 76-77)
8.4 Outlook for World Dairy Markets: The short-term outlook is for a continuing firm product demand, tight supply and as a consequence a marked increase in world prices. Average world prices for 1995-96 are forecast to increase: 3 6% for butter, 18% for cheese and 13% for Skim Milk Powder. (ABARE Economics, Australian Commodities 2 (4) Dec. 1995 p. 446) Milk Sales in Asia:
Over the period 1986-1992, the amount of milk sold in Thailand has trebled reaching a value of USD 610 million in 1992. The Thai's natural aversion to dairy products is being overcome by a combination of a government health campaign, the increasingly cosmopolitan tastes of the Thai middle-class and manufacturers' experiments with coloured and sweetened milk. ("Pastures new." The Economist, Oct. 9, 1993 p. 73)
European Union: . . In 1995, farm incomes in the EU rose by an estimated 2.6* in real terms, to a 2 0-year high. World markets helped with

286
prices of cereals and dairy products rising but the real reason was the EU's attempt to reform farm subsidies Brussels compensated farmers with direct payments set too high for a drop in income that never eventuated. ("Milking it " The Economist, Jan. 2 0, p.74)
USA: In 1995, Mead Johnson of the USA opened a USD 30 million joint venture in Guangdong with the Light Industry Bureau of Guangzhou and the Guangzhou Economic and Technological Development Zone to manufacture milk products for the domestic market. Plant capacity will be up to 15,000 tonnes of milk products a year. Ingredients will be imported from New Zealand and processed by equipment from the USA, Spain and Germany. (Economist Intelligence Unit, Business China, 4 Oct 1995)
Russia: 27th October 1993 Russian decree allowing agricultural land to be bought and sold freely in Russia for the first time since 1917. The result could change Russia but it may take some time before a quarter of the butter consumed in Britain comes from Siberia, as it did before Russia's 1917 revolution. The rebirth of Russia as a food exporter no longer seems a distant dream. ("Europe's once and future granary" The Economist, Oct, 30, 1993 pp. 58-59). 28th February 1996 Russia admitted to the Council of Europe.
8.5 Some Recent Publications:
"A billion consumers." (A survey of Asia) The Economist. (1993) Oct. 30, p.60 (1-24)
ABARE Economics (1995) Australian Commodities Forecasts and Issues. Commonwealth of Australia, 2 (4) Dec. 1995.
Australian Bureau of Statistics (1996) 1995 Year Book Australia" ABS, 77.
Australian Dairy Corporation (1994) Dairy Compendium. Australian Dairy Corporation.
"Europe's once and future granary." The Economist (1993) Oct. 30, pp. 58-59.
Garnaut, R. (1994) Asian Market Economics. Challenges of a Changing International Environment. Institute of Southeast Asian Studies, Singapore.
Garnaut, R. and Drysdale, P. (1994) Asian Pacific Regionalism. Readings in International Economic Relations. Harper Educational Publications, Pymble, NSW.
Hughes, H. (1995) "Why have East Asian Countries led economic development?" The Economic Record, 71, March pp.88-104.
"Milking it." (1996) The Economist, Jan. 20, p.74. "Not the union they meant." (1993) The Economist, Nov. 6, pp.
56 and 59. "Pastures new." The Economist, (1993) Oct. 9, p. 73. "The case for APEC. An Asian push for world-wide free trade."
(1996) The Economist. Jan. 6, pp. 76-77.

287
"The trade winds shift." (1993) The Economist. Nov. 20, pp. 13-14.
"World Trade. Knock, knock." (1996) The Economist. Jan., 13, p. 80.
"World trade ordeal." (1995) The Economist. Nov. 4, p.30.
i
9
APPENDIXES
"Tse Kung asked, saying, "Is there one word which may serve as a rule of practice for all one's life ?"
The Master said, "Is not Reciprocity such a word? What you do not want done to yourself, do not do to others."
Confucian Analects

289
APPENDIX 1 Source:
MILK PRODUCTS YIELD CONVERSION Dairy Compendium (1991) Australian Dairy Corporation, Melbourne. p. 78.
All data in the research are based on the following conversions: ^
Milk Product Yield Conversion Table
BUTTER/SMP
887 kg SMP 518 kg Butter 52 kg BMP
10,000 Litres milk 429 kg Fat 332 kg Protein 910 kg SNF
BUTTER/CASEIN UMP
300 518 52
kg Casein kg kg
Butter BMP
1,265 125 13
kg kg kg
WMP Butter BMP
CHEDDAR
1,031 54 5
619
kg Cheddar kg Butter kg BMP kg Whey Pdr.
Milk Product Yield Conversion Table Source: Dairy Compendium (1991) Australian
Dairy Corporation/ p. 76.
Milk Input Conversion Table
The following table shows the amount of milk needed to produce a given amount of each dairy product. Note that because of the joint nature of butter/SMP and butter/casein lines, these products are derived from the same milk input. Hi Ik Input Conversion Table
1,000 TONNES PRODUCT
BUTTER
SKIN MILK POUDER
BUTTERMILK POWDER
CASEIN
CHEDDAR CHEESE
| WHOLEMILK POUDER
ML MILK
19.31
11.27
193.05
33.33
9.70
7.91
'000 TONNES MILK
19.88
11.61
19.88
34.33
9.99
8.14

290
APPENDIX 2 DAIRY EXPERTS INTERVIEWED IN CHINA
1. China's Ministry of Agriculture
1.1 Mr. Zhang Zhen Guo Department of International Cooperation, China's Ministry of Agriculture Officer
1.2 Mr. Xu Ji Department of International Cooperation, China's Ministry of Agriculture Deputy Director
1.3 Mr. Wang Jian Department of International Cooperation, China's Ministry of Agriculture Deputy Director
1.4 Mr." Sun Sheng Zhi Department of International Cooperation, China's Ministry of Agriculture Officer
1.5 Mr. Zhang Jian Qu Department of International Cooperation, China's Ministry of Agriculture Officer
1.6 Mr. Yin Cheng Wen Deputy Director of Dairy Project Office, China's Ministry of Agriculture Deputy Director
1.7 Mr. Zhang Chuan Yi Deputy Director of Dairy Project Office, China's Ministry of Agriculture Deputy Director
1.8 Mr. Zhao Shu Bo Division Chief of Import Office, China's Ministry of
Agriculture Director
2 Cenoway Ltd. Co.
2.1 Mrs. Li Zhi Ru Managing Director
2.2 Mr. Zhu Pin Xian Executive Director

291
3 Beijing Agricultural University
3.1 Professor Rong Yi Professor of Beijing Agriculture University Honorary Researcher, Chinese Academy of Agricultural
Science Vice-President, Chinese Feed Industry Association
4 China Agricultural Academic Science Institute
4.1 Professor Liu Zhao Beijing Zhong Gu New Biotechnology Development
Corporation
4.2 Professor Zhou Ding Nian Feed Research Institute, China's Academy of
Agricultural Sciences General Secretory of China Dairy Association
5 Beijing Municipal Dairy Corporation
5.1 Mr. Xiao Chun Yuan General Manger
5.2 Mr. Wang Zhu Qing Vice General Manager
6 Beijing State Farm Administration Bureau
6.1 Mr. Zhao Dong Sheng Deputy Director
7 Beijing Hua Guang Dairy Corporation
7.1 Mr. Song Feng Zao Director
8 Beijing Bei Jiao State Farm
8.1 Ms. Liu Bao Zhen Party Branch Secretary
8.2 Mr. Dong Meng Lin Deputy Director
9 Beijing Xi Jiao Dairy Factory
9.1 Mr. Jia Lian Dong Deputy Director

292
10 China's Ministry of commerce China Sugar & Wine Company
10.1 Mr. Hu Wen Ming Director
10.2 Ms. Liu Fang Officer
11 China's National Cereal & oil import & Export Corporation China beverage & Foodstuffs Import & Export Corporation
11.1 Mr. Han Xiang Qing Deputy Chief Director
11.2 Ms. Yan Min Manager
11.3 Ms. Huang Jin Manager
12 Ch^a^Gejaeral Corporation of Animal Husbandry, Industry
12.1 Mr. Yang Xin Rui Deputy Chief Director
12.2 Mr. Luo Zhi Gang Manager of Dairy Division
13 China's National Commodity Inspectation Bureau
13.1 Mr. Shi Shu Sheng Director of Inspection Control Division
13.2 Mr. Bao Jun Kai Veterinarian
13.3 Mr. Yuan Ke Wen Deputy Director
14 Ministry of Light industry China Food industry Supply and Marketing Company
14.1 Ms. Mu Jing Jun Chief Director
14.2 Mr. Cai Jian Division Director
14.3 Mr. Jia Yu Xin ... Officer
14.4 Mr. Ping Guang Yuan Officer

15 Hebei Provincial Animal Husbandry & Fishery Bureau
15.1 Mr. Guo Tai Chief Director
15.2 Mr.. Fan Jian Wu Director of the Foreign Trade Office
15.3 Mr. Gu Chuan Yue Director Assistant
16 Shi Jia Zhuang Municipal Dairy Corporation
16.1 Mr. Wang Yu Liang Technology Manager
16.2 Mr. Cai Shu Wei Merchandise Manager
16.3 Mr.. Li Bao Ying Financial Manager
17 Hebei Provincial Cereal & oil Import & Export Corporati
17.1 Ms. Zhang Huan Xin Manager
17.2 Mr. Xia Jun Tao Officer
18 Qing Dao Municipal Dairy Project Office
18.1 Mr. Yang Yong Dong Vice Manager
18.2 Mr. Tang Xiao Dong Deputy Director
19 Qingdao Municipal Commission of Foreign Economic Relations & Trade
19.1 Mr. Chu Cheng Dong Officer
19.2 Mr. Cong Yan Director
20 Qing Dao Foreign Trade & Development Corporation
20.1 Mr. Luan Ying Xian General Manager
i»

294
21 Qing Dao Municipal Agricultural Committee
21.1 Mr. Zhu He Ting Deputy Director
22 Qing Dao Cereals, Oil & Foodstuffs Import & Export Corporation
22.1 Mr. Zheng Fang Si Deputy Chief Director
23 Qing Dao No. l Dairy Farm
23.1 Mr. Zong Zhu Giu Director
24 Shanghai Municipal Agricultural Committee
24.1 Mr. Yuan Yi Xing General Secretary
24.2 Ms. Ang Jin Lian Deputy Director of Foreign Affair
24.3 Mr. Jiang Shan Chang Investigator of Planning Division
24.4 Mr. Gu Yi Ping Official
25 Shanghai Food Import & Export Corporation
25.1 Mr. Wu Shun Bao General Manager
25.2 Ms. Cai Xiu Lian Vice Manager
25.3 Mr. Wu Rong Hua Officer
26 Shanghai Shen Feng Foods company Limited
26.1 ' Ms. Ding Yi Fang General Manager
26.2 Mr. Ren Rong Biao Deputy Manager
27 Shanghai Dairy Machinery Factory
27.1 Mr. Xin Cheng Hui Deputy Director

295 28 Shanghai No. 7 Dairy Farm
28.1 Mr. Yang Wei Rong ,A Deputy Director
29 Shanghai No. 3 Dairy Factory
29.1 Mr. Cao Hui Xing Director
30 Shanghai No. 8 Dairy Factory
30.1 Mr. Hu Ren Yu Director
31 Shanghai Dairy Training and Research Centre
31.1 Mr,. Qian Wei Deputy Director
32 Institute of Animal & Veterinary Sciences Shanghai Academy of Agricultural Science
32.1 Mr. Zhao Fang Gen Senior Animal Husbandry Specialist
33 Shanghai Dairy Corporation
33.1 Mr. Liu Gong Liang Deputy Chief Director
33.2 Ms. Xie He Fang Development Manager
33.3 Mr. Sha Zhen Xia Vice Manager of Development Division
33.4 Mr. Wang Guang Wen Animal Husbandry Specialist
33.5 Mr. Wang Hong Zhang General Adviser of Shanghai Dairy Corporation
34 Guang Zhou Foodstuffs Import & Export Corporation
34.1 Mr. Lag Fu Biao Deputy Manager
34.2 Ms. Yang Hong Officer
34.3 Ms. Liu Hui Zhu Officer

296
35 China's International Exchange of Agriculture Association
35.1 Mr. Xie Rong Sen Director
36 Agriculture Department of Guangdong Province
36.1 Mr. Han Hong Guang Deputy Director
37 Guang Zhou Dairy Factory
37.1 Mr. Li Wen Yu Deputy Director
38 Guanzhou Municipal Light Industry Bureau
38.1 Ms,. Gong Hai Rong Officer
39 Guang Zhou Fenghuang Integrated Farm
39.1 Mr. Jiang Yao Quan Director
40 Hang Zhou Food Factory
40.1 Mr. Zou Xi Jia Director

297
APPENDIX 3 CATTLE DISTRIBUTION IN CHINA Source: CSICSC* (1991) China Statistical Yearbook,
Beijing
PLACE NO.
0
1
2
3
4
5
6
7
8
9
10
11
12
13
14
15
16
17
18
19
20
21
22
23
24
25
26
27
28
, 29
wrv- it
30
PROVINCE
National Total
Sichuan
Henan
Yunnan
Guangxi
Guizhou
Shandong
Qinghai
Tibet
Anhui
Guangdong
Hunan
Inner Mongolia
Hubei
Xinjiang
Gansu
Jiangxi
Shaanxi
Heilongjiang
Hebei
Ji Lin
Shanxi
Liaoning
Fuji an
Hainan
J iangsu
Zhej i ang
Ningxia
Beijing
Tianjin
Shanghai
CATTLE AND BUFFALOES ('000 HEAD)
Total
102884
10080
8925
7675
7039
5901
5518
5386
5056
5012
4765
3992
3853
3515
3382
3379
3237
2416
2368
2079
1883
1793
1509
1295
1223
715
680
279
145
103
81
Cows
2691
45
29
54
5
17
29
65
233
14
29
7
394
25
476
112
13
42
540
95
50
82
60
21
1
35
40
19
65
23
71
Other Cattle
100193
10035
8896
7621
7034
5884
5489
5321
4823
4998
4736
3985
3459
3490
2906
3267
3224
2374
1828
1984
1833
1711
1449
1274
1222
680
640
260
80
80
10
PROPORTION OF REGISTERED DAIRY COUS
(X>
2.62
0.45
0.32
0.70
0.07
0.29
0.53
1.21
4.61
0.28
0.61
0.18
10.23
0.71
14.07
3.31
0.40
1.74
22.80
4.57
2.66
4.57
3.98
1.62
0.08
4.90
5.88
6.81
44.83
22.33
87.65
*CSICSC: China Statistical Information and Consultancy Service Centre

298
APPENDIX 4 GOAT AND SHEEP DISTRIBUTION IN CHINA Source: CSICSC (1991) China Statistical Yearbook,
Beijing PLACE NO.
0
1
2
3
4
5
6
7
8
9
10
11
12
13
14
15
16
17
18
19
20
21
22
23
24
25
26
27
28
29
30
REGION NAMES
National Total
Inner Mongolia
Xinjiang
Shandong
Tibet
Qinghai
Henan
Gansu
Hebei
Sichuan
Jiangsu
Yunnan
Shanxi
Shaanxi
Anhui
Ningxia
Heilongjiang
Liaoning
Jilin
Zheji ang
Guizhou
Hubei
Guangxi
Beijing
Tianjin
Hunan
Fujian
Shanghai
Hainan
Guangdong
Jiangxi
SHEEP AND GOATS ('000 HEAD)
Total
210021
30239
28308
20764
16769
16083
12795
11098
10745
9459
8508
7224
7096
6126
3980
3176
2833
2672
2336
1851
1777
1631
806
784
670
665
600
372
371
142
141
Goats
112816
9490
4494
15527
5662
2036
11295
2309
5626
5986
7974
5686
3039
4482
3823
903
342
734
150
774
1373
1607
806
521
364
660
600
289
371
142
140
Sheep
97205
20749
23814
5237
11107
14047
1500
8789
5119
3473
534
1538
4057
1644
157
2273
2491
1938
2186
1077
404
24
263
306
5
83
1
PROPORTION OF GOATS IN EACH PROVINCE
(X)
53.72
31.38
15.88
74.78
33.76
12.66
88.28
20.81
52.36
63.28
93.72
78.71
42.83
73.16
96.06
28.43
12.07
27.47
6.42
41.82
77.27
98.53
100.00
66.45
54.33
99.25
100.00
77.69
100.00
100.00
99.29

299
APPENDIX 5 MILK PRODUCTION COMPOSITION IN DIFFERENT PROVINCES
Source: CSICSC (1991) China Statistical Yearbook, Beijing
PLACE NO.
0
1
2
3
4
5
6
7
8
9
10
11
12
13
14
15
16
17
18
19
20
21
22
23
24
25
26
27
28
29
30
REGION NAMES
National Total
Heilongjiang
Inner Mongolia
Xinjiang
Shandong
Sichuan
Shanghai
Beijing
Shaanxi
Qinghai
Shanxi
Tibet
Liaoning
Hebei
Jilin
Zheji ang
Jiangsu
Gansu
Tianjin
Yunnan
Henan
Guangdong
Hubei
Fuj i an
Ningxia
Anhui
Jiangxi
Hunan
Guizhou
Guangxi
0 Hainan
TOTAL MILK PRODUCTION (TMP) ('000 TON)
4751
1027
396
356
296
268
227
218
212
210
179
158
153
143
121
113
89
81
77
76
74
56
52
49
41
26
22
11
10
9
1
COW'S MILK PRODUCTION (CMP) ('000 TON)
4157
1017
370
308
70
264
227
217
95
201
160
126
144
112
117
113
87
79
76
73
27
55
52
48
41
25
22
11
10
9
1
COW'S MILK PROPORTION IN THE REGION (X)
87.50
99.03
93.43
86.52
23.65
98.51
100.00
99.54
44.81
95.71
89.39
79.75
94.12
78.32
96.69
100.00
97.75
97.53
98.70
96.05
36.49
98.21
100.00
97.96
100.00
96.15
100.00
100.00
100.00
100.00
100.00
REGIONAL WEIGHT OF THE TOTAL NATIONAL PRODUCTION (X)
100.00
21.62
8.34
7.49
6.23
5.64
4.78
4.59
4.46
4.42
3.77
3.33
3.22
3.01
2.55
2.38
1.87
1.70
1.62
1.60
1.56
1.18
1.09
1.03
0.86
0.55
0.46
0.23
0.21
0.19
0.02
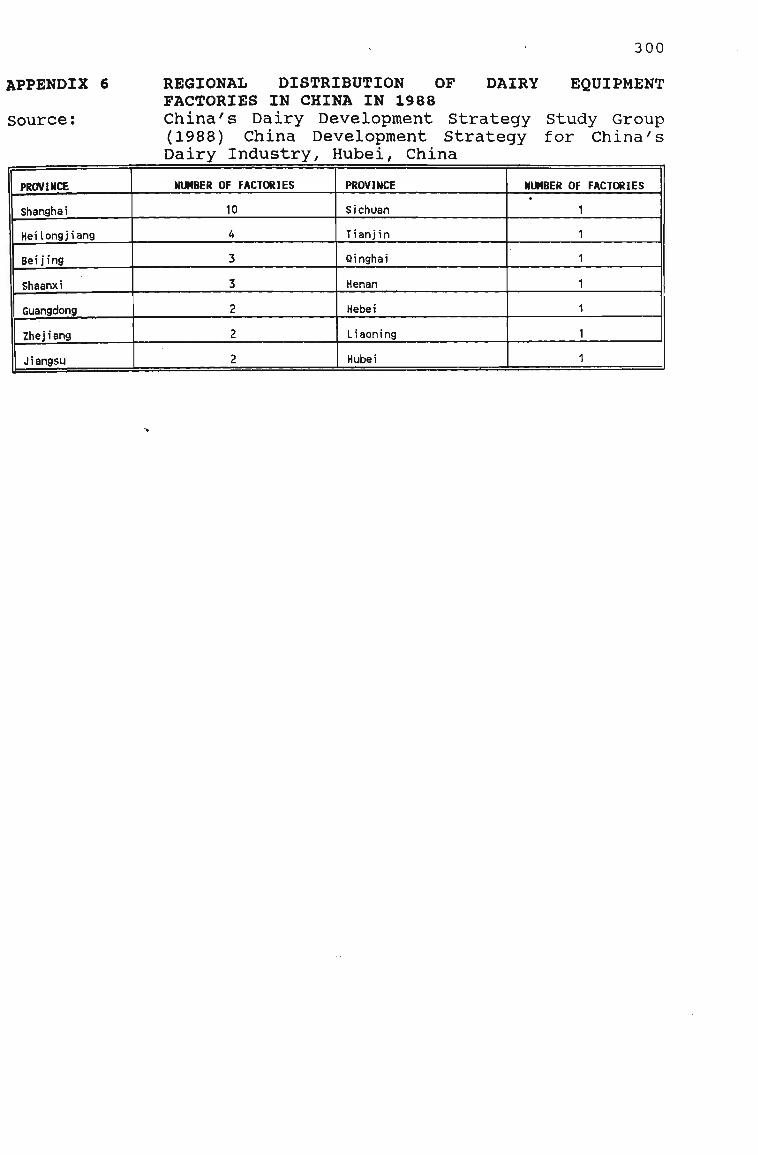
300
APPENDIX 6 REGIONAL DISTRIBUTION OF DAIRY EQUIPMENT FACTORIES IN CHINA IN 1988
Source: China's Dairy Development Strategy Study Group (1988) China Development Strategy for China's Dairy Industry, Hubei, China
PROVINCE
Shanghai
Heilongjiang
Beijing
Shaanxi
Guangdong
Zhej i ang
1 Jiangsu
NUMBER OF FACTORIES
10
4
3
3
2
2
2
PROVINCE
Sichuan
Tianjin
Qinghai
Henan
Hebei
Liaoning
Hubei
NUMBER OF FACTORIES

301
APPENDIX 7 DAIRY EQUIPMENT FACTORY LOCATIONS IN CHINA IN 1988
Source: China Dairy Development Strategy Study Group (1989) Development Strategy for China's Dairy Industry, Hubei, China
Product Catalogue Milk & Milk Delivery Equipment
Milk Storage
Pump
High Pressure Homogeniser
Milk reception Equipment
Centrifugal Separator
Evaporator
Drying System
Condensed Milk Machine
Butter Churn Ice-cream Machine
Malt Processing Machine
Filling & Packing Machines
Washing Equipment
Others
Whole Set of Equipment Analysis Equipment
Product Name Milking Equipment Milking Trolley Milk Receptacle Milk Bucket Milk Tank Trolley Milk Tank Truck Milk Tank Vertical Vat
Horizontal Vat Vertical Vat with Refrigerator Horizontal Vessel with Refrigerator
Centrifugal Pump Positive Displacement Pump
High Pressure Pump Vertical Homogeniser Horizontal Homogeniser Milk Tank
Milk Receiver
Vacuum Milk Tank
Separator
Butter Fat Indicator Mono-Stage Type External Evaporation Radiator Type Dual-Stage Type Trio-Stage Type Centrifugal Type Centrifuge Spray (Horizontal) Spray (Vertical) Two Stage Drying Crystallisation Vat Vacuum Crystallisation Vat Crystal Agitator Agitator Refrigerator Filling Machine Agitator (Mixer, Doser) Vacuum Equipment Oven Pelleting Bottle Cap Sealing Machine Bottle Sealing Machine Condensed Milk Filling Machine Can Sealing Machine Soft Packing Machine Pasteurised Milk Filling Machine Bucket Washing Machine Tube (Duct) Washing Unit Bottle Washing Unit CIP (Cleaning in Place) Unit Vibrator Sieve Filter Double Layered Container De-odour Device Milk Powder Yoghurt Butter Fat Indicator
No. of Product TVDes
4 1 1 4 1 8 1 12
6 1 4
16 9
17 2 5 4
8
3
11
3 5 2 3 3 1 5 3 13 3 1 2 1 2 7 4 1 1 1 1 2 2 1 2 3 3 3 2 2 2 2 2 5 5 1 7 1 4
Location
Shanghai Shanghai Shanghai Shanghai & Zhejiang Shanghai Shanghai Shanghai Shanghai, Zhejiang, Heilongjiang & Shaanxi Shanghai Shanghai Shaanxi, Shanxi
< & Zhejiang Shanghai Shanghai, Zhejiang & Jiangsu
Shanghai Ij Zhejiang Liaoning. Tianiin Heilongjiang, Shanghai, Zhejiang, Shaanxi Heilongjiang, Shanghai, Zhejiang, Shaanxi Beijing, Shaanxi & Shanghai Shaanxi, Qinghai & Jiangsu Shanghai. Qinghai Shanghai Shanghai Heilongjiang Shanghai j Fuji an Shanghai Heilongjiang Shanghai Zhe i i ang Shanghai Heilongjiang Shanghai Shanghai Shanghai Beijing Shanghai Shanghai Shanghai Shanghai Shanghai Shanghai Shanghai Guangdong Tianjin Bei iing Shanghai Shaanxi J i angsu Zheiiang Heilongjiang Zhejiang Shaanxi Shaanxi Shanghai Shanghai Zheiiana Guangdong

302
APPENDIX 8 COST STRUCTURE OF URBAN DAIRY FARMS IN 1988 Source: China's Dairy Development Strategy Study Group (1988),
"Development Strategy for China's Dairy Industry", Wuhan, Hubei! China.
URBAN AREAS I tea Total Costs per
Annum (Yuan) Costs per cow (Yuan)
Proportion of the Total Costs (Yuan)
FIXED COSTS
Depreciation 385672 964 22.45
VARIABLE COSTS
Feeding Costs
Personnel
Maintenance
Management, Admin, -etc.
Sub-total
TOTAL COSTS
1025701
144000
28405
134000
1332106
1717778
2564
360
71
335
3330
4294
59.71
8.38
1.65
7.80
77.55
100.00
RETURNS
Raw Milk
Sales of Animals
TOTAL RETURNS
PROFIT/LOSS
Return on "written down" capital (%)
1579930
207550
1787480
69702
4.06
3950
519
4469
175
88.39
11.61
100.00
The fixed and variable costs are based on figures for:
Depreciation of fixed costs including: buildings and yards (Yuan/cow) equipment (Yuan/cow) animals (Yuan/cow); and
Variable costs include: Production costs (feeding costs)
feed concentrates (Kg/cow) feed additives (Yuan/cow) forage (Yuan/cow) medicines (Yuan/cow)
Personnel wages and salaries (Yuan/year/person) bonus (Yuan/year/person) medical insurance (Yuan/year/person) pensions (superannuation) (Yuan/year/person)
Maintenance buildings and yards (Yuan/cow) equipment (Yuan/cow)
Other costs management and administration (Yuan/cow) power, water, etc. (Yuan/cow) interest from working capital (Yuan/cow) general (Yuan/cow)
Sales of animals cows for slaughter (Yuan/head) cows for re-stocking (Yuan/head) male calves (Yuan/head)

303
APPENDIX 9 COST STRUCTURE OF DAIRY FARMS IN PASTORAL AREAS IN 1988
Source: China's Dairy Development Strategy Study Group (1988), "Development Strategy for China's Dairy Industry", Wuhan, Hubei, China.
PASTORAL AREAS
Itea Total Costs per Annum (Yuan)
Costs per cow (Yuan)
Proportion of the Total Costs (Yuan)
FIXED COSTS
Depreciation 33463 669 20.15
VARIABLE COSTS
Feeding Costs
Personnel
Maintenance
Management, Admin, etc.
Sub-total
TOTAL COSTS
72919
21000
1425
37253
132597
166060
1458
420
29
745
2652
3321
43.91
12.65
0.86
22.43
79.85
100.00
RETURNS
Raw Milk
Sales of Animals
TOTAL RETURNS
PROFIT/LOSS
Return on "written down" capital (%)
103492
16800
120292
-45768
-27.56
2070
336
2406
-915
86.03
13.97
100.00
The fixed and variable costs are based on figures for:
Depreciation of fixed costs including: buildings and yards (Yuan/cow) equipment (Yuan/cow) animals (Yuan/cow); and
Variable costs include: Production costs (feeding costs)
feed concentrates (Kg/cow) feed additives (Yuan/cow) forage (Yuan/cow) medicines (Yuan/cow)
Personnel wages and salaries (Yuan/year/person) bonus (Yuan/year/person) medical insurance (Yuan/year/person) pensions (superannuation) (Yuan/year/person)
Maintenance buildings and yards (Yuan/cow) equipment (Yuan/cow)
Other costs management and administration (Yuan/cow) power, water, etc. (Yuan/cow) interest from working capital (Yuan/cow) general (Yuan/cow)
Sales of animals cows for slaughter (Yuan/head) cows for re-stocking (Yuan/head) male calves (Yuan/head)

304
APPENDIX 10 COST STRUCTURE OF DAIRY F A R M S IN AGRICULTURAL AREAS IN 1988
Source: China's Dairy Development Strategy Study Group (1988), "Development Strategy for China's Dairy Industry", Wuhan, Hubei., China.
AGRICULTURAL AREAS Item Total Costs per
Annum (Yuan) Costs per cow (Yuan)
Proportion of the Total Costs (Yuan)
FIXED COSTS
Depreciation 3754 751 25.20
VARIABLE COSTS
Feeding Costs
Personnel
Maintenance
Management, Admin, etc.
Sub-total
TOTAL COSTS
8548
1225
70
1300
11143
14897
1710
245
14
260
2229
2980
57.38
8.22
0.47
8.73
74.80
100.00
RETURNS
Raw Milk
Sales of Animals
TOTAL RETURNS
PROFIT/LOSS
Return on "written down" capital (%)
13312
2235
15547
650
4.36
2662
447
3109
129
85.62
14.38
100.00
The fixed and variable costs are based on figures for:
Depreciation of fixed costs including: buildings and yards (Yuan/cow) equipment (Yuan/cow) animals (Yuan/cow); and
Variable costs include: Production costs (feeding costs)
feed concentrates (Kg/cow) feed additives (Yuan/cow) forage (Yuan/cow) medicines (Yuan/cow)
Personnel wages and salaries (Yuan/year/person) bonus (Yuan/year/person) medical insurance (Yuan/year/person) pensions (superannuation) (Yuan/year/person)
Maintenance buildings and yards (Yuan/cow) equipment (Yuan/cow)
Other costs management and administration (Yuan/cow) power, water, etc. (Yuan/cow) interest from working capital (Yuan/cow) general (Yuan/cow)
Sales of animals cows for slaughter (Yuan/head) cows for re-stocking (Yuan/head) male calves (Yuan/head)
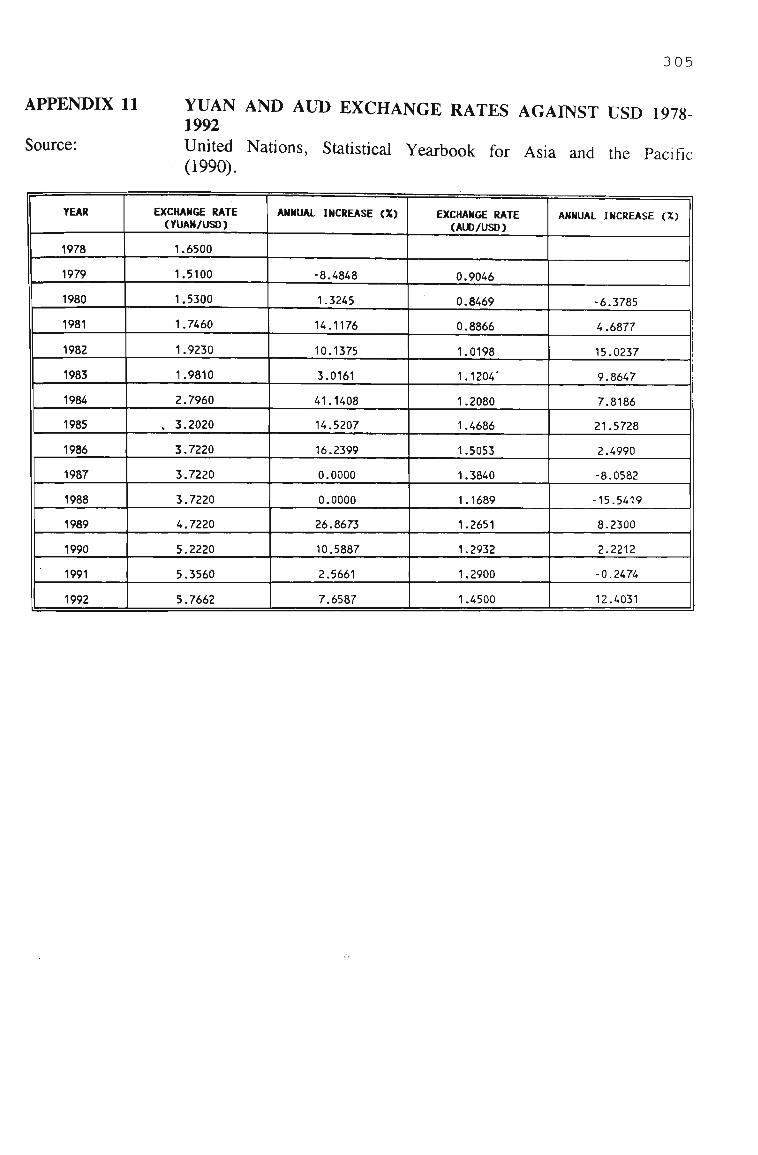
305
APPENDIX 11
Source:
YUAN AND AUD EXCHANGE RATES AGAINST USD 1978-1992 United Nations, Statistical Yearbook for Asia and the Pacific (1990).
YEAR
1978
1979
1980
1981
1982
1983
1984
1985
1986
1987
1988
1989
1990
1991
1992
EXCHANGE RATE (YUAN/USD)
1.6500
1.5100
1.5300
1.7460
1.9230
1.9810
2.7960
, 3.2020
3.7220
3.7220
3.7220
4.7220
5.2220
5.3560
5.7662
ANNUAL INCREASE (X)
-8.4848
1.3245
14.1176
10.1375
3.0161
41.1408
14.5207
16.2399
0.0000
0.0000
26.8673
10.5887
2.5661
7.6587
EXCHANGE RATE (AUD/USD)
0.9046
0.8469
0.8866
1.0198
1.1204'
1.2080
1.4686
1.5053
1.3840
1.1689
1.2651
1.2932
1.2900
1.4500
ANNUAL INCREASE (X)
-6.3785
4.6877
15.0237
9.8647
7.8186
21.5728
2.4990
-8.0582
-15.5419
8.2300
2.2212
-0.2474
12.4031

306
APPENDK 12 WORLD EXPORTS OF DAIRY PRODUCTS (LEADING COUNTRIES, PROVISIONAL DATA) '000 TONNES, 1990
Source: Australian Dairy Corporation, Glen Iris, Statistics (pers. comm.).
COUNTRY
EC
Netherlands
France
West Germany
New Zealand
Denmark
Belgium
Ireland
U.K.
Australia
Poland
Sweden
East Germany
Finland
Italy
Switzerland
Canada
Argentina
BUTTER/AMF
195.6
187.8
94.5
75.6
202.7
50.9
108.0
80.0
34.4
44.1
24.0
31.9
60.0
35.9
13.0
4.1
7.4
CONDENSED/ EVAPORATED
HILK
336.0
348.9
39.4
197.6
0.6
0.3
32.4
49.3
1.8
na
3.8
CHEESE
431.6
437.0
341.4
317.9
95.8
235.0
70.9
69.8
40.4
51.1
4.0
77.2
61.5
12.0
22.5
CASEIN
59.1
10.0
30.8
25.1
63.3
14.0 '
0.0
26.6
0.0
3.8
20.0
0.0
SMP
327.2
156.3
139.1
291.1
149.6
33.5
63.4
87.8
103.7
94.9
71.3
30.5
42.5
27.3
UMP
493.7
236.5
180.9
59.1
190.8
74.8
35.6
27.6
54.7
41.7
23.1

307
APPENDIX 13 TYPICAL FARMGATE MILK PRICES IN AUSTRALIA 1987-1991
Source: "Dairy Compendium" (1991) Australian Dairy Corporation, p. 17.
YEAR ENDED 30 JUNE | NSU VIC OLD SA i UA TAS AUST.
MANUFACTURING MILK
1987
1988
1989
1990
1991
17.1
18.6
19.4
21.2
24.3
17.4
18.9
23.2
25.1
21.1
14.1
15.4
18.9
20.1
20.9
16.3
17.8
20.2
23.5
24.0
12.3
13.5
15.9
20.4
23.8
16.1
17.4
21.6
22.8
20.4
16.9
18.3
22.3
24.2
21.4
MARKET MILK
1987
1988
1989
1990
1991
33.4
35.8
39.0
39.7
41.2
32.7
35.1
36.3
37.6
38.4
39.9
41.7
43.6
44.9
47.4
30.6
33.2
35.5
38.3
42.7
29.4
30.9
32.3
36.0
42.8
34.5
35.4
37.3
39.8
40.7
33.8
36.0
38.2
39.7
41.9
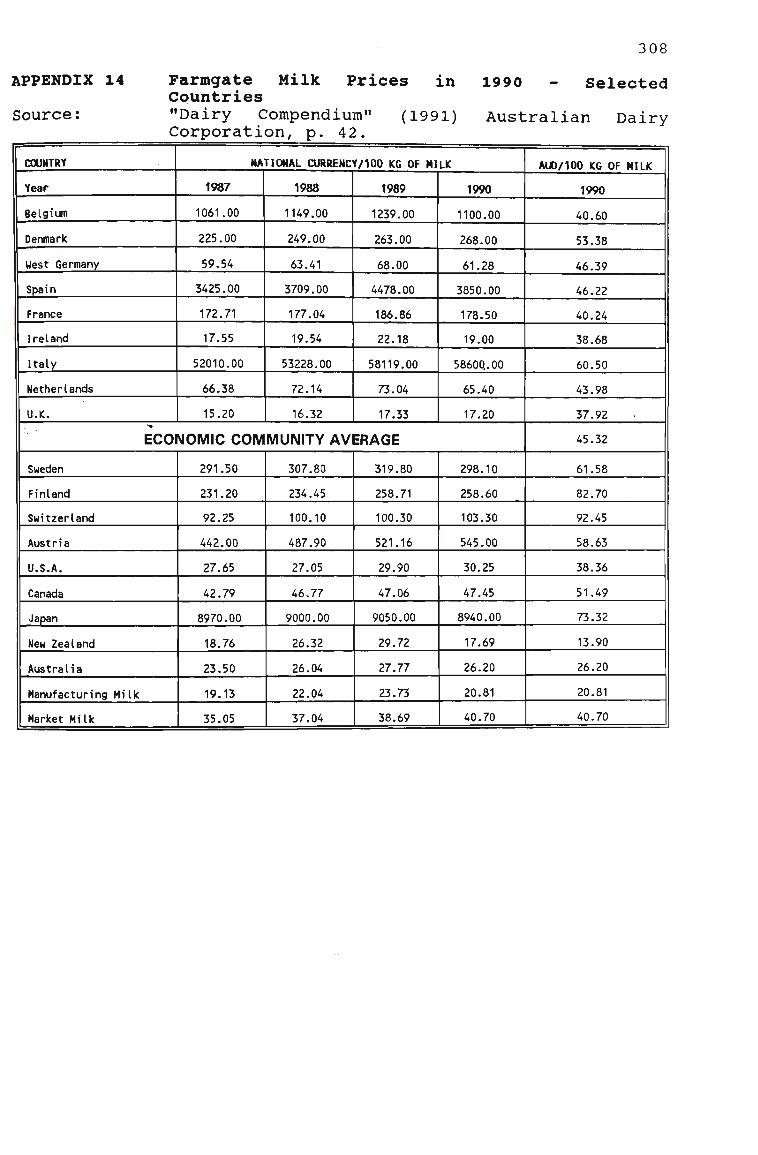
308
APPENDIX 14 Farmgate Milk Prices in 1990 - Selected Countries
Source: "Dairy Compendium" (1991) Australian Dairy Corporation, p. 42.
COUNTRY
Year
Belgium
Denmark
West Germany
Spain
France
Ireland
Italy
Netherlands
U.K.
NATIONAL CURRENCY/100 KG OF MILK
1987
1061.00
225.00
59.54
3425.00
172.71
17.55
52010.00
66.38
15.20
1988
1149.00
249.00
63.41
3709.00
177.04
19.54
53228.00
72.14
16.32
1989
1239.00
263.00
68.00
4478.00
186.86
22.18
58119.00
73.04
17.33
1990
1100.00
268.00
61.28
3850.00
178.50
19.00
58600,. 00
65.40
17.20
ECONOMIC COMMUNITY AVERAGE
Sweden
Finland
Switzerland
Austria
U.S.A.
Canada
Japan
New Zealand
Australia
Manufacturing Milk
Market Milk
291.50
231.20
92.25
442.00
27.65
42.79
8970.00
18.76
23.50
19.13
35.05
307.80
234.45
100.10
487.90
27.05
46.77
9000.00
26.32
26.04
22.04
37.04
319.80
258.71
100.30
521.16
29.90
47.06
9050.00
29.72
27.77
23.73
38.69
298.10
258.60
103.30
545.00
30.25
47.45
8940.00
17.69
26.20
20.81
40.70
AUD/100 KG OF MILK
1990
40.60
53.38
46.39
46.22
40.24
38.68
60.50
43.98
37.92
45.32
61.58
82.70
92.45
58.63
38.36
51.49
73.32
13.90
26.20
20.81
40.70

309
APPENDIX 15 LIQUID MILK CONSUMPTION IN SIX CITIES IN CHINA FROM 1982-89
Source: Ministry of Agriculture (1989), "The Dairy Projects Report in Six Cities of China", Ministry of Agriculture, Beijing.
CITY
1982
1983
1984
1985
1986
1987
1988
1989
Annual Increase (%)
TOTAL ('000 TON)
145.77
167.08
239.16
311.25
357.86
366.98
396.95
417.30
17.0
BEIJING ('000 TON)
68.70
71.92
92.94
112.16
123.35
125.70
133.54
142.57
11.4
SHANGHAI ('000 TON)
40.47
46.29
67.77
89.65
106.06
114.38
136.62
149.33
21.1
TIANJIN ('000 TON)
13.96
16.96
29.91
41.07
46.74
47.72
48.23
56.41
24.2
UUHAN ('000 TON)
6.76
11.04
17.70
25.95
32.00
28.58
31.07
25.30
24.7
NANJING ('000 TOM)
7.21
9.17
14.40
20.15
22.56
23.96
20.83
20.23
18.1
XIAN ('000 TON)
86.77
11.70
16.44
22.27
27.16
26.64
26.66
28.45
2.3

310
APPENDIX 16 COMPARISON OF MILK PRICES IN EIGHT CITIES IN CHINA IN 1988
Source: China's Dairy Development Strategy Study Group (1988), "Development Strategy for China's Dairy Industry", Wuhan, Hubei, China, p. 236.
CITY NAME
Beijing
Shanghai
Tianjin
Nanjing
Xian
Guangzhou
Hangzhou
Changsha
Average
WEIGHTED FARMGATE PRICES (YUAN/KG)
0.660
0.692
0.640
0.735
0.580
1.050
0.713
0.800
0.734
WEIGHTED LIQUID MILK RETAIL PRICE (YUAN/KG)
0.840
1.235
0.600
1.000
0.860
1.550
1.045
1.280
1.051
RATIO BETWEEN WEIGHTED PRICES(LIQUID MILK/FARMGATE)
1.2727
1.7847
0.9375
1.3605
1.4828
1.4762
1.4656
1.6000
1.4319

311
APPENDIX 17 MILK POWDER CONSUMPTION IN SIX CITIES OF CHINA 1982-89 (TONS)
Source: The Dairy Projects Report in Six Cities of China (1989), Ministry of Agriculture, Beijing.
CITY
1982
1983
1984
1985
1986
1987
1988
1989
Annual Growth Rate (%)
TOTAL ('000 TON)
5.54
7.35
8.47
9.96
9.95
10.61
10.82
10.95
10.74
BEIJING ('000 TON)
0.33
1.33
1.71
2.21
2.20
2.49
2.93
2.84
55.46
SHANGHAI ('000 TON)
2.74
3.24
3.73
4.09
3.88
3.88
3.52
3.54
2.94
TIANJIN ('000 TON)
1.33
1.59
1.70
2.07
2.11
2.18
2.41
2.21
6.79
UUHAN ('000 TON)
0.79
0.87
0.95
1.13
1.00
1.22
1.30
1.46
9.60
NANJING ('000 TON)
0.15
0.12
0.15
0.22
0.28
0.43
0.33
0.47
22.04
XIAN ('000 TON)
0.20
0.21
0.22
0.25
0.38
0.33
0.33
0.42
12.79

10
BIBLIOGRAPHY
A Night-Mooring at Ezhou
The clouds dispersed and Hanyang appeared far away. The voyage of our lone sail would take one more day. The merchants dozed till dusk as the waves did subside. And boatmen talked at night, I felt the pull of tide. As streams were cold with frost, my hair was hoar with care. Under the moon I would in thought homeward repair. Ruined by war was I, both estate and career. What pangs I felt when distant war-drums I did hear!
Lu Lun

313
Akiner, S., Allen, B.J., Baral, J.R. et al. (Editors) (1991) The Far East and Australasia 1991. Europa Publications Ltd., England.
Alfa Laval (1985) Dairy Handbook, Alfa Laval Food Engineering A.B., Lund, Sweden.
"America's builds a trade block" (1992) The Economist. Aug. 15, pp. 55-56.
"America's farm subsidies. The trough." (1992) The Economist. June 27, pp. 21-22 and 24.
Anderson, K. and Tyres, R. (1987) Economic Growth and Market Liberalisation in China: Implications for Agricultural Trade. The Developing Economies. 25 (2) June, pp. 124-51.
Andrews, N.P., Roberts, I.M. and Love, G.C. (1992) Recent developments in the Uruguay Round for Agriculture. A B A R E , Agricultural and Resources Quarterly 4 (2) June.
Arbouw, J. (1992) "Will Asia form the third bloc?", Australian Business Monthly. July, pp. 125-126.
Austrade (1989) Austrade's Business Guide to (the) People's Republic of China. Australian Trade Commission, Canberra.
Austrade's Export Report (1992) Business Review Weekly. Mar. 13, p. 65.
Australia-China Trade (1984) Report from the Senate Standing Committee on Industry and Trade.
Australian Bureau of Agricultural and Resource Economics (ABARE) (1992) Agricultural and Resources Quarterly (ARQ).
Australian Bureau of Agricultural and Resource Economics (ABARE) (1992) Commodity Statistical Bulletin (CSB).
Australian Bureau of Statistics (1989) Catalogue No. 1102.0. Publications issued in December 1989.
Australian Bureau of Statistics (1991) Foreign Trade Australia. 1989-1990. Cat. No. 5410.0.
The Australian Commerce and Industry Office (1988) Long-term Projections Dairy Product Consumption and Dairy Industry Development in Taiwan. Taipei.
Australian Dairy Corporation (1989) Butter Leaflet. Australian Dairy Corporation, Victoria.

314
Australian Dairy Corporation (1989) Dairy Compendium, Australian Dairy Corporation Victoria.
Australian Dairy Corporation (1991) Dairy Compendium Australian Dairy Corporation Victoria.
Australian Dairy Corporation (1993) Export Division (pers. comm.)
Australian Dairy Corporation (1989) Ice-cream leaflet. Australian Dairy Corporation, Victoria.
Awanohara, S. (1992) "Liberal infection, Asia concerned by the pacts in the Americas", Far Eastern Economic Review Sept. 10, pp. 73-74.
Awanohara, S., Rowley, A. and Paisley, E. (1992) "New kid on the bloc", Far Eastern Economic Review. Aug. 27, pp. 50-51.
Bannock,G., Baxter, R.E. and Davis, E. (1987) Dictionary of Economics. Penguin Books Australia, Ringwood, Victoria.
Barker, R., Sinha, R. and Rose, B. (Editors) (1982) The Chinese Agricultural Economy. Westview Press, Boulder, Colorado.
Bennett, R. (1992) Applied Economics and Australian Business. M.M. & B. Book Co. Pty. Ltd., Sydney.
Brown, A.J.F., Bell, D.M.H., Murphy, K.R., Pearson, A.G., Slaviero, M.E., Sullivan, M.S. and Van Helten, J.J. (1989) International Banking and Finance. Serindip Publications, Wamberal, N.S.W..
Buchanan, S. (1992) 1992 CRB Commodity Yearbook. Commodity Research Bureau, N e w York.
Burniaux, J.M., Delorme, F., Lienert, I., Martin, J.P. and Hoeller, P. (1988) Quantifying the economy-wide effects of agricultural policies: a general equilibrium approach. Working Paper No.55, Department of Economics and Statistics, O.E.C.D., July 1988, Paris.
Burniaux, J.M. and Waelbroeck, J. (1985) The impact of the CAP on developing countries: a general equilibrium analysis. In C. Stevens and J. Verloren van Themaat (Eds.) Pressure Groups. Policies and Development. Hodder and Stoughton, London.
Byrnes, M. (1992) Co-production with China is Australia's next big chance, Financial Review. Sept. 7, p. 7.
Campbell, A. (1991) Planning for Sustainable Farming. Lotham Books, Port Melbourne.

315
Carlson, G. (1991) China's milk production up 45% in last five years, Cheese Market News. II (29) Sept. 6.
Carr, E. (1992) A Survey of Agriculture. "Grotesque". The Economist. Dec. 12, pp. 1-18
"CER's mutual trade benefits" (1992) The Economist. May 16, p. 15.
Chan, W.K.K. (1977) Merchants, mandarins, and modem enterprise in late Ch'ing China. East Asian Research Centre, Harvard University Press, Cambridge, Massachusetts.
Chen, X.L. and Liu, L. (1991) "The Effects and problems of Government Price Policies on Agricultural Products after 1987", Chinese Economic Reforms. Vol. 24, pp. 35-51.
Chen, H.Y. (1989) "An Innovative Approach to Agricultural Marketing", Industry of Free4Z!hina, June, pp. 13-23.
Cherry-Burrell Corporation (1986) "A joint-venture company in China", Dairy Industries International. December, pp. 14-15.
Cheung, T.M. (1992) "Pushing the pendulum. Deng leads China's economic reformers against party diehards", Far Eastern Economic Review. Apr. 9, pp. 46-47.
China Media Development Inc., Xinhua News Agency, P.R. China (Editors and Translators) (1989) The China Directory of Industry and Commerce. 3rd. Ed., Volumes M I L N.C.N. Limited, Hong Kong and Jardine Printing,
Hong Kong.
China Ministry of Agriculture (MOA) (1988) China Dairy Industry Report. Beijing.
China Ministry of Agriculture (MOA) (1988) The Report of Dairy Projects in the cities of China. Beijing.
China Ministry of Agriculture (MOA) (1988) Vegetable Basket Project Report 1988.
China Ministry of Agriculture (MOA) (1989) The Dairy Projects Report in Six cities of
China. Beijing.
China National Statistic Bureau (CNSB) (1987) Urban Statistics Yearbook of China, China National Statistic Bureau, Beijing.
China National Statistic Bureau (CNSB) (1990) China's Yearbook, China National
Statistic Bureau, Beijing.
China National Statistic Bureau (CNSB) (1992) Statistical Communique of the State Statistical Bureau of the P.R. China on 11 National Economic and Social Development, Beijing Review. 12, May 23-29, pp. 36-43.

316
China's Dairy Development Strategy Study Group (CDDSSG) (1988) The Development Strategy Study of China's Dairy Industry. Hubei Science and Technology Press, Wuhan, China.
"China's first modernised dairy starts up" (1991) Dairy Industries International. Oct p. 6.
"China swings back to reform" (1992) The Economist. Feb. 1, pp. 23-24.
"Chinese dairy industry in period of expansion" (1988) Cheese Market News. II, p. 1.
CMN. (1991) "China's milk production up 45% in last five years", Cheese Market News. Sept. 6, p. 1.
CMN. (1992) "Price reform, The Progressive Way", Beijing Review. 12, May 4-10, pp. 14-18.
"Commodities and Agriculture: China's dairy shake-up has a long way to go" (1992) Financial Times. London, July 25, p. 4.
"Comprehensive Program" (1990) European Dairy Magazine, part 2, pp. 44-49.
Cooke, I.M. (1991) Overseas Marketing from Australia. Australian Institute of Export, Brisbane.
Croll, E. (1983) The Family Rice Bowl. Food and the Domestic Economy in China. U N Research Institute for Social Development. Z E D Press, London.
CSIRO (1991) Whey - too valuable to dump!. CSIRO Dairy Research Laboratory, Melbourne.
Dairy Cabinet Development Department, Australian Dairy Corporation (1989) How to Increase Profits with Dairy Foods. A.D.C., Melbourne.
Dairy Research and Development Corporation (1991) Five Year Research and Development Plan (1991-1995).
Deans, A. (1992) Hard going, Far Eastern Economic Review. 155 (38), Sept. 24, p. 96.
DBIRD, (1992) OINDIS Database. Exporters of Dairy Products - Location Report.
Department of Foreign Affairs and Trade, China Section (1988) China Brief, January.
Department of Foreign Affairs and Trade, China Section (1991) China Brief. December.
Dionysius, D. (1991) Milk - A Source of Pharmaceuticals. Fresh Directions '91. p.88.

317
Drysdale, P. and Elek, A. (1992) China and the International Trading System. Pacific Economic Papers No. 214 Dec. 1992. Australia-Japan Research Centre.
East Asia Analytical Unit, DFAT (1992) Australia and North-Fast Asia in the 1990s Accelerating Change. Australian Government Publishing Service, Canberra.
Epson J. (1986) "China plans for the future", Dairy Industries International. October pp.34-37.
External Services Division of Economic Daily and EAI Information & Agency (1992) China Economic News. Economic Daily, Beijing.
Food and Agriculture Organisation (FAO) (1983) Animal Health Yearbook.
Food and Agriculture Organisation (FAO) (1985) Animal Health Yearbook.
Freeberne, M. (1992) The Far East and Australia - 1992. Europa Publication Ltd., England.
"Freer Trade with Luck" (1992) The Economist. Oct. 17, p. 12.
Fresh Directions '91. (1991) Dairy Convention '91 - Towards 2000. Proceedings International Dairy Convention. Surfers' Paradise, 9-12 July.
Friedland, J. (1992) Bulls in a China shop. Fund managers cash in on market opening, Far Eastern Economic Review. Apr. 9, pp. 47-48.
Garnaut, R. (1989) Australia and the Northeast Asian Ascendancy. Australian Government Publishing Service, Canberra.
Garnaut, R. (1990) Australia's Response to Northeast Asian Ascendancy. Australian International Business Centre, University of Queensland, St. Lucia.
Garnaut, R. and Liu, G-G. (Editors) (1992) Economic Reform and Internationalisation: China and the Pacific Region. Allen and Unwin, St. Leonards, N S W .
Gartner, J.A. and Krostitz W. (1984) "Milk for the main cities of China", World Animal Review. July-September, pp.35-43.
"GATT will build the world" (1992) The Economist. June 27, pp. 11-12.
General Administration of Customs, China, Order 29 (1992) Procedures of the Customs of the People's Republic of China for the Supervision of, and the Imposition of or Exemption from Tax on, Imports and Exports by Overseas Investment Businesses, China Economic News. 9, Supplement 9, pp. 1-7.
Gilchrist, M. (1992) Plugging in to China's market, Business Review Weekly. Apr. 10, p. 53.

318
Gill, P. (1992) "Australia as trade orphan", Financial Review 3, July 22, p. 3.
Goldin, I. and Knudsen, O. (Eds.) (1990) Agricultural Trade Liberalisation. Implications for Developing Countries. O.E.C.D., Paris.
Goldstein, C. (1992) Stranglehold loosens. Hong Kong's Li Ka-Shing boosts Shanghai port. Far Eastern Economic Review. Oct. 15, p.60.
Goldstein, C. and Baum, J. (1992) "Outside GATT's door". Far Eastern Economic Review. Oct 22, pp.57-58.
Goodward, F. (1992) "Getting more business into farming." Business Queensland. Aug. 3, p. 9.
Gruen, F. H. et al. Long Term Projections of Agricultural Supply and Demand: Australia 1965-1980. U S Department of Agriculture, Economic Research Service, Washington, D C 1967. (Cited by Tisdell, C A . p.31)
Grummitt, K. (1986) China Economic Handbook. Euromonitor Publications Ltd., London.
Guilliatt, R. (1992) "To war, with a clever tomato", Business Review Weekly. Sept. 18, pp. 60 and 63.
Gunasekera, H.D.B.H., Andrews, N.P., Haszler, H C, Chapman, J.N., Tian W.M. and Zhao Z. (1991) Agricultural Policy Reform in China. Australian Bureau of Agricultural and Resource Economics, Canberra.
Hardaker, J.B.,Lewis, J.N. and McFarlane, G.C. (1970) Farm Management and Agricultural Economics. Angus & Robertson, Sydney.
Harding, B. (Editor) CSIRO Business (1992) "Food-processing Research offers a big boost in export earnings", Business Review Weekly 14 (16) May 1, pp. 90-92.
He, B.C. (1988) China on the Edge. The crisis of ecology and development. China Books and Periodicals, San Francisco.
Hill, B. (1990) An Introduction to Economics for Students of Agriculture. (2nd Ed.) Pergamon Press, Sydney.
Hiraiwa, K. (1992) "Foreign Investment in the P.R. China, 1990-91", China Newsletter, January-February, pp. 11-14.
Hook, B. (1982) The Cambridge Encyclopedia of China. Syndicated Press of the University of Cambridge, London.

319
Hooper, N. (1992) "Which way should Australia jump?", Business Review Weekly Sept 18, pp. 30 and 32.
Hornby, A.S. (1988) Oxford Advanced Learner's Dictionary of Current English with Chinese Translation. Oxford University Press, London.
Horridge, M., Pearce, D. and Walker, A. (1990) World Agricultural Trade Reform: Implications for Australia. The Economic Record. 66, pp. 235-248.
The Import Duty Handbook of the People's Republic of China. (1989) Beijing.
James, R.S. (1988) "China's Dairy Industry: Economic Analysis and Implications" Feedstuffs. 188, Oct. 3, p. 25.
Jiang, Y. (1986) "China, Some Goat Breeds", World Animal Review. April-June, pp. 31-41.
Johnson, D.G. (1991) World Agriculture in Disarray. 2nd. Edition. St. Martin's Press, N e w York.
Kaye, L. (1992) "Debt without Tears", Far Eastern Economic Review. Apr. 16, p. 66.
Kaye, L. (1993) "Formation Flying", Far Eastern Economic Review. July 23, p.49.
Klein, L.R. (1960) An Introduction to Econometrics. Prentice-Hall Inc., Englewood Cliffs, N.J.
Krostitz, W. (1990) International Dairy Federation/FAQ Consultation on World Dairy Situation. June, Rome.
Krostitz, W. (1990) Medium Term outlook for Dairying in the Developing Countries. International Dairy Federation/FAO Consultation on World Dairy Situation, Rome, June 7-8, pp. 1-7.
Kung, J.K. (1992) "Food and Agriculture in Post-Reform China", Modern China. April,
pp. 138-170.
Larsen, N. (1984) "China - on her way!", Danish Dairy Industry - worldwide, no. 4,
pp. 47-48.
Latham, R. (1958) The Travels of Marco Polo. Penguin Books Ltd., Harmondsworth,
England.
Li, Mao-Ming (1992) China to have 8 more bonded areas. China Economic News 29,
Aug. 3, p.2.

320
Longworth, J.W., (1987) China's Rural Development Miracle. University of Queensland Press, Queensland.
Loo, T. and Tower, E. (1989) Agricultural Protection and the less developed countries: the relationship between agricultural price, debt servicing and the need for development aid. In A. Stoeckel (Ed.) "Macroeconomic consequences of
Farm-Support Policies" Duke Uni. Press, Durham.
Ma, G. N. and Garnaut, R. (1992) How rich is China: Evidence from the food economy. Department of Economics and National Research School of Pacific Studies, Australian National University, Canberra.
Mansfield, E. (1980) Statistics for Business and Economics. W.W.Norton & Company, Pennsylvania, U.S.A.
Mann, E.J. (1988) "New Product", Dairy Industries International. 53 (12), pp. 10-11.
Miller, R.J. and Shade, E.D. (1991) Foundations of Economics. Longman Cheshire,
Melbourne.
Morse, H.B. (1966) The Trade and Administration of the Chinese Empire. Ch'eng-wen
Publishing Company, Taipei.
"Odd man In" A Survey of Australia. (1992) The Economist. Apr. 4, pp. 1-18.
O.E.C.D. (1987) "National Policies and Agricultural Trade. Agricultural Directorate of
the O.E.C.D. Secretariat. May, Paris.
Office of Trade and Investment, Department of Manufacturing and Industry, Victorian State Government, Melbourne (1992) Milk Production - Australian
Context.
Office of Trade and Investment Department of Manufacturing and Industry, Victorian State Government, Melbourne (1992) Milk Production - Overseas Context.
Olscheske, J.H. (1990) 1990 Asian Ch^e Market research. Wisconsin Department of
Agriculture, U.S.A..
Onyeneho, S.N., Partridge, J.A., Brunner, J.R. and Guan J. (1987) "Manufacture and Characterisation of Gua-Nai: A N e w Dairy Food Produced with an Oriental
Type Culture", Dairy Science, 70 (12), pp. 2499-2503.
Parikh, K.S., Fischer, G., Frohberg, K. and Gulbrandsen, O. (1988) Tjomds^ree Trade in Agriculture. Mortimers Nijhoff for IIASA, Amsterdam.
PJB. (1992) "Outlook for the world livestock situation in 1992", Animal Pharmaceutical,
January 24, pp. 10-15.

321
Pratley, J.E. (1991) Trees - The essential farm ingredient. Riverina Outlook Conference 1991 held at Charles Sturt University, Riverina.
Rees, J. (1992) "Taste of Australia. Are Food Multinationals Seeking an Export Base?*', Far Eastern Economic Review, Oct. 29, pp. 79-80.
Remer, C.F. (1972) The Foreign Trace of China, Ch'eng-wen Publishing Company, Taipei.
Rennie, P. (1992) "Getting a piece of the China boom", Business Review Weekly 14 (31), Aug. 14, p. 95.
"Revolution on the High Seas" (1992) Asia Inc. September, p. 10.
Ritson, C. (1977) Agricultural Economics. Principles and Policy. Cosby Lockwood Staples, London.
Rohwer, J. (1992) "The Titan Stirs", The Economist. Nov. 28, pp. 3-6.
Roningen, V.O. (1986) A Static World Policy Simulation (SWOPSIM) Modelling Framework. U S Department of Agriculture, ERS Staff Report No. A G E S 860625, July, Washington DC.
Roningen, V.O., Dixit, P.M. and Seeley, R. (1989) Agricultural Outlook for the year 2000: some alternatives. In A.Maunder and A. Valdes (Ed.) "Agriculture and Governments in an Interdependent World. Proceedings. Twentieth International Conference on Agricultural Economics, pp.615-626. Dartmouth for the IAAE, London
Rowley, A. (1992) "Governing markets", Far Eastern Economic Review. Apr. 30, p. 66.
Rowley, A. (1992) "High marks for Asia. World Bank presents its annual report card", Far Eastern Economic Review. Sept. 24, pp. 89-90.
Sanderson, F.H. (1988) "The Agro-Food Filiere: A Macroeconomic Study on the Evolution of the Demand Structure and Induced Changes in the Destination of Agricultural Outputs", The Agro-Technological System Towards 2000,
pp. 185-208.
See, C.S. (1970) The Foreign Trade of China. AMS Press, New York.
Schauble, J. (Ed) (1993) The SBS World Guide. The Text Publishing Co., Melbourne.
Shepherd, G. (1992) China's southern comfort, Australian Business Monthly. May,
p. 64.
Shoebridge, N. (1992) "Dairy marketers reap the benefits of a new image", Business Review Weekly. July 24, pp. 82-84 and 87.

322
Shoebridge, N. (1992) "Food for Asia: A market on the boil", Business Review Weekly. Oct. 23, pp. 22-28.
Shoebridge, N. (1992) "The new flavour of food marketing", Business Review Weekly. Aug. 7, pp. 85 and 87.
Shoebridge, N. (1993) "Petit Miam, A rare copycat success", Business Review Weekly. Feb. 5, pp. 59-60.
Sicular, T. (1989) Food Price Policy in Asia. A Comparative Study. Cornell Uni. Press, Ithaca.
Simpson, J.R. (1988) "China's Dairy Industry: Economic Analysis and Implications", Feedstuffs. Oct. 3, pp. 25-32.
Sivin, N., Wood, F., Brooke. P. and Ronan, C. (1989) The Contemporary Atlas of China. Collins Publishers Aust., Sydney.
State Statistical Bureau of the P.R. China (SSB) (1989) China Trade and Price Statistics 1989. The China Series, Praeger, New York.
State Statistical Bureau of the P.R. China (SSB) China Statistical Yearbook. (Issues 1988-1991) China Statistical Information and Consultancy Service Centre for the Advancement of Science and Technology Ltd., Beijing.
Stevens, M. (1992) Infrastructure the top priority. Business Review Weekly. July 17,
p.80.
Stork, (1990) "Comprehensive Program", European Dairy Magazine, part 2, pp. 44-49.
Strachan, S.F. (1992) Dairy Products. Recent Developments in GATT. Agriculture
Resources Quarterly 4 (1) March.
Stretton, R. (1992) A feast of opportunities, Bulletin 114, Sept. 15, pp. 82-83.
Taber, G.M. (1992) Growing, growing... Time 7 (37) Sept. 14, pp. 28-32.
Tigliao, R. (1992) On the launch pad. Far Eastern Economic Review. Nov. 5, p. 50.
Tisdell, CA. (1974) Economics of Markets. An Introduction to Economic Analysis. John
Wiley & Sons Australasia Pty. Ltd.
Tucker, K. (1992) "Going global: Lessons from our top players", The Voice of Business
158 Dec.91/Jan.92, p. 12.
Tyers, R. and Anderson, K. (1992) Disarray in World Food Markets. A quantitative
assessment. Cambridge University Press.

32
Tyrchniewicz, E.W., Honeyman, D.D. and Zhong, F-N. (1987) Developing transport and infrastructure facilities for China's agriculture. In Longworth, J.W. (Editor) China's Rural Development Miracle with International Comparisons. Papers presented at an International Symposium held at Beijing, China, 25-29 October, 1987.
United Nations (1991) Livestock Yearbook of China.
United Nations (1992) Population Fund Projections, (in SBS World Guide p.l 10)
United Nations (1990) Statistical Yearbook for Asia and the Pacific. (Annuaire Statistique pour l'Asie et le Pacifique) 1990.
United Nations (1991) Statistical Yearbook of World Trade.
Vatikiotis, M. (1992) EAEC fails to Appeal. Far Eastern Economic Review. Jan 29, p.ll.
Victorian State Government, Melbourne, Office of Trade and Investment (1991) Milk Production - Australian Context and World Context.
Walker, K.R. and Kueh Y.Y. (1988) "Food and Agriculture in China during the Post-Mao Era", China Statistics Monthly. December, pp. 5-20.
Ward, G.M., Oltjen R., Temple R. and Gates D.H. (1986) "New technologies needed to improve animal production in China", Feedstuffs. January 6, pp. 22-31.
Watson, A. (1988) "The Reform of Agricultural Marketing in China Since 1978", The
China Quarterly. March, pp. 1-27.
Wen, S. (1990) Government Policies and Food Sector Performance: The Chinese Experience. In Tyagi, D.S. and Vyas, V.S. (Editors) "Increasing Access to Food" (pp. 145-240) Sage Publications, N e w Delhi.
Westlake, M. (1992) Flying Start. Far Eastern Economic Review, Aug. 6.
Westlake, M. (1992) Hubs under pressure. Far Eastern Economic Review, Sept.24, p.86.
Whalley, J. (1984) Trade Liberalisation Among Maior World Trading Areas. Cambridge
M I T Press.
Williams, R. (Ed) (1991) Growback '91. Growback Publications, University of
Melbourne, Victoria.
The World Bank (1991) China - The Livestock Sector, The World Bank, Washington,
D . C , U.S.A..

3 2 <3
The World Bank (1993) The East Asian Miracle. Economic Growth and Public Policy Oxford University Press.
Worthy, F.S. (1992) Where capitalism thrives in China, Fortune International. 125, 5, pp. 18-25.
Xiao, Y.Z. (1988) "Buffaloes as dairy animal in China", Asian Livestock. March, pp. 25-27, and 34.
Xue, M.Q. (Editor-in-Chief) (1986) Almanac of China's Economy TM 1985/1986. Modern Cultural Company Ltd., Tai Dao Publishing Ltd., Hong Kong.
Yu, J.D. (1992) "China sets Targets for Transportation", China Economic News, 34 (13), p. 3.
Yu, J.D. (1992) "Transport: Inroads to Make Investment", China Economic News, 35, p. 6,7.
Zhang, P.J. and Huenemann, R. (1987) China's Foreign Trade, Oolichan Books and the Institute for Research on Public Policy: L'Institute de Recherches Politiques, Canada.
Zietz, J. and Valdes, A. (1985) The costs of Protectionism to less-developed countries: an analysis for selected agricultural products. World Bank and the International Food Policy Research Institute, January (Mimeo) Washington,
DC.