a study of the delivery ratio characteristics of cran ... · a study of the delivery ratio...
TRANSCRIPT

A Study of the Delivery Ratio
Characteristics of
Cran kcase-Scavenged
Two-Stroke Cycle Engines
Kazunari Komotori and Eiichi Watanabe Keio University
PART 1
CASE OF ROTARY DISC-VALVE INLET PORT ENGINE
THE OUTPUT CHARACTERISTICS of two-stroke cycle en- gines are determined mainly by the charging efficiency which is a product of the delivery ratio and the trapping efficiency. With the same scavenging system, there i s l i t t le difference in trapping efficiency at a specified delivery rat io . (1)" Therefore, the output characteristics of crank- case -scavenged two -stroke cycle engines with the same scavenging system depend chiefly on the delivery ratio.
When these engines are used as prime movers of motor- scooters or auromobiles, it is usually not required to have the tuning effects from the inlet and/or exhaust pipe sys- rems because of their vehicle characteristics. Under these
"Numbers in parentheses designate References at end of Part 1.
circumstances, the approximate delivery ratio c
istics are obtained by motoring the engines. (2-5) This was also confirmed by the authors' preliminary test described in the Appendix. Consequently, the following tests were car- ried out in the motoring mode. The authors used an e n - gine having a rotary disc-valve inlet port, which was varied by changing the disc valves and their phase angles to the crankshaft. On the other hand, the scavenging and exhaust ports, which were designed to give the best trapping effi- ciency, were left unchanged from their original design.
EQUIPMENT USED AND TEST PROCEDURES
The general specifications of the engine and equipment used are shown in Table 1 and Fig. 1. In order to avoid the
In order to increase the air charge of crankcase-scav- enged two-stroke cycle engines, the relations between de- livery ratio and engine speed were investigated on a rotary disc-valve inlet port engine and on a conventional piston- valve inlet port engine by varying through wide limits the angle area and timing of he inlet port.
For the inlet port configuration tested on the first engine, i t was found that there was an optimum cut angle of the
rotary disc valve, which produced a certain angle area. To improve the delivery ratio characteristics at a given speed,
i t was not necessary to change this angle area; i t was effec- tive to change only the timing of the inlet port by shifting the disc valve around the crankshaft.
For the piston-valve inlet port engine, the results showed that a wide, low port, which was also found to have a higher flow coefficient, produced a higher delivery ratio over the entire engine speed range than a narrow, high port. For the configuration tested (with no inlet or exhaust pipes), the maximum delivery ratio of the wide, low port was nearly in proportion to the effective crankcase stroke.

tuning effects,from the inlet and/or exhaust pipe systems on the delivery ratio characteristics, rhe inlet port was con- nected with receiver C by a short, large diameter duct as illustrated in Fig. 2. The exhaust port opened directly to the atmosphere.
The pressure in receiver C was always kept equal to that of the atmosphere by a Roots blower with control valves. The flow rate to the engine was measured by round noz- zles (0.59 in. @, 0.47 in.@) (6) attached to the surface of receiver A. Some of the disc valves with cut angles of 50- 180 deg are shown in Fig. 3.
In order to minimize the effects caused by the thickness of the disc valves, the edges of the valves and the inlet port
Table 1 - General Specifications of Yamaha YG- 1 Engine
Cylinder Bore and Stroke
Cylinder Volume Rated Output Compression Ratio Crankcase Compression
Ratio Scavenging Port
Exhaust Port
Air-cooled, single-cylinder, ~chn'ble-scavenged, two- stroke cycle gasoline engine
1.85 in. x 1.65 in.
4.45 cu in. (73 cc) 6.5 hp/7000 rpm 6.8: 1 1.39:l
Opened 55 deg bbdc, closed 55 deg abdc, angle area of 45.5
deg- in. Opened 74 deg bbdc, closed 74
deg abdc, angle area of 51.7
deg- in. 2
Reduced Angle Area of Scaveng-
31.8 deg. in 2
ing and Exhaust Ports
Inlet Port Variable, shifting, and changing disc valves
located in the valve cover were finished as illustrated in Fig. 2. To assure the correct opening and closure of the ports, the diameter of the piston was machined over its total length equal to the piston skirt diameter. The angle area of the inlet port was varied in seven steps by different cut angles of the disc valves. The disc valves were fabri- cated in such a way as to permit shifting around the crank- shaft (by slots cut in the collar and a pin used to fix the disc valve) as shown in Fig. 3. Each slot permitted a 22.5 crankangle deg shift to the disc valve. Table 2 shows the tested angle areas and rhe inlet port timing. Under these inlet port conditions, the relations between the delivery ratio and the engine speed were investigated.
At the same t ime, pressure indicator diagrams in the crankcase were recorded using a low -pressure pickup (Model P R / ~ , Shinko Electric Corp.). In orienting the crank angle of the indicator diagrams, a combination of mirror and photo- ce l l pickup were used. The distances between the pressure pickup and the scavenging or inlet ports were nearly the same, about 0.31 in. Assuming the sonic velocity in the crankcase was 1100 ft/sec, the travel t ime of rhe wave b e -
-4 tween them was in the order of 2.3 x 10 sec. The shift in the indicator diagrams corresponding to this travel t ime was about the widrh of the diagram's line even at the maxi- mum speed (n = 6120 rpm) recorded. Therefore, the authors
Fig. 2 - Inlet port in detail
TACHOMETER Fig. 1 - Test equipmefl used

Fig. 3 - Disc valves having different cut- angles
Table 2 - Angle Areas and Inlet Port Timing
Valve Angle Area,
Cut Angle, D
deg- deg- in. Notation
Inlet Port Opens
92" 05' B. T. 69" 35' B. T. 47" 05' B. T. 24" 35' B. T.
128" 20' B. T. 105' 50' B. T.
83' 20 ' B. T. 60' 50' B. T.
142" 05' B. T. 119" 35' B. T..
9 T 05' B. T. 74" 35' B. T.
178" 20 ' B. T. 155" 50' B. T. 133" 20' B. T. 110' 50' B. T.
88" 20' B. T. 214" 35' B. T. 192" 05' B. T. 169" 35' B. T. 147" 05' B. T. 196' 20' B. T. 173" 50' B. T. 151' 20' B. T. 128" 50' B. T. 199" 35' B. T. 177" 05' B. T. 154" 35' B. T. 131' 05' B. T.
Inlet Port Closes
B. T. = Before tdc A. T. = After tdc
:hink it is reasonable to represent the registered indicator iiagrams as diagrams at the inlet or scavenging ports. This .s also the case for the engine described in the Appendix.
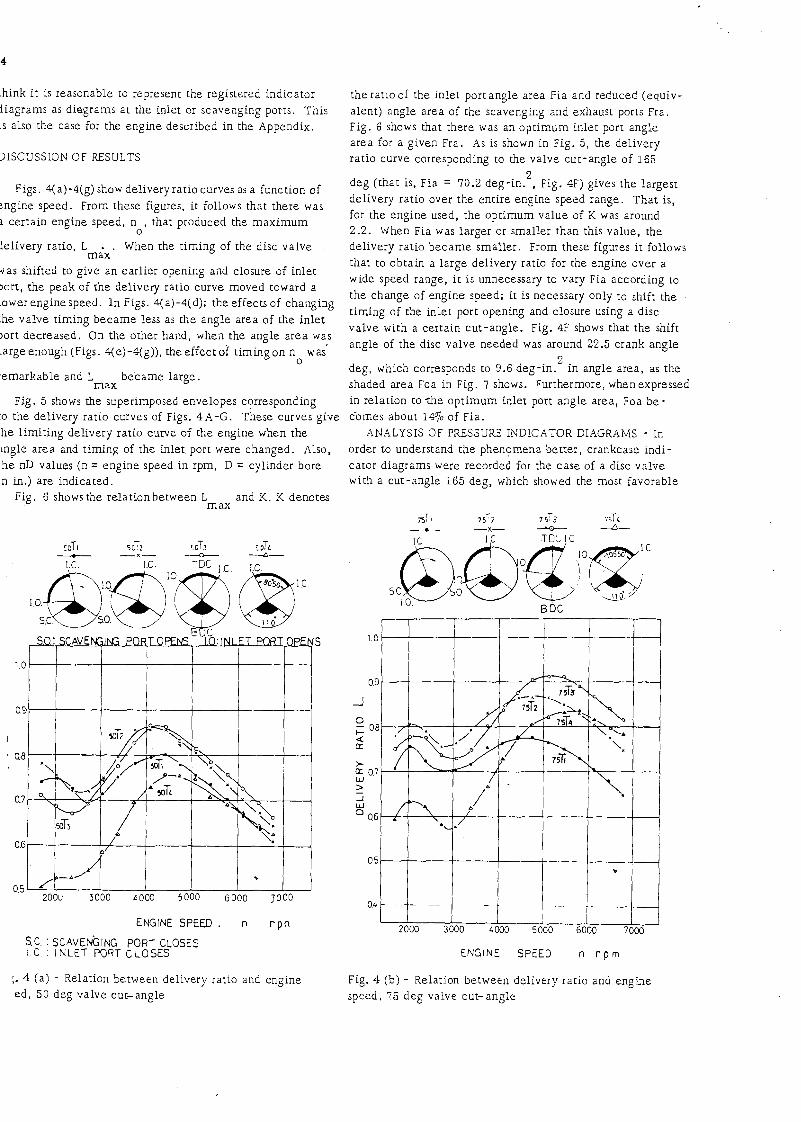
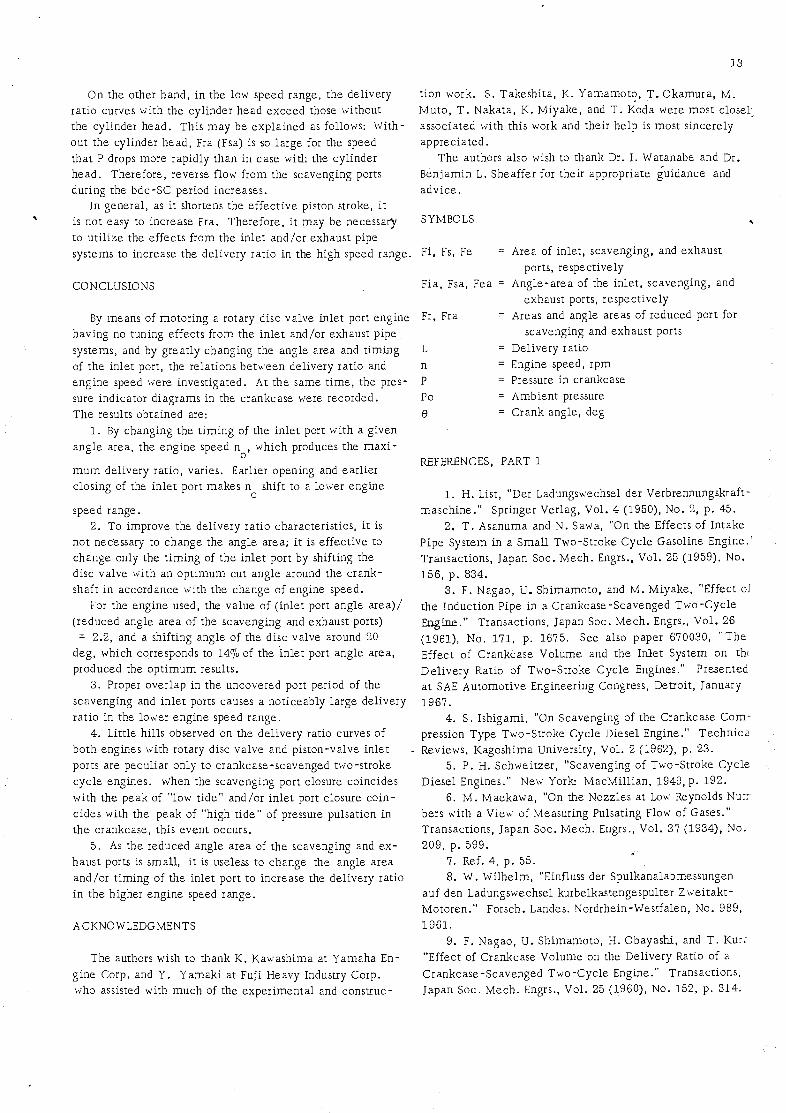
IISCUSSION OF RESULTS
Figs. %a)-4(g) show delivery ratio curves as a function of :ngine speed. From these figures, it follows that there was 1 certain engine speed, n , that produced the maximum
0
lelivery ratio, L . . When the timing of the disc valve max
Mas shifted to give an earlier opening and closure of inlet lort, the peak of the delivery ratio curve moved toward a .owe1 enginespeed. In Figs. 4(a)-4(d); the effects of changing .he valve timing became less as the angle area of the inlet )or[ decreased. On the other hand, when the angle area was large enough (Figs. 4(e)-4(g)), the effect of timing o n n w a s
0
,emarkable and L became large. max
Fig. 5 shows the superimposed envelopes corresponding o the delivery ratio curves of Figs. 4A-G. These curves give h e limiting delivery ratio curve of the engine when the lngle area and timing of the inlet port were changed. Also, h e nD values (n = engine speed in rpm, D = cylinder bore n in.) are indicated.
Fig. 6 showsthe relation between L and K . K denotes m ax
TDC LC ,,o,@;JgJiO@ @,C.
S.C. D u 'd
S.0: ScavE&~ffi PORT OWNS I.O:INI FT PORT W S
ENGINE SPEED . n r p n
S.C. : SCAVENGING PORT CLOSES I. C. : INLET PORT CLOSES
the ratio of the inlet port angle area Fia and reduced (equiv- alent) angle area of the scavenging and exhaust ports Fra. Fig. 6 shows thar there was an opt imum inlet port angle area for a given Fra. As is shown in Fig. 5, the delivery ratio curve corresponding to the valve cut-angle of 165
2 deg (that is, Fia = 70.2 deg-in. , Fig. 4F) gives the largest delivery ratio over the entire engine speed range. That is, for the engine used, the optimum value of K was around 2.2. When Fia was larger or smaller than this value, the delivery ratio became smaller. From these figures i t follows that to obtain a large delivery ratio for the engine over a wide speed range, i t is unnecessary to vary Fia according to the change of engine speed; i t is necessary only to shift the timing of the inlet port opening and closure using a disc valve with a certain cut-angle. Fig. 4F shows that the shift angle of the disc valve needed was around 22.5 crank angle
2 deg, which corresponds to 9.6 deg-in. in angle area, as the shaded area Foa in Fig. 7 shows. Furthermore, when expressed in relation to t h e opt imum inlet port angle area, Foa b e - comes about 14% of Fia.
ANALYSIS OF PRESSURE INDICATOR DIAGRAMS - In order to understand the phenomena betrer, crankcase indi- cator diagrams were recorded for the case of a disc valve with a cut-angle 165 deg, which showed the most favorable
ENGINE SPEED n r p m
;. 4 (a) - Relation between delivery ratio and engine Fig. 4 (b) - Relation between delivery ratio and engine ed , 50 deg valve cut-angle speed, 75 deg valve cut-angle

ENGINE S P E E D n r p m
Fig. 4 (c) - Relation between delivery ratio and engine speed, 100 deg valve cur-angle
@o@o@lc
5C 10
10 I0 B D C
E N G I N E S P E E D n r p m
Fig. 4 (d) - Relation between delivery ratio and engine speed, 125 deg valve cut- angle
E N G I N E S P E E D n r p rn
Fig. 4 (e) Relation between delivery ratio and engine speed, 150 deg valve cut-angle
16 ST) IUTZ I G 5T3 16sTb -C -x- +
I.C. I C T DC
(&@ @l'c@lc
5.C 1 .o. 1.0.
1.0. 10. BDC
Fig. 4(f) Relation between delivery ratio and engine speed, 165 deg valve cut-angle. Notations t t t
1 1 - 7 ' 2 1-5' 3 1-5 , correspond to each indicator diagram in Figs. 9, and
3 1 - 3 12-16

lelivery ratio characteristics. Figs. 8(a)-(d) show the repre- entat ive phitographs of the indicator diagrams. Figs. 9 and 2-17 show the superimposed indicator diagrams in relation o engine speed. The notation attached to each of the in- ~ ica to r diagrams represents the measured points on the d e - ivery rario curves in Fig. q f ) .
GENERAL CHARACTERISTICS OF DELIVERY RATIO LGAINST ENGINE SPEED - Fig. 9 shows the indicator d ia - ;rams of T which showed favorable delivery ratio
165 2 alues over a rela'tively wide engine speed range.
0 4 I I I I
2000 3000 4000 5000 GOO0 7000
ENGINE SPEED , n r-pm ig. 4 (g) - Relation between delivery rario and engine ~ e e d . 1 8 0 deg valve cut-angle
1 ENGl NE SPEED n r pm
+.O 6.0 8 C i . 1 2 C
n D VALUE mm- rPm x103
Fig. 5 - Relation between delivery ratio and engine speed. Envelopes from Figs. 4 a-g give limiting delivery ratio curve
2 Fia / Fra = K
Fie; INLET PORT ANGLE AREA
Fra REDUCED A N G L E AREA O F
SCAVENGING AND EXHAUST PORTS
Fig. 6 - Relation between maximum delivery ratio and K. A-g correspond to the maximum delivery rario in Fig. 4 ( a ) - 4 (g)
5
ig. 7 - Relation between inlet port .ea and uncovered inlet port duration. f l a indicates change of inlet port angle e a corresponding to 22.5 crank angle - :g valve shift U N C O V E R E D : r l l z T P O R T X J R A T I O N , deg

At the lowest speed, thereduced angle area of the 2 5 '
scavenging and exhaust ports Fra was too large, so the pres- sure in the crankcase P dropped to atmospheric long before scavenging port closure SC. An overexpansion period of P (that is, a "low t ide," which is a negative pressure period usually observed in crankcase-scavenged two-stroke cycle engines) is seen right after inlet port opening 10. As the sca.venging and exhaust ports of theQengine used were nearly rectangular, the uncovered reduced port area Fr curve as a
2 2 function of crank angle was convex, that is, d Fr/d 8 < 0, a t the beginning of port opening (Fig. 10). Therefore, the rate of increasing Fr was comparatively high. OF. the other hand, the inlet port had an oval shape and the uncovered
2 . port area Fi curve was concave, that is, d F,/do2 > 0. ar the beginning of port opening. Thus, the rate of increasing Fi was low. Therefore, an ineffective angle after I0 oc- cured. That is, although the inlet port was open during the "low tide" of P, the uncovered port area was not enough and t h e reverse flow from scavenging port was probably appre- c iable . As P at IC was almost atmospheric, the reverse flow from the inlet port during the tdc-IC period may also have been appreciable. Therefore, at this low speed, owing to the reverse flows from both the inlet and scavenging ports, the delivery ratio was small. T h e measured delivery rat ioL=O .77 corresponded to thevalue1.30/1.65 = 0.79, where 1.30 in. was the effective crankcase suoke which corresponds t o the SC-I0 period and 1 . 6 5 in. was the piston stroke.
At a higher speed, t P dropped below atmospheric 2 2'
after I 0 after a short delay. This t i m e the inlet port was sufficiently open, thus the reverse flow from the scavenging port was probably less than in case of t . consequently,
2 1' t h e delivery ratio was larger.
the
( a )
t 2 3
delivery ratio reached a maximum,
In this case, the lowest P during "low tide" ocurred at SC, while the inlet port was sufficiently open. On the other ban< P became atmospheric a t tdc, then rose during the tdc-IC period. Inasmuch as there was no sudden pressure difference before and after IC and there was a smooth increase of P, there was probably l i t t le reverse flow from the inlet port during the tdc-IC period. Although P was fairly high at 10, there existed an ineffective anglg at the beginning of the inlet port opening as already stated, so this case may be stated as follows: There was no reverse flow from either the inlet or the scavenging ports, that is, the effective crank- case suoke nearly coincided with the piston stroke and the largest delivery ratio was obtained.
As the engine speed increased to 2t4, 2t5, Fra be-
c a m e inadequate and P remained above annospheric even at SC. That is, the reverse flow from the inlet port a t the beginning of port opening increased. As the angle area of
the inlet port also became inadequate, P was below a t - mospheric at tdc and finally rose to atmospheric at IC. After t both Fra and Fia became inadequate, and the
2 4' delivery ratio became smaller.
The small fluctuations observed on the indicator diagrams at t may have been caused by the relatively low natural
2 5 frequency of the low pressure pickup.
WITH LARGE OVERLAP IN UNCOVERED PERIOD OF IN-
LET AND SCAVENGING PORTS - Each of T T 150 2' 165 1'
T had a disc valve with a large cut-angle. In these 180 1 cases, I 0 and IC c a m e near bdc and tdc, respectively. This caused an overlap period between I 0 and SC where both the inlet and scavenging ports were open as illustrated (hatched area) in Figs. 10 and 11. With these overlap periods, the delivery ratio rose noticeably in the lower speed range, as indicated in Figs. 4(e)-(g). -Fig. 1 2 shows the crankc
Fig. 8 - Representative photographs of the crankcase indicator diagrarrls for rotary disc-valve inlet port engine

T. b.c B. b.c I T.D.C
CRANKANGLE- DEGREES
indicator diagrams corresponding to T in which this 165 1
event is most remarkable.
At the lowest speed, t Fra was too large, so P dropped 1 1'
to atmospheric even before bdc. Between the bdc-SC period there should have been a reverse flow from the scavenging port. Although in this period the inlet port was sufficiently open,
the reverse flow may not have been remarkable. LC coin- cided with tdc in this case, that is, there was no reverse flow from the inlet port around tdc. Regarding the effec - tive crankcase strokeas (bdc-SC period)/:! + (SC-tdc period which corresponded to 1.52 in., the measured delivery ratio L = 0.91 nearly coincided with 1.52/1.65 = 0.92, where 1.65 in. was the piston stroke. Assuming that the mean P was about atmospheric during the bdc-SC period, the re - verse flow from the scavenging port in the I0 - SC period may be evaluated as about the same as that from the inlet port.
As the speed increased a little to t P after SO dropped 1 2'
a l i trle slower.. Inasmuch as the uncovered inlet port area
INLET PORT
OVERLAP OF. INLET AND SCAVEKiIN; PORT
67': BEFORE TDC A T : AFTER TDC
PORT
PORT
PENS
OPENS
OPENS
.g. 9 - Crankcase indicator diagrams, case of T 165 2
Fig. 11 - Port timing diagram
I 0 CRANKANGLE-DEGREES
1 C
Fe ;EX HAUSS PORT AREA Fr : REDUCED AREA O F EXHAUST
Fi : ItJLES PORT AREA
FS : SCAVENGING PORT AREA AND SCAVENGING PORT
Fig. 10 - Relation between uncov- ered port area and crank angle

in the "low tide" of P was larger than in the case of t the 1 1'
reverse flow, from scavenging porr was less. At t t the delivery ratio reached its maximum,
1 3' 1 4' L = 0.99. As P was about atmospheric at tdc (IC) in this case, the event may be stated as follows: The inlet porr
Fig. 1 2 - Crankcase indicator diagrams, case of T 1 6 5 1
was sufficiently open in the "low t ide" of P , which was very helpful in drawing fresh air into the crankcase. On the other hand, the scavenging port closed just before reverse flow occurred because of the inertia of the gases in the scaveng- ing passages. (8) - The effect was as if the effecrive crank- case stroke nearly coincided with the piston stroke and thus made the delivery ratio almost unity.
With further increases in engine speed - P dropped l t 5 l t 8 '
more slowly after SO, thus a higher P occurred a t I 0 which made the reverse flow from the inlet port increase a t the beginning of porr opening. Thus, the delivery ratio values decreased.
WHEN DISC VALVE IS SHIFTED AROUND CRANKSHAFT - Figs. 1 3 and 1 4 show the crankcase indicator diagrams a t the same engine speed but with the disc valve having the same cu t angle shifted around the crankshaft.
In Fig. 13, although lt3, 2tl, 3t3 had the same uncovered
inlet port duration, e a c h of them had a 22.5 crankangle deg difference i n timing. ,P was about the same and
max
n =2380 T DC BDC TDC
I SO I SC
1 TDC ' I ' 0.9
I BDC SC TDC
CRANKANGLE- DEGREES
Fig. 1 3 - Crankcase indicator diagrams, cases of 1 6 5 ~ 1 '
T and T 1 6 5 2 1 6 5 3

there were few differences between them in the P curves after SO.
At t as already stated, both I 0 and IC satisfied the 1 3'
optimum condition which produces the largest delivery ratio. At t , as explained, both I 0 and IC were too la te to check
2 1
the reverse flow from the scavenging and/or inlet ports. At t , as both I 0 and IC occurred much later, the reverse
3 3 flow from both ports may have been appreciable and delivery ratio became sinaller .
In Fig. 14, as the engine speed was higher rhan in Fig. 13, P dropped slowly after SO. At t , as aIready stated, both
2 3 I 0 and IC satisfied the optimum condition which allows the minimumreversef low. At t I 0 wassoear ly that the
1 8' inlet port opened long before P dropped to atmospheric: Also, IC was too early for P to recover even atmospheric pressure. Therefore, the reverse flow from both the inlet and scavenging ports must have been appreciable.
From these figures it.follows that there is an opt imum shifting angle of the disc valve for a given engine speed.
LITTLE HlLL ON DELIVERY RATIO CURVE IN LOW EN- GINE SPEED RANGE - Little hills are observed on the delivery ratio curves in the low engine speed range, as indicated by each curve in Fig. 4. These hills are not as pronounced as the usual peaks of the delivery ratio curves. But this event occurred not only with the engine which had a rotary disc valve inlet port, but also with the engine having a piston- valve inlet port, as described in the Appendix. Furthermore,
J
B.0.C T. DL
CRANKANGLE-DEGREES
Fig. 14 - Crankcase indicator diagrams, cases of T 1 6 5 ~ 2 and
165 1
these hills are observed also in the literature. (9-11) This phenomenon, peculiar only to crankcase -scavenged two - stroke cycle engines, has never been discussed.
CASE OF ROTARY-VALVE INLET PORT ENGINE - Fig. 15 shows the representative crankcase indicator diagrams for
t whose delivery ratio curve is shown in Fig. qf). 165 3' As the engine speed was relatively low, P dropped quickly to atmospheric after SO, then went into a "low tide." This negative pressure pulse generated pressure fluctuations in the crankcase, which were almost completely damped out a t the end of the suction stroke. In view of the fact that these hills have almost no relatioh with the angle area and timing of the inlet port, as indicated in each curve of Fig. 4,
.attention is directed to P at SC.
~t t SC coincided with the second peak of P after 3 1'
SO. That is, the air flow into the crankcase decreased in the next cycle; thus, the delivery ratio was smaller. At
t as the engine speed increased, the entire pressure pul- 3 2' sation shifted to the right in the figure; therefore, SC o c -
TIDC B PC TDC
Fig. 1 5 - Crankc
T DC sbc T D C
CRANKAWLE-DEGREES
:ase indicator diagrams, case of 165T3

curred during the second "low tide" of P. At t the pres- 3 3'
sure pulsation shifred more and P was nearly atmospheric at SC. On the orher hand, P at IC was about the same as at
and t . Therefore, a lit t le hill occurred on 3 t l ' 3 t 2 ' 3 3 the delivery ratio curve before and after t . With a further
3 2 increase in speed, t besides the pressure pulsation being
3 4' shifted more, the entire pressure wave dropped downward owing to the effect of the suct:on stroke. After t as
3 5' SC occurred during the first "low tide," the delivery ratio increased.
When the cylinder head was removed, Fra reached a maximum and coincided with the angle area of the scav- enging port Fsa. In this case, P dropped more rapidly after SO and made it possible to reproduce the same event over a wider engine speed range, as illustrated by the dash l ine in Fig. 4(f). This is favorable for better analysis.
Fig. 16 shows the indicator diagrams of T without 165 3
the cylinder head. Notation t * t * correspond to the 3 1 ' 3 3
BDC
CRANKANGLE- DEGREES
Fig. 16 - Crankcase indicator diagrams, case of T (without cylinder head)
165 3
troughs before and after the hill . - t * corresponds to the 3 2
peak. SC coincided with the second peak of "high t ide" at t *, with the second peak of "low tide" at t *, and
3 1 3 2 with the first peak of "high tide" at t *, respectively.
3 3 From this, the event described above is betterunderstood.
The natural frequencies of these pressure pulsations m e a - sured from the indicator diagrams were between 340-360 cps. There was no difference in,these values with or with- out the cylinder head. Therefore, putting the cylinder vol- ume aside, the crankcase volume and scavenging passages are noticed. Regarding the crankcase volume as V, the sonic velocity i n the crankcase as C , the scavenging passages as a pipe having a cross-sectional area A and a length L, the natural frequency of the air in the crankcase f is e x -
C
pressed as f = ~dq12). Using the measured values c 2 a VL
3 A = 0.62 in.2, L = 0.196 in., V = 11 .8 in. (this corre- sponded to m e crankcase volume when the piston was l o - cated halfway between bdc and SC), and assuming C = 1100 ft/sec, then f = 350 cps, which coincided with the value
C
from the indicator diagrams fairly well. CASE OF PISTON-VALVE INLET PORT ENGINE - Fig. 17
shows the crankcase indicator diagrams of the engine with a piston-valve inlet port, whose general specifications are shown in Table A-1. Although in this case the air delivery was measured on the running (firing) engine, the blowdown angle area was adequate in the entire speed range and thus no abnormal pressure rise right after SO is observed. This reveals that there was no reverse flow into the crankcase. Because of this, the delivery ratio curve very nearly coin- cided with that obtained when motoring. (See Fig. A-3.)
In Fig. 17, P expanded below atmospheric after SO. This depression (negative pressure pulse) generated a lit t le pres- sure fluctuation in the crankcase as in the case of the en- gine with a rotary disc valve inlet port. Since the inlet port was not open until after SC, this l i t t le pressure pulsa- tion disappeared with decreasing P. On the orher hand, right after 10 , P recovered rapidly and went above atmos- pheric. This positive pressure pulse also generated a lit t le -pressure fluctuation in the crankcase, as observed around bdc.
First, attention is directed to P at SC. At SC, a lower P is more favorable for increasing the delivery ratio. At t SC coincided with the second peak of "high tide" after 1'
SO. At t and t SC occurred during the second "low tide" 2 3'
of P. As the engine speed increased to i and t the whole 4 5'
pressure pulsation gradually shifted to the right. At t SC 6'
nearly coincided with the first peak of "high tide." Second, attention is directed to P a t IC, where higher
P is more favorable. At t , IC coincided with the second 1
peak of "high tide." As the engine speed increased, t - t 2 5'

the whole pressure pulsation gradually shifted to the right. At t IC coincided with the first peak of "low tide."
6' When the pressure difference between IC and SC which
governs the delivery ratio is considered in each case, it follows that a little hill on the delivery ratio curve will occur before and after t .
2 With further increase in the engine speed, SC comes
into the firs1 "low tide" and IC comes into the first "high tide" of P . When SC coincides with the first peak of "low tide" and IC with the first peak of "high tide," respectively, the maximum delivery ratio is obtained.
WHEN REDUCED AREA OF SCAVENGING AND EXHAUST PORTS IS CHANGED - In the test so far, the scavenging and exhaust ports were left unchanged. That is, the reduced angle area of the scavenging and exhaust ports Fra was-kept constant. To investigate result with another Fra most simply the cylinder head was removed. This case corresponds to that in which the blowdown angle area is greatly incieased; then Fra coincides with the angle area of the scavenging ports Fsa. One example of these cases is shown as dashed lines in Fig. 18. Solid lines represent the delivery ratio curves with the cylinder head. The speed n , which affects
0
L , shifts widely to a higher engine speed, and L be- max m ax
comes larger. In view of the fact that even by increasing
Fia, the delivery ratio curve doesn't exceed the limit curve (as illustrated in Fig. 5) i t follows that the reason the de- livery ratio is limited at the higher speeds is the shortage of Fra.
-o-- 1wT3 WITH - - - o - - - d 3 WITHOUT CYLINDER HEAD -A- lwT+ WITH - - - ~ - - - 1 6 4 WITHOUT CYLINDER HEAD
r I 1 I I I I I
I 2000 I 3000 I COOC 1 5000 GOO0 7000 1 ENGINE SPEED , n r p m
Fig. 18 - Relation between delivery ratio and engine speed, 150 deg valve cut-angle. Comparison of delivery' ratio curves with and without cylinder head
I I
BDC T DC CRANKANGLE- DEGREES
Fig. 17 - Crankcase indicator diagrams, case of the piston- valve inlet port engine described in Appendix A
On the other hand, in the low speed range, the delivery ratio curves with rhe cylinder head exceed those without the cylinder head. This may be explained as follows: With- out the cylinder head, Fra (Fsa) is so large for the speed that P drops more rapidly than in case with the cylinder head. Therefore, reverse flow from the scavenging ports during the bdc-SC period increases.
In general, as i t shortens the effect ive piston srroke, i t Z is not easy to increase Fra. Therefore, i t may be necessargi
to uril ize rhe effects from the inle t and/or exhaust pipe systems to increase the delivery rario in the high speed range.
CONCLUSIONS
6y means of motoring a rotary disc valve inlet port engine having no tuning effects from the inler and/or exhaust pipe systems, and by greatly changing the angle area and riming of the inlet port, the relations between delivery rario and engine speed were investigared. At the same t ime , the pres- sure indicator diagrams in the crankcase were recorded. T h e results obtained are:
1. By changing the t iming of the inle t port with a given angle area, the engine speed n which produces the maxi -
0'
m u m delivery ratio, varies. Earlier opening and earlier closing of the inlet port makes n shift to a lower engine
0
speed range. 2. To improve the delivery ratio characterisrics, it is
not necessary to change the angle area; i t is effecrive to change only the timing of the inle t port by shifring the disc valve with an opt imum cut angle around rhe crank- shaft in accordance with rhe change of engine speed.
For the engine used, the value of ( inle t port angle area) / (reduced angle area of the scavenging and exhaust ports)
= 2.2, and a shifting angle of the disc valve around 20 deg , which corresponds to 1470 of the in le t port angle area, produced the opt imum results.
3. Proper overlap in the uncovered port period of the scavenging and inle t ports causes a noticeably large delivery ratio in the lower engine speed range.
4. Little hills observed on the delivery ratio curves of both engines with rotary disc valve and piston-valve inler ports are peculiar only to crankcase-scavenged two-stroke cyc le engines. d h e n the scavenging port closure coincides with the peak of "low ride" and/or inle t porr closure coin- cides with the peak of "high tide" of pressure pulsation in the crankcase, this event occurs.
5 . As the reduced angle area of the scavenging and ex- haust ports is smal l , i t is useless to change the angle area and/or t iming of the inlet port to increase the delivery ratio in the higher engine speed range.
ACKNOWLEDGMENTS
The authors wish to thank K. Kawashima at Yamaha En- gine Corp. and Y. Yamaki at Fuji Heavy Industry Corp. who assisted with much of the experimental and consuuc-
t ion work. S. Takeshita, K. Yamamot?, T. Okamura, M. Muto, T . Nakata, K. Miyake, and T . Koda were most closel, associated with rhis work and their help is mosr sincerely appreciated.
T h e authors also wish to thank Dr. I . Watanabe and Dr. Benjamin L. Sheaffer for their appropriate guidance and advice.
Fi, Fs, Fe = Area of inlet, scavenging, and exhaust ports, respectively
Fia , Fsa, Fea = Angle-area of rhe inlet, scavenging, and exhaust ports, respectively
Fr, Fra = Areas and angle areas of reduced port for scavenging and exhaust ports
L = Delivery ratio n = Engine speed, rpm P = Pressure in crankcase P o = Ambient pressure
9 = Crank angle, deg
REFERENCES, PART 1
1. H. List, "Uer Ladungswechsel der Verbrennungskraft- maschine." Springer Verlag, Vol. 4 (1950), No. 2, p. 45.
2. T . Asanuma and N. Sawa, "On rhe Effecrs of Intake Pipe System in a Smal l Two-Stroke Cycle Gasoline Engine.' Transactions, Japan Soc. Mech. Engrs., Vol. 25 (1959), No. 156 , p. 834.
3 . F. Nagao, U. Shimamoto, and M. Miyake, "Effect oi the Induction Pipe in a Crankcase-Scavenged Two-Cycle Engine." Transacrions, Japan Soc. Mech. Engrs., Vol. 26 (1961), No. 171, p. 1675. See also paper 670030, " T h e Effect of Crankcase Volume and the Inlet System on thi Delivery Ratio of Two-Srroke Cyc le Engines." Presenred a t SAE Auromotive Engineering Congress, Detroit, January 1967.
4. S . Ishigami, "On Scavenging of rhe Crankcase C o m - pression Type Two-Stroke Cycle Diesel Engine." Technica Reviews, Kagoshima University, Vol. 2 (1962), p. 23.
5. P. H. Schweitzer, "Scavenging of Two-Srroke Cycle Diesel Engines." New York: MacMillian, 1949, p. 192.
6. M. Maekawa, "On the Nozzles a t Low Reynolds Nuc: bers with a View of Measuring Pulsating Flow of Gases." Transactions, Japan Soc. Mech. Engrs., Vol. 37 (1934), No. 209, p. 599.
7. Ref. 4, p. 55. 8. W. Wilhelm, "Einfluss der Spulkanalabmessungen
auf den Ladungswechsel kurbelkastengespulter Zwei takt- Mororen." Forsch. Landes. Nordrhein-Westfalen, No. 989, 1961.
9. F. Nagao, U. Shimamoto, H. Obayashi, and T . Kur: "Effect of Crankcase Volume on the Delivery Ratio of a Crankcase-Scavenged Two-Cycle Engine." Transactions, Japan Soc. Mech. Engrs., Vol. 25 (1960). No. 152, p . 314.
See also SAE paper 670030, listed in Ref. 3. 11. Fkport of Lecture Meeting, Journals, Japan Soc.Mech. 10. E. Watanabe and K. Komotori, "Study of the Delivery Engrs., Vol. 67 (1965). No. 545, p. 917.
Ratio Characteristics of a Crankcase-Scavenged Piston- 12. E. Fiala and H. P. Willmeit, "Schwingungen in Gas- Valve Inlet Port Two-Stroke Cycle Engine." Paper 156 wechselleitungen von Kolbenmaschinen." MTZ, Vol. 28
. presented at Meeting of Japan Soc. Mech. Engrs., 1966, p. 39. (1967), No. 4, p. 144.
In the preliminary test, the delivery ratio curves of the motored and running (firing) engine were compared. To avoid the tuning effects from the carburetor or throttle in the intake system on the delivery ratio, a single-cylinder cr ankcase-scavenged two -stroke cycle diesel engine was used. The general specifications and test equipment used are shown in T a b l e A-1 and Fig. A-1. To avoid the tuning effects from the inlet and/or exhaust pipe systems, both ports were connected to receivers through short ducts with
Table A - 1 - General Specifications of Robin DC 32 Engine, Huji Heavy Industry Corp.
Cylinder bore x stroke
Cylinder volume Rated output Compression rat io Crankcase compression
ratio :nler port
kavenging port
xhaust port
Air- cooled, single-cylinder, Schniirle- scavenged two- snoke cycle diesel engine
3.34 in. ~ 3 . 3 9 in.
34.6 c u in. (567 cc) 10 hp/2000 rprn 23:l 1.35: 1
b
Opened 52 deg btdc, closed 52 deg atdc
Opened 56 deg bbdc, closed 56 .deg abdc
Opened 71 deg bbdc, closed 71 deg abdc
large cross-sectional areas as shown in Fig. A-2. Fig. A-3 shows that there was almost no difference in the delivery ratio characteristics between the motored and running engines.
The brake m e a n effective pressure of Pme = 56.9 psi corresponds to 110% load for the engine
APPENDIX A - Part 1
I : OIL TANK, FUELTANK I 7 : RECEIVER C (7.1ft3) 2 : OIL METERING DEVICE I 8 : OUT DOORS 3 : FUEL METERING DEVICE I 9 : OVER FLOW 4 : WATER MANOMETER 2 0 : WATER SUPPLY 5 : WATER MANOMETER 2 1 : WATER HEAD TANK 6 : THERMOHETER 2 2 : TACHOMETER 7 : CYLINDERHEAD EXHAUST 23 :WATER DYNAMOMETER
GAS TEMP. ~ V ' M E T E R 2 4 : VARIABLE DIAMETER PULLEY 8 : FILTER TYPE SMOKE METER 2 5 : MOTOR 9 : THERMO COUPLE 2 6 : MOTOR
10 : CONTROL VALVE 2 7 :RECEIVER A (7.1ft31 I I :RUBBER MEMBRANcE 12 : ROUND NOZZLES 13 : ROOTS BLOWER I 4 : RUBBER MEMBRANCE I 5 :RECEIVER B ( Z l f t 3 ) 1 6 :ENGINE
C.
3 Fig. A- 1 - Test equipment used

RECEIVER B EXHAUST
d
I EGINESPEED n rpm
Fig. A-2 - Inlet and exhaust ducts in detail
Fig. A-3 - Relation between delivery ratio and engine speed, 3.0 4.0 5.0 7.0
6.0 x ,"I in piston-valve inlet port engine. Notations t - t cor-
1 6 . - n D VALUE in-rpm respond to indicator diagram in Fig. 17

PART 2
CASE OF PISTON-VALVE INLET PORT ENGINE
2 THE OUTPUT CHARACTERISTICS of small crankcase- The inlet port angle area of 502 deg-in. was nearly scavenged two-stroke cycle engines with the same scavenging the same as the original and i s denoted as Fia. Two methods system depend mainly on the delivery ratio. When theJe are no tuning effects from the inlet and/or exhaust pipe systems, the delivery ratio characteristics of such engines may be obtained approximately by motoring. The authors have reported (i)" the relations between the delivery ratio and engine speed for the case of a rotary disc valve inlet port engine.
In this Part, the same relations were investigated under motoring conditions with a conventional piston-valve inlet port engine by varying the angle area and the timing of !he inlet port.
of varying the inlet port with engine speed are practical: varying the port width keeping the height constant, orvary- ing the port height keeping the port width constant. Table 4 shows the relative width of the port in relation to the cylinder periphery and the relativeheight of the port in relation to the stroke at each different angle area from 1/5 Fia to 5/5 Fia. In the table, since the port width with a relative height lower than 24.770 i n ( a ) and with a relative width wider than 39.870 in (b) overlaps the scavenging port in width, the inlet
Table 3 - General Specifications of Tohatsu T52D Engine EQUIPMENT USED AND TEST PROCEDURES
The general specifications of the engine and equipment used are shown in Table 3 and Fig. 19. In order to avoid the tuning effects from the inlet and/or exhaust pipe sys- tems on the delivery ratio characteristics, the exhaust port opened to the atmosphere through a short duct with a large cross-sectional area, as illustrated in Fig. 20. The inlet port opened directly into receiver C where the pressure was
TY Pe Air- cooled, sigle-cylinder, ~ c h n k l e - scavenged, t w o - s ~ o k e cycle gasoline engine
Cylinder bore X stroke 2.04 in. x2.28 in. 3
Cylinder volume 7.52 in, (123cc) Rated output 10.3 hp/6700 rpm Compression ratio 7.8:l
always kept equal to that of the atmosphere by a Roots blower Crankcase equipped with a bypass valve. The air flow rare to the engine was measured by round nozzles ( 0.59 in. @, 0.47 in.@) (2) Scavenging port
attached to the surface of receiver A. To ensure the correct opening and closing of the ports, the diameter of the piston (which was substituted for rhe one with no pin offset) was ~~h~~~~ port machined to a diameter equal eo that of the piston skirt over its total length. The inlet port was varied by changing cylinder liners; the cylinders had different inlet ports but the same scavenging and exhaust ports as indicated in Fig. Reduced angle area of 21. scavenging and
exhaust ports "Numbers in parentheses designate References at end of Inlet port
part 2.
Opened 59.5 deg bbdc, closed 59.5 deg abdc, angle area -
2 59.6 deg- in.
Opened 78.5 deg bbdc, closed 78.5 deg abdc, angle area -
2 107 deg-in.
2 46.6 deg-in.
Variable by changing cylinder liners
u TACHOMETER Fig. 19 - Test equipment used

OUTLET & ~ 7 7 "
TEXHAUST I 3 PORT SIDE
lc- 2,," --I Fig. 2 0 - Exhaust ducr in detail
porr was divided into rwo halves. T h e orher half was lo- cated beneath rhe exhaust porr, as cylinder liners (b) and ( c ) in Fig. 2 1 indicate. As rhere was no inlet duct, rhe port widrh was taken along the cylinder periphery (thar is, arc length), as illustrated in Fig. 22. To.minimize rhe ef- fect of thickness (3), the edges of the inlet porrs and rhe bottom end of the piston skirr were finished as illustrated in Fig. 22.
Fig. 23 shows rhe relarionship berween the uncov&ed in! port area and the crank angle with different port configura- rions having the same angle area Fia. Fig. 2 4 shows rhe relation between the relative height and the relat ive widrh of the inlet port ar Fia. In Fig. 24, when the relative heigl is reduced from 30% to 207'0, the relative widrh increases
Table 4 - Inlet Porr Conditions Tested
(a ) Width of Inlet port (70) of Cylinder Periphery When Changing Angle Area, Keeping Port Height Constant (Nondimensional inlet porr angle area Fia"' = 0.121)
Port Height,
H, %
35.3 30.0
24.7 21.4 19.7
Port Height,
H, in. 1 /5 Fia 2/5 Fia 3/5 Fia 4 / 5 Fia 515 Fia - - P --- - 0.81 4.6 9.1 13.7 18.2 22.8 0.69 5.9 11.8 17.6 23.5 29.4 0.56 8.0 15.9 23.9 31.8 39.8 0.48 9.7 19.4 29.1 38.8 48.5 0.45 11.3 22.5 33.8 45.0 56.3
(b) Height of Inlet Port (lo) of Piston Stroke When Changing Angle Area, Keeping Port Width Constant (Nondimensional inlet port angle area F ia* = 0.121)
Port Width,
B, '%
Port Width, B, in. 1 /5 Fia 215 Fia 3/5 Fia 4 /5 Fia 5/5 Fia - - 3.62 6.7 10.7 14.1 17.1 19.7 3-12 7.4 U .9 15.5 18.6 21.4 2.56 8.5 13.6 17.6 21.4 24.7 1.89 10.3 16.6 21.5 26.0 30.0 1-47 12.2 19.5 25.3 30.5 35.3
Fig. 2 1 - Cyllnder liners having dif- ferent lnlet ports of constant angle area
2 Fla = 102 deg- ir.

:om 3090 to 5670 which is impracticable unless the port is ivided into two halves. The A and B marks in the figure ~ d i c a t e the te'sted range of port widths and heights. The ondimensional inlet port angle area, Fia ,* is defined in .ppendix B of this part of the paper.
)ISCUSSION OF RESULTS
RELATION BETWEEN DELIVERY RATIO AND ENGINE PEED - Figs. 25-27 show delivery ratio versus engine speed.
I" 0.1 in .
Y-Y I SECTION
H : INLET PORT HEIGHT
h: INLET PORT OPENING HEIGHT
I 5 :INLET PORT WIDTH
X-X SECTION
Fig. 22 - Inlet port in detail
In each figure, inlet ports with different configurations having the same angle area are illustrated. Fig. 25 covers the case of the largest angle area Fia. In Figs. 26(a)-(e) the inlet port was varied by changing the port height with a constant port width, while in Fig. 27 the inlet port was varied by changing the port width with a constant port height. In each figure, the engine speed which produced the maximum delivery ratio, hereafter denoted as n , shifted to a higher
0
speed with an increase of inlet port angle area. As is known, at a certain inlet port angle area, when the engine speed is higher than n the angle area becomes inadequate, that is
0'
the inlet port closes before the inlet process finishes. On the other hand, when the engine speed is lower than n
0'
the angle area is too large to check the reverse flow of the
Fig. 24 - Relation between port width and port height a t constant angle area ( Xdenotes ratio.of connecting rod length and crank radius)
Q8 ' ANGLE-AREA
C R A N K A N X E deg
;. 23 - Relation between uncovered inlet port area and mk angle (a11 curves (a- e ) have the same angle area)
ENGINE SPEED n r p m
Fig. 25 - Relation between delivery ratio and engine speed, case of largest angle area

air from the crankcase. Also, each figure shows that when . . . - . . - . . - . . . . the inlet port angle areas were identical, a lower and wider 0.8i-ANGLE-mEA : 1
port (resulting in a longer effective crankcase stroke) p ~ o - : I
duced a larg& delivery ratio over the entire engine speed i range. I
Fig. 28 shows superimposed envelopes representing the delivery ratio curves of Figs. 25-27. Shown are the lilniting -I 1
I delivery ratio h v e s when the angle area and timing of the inlet port are changed. Also, nD values (n = engine speed in : I
I 1 ;
- 1.8 1" - / 3 % -. - x - r i t ' 55.3 !
rpm, D = cylinder bore in in.) are indicated. F;~. 28 shows that when angle area of inlet port was varied in accordance with the change of engine speed to improve the delivery
0.3 - I
I
1000 2000 3000 LOCO jW GOO0 7020
ENGINE SPEED n r P m
Fig. 26 (a) - Relation between delivery ratio and engine speed
ENGINE SPEED n r p m
Fig. 26 (b) - Relation between delivery ratio and engine speed
Fig. 26 (c) - Relation between delivery ratio and engine sp,
ENGINE SPEED n r p m
Fig. 26 (d) - Relation between delivery ratio and engine spt
Fig. 26 (e) - Representative crankcase indicator diagram

ario characteristics, i t was better to vary the por: heighr ieeping the port width constant than to vary the port width ieeping port height constant. In Fig. 28, the delivery ratio :urve of the inlet port with a 3070 relative height and 4 /5 'ia angle area, which is nearly the original design, is indi- :ated by-m- and the curve of 17.170 relative height, which s the lowest port with same angle area, is indicated by -X-. From this figure, i t follows that by varying only he inlet port, some improvement of delivery ratio charac- eristics can be expected. Especially when the inlet port !eight is varied keeping the port width constant with the
ENGINE SPEED n r p m
ig. 27 (a) - Relation between delivery ratio and engine
ENGINE SPEED , n r p m
ig. 27 (b) - Relation between deliveiy ratio and engine I eed
change of engine speed, the delivery ratio characteristics in the middle and low speed ranges can be improved signifi- cantly.
Fig. 29 shows the relation between the maximum delivery ratio L which is given from each delivery ratio curve
max' in Figs. 25-27, and the effective crankcase stroke. Solid lines represent a constant port width and dashed lines a constant port height. Noting from Figs. 25-27 that when t h e delivery ratio curve had a large L the whole curve
m ax was higher over the entire engine speed range, L is
m a x
ENGIKE SPEED , n r p rp
Fig. 27 (c) - Relation between delivery ratio and engine speed
I I I I I I L I000 2030 3000 4033 5000 6000 70
ENGINE SPEED n r p m
Fig. 27 (d) - Relation between delivery ratio and engine speed

plotted. Fig. 29 indicates that when the angle area of the Discussions of the pressure indicator diagrams calculated inlet porr was the same, L increased almost in pro- in the crankcase with variable inlet porr height were pre-
m ax viously reported (4, 5). So, in rhis paper, artention is d i -
portion to the increase in effective crankcase stroke. Com- rected to another important factor which auects delivery
paring the dashed lines wirh the solid lines, it is clear that ratio - - the flow coefficient of the inler porr.
wirh the same angle area, a lower and wider inler port (which causes a longer effective crankcase stroke) produced a larger ANALYSIS O F FLOW COEFFICIENT OF delivery ratio. Noting that the delivery ratip curves with a INLET PORT =a
larger angle area than 315 Fia were nearly superimposed, it may be said that when angle area is large enough, L In order to understand better the test results mentioned
above, the authors think it is necessary to take a close look is almost determined by the effective crankcase stroke. a t the flow coefficient of inlet ports with different c o n f i g u r ~
In case of thesurves withsolid lines, L became a maxi- tiom. ln view of the fact that L increases with a n in- m ax m ax nluln when the angle area was about 3/5 Fia, whilein case crease in effective crankcase stroke ( ~ i ~ . 291, attention is
thedashed lines, becamea a t 4/5 directed to the flow coefficient of the low, wide inlet port. m ax Fia. The reason may be stated as follows: when the port the case of a Poppet valve, the flow coeffi-
height is varied keeping the port width constant, a longer cient of this type of inlet port has been scarcely discussed.
effective crankcase stroke is available, which causes a higher effect of the port configuration and engine
crankcase compression ratio and thus less inlet porr angle Speed on the flow coefficient, a flat plate model of the inle-
area is needed. pcrt and cylinder liner inlet port were used for testing. TEST EQUIPMENT USED AND TEST PROCEDURE - The
A s the engine had 46.6 deg-in.2 reduced area Iest equipment used is illusuated in Fig, 30. A flat plate of the scavenging and exhaust ports, of area model of the inlet port shown in Fig. 31 or a cylinder liner of the port which produced maximum is, inlet was attached to the surface of receiver B'. The max ' optimum angle area of the inlet port)/(reduced angle area air flow rate was measured by round ~ o z z l e s ( 0.71 in. @,
of the scavenging and exhaust ports) was 1.31 and 1.75 in 0.59 in. @, 0.45 in. @) at receiver A. The flow coefficient
each case, respec~ively. Little hills are observed on the delivery ratio curves of 0.80 4 I I , I
Figs. 25-27 in the low engine speed range. As rhis phenom- enon is already discussed in detail in Part 1 of this paper, I
explanation of it is omitted here. ,075- rO E J
I - 0'970 - - A
07
.J
0.6
0 t- a , 0.5
r [L w 7 0 4 5 W n
3.3
10' , 515 Ed
n D VALUE , ~ n - r p m Fig. 29 - Relarion between maximum delivery ratio and
Fig. P S - Relation b e m e e n delivery ratio and engine speed effective crankcase stroke. Dashe.d lines - when porr width (comparison of the limiting delivery ratio curves between is changed at consranr angle area. solid lines - when porr
porr \\.idrh constant and port height constant) height is changed at constant a n ~ l e area
- - -- w > - W &
i / 0 0 6 0 - . -2- - ..
PORT WID? H 5 CONSTANT E .PORT HElGHT 2 055 CONSTANT -- x -x- H ~17.1%
-o- H ~ 3 0 . 0 %
/ /
/ ,------.' - -. - -.- ,I f / , . "'
/ I
a/ I a , 0.50
I
1000 2000 3000 4000 5000 6000 7000
ENGINE SPEED , n r p m
0.50 055 060 065 030 075
EFFECTIVE CRANKCASE STROYE / STROKE
. 1/5Ea - - - - 8 PORT HECHT CONSTANT
B , 2 / 5 F a - PORT WIDTH CONSTANT
x 8 3 /5 6s 0 415 La
20 4 0 60 8.0 10.0 120 140

was defined as the ratio of the measured flow to the theore- tical flow through the model or the cylinder liner inlet porl. The flow rate was'varied at each port configuration bychang- ing the pressure difference across receiver 13' between 3.9 and 15.8 in. water manometer. As is known from the l i tera- ture (6-9) , this small pressure difference did not cause any difference in the measured flow coefficients.
FLAT PLATE hlODEL OF THE INLET PORT - As illus- trated in Fig. 3;, rhe edges of port were rounded to a qua- drant arc, which was varied by changing the thickness of the plate to determine the effect of the rounded edges on the flow coefficie.nt. Although several back plates with different thicknesses were tested, the influence of this thick- ness on the flow coefficient was not significant; therefore, the same back plate with a thickness of 0.1 in., which cprre- sponded to the thickness of the piston skirt of the engine, was used throughout the entire experiment. Two types of ports with 1.18 in. width and 0.59 or 1.18 in. heights were used with the following plate thicknesses (that is, with the following quadrant arc radii): 0.1, 0.2, 0.3, and 0.4 in. In each case, the back plate was positioned to vary the port opening height.
CYLINDER LINER INLET PORT - The cylinder liners shown in Fig. 21 were used. As illustrated in Fig. 30(b), piston was positioned in the cylinder to vary the port opening height. The measured flow coefficients were compared with the case of the f la t model port and also with those measured under dynamic conditions.
RECIPROCATING ENGINE INLET PORT - The relations between the flow coefficients measured under static and dynamic, that is, reciprocating, conditions were investigated using the test equipment illustrated in Fig. 30 (a).
Air flow from the Roots blower passed through receiver
lNET PORT
TO R r n BLOWER
TACHOMETER
a
(a) FOR MODEL INLET PORT AN0 WNAMIC FLOW COEFFlClENT
Fig, 30 - Test equipment used for measuring the flow coef- ficient of inlet port
B' and was led to receiver C ' , while the model port a t re- ceiver B' was sealed. The inlet port in the cylinder liner opened directly into receiver C'. The crankcase had several outlet ports of 5 . 6 sq in. total area leading to the atmos- phere. The air flowed from receiver C ' into the crankcase through the cylinder liner inlet port, then out into the a t - mosphere. As the angle area of the inlet port almost coin- cided with the reduced angle area of the inlet port and the out let ports in the crankcase, the authors thought i t was permissable to ignore the pressure fluctuations in the crank- case.
If the air flow rate per cycle into the crankcase is e x - pressed as Gc, then
where
Fi = Inlet port area
€3 = Crank angle g = Acceleration due to gravity
BACK PLATE
t : 0.1 ,a2,0.3,0.4 ' ~ n h : INLET PORT
OPENING HEIGHT
H : INLET PORT HEIGHT
: INLET PORT W lDTH
Fig. 31 - Model of inlet port in detail

Specific heat ratio Pressure in receiver C '
Ambient pressure
Specific volume of air in receiver C'
Port opening period of inlet port Opening and closii~g of inlet port, respectively
pdrn is called the dynamic mean flow coefficient in this paper.
Fi (0) . dB/(@. - 0 . ) indicates the mean inlet 1C 10
10 port area during the port opening period.
The pressure difference across receiver C ' was varied between 3.9 and 23.6 in. water manometer, while the engine was driven through the variable diameter pulley a t 1700- 6000 rpm. At each condition, pdrn was calculated using the measured values from Eq. 1. The relation between the static flow coefficient ps and the dynamic mean flow co- efficient pdrn is written as follows:
where:
Eq. 3 shows the static mean flow coefficient. The ratio of pdrn and psm is denoted as K, and is called the dynamic factor in this paper. That is,
DISCUSSION OF RESULTS - Static Flow Coefficient - 1. Effect of the port configuration and the rounded edges
(quadrant-arc sections) of the inlet port on t h e flow co- efficient.
Fig. 32 shows the relationship between the static flow co- efficient p s and the relative height of the inlet port open- ing in relation to the port width h/B. From each 1 s curve, i t follows that ps was larger near the beginning of port open- ing and decreased as the pon opening height, h , increased.
and Benson (ll), who measured the ps values at the scaveng- ing and exhaust ports which had guiding surfaces, such as the piston crown and the scavenging and exhaust ducts. 11
also correlated well with the results of Suda (4) , who mea- sured the ps values of an inlet port with a duct, and those of Tanaka (12) , Kastner (8), and Pope (9) who measured the ps values of the poppet inlet valves. In the case of the pop- pet valve, Tanaka (13) took photographs of the air flow around the inlet valve, and Kastner (8) investigated the air flow on a two-dimensional model of the inlet port using a pitot tube. Both results showed that the flow separation from the guide surface increased with an increase in port opening height. Annand (8) explained that with poppet valv the viscous effects in the gap suppressed the flow separation from the guide surface when the port opening height was low.
It is generally acknowledged that the flow coefficient is t h e product of the velocity coefficient and the contractic coefficient. The velocity coefficient is thought to decreasc with small nozzles because of the increase in the friction loss due t o the viscous effect. On the other hand, the contlac tion coefficient is due to three-dimensional effects (14) anc is said to increase as a result of compressibility with an in- crease in pressure ratio, as the test results of Ramamoorty (15) with quadrant arc nozzles and Perry (14) with sharp- edge orifices showed. Taking these facts into account and noting t h e ps curves in Fig. 32 p ~ ~ i n c r e a s e s with a decrease in h/B, that is, a narrow port has a larger ps. This means that the viscous effects in the gap, which m a y suppress the flow separation, a r e not so significant as to decrease the velocity coefficient, but the increase in contraction co- efficient affects t h e increase in ps. The increase in con- traction coefficient with t h e decrease in h/B may b e partl: d u e to the reduction of flow separation and partly t o the
1.0
3 0.9
t- z 0.8 W - c LL LL 0.7 W 0 C)
0.6 0 -I LL
0.5 0 0.2 0 P 0.6 ' 0. 8 1.0
h/B INLET PORTOPENING HEIGHT/INLET PORT W'.
H x B i n a : o . 6 ~ 1.2 b : 1.2~12
Fig. 32 - Relation between flow coefficient and inlet por configuration (influence of rounded edges on flow coef-
The resulrs were the same as those of List, Niedemayer (10) ficient)

change of flow patterns from three-dimensional t o nearly two-dimensional, that is , the effect of the side walls on the flow becomes less with a decrease in rhe port openingheight. This is also verified by noting the fact that when the port opening height was the same, the wider port had a larger
ps, as is indicated later in Fig. 35. All of the ps curves in Fig. 32 decrease smoothly with an
increase in h and no singular points are seen on the curves, as are usually observed in the case of poppet valves. Con- sidering the test results of Tanaka and Kastner, i t seems that the flow separation point, thar is, the front of the free sueam l ine , shifts smoothly because of the rounded edges of the inlet port, as illustrated in Fig. 31.
In ~e ac tua lengine , when the inlet port opens, the pres- sure difference between the crankcase and the atmosphere is much greater than in these tests. Therefore, because of the increase in contraction coefficient caused by the compress- ibility of the air , the actual curves may b e higher than the measured values in the neighborhood of port opening.
The effect of the rounded edges of the quadrant arc sec- tion was significant. Although a larger radius of curvature produced a larger ps in th.e figure, by noting that there was l i t t l e difference in the ps curves berrween plate thicknesses t = 0.3 and t = 0.4 in., t/(Width of inlet port) = 0.3 seems to be an appropriate value.
Here, it should b e noted that ~s increased again when the port opening height, h , approached the port height, H. This
is significant, a sp s is large when the uncovered port area is large enough. This causes a larger effective inlet port angle area. As illustrated in Fig. 23, a wider and lower inlet port had a larger maximum port area than a narrower and higher inlet port for the same angle area. Moreover, the increase in ps around top dead center , chat is, near maximum port opening area, was more remarkable for such a port. These facts indicate that a wider and lower inlet port is more de- sirable for obtaining a larger effective angle area.
the piston skirt may have caused a significant contraction of flow, while in Fig. 31 (b) , i t may have been less because of the rounded upper edge. This caused a difference in lis. When piston was located to give full port opening in Fig. 31 (b) , the difference in ps became more remarkable. In Fig. 32, the point of 0.5 in relative port height h/B cor- responds to this particular case.
In short, a wider and lower inlet port having rounded edges, especially a rounded upper edge with large radius of curvature, produced a larger ps throughout the inlet port opening period.
2. Relation between the flat plate model and the cyl- inder liner inlet port.
Fig. 34 shows ps for the same size inlet ports. (a) with the model and (b) with the cylinder liner. The difference was, as shown in Fig. 22 , the width of the inlet port; in the case of the cylinder l iner , the width was measured along the cylinder periphery, causing a shorter effective port width. The configuration of the port was nearly the original. The width of the portreached about 28% of the cylinder periphery, which was about the maximum value possible to avoid over- lap with the scavenging ports. In this case, the difference in ps between the model and the cylinder liner pons may be most remarkable. As is seen in the figure, the difference occured as the port opening height increased, and it became the largest at the fully open position. Comparing Psm ca l - culated from ps, psm became 0.74 and 0.68 to each case, respectively, that is, the difference in effective angle area berween them was about 97~.
Funhermore, using the measured psm value of 0.70 ob- tained by Suda (4) with same engine but having an inlet duct (in &is case, the width of port was measured perpen- dicular to the air flow or chordally), the effective angle area in both cases may be compared. psm was 0.70 and 0.68; the pon width was B ' and B in each case, respectively,
This increase in ps may be caused by the effect of the rounded upper edge of the port. Fig. 33 shows two types of portshavingthe same rounded edges but different port heights. 1 0
In Figs. 33 (a) and 33 (b) , both pistons had the same port 2pening height , that is , both ports had the same port opening 0.9 nrea. In the case of Fig. 33 (a ) , the sharp bottom edge of
- 0 8 C z W 5 0.7 LL LC ul
0.6
Z 0 I? 0.5
0 0.1 0.2 0.3 0 4 3 6 0.7 0.8 a9 1.0 h /B
INLET FORT OPENING HEIGHT/ INLET PORT WDTH (t =Q.l)
Fig, 34 - Relation berween the flow coefficient and inlet
Fig. 33 - Influence of rounded upper edges on inlet flow port cofiguration (relation between cylinder liner inlet port and model of inlet port)

as indicated in Fig. 35. Thus, the ratio of effective por.1 area in both cases was (O.GS x G)/(0.70 x B' ) . It follows that about an 1170 increase in effective angle area i s pos- sible when'using the port width along the cylinder periphery. This means that it is bet ter , if possible, not to use an intake duct but to make the inler port open directly into the air (as in this experiment) in order to increase the effective angle area with the same size of inlet bort. In Fig. 3 4 , the ps of a square port with the same width is also indicated.
3 . Effect of a rounded bottom edge of the piston skirt on ps.
T h e ps vaIues so far were measured using a piston skirt having a sharp bottom edge as illustrated in Fig. 36 (a).
I Fig. 35 - Port width, relation between arc B and chord B'
Here, the effect of a rounded bottom edge, as illustrated in Fig. 36(b) , on ps was investigated. In this case, the port opening height , h , should be taken as in Fig. 36 , and since the term flow coefficient may not be appropriate, the ratio of effective port opening area to port o p e n i q area is used instead of ~ s . From Fig. 36 it follows that the larger the radius of curvature at the bottom edge of the piston skirt, the smaller the effective port opening arc? became.
Dynamic Flow Coefficient - To understand the effect of dynamic (that is, recipro-
cating) conditions on t h e flow coefficients, the dynamic mean flow coefficients pdm were measured on the motored engine using t h e test equipment illustrated in Fig. 30(a). First, the static flow coefficient ps were measured with the same cylinder liners, selecting the three port configurations of Figs. 23(a ) , (d), and (e). All of ttiese had the same angle
2 " area of Fia = 102 deg-in. (Fia = 0.121). The measured ps values a re shown in Fig. 37, which shows that the wider port had a larger ps when the port opening height, h , was the same. Comparing the effective angle a rea , that is,static mean flow coefficient, using Fig. 23 Psm became 0.72, 0.68, and 0.62 for each of (a) , (d), and (e) , respectively. This means that a wider and lower port had a larger psm when the angle area was t h e same.
Figs. 38 a - c show the pdm values measured. In each figure, pdm decreased with an increase in engine speed. This tendency was more remarkable when there was less pressure difference across the inlet port. When the engine speeds and the pressure differences were the same, a wider and lower port tended to have a larger pdm.
These facts indicate that pdm had a close relation to the inlet air velocity and t h e piston velocity, as illustrated i n Fig. 39. So, the theoretical i rJet velocity V caused by
a the pressure difference across the inlet port, and the mean - piston velocity V while the inlet port was open were ca l -
P h : INLET PORT OPENING HEIGHT
d
- -
W INLET FORT OPENING HEIGHT/ INLET PORT WIDTH , h/B
Fig. 36 - Relarion between flow capability and inlet port configuration (influence of rounded bottom edge of piston)
a -@-M5 X36212-- d -.-(Xi9 X1.89 e - 0 - 0 8 1 X1.47,
LL
3 0
0.6
O=O 0.2 0.4 0.6 0.8 INLET PORT OPENING HEIGHT, h in.
Fig. 37 - Relation between flow coefficient and inler port opening he ight
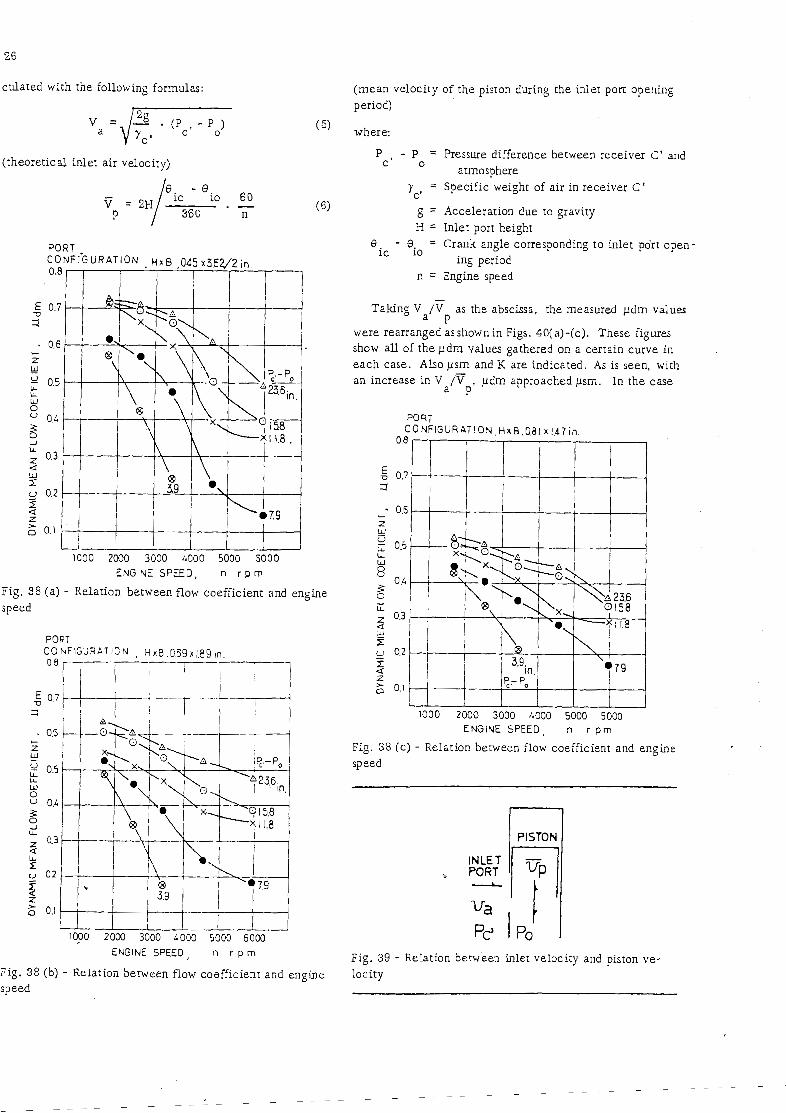
culated with the following formula :
(theoretical inlet air velocity)
PORT
(mean velocity of the piston during the inlet port opening period)
where:
P - P = Pressure difference between receiver C' and c ' 0
atmosphere
%' = Specific weight of air in receiver C '
g = Acceleration due to gravity H = Inlet port height
e - i c 'io
= Crank angle corresponding to inlet port open- ing period
n = Engine speed
Taking V /V as the abscissa, the measured pdrn values a P
were rearranged asshownin Figs. 40(a)-(c). These figures show al l of the pdm values gathered on a certain curve in each case. Also psm and K are indicated. As is seen, with an increase in V /v pdm approached psm. In the case
a P '
E N G I N E S P E E D , n r p m
Fig. 38 (a) - Relation between flow coefficient and engine speed
ENGINE S P E E D , n r p rn
Fig. 38 (b) - Relation between flow coefficient and engine speed
ENGINE SPEED, n r p m
Fig. 38 (c ) - Relation becween flow coefficient and engine speed
INLET PORT L
Fig. 39 - Relation between inlet velocity and piston ve- locity

of the lower and wider port, the approach was more rapid. Since an increase in V indicates a decrease in piston
a P velocity, i t seems to be natural that pdm approached psrn with an increase in V /V .
a P In the case of port configuration ( a ) , K was already unity
a t V /V = 30. On the other hand, in the cases of (d) and a P
( e ) , I? was 0.94 and 0.80, respectively. Besides tha t , psm was smaller than in the case of (a).
The results obtained may be explained as follows: in the case of a larger psm, (that is, when the air flowed closely along the guide surfaces), the flow was more stable against external disturbances than in the case of a smaller psrn (that is , when the air flowed with separation having free stream
lines). Moreover, as the lower port-had a b w e r v at the P
same engine speed, the dynamic effect became less signifi- cant.
Therefore, when the angle area of the inlet port is fixed, it is better to use a wider and lower port in order t o get a larger effective angle area, as t h e pdm value of such a port approaches a larger psm value more quickly a t smaller - V /V 'values.
a P In case of the actual engine, the value of V /v is much
a P larger than in these tests in most port opening periods, so the authors think it reasonable to use psm instead of pdm in deciding the capability of air flow through these ports.
In contrast t o the explanation of Kastner, even with t h e
4 m STATIC MEAN FLOW COEFFICIENT
0.8 I
STATIC MEAN FLOW COEFFICIENT
Fig. 40(b) - Relation between dy- namic mean flow coefficient pdm and V /v
a P
JJsm
THEORETICAL INLET VELOCITY/MEAN PISTON VELOCITY DURING THE OPENING PERIOD. ~JTF
4 - - 0 . 7 2 1.0 sm
0.7 p
0.5 1:
0.4 &
Fig. 40 ( a ) - Relation between dy- namic mean flow coefficient pdm
0.1 and V /v
--
5 10 15
- - X
20 2 5 3 0 35 40 a P
V 0.5 !L
THEORETICAL INLET VELOCITY/MEAN PISTON VELOCITY DURING THE OPENING PERIOD, ~ a / Tp
------ O-A
0.8
F,: = 0.121
.---. 0.7 _ _ _ _ _ _ e _ _
PORT CONFIGU RAT ION H x B (%)
19.7 x 56.3 91- PO in.
O - -
Q 3.9 - 7 . 9
x 11.8 0 1 5.8
23.6
- -
!L W
8 0.4 .
8 I? 0.3 2 a W I 0.2 2 z a g o.l
E
2 0.6
C- Z w
O x .x
B
0
0 x

test equipment used having no inlet duc t , pdm decreased with an increase, in engine speed. So, the decrease in iidm should be considered due to the loss of energy which is in- volved in accelerating the air regardless of the inlet duct or iniet passage.
From the above, i t follows that the reason a lower and wider inlet port produces a larger delivery ratio is not only the longer effective crankcase stroke but also the increased flow coefficient.
CONCLUSIONS
By mororing an engine having a conventional piston- valve inlet port. which had no tuning effects from the inler and/or exhaust pipe systems, and by changing widely the angle area and timing of the inlet port, the relations between engine speed and delivery ratio were investigated.
At the same t i m e , the flow coefficients of inlet porn with different configurations were investigated under static and dynamic conditions. The results obtained were:
1. W i t h an increase in inlet port angle area, t h e engine speed n which produces the maximum delivery rario in-
0
creases, and a t a cer tain angle area the delivery ratio obtains its maximum value. This optimum angle area differs, de- pending upon whether the port width is varied keeping the port height constant or the port height is varied keeping the port width constant. In the latter case, the oprimum angle area is smaller.
2. The maximum delivery ratio varies when the port height and port width are changed keeping the angle area constant. A lower and wider inlet port produces a larger delivery ratio, that is , the maximum delivery ratio is nearly in proportion to the effective crankcase stroke.
3. A lower and wider inlet port has a larger static mean flow coefficient,
4. The radius of curvature, which corresponds to about 30% of the port width a t the port edges, is favorable for a
larger flow coefficient. Especially, a rounded upper edge of the inler port is significant i n increasing the flow coef- ficient a t nearly complete port opening.
5. If possible, it is better to use the inlet port arrange- ment which utilizes the cylinder periphery as effective port width to increase the effective port area.
6 . A rounded bottom edge of the piston skirt decreases the effective port area.
7. Usually, the dynamic m e a n flow coefficient Pdrn of the inlet port is smaller than the static mean flow coefficient psm. The smalIer the pressure difference across the inlet port and h e higher the engine speed, the more significant the difference between them becomes.
8. Plotting pdm as the ordinate and the ratio of the the- oretical inlet velocity caused by the pressure difference across t h e inlet port and the m e a n piston velocity during the inlet port opening period V /v as the abscissa, almost a l l
a P pdm garher on a cerrain curve, In the case of t h e wider and lower inlet p o x , pdm approaches psm at small values of V /T .
- a P 9. In judging the air flow capability of this type of inlet
port, i t seems to be reasonable to use psm instead of pdm. Therefore, the authors would l ike to propose using the
widest port possible varying the port height with the change in engine speed to improve the delivery ratio characteristics of crankcase-scavenged two-stroke cyc le engines.
ACKNOWLEDGMENTS
The authors wish t o thank T. Toyoda a t Toyota Auto- mobi le Corp. who assisted with much of the experimental and construction work, M. Tone, K. Yanagihara, Y. Nakat- sugawa, N. Sakai, K. Sappa, T. Miyamoto, T. Koda, and K. Miyake were most closely associated with this work and their help is most sincerely appreciated.
T h e authors also wish t o thank Dr. I. Waranabe and Dr. Benjamin L. Sheaffer for their appropriate guidance and advice.
STATIC ME A N FLOW COEFFICIENT
0.8 urn
E D --------- ------.-----
0.6 -
C z
1-
0.9 W - 0
Q
2 0.5. A d' 0- X 0.8 LL
L W 0
0.7 0 0.4. .3 PC'-Poi". 0.6 0 J c 3 @ x - 8 3.9 0.5 L 0.3 -
z a 0.4 W Z 3.2 0.3 U
0. I 5 10 15 2 0 i 5 30 3 5
-HEORETICAL INLET VELOCITY/IV(EAN PISTON VELGCITY OLRlNG THE OPENING PERIOU.
Fig. 40(c) - Relation between dy- namic mean flow coefficient udm and V /F
a P
REFERENCES, PART 2 7. T. Saito and H. Okamura, "Study on the Flow Area of a Uniflow Two-Cycle Diesel Engine." Paper 101 pre-
1. E. Watanabe and K. Komotori, "Study of the Delivery sented at Meeting of Japan Soc . Mech .+ Engrs ., 1964, Ratio Characteristics of a Crankcase-Scavenged Rotary Disk- P. 25. Valve Inlet Port Two-Stroke Cycle Engine." Paper 143 pre- 8. L. J . Kastner, T. J. Williams, and J. B. White, "Pop- sented at meet ing of Japan Soc. hlech. Engrs., 1965, p. 121- pet Inlet Valve Characteristics and Their Influence on the
2 . M. Maekawa, "On the N w z l e s a t Low Reynolds Num- Induction Process." P.I.M.E., ~o1.'178 (1963-64) No. 36 , bers with a View of Measuring Pulsating Flow of Gases." p. 955. Transactions, Japan Soc. Mech. Engrs., Vol. 37 (1934), No. 9. J. A. Pope, "Techniques Used in Achieving a High 209, p . 599. Specific Airflow for High-Output, Medium-Speed Diesel
3. T. Sasaki, "The Coefficient of Discharge to rhe Scav- Engine." Transactions of the ASi\4E, Journal of Engineering enging and Exhaust Ports of Two-Stroke Cycle Engine." for Power, No. 4 (1967), p. 245. Transactions, Japan Soc. Mech. Engrs., Vol. 1 (1936), No. 2, 10. Ref. 6 , pp. 1 8 , 38 , 4 1 , 135. p. 139. 11. R S. Benson, "Experiments on Two-Stroke Engine
4. T . Suda and T. Ishimaru, "Porting of 2 Cycle Gasoline Exhaust Ports Under Steady and Unsteady Flow Conditions.' Engines." Journals, SAE of Japan, Vol. 16 (1962), No. 4 , P.I.M.E., Vol. 173 , (1959), No. 1 9 , p. 511. p. 200. 12. K. Tanaka, "Air Flow through Suction Valve of Con-
5. F. Nagao, U. Shimamoto, and M. Aliyake, "Effect ical Seat." Rep. Aero. Res. Inst. Tokyo Imp. Univ., Nos. of the Induction Pipe in a Crankcase-Scavenged Two-Cycle 1 7 , 22 , 27, 1929.
Engine." Japan Soc. Mech. Engrs., Vol. 26 (1961) NO. 171, 13.' Ref. 6 , Vol. 3 (1952), p. 47. p. 1675. See also paper 670030, "The Effect of Crankcase 14. A. H. Shapiro, "The Dynamics and Thermodynamic: Volume and the Inlet System on the Delivery Ratio of Two- of Compressible Fluid Flow." Vol. 1 , pp. 100 , 359, Ronald Stroke Cycle Engines," presented a t SAE Automorive Engi- Press, 1953.
neering Congress, Derroit , January 1967. 15. hl. V. Ramamoorthy and K. Seetharamaiah, "Quadranr 6. H. List, "Der Ladungswechsel der Verbrennungskrait- Edge Orifice-h30dificarion for Better Performance." La
maschine." Springer Verlag, Vol. 4 (1950), No. 2 , p. 16. Houille Blanche, No. 3 (1966), p. 313.
APPENDIX B - Part 2
Terms concerning ports are defined as follows: e Fra = " Fr (0) . d e (reduced angle area of the
e scavenging and exhaus; Fia = 11" Fi(l) d 6 ( inlet port angle area) so ports)
10 Ti Fia * = - 1 1 . - - . Fia (nondimensional inlet pori
J C F (0) d e 180 nD S
Fsa = (scavenging port angle angle area)
area) so
where:
Fea = 1'; Fe (0) . d e (exhaust port angle area) F = Port area D = Cylinder bore
e o S = Stroke 6 = Crank angIe
(reduced area of the scav- enging and exhaust ports) Subscripts e , s , i = Exhaust, scavenging, and inlet ports, F + F
e s respectively.
@q---j T h u paper is subject to revision. Sratemenrs and opinions been e d i ~ e d by SAE for uniform styling and format. Dlscuvion wlll b e prlnted
advanced in papers or ducussion a re the author 's and a re with t h e paper if 11 1s published In SAE Transactions. For permission to pubilsh
,,,,, his r e s p o r u i b ~ l i t ~ , not t h e Socletyqs; however, t h e paper has lhls paper In full or In parr, conracl t h e SAE P u b l ~ c a t ~ o m Divlsion and the authors.
Society of Automotive Engineers, Inc. 32 -page bookler . Printed in U . S . A .