a study of the effect of ion-exchange resin particle size
TRANSCRIPT

University of Rhode Island University of Rhode Island
DigitalCommons@URI DigitalCommons@URI
Open Access Master's Theses
1970
A Study of the Effect of Ion-Exchange Resin Particle Size on A Study of the Effect of Ion-Exchange Resin Particle Size on
Flourescent X-Ray Intensity Flourescent X-Ray Intensity
Alfred Lapham Allen University of Rhode Island
Follow this and additional works at: https://digitalcommons.uri.edu/theses
Recommended Citation Recommended Citation Allen, Alfred Lapham, "A Study of the Effect of Ion-Exchange Resin Particle Size on Flourescent X-Ray Intensity" (1970). Open Access Master's Theses. Paper 1099. https://digitalcommons.uri.edu/theses/1099
This Thesis is brought to you for free and open access by DigitalCommons@URI. It has been accepted for inclusion in Open Access Master's Theses by an authorized administrator of DigitalCommons@URI. For more information, please contact [email protected].

A STUDY OF THE EFFECT OF IO _T- EXCHANGE RES I N
PARTICLE SI ZE ON FLUORESCENT X- RAY I NTENSITY
BY
ALFRED LAPHAM ALLEN .
A THESI S SUB ~1ITTED I N PARTIAL FULFI LLME T OF THE
REQUI HEMENTS FOR THE DEGREE OF
MA STER OF SC I ENCE
IN
NUC LEAR ENGI NEERI NG
UNI VERSITY OF RHODE ISLAND
1970
MASTER OF SC I ENCE THESI S
OF
ALFRED LAPHAM ALLEN
Approved:
Thesis Committee : / ~
Chairman · ~cJ" k ~o/h~
Dean of the Graduate School
UNIVERSI TY OF RHODE I SLAND
1970
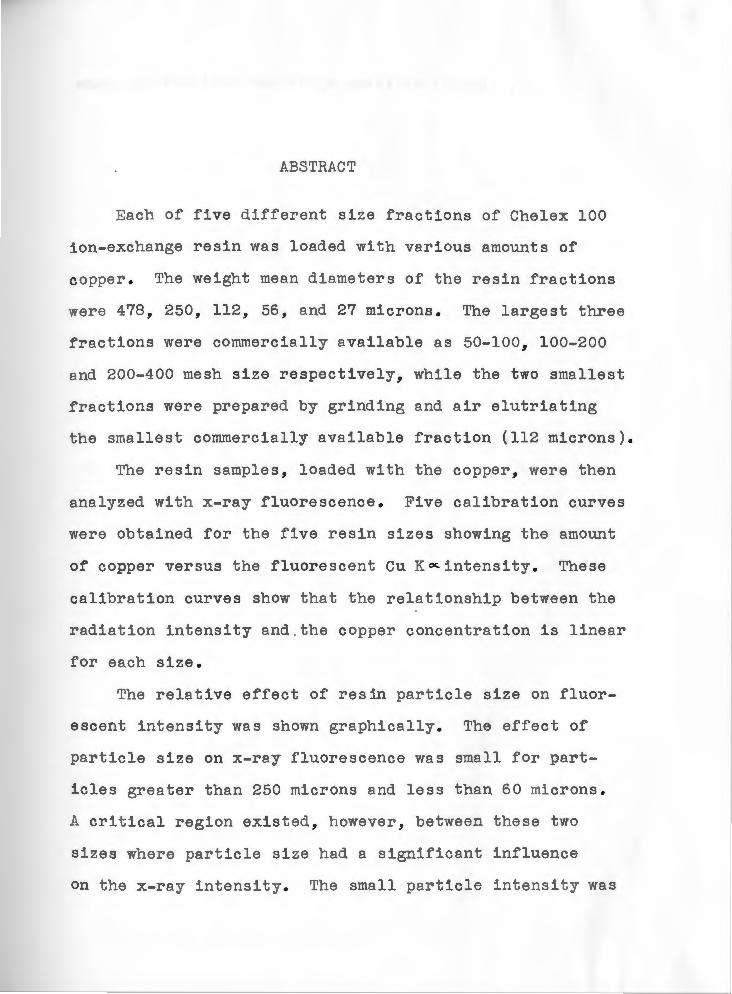
ABSTRACT
Each of five dif f erent size fractions of Chelex 100
ion- exchange res i n wa s loaded wi th variou s amounts of
c opper . The we i ght mean d i ame ters of the r e sin f ract i on s
were 478 , 250 , 112 , 56 , and 27 mi cr on s . The l a r gest t hree
fr actions were commer c i a lly ava ilabl e a s 50- 1 00, 100- 200
and 200- 400 mesh s ize re spect ively, whi l e the t wo smallest
f ractions were pr e pared by gr inding and a ir elutriat i ng
t he sma llest commerc i a l ly a va i l able f r ac t i on ( 112 mi crons) .
The re s i n samples , loaded with t he copper , were t hen
analyzed wi t h x- r ay fluores cenc e . Five ca l i bration curves
were ob t a i ned for t he five r esin s i zes sh owing t he amount
of copper versus the fluore sc ent Cu K oc. i ntensi t y . These
calibr ation curve s sh ow t hat t he r e l at ionship between the
radi at ion intensity a nd . t he copper c oncentrat ion is l i near
f or ea.ch size .
The r e l a tive effe c t of r e sin part ic le size on fluor
escent i nt ensity was shown gr aphi cal l y . The ef fe c t of
par t i cle size on x - r ay f luores cence wa s small f or part
icles gr eater t han 250 micron s a nd le s s than 60 micr ons .
A crit ica l region exis t ed , h owe ver , be t ween these t wo
size s where particle size had a s i gnif icant infl uence
on the x - ray intens i ty. The sma ll par t i c l e intensity was
much greater t han the l a rge part ic le i ntensity .

ACKNOWLEDGMENT
At t h is time , I should like to take the opportunity
t o extend gra titude t o my major professor , Dr . Vincent Rose ,
for i s adv i ce and generous ass istance . I am al so gra te
ful to t h e Agricultural Chemistry Department for the use
of its Atomic Ab sorption Spec t rophotometer . Thanks are
a lso expressed to Richard A. Romanell i f or h is va luable
time and aid in figure prepa r at ians .
To my wife , for her devotion a nd pat i ence i n typing
the manuscript , I would like to extend my sincerest ap
preciation .
I.
II.
III.
IV .
v. VI.
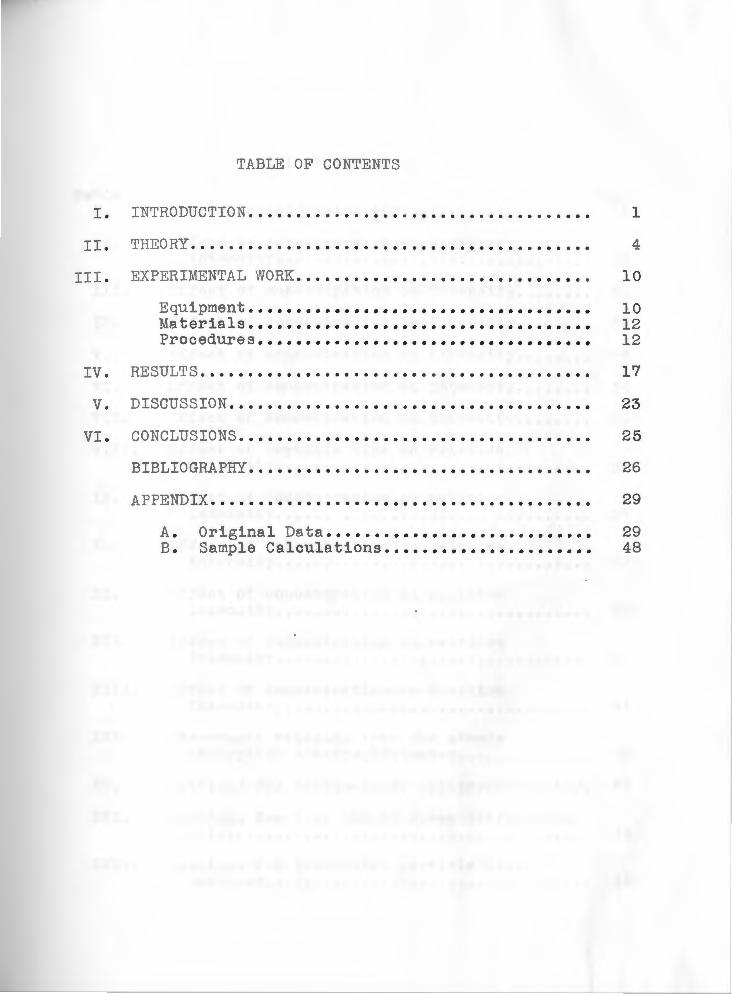
TABLE OF CONTENTS
I NTRODUCTION •.•••.•.•...•••• . ••.•..•
Tl- EO RY •.. .. .• . . . .• . . . . . . . . . . . . . . . . . . . . . . . . . . . . . . EXPERI MENTAL WORK. . . . . . . . . . . . . . . . . . . . . . . . . . . . . . .
Equ i pment . ..•.••••••••••••...••...••••. ... Ma t erials •• Pr oce dures •••
. . . . . . . . . . . . . . . . . . . . . . . . . . . . . . . . . . . . . . . . . RESULT S . .....••••.•.••...•...•. . ••.•..•.••• • .•.•
DI SCUSSI ON . .•.•.•.•••....•••...•...••.••••••.•••
CONCLUS I ONS • ••.•••••••••••••••••••••.•••••••••••
1
4
10
1 0 12 12
17
23
2 5
BIBLIOGRAPHY . . . . . . . . . . . • • . • • . • . • • . • • • . . • • . • • . . • . 26
APPENDIX ••.•••••••••• . . . . . . . . . . . . . . . . . . . . . . . . . . . A. B.
Orig ina l Da t a ••.•••• Samp l e Calculations .
. . . . . . . . . . . . . . . . . . . . . . . . . . . . . . . . . . 29
29 48

Table I .
LI ST OF TABLES
Page Properties of Chelex 100 •••.•••••••••••••••• 13
II . Effe c t of par ticle size on rela tive
III .
IV .
v. VI.
VII.
VIII .
intensity......... . ....................... 18
Effect of concentration on intensity •••.••••
Effe c t of c oncentr ation on intensity ••...•••
Effect of concentration on i ntensity .• . •••••
Effe c t of c onc entration on i ntensity . •.•••••
Ef f e c t of c oncentration on i ntensity ..•.••••
Effe c t of particle size on rela tive i ntensity ........ . ........................
31
32
33
34
3 5
36
IX. Effect of concentra tion on relative intensity.... . . . . . . . . . . . . . . . . . . . . . . . . . . . . . 37
X. Effect of concentra tion on re l at ive :h.ntensity.............. . .................. 38
XI . Ef fect of concentra tion on rela tive i ntensity ............... ·.................. 39
XI I . Effe c t of concentr a tion on relat ive i ntensity . . . . . . . . . . . . . . . . . . . . . . . . . . . . . . . . . 4 0
XIII . Effect of concentra tion on rela tive intensity .•.• . •••.•••••••••.•.•..••••••••• 41
XIV . Absorbance reading s from the atomic absorp tion s pectrophotometer • •••. • •••• . ••• 42
XV . Sett ing s for Perk i n - El mer s pe c trophotome ter . 43
XVI . Sett ing s for G. E . XRD- S5 x - ray diffr a ction unit . . . . . . . . . . . . . . . . . . . . . . . . . . . . . . . . . . . . . . 44
XVII . Settings for t he Rolle r part icle si ze ana lyzer ....... _.................... . ...... 45

XVII I . Pa rticle size distr i bution •••••••••••••••••• 46
LI ST OF F IGURES
Figure Page 1 . Shiel ding effec t from lar ge particles ......... 8
2 . Theoretica l relat ionsh i p between r e l a tive intensity a nd par t i cle si ze ................. 9
3 . Ion- ex change equ i pment ••••••••••••••••••..•••• 11
4 . Influence of t hree res i n mesh si zes and amount of Cu ab sorbed on relat ive x - ray flu orescence i n t ensity •••••••••••••••••••••• 19
5 . Effe c t of par t icle siz e on rela tive intensi t y . 20
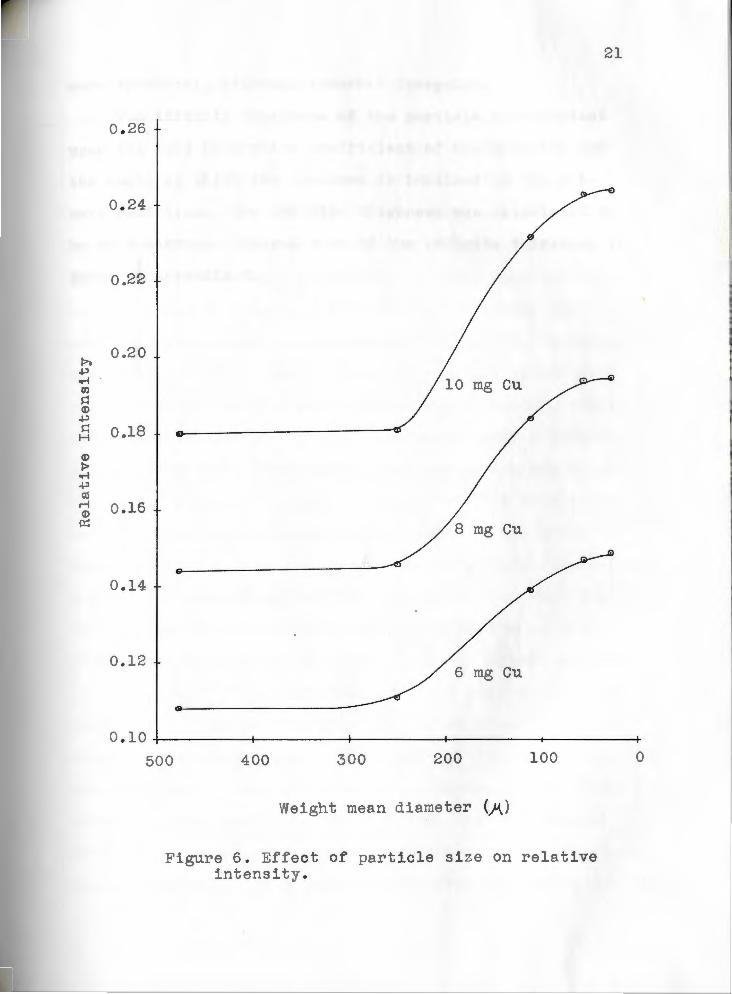
6 . Effec t of particle size on rela tive intensity . 21
7 . Dis t ribut i on curves f or t h e fi ve r esin size s .• 47

I NTRODUCTI ON
Accurate determination of copper in water is i mpor
t ant since copper is introduc ed into streams by corrosion
of cooling equipment in the process and power industries,
from dips and pick les used by the metal finishers , etc .
Since small amounts of copper have an adverse effect upon
living organisms , including fish and shellfish, a quick and
accura te method for determining t he amount of copper in
water is necessary (15) .
The usual technique for trace analysis of copper in
water cons ists of removing the copper from t he water with
ion- exchange ma terials, t hen eluting from the resin to
give a concentrated solution a nd ana lyz i ng by routine
chemica l methods . In recent wor k , filter paper loaded
with ion- exchange ma terial ha s been used to collec t metal
ions ( 2 ,5 , 12) . The ions are analyzed on the paper by x-ray
fluore scence . These papers require recycling of the solu
tion severa l times and have a limited capa c i ty . In order
to elimina te the problems in the paper me t h od , it is pro
posed t ha t the ions be collec ted directly on standard col
umns and a representa tive sample of t h e resin be analyzed
using x-ray fluorescence analysis . Previous x- r a y fluores
cence work with chemica l powders indica tes t hat part icle

2
size affects the analytical result s (3 , 4 , 8) . This inve s
tigation shows the effect of resin particle size on the
uptake and analysis of copper from water using x- ray fluo
rescence .
The effect of part ic le size on x - r ay fluorescence in
tensity for various minerals ha s long been recogni zed .
Fonda (7) exposed particu l a te target material of various
sizes to h i gh energy electrons and observed the particle
size effect on the re sult i ng fluorescent emission i ntensity .
Bernstein ( 4 ) has noted tha t the particle size of a
material may effec t not only its own intensity but also the
i ntensity of another component in the mi xture . He ob served
t hat if the particle size of two components were reduced
uniformly , the intens i ty of one would decrease while the
i ntensity of the other would increase .
Other investiga tors ave observed the e ffe c t of pa r
ticle size on x - r ay fluore scent intensity for various
elements and minerals . Gunn (8) noted t . t both p rticle
size and surface irregularities affect x - r ay fluorescence .
He i ndica t ed t ha t a smooth surfa ce and a smal l particle
size had a tendency to increase the x- ray i~t ensity .
Bernstein ( 3 ), i n an earl ier publica tion , observed tha t
particle size effects could seriously reduce both preci
sion and ac cur a cy of ana lytical r esults . Thus t here is
a need to investigate the effect of ion- exchange resin
on x-ray fluorescence s o tha t a proper sized resin can be
3
selected .
Five ranges of particle size were investiga ted . Three
sizes were commercia lly a va ilable , 50-100, 100- 200 , and
200- 400 mesh resin , whi le t wo sm ller size r a nges were ob
tained by grinding and then air elutriating t e 200- 400
mesh resin . This study is concerned with one particul r
resin , Dowex A- 1. Since the sodium form of Dowex A-1 ha s
a large affinity for cu+ + ion (Cu/Na ))lOO), it is commonly
used to preferentially remove copper fr om solutions .
THEORY
The pertinent princi pl es and t heory of x - ray fluo
re scence and t he effect of particle s i ze on t e fluores
cence can be briefly described a s follows . A fast moving
electron , upon i mpact with ma tter, will l ose i t s energy
and produce e lectromagnetic r adiation which can be contin
uous (bremss trahlung) and/or char a cteristic radiation
(definite wavelength ) . Bremsstrahlung is caused by the
decelera tion of t e electron which lose s anyw ere fr om
zero t o a ll of its kinetic energy in t he form of contin
uous (white ) r adia tion . Characterist i c r ad i a t ion i s caused
by the vacanc ies in t he exc ited a t oms which are f i lled by
electrons from t he outer shells . Upon "fall ing back" t o
the ground state , the atoms emit d iscrete amounts of energy
in t he form of electromagnetic radia tion of a definite
wavelength .
In copper fluorescence analys i s , K electrons are
expelled by h i gh energy tungst en x - r ays . Copper emits
characteri st ic K r ad i a t ion of which Cu K oc. (1 . 54 A) is t he
stronges t and , therefore, most usefully appl i ed component .
I n order to distinguish t he Cu Koc: r di a ti on from
r ad i at i on fr om t _e x - ray tube and t e continuous rad iation
from t h e sample , an x- r ay diffractometer i s used . Elec -

5
tromagnetic r adi ation will be diffracted at crysta llog
r aphic planes of n ana lyzing crys tal at a p rticule r
angle if t e wavelength of the r ad i tion is in the s me
order of ma gnitude as t he interplanar s pacing of the crys
t al . Diffraction f ollows Bragg's law :
n }... = 2d Sine e
where n is the order of reflection, ~ is t he wavelength
( - 8 of the r ad i at ion i n Angs t r oms 10 cm) , d is the inter-
planar spacing of the crysta l i n Angstroms , a nd e is the
angle of d iffraction . In this particular case , Li F
(d = 2 . 01 A0) was used as the ana lyz ing crysta l .
In x - ray f luores c enc e analys is , it has been f ound
that t h e intens i ty of a constituent in a sample , within
limits , is d irectly proportional to its concentration in
t he sample . J . W. Meyer (11) expre s s ed t h is dependency
with the foll owing rela tionship: KC
IE~ E 2= Ci (A/p )i
where I E i s the r ad i at ion i ntensity a nd CE is the concen-
trat ion of t he constituent i n t he sample ,
i s the mass ab s or ption coefficient of the entire sample
and K is a proportiona lity constant which i ncludes such
f ac t ors a s tube voltage , amperage , t arget element charac -
t eristics , and fluorescent yield of t he element .
For t h e standard sample , the r e l ationship is expressed
as follows :

6
Is = K Cs ~ C1 (fa_ff ) s
•
s i nce t h e concentration of copper i n the st nd r d sample
and the ma ss absorption coefficient a re cons tant, the rela -
tionship can be written as Is = K x K' where K1= Cs • L Ci (A/ p ) s
For t h e r e sin sample , owever , the ma ss absorption coef-
fici ent is not constant but is a weighted sum of the absorp-
tion coefficients of each component i . e .
where c1 is the concentration of each component in t he
sample . For a sample loaded with 10 mg Cu, the concentra -
tion of t he resin is approxima tely 400 times the concentra-
t ion of the copper, while t he ab sorpt ion coefficient of the
copper is approxim tely 10 times grea ter t han the absorp-
tion coefficient of t he resin . Thus it is safe to a ssume
t hat the absorption coefficient for t e s ampl e is constant
for small copper concentrat ions . The relat ionship between
the int ensity and
' ' I E = K x CE x K
one obta i ns I E ,-;-
t e sample concentration now bec ome s
By combining these two r e l a tions ips ,
K C K ' ' ' E or IE = K' ' Is CE • Th is = K K1
expres s ion shows that there is a linea r relationship be -
t ween t he intensity a nd concentration of copper i n t he resin
sample .
Previous i nvestigators (3 , 8) have ob served particle
size effects on x-ray intensity . They have a ll rea ched

7
the same general conclusion tha t intensity of t he fluores
cence will increase with decreasing particle size .
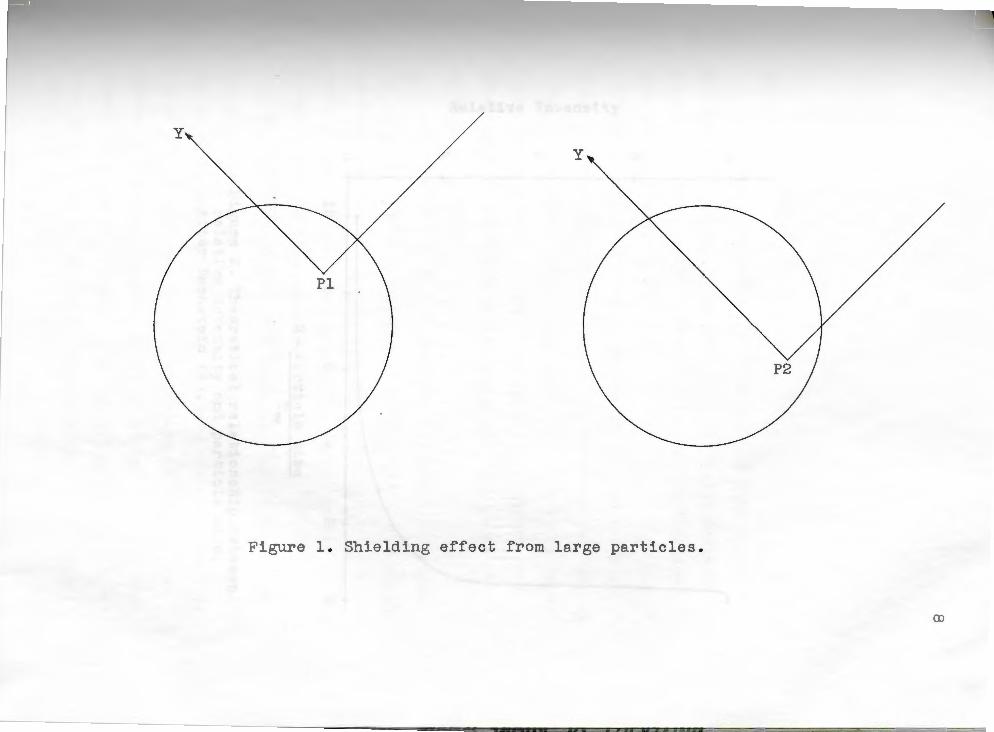
Gunn (8) expl a i ned t is de pendence by observing the
poss i ble sh ielding effects that a large particle could
possess. This conce pt i s sh own in Figure 1 . If one con
siders the fluorescent r ad i a tion emitted only in the Y
direction , for a large particle , it can be seen that it
is possible for t h e fluorescent radiation genera ted at
P2 to be l argely self-absorbed i n t he Y d irection before
arriving at the su rfa ce of t h e particle . It can be seen
t at the intensity from P2 will b e somewha t less t an tha t
emerging from Pl . Because of t he loss in intensity due to
l arge pa rticle sh ield ing , it is expected , therefore, that
a sample of large particles will emit a lower fluorescent
intensity than a sample of small particles .
Bernste i n ( 4 ) t h ought t at a higher intensity was
due to a decrease i n t he percent voids as the particle
size decreased. He found that , for particle thickness
larger t han t h e effective depth of x - ray penetration
(infinite t hickness, T_ ), the intensity of the x - ray
fluorescence decreased sharply a s particle size increased .
In addition , he found t ha t the effec t of particle size on
intensity d i mi nishes s t e particle size be comes sma ller
t han infin ite thickness. Both of these effects are il
l ustrated in Fi gure 2 .
y
y
Pl
P2
Fi gure 1 . Shielding effect from l ar ge par t icles .
CD

4
3 :» ..µ •rl Cl)
i::: (1)
..µ i:::
H 2 (1)
:> •rl ..µ al .-l (1)
~ 1
0 10 8 6 4
N = article size Too
2
Figure 2 . Theoretical rela tionship between relative intensity and part ic le size . After Bernstein (4) .
9
0
EXPER I MENTAL WORK
Equipment
A Per k in- Elmer Model 303 At omic Absorption Spectr o
ph otometer was used i n the analysis of the ion- exch a nge
column e ffluent. A t hree slot burne r h e ad wa s util i zed
with an a i r - a c ety lene fl a me .
The fluorescen t x - ray a na l y sis of t e i on-ex chang e
re s i n was conduc t ed with a Gene ral El e c tric Company XRD- S 5
x - r ay d iffraction u nit. A Li F analyzing cry stal was used
i n conjunction wi t h a f l ow proportional coun t e r f or the
detection . A 90% methane , 10% a r g on gas mi xture was used
i n t h e f low counter.
A Rol ler partic le size a na l y zer ( Ame ric an Instrument
Co. ser . no. 15309) wa s used to a ir elutriate resin which
had been pr eviously ground i n a morta r nd p e stle . The
sett i ng s u s ed to collec t the two s i z e fractions are li s t ed
i n Table XVII in Ap pend i x A.
T e i on - exc ang e columns were made f r om 6 mm a nd 2 5 mm
diamete r g lass tubing . A g l ass wool p lug was used t o retain
t h e r es in i n the column. The flow rate was ma i n tained by
use of a cons tant h ead ta n~ . The columns are sh own in
Figure 3 . Four ml s amples of the 50-1 00 me sh were pla ced
i nto 6 mm d i ameter co lumns . The oth er s i z e s were p l a ced
i nto 25 mm d i a me t e r columns . The capacity of the Dowex

6 mm 25 mm
12 11
I on- exchange column
__J
Fiber gl a ss plug
_J
Figure 3 . Ion- exchange equipment .
11

A- 1 resin was 0 . 33 mill i moles of cu++per ml of resin bed .
This is e quivalent to 21 mg of cu++per ml of resin bed .
According to Incz~dy (10) , the capacity of t he column
should be a t least four times greater than theoretically
required . The maximum amount of copper absorbed on the
resin in this study was 10 mg , well within the limit for
the four ml resin samples t hat were used .
Ma terials
12
Analytical grade Dowex A- 1 resin in the sodium form
was used to retain the copper . Three d ifferent sized
re sins were used as suppl ied by Bio- Rad Laboratories :
50- 100 , 100- 200 , and 200- 400 mesh . The properties of the
supplied re sin are given i n Table I . The 200- 400 mesh
r esin was further ground and sized to obtain two sma ller
size fractions .
Allied Chemical reagent grade cupric ch loride was
used to make stock copper solution . The standard used in
t he x - ray anal ysis was a. 50 percent mi xture by we i ght of
t he reagent grade cuc12 and reagent grade KBr.
Procedures
The 1000 ppm copper stock solution was made by
dissolving 2 . 11 gr ams CuC12 i n one liter of deionized wa
ter. Fresh solutions of the desired concentration , rang
i ng from 2 to 10 ppm of copper , were made from the stock
solution before each run .
The solution was eluted through resin at a flow rate

Mesh Si 7. e Shape
50- 100 Spherica l
100-200 Granul ar
200- 400 Granul ar
TABLE I
PROPERTI ES OF CHELEX 100
Active Group
0 - CH2- N- CH2COO ' CH2COO
Order of Selectivi t y : Monovalent ions - - H) Li)Na >K
Re sin Type
Weakl y acid
ca tion che l at -
i ng resin
Diva l ent ion s cu> Pb ) FEI3) Ai 3>c r 3 ) Ni ) Zn) Ag1) Co) Cd ) Fe ) Mn) Ba) Ca) Na+l
Maximum % I mpurities : Fe - - 0 . 0001%
cu --o . 0000870
Ni --0 . 0000©15 ;0
Capacity
0 . 33 mmole s
per ml of
Cu( NH4 ).
I-' Vl

14
of 35 ml / h r cm2 for t he 6 mm columns and a t 2 ml/hr cm2
for t he 25 mm columns. After t he copper solu tions were
passed through t h e resin , t h e effluents were ana l yzed with
t he a tomic absorption spectrophotome t er to de t er mine whether
all t he copper was removed by the ion-exchange resin .
The smallest size fraction (weight mean diameter =27.A)
could not be run in column operation because of t he l a r ge
pre ssure drop across t he bed . A batch procedure , described
by I nc zedy (1 0 ), wa s used instead . The resin was p l a ced
in a b eaker with t h e copper solution and stirred intermi t
tantly f or about one hour. The solution was t h en filtered
to collect the resin . The wa t er was tested for presence
of copper, a nd t he r e sin wa s ana lyzed on t e x - r ay unit.
In order to come to any conclusions about t he particle
size effec t on x-ray intensity, t h e actual size distribu
t i on for ea ch mesh r ange had to be known. From t his d is
tribution, a mean va lue for t h e particle could be calcu
lated . For ea ch mesh s~ze , a pproximately 400 particles
were count ed and mea sured a nd a weight mean diameter was
deter mi ned , using procedure s describ ed by Herdan (9 ) . The
distributions, plotted on log probab ility pa per , a re shown
in Fi gure 7 in Append ix A.
To ob t ain re s in par ticle s smal ler t han 200- 400 mesh
size , the 200-400 mesh resin wa s dried and t hen ground in
a mortar and pestle. After dry i ng i n an oven a t 100° C
for one h our , t he r es in wa s sieved t hrough a 200 mesh

15
screen prior to elutriation . A port ion of t he ground sam-
ple was placed in the sample holder of t he a ir elutriator .
By knowing t he dens ity and t he particle size of t he re sin
desired , a ppropriat e a ir f l ow rates and cy linder selection
can be made by con sulting the oper ator ' s manual (1) . The
weight mean diameters of the two size fractions were 56 and
27 microns .
Appropriate se ttings for t he s pectrophotometer were
obtained f rom the Per k i n- El mer Model 303 instruction man
ual (13 ) . A wavelength setting of 3247 . 5 .A wa s used for
copper . The va lue s for the various settings are given in
Table XV of t he a ppendix . The s pectrophotometer wa s cal
i br a ted by obtaining absorba nce readings for a freshly
pr epared 1 ppm copper solution and for deionized water .
The copper extracted by the resin column could t hen be
calcula ted by knowing t he amount rema i n i ng in the effluent .
In pr eparation for analys is with the x- ray s pectro
me ter , t he moist resin ~amples were placed in the s ample
holder and put into the sample chamber be low the wi ndow of
t he x - ray tube . The sample was analyzed using an x-ray
t ungsten tube with a tube potent i al of 50 kvp and a tube
current of 35 ma . The t akeoff angle on the s pectrome ter
was o0 • The goniometer was se t at 45 . 03° so t hat the
first order Cu K ~ rad iation could be detec ted by the pro
portional counter . A complete list of t he settings for the
X- ray s pectrome ter is given i n Table XVI of t h e a ppend i x .
16
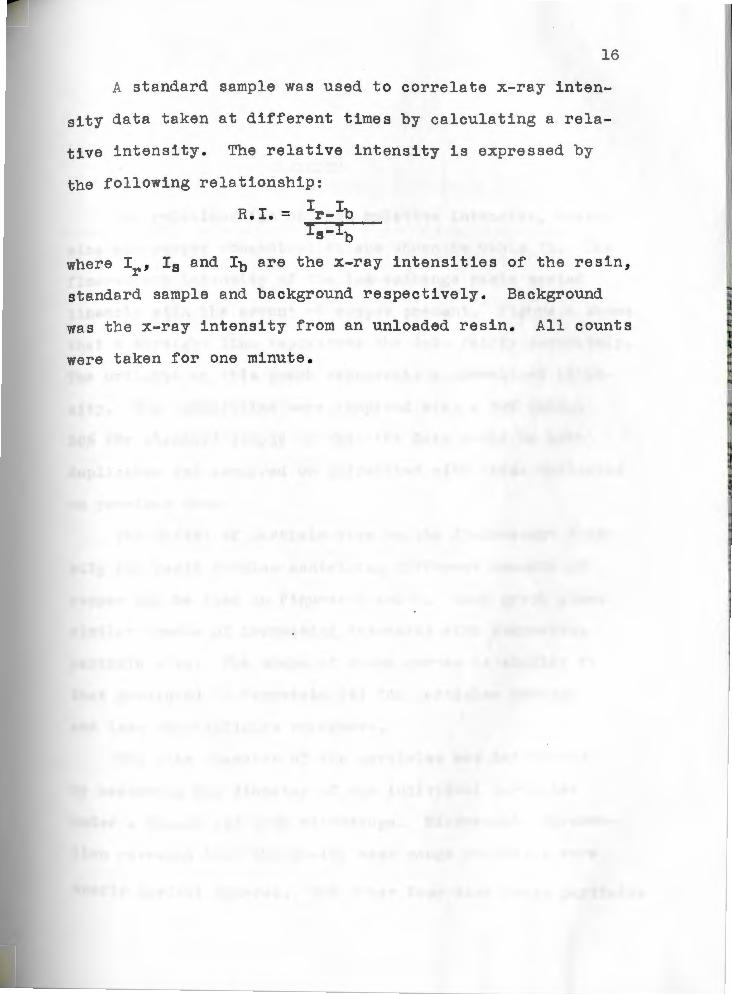
A standar d sample wa s used t o correlate x-ray inten-
sity data taken at different times by calculating a rela
tive intensity . The relative i ntens ity is expressed by
t he following rela tionship:
R. I. = Ir- Ib I s-Ib
where Ir ' Is and Ib are the x-ray i ntens ities of the resin,
standard sample and background respectively . Background
was the x - ray i ntensity from an unloaded resin . All counts
were taken for one minute .

RESULTS
The relations ips betwe en rela tive intensity , resin
size and copper concentra tion are s own in Table II . The
fluorescent int ensity of t h e i on- exchange resin varied
linearly with the amount of copper pre sent . Fi gure 4 shows
that a straight line represents t h e da ta fairly a ccura tely .
The ord inate on t h is gr aph represents a norma lized inten
sity . The i ntensities were compared with a 50% CuCl2-
50% KBr s t andard sample so that the data could be both
duplica ted and compared or correla ted with those collected
on previous runs .
Th e effect of particle s i ze on t he fluorescent inten
sity for resin samples conta ining different amounts of
copper ca n be seen in Fi gures 5 a nd 6 . Each graph sh ows
similar trends of incre?sing intensity with decreasing
particle size . The shape of t hese curves is similar to
that predicted by Bernste in ( 4) f or particles gr ea ter
and les s than i nf i nite t h ickness .
The mean diameter of t he particles was determined
by measuring t h e d iameter of t h e i ndividual pa r t icle s
under a Bausch and Lomb micr oscope . Microscopic observa
tion r evealed tha t t h e 50-100 mesh range partic les were
nearly perfect s pheres . The other four size r e sin particles

18
TABLE II
EFFECT OF PARTICLE S I ZE ON RELAT IVE INTENSITY-:~
Resin (weight mean d i ame t er i n microns)
cu (mg ) ( 478A) ( 250A ) ( 112)() ( 56,u..) ( 27){ ) 50- 100 100- 200 200-400
Me sh Mesh Mesh
10 0 . 180 0 . 18 1 0 . 23 2 0 . 243 0 . 244
8 0 . 1 44 0 . 146 0 . 18 4 0 . 194 0 . 195
6 0 . 108 0 . 1 11 0 . 139 0 . 147 0 . 148
4 0 . 072 0 . 076 0 . 093 0 . 098 0 . 098
2 o. 035 0 . 040 0 . 047 0 . 049 0 . 049
p:~·
Relative Intensity = Intensity- Ba ckgr ound St andard- Background

J>., .µ •rl en s:: <D .µ s::
H
<D :>
•rl .µ al rl <D 0::
H
0 . 2
0 . 1
0 . 1
0 . 05
I =a +bx, where a (Y- i nt er cept)=O in all case s .
Slope b
D- 0 . 0180 Q- o. 0181 A- 0 . 0221 ·- o. 0240 ·- 0 . 0240
Diam. (A )
4 78 250 1 12
56 27
~'l~ ~ :::;..-- -
,,&~~------,~~ ......
o.o ~ :..--1 2 3 4 5 6 7 8 9
Copper (mg)
Fi gure 4 . Inf l uence of five resin me sh sizes and amount of Cu absorbed on relative x-ray fluorescence intensity .
10
I-' (()

p., .µ •r-l Ul s:: Q) .µ s:: H
Q)
:> •r-l .µ (\j
r-i Q)
ix:
20
0 . 10
0 . 09
0 . 08
4 mg Cu
0 . 07
0 . 06
0 . 05
0 . 04 2 mg Cu
0 . 03 +-~~~~-+-~~~~-+-~~~~--+~~~~~-+--~~~-----4
500 400 300 200 100
Weight mean diame ter (A )
F i gure 5 . Effect of particle size on rela tive i n tensity .
0
p., ..µ •rl en i::: Q)
..µ i::: H
Q)
:> •rl .µ oj r-l Q) p:;
0 . 26
0 . 24
0.22
0 .2 0
10 mg Cu
0.18
0 .16 8 mg Cu
0 . 14
0 . 12 6 mg Cu
500 400 300 2 00 100
We i ght mean diame ter (A )
F i gure 6 . Effect of part icle size on rela tive i ntens ity .
21
0
22
were s pherical , a lth ough somewh a t irregular .
The infinite t h icknes s of the pa rtic l e is dependent
u pon t h e ma ss absorption coefficient of t e ma teria l nd
t he angle a t which t h e s pecimen is incl ined to the pri
mary r adiation . The infinite thickness was calcu l a ted to
be 30 . 9 microns . Calcula tion of t h e infinite thickness is
shown in Appendix B.

DI SCUSSI ON
The diameter of the columns t a t were firs t used in
t is investiga tion was 6 mm . This size proved satisfac
tory for t h e large size resin (50- 100 mesh) , but the pres
sure drop across the resin bed for t he other four sizes
was too great to al low an appreci ble flow rate . Reducing
the amount of resin , a nd thereby lowering the bed height ,
was limited by the size of the x - r ay sample h older , since
t he area and depth of t he resin had to be uniform for all
samples . The only a lternative for reducing the bed height
was to use a larger d i ameter column. For the next t hree
smaller resin sizes, 25 mm d i ame ter columns were used .
Th is r educed t h e pressure drop a nd increa sed the flow r at e .
A ba tch procedure de scribed by Inczedy (10) was used for
the sma l l est resin size . since t h e pressure drop in the
co lumn wa s too gr ea t to permit flow of t h e copper solution.
A tendency for channelling occurred with the smaller
resin sizes . Channelling not only caused a l ess t an 100%
uptake of the copper, but a sma ll part of the resin sample
was also lost in the effluent . This phenome non wa s easily
noticed by both the excessive flow rate , and the colored
path t ha t the exchanged copper ion would l eave . When chan
nelling did occur , that particular run was discarded .

24
Early in the inve s t i ga tion , the resin samples were
dried before x - ray a na l ys is so t ha t t he absorption of
r ad i a t ion due to the water would not be a f actor . This
method wa s aband oned when it was d iscovered that t he loss
of water created a mar ked change i n t he resin volume . This
shrinkage of the particles effectively concentrated the
copper which in turn caused a h i gher t han expected fluo
rescent intensity .
Since the res i n s ampl es could not be ana l yzed in the
dry state, the prob l em of kee ping the amount of water in
each s ample essentially constant had t o be s olved . The
prob lem wa s solved by keepi ng the resin s ample i n filter
paper whi ch was in contact with wat e r .
CONCLUSIONS
For a given resin s ize , t he rela tionship between the
concentration of the copper in the resin and the x-ray
intensity was linear . This relationship agrees with Meyer's
observations (11) .
As the resin part icle size decrea sed, the x- r ay in
tensity emitted by the copper on t h e resin i ncreased .
Figures 5 and 6 sh ow the effect of particle size on x- ray
i ntensity . The gener al shape of these curves corresponds
with that predicted by Bernstein (4) for a minor consti
tuent in a powder sample (Figure 2) .

BIBLIOGRAPHY

1.
2 .
3 .
4 .
5.
6 .
7.
8 .
9 .
10.
11.
12.
13 .
27
American Instrument Company Roller Particle Size Analyzer Instruc t ion Manual . A manual prepa r ed by the American Instrument Company . Si lver Spring, Maryland .
Bendre, S., "Determinat ion of Trace mounts of Tin , Uranium and Zirconium in Wa ter" Unpub lished Ma ster 's the sis, University of Rhode Island, Kingston, R. I ., 1969 .
Bernstein , F ., Advances in X- Ray Analysis , Vol . 5 , University of Denver , Plenum Press, New York , 1961 , pp . 486 - 499 .
Bernste i n , F., Advances in X- Ray Analys is, Vol . 6 1 University of Denver , Plenum Pres s , New York , 1962 , pp. 436- 446 .
Campbe ll, W. J ., Spano, E. F. and Green , T. E., "Micro and Trace Analysis by a Combination of Ion Exchange Resin-Loaded Papers and X- Ray Spectography 11 ,
Anal . Chem., 33 : 787-996 (1966).
Cullity , B. D., Elements of X- Ray Di ffraction, Addison- esley Publishing Co., Inc., Reading , Mass ., 1967, pp . 402-422 .
Fonda , G. R., J. Am. Chem. Soc., 55: 123 , (1933).
Gunn , E. L., Advances i n X- Ray Analys isN Vol . 4 , University of Denver , Plenum Press, ew York, 1960, pp . 382- 400.
Hardan , G., Small Particle Statis tics , Elsevier Publishing Company, New York , N.Y., 1953 .
Inczedy, J., Analytical Application of I on Exchangers, Pergammon Pr ess , Budapest , 1966 , pp . 131-156.
Meyer, J . w., Anal . Chem., 33: 692 , (1961) .
Ndam , s . N., "Tra ce Meta l Ana lysis Using Ion-Exchange Re sin- Loaded Papers a nd X- Ray Fluore scence" Unpublished Mas ter ' s t hesis , University of Rhode Island , King ston, R. I ., 1969 .
Perkin-El mer Atomic Absorption Spe c troph otometer I n struction Manua l . A manual prepared by the Perkin-El mer Co. Norwa l k , Conn ., 1962 .

14 .
15 .
28
Whea ton, R. M., a nd Seamster, A. H., 11A Basic Reference on Ion Exchange ", Dow Chemical Company, 1966 .
Zeitoun , M. A., and Mcilhenny, "Chemistry of Copper in Effluents from Desalination Plants" , Dow Chemical Company, 1969 .

APPENDIX A
ORI GI NAL DATA

30
Table s I I I through VII g ive t e data obtained from
t he x - ray s pe c trometer. Background wa s obtained by count
i ng t e resin i n its sodium form .
Tab le XVII I give s the particle distribution for the
five resin sizes . Fi gure 7 sh ows t he istri b tion on
log probi lity paper .
The absor bance readings fr om the a tomic absorption
spectrophotometer can be found in Table XI V while Tabl e
XV gives t he settings used in the aperation of the AAS .
The sett ings used on t e x - ray unit can be found i n
Table XVI .
31
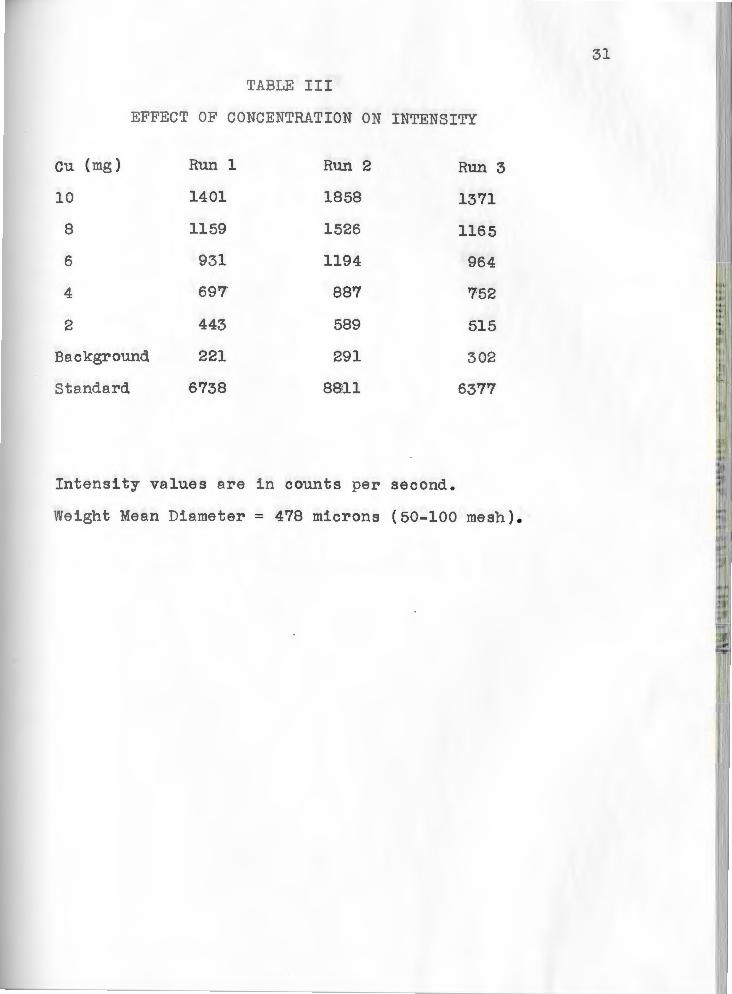
TABLE III
EFFECT OF CONCENTRATION ON INTENSITY
cu (mg ) Run 1 Run 2 Run 3
10 1401 1858 13'71
8 1159 1526 1165
6 931 1194 964
4 697' 887 752
2 443 589 515
Background 221 291 302
Standard 6738 88311 6377
I ntens ity va lues a re i n counts per second .
Weight Mean Diame ter= 4'78 microns (50-100 mesh ) .

32
TABLE IV
EFFECT OF CONCENTRATI ON ON I NTENS I TY
c u ( mg ) Run 1 Run 2 Run 3
10 2047 2 029 1591
8 1730 1737 1341
6 1439 14 04 1099
4 1 112 1104 857
2 804 804 577
Background 451 496 251
Standard 9270 8828 78Ql
Intensity values a re in counts per second .
reight Mean Di ameter = 250 microns (100- 200 mesh) .

33
TABLE V
EFFECT OF CONCENTRATION ON I NTENSITY
cu (mg ) Run 1 Run 2 Ru n 3
10 2370 2445 2332
8 1991 1992 1979
6 1628 1617 1584
4 1240 1216 1213
2 852 832 836
Background 472 457 397
Standard 8726 8987 8812
Intensity values a re in counts per second.
We i ght Mean Di ameter = 112 micr ons ( 200- 400 mesh) .
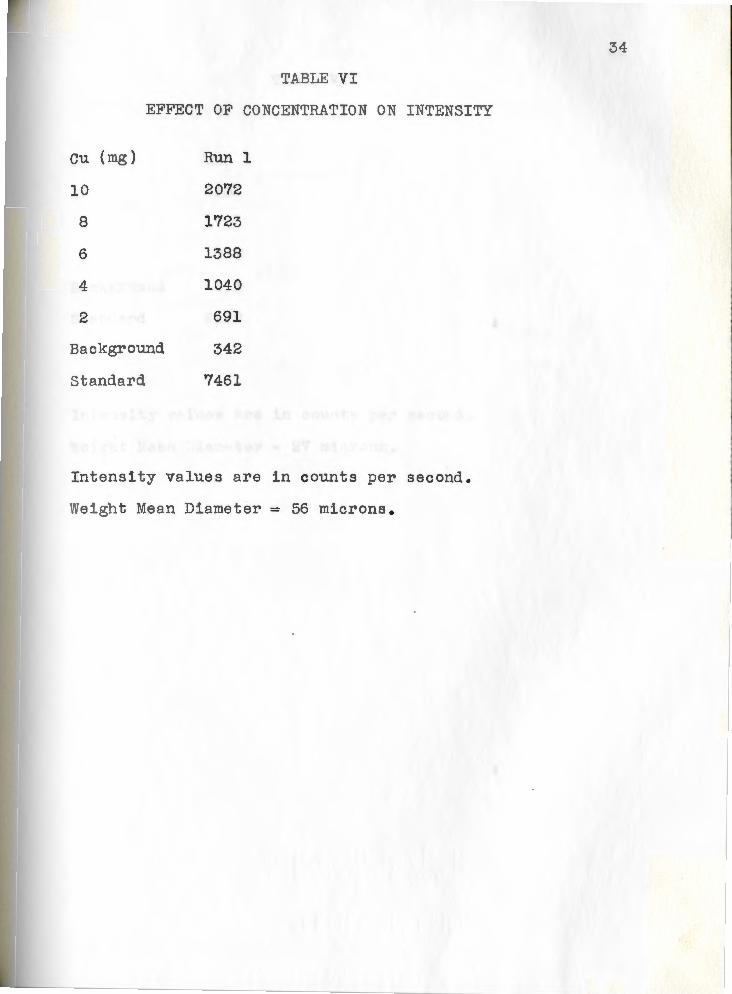
TABLE VI
EFFECT OF CONCENTRATION ON I NTENSITY
cu (mg ) Run 1
10 2072
8 1723
6 1388
4 104 0
2 691
Background 342
St andard 7461
I ntens i ty va lues a re in counts per second .
Weight ean Di ameter = 56 microns .
34
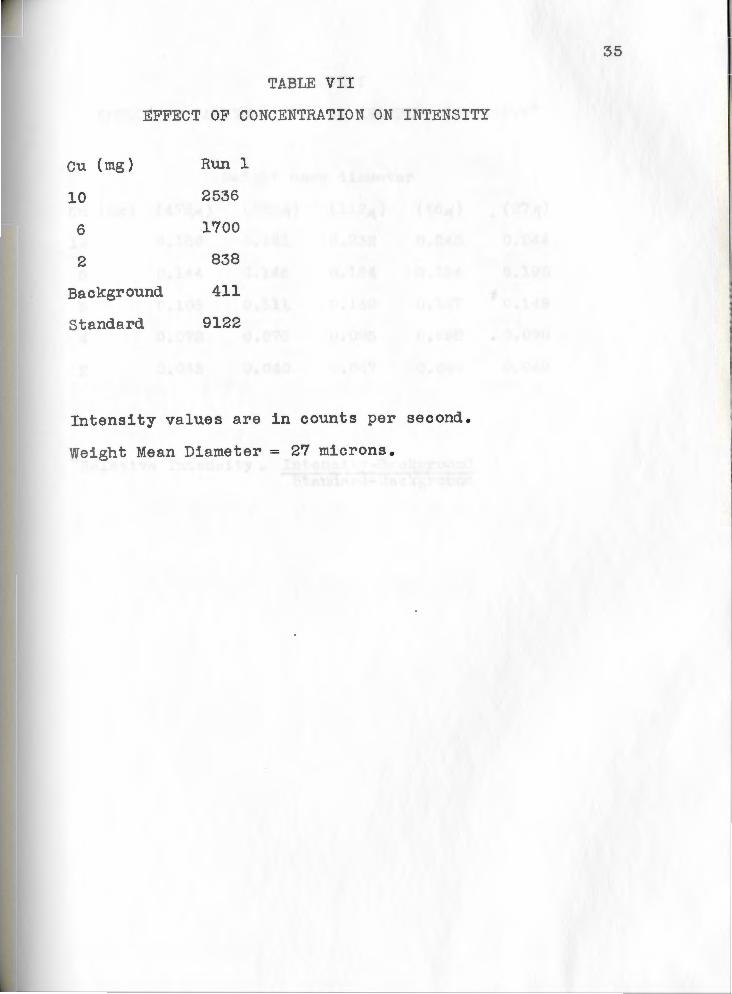
TABLE VII
EFFECT OF CONCENTRATI ON ON I NTE SI TY
cu (mg ) Run 1
10 2536
6 1'700
2 838
Background 411
St andard 9122
Intensity value s are in counts per second .
Weight Me an Diameter = 2'7 microns .
35
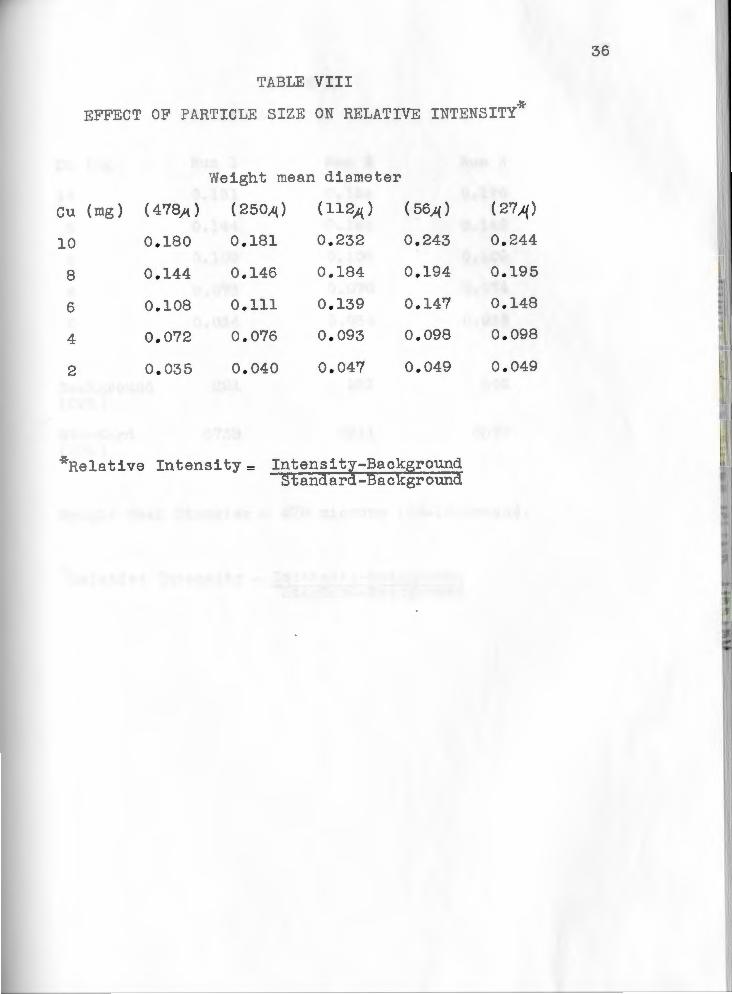
TABLE VIII
EFFECT OF PARTICLE S I ZE ON RELAT I VE INTE S I TY-::-
Weight mean diameter
cu (mg ) ( 478;\) ( 250){ ) ( 112){ ) ( 56)1 )
10 0 . 18 0 0 . 181 0 . 232 0 . 243
8 0 . 144 0 .146 0 . 184 0 . 194
6 0 . 108 0 . 111 0 . 139 0 . 147
4 0 . 07 2 0 . 076 0 . 093 0 . 098
2 0 . 035 0 . 040 0 . 047 0 . 049
-:~Relative Intens ity = Intens i ty- Ba ckground St andard- Background
( 27 ){ )
0 . 244
0 . 195
0 . 148
0 . 098
0 . 049
36

EFFECT
cu (mg )
10
8
6
4
2
Background (CPS )
St andard (CPS )
OF
TABLE IX
CONCENTRATI ON ON RELAT IVE INTENSITY:~
Run 1 Run 2 Run 3
0 . 181 0 . 184 0 . 176
0 . 144 0 . 145 0 . 142
0 . 109 0 . 106 0 .109
0 . 073 O. OlfQ. 0 . 074
0 . 034 0 . 035 0 . 035
221 291 3 02
6738 8811 63771
Weight Mean Di ameter = 478 microns ( 50-1 00 mesh ).
*Relat ive Intens i ty = Intensity- Backgr ound St andard- Backgr ound
3 7

TABLE X
EFFECT OF CONCENTRATION ON RELAT I VE INTENSITY-l~
cu (mg )
10
8
6
4
2
Background (CPS )
Standard (CPS )
Run 1
0 . 181
0 . 145
0 . 112
0 . 075
0 . 040
451
927'0
Run 2 Run 3
0 . 184 0.177
0 . 149 0 . 144
0 . 109 0 . 112
0 . 073 0 . 080
0 . 037 0 . 043
496
8828 7821
Weight Mean Diameter = 250 microns (100- 200 mesh) .
-:~Re lative Intensity= Intensity- Background St andard- Background
38

EFFECT OF
cu (mg )
10
8
6
4
2
Background (C PS )
St andard (C PS )
TABLE XI
CONCENTRATI O ON RELAT IVE INTENSITY~~
Run 1 Run 2 Run 3
0 . 230 0 . 233 0 . 230
0 . 184 0 . 180 0 .188
0 . 140 0 . 136 0.141
0 . 093 o. oag 0 . 09'7
0 . 046 0.044 0 . 051
472 4 57· 39F/!
8726 8987 8812
Weight Mean Diameter = 112 microns (200- 400 mesh) .
~~elative Intensity = Intensity- Background Standard-Ba ckground
39
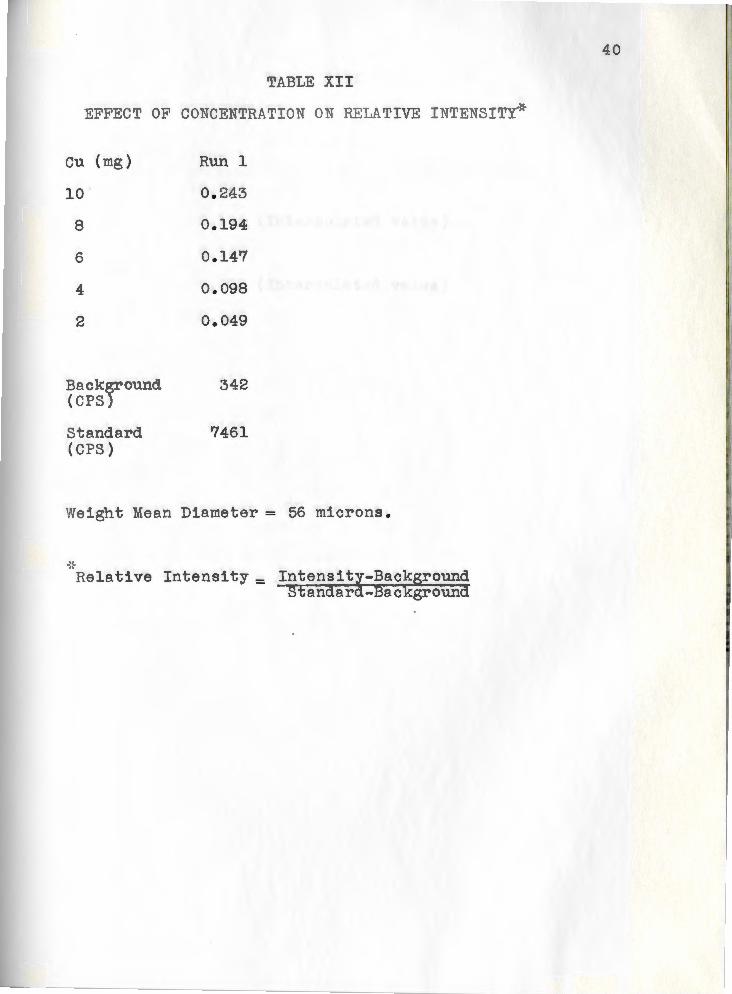
TABLE XI I
EF FECT OF CONCENTRATI O ON RELATIVE I TENSITY-:~
cu ( mg ) Run 1
10 0 . 243
8 0.194
6 0 . 147
4 0 . 098
2 0 . 049
Background 342 ( CPS )
Standard 7461 ( CPS )
Weight Me an Diameter = 56 micron s .
Relat ive Intensity= Intensita- Backgr ound Standar - Ba ckground
40
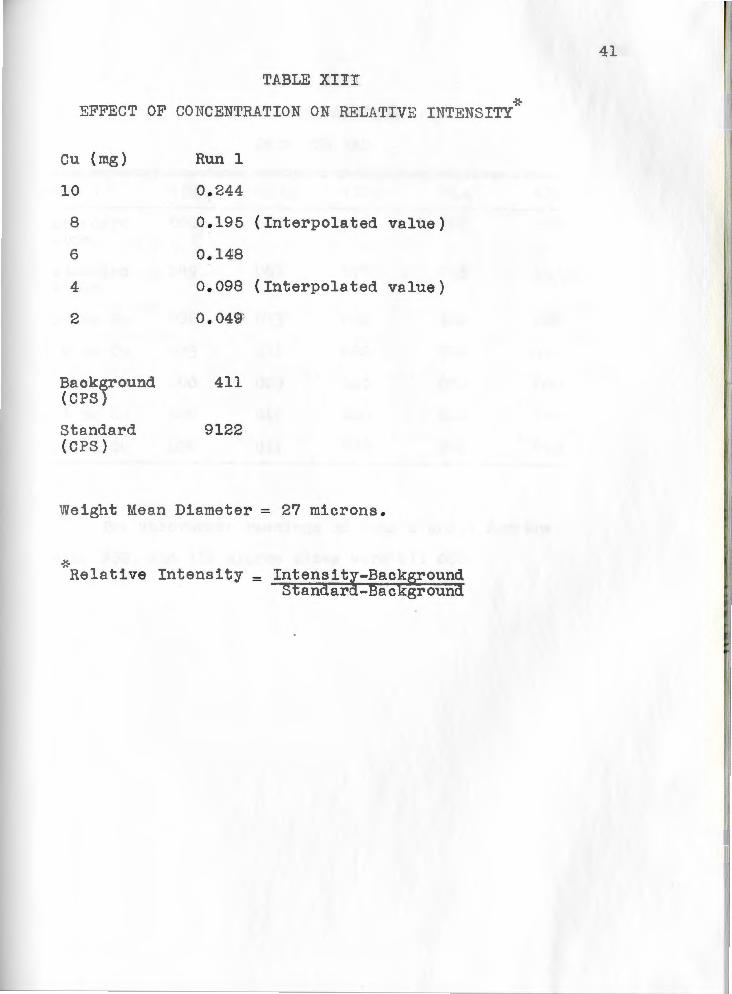
TABLE XIIY ~~~
EFFECT OF CO NCENTRATION ON RELATIVE I NTENSITY
cu (mg) Run 1
10 0 . 244
8 0 . 195 (Inter p olated value)
6 0 . 148
4 0 . 098 (Inte r p ola ted value)
2 o. 049'
Ba ckground 411 (C PS )
Stand a rd 9122 (C PS )
We i ght Mean Diameter = 27 micr on s •
.. ;, Re l a tive I ntensity = I ntensitK-Background
St a ndar - Background
41
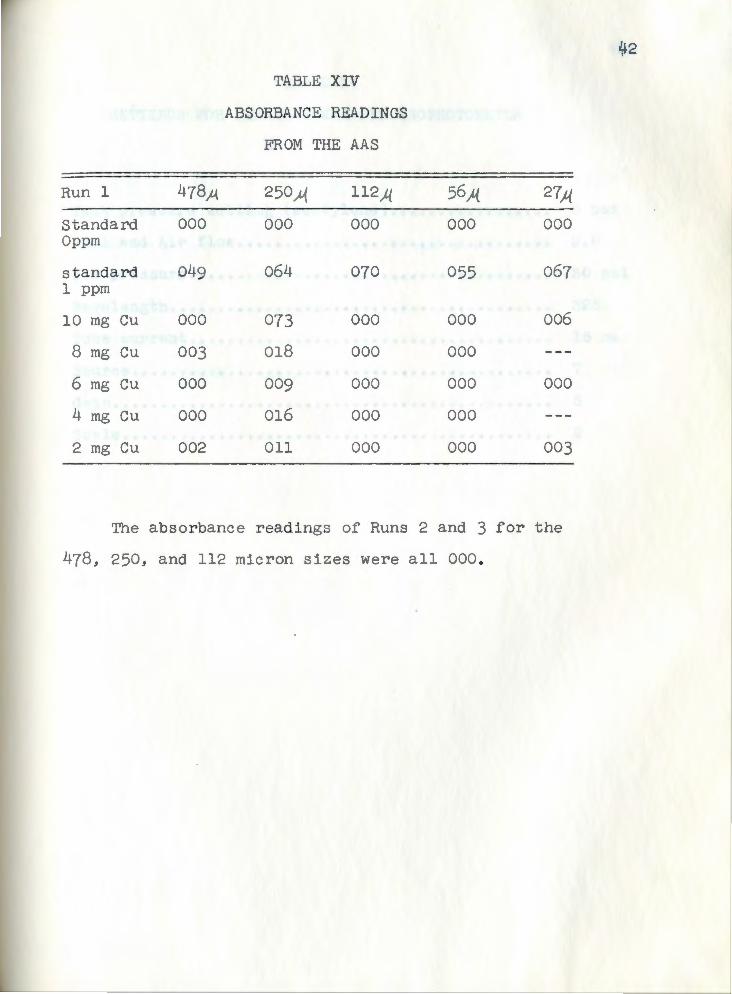
TABLE XIV
ABSORBANCE READINGS
FROM THE AAS
Run 1 478}{ 250 )-{ 112_,l{ 56){ 27,l(
Standard 000 000 000 000 000 Op pm
standard 049 064 070 055 067 1 ppm
10 mg Cu 000 073 000 000 006
8 mg Cu 003 018 000 000
6 mg Cu 000 009 000 000 000
4 mg Cu 000 016 000 000
2 mg Cu 002 011 000 000 003
The absorbance readings of Runs 2 and 3 for the
478, 250, and 112 micron sizes were all 000 .
1t2

TABLE XV
SETTINGS FO R PERKI N- ELMER SPECTROPHOTOMETER
Tank pressure sett i ng (acetylene) •••••••••••••••••
Fuel and Air flow ••.••••••.•••••.•••••••••.•••••••
Air pre ssure ••••••••••• . .•••••••••••••••••••••••••
Wavelength ••••••••••.•••.•••.•••••.•••.•••.••.•.••
Tube current . . . . . . . . . . . . . . . . . . . . . . . . . . . . . . . . . . . . . . Source . . . . . . . . . . . . . . . . . . . . . . . . . . . . . . . . . . . . . . . . . . . . Gain •• . . . . . . . . . . . . . . . . . . . . . . . . . . . . . . . . . . . . . . . . . . . . Scale . . . . . . . . . . . . . . . . . . . . . . . . . . . . . . . . . . . . . . . . . . . . .
43
8 ps:i
9 . 0
30 psi
325
15 ma
7
5
2

TABLE XVI
SETTINGS FOR G. E . XRD- S5 X- RAY DI FFRACTION UNIT
Goniometer ••••••••••••• . . . . . . . . . . . . . . . . . . . . . . . . . . . .
44
0 45 . 03
Takeoff angl e •••••••••• . . . . . . . . . . . . . . . . . . . . . . . . . . . . . . . . 00
Detection ••••••• . ••••••••••••••• Propor t ional flow counter
••••••••••••••••• 90% Methane , 10% Argon Pr oportional gas ..
Tube potential •••• . . . . . . . . . . . . . . . . . . . . . . . . . . . . . . . . . 50 kvp
Tube current •••••••.••• . . . . . . . . . . . . . . . . . . . . . . . . . . . . . 35 ma
Anal yz ing Crystal •••••••.•••.•••.••••••••••••••••••••• LiF
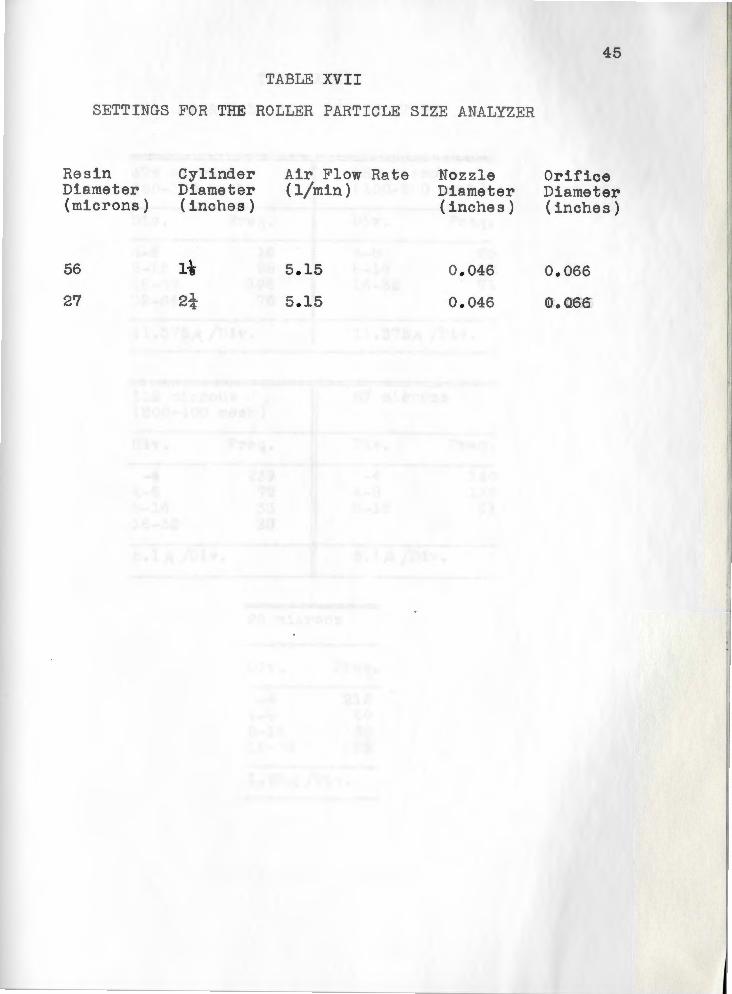
TABLE XVII
SETTINGS FO R THE ROLLER PARTICLE SI ZE ANALYZER
Re s in Diameter (micron s )
56
27
Cylinder Di ameter (inch es)
1-k
Air Flow Rate (l/min )
5 . 15
5 . 15
Nozzle Di ameter (inch es)
0 . 046
0 . 046
45
Or i f ice Di ameter (inch es)
0 . 066
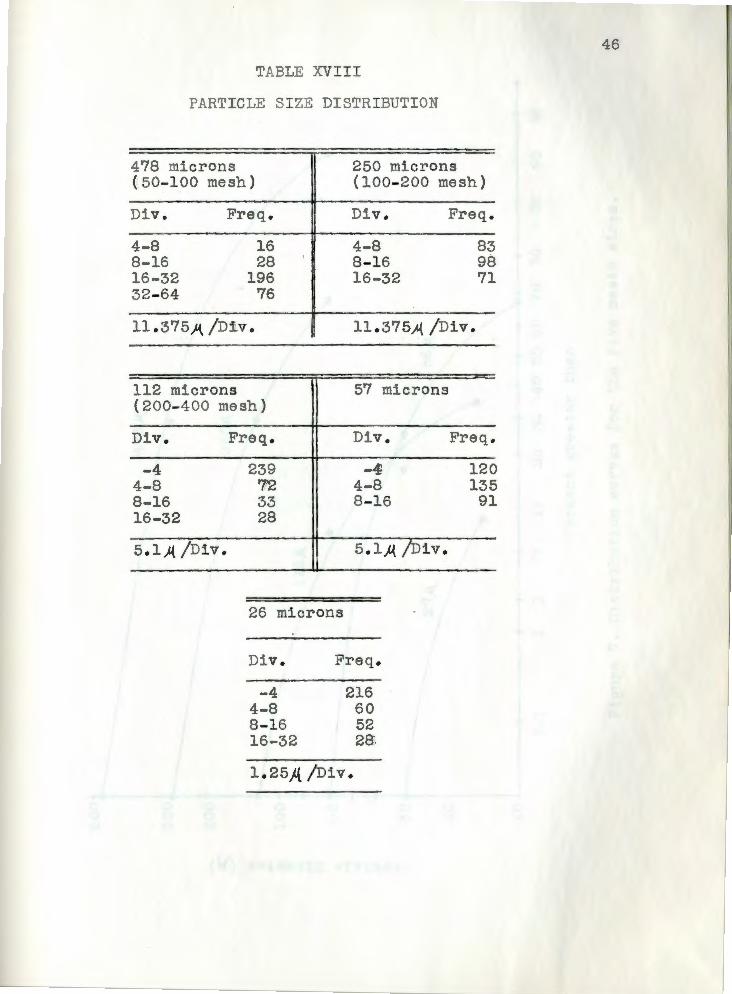
TABLE XVIII
PARTI CLE SI ZE DI STRI BUTION
478 microns 2 50 microns ( 50- 100 me sh ) (100- 200 mesh )
Div . Fre q . Div . Freq .
4 - 8 16 4 - 8 83 8 - 16 28 8 - 16 98 16 - 32 196 16- 32 71 32- 64 76
11 • 3 7 5 A / D :t v • ll . 375A / Div .
112 microns 57 micr ons ( 200- 400 me sh)
Div . Freq . Div . Freq .
- 4 239 - 41 120 4- 8 72 4 - 8 13 5 8 - 16 33 8 - 16 91 16- 32 28
5 . 1 ,A / Div . 5 . 1 ).{ / Div .
26 microns
Div .
- 4 4- 8 8 - 16 16 - 32
Freq.
216 60 52 28)
1 . 25){ / Div .
46

5 H Q)
+:> Q)
e al
•r-l (::1
Q)
r-l t)
o,...{
+:> H al
p..,
6 00
478.A I -----3 00
2 00
1 00
6 0
30 1 ------ '\. ~ 56}\
~ ' ' 2 0
lO j__~--+~~~+--+-~+----+-~--t----t~+-+-~~~~~~-:=-----:~ 0 . 1 1 2 5 1 0 20 30 4 0 50 6 0 70 80 90 95 00
Per cent gr ea t er t han
Fi gure 7 . Di s tribution curve s for t he five re sin si ze s . fP> -.J

APPENDIX F
SAMPLE CALCULAT IONS

1 . Calcu l a tion of i nf i n ite t h ickness
where X i s t h e i nfin i te t h i c kness ,}\ i s t h e linear
1 i ab sorp tion coefficient and K = SIN o<. + SIN~ = 3.155
The angles of ~ a nd ~ are from t h e ge ome try of t e
s pe ctrometer and a re res pec t ively 60° and 30° .
x 4.62. - 1489. B 0.00309 Cl'\ = 30. 9 A
2 . Ca lcu l a tion of mg of Cu ab sorbed on t h e resin.
From the AAS da t a for t h e 100- 200 si z e resin
us i n g t h e 1 0 ppm Cu solut i on, t h e c oncentrat ion of the
e fflue n t c an b e c a lcula ted s follows:
ppm = sample readin~ = 73 = 1 . 1 ppm 1 ppm sta ndard rea i ng '64
For 1 lite r of s olution t h is amounts t o 1 . 1 mg Cu . The
a mount of u p t ake is ther e fore 1 0 mg - 1 . 1 = 8 . 9 mg .
3 . Calculati on of weight mean diame t er .
The we i ght mean diameter for t e l arge st fraction
calc l a ted by e v a l uating t e foll owing
lr. d (Dw) i n tegral: wa s
D where W is the weight of ea ch par ticle and D is the
d i ameter .
g iven by:
An approx i ma tion of the i ntegral may be
L Dn.D3
0 = 2=n.\)3 sinc e D3 is proportiona l to t e
4 9

we i ght of t he particle.
Calculation of t he weight mean d i ameter of the
50 - 1 00 mesh is a s follows:
n
16
28
196
76
D nD3 nD4
6 3456 20736
12 48384 580608
24 2709504 65028 096
48 8404992 403439616
L: nn3 = 11166336 L_nn 4 469069056
4 D = nD = 42 d ivisions nW
Di ameter = 42 d iv . x 11 . 375 = 478 )( div .
50