a study of the impact of green marketing on consumer purchasing patterns and decision...
TRANSCRIPT

i
A study of the Impact of Green Marketing on Consumer Purchasing Patterns
and Decision Making in Telangana, India
Aditi Jaju
MSc in Management
National College of Ireland
Submitted to the National College of Ireland, August 2016.

ii
Abstract
The purpose of this study is to investigate the impact of Green Marketing on Consumer Purchasing
Patterns and Decision Making in India. The study was concentrated particularly on the Telangana State
in India. The research was used a quantitative approach with survey as the research instrument. The
survey included basic socio-demographic questions followed by questions on consumers’
environmental beliefs and their environmental behaviour. The results were then analysed using
descriptive, regression analysis and correlations from SPSS. The significant findings show that intensity
of green packaging and green branding, importance of green products and premium green pricing have
a significantly positive impact on consumer behaviour leading to green purchases. Associations
between place of residence and some of the environmental belief factors were found. Correlations were
found between eco-labelling, green branding and green pricing and the environmental behaviour of
consumers.
Keywords: Green marketing, consumer purchase patterns, developing nations, India, strategies of
green marketing, consumer beliefs, environmental behaviour

iii
Declaration Form
National College of Ireland
Research Students Declaration Form
(Thesis/Author Declaration Form)
Name: Aditi Jaju
Student Number: 14128110
Degree for which thesis is submitted: MSc in Management
Material submitted for award
(a) I declare that the work has been composed by myself.
(b) I declare that all verbatim extracts contained in the thesis have been
distinguished by quotation marks and the sources of information
specifically acknowledged.
(c) My thesis will be included in electronic format in the College
Institutional Repository TRAP (thesis reports and projects)
(d) Either *I declare that no material contained in the thesis has been
used in any other submission for an academic award.
Or *I declare that the following material contained in the thesis formed part
of a submission for the award of
(State the award and the awarding body and list the material below)
Signature of research student: _______________
Date:

iv
Submission of Thesis to Norma Smurfit Library
National College of Ireland
Student name: Aditi Jaju Student number: 14128110
School: Business Course: MSc in Management Degree to be awarded: MSc in Management
Title of Thesis: A study of the Impact of Green Marketing on Consumer Purchasing
Patterns and Decision Making in Telangana, India
One hard bound copy of your thesis will be lodged in the Norma Smurfit Library and will be available for consultation. The electronic copy will be accessible in TRAP (http://trap.ncirl.ie/), the National College of Ireland’s Institutional Repository. In accordance with normal academic library practice all theses lodged in the National College of Ireland Institutional Repository (TRAP) are made available on open access.
I agree to a hard bound copy of my thesis being available for consultation in the library. I also agree to an electronic copy of my thesis being made publicly available on the National College of Ireland’s Institutional Repository TRAP.
Signature of Candidate: Aditi Jaju
For completion by the School: The aforementioned thesis was received by Date: 26/08/2016
This signed form must be appended to all hard bound and electronic copies of your thesis submitted to your school

v
Acknowledgements
I would like to thank my supervisor, Dr. Paul Hanly, for his patience, guidance,
support and encouragement throughout this study.
I would like to thank Jonathan Lambert for his guidance as well.
I would like to thank my parents for their encouragement and support throughout
this journey, I’m very grateful.
I would like to thank all of my friends for their constant encouragement.
Finally, I would like to thank all of the people who participated in this study.

Table of Contents
Abstract ............................................................................................................................... ii
Declaration Form ............................................................................................................... iii
Submission of Thesis to Norma Smurfit Library ............................................................. iv
Acknowledgements ............................................................................................................ v
List of Tables ....................................................................................................................... 1
List of Figures ..................................................................................................................... 2
1. Introduction ..................................................................................................................... 3
1.2 Context and Rationale ............................................................................................................ 3
1.3 Research aim and objectives ............................................................................................... 4
1.4 Outline of the research .......................................................................................................... 5
2. Literature Review ............................................................................................................ 6
2.1 Introduction............................................................................................................................... 6
2.2 Green Marketing ...................................................................................................................... 6
2.2.1 Green Consumer .............................................................................................................. 6
2.2.2 Need for Green Marketing .............................................................................................. 8
2.3 Green buying behaviour ........................................................................................................ 8
2.4 Consumer Responsiveness and Eco-labelling ............................................................. 10
2.5 Green Branding ...................................................................................................................... 11
2.6 Green Advertising ................................................................................................................. 12
2.7 Conclusion .............................................................................................................................. 13
3. Research Methodology ................................................................................................. 15
3.1 Introduction............................................................................................................................. 15
3.2 Research Aim and Objectives ............................................................................................ 15
3.3 Research Philosophy ........................................................................................................... 16
3.4 Research Approach .............................................................................................................. 16
3.5 Research Design and Strategy .......................................................................................... 17
3.6 Research Instrument ............................................................................................................ 18
3.7 Ethical Considerations ......................................................................................................... 21
3.8 Data Analysis .......................................................................................................................... 21
3.9 Limitations of research methodology .............................................................................. 25
4. Results ........................................................................................................................... 26
4.1 Exploratory Results .............................................................................................................. 26

4.2 Tests of Normality and Difference .................................................................................... 27
4.3 Correlations ............................................................................................................................ 38
4.4 Regression .............................................................................................................................. 39
5. Discussion ..................................................................................................................... 41
5.1 Introduction............................................................................................................................. 41
5.2 Intensity of green packaging and branding for ecological customers ................... 41
5.3 Importance of green products and premium green pricing ....................................... 42
5.4 Effectiveness of eco-labelling and green products identification ............................ 43
5.5 Environmental advertisement and green consumption patterns ............................. 43
5.6 Consumers’ perceptions on environmental concerns and beliefs .......................... 44
5.7 Future Research .................................................................................................................... 45
5.8 Limitations............................................................................................................................... 45
5. Conclusion .................................................................................................................... 46
References ........................................................................................................................ 48
List of Appendices ............................................................................................................ 53
Appendix A ........................................................................................................................................ 53
Appendix B ........................................................................................................................................ 56
Appendix C ........................................................................................................................ 63
Appendix D ........................................................................................................................ 65
Appendix E ........................................................................................................................ 67
Appendix F ........................................................................................................................ 69
Appendix G ........................................................................................................................ 71
Appendix H ........................................................................................................................ 73
Appendix I ......................................................................................................................... 75
Appendix J ........................................................................................................................ 77
Appendix K ........................................................................................................................ 79

1
List of Tables
Table 1 Environmental Beliefs – Questionnaire
Table 2 Environmental Behaviour – Questionnaire
Table 3 Test of internal consistency of the questionnaire
Table 4 Frequencies and Descriptive Statistics
Table 5 Test of Normality (Shapiro-Wilk Test)
Table 6 Results of Independent t-test and ANOVA for eco-labelling
Table 7 Results of Mann-Whitney U-test, Kruskal-Wallis test and ANOVA for green branding
Table 8 Results of Mann-Whitney U-test and Kruskal-Wallis test for environmental advertising Table 9 Results of Mann-Whitney U-test and Kruskal-Wallis test for green pricing
Table 10 Results of Mann-Whitney U-test and Kruskal-Wallis test for eco-image Table 11 Results of Mann-Whitney U-test and Kruskal-Wallis test for environmental concerns
Table 12 Results of independent t-test, ANOVA, Kruskal-Wallis test and Mann-Whitney U-test
for environmental behaviour
Table 13 Correlations between factors of environmental beliefs and environmental behaviour
Table 14 Regression analysis

2
List of Figures
Figure 1 Maslow’s Hierarchy of needs
Figure 2 Correlation Coefficient values
3
1. Introduction
Green marketing is on the rise and a rather new area acknowledged for research. There is not one
universal definition of green marketing and the definition generally varies according to the researcher’s
viewpoint. Dahlstorm (2011) and Ottman (2011) have characterized green marketing as an integration
of ecological concerns into marketing aspects including production, distribution and logistics, promotion
and packaging along with marketing communications. Green marketing associates with identifying the
consumer needs and satisfying those needs in valuable and sustainable manner (Peattie, 1995). For
this research, the definition adopted states that green marketing can also be used as a strategy that
points the consumers towards the benefits of environmentally friendly products to influence their
purchasing patterns (Harrison, 1993). Green marketing helps in brand differentiation of companies that
in turn focuses on the environmentally aware consumers willing to buy green products (Chan, 2004). It
can be inferred from various literature that green marketing basically bridges the communication
between environmentally conscious firms and consumers, in turn strengthening their relationship. A
green consumer, as stated by Elkington (1994), is indulgent in using environmentally friendly products
including the ones using green manufacturing and production methods and the ones that are against
animal cruelty and so on. Such green consumers are compelling companies to differentiate themselves
by going green and consequently making a new market segment adding to the economies of different
nations globally (Juwaheer et al., 2012).
Empirical researches have recognised that issues regarding sustainability, awareness about
environmental issues and green brands are becoming a focal point in developed and developing
nations, with added consciousness from the government and population in general. Studies have been
conducted on green buying behaviour and attitudes of the different population and it was noted that
green marketing was gaining prominence in developing nations (Khare, 2014). In the context of
developing countries, studies concluded that green consumption was becoming popular and different
elements that influenced green consumptions include, awareness and knowledge about green
products, trust in eco-labels and brands, consumers’ concern towards environment’s degradation and
their altruistic values, consumers were also found to be more socially integrated and have a
cosmopolitan approach and favourable attitude towards green products (Mosafa, 2009, Rahbar and
Wahid, 2011 and Juwaheer et al., 2012). India was appraised as a relatively new segment for further
research in green marketing in contrast to the other developing nations (Khare, 2014).
Due to the increasing recognition of green marketing especially in emerging nations, the key focus of
this study is to investigate the impact of green marketing on consumer purchasing patterns and decision
making in Telangana, India.
1.2 Context and Rationale
To make the market segment for green products more conventional, it is essential to research the
factors that persuade green behaviour in consumers leading to green purchases. A consumer’s

4
decision-making process is influenced by numerous factors, most importantly, a consumer’s awareness
and knowledge about green products dictates the decision-making (Carlson et al., 1993). Various other
studies have been pursued on green marketing and the strategies used for communication in order to
influence the consumer purchase behaviour. It is observed that a correlation exists between consumers’
environmental beliefs and their confidence on the performance of green products (Pickett-Baker and
Ozaki, 2008). Researches state that consumers’ values/beliefs and their behaviour are the driving
factors that shape their perceptions of environmentally friendly products, and that this is guided by
means effective marketing (Pickett-Baker and Ozaki, 2008). It was also identified that Indian consumers
were affected by green brands and price, which influenced their behaviour (Khare et al., 2013). Khare
(2014) affirmed that there is an upsurge in eco-awareness in urban consumers, but there is still a need
for extending and multiplying the same among more number of people. As per the reviewed literature
it was observed that eco-labelling encroaches on the consumer purchasing patterns of green products.
Researchers have also found that brands can also influence consumer behaviour towards ecological
product consumption (Pickett-Baker and Ozaki, 2008). There are contradictory studies in terms of the
effect of green advertisements on consumers, based on various research papers. Juwaheer et al.
(2012), also put forward that consumers have started becoming more conscious about being eco-
friendly, this has furthermore resulted in demand for such eco-friendly products, and this in turn is
offering companies a chance to exploit the need and create a new market segment.
The literature suggests that consumer is the biggest stakeholder and hence there is a need for more
research around the consumer. Several studies revealed that consumers are now well informed about
ecological benefits and issues, thus leading to their growing environment concerns.
1.3 Research aim and objectives
There is a lot of published literature in the area of green marketing and consumer behaviour, although
the consumer purchasing patterns influenced by different green marketing strategies for developing
countries is yet to be discovered in detail (Juwaheer et al., 2012). Therefore, to bridge this literature
gap, taking up the current research may lead to consumer perceptions and comprehensions that would
be of interest. It would be interesting to look at socio-demographics to see if there are any associations
with respect to consumers’ beliefs.
There are different factors under consumer beliefs that may act as drivers of green behaviour (Juwaheer
et al., 2012). A questionnaire based on the same factors has been adopted for this research.
This study aims to investigate the impact of green marketing on consumer purchasing patterns and
decision making in India. In particular, this research is concentrated on the Telangana state in India.
Sub-Objective 1: To investigate the direction and strength of the relationship between the six distinct
environmental belief factors and environmental behaviour, while controlling for key socio-demographic
factors.

5
Sub-Objective 2: To investigate significant associations between the environmental behaviour, the six
environmental belief factors and key socio-demographic variables including gender, age, education and
place of residence
Sub-Objective 3: To analyse the correlations between environmental belief factors (eco-labelling, green
branding and packaging, environmental advertisements, green pricing, embedding an eco-image,
environmental concerns and beliefs) and the environmental behaviour of consumers
1.4 Outline of the research
Chapter 1 provides a background of the research
Chapter 2 will highlight the existing literature in the area of green marketing further pointing to the
research aim and objectives.
Chapter 3 will focus on the research methodology that will be used to investigate the research aim and
objectives.
Chapter 4 will included all the analysis of the research objectives followed by stating the results and
findings.
Chapter 5 will emphasize the findings leading to a discussion, implications and suggestions for future
research.
Chapter 6 will conclude the research paper.

6
2. Literature Review
2.1 Introduction
Green marketing is becoming a popular research area and many theories have been proposed in the
context of green marketing and consumer behaviour. This chapter will focus on the key literature that
has been studied surrounding the research topic. The key aspects of green marketing, green consumer
behaviour and consumer responsiveness on eco labelling, green advertising and green branding will
be explained primarily based on the impact of green marketing on consumer purchase patterns in India.
2.2 Green Marketing
The definition of green marketing has evolved considerably since its origination in the 1970. One of the
earliest definitions of Green Marketing includes the aspects of marketing activities, both positive and
negative, studying the depletion of energy and non-energy sources, pollution and so on (Henoin, 1972).
The most recent definition of green marketing has completely progressed in terms of its variables. It
states that green marketing involves the marketing strategies used to achieve a firm’s financial as well
as strategic goals while reducing its negative impact on the environment (Leonidou et al., 2013).
Dahlstorm (2011) and Ottman (2011) have characterized green marketing as an integration of
ecological concerns into marketing aspects including production, distribution and logistics, promotion
and packaging along with marketing communications. On the other hand, Prakash (2002) regards green
marketing as an environmentally considered strategy that consists of disclosing information to
consumers at different levels like industry, firm and product level. Welford (2000) and Peattie (1995)
describe green marketing as a management process of identifying, anticipating and satisfying the
consumers’ needs and wants while being sustainable as well as profitable. Despite the growing body
of literature focusing on green marketing, a universal definition remains elusive with many
heterogeneous definitions remaining in use, depending on the researcher’s perspective. For the
purpose of this study, the researcher will focus on the definition advocated by Harrison (1993), which
defines green marketing as a marketing strategy involved in pointing consumers at the benefits of green
products in a way that it influences consumer purchase decisions.
2.2.1 Green Consumer
In order to understand the concept of green marketing, it is necessary to understand a green consumer.
Elkington (1994) defines a green consumer as an individual who indulges in avoiding the use of
products that endanger the environment due to their manufacturing or disposing methods, or products
that involve animal cruelty or products that are obtained from threatened species. Numerous green
marketing research papers, which are based on consumer behaviour, include factors that impact green
purchase, different consumer segments in green marketing, consumer’s decision based on their
willingness to pay and consumer profiling (Peattie, 2001). In line with the same, in a study conducted
by Laroche (2001), it was identified that most green consumers are very likely to be educated young

7
adults, who spend money on both green and non-green products in anticipation that they work just as
efficiently and effectively (Laroche et al., 2001). From the findings of another recent study, it was
observed that the knowledge consumers have about environmentally friendly products is one of the
contributing factors that influence their decisions to purchase green products (Khare et al., 2013). These
studies show that different consumers have different approaches and drivers for green purchase.
Ottman (1993) and Peattie (2001), classify green consumer needs in four categories including having
knowledge and information, preserving their choice of lifestyle, desires to be substantive and the desire
to control. These needs are classified in a way that they are met by what the market has to offer. To
understand how people are motivated in their decisions to achieve their needs, Maslow’s Hierarchy of
needs includes motivational needs at different hierarchical levels in a pyramid. They can be classified
as, physiological, safety, love and belongingness, esteem and self-actualization needs (Maslow, 1943
and 1954).
Figure 1: Maslow’s Hierarchy of needs
Maslow’s Hierarchy of needs can be integrated with green consumer needs, therefore suggesting that,
green consumers buy green products to contribute to a safe environment while adding to their good
health. This meets their physiological and safety needs. At further levels, certain green consumers meet
their love and belongingness need by giving it back to the environment, hence creating belongingness
to a community that loves the environment. This in turn can lead to high esteem and self-actualization.
On the basis of this theory, in a research on choosing the right green marketing strategy, conducted by
Ginsberg and Bloom (2004), the findings suggest that green consumers, who have decided to purchase
green products, are more likely to not compromise on the quality of the product as long as the product
influences the consumers’ self-interest and at the same time promoting its environmental benefits.
Okada and Mais (2010), also suggest that green consumers are more likely to overlook the cost as long
as the product aids their convenience. On the other hand, based on a study about consumer’s
willingness to pay, it can be argued that, consumers would be reluctant to pay extra unless they have

8
satisfactory information about green products (Michaud and Llerena, 2011). The key findings here
suggest contradictory views, therefore it can be interesting to learn more about the patterns that
influence consumers’ decision making to buy green products.
2.2.2 Need for Green Marketing
The literature in the area of green marketing abundantly consists of studies examining the need for
green marketing particularly inclining upon the consumer requirements and environmental
considerations. Stafford (2003) and Ottman et al. (2006), through their researches have acutely
concluded that as the concern regarding the environment is growing globally and continually, green
marketing has gained more popularity. Overtime, numerous researchers have stimulated further
investigations on environmental issues and conservation with regard to marketplaces across the globe
(Mintel, 2006). In 2006, the green industry was projected at 200 billion dollars (Gupta and Ogden, 2009).
In a report from 2011 on ‘Green marketing: A Global Strategic Business Report’, it was ascertained that
by the year 2017, the green marketing industry would have a market worth $3.5 trillion (Global Industry
Analysts Inc., 2011). The report further suggests that awareness about ecological issues amongst
government, firms and consumers is the primary reason for the huge potential market. McKinsey (2007),
conducted a survey in which it was found that 87% of men and women, from different developing nations
like Brazil, India, China and developed nations like, Canada, UK, France and the US have inclined
themselves in decreasing their negative impact on the ecosystem (McKinsey, 2007). This shows that
there is an increase in environmental awareness, therefore supporting the rise in the market share of
green industries.
Later in 2011, after examining the literature in marketing, operations and management, researchers
pointed opportunities for investigation in various fields like green processes, green performance, green
associations, green performance and green consumers (Cronin et al., 2011). According to D’Souza et
al, (2006), as the number of green consumers is accelerating, firms are trying to understand consumers’
purchase intention when it comes to green products. This shows that, there is a need to further explore
the area of consumer purchase patterns of green products.
2.3 Green buying behaviour
It is essential to analyse green buying behaviour of green consumers in order to identify the factors that
are driving the consumer purchase patterns, including the intention of purchase and actual purchase
behaviour of green products. Grob (1995) defines behaviour in environmental context as actions that
have a direct effect on the ecosystem. There are multiple green practices that are gaining momentum.
Some of them include recycling, saving paper and electricity, avoiding the use of aerosols, encouraging
the use of biodegradable products, use of organic food and so on (Gilg et al., 2005). Consumer demand
in terms of green movement is gradually sloping upwards (Han et al., 2010). The reason for this shift
towards green purchases could be a result of consumers’ realization of the impact their behaviour has
on the environment.

9
Carlson et al. (1993) point that a consumer’s decision-making process is influenced by numerous
factors, most importantly, a consumer’s awareness and knowledge about green products dictates the
decision-making. Various other studies have been pursued on green marketing and the strategies used
for communication in order to influence the consumer purchase behaviour. Pickett-Baker and Ozaki
(2008) observed that a correlation exists between consumers’ environmental beliefs and their
confidence on the performance of green products. There was no linear relationship between consumers’
environmental behaviour and their environmental beliefs.
In studies carried out by Straughan and Roberts (1999), it was concluded that pro-environment and
eco-friendly attitude might be influenced by personal factors as well as peer viewpoint. Ajzen’s Theory
of Planned Behaviour (TPB), validates that, the intention of buying is influenced by beliefs that shape
attitudes to behaviour (Ajzen, 1991). In a study by Mathur et al (2008) where TPB is used, the
consumption behaviour was compared between 2nd and 3rd generation Indians living in the USA and
India. The Indians living in America were found to be extremely influenced by the green values and the
green culture there and it was observed that this was more evident on the Indian youth compared to
the other consumption groups. In the context of developing countries, studies based on countries like
Egypt, Malaysia, Singapore and Mauritius, it was found that green consumption was becoming popular
and different elements that influenced green consumptions include, awareness and knowledge about
green products, trust in eco-labels and brands, consumers’ concern towards environment’s degradation
and their altruistic values, consumers were also found to be more socially integrated and have a
cosmopolitan approach and favourable attitude towards green products (Mostafa, 2009, Rahbar and
Wahid, 2011 and Juwaheer et al., 2012). In a research on consumers in Ghana, a low level of ecological
awareness was found which, directly impacted the green purchase decision of Ghanaian consumers.
Another factor that influenced green purchases was price (Braimah and Tweneboah-Koduah, 2011).
On the other hand, when the Ajzen’s Theory of Planned Behavior (TPB) was applied to a study on
consumers from developed countries like UK and Greece, in order to examine the different factors that
influence their intention to purchase green products, the results were completely different for both UK
and Greece. In UK, it was found that the consumers were more inclined towards social norms and
acceptance from society. And thus, social norms were directly proportional to purchase intentions of
consumers. On the contrary, in Greece, consumers were not influenced by social norms but believed
in control. They felt that their knowledge and awareness about green products has an impact on the
ecological behaviour (Kalafatis et al., 1999). On the basis of these studies, it can be observed that
Ajzen’s theory of planned behaviour is well suited to know the intention behind consumer purchase of
green products. However, Mangnusson et al. (2003) validate that TPB is less suitable to explain ethical
behaviour because the consumer affective element that influences consumer ethical behaviour is not
accounted for in TPB.
Although, there are theories that support that behaviours are influenced by attitudes of individuals, in
the case of green consumerism, researchers are still debating the ability to predict attitude. According
to Mainieri et al., (1997), the correlation amid consumers’ green behaviour and their attitude was found
to be low. Tracy and Oskamp (1984), also suggest the same where as Spruyt et al. (2007), proposed
10
that the prediction of an individual consumer’s behaviour is dependent on the individual’s attitude.
Therefore, the measure of attitudes to predict consumer behaviour should be concentrated on specific
categories like purchasing of environmentally friendly products (Wulf and Schronder, 2003). Young et
al. (2010) suggested that there is an “attitude-behaviour” gap in translating consumers’ ecological
concerns into behaviour. Green purchases are not necessarily led by consumers’ interest in being
ecologically safe (Young et al., 2010).
Based on studies about consumer’s behavioural patterns, it was concluded that a green consumer is
likely to be a confused consumer (Crane, 2000 and Davis, 1993). From the findings in different
developing nations, it was observed that consumers’ awareness, knowledge, environmental concerns
and so on are the drivers behind their green purchases. However, in the case of India, contradictory
views have been presented by different researchers. In a paper by Singh and Pandey (2012), it was
noted that the Indian consumers were showing an increased interest in green products, and if the
consumers are well informed about the price, quality and features, performance and other benefits of
different green products through green marketing, it will lead to a sharp increase in the use of such
products. According to their research, Singh and Pandey (2010), found that the consumers in India,
however, lack awareness of other green products including recyclable products, organic food and so
on; hence, there is a need of building green products and brand awareness (Singh and Pandey, 2012).
On the contrary, a study by Mishra and Sharma (2010) showed that, Ayurveda and herbal products
have been popular in India for many decades. These products were considered important as they
consisted natural elements and medicinal aids. Indian consumers have been relying on these products
and using them over many years (Mishra and Sharma, 2010). Indian consumers trust that both
Ayurveda as well as herbal products do not have any side effects, thus, encouraging them to use these
products at home for beauty benefits (Mishra and Sharma, 2010). Globalization has influenced
consumption patterns which has in turn altered the lifestyles of consumers. Taking into account the
evidence from the literature, further investigation on the Indian consumer segment by identifying the
relationship between consumer belief and behaviour may lead to interesting insights.
2.4 Consumer Responsiveness and Eco-labelling
Eco-labelling is a key factor that will be incorporated in this research paper. Eco-labelling impinges on
the purchasing patterns of green products. An eco-label recognizes the complete environmental
preference of a product or service inside a product classification with respect to its life cycle (Global
Ecolabelling Network, 2004). Organizations could use Eco labels as a proof to illustrate to their
consumers that they have used environmentally profound production as well as distribution methods
(Bruce and Laroiya, 2007). Eco labelling is supported by “perspective criteria as well as standardization
of principles” for products that are eco-friendly, thus differentiating the product from others to ensure
consumers of its standards (Boström and Klintman, 2008, p.28). The producers of eco labelling
schemes are most likely to be licensed through independent third parties (state or private agency) who
inspect whether or not the producers are complying by the labelling standards (Boström and Klintman,
2008, p.28). Cherion and Jacob (2012) state that there are over 30 eco-labelling methods currently and

11
Germany was the first nation to introduce eco-labelling scheme called Blue Anger.
Eco-labels carry major significance in improving market shares by demonstrating affirmative social and
ecological impact (Michalko, 2010). Such eco labels are called “winners”. Eco labels that determine
little or no impact despite being popular amongst consumers are called “green washers”. Eco labels
that demonstrate positive ecological results with less market recognition are called “wallflowers”. Eco
labels that have no significance in either dimension are called “weeds” (Purohit, 2012).
Eco-labelling might be an important factor in convincing consumers to buy green products. Eco-labelling
can influence consumers to pay a premium price by showing additional benefits of the products such
as quality, ecologically safe, non-hazardous, more efficient and so on (Renfro, 2010). In a Malaysian
research including 526 respondents, Rashid (2009) pointed that consumers have a positive outlook and
reaction to green purchases and green marketing as a result of their awareness of eco-labels. Another
study by Kuhn (1999), supports the findings from Rashid (2009). According to Kuhn (1999), the market
share of a company that uses ecological manufacturing methods and sustainable marketing strategies
can be improved by promoting their eco-friendly activities using eco labels. On the contrary, Leire and
Thidell (2005) identified that consumers’ green purchases are not driven by their eco label awareness.
They used a framework developed by the US-EPA to measure the effectiveness of eco-labelling. As a
result, it was found that consumers acknowledge eco-labels but they don’t necessarily buy those
products or that they don’t necessarily follow the information they specify in the survey (Leire and
Thidell, 2005). Lyer (1999) has informed that consumers’ lack trust when eco labels are concerned.
Cherian and Jocob (2012) suggest that the reason behind this consumer distrust is not understood to
its full potential. The perception that is understood suggests that eco labels attract consumers by
explaining the product’s environmental impact (Cherion and Jacob, 2012).
These conflicting views by various researchers point to a literature gap and hence further investigation
is required to understand the consumer responsiveness towards eco-labels. Empirical research has
suggested a need in investigating the different ways, which will have a direct impact on intentions behind
consumers’ green purchase with the use of eco labels (D’Souza et al., 2006). Sammer and
Wüstenhagen (2006), also suggest that it is necessary to explore the direct impact of eco-labelling on
consumer’s ecological attitude and decision-making. The current research will explore this interesting
area using a validated questionnaire that has been underutilized in the literature to date in an interesting
population within a developing country.
2.5 Green Branding
Researchers who studied concepts of brands and their effect on consumers’ attitude and consumers’
behaviour, have offered various internal and perceptual factors leading to purchase behaviour by
influencing consumers’ attitudes. There are three perceptual factors identified in “Managing Brand
Equity”, namely, Brand awareness, associations and quality perception (Aaker, 1991). Banytè &
Gadeikienè (2008) believe that in the recent past, Green Marketing is coming to light as an instrument

12
contributing to sustainable development and adding value to the brand image. Marketing of products
that are eco-friendly is not commercially feasible to infiltrate the marketplace if there is lack of
communication of the brand attributes (Meffert and Kirchgeorg, 1993).
One of the most significant elements of green branding strategies is green positioning which can further
be classified into functional or emotional. Elements that are classified as emotional are considered more
important compared to functional elements of branding and green positioning of products (Meffert and
Kirchgeorg, 1993). According to Sarkar (2012), when green positioning is used in terms of a corporate
strategy, it can be based on different emotional brand benefits such as selflessness associated with
emotion of well-being, benefits including auto-expression that are a result of using socially recognizable
green brands and nature related benefits (Sarkar, 2012, p. 47). Green positioning has a positive
influence on brand attitudes, proposing that the green product purchases are a result of communication
of effective branding with the marketplace (Hartmann et al., 2005). Brands can influence consumer
behaviour towards ecological product consumption (Pickett-Baker and Ozaki, 2008). One of the
important factors for a firm to gain competitive advantage in its marketplace is packaging of consumer
products (Barber, 2005). A low-key investment in packaging can lead to accelerating brand sales in
comparison to advertising and promotion of products (Barber, 2010). For example, Dell uses green
branding of their eco-friendly products using “Go Green with Dell” as their branding strategy. They also
use packaging that is eco-friendly. Apart from this, Dell focuses on efficient and green innovations. On
the other hand, certain companies use green marketing as their tool for popularity, which induces lack
of trust in consumers in terms of green initiatives. This arises doubts in consumers about the credibility
of firms green activities (Raska and Shaw, 2012).
Kinner and Taylor (1973) investigated green brand issues using a quantitative analysis with 500
respondents. Their findings showed that buyers’ ecological concerns had an apparent effect on their
perception of the brand. Later in 2005, on application of the experimental design method, Patrick et al.
(2005), found a positive effect on the brand because of consumers’ perception of green brand
positioning. Similar researches were carried out in other nations and it was found that consumers have
a negative perception of eco-friendly products. They believe there is a marked trade off among the
functional brand performance and environmental effects. It was also found that emotional brand benefits
act as a vital encouraging factor for green purchases by influencing consumer behaviour (Cherain and
Jacob, 2012). The literature on green branding demonstrates that there is an effect of green branding
on consumers’ perception, but in order to explore if this perception has an effect on green purchases,
there is a need for further analysis.
2.6 Green Advertising
Green advertisements first incepted in late 1960s as a result of concerns brought up by consumer
activism, public and scientific communities and others about firms using anti-environmental practices
(Easterling et al., 1996). Over the years, green advertising decreased because of false claims via
advertisements, exaggeration in the advertisement content and it was found that consumers’ were
13
perplexed about the terminologies used (Polonsky et al., 1997). Yin and Ma (2009) state that green
advertising caught momentum again in 2000s, with developments in international legislations, global
support, renewed interest among consumers and so on, therefore starting the sustainable age (Belz
and Peattie, 2009). Green advertisements refer to adverts including sustainability of the environment,
eco-friendly content, substance targeting needs and desires of green consumers and other
stakeholders (Zinkhan and Carlson, 1995).
Lutz (1985) interprets that, advertising is one of the vital factors contributing to consumers’ attitude and
consumer responsiveness to any products or services. Baldwin (1993) suggested that green
advertisements contribute in translating consumer’s perceived value of green products into purchases.
However, contrary to this, in a research by Chase and Smith (1992), it was found that only about 70%
of the respondents were influenced with green messages from advertising and eco-labelling. The same
study further reported that more than 50% of the respondents didn’t pay enough attention to green
messages from the advertisements because of its exploited use, making these advertisements less
credible (Chase and Smith, 1992). Chan (2004), points that the core reasons for less credibility
observed in terms of green advertisements may be as follows:
a. The country that is advertising the green product does appear as eco-friendly
b. The manufacturer of the product does not appear eco-friendly
c. The asserted eco-friendly nature of the product does not meet consumers’ experience with the
product
Pooley and O’Connor (2000), report that providing consumers with ecological information might not
inspire positive green attitude in them. However, emotional content in green advertisements might
attract consumers’ attention to them (Hawkins et al., 1998). These studies indicate a need for further
investigation about the impact of green advertisements on consumer purchases.
2.7 Conclusion
Green Marketing is rising in its popularity and becoming a widespread research area. Green Marketing
had been prevalently researched in developed countries for decades but is only drawing interest from
developing nations in the recent past. The literature suggests that consumer is the biggest stakeholder
and hence there is a need for more research around the consumer. Several studies revealed that
consumers are now well informed about ecological benefits and issues, thus leading to their growing
environment concerns. However, different researches suggest that even though consumers are more
environmentally concerned, they do not necessarily indulge in using green products. This has been
contradicted by other studies and a significant gap is found between consumers’ concern for
environment and their green purchases, thus encouraging further investigation.
Various studies show that there is more environmental awareness in the developed nations, but in the
recent times, there has been an inclination in awareness in the developing nations as well, India being

14
one such nation. However, it fails to acknowledge whether this awareness is leading to an increase in
the use of sustainable and green products. There have been conflicting results about consumers’ green
attitude and their behaviour as a consequence.
Evidence suggests that green packaging, branding and eco-labelling have positive impact on
consumers leading to increased green purchases in some cases, and unaffected green purchases in
others. The results for such researches have varied for different nations, demographics and so on.
Evidence from the literature review point that in the developed countries, green marketing has been
extensively researched while in the developing countries, there appears to be a lack of research in this
area. Studies suggest consumers from developing nations have been showing greater interest in eco-
friendly activities and green products. It is therefore appropriate to undertake the analysis of the impact
of green marketing on the consumer purchase patterns and decision making in a developing nation
where green consumers are rapidly emerging. Furthermore, this research will emphasize on the key
tenants of green consumers purchasing patterns in Telangana, India. These include investigating if
there is a correlation between consumers’ green attitude and their green behaviour and the impact of
green packaging, branding and eco-labelling on green purchases. All of these factors have a significant
impact on green consumer purchase patterns as highlighted in the literature. For the purpose of this
research, a questionnaire that has been applied to another developing nation (Mauritus) by Juwaheer
et al., (2012) will be utilized. The main focus of this questionnaire is on characteristics like effectiveness
of eco-labelling in green products identification, intensity of green packaging and branding on green
consumers, green advertisements and consumption patterns, importance of green products and
premium green pricing, embedding an eco-image and environmental concerns and beliefs which will
facilitate the researcher in examining the unique relationship between consumers’ environmental beliefs
and their environmental behaviour, therefore leading to interesting insights about the research area.
15
3. Research Methodology
3.1 Introduction
This chapter will summarize the method and approaches adopted for this research. It will include the
research aims and objectives, the research philosophy, the research design and approach, the research
strategy, the research instrument used in this study. It will also provide justification for the method used
for the study and provide details about the research tool that is used, the survey design, the sample
selection, ethical considerations, and analysis of the data along with the limitations of the approach.
This research is based on the research framework proposed by Saunders et al. (2009), called the
research onion giving the research an organized structure and procedure.
3.2 Research Aim and Objectives
The overall research aim for this study is to investigate the impact of Green Marketing on Consumer
Purchasing Patterns and Decision Making in Telangana, India. The sub objectives of this research are:
Sub-Objective 1: To investigate the direction and strength of the relationship between the six distinct
environmental belief factors and environmental behaviour, while controlling for key socio-demographic
factors.
Hypothesis 1(a): There is a positive relationship between eco-labelling and environmental
behaviour of consumers
Hypothesis 1(b): There is a positive relationship between green branding and packaging and
the environmental behaviour of consumers
Hypothesis 1(c): There is a positive relationship between green advertising and the
environmental behaviour of consumers
Hypothesis 1(d): There is a positive relationship between green pricing and the environmental
behaviour of consumers
Hypothesis 1(e): There is a positive relationship between embedding and eco-image and the
environmental behaviour of consumers
Hypothesis 1(f): There is a positive relationship between environmental concerns and beliefs
and the environmental behaviour of consumers
Sub-Objective 2: To investigate significant associations between the environmental behaviour, the six
environmental belief factors and key socio-demographic variables including gender, age, education and
place of residence
Sub-Objective 3: To analyse the correlations between environmental belief factors (eco-labelling, green
branding and packaging, environmental advertisements, green pricing, embedding an eco-image,
environmental concerns and beliefs) and the environmental behaviour of consumers

16
In all cases the null hypothesis was that there is no correlation between environmental belief
factors and the environmental behaviour of consumers
The alternative hypotheses states that there is a positive correlation between each
environmental belief factors and the environmental behaviour of consumers.
3.3 Research Philosophy
Research philosophy consists of important assumptions in the researcher’s viewpoint underpinning the
research strategy and approach. According to Saunders et al., (2009), Research philosophy ‘relates to
the development of knowledge and the nature of knowledge’ (p. 107). There are two ways in which
research philosophy can be reflected, namely Ontology and Epistemology. Both Ontology and
Epistemology influence the research process differently to enhance the understanding of the technique
to approach the study. Ontology focuses on the nature of reality containing attributes of objectivism,
subjectivism and constructionism (Saunders et al., 2009). According to Quinlan (2011), Epistemology
focuses on conventional knowledge and the process it is obtained from in any research area.
Epistemology involves attributes like positivism, interpretivism and realism (Saunders et al., 2009).
This research uses the philosophy of positivism. The primary aim of this research is to analyse the
impact of Green marketing on consumer purchasing patterns in India. To investigate this, existing
theory, as mentioned in the literature review, is being used to build the hypothesis. When using the
posivitism philosophy, the researcher works with an ‘observable social reality’ (Remenyi et al., 1998, p.
32). According to Saunders et al. (2009) an existing theory is used to develop new hypothesis and
research strategy that is further tested and confirmed, which in turn develops the theory. According to
Gill and Johnson (2002), it is more likely for a research using the philosophy of positivism to use a more
structured methodology to ease replication. They are likelier to emphasize on quantitative data for
statistical analysis (Saunders et al., 2009). The researcher concentrates on applied functional research
so that different perspectives can be integrated to interpret the data.
3.4 Research Approach
There are two types of research approaches involving Inductive approach and Deductive approach. In
the case of an inductive approach data is accumulated and analysing this data contributes in developing
a theory as a result. However, one limitation in this case is, if the researcher does not have sufficient
knowledge of the research area, it might be difficult to build a hypothesis. In case of a deductive
approach, according to Robson (2002), a hypothesis is developed and tested using the research
strategy. This happens in five stages involving developing a hypothesis, operationalizing it by indicating
the variables and concepts to be measured, testing it and investigating the outcome therefore leading
to modification of existing theory (Saunders et al., 2009). It can be suggested that deduction might lead
to alternative theories that are within the structured design limits, deduction also helps in determining
17
causal relationships or correlations between variables using quantitative data (Saunders et al., 2009).
It can also be observed that deduction is connected to the philosophy of positivism.
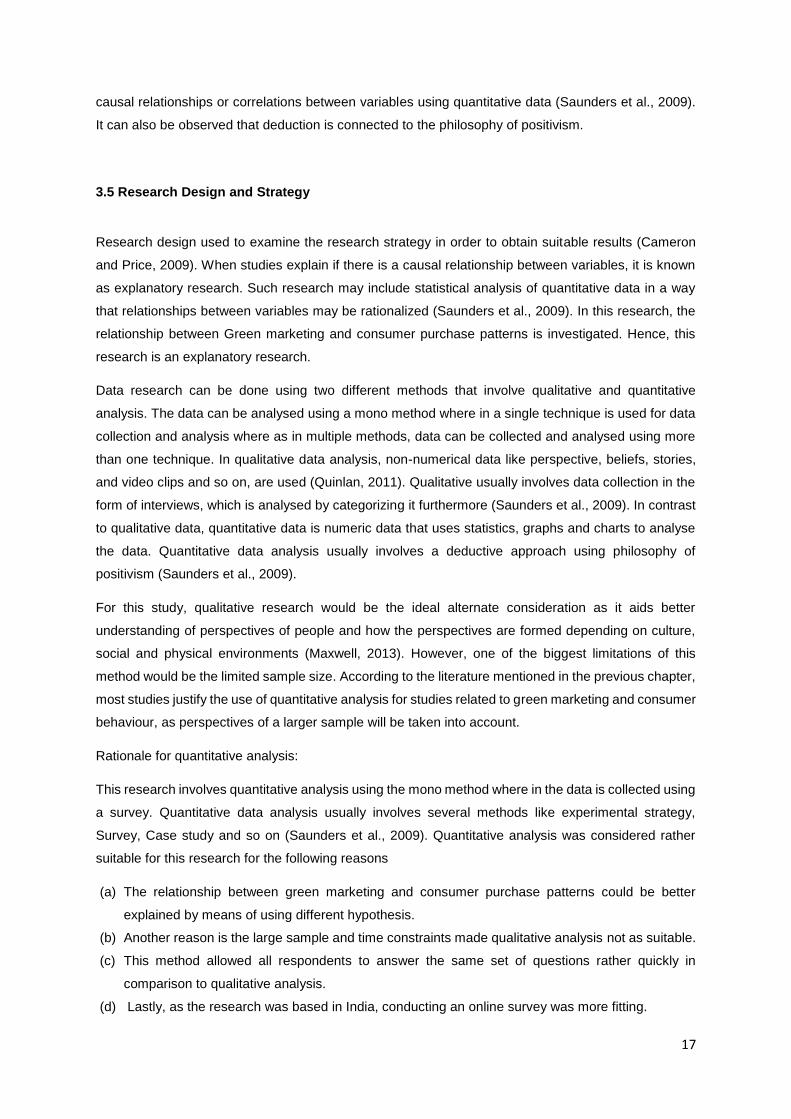
3.5 Research Design and Strategy
Research design used to examine the research strategy in order to obtain suitable results (Cameron
and Price, 2009). When studies explain if there is a causal relationship between variables, it is known
as explanatory research. Such research may include statistical analysis of quantitative data in a way
that relationships between variables may be rationalized (Saunders et al., 2009). In this research, the
relationship between Green marketing and consumer purchase patterns is investigated. Hence, this
research is an explanatory research.
Data research can be done using two different methods that involve qualitative and quantitative
analysis. The data can be analysed using a mono method where in a single technique is used for data
collection and analysis where as in multiple methods, data can be collected and analysed using more
than one technique. In qualitative data analysis, non-numerical data like perspective, beliefs, stories,
and video clips and so on, are used (Quinlan, 2011). Qualitative usually involves data collection in the
form of interviews, which is analysed by categorizing it furthermore (Saunders et al., 2009). In contrast
to qualitative data, quantitative data is numeric data that uses statistics, graphs and charts to analyse
the data. Quantitative data analysis usually involves a deductive approach using philosophy of
positivism (Saunders et al., 2009).
For this study, qualitative research would be the ideal alternate consideration as it aids better
understanding of perspectives of people and how the perspectives are formed depending on culture,
social and physical environments (Maxwell, 2013). However, one of the biggest limitations of this
method would be the limited sample size. According to the literature mentioned in the previous chapter,
most studies justify the use of quantitative analysis for studies related to green marketing and consumer
behaviour, as perspectives of a larger sample will be taken into account.
Rationale for quantitative analysis:
This research involves quantitative analysis using the mono method where in the data is collected using
a survey. Quantitative data analysis usually involves several methods like experimental strategy,
Survey, Case study and so on (Saunders et al., 2009). Quantitative analysis was considered rather
suitable for this research for the following reasons
(a) The relationship between green marketing and consumer purchase patterns could be better
explained by means of using different hypothesis.
(b) Another reason is the large sample and time constraints made qualitative analysis not as suitable.
(c) This method allowed all respondents to answer the same set of questions rather quickly in
comparison to qualitative analysis.
(d) Lastly, as the research was based in India, conducting an online survey was more fitting.
18
A survey is more commonly associated with the deductive approach. Surveys often in the form of
questionnaires helps in large amount of data collection, which helps in easy comparison, as the data is
very standardized. Usually, analysis of such quantitative data can be done with the help of descriptive
and inferential statistics (Saunders et al., 2009).
An electronically managed, self-administered questionnaire is used as a part of this research for the
purpose of data collection. In order to investigate the research aim and objectives, this research uses
modern, reliable and valid scales as part of the statistical measures. This research uses the survey
method as most of the previous studies as discussed in the literature review have used the same
approach. The benefit of using quantitative approach to analyse the impact of Green Marketing on
consumer purchase patterns and decision making in India is that views of more number of people can
be analysed.
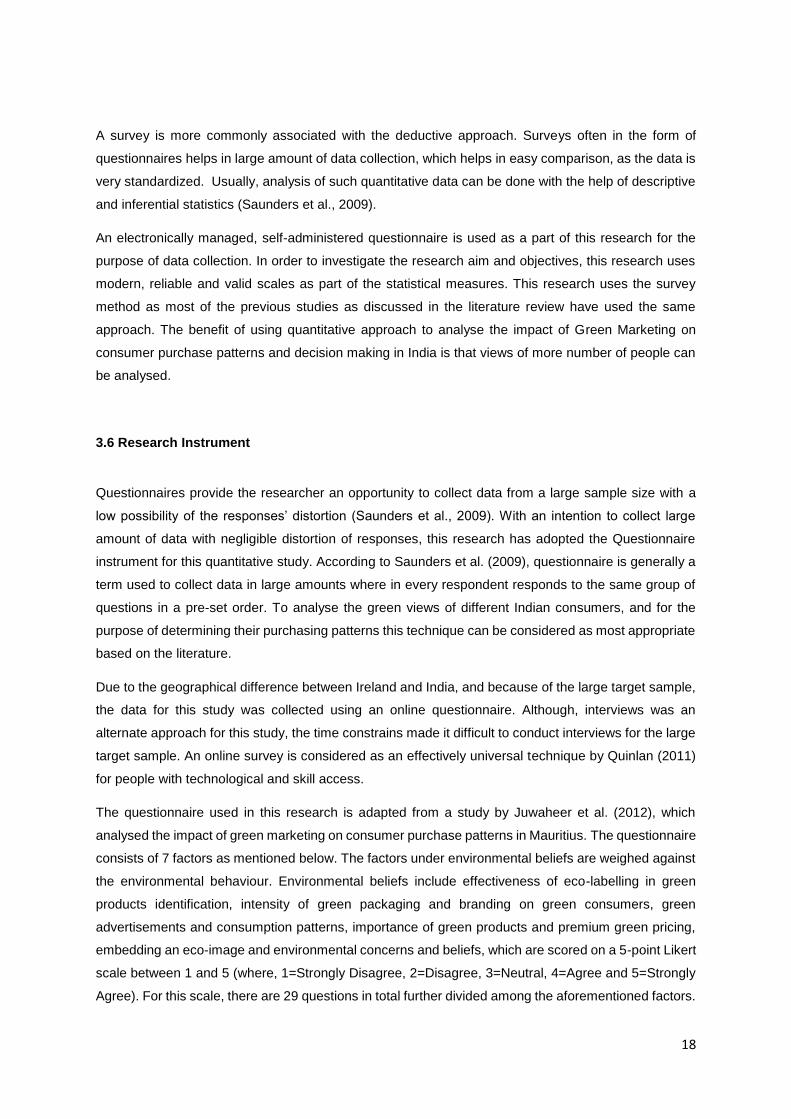
3.6 Research Instrument
Questionnaires provide the researcher an opportunity to collect data from a large sample size with a
low possibility of the responses’ distortion (Saunders et al., 2009). With an intention to collect large
amount of data with negligible distortion of responses, this research has adopted the Questionnaire
instrument for this quantitative study. According to Saunders et al. (2009), questionnaire is generally a
term used to collect data in large amounts where in every respondent responds to the same group of
questions in a pre-set order. To analyse the green views of different Indian consumers, and for the
purpose of determining their purchasing patterns this technique can be considered as most appropriate
based on the literature.
Due to the geographical difference between Ireland and India, and because of the large target sample,
the data for this study was collected using an online questionnaire. Although, interviews was an
alternate approach for this study, the time constrains made it difficult to conduct interviews for the large
target sample. An online survey is considered as an effectively universal technique by Quinlan (2011)
for people with technological and skill access.
The questionnaire used in this research is adapted from a study by Juwaheer et al. (2012), which
analysed the impact of green marketing on consumer purchase patterns in Mauritius. The questionnaire
consists of 7 factors as mentioned below. The factors under environmental beliefs are weighed against
the environmental behaviour. Environmental beliefs include effectiveness of eco-labelling in green
products identification, intensity of green packaging and branding on green consumers, green
advertisements and consumption patterns, importance of green products and premium green pricing,
embedding an eco-image and environmental concerns and beliefs, which are scored on a 5-point Likert
scale between 1 and 5 (where, 1=Strongly Disagree, 2=Disagree, 3=Neutral, 4=Agree and 5=Strongly
Agree). For this scale, there are 29 questions in total further divided among the aforementioned factors.

19
Therefore, the highest score would be 150 while the lowest score would be 29. In terms of the
environmental behaviour, there are 9 questions scored on a frequency scale between 1 and 4 (where,
1=Never, 2=Sometimes, 3=frequently and 4=Always). The highest score for this scale is 36 while the
lowest score is 9. Various socio-demographic factors like gender, age, education and place of residence
were considered using the Indian Census form.
A Pilot study was conducted by distributing the questionnaire to 12 individuals in order to ascertain the
understanding and generality of the questionnaire and to address any issues or concerns regarding the
questionnaire. As a result of this Pilot study, it was observed that the researcher needed to make a few
modifications to ensure correctness.
Q8. Effectiveness of eco-labelling and green products
identification
1. Eco-labels are eye catching on green products
2. Sufficient information is provided on eco-labels
3. I believe that eco-labels are easy to read
4. Green products are marketed to me in a way which I
really find engaging and relevant to my lifestyle
5. Information on eco-labels is accurate for green
products
6. It is easy for me to identify green products in India
Q9. Intensity of green packaging and branding for ecological
customers
1. I acknowledge that the information on packaging is
an important criterion
2. It is important to reuse or recycle the packaging after
use
3. Biodegradable packaging is an important
consideration for green customers
4. I feel good about buying brands which are less
damaging to the environment
5. I trust well-known green branded products in India
Q10. Environmental advertisement and green consumption
patterns
1. Green advertisements should promote environmental
friendly products in a credible manner
2. The content of environmental advertisements should
offer pertinent emotional relevance for green
customers
3. Attractive environmental advertisements will
encourage me to adopt green purchasing patterns
4. I acknowledge that environmental advertisements are
not exaggerated for green products in
India
Q11. Importance of green products and premium green pricing
1. I accept as true that a portion of the price for green
products goes to a worthy
environmental cause
2. I consider that green products are very important in
the context of India
3. I think that it is reasonable to pay a higher price for
products that are produced in
an ecological way
Q12. Embedding an eco-image in marketing of green products
Strongly
Disagree
Disagree
Neutral
Agree
Strongly
Agree

20
1. I share the opinion that the green products should
bear an eco-image in India
2. There should be more visibility in the way in which
green products are marketed in India
Q14. Environmental concerns and beliefs in India
1. The earth is approaching the limit the number of
people it can support
2. The balance of nature is very delicate and easily
upset
3. Human have the right to modify the natural
environment to suit their needs
4. The humans’ interference with nature often has
disastrous consequences
5. Plants and animals exist primarily to be used by
humans
6. Humans have to control industrial growth to maintain
a healthy economy
7. Human must live in harmony with nature in order to
survive
8. Human need to adapt to the natural environment
because they can remake it to suit their own needs
9. There are limits to which the industrialized society
can expand
10. Mankind is severely abusing the environment
Table 1: Environmental Beliefs – Questionnaire
Table 2: Environmental Behaviour – Questionnaire
Sample:
There are two types of techniques that can be used for sampling, namely, probability and non-probability
sampling. In probability sampling, interpretations are made from the sample concerning a population to
address the aim and objectives of the research following different rules in the sample selection
(Saunders et al., 2009). On the other hand, non-probability sampling uses alternative techniques for
sample selection based on the researcher’s subjective judgment (Saunders et al., 2009). For the
purpose of this research, non-probability sampling is used, in particular convenient sampling. In the
Q13. Environmental behaviour of consumers
1. Use of biodegradable soaps or detergents
2. Avoid buying aerosol products
3. Read labels to see if contents are environmentally
safe
4. Buy products made or packaged in recycled
materials
5. Buy products in packages that can be refilled
6. Avoid buying products from companies who are
environmentally responsible
7. Recycle bottles, cans or glass
8. Consumers taking their own bags to the
supermarket
9. Contribute money to environmental causes
Never Sometimes Frequently Always

21
case of convenient sampling, random selection is done to easily obtain the sample and the process is
carried on until the desired sample size is reached (Saunders et al., 2009). India is a developing country,
and the concept of green marketing is comparatively new, therefore a full target population using
probability sampling (alternate sampling method) could not be used. Since the research was associated
with buying behaviour of consumers with regard to green marketing, the participants included regular
supermarket visitors from different gender, age groups, education qualification and place of residence.
The gender was coded as Female=1 and Male=2. The age group was further divided into tertiles (18-
23=1, 23-38=2, and 39-62=3). The highest education level was divided into three and coded as
Intermediate=1, Graduate=2 and Masters=3. The place of residence was coded as Urban=1 and
Rural=2. To facilitate the research, 100 surveys were sent out to participants from Telangana State,
India, of which 80 complete responses were received.
3.7 Ethical Considerations
According to Saunders et al., (2009), the researchers should be responsible to protect the rights of all
individuals who are a part of their research. Ethical conduct is a combination of anonymity and
confidentiality of the participants involved in a research. Quinlan (2011) refers to anonymity and
confidentiality of the participants as a declaration by the researcher to protect their identity and data
keeping it private and confidential.
This research has thoroughly considered and followed all ethical guidelines stated by National College
of Ireland. This research involved quantitative data collection in the form of an online survey. For the
purpose of data safety, there was no documentation of names. The participants were informed that the
study is anonymous and their consent to participate in the survey was taken. The participants were also
informed that they could withdraw from the survey at any given time. The survey results were not
accessible to anyone but the researcher.
3.8 Data Analysis
The first segment of data analysis includes exporting the responses from Survey Monkey to Microsoft
Excel in order to code it as mentioned earlier. These coded responses are then exported to SPSS for
analysing the data.
Before analysing the data to address the research question, it is essential to analyse the internal
consistency of the questionnaire itself. The factors involving the environmental beliefs include
effectiveness of eco-labelling and green products identification, intensity of green packaging and
branding for ecological customers, environmental advertisement and green consumption patterns,
importance of green products and premium green pricing, embedding an eco-image in marketing of
green products and consumers’ perceptions on environmental concerns and beliefs in India. For this

22
research, the internal consistency of the different factors and scales namely, Environmental Beliefs and
Environmental behaviour were measured using the Cronbach’s alpha. The internal consistency is used
to measure the correlation of responses between the different questions of the questionnaire.
Cronbach’s alpha (>0.7) is considered as a reliable technique to measure the internal consistency of
questionnaires with multiple items (Gliem and Gliem, 2003). For this research, the Cronbach’s alpha
was calculated for all the factors (Table 3) and it was observed that while the Cronbach alpha for the
whole questionnaire was 0.826 which is greater than 0.7, making the questionnaire reliable, all the
factors individually did not have Cronbach’s alpha greater than 0.7. Detailed Cronbach’s alpha results
can be found in Appendix A.
Variable Cronbach’s alpha
Effectiveness of eco-labelling and green products identification .717
Intensity of green packaging and branding for ecological customers .752
Environmental advertisement and green consumption patterns .598
Importance of green products and premium green pricing .498
Embedding an eco-image in marketing of green products .838
Consumers’ perceptions on environmental concerns and beliefs .452
Environmental behaviour of consumers .807
Overall Questionnaire .826
Table 3: Test of internal consistency of the questionnaire
Following the internal consistency test, the composite scores for all the factors are calculated and used
for consequent analysis. The analysis for this research was done in 3 parts. The first part included
statistical tests for normality followed by tests of difference to check for significant associations. In order
to investigate the relationships between variables, the second part included the correlation analysis of
the factors and the third part involved regression analysis of the factors.
Test of Normality and Test of Difference:
To analyse the descriptive statistics, test of normality is done using the Shapiro-Wilk test and
distributions of histograms. Depending on the normality or the deviation from it, statistical tests on
different groups are carried out. The p value shows the significance level and for p<0.05, the null
hypothesis is rejected and for p>0.05, the null hypothesis is accepted.
There are two groups of statistical tests of difference, namely, parametric and non-parametric.
Parametric tests are used when the numerical data is normally distributed (Saunders et al., 2009). When
normality is assumed, parametric tests are done, therefore, to compare means, between two
independent groups assuming normality, Levene’s T-test for equal variance is done and to compare
means between k independent groups assuming normality, one-way ANOVA test is done. The
independent t-test compares the means between two groups using spread of scores as the measure.

23
If there is a low likelihood of difference between the two groups, it is represented using a large t statistic
where the p < 0.05 meaning it is statistically significant (Saunders et al., 2009). One-way analysis of
variance (ANOVA) test is used when the data is distributed in 3 or more groups. The variance is
analysed using ANOVA both within and between the groups by comparing the means. The F-ratio as a
result would represent the differences, and when there is a low likelihood of difference between groups,
F statistic is large with p<0.05 showing statistical significance (Saunders et al., 2009).
Non-parametric tests are used when the numerical data is not normally distributed (Saunders et al.,
2009). When deviation from normality is assumed, non-parametric tests are done. For difference
between two independent groups, where the data is not normally distributed, a Mann-Whitney U test is
appropriate. If there is low likelihood of difference between the two groups, a large U statistic along with
p<0.05 shows the statistical significance (Saunders et al., 2009). This test is non-parametric equivalent
of the parametric independent t-test (Saunders et al., 2009). Similarly, a Kruskal-Wallis H-test is done
for more than two independent groups.
Correlation Analysis
A bivariate correlation analysis for all the factors of environmental beliefs and environmental behaviour
to measure the relationship between the variables is done using Spearman’s rank order correlation, as
it is non-parametric. The Spearman’s rank order correlation is used to measure the level and strength
of the relationship between the variables (Saunders et al., 2009). The correlation coefficient (r) helps in
quantifying the strength of the relationship and lies between -1 and +1 (Saunders et al., 2009). The
figure 2 below shows the level of relationship on the basis of the r value. The p value shows the
statistical significance of the variables and if p<0.05 or in certain cases p<0.01 shows statistical
significance, therefore, the null hypothesis is rejected.
Figure 2: Correlation Coefficient values
Correlation and regression analysis are both used to analyse the relationships between variables,
however, correlation analysis shows the degree of association while regression analysis shows the
relationship between dependent and independent variables.
Regression Analysis
24
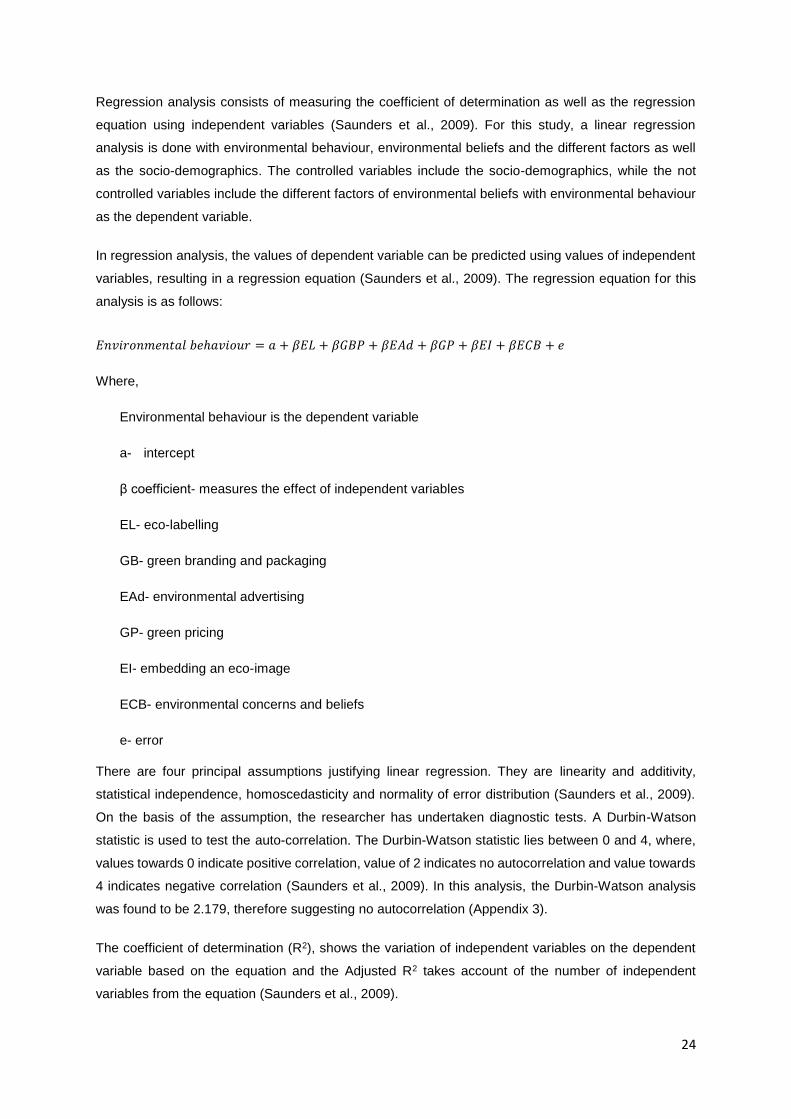
Regression analysis consists of measuring the coefficient of determination as well as the regression
equation using independent variables (Saunders et al., 2009). For this study, a linear regression
analysis is done with environmental behaviour, environmental beliefs and the different factors as well
as the socio-demographics. The controlled variables include the socio-demographics, while the not
controlled variables include the different factors of environmental beliefs with environmental behaviour
as the dependent variable.
In regression analysis, the values of dependent variable can be predicted using values of independent
variables, resulting in a regression equation (Saunders et al., 2009). The regression equation for this
analysis is as follows:
𝐸𝑛𝑣𝑖𝑟𝑜𝑛𝑚𝑒𝑛𝑡𝑎𝑙 𝑏𝑒ℎ𝑎𝑣𝑖𝑜𝑢𝑟 = 𝑎 + 𝛽𝐸𝐿 + 𝛽𝐺𝐵𝑃 + 𝛽𝐸𝐴𝑑 + 𝛽𝐺𝑃 + 𝛽𝐸𝐼 + 𝛽𝐸𝐶𝐵 + 𝑒
Where,
Environmental behaviour is the dependent variable
a- intercept
β coefficient- measures the effect of independent variables
EL- eco-labelling
GB- green branding and packaging
EAd- environmental advertising
GP- green pricing
EI- embedding an eco-image
ECB- environmental concerns and beliefs
e- error
There are four principal assumptions justifying linear regression. They are linearity and additivity,
statistical independence, homoscedasticity and normality of error distribution (Saunders et al., 2009).
On the basis of the assumption, the researcher has undertaken diagnostic tests. A Durbin-Watson
statistic is used to test the auto-correlation. The Durbin-Watson statistic lies between 0 and 4, where,
values towards 0 indicate positive correlation, value of 2 indicates no autocorrelation and value towards
4 indicates negative correlation (Saunders et al., 2009). In this analysis, the Durbin-Watson analysis
was found to be 2.179, therefore suggesting no autocorrelation (Appendix 3).
The coefficient of determination (R2), shows the variation of independent variables on the dependent
variable based on the equation and the Adjusted R2 takes account of the number of independent
variables from the equation (Saunders et al., 2009).

25
3.9 Limitations of research methodology
The first limitation of this methodology is that the questionnaire consisted of closed-ended questions,
which are easy for the respondents to answer but if a question is misinterpreted, the researcher is likely
to overlook it. The Cronbach’s alpha of some of the individual factors was not greater than 0.7 even
though the overall Cronbach’s alpha value was greater than 0.7, is a prominent limitation. The rural
sample is very small compared to the urban sample. Therefore, the conclusions drawn might not be
completely accurate due to the lack of sample size. Also, the 20% of non-respondents could have
influenced the insights of the research, therefore adding to the limitations. Another limitation is the
convenient sampling method, as the flaws in this method cloud the conclusions drawn from the sample,
therefore, possibly leading to incomplete conclusions.

26
4. Results
This chapter consists of the basic exploratory results, test of normality for all factors followed by the
parametric and non-parametric tests, results for correlations and the regression analysis. The
questionnaire received an 80% response rate with 80 participants.
4.1 Exploratory Results
An exploratory study was done and the frequency data is summarized in Table 4. The majority
participants were female (45%) compared to male (35%). The participants’ age ranged between 18 and
62 years. The mean, SE, 95% confidence interval and range for all of the factors is also presented in
the table below.
Table 4: Frequencies and Descriptive Statistics
Variable Frequency Valid % - - -
Categorical variables Gender
Female Male
45 35
56.3 43.8
Age 18-23 23-38 39-62
26 27 27
32.5 33.8 33.8
Highest Education Level attained Intermediate Graduate Masters
20 38 22
25
47.5 27.5
Place of Residence Urban Rural
69 11
86.3 13.8
Exploratory variables
M
SE
95% Confidence
Interval
Range
Effectiveness of eco-labelling and green products identification
20.86 0.33 20.19 - 21.52 14-29
Intensity of green packaging and branding for ecological customers
20.46 0.29 19.88 - 21.04 13-25
Environmental advertisement and green consumption patterns
15.38 0.22 14.94 - 15.83 6-20
Importance of green products and premium green pricing
11.23 0.20 10.81 -11.63 6-15
Embedding an eco-image in marketing of green products
8.23 0.13 7.96 - 8.51 2-10
Environmental concerns and beliefs in India
37.15 0.37 36.41 -37.89 30-49
Environmental behaviour of Consumers
23.21 0.52 22.17 -24.25 12-36

27
4.2 Tests of Normality and Difference
The summary of all results of the test of Normality for all factors based on Shapiro-Wilk is presented in
Table 5. The detailed case summary and descriptive results along with the normality results for
individual factors can be referred to in Appendix B.
From the table below, it can be observed that data for all the socio-demographic factors for eco-
labelling, age for green branding, gender and education for environmental behaviour appear to be
distributed normally (p>0.05) while for all of the remaining factors the data is deviated from normality
(p<0.05).
Table 5: Test of Normality (Shapiro-Wilk Test)
Variable Gender Age Education Place of Residence
Effectiveness of eco-labelling and green products identification
Normal Normal Normal Normal
Intensity of green packaging and branding for ecological customers
Deviated Normal Deviated Deviated
Environmental advertisement and green consumption patterns
Deviated Deviated Deviated Deviated
Importance of green products and premium green pricing
Deviated Deviated Deviated Deviated
Embedding an eco-image in marketing of green products
Deviated Deviated Deviated Deviated
Consumers’ perceptions on environmental concerns and beliefs
Deviated Deviated Deviated Deviated
Environmental behaviour of consumers
Normal Deviated Normal Deviated
*All normality tests are based on Shapiro-Wilk test
In the cases where there is lack of deviation from normality parametric tests like independent t test and
one-way ANOVA tests have been relied on, however, in the cases where there is deviation from
normality, non-parametric tests like Mann-Whitney U test and Kruskal-Wallis test have been considered
for each of the factors.

28
Effectiveness of eco-labelling and green products identification
Table 6 includes a summary of all independent t-test and ANOVA for all of the socio-demographic
variables. For full results, please refer Appendix C.
Table 6: Results of Independent t-test and ANOVA for eco-labelling
Demographic Variables
n Mean SD SE F Sig t Sig. (Two-tailed)
Gender .013 .911 -.285 .776
Female 45 20.77 3.06 .457
Male 35 20.97 2.93 .496
Age .247 .782
18-23 26 20.53 3.82
23-38 27 21.11 2.20
39-63
27 20.92 2.85
Education
1.756 .180
Intermediate 20 19.80 3.50
Graduate 38 21.13 2.88
Master 22 21.36 2.53
Place of residence
1.623 .206 1.474 .144
Urban 69 21.05 3.05 .365
Rural
11 19.63 2.33 .704
Gender:
The Levene’s Test for equal variance (F=.013, p=.911) specifies that there is not enough evidence to
reject the assumption of equal variances, hence, equal variances can be assumed. The result of the
independent t-test states that there is insufficient evidence that perception of Female participants
(M=20.77, SD=3.06, SE=.457, n=45) and Male participants (M=20.97, SD=2.93, SE=.496, n=35) is
different (t(78) = -.285, p=.776).

29
Age:
Based on the ANOVA results (F=.247, p=.782) from Table 6, it can be observed that there are no
significant differences between age group 18-23 (M=20.53, SD=3.82), 23-38 (M=21.11, SD=2.20) and
39-62 (M=20.92, SD=2.85).
Education:
Based on the ANOVA results (F=1.756, p=.180), it can be observed that there are no significant
differences between Education level of participants, Intermediate (M=19.80, SD=3.50), Graduate
(M=21.13, SD=2.88) and Masters (M=21.36, SD=2.53).
Place of Residence:
The Levene’s Test for equal variance (F=1.623, p=.206) specifies that there is not enough evidence to
reject the assumption of equal variances, hence, equal variances can be assumed. The result of the
independent t-test states that there is insufficient evidence that perception of Urban participants
(M=21.05, SD=3.05, SE=.367, n=69) and Rural participants (M=19.63, SD=2.33, SE=.704, n=11) is
different (t(78) = 1.474, p=.144) as shown in Tables 6.
Intensity of green packaging and branding for ecological customers
Table 7 includes a summary of all Mann-Whitney U test, ANOVA and Kruskal-Wallis test for all of the
socio-demographic variables. For full results, please refer Appendix D.
Gender:
The Mann-Whitney U test shows that there is no statistical significant difference of perception among
female and male participants with mean ranks of 41.86 and 38.76 respectively (U=726.500, p=.549).
Age:
Based on the ANOVA results (F=2.352, p=.102) from Table 7, it can be observed that there are no
significant differences between age group 18-23 (M=21.30, SD=2.37), 23-38 (M=19.81, SD=3.13) and
39-62 (M=20.29, SD=1.99).
Education:
The Kruskal-Wallis test (X2 (2)= .784, p=.676) from Table 7, shows that there is no statistical significant
difference between the participants of different education level, Intermediate (M rank=37.03), Graduate
(M rank= 40.72) and Masters (M rank =43.27).
Place of residence:
The Mann-Whitney U test suggests that there is a statistical significance in difference of perception
among urban and rural participants with mean ranks of 43.32 and 22.82 respectively (U=185.000,
p=.006).

30
Table 7: Results of Mann-Whitney U-test, Kruskal-Wallis test and ANOVA for green branding
Demographic Variables
n Mean SD Mean Rank
F Sig U X2(2) Sig. (Two-tailed)
Gender 726.500 .549
Female 45 41.86
Male 35 38.76
Age 2.352 .102
18-23 26 21.30 2.37
23-38 27 19.81 3.13
39-63
27 20.29 1.99
Education
.784 .676
Intermediate 20 37.03
Graduate 38 40.72
Master 22 43.27
Place of residence
185.000 .006
Urban 69 43.32
Rural
11 22.82
Environmental advertisement and green consumption patterns
Table 8 includes a summary of all Mann-Whitney and Kruskal-Wallis test for all of the socio-
demographic variables. For full results, please refer Appendix E.
Gender:
The Mann-Whitney U test (Table 8) shows that there is no statistical significance in difference of
perception among female and male participants with mean ranks of 39.97 and 42.47 respectively
(U=718.000, p=.494).
Age: The Kruskal-Wallis test (X2 (2)= 1.173, p=.556) from Table 8, shows that there is no statistical
significant difference between the participants of different age groups, 18-23 (M rank=38.90), 23-38 (M
rank= 38.20) and 39-62 (M rank =44.33).

31
Table 8: Results of Mann-Whitney U-test and Kruskal-Wallis test for environmental advertising
Demographic Variables
n Mean Rank U X2(2) Sig. (Two-tailed)
Gender 718.000 .494
Female 45 39.97
Male 35 42.47
Age 1.173 .556
18-23 26 38.90
23-38 27 38.20
39-63
27 44.33
Education
1.247 .536
Intermediate 20 35.68
Graduate 38 42.58
Master 22 41.30
Place of residence
362.000 .803
Urban 69 40.25
Rural
11 42.09
Education:
The Kruskal-Wallis test (X2 (2)= 1.247, p=.536) from Table 8, shows that there is no statistical significant
difference between the participants of different education level, Intermediate (M rank=35.68), Graduate
(M rank= 42.58) and Masters (M rank =41.30).
Place of Residence:
The Mann-Whitney U test (Table 8) shows that there is no statistical significance in difference of
perception among urban and rural participants with mean ranks of 40.25 and 42.09 respectively
(U=362.000, p=.803).

32
Importance of green products and premium green pricing
Table 9 includes a summary of all Mann-Whitney and Kruskal-Wallis test for all of the socio-
demographic variables. For full results, please refer Appendix F.
Table 9: Results of Mann-Whitney U-test and Kruskal-Wallis test for green pricing
Demographic Variables
n Mean Rank U X2(2) Sig. (Two-tailed)
Gender 783.500 .968
Female 45 40.59
Male 35 40.39
Age 3.680 .159
18-23 26 41.62
23-38 27 34.11
39-63
27 45.81
Education
1.801 .406
Intermediate 20 34.60
Graduate 38 42.53
Master 22 42.36
Place of residence
184.000 .005
Urban 69 43.33
Rural
11 22.73
Gender:
The Mann-Whitney U test suggests that there is no statistical significance in difference of perception
among female and male participants with mean ranks of 40.59 and 40.39 respectively (U=783.500,
p=.968).
Age:
The Kruskal-Wallis test (X2 (2)= 3.680, p=.159), shows that there is no statistical significant difference
between the participants of different age groups, 18-23 (M rank=41.62), 23-38 (M rank= 34.11) and
39-62 (M rank =45.81).
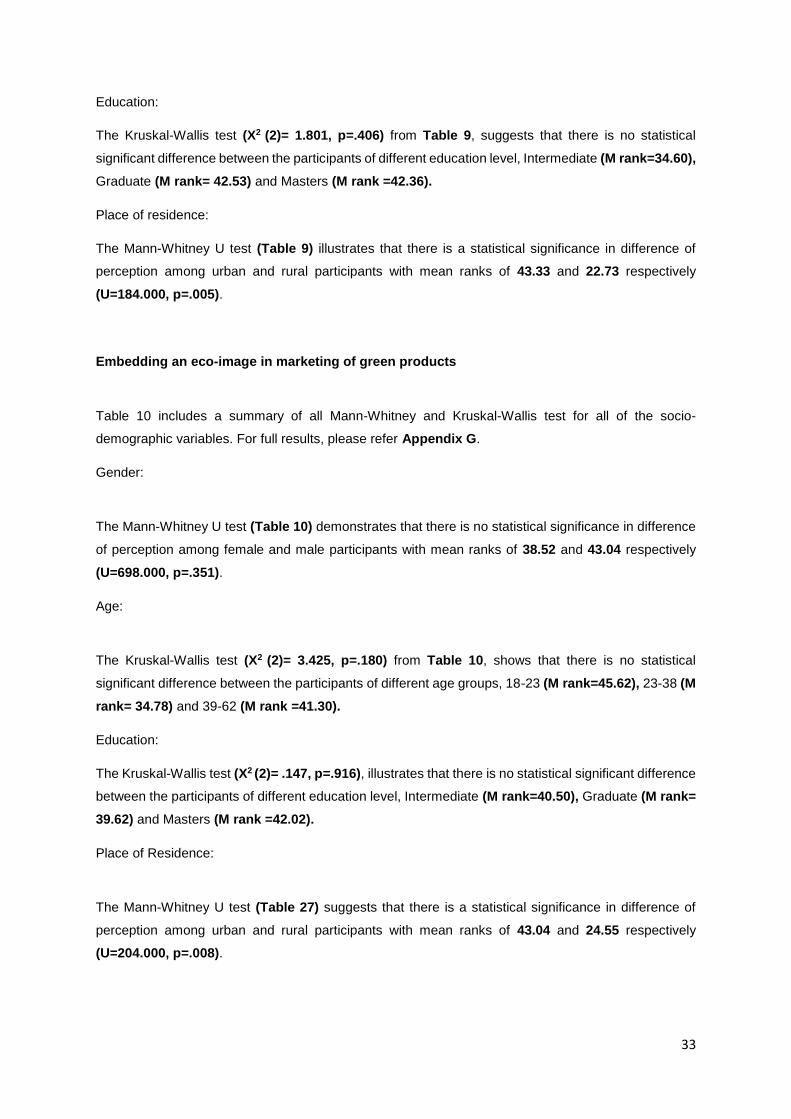
33
Education:
The Kruskal-Wallis test (X2 (2)= 1.801, p=.406) from Table 9, suggests that there is no statistical
significant difference between the participants of different education level, Intermediate (M rank=34.60),
Graduate (M rank= 42.53) and Masters (M rank =42.36).
Place of residence:
The Mann-Whitney U test (Table 9) illustrates that there is a statistical significance in difference of
perception among urban and rural participants with mean ranks of 43.33 and 22.73 respectively
(U=184.000, p=.005).
Embedding an eco-image in marketing of green products
Table 10 includes a summary of all Mann-Whitney and Kruskal-Wallis test for all of the socio-
demographic variables. For full results, please refer Appendix G.
Gender:
The Mann-Whitney U test (Table 10) demonstrates that there is no statistical significance in difference
of perception among female and male participants with mean ranks of 38.52 and 43.04 respectively
(U=698.000, p=.351).
Age:
The Kruskal-Wallis test (X2 (2)= 3.425, p=.180) from Table 10, shows that there is no statistical
significant difference between the participants of different age groups, 18-23 (M rank=45.62), 23-38 (M
rank= 34.78) and 39-62 (M rank =41.30).
Education:
The Kruskal-Wallis test (X2 (2)= .147, p=.916), illustrates that there is no statistical significant difference
between the participants of different education level, Intermediate (M rank=40.50), Graduate (M rank=
39.62) and Masters (M rank =42.02).
Place of Residence:
The Mann-Whitney U test (Table 27) suggests that there is a statistical significance in difference of
perception among urban and rural participants with mean ranks of 43.04 and 24.55 respectively
(U=204.000, p=.008).

34
Table 10: Results of Mann-Whitney U-test and Kruskal-Wallis test for eco-image
Demographic Variables
n Mean Rank U X2(2) Sig. (Two-tailed)
Gender 698.500 .351
Female 45 38.52
Male 35 43.04
Age 3.425 .180
18-23 26 45.62
23-38 27 34.78
39-63
27 41.30
Education
.147 .916
Intermediate 20 40.50
Graduate 38 39.62
Master 22 42.02
Place of residence
204.000 .008
Urban 69 43.04
Rural
11 24.55
Consumers’ perceptions on environmental concerns and beliefs
Table 11 includes a summary of all Mann-Whitney and Kruskal-Wallis test for all of the socio-
demographic variables. For full results, please refer Appendix H.
Gender:
The Mann-Whitney U test (Table 11) shows that there is no statistical significance in difference of
perception among female and male participants with mean ranks of 37.81 and 41.69 respectively
(U=673.500, p=.450).

35
Table 11: Results of Mann-Whitney U-test and Kruskal-Wallis test for environmental concerns
Demographic Variables
n Mean Rank U X2(2) Sig. (Two-tailed)
Gender 673.500 .450
Female 44 37.81
Male 34 41.69
Age 2.613 .271
18-23 26 43.37
23-38 26 33.79
39-63
26 41.35
Education
.660 .719
Intermediate 20 35.98
Graduate 37 40.65
Master 21 40.83
Place of residence
296.500 .298
Urban 67 40.57
Rural
11 32.95
Age:
The Kruskal-Wallis test (X2 (2)= 2.613, p=.271) from Table 11, shows that there is no statistical
significant difference between the participants of different age groups, 18-23 (M rank=43.37), 23-38 (M
rank= 33.79) and 39-62 (M rank =41.35).
Education:
The Kruskal-Wallis test (X2 (2)= .660, p=.719) illustrates that there is no statistical significant difference
between the participants of different education level, Intermediate (M rank=35.98), Graduate (M rank=
40.65) and Masters (M rank =40.83).

36
Place of Residence:
The Mann-Whitney U test (Table 11) shows that there is no statistical significance in difference of
perception among urban and rural participants with mean ranks of 40.57 and 32.95 respectively
(U=296.500, p=.298).
Environmental behaviour of consumers
Table 12 includes a summary of all independent t-test, ANOVA, Mann-Whitney and Kruskal-Wallis test
for all of the socio-demographic variables. For full results, please refer Appendix I.
Table 12: Results of independent t-test, ANOVA, Kruskal-Wallis test and Mann-Whitney U-test for environmental behaviour
Demographic Variables
n Mean
SD SE Mean Rank
t F Sig U X2(2) Sig. (Two-tailed)
Gender 2.239 .001 .978 .022
Female 44 24.27 4.51 .680
Male 35 21.88 4.53 .766
Age .404 .817
18-23 26 40.75
23-38 27 37.78
39-63
26 41.56
Education
.012 .989
Intermediate
20 23.30 3.81
Graduate 37 23.24 5.28
Master 22 23.09 4.38
Place of residence
367.000 .921
Urban 69 39.90
Rural
11 40.64
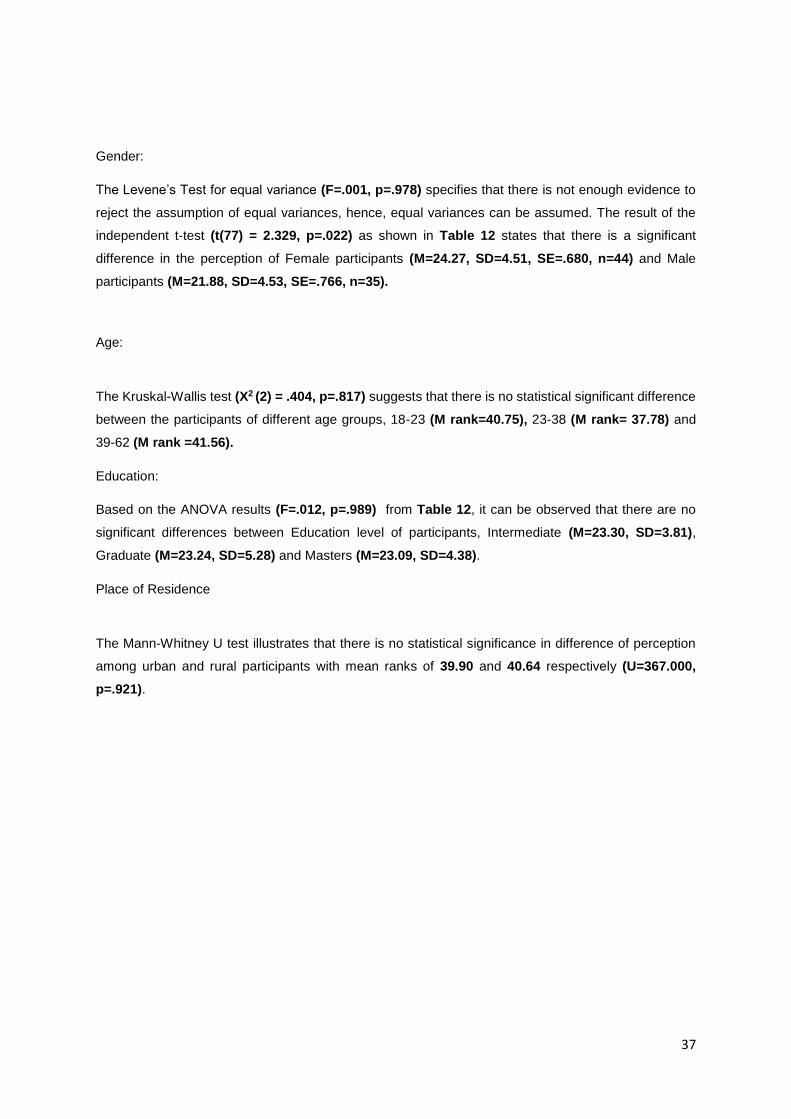
37
Gender:
The Levene’s Test for equal variance (F=.001, p=.978) specifies that there is not enough evidence to
reject the assumption of equal variances, hence, equal variances can be assumed. The result of the
independent t-test (t(77) = 2.329, p=.022) as shown in Table 12 states that there is a significant
difference in the perception of Female participants (M=24.27, SD=4.51, SE=.680, n=44) and Male
participants (M=21.88, SD=4.53, SE=.766, n=35).
Age:
The Kruskal-Wallis test (X2 (2) = .404, p=.817) suggests that there is no statistical significant difference
between the participants of different age groups, 18-23 (M rank=40.75), 23-38 (M rank= 37.78) and
39-62 (M rank =41.56).
Education:
Based on the ANOVA results (F=.012, p=.989) from Table 12, it can be observed that there are no
significant differences between Education level of participants, Intermediate (M=23.30, SD=3.81),
Graduate (M=23.24, SD=5.28) and Masters (M=23.09, SD=4.38).
Place of Residence
The Mann-Whitney U test illustrates that there is no statistical significance in difference of perception
among urban and rural participants with mean ranks of 39.90 and 40.64 respectively (U=367.000,
p=.921).

38
4.3 Correlations
Table 13 represents a summary of the correlation between the distinct factors of environmental beliefs
and environmental behaviour using spearman’s rho. It can be noted that there are distinct shifts in both
the R values and p values, even though the correlation in most cases remains positive but weak. The
detailed correlation analysis for each of the factors can be referred to in Appendix J.
Table 13: Correlations between factors of environmental beliefs and environmental behaviour
Variables
R
Sig.
Effectiveness of eco-labelling and green products identification .250* .027
Intensity of green packaging and branding for ecological customers .318** .004
Environmental advertisement and green consumption patterns .120 .291
Importance of green products and premium green pricing .365** .001
Embedding an eco-image in marketing of green products .065 .572
Consumers’ perceptions on environmental concerns and beliefs .026 .819
All correlations are made with environmental behaviour as dependent variable using spearman’s rho. (**Correlation is significant at 0.01 and *Correlation is significant at 0.05)
In the case of the correlation between effectiveness of eco-labelling and green product identification
and environmental behaviour, it can be observed that there is a very weak positive correlation between
the variables (R=.250), however, it is statistically significant (p=.027). Similarly, correlation between
importance of green products and premium green pricing and the environmental behaviour is positive
but weak and statistically significant (R=.365, p=.001). In the case of green branding, correlation is
significant at 0.01. So, considering the correlation between intensity of green packaging and branding
and the environmental behaviour, a statistically significant and positive weak correlation can be found
(R=.318, p=.004). There is no correlation or statistical significance between embedding an eco-image
in marketing of green products (R=.065, p=.572), green advertisements (R=.120, p=.291) or
consumers’ perceptions on environmental concerns and beliefs (R=0.26, p=.819) and environmental
behaviour.
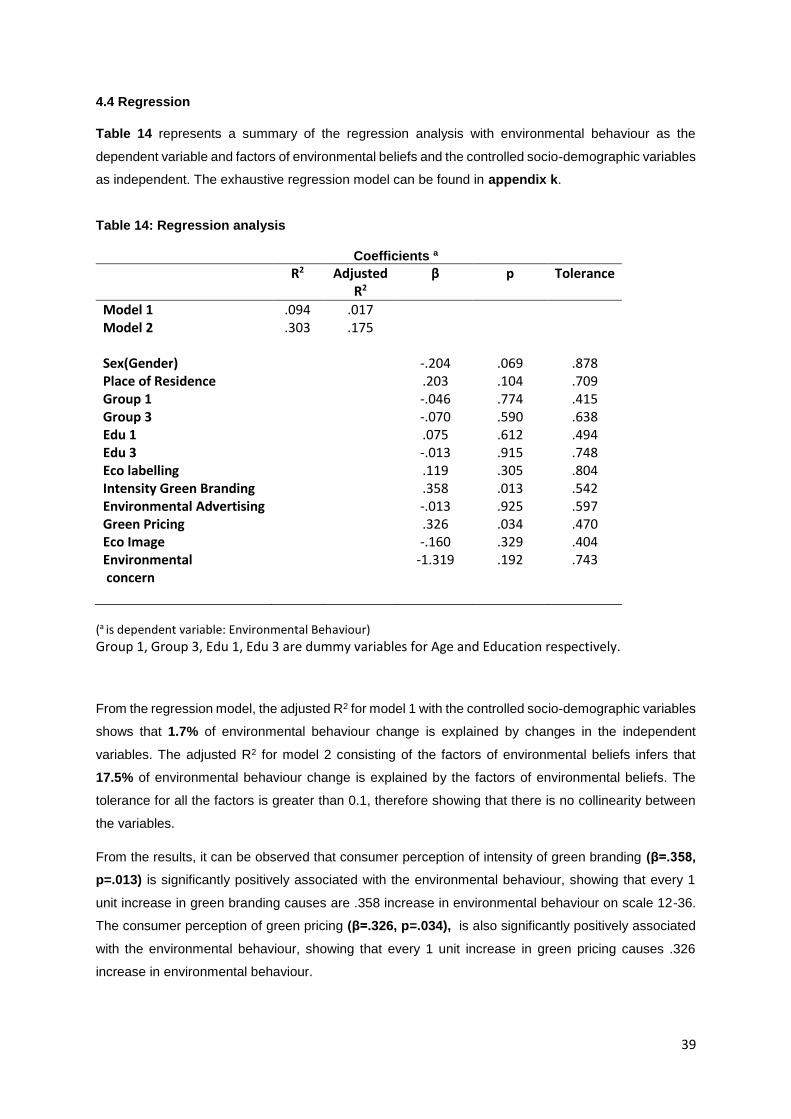
39
4.4 Regression
Table 14 represents a summary of the regression analysis with environmental behaviour as the
dependent variable and factors of environmental beliefs and the controlled socio-demographic variables
as independent. The exhaustive regression model can be found in appendix k.
Table 14: Regression analysis
Coefficients a
R2 Adjusted R2
β p Tolerance
Model 1 .094 .017 Model 2 .303 .175 Sex(Gender) -.204 .069 .878 Place of Residence .203 .104 .709 Group 1 -.046 .774 .415 Group 3 -.070 .590 .638 Edu 1 .075 .612 .494 Edu 3 -.013 .915 .748 Eco labelling .119 .305 .804 Intensity Green Branding .358 .013 .542 Environmental Advertising -.013 .925 .597 Green Pricing .326 .034 .470 Eco Image -.160 .329 .404 Environmental concern
-1.319 .192 .743
(a is dependent variable: Environmental Behaviour)
Group 1, Group 3, Edu 1, Edu 3 are dummy variables for Age and Education respectively.
From the regression model, the adjusted R2 for model 1 with the controlled socio-demographic variables
shows that 1.7% of environmental behaviour change is explained by changes in the independent
variables. The adjusted R2 for model 2 consisting of the factors of environmental beliefs infers that
17.5% of environmental behaviour change is explained by the factors of environmental beliefs. The
tolerance for all the factors is greater than 0.1, therefore showing that there is no collinearity between
the variables.
From the results, it can be observed that consumer perception of intensity of green branding (β=.358,
p=.013) is significantly positively associated with the environmental behaviour, showing that every 1
unit increase in green branding causes are .358 increase in environmental behaviour on scale 12-36.
The consumer perception of green pricing (β=.326, p=.034), is also significantly positively associated
with the environmental behaviour, showing that every 1 unit increase in green pricing causes .326
increase in environmental behaviour.
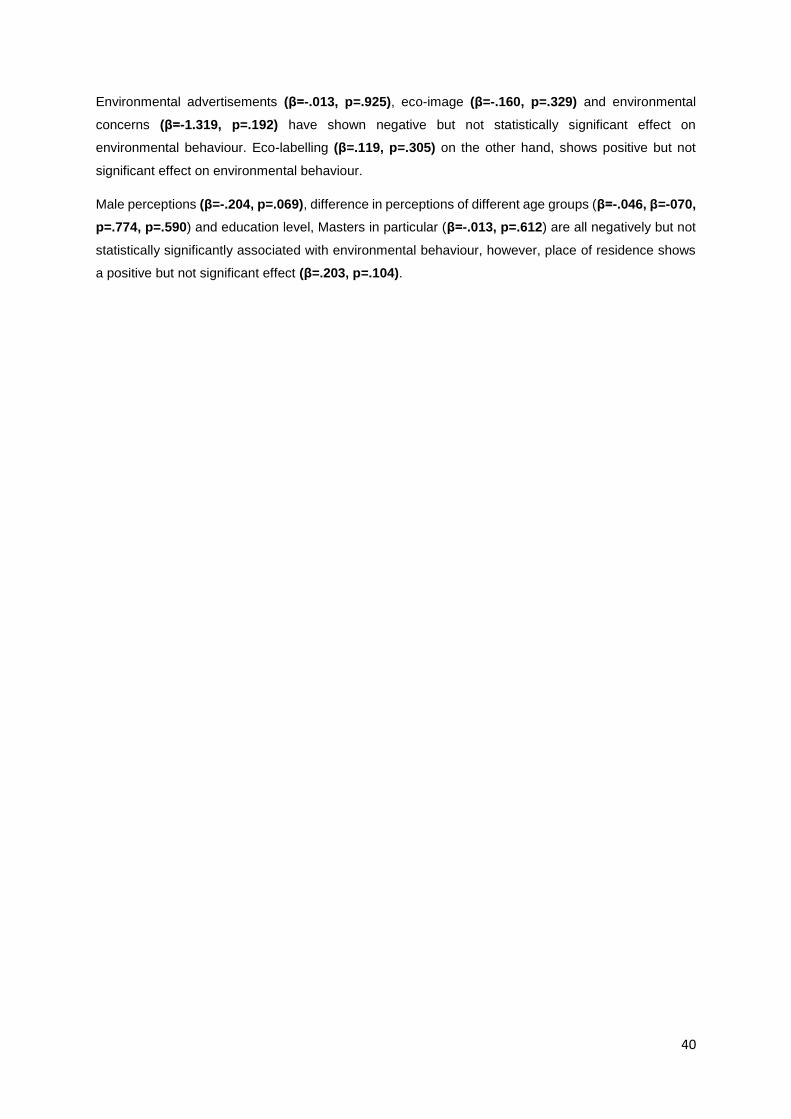
40
Environmental advertisements (β=-.013, p=.925), eco-image (β=-.160, p=.329) and environmental
concerns (β=-1.319, p=.192) have shown negative but not statistically significant effect on
environmental behaviour. Eco-labelling (β=.119, p=.305) on the other hand, shows positive but not
significant effect on environmental behaviour.
Male perceptions (β=-.204, p=.069), difference in perceptions of different age groups (β=-.046, β=-070,
p=.774, p=.590) and education level, Masters in particular (β=-.013, p=.612) are all negatively but not
statistically significantly associated with environmental behaviour, however, place of residence shows
a positive but not significant effect (β=.203, p=.104).

41
5. Discussion
5.1 Introduction
This chapter will present a discussion of the key findings with the literature of the research topic and
explore if the findings fit with the previous researches. This chapter will also include the implications of
the study, suggestions for further research and limitations of the study.
This overall research aim for this paper was to investigate the impact of green marketing on the green
purchasing behaviour of consumers. As discussed earlier, the area of green marketing has been gaining
momentum especially in developing nations like India, so knowing about green perceptions of
consumers would be interesting to build better green marketing strategies. To understand what
influences consumers’ environmental behaviour, for this research, a regression model was made using
the environmental belief factors and socio-demographic variables. The study was concentrated on the
Telangana region in India, where green marketing is becoming more popular and there is a rise in
awareness among people. Apart from the regression model, to analyse the supportive objectives,
descriptive analysis along with correlation analysis using Spearman’s rho was undertaken.
5.2 Intensity of green packaging and branding for ecological customers
The primary objective of the research was to investigate the direction and strength of the relationship
between the six distinct environmental belief factors and environmental behaviour, while controlling for
key socio-demographic factors. The first key finding was that the perception of green packaging and
branding has a significant and positive effect on the environmental behaviour of consumers. Some of
the underlying questions of the factor measure how good the consumers feel about buying green brands
and how they trust well-known brands in India and whether biodegradable packaging is an important
consideration for them or if they believe in reusing and recycling the products they buy. From the
response frequencies for all of these questions, it was found that most of them agree and strongly agree
to these underlying questions. This means that increase in green branding would lead to an increase in
environmental behaviour in turn increasing the green purchases. In the sense, from the response
frequencies for environmental behaviour, it is found that majority of the people buy biodegradable
products, they also but products that can be re-used. This forms a direct link between the two factors.
Another finding from supporting objectives of the study shows that there is a weak but positive
correlation between consumers’ perception of green branding and their environmental behaviour. It was
also found that there are associations with green branding on the basis of consumers’ place of
residence and a significant difference in their mean scores were found. The mean score for the urban
consumers was almost double the score of rural consumers.
The green buying behaviour of consumers from the past literature shows that consumers’ perceptions
of green branding is affecting their green buying behaviour. Aaker (1991) identified brand awareness,

42
associations and quality perception as key factors influencing consumer’s behaviour. On the basis of a
conceptual framework, it was suggested that the literature supports that the brand benefits accounts as
an encouraging factor for green purchases, therefore influencing consumer’s environmental behaviour
(Cherain and Jacob, 2012). On exploring the functional attributes by means of a quantitative analysis,
it was found that there is also a positive effect on the brand because of consumers’ perception of green
brand positioning (Patrick et al., 2005). Based on a quantitative study, using regression analysis, with
a sample of women who were frequent visitors of supermarkets in London, it was found that brands can
influence consumer behaviour towards ecological product consumption (Pickett-Baker and Ozaki,
2008). Therefore, it can be inferred that the current findings for green branding are in line with the
previous literature findings, however, the demographic significance about change in urban and rural
perceptions is the an additional finding in this study compared to others.
Future work should concentrate on a larger sample spread across different urban and rural locations to
add more insight to the generalisability of the current findings. The results from this study point towards
policy implications such as increase in government funding as there is a direct significant and positive
link of green branding on consumer behaviour. India is predicted to be in the top third ranks of growing
economies and manufacturing destinations, most likely by the year 2020 (Make in India). Additional
government funding on brands that use green manufacturing methods could be beneficial and probably
lead to even further growth. Green branding should also be further concentrated upon in terms of
corporate marketing strategies as this can be termed as a driver of green purchases. The findings from
this study suggest that there was a major difference in the urban and rural perceptions, so investment
of potential money in the rural area to increase the market segment there would be a rational option.
5.3 Importance of green products and premium green pricing
In support of the primary research objective, another key finding is that there is a significantly positive
effect of consumer perception about the importance of green products and premium green pricing and
the environmental behaviour of the consumers. Some of the underlying questions of the importance of
green products and premium green pricing factor include the perception of consumers about how
important they consider green products, how strongly they believe that a portion of the price of green
products is used for a worthy environmental cause, and whether they think it is reasonable to pay higher
for green products. The response frequencies by majority of them in the case of importance of green
products was agree and strongly agree, however, in terms of the price-related questions, majority of
the urban consumers responded positively while most rural consumers disagreed. This entails that
green pricing has a direct link to the environmental behaviour of consumers, thus adding to the green
purchases. The findings from the sub-objectives show that there is a significant positive correlation
between green pricing and the environmental behaviour of consumers, nevertheless, there was a
significant difference in consumer perceptions of people from urban and rural areas. While consumers
from both the locations were influenced by green pricing, the mean scores of urban consumers was
found to be about double than that of the rural consumers.

43
The literature states that consumers can be influenced to pay a premium price by showing them the
additional benefits of eco-friendly products, such as quality, ecologically safe, non-hazardous, more
efficient and so on, therefore increasing green purchases (Renfro, 2010). Khare et al. (2013), conducted
a quantitative study on 6 cities in India using a sample of 500 participants, where in it was observed
that Indian consumers’ green attitude was influenced by the brand and price of the product (Khare et
al., 2013). The scale used in the previous study was adapted by Lee (2009), while this research adopts
the scale from Juwaheer et al. (2012), which is fairly new and constructed keeping in mind a developing
economy (Mauritius). Effective marketing strategies influence consumers to pay a premium price for
green products therefore increasing green purchase patterns of consumers (Ottman, 1998). It can be
seen that the findings of the research for green pricing are in support of the previous literature and show
interesting comprehension of Indian consumers like how green products are important to them and how
their environmental behaviour is impacted by green brands and pricing. Also, on the basis of the
literature, it can be noted that the Indian market for green consumers is marginally underexploited
(Khare, 2014), green brands and importance of green products and premium green pricing should be
made use of in marketing strategies and so on for increasing green purchases.
5.4 Effectiveness of eco-labelling and green products identification
From the results, it was found that consumer perception of eco-labelling has a positive effect on the
green purchasing behaviour, but there was not enough evidence from the sample size to show the
statistical significance of this effect. It can also be inferred from the results that there is a positively
significant correlation between the effectiveness of eco-labelling and identification of green products
and the environmental behaviour of consumers. However, there was no significant difference in
perceptions across the socio-demographics.
Preceding literature in this area has identified contradictory views in general where some researchers
have stated that green purchases are not driven by eco-labels while others have stated that eco-labels
do attract consumers therefore influencing their green purchases (Leire and Thidell, 2005 and Cherion
and Jacob, 2012). Both of these studies, however were based on reviewing literature using different
frameworks, while Cherion and Jocob (2012), used a conceptual framework, Leire and Thidell (2005)
used a Nordic framework. The findings from the current research support that green purchases are
positively impacted by eco-labelling but its statistical significance could not be stated.
5.5 Environmental advertisement and green consumption patterns
Environmental advertisement and green consumption patterns have been identified to be one of the
contributing factors to consumers’ attitude and behaviour by some previous literature while others have
44
proved contradicting results showing that consumers were influenced by green advertisements but did
not have a resulting impact on their behaviour (Lutz, 1985 and Chase and Smith, 1992). While Lutz
(1985), used a conceptual framework, Chase and Smith (1992), used a quantitative study where 70%
of the respondents did not find messages in these advertisements very influencing while over 50% of
them did not pay enough attention to these messages as according to them, they lacked credibility.
Pooley and O’Connor (2000), have added to this by reporting that green messages do not necessarily
inspire a positive green attitude in consumers. The findings from this research have shown that
environmental advertisements and eco-image have a negative effect on environmental behaviour of
consumers, however, this result was not statistically significant. From the response frequency, it was
found that consumers feel that environmental advertisements should be presented in credible manner,
but about 70% of the respondents feel that these environmental advertisements are exaggerated. It is
interesting that despite the finding that green branding drives green purchase behaviour, green
advertisements don’t influence green purchases positively. It can be observed that the findings of the
research partially support the aforementioned literature as it can be concluded that environmental
advertisements don’t impact the behaviour of consumers in a way that adds to the green purchases.
5.6 Consumers’ perceptions on environmental concerns and beliefs
Consumers’ perceptions on environmental concerns and beliefs and its impact on green buying
behaviour has been a widely studied area with results varying depending on the place, culture and
ethics. Empirical studies on developed nations showed positive findings but the drivers varied for each
nation while for most of the developing nations, the primary driver of green purchases was found to be
environmental concerns and beliefs of consumers. McKinsey (2007), conducted a survey in which it
was found that 87% of men and women, from different developing nations like Brazil, India, China and
developed nations like, Canada, UK, France and the US have inclined themselves in decreasing their
negative impact on the ecosystem (McKinsey, 2007). In the case of India, Singh and Pandey found
results that are contradictory to other studies. Using a comprehensive literature review, it was found
that Indian consumers lacked brand awareness of green products which did not fit with their concerns
and beliefs (Singh and Pandey, 2012). On the other hand, another study based on a conceptual
framework stated that there is awareness amongst consumers which is encouraging green behaviour
(Mishra and Sharma, 2010). The findings from the current research point that Indian consumers are
aware but their environmental concerns and beliefs do not increase their environmental behaviour,
which is a combination of the two contradictory studies. It was found that environmental concerns had
no correlation with environmental behaviour, however, it had a negative effect on environmental
behaviour. But, because of the small sample size, the finding was not statistically significant. Although
this study has bridged the gap in the Indian context to an extent, future work could contemplate this
relationship with a different and bigger sample size spread across India as the results may be different
based on the locations as well.

45
5.7 Future Research
The future research could take a new approach to this study by using mixed approach using survey to
collect the quantitative data complemented with qualitative data by means of in-depth interviews, to
study the drivers of green consumer behaviour like green branding and premium green pricing, over a
period of time. Studies could be undertaken to identify why green advertising has a negative impact on
environmental behaviour of consumers even though green branding has found to have a positive impact
on the same. According to Jankowicz (2005), using multiple methods research design is a better way
of getting more accurate results. Questionnaires can be complemented with either semi-structured or
in-depth interviews giving more detailed and accurate results. The research can also be concentrated
more on the socio-demographic front, especially the Urban versus Rural perceptions, as this study
showed many interesting results with regard to the same.
5.8 Limitations
This research has provided interesting insights on the impact of green marketing on consumer purchase
patterns in India, nonetheless, there are certain limitations of this study. One of the fundamental
limitations of the study includes the limited sample size especially the rural sample, which would give a
better understanding about consumer perception in different parts of India. Another limitation is that the
study was concentrated on Telangana state alone. The lack in sampling frame and the method of data
collection through convenient sampling is another drawback, as convenience sampling is not
considered as robust as simple random sampling. Also, the response rate for the stud was 80% but the
20% of non-respondents could have influenced the insights of the research, therefore adding to the
limitations. This research also includes limitations in terms of the theories and concepts of green
marketing, as this is a rather new area of research in emerging markets, especially India, so there were
limited predetermined predictors or hypothesis to elaborate on. Another drawback of this study is that
there was no confirmatory factor analysis performed on the scale used and it was not specific to Indian
population.

46
5. Conclusion
The research was carried out to bridge the gap in the literature about how consumer purchasing
patterns are influenced by different green marketing strategies in the context of developing countries.
While green marketing has become a widely researched area, it has only gained resonance in the case
of India in the recent past.
The purpose of this research was to investigate the impact of green marketing on consumer purchasing
patterns and decision making in India. The sample concentrated particularly on the Telangana state in
India. The overall purpose of the research was contained by sub-objectives that contributed to finding
the direction and strength of the relationship between the six distinct environmental belief factors and
environmental behaviour, while controlling for key socio-demographic factors. Other sub-objectives
included investigation of significant associations between the environmental behaviour, the six
environmental belief factors and key socio-demographic variables including gender, age, education and
place of residence and the analysis of correlations between environmental belief factors (eco-labelling,
green branding and packaging, environmental advertisements, green pricing, embedding an eco-
image, environmental concerns and beliefs) and the environmental behaviour of consumers
The significant findings of the study harmonised with the literature that had been reviewed previously,
while the larger significant addition to the findings was about the urban and rural socio-demographic
results. The first key significant finding was that consumer perception of the intensity of green packaging
and green branding had a significant and positive effect on the environmental behaviour of consumers
therefore initiating a direct link between branding and consumer behaviour and adding to the green
purchase patterns. From the literature, it can be inferred that there is a positive impact of green branding
on consumer behaviour, hence impacting their purchase decisions. It was found that people tend to
trust known brands easily. The second key finding was that consumers felt the importance of green
products and the premium green pricing also had a direct positive yet significant impact on the green
behaviour of consumers, further leading to their purchase patterns. In terms of correlations, weak but
significant positive correlations were found between consumer perceptions of effectiveness of eco-
labelling and green consumer behaviour. This study has confirmed the findings from previous literature.
Correspondingly, intensity of green packaging and branding was also found to be correlated to the
environmental behaviour of consumers. The regression analysis furthered this theory for Indian
consumers. Also, importance of green products and premium green pricing and environmental
behaviour were found to be correlated. There were significant associations found in terms of eco-image,
green branding and green pricing with regard to the socio-demographics of place of residence. A
significant difference in the perception of urban and rural participants was found. Previous researchers
have suggested that the impact of socio-demographics on the environmental behaviour might be
restricted (Diamantopoulus et al., 2003). Therefore, the current research is augmenting the previous
research by showing significant associations.
47
Apart from this, some other interesting results were found but were not statistically significant. Based
on the results, it was gathered that effectiveness of eco-labelling had a positive effect on the consumers’
environmental behaviour. It was also observed that environmental advertising had a negative effect on
environmental behaviour, similar result was found in terms of environmental concerns and beliefs of
consumers and its relationship to the environmental behaviour. This shows that consumers are
concerned about the environment, but they are reluctant to purchase green products.
In terms of correlations also, no significant correlation was found between the environmental concerns
of consumers, environmental advertising and eco-image and the environmental behaviour of
consumers. Further research, with a bigger sample size might be able to shed more significant insights
with regard to these findings.
48
References
Aaker, D.A. (1991) ‘Managing brand equity: Capitalizing on the value of a brand name’, Journal of Marketing, 56(2), p. 125. doi: 10.2307/1252048.
Ajzen, I. (1991) ‘The theory of planned behavior’, Organizational Behavior and Human Decision Processes, 50(2), pp. 179–211. doi: 10.1016/0749-5978(91)90020-t.
Baldwin, P. (1993) ‘Advertisers beginning to see green’, The Dallas Morning News, pp. J1–J11.
Barber, N. (2005) Wine label design, information and bottle packaging: influence on wine buying behaviours. Master’s Thesis thesis. Prude University, IN.
Barber, N. (2010) ‘“Green” wine packaging: Targeting environmental consumers’, International Journal of Wine Business Research, 22(4), pp. 423–444. doi: 10.1108/17511061011092447.
Belz, F.M. and Peattie, K. (2009) Sustainability Marketing: A Global Perspective. Edited by John Wiley & Sons. Glasgow.
Braimah, M. and Tweneboah-Koduah, E.H. (2011) ‘An Exploratory Study of the Impact of Green Brand Awareness on Consumer Purchase Decision in Ghana’, Journal of Marketing Development and Competitiveness, 5(7), pp. 11–18.
Carlson, L., Grove, S.J. and Kangun, N. (1993) ‘A content analysis of environmental advertising claims: A matrix method approach’, Journal of Advertising, 22(3), pp. 27–39. doi: 10.1080/00913367.1993.10673409.
Chan, R.Y.K. (2004) ‘Consumer responses to environmental advertising in china’, Marketing Intelligence & Planning, 22(4), pp. 427–437. doi: 10.1108/02634500410542789.
Chase, D. and Smith, T.K. (1992) ‘Consumers keen on green but marketers don’t deliver’, Advertising Age, 63(63).
Cherian, J. and Jacob, J. (2012) ‘Green marketing: A study of consumers’ attitude towards environment friendly products’, Asian Social Science, 8(12). doi: 10.5539/ass.v8n12p117.
Crane, A. (2000) ‘Facing the backlash: Green marketing and strategic reorientation in the 1990s’, Journal of Strategic Marketing, 8(3), pp. 277–296. doi: 10.1080/09652540050110011.
Cronin, J.J., Smith, J.S., Glelm, M.R., Martinez, J. and Ramirez, E. (2011) ‘Sustainability oriented marketing strategies: an examination of stakeholders and the opportunities they present’, Journal of the Academy of Marketing Science, 39(1), pp. 158–174.
Dahlstorm, R. (2011) Green Marketing: Theory Practice and Strategy. Cengage Learning India edition.
Davis, J.J. (1993) ‘Strategies for environmental advertising’, Journal of Consumer Marketing, 10(2), pp. 19–36. doi: 10.1108/07363769310039102.
Diamantopoulos, A., Schlegelmilch, B.B., Sinkovics, R.R. and Bohlen, G.M. (2003) ‘Can socio-demographics still play a role in profiling green consumers? A review of the evidence and an empirical investigation’, Journal of Business Research, 56(6), pp. 465–480. doi: 10.1016/s0148-2963(01)00241-7.
Easterling, D., Kenworthy, A. and Nemzoff, R. (1996) ‘The greening of advertising: A Twenty-Five year look at environmental advertising’, Journal of Marketing Theory and Practice, 4(1), pp. 20–34. doi: 10.1080/10696679.1996.11501714.

49
Elkington, J. (1994) ‘Towards the sustainable corporation: Win-win-win business strategies for sustainable development’, California Management Review, 36(2), pp. 90–100. doi: 10.2307/41165746.
G, L. (1999) ‘Business, customers and sustainable living in an interconnected world: a multilateral ecocentric approach’, Journal of Business Ethics, 20(4), pp. 273–288.
Gilg, A., Barr, S. and Ford, N. (2005) ‘Green consumption or sustainable lifestyles? Identifying the sustainable consumer’, Futures, 37(6), pp. 481–504. doi: 10.1016/j.futures.2004.10.016.
Gill, J. and Johnson, P (2002), Research Methods for Managers. 3rd ed: London: Sage Ginsberg, J.M. and Bloom, P.N. (2004) ‘Choosing the right green marketing strategy’, MIT Sloan Management Review, pp. 79–84.
Grob, A. (1995) ‘A structural model of environmental attitudes and behaviour’, Journal of Environmental Psychology, 15(3), pp. 209–220. doi: 10.1016/0272-4944(95)90004-7.
Gupta, S. and Ogden, D.T. (2009) ‘To buy or not to buy? A social dilemma perspective on green buying’, Journal of Consumer Marketing, 26(6), pp. 376–391. doi: 10.1108/07363760910988201.
Han, H., Hsu, L.T. and Sheu, C. (2010) ‘Application of the theory of planned behavior to green hotel choice: Testing the effect of environmental friendly activities’, Tourism Management, 31(3), pp. 325–334. doi: 10.1016/j.tourman.2009.03.013.
Harrison, E.B. (1993) Going Green: How to communicate your Company’s Environmental Commitment. Homewood, IL. .
Hartmann, P., Apaolaza Ibáñez, V. and Forcada Sainz, F.J. (2005) ‘Green branding effects on attitude: Functional versus emotional positioning strategies’, Marketing Intelligence & Planning, 23(1), pp. 9–29. doi: 10.1108/02634500510577447.
Juwaheer, T., Pudaruth, S. and Monique Emmanuelle Noyaux, M. (2012) ‘Analysing the impact of green marketing strategies on consumer purchasing patterns in Mauritius’, World Journal of Entrepreneurship, Management and Sustainable Development, 8(1), pp. 36–59. doi: 10.1108/20425961211221615.
Kalafatis, S.P., Pollard, M., East, R. and Tsogas, M.H. (1999) ‘Green marketing and Ajzen’s theory of planned behaviour: A cross‐market examination’, Journal of Consumer Marketing, 16(5), pp. 441–460. doi: 10.1108/07363769910289550.
Khare, A., Mukerjee, S. and Goyal, T. (2013) ‘Social influence and green marketing: An exploratory study on Indian consumers’, Journal of Customer Behaviour, 12(4), pp. 361–381. doi: 10.1362/147539213x13875568505903.
Khare, A. (2014) ‘Antecedents to green buying behaviour: A study on consumers in an emerging
economy’, Marketing Intelligence & Planning, 33(3), pp. 309–329. doi: 10.1108/mip-05-2014-0083.
Kinnear, T.C. and Taylor, J.R. (1973) ‘The effect of ecological concern on brand perceptions’, Journal of Marketing Research, 10(2), p. 191. doi: 10.2307/3149825.
Kuhn, G.L. (1999) Environmental labels and entry into an environmentally differentiated market under asymmetric information. Thunen Series of Applied Economic Theory thesis. University Rostock. .
Laroche, M., Bergeron, J. and Barbaro‐ForleoGuido (2001) ‘Targeting consumers who are willing to pay more for environmentally friendly products’, Journal of Consumer Marketing, 18(6), pp. 503–520. doi: 10.1108/eum0000000006155.
Leire, C. and Thidell, Å. (2005) ‘Product-related environmental information to guide consumer purchases – a review and analysis of research on perceptions, understanding and use among Nordic

50
consumers’, Journal of Cleaner Production, 13(10-11), pp. 1061–1070. doi: 10.1016/j.jclepro.2004.12.004.
Leonidou, C.N., Katsikeas, C.S. and Morgan, N.A. (2013) ‘“Greening” the marketing mix: Do firms do it and does it pay off?’, Journal of the Academy of Marketing Science, 41(2), pp. 151–170. doi: 10.1007/s11747-012-0317-2.
Lutz, R.J. (1985) Affective and Cognitive Antecedents of Attitude towards the Ad: A Conceptual Framework.
Maheshwari, A. and Malhotra, G. (2011) ‘Green marketing: a study on Indian youth’, International
Journal of Management and Strategy, 2(3).
Mainieri, T., Barnett, E.G., Valdero, T.R., Unipan, J.B. and Oskamp, S. (1997) ‘Green buying: The influence of environmental concern on consumer behavior’, The Journal of Social Psychology, 137(2), pp. 189–204. doi: 10.1080/00224549709595430.
Make in India Available at: http://www.makeinindia.com/article/-/v/direct-foreign-investment-towards-india-s-growth (Accessed: 27 July 2016)
Maslow, A.H. (1943) ‘A theory of human motivation’, Psychological Review, 50(4), pp. 370–396. doi: 10.1037/h0054346.
Maslow, A.H. (1954) ‘Motivation and personality’, New York: Harper and Row.
Mathur, S., Guiry, M. and Tikoo, S. (2009) ‘Intergenerational culture-specific consumption differences
between Asian Indian immigrants in the U.S. And Indians residing in an Indian metropolis’, Journal of
International Consumer Marketing, 20(3-4), pp. 69–80. doi: 10.1080/08961530802129276.
McKinsey (2007) Mckisey and Company Inc.
McLeod, S.A. (2014) Maslow’s Hierarchy of Needs. Available at: www.simplypsychology.org/maslow.html (Accessed: 26 July 2016).
Michaud, C. and Llerena, D. (2011) ‘Green consumer behaviour: An experimental analysis of willingness to pay for remanufactured products’, Business Strategy and the Environment, , p. n/a–n/a. doi: 10.1002/bse.703.
Mintel (2006) Green living, US Marketing Research Report. London.
Mishra, P. and Sharma, P. (2010) ‘Green Marketing in India: Emerging Opportunities and Challenges’, Journal of Engineering, Science & Management Education, 3, pp. 9–14.
Mostafa, M.M. (2009) ‘Shades of green: A psychographic segmentation of the green consumer in
Kuwait using self-organizing maps’, Expert Systems with Applications, 36(8), pp. 11030–11038. doi:
10.1016/j.eswa.2009.02.088.
Okada, M.E. and Mais, E.L. (2010) ‘Framing the “Green” alternative for environmentally conscious consumers’, Sustainability Accounting, Management and Policy Journal, 1(2), pp. 222–234. doi: 10.1108/20408021011089257.
Ottman, J. (1993) Green Marketing: Challenges and Opportunities. NTC, Lincolnwood, IL.
Ottman, J. (ed.) (2011) The New Rules of Green Marketing: Strategies Tools and Inspiration for Sustainable Branding. Greenleaf Publishing.

51
Ottman, J.A. (2006) The rules of ‘green’ marketing. Available at: http://www.marketingprofs.com/6/ottman1.asp (Accessed: 26 August 2016).
Patrick, Apaolaza Ibáñez, V. and Forcada Sainz, F.J. (2005) ‘Green branding effects on attitude: Functional versus emotional positioning strategies’, Marketing Intelligence & Planning, 23(1), pp. 9–29. doi: 10.1108/02634500510577447.
Peattie, K. (1995) Environmental Marketing Management: Meeting the Green Challenge. London.
Peattie, K. (2001) ‘Golden goose or wild goose? The hunt for the green consumer’, Business Strategy and the Environment, 10(4), pp. 187–199. doi: 10.1002/bse.292.
Pickett‐BakerJosephine and Ozaki, R. (2008) ‘Pro‐environmental products: Marketing influence on
consumer purchase decision’, Journal of Consumer Marketing, 25(5), pp. 281–293. doi:
10.1108/07363760810890516.
Polonsky, M.J., Carlson, L., Grove, S. and Kangun, N. (1997) ‘International environmental marketing claims’, International Marketing Review, 14(4), pp. 218–232. doi: 10.1108/02651339710173426.
Prakash, A. (2002) ‘Green marketing, public policy and managerial strategies’, Business Strategy and the Environment, 11(5), pp. 285–297. doi: 10.1002/bse.338.
Purohit, H.C. (2012) ‘Product Positioning And Consumer Attitude Towards Eco-Friendly Labeling and Advertisement: An Analytical Study’, Journal of Management Research, 12(3), p. 153.
Quinlan, C., 2011. Business Research Methods. Hampshire: Thomas Rennie
Rahbar, E. and Abdul Wahid, N. (2011) ‘Investigation of green marketing tools effect on consumers
purchase behaviour’, Business Strategy Series, 12(2), pp. 73–83. doi: 10.1108/17515631111114877.
Rashid, N.R.N.A. (2009) ‘Awareness of Eco-label in Malaysia’s green marketing initiative’, International Journal of Business and Management, 4(8). doi: 10.5539/ijbm.v4n8p132.
Raska, D. and Shaw, D. (2012) ‘When is going green good for company image?’ Management Research Review, 35(3/4), pp. 326–347. doi: 10.1108/01409171211210190.
Renfro, L.A. (2010) ‘Green Business Operations and Green Marketing’, Gatton Student Research Publication, 2(2).
Robson, C. (2002), Real world research, Oxford: Blackwell.
Sarkar, A.N. (2012) ‘Green Branding and Eco-innovations for evolving a sustainable green marketing strategy’, Asia-Pacific Journal of Management Research and Innovation, 8(1), pp. 39–58. doi: 10.1177/2319510x1200800106.
Saunders, M., Lewis, P. and Thornhill, A. (2009). Research Methods for Business Student. 3rd ed. Essex: Pearson Education Limited
Shamdasani, P., Chon-Lin, G. and Richmond, D. (1993) ‘Exploring green consumers in an oriental culture: role of personal and marketing mix factors’, Advances in Consumer Research, 20(1), pp. 488–493.
Singh, P.B. and Pandey (2012) ‘Green Marketing:policies and practices for sustainable development’, Integral Review -A Journal of Management, 5(1).
Spruyt, A., Hermans, D., De Houwer, J., Vandekerckhove, J. and Eelen, P. (2007) ‘On the predictive validity of indirect attitude measures: Prediction of consumer choice behavior on the basis of affective priming in the picture–picture naming task’, Journal of Experimental Social Psychology, 43(4), pp. 599–610. doi: 10.1016/j.jesp.2006.06.009.

52
Stafford, E.R. (2003) ‘Commentary: Energy efficiency and the new green marketing’, Environment: Science and Policy for Sustainable Development, 45(3), pp. 8–10. doi: 10.1080/00139150309604533.
Straughan, R.D. and Roberts, J.A. (1999) ‘Environmental segmentation alternatives: A look at green consumer behavior in the new millennium’, Journal of Consumer Marketing, 16(6), pp. 558–575. doi: 10.1108/07363769910297506.
Tracy, A.P. and Oskamp, S. (1984) ‘Relationships among ecologically responsible behaviors’, Journal of Environmental Systems, 13(2), pp. 115–126. doi: 10.2190/6tn8-48wt-63xt-chen.
Welford, R. (2000) Hijacking Environmentalism. London: Earthscan.
Wulf, K.D. and Odekerken-Schröder, G. (2003) ‘Assessing the impact of a retailer’s relationship efforts on consumers’ attitudes and behavior’, Journal of Retailing and Consumer Services, 10(2), pp. 95–108. doi: 10.1016/s0969-6989(02)00013-9.
Yin, H. and Ma, C. (2009) ‘International integration: A hope for a greener china?’, International Marketing Review, 26(3), pp. 348–367. doi: 10.1108/02651330910960825.
Zinkhan, G.M. and Carlson, L. (1995) ‘Green advertising and the reluctant consumer’, Journal of Advertising, 24(2), pp. 1–6. doi: 10.1080/00913367.1995.10673471.

53
List of Appendices
Appendix A
Cronbach’s Alpha for entire scale
Cronbach’s Alpha for Eco-labelling
Cronbach’s Alpha for Green Branding

54
Cronbach’s Alpha for environmental advertisements
Cronbach’s Alpha for green pricing
Cronbach’s Alpha for environmental concerns and beliefs
Cronbach’s alpha for eco-image
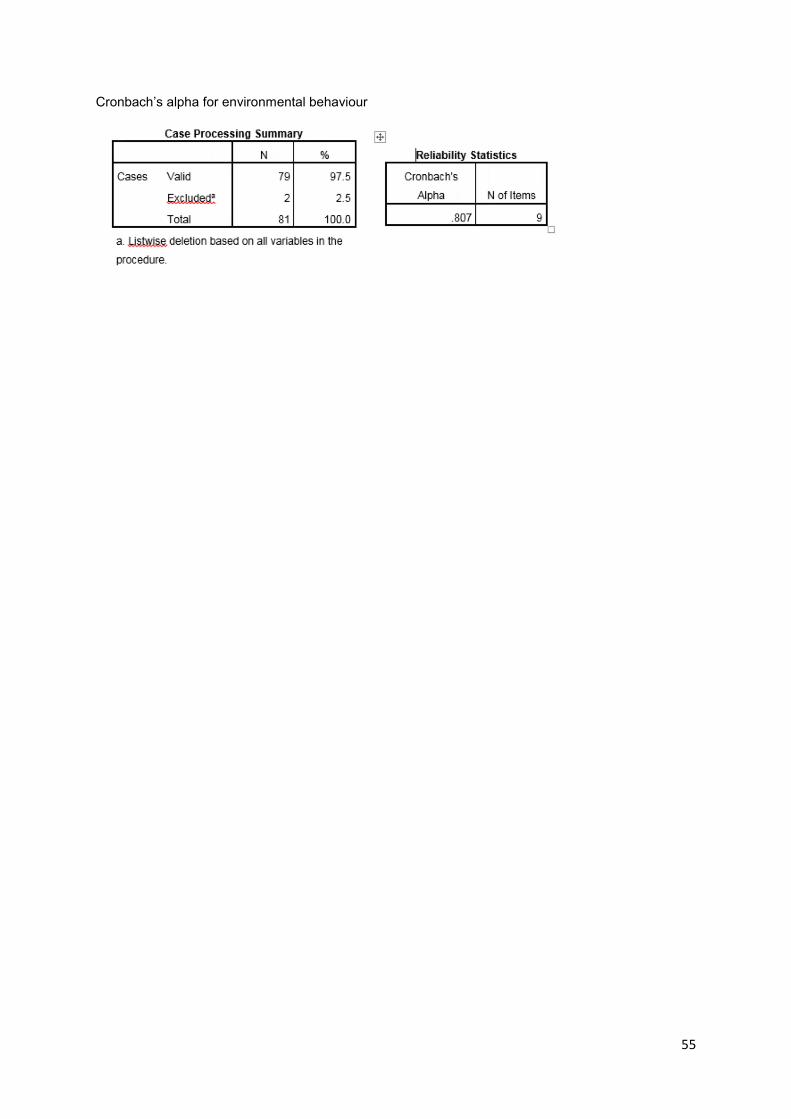
55
Cronbach’s alpha for environmental behaviour

56
Appendix B
Normaility test Results

57

58

59

60

61

62

63
Appendix C
Tests of difference for Eco-labelling
Independent T-test for Gender
Independent t-test for place of residence
ANOVA for Age

64
Anova for education

65
Appendix D
Tests of difference for green branding
Mann-Whitney U test for gender and place of residence

66
ANOVA for Age
Kruskal-Wallis for Education
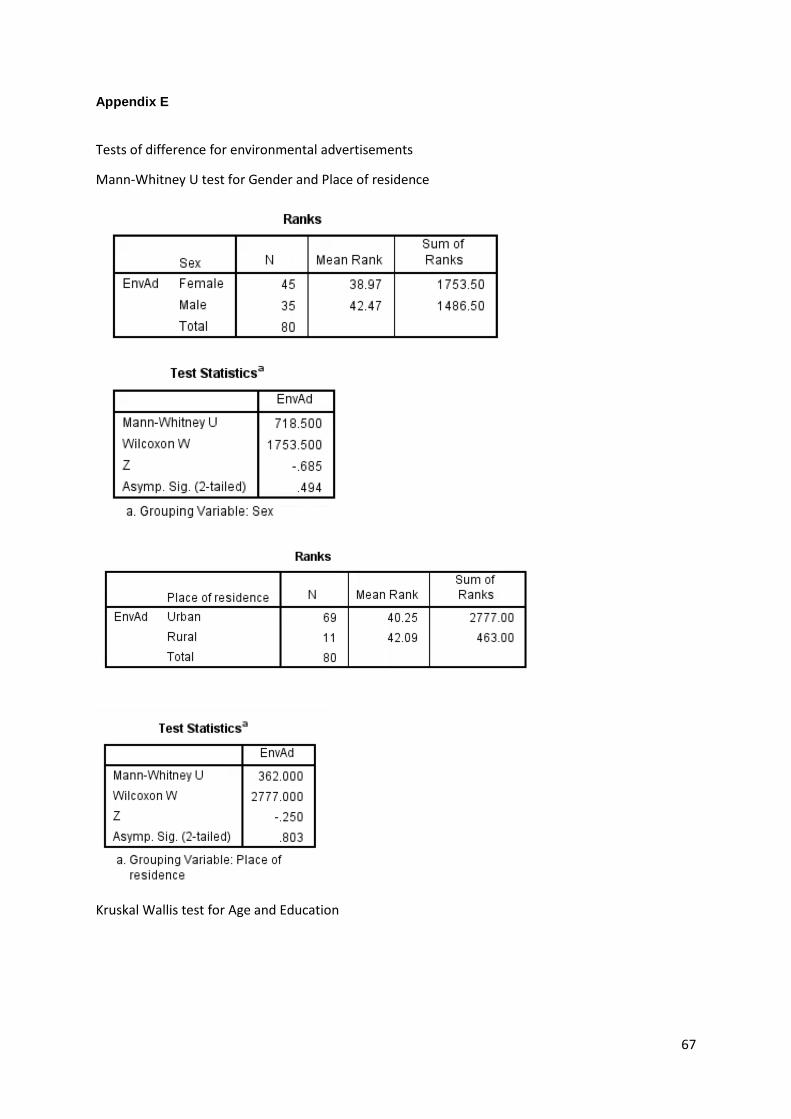
67
Appendix E
Tests of difference for environmental advertisements
Mann-Whitney U test for Gender and Place of residence
Kruskal Wallis test for Age and Education

68
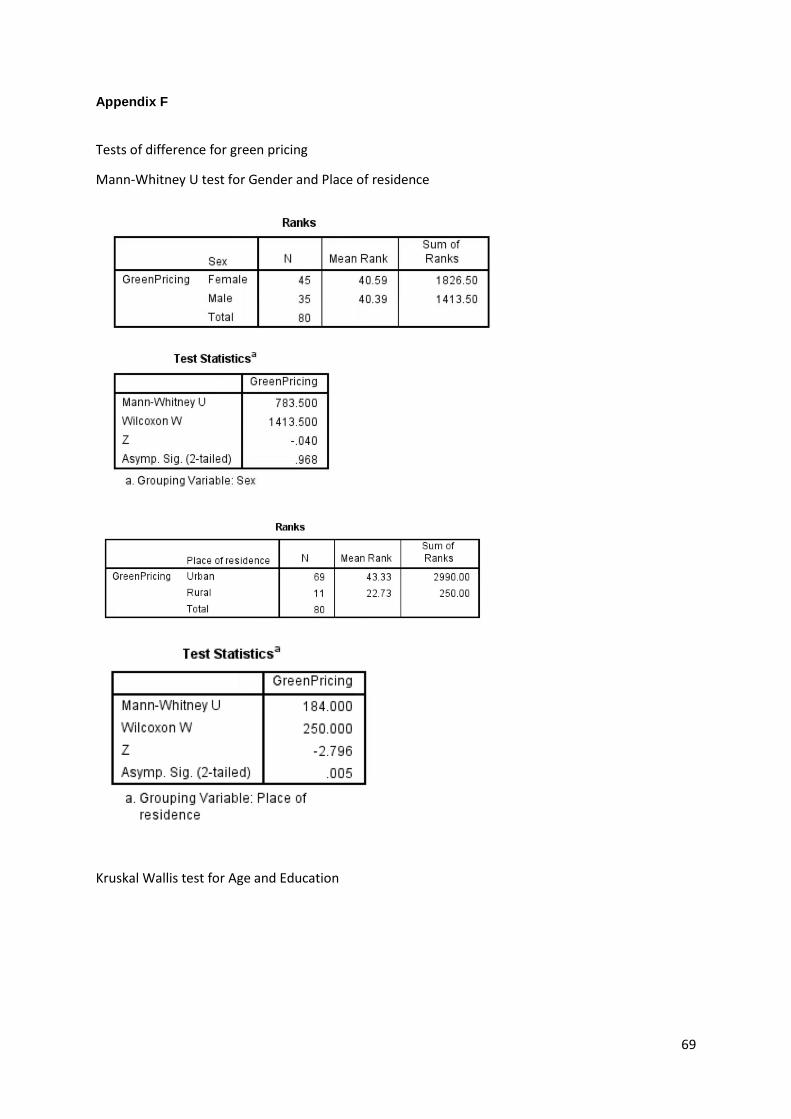
69
Appendix F
Tests of difference for green pricing
Mann-Whitney U test for Gender and Place of residence
Kruskal Wallis test for Age and Education

70

71
Appendix G
Tests of difference for eco-image
Mann-Whitney U test for Gender and Place of Residence
Kruskal-Wallis test for Age and Education

72

73
Appendix H
Tests of difference for environmental concerns
Mann-Whitney U test for Gender and place of residence
Kruskal Wallis test for Age and Education
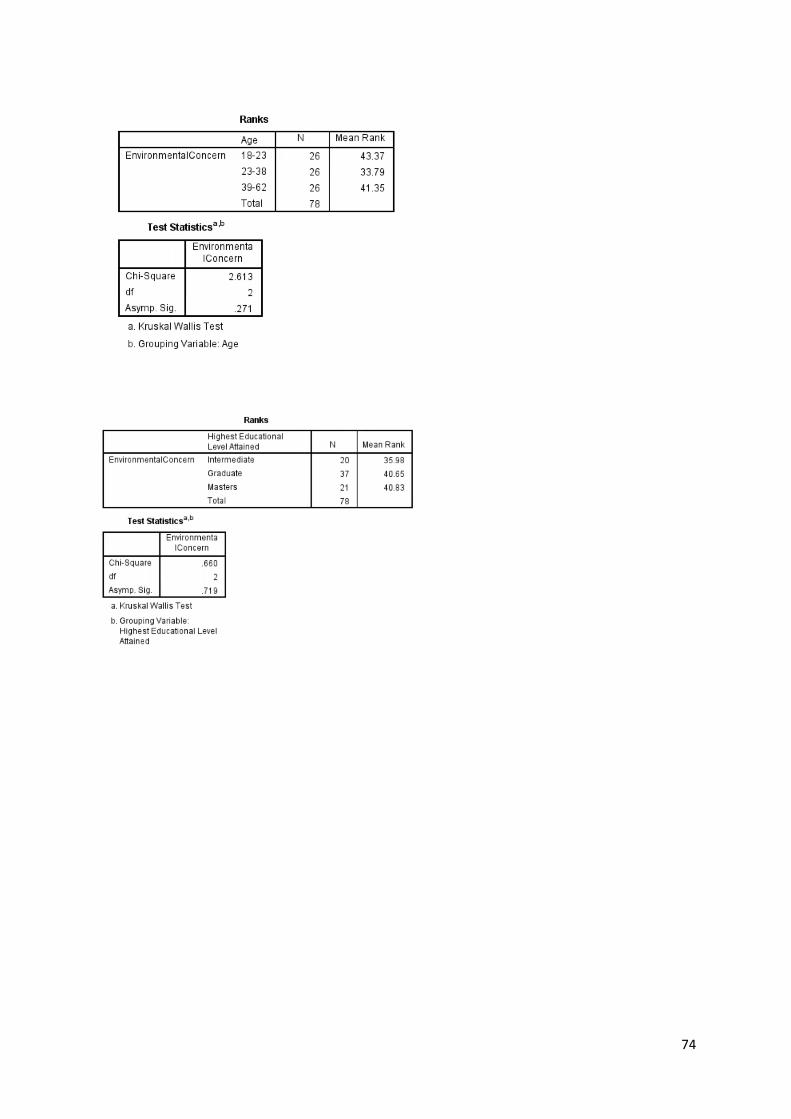
74

75
Appendix I
Tests of difference for environmental behaviour
Independent t-test for Gender
Kruskal-Wallis test for Age
ANOVA for Education

76
Mann-Whitney U test for Place of residence

77
Appendix J
Correlation of Eco-labelling and environmental behaviour
Correlation of green branding and environmental behaviour
Correlation of environmental advertisement and environmental behaviour
Correlation of green pricing and environmental behaviour

78
Correlation of eco-image and environmental behaviour
Correlation of environmental concerns and beliefs and environmental behaviour

79
Appendix K
Regression Analysis
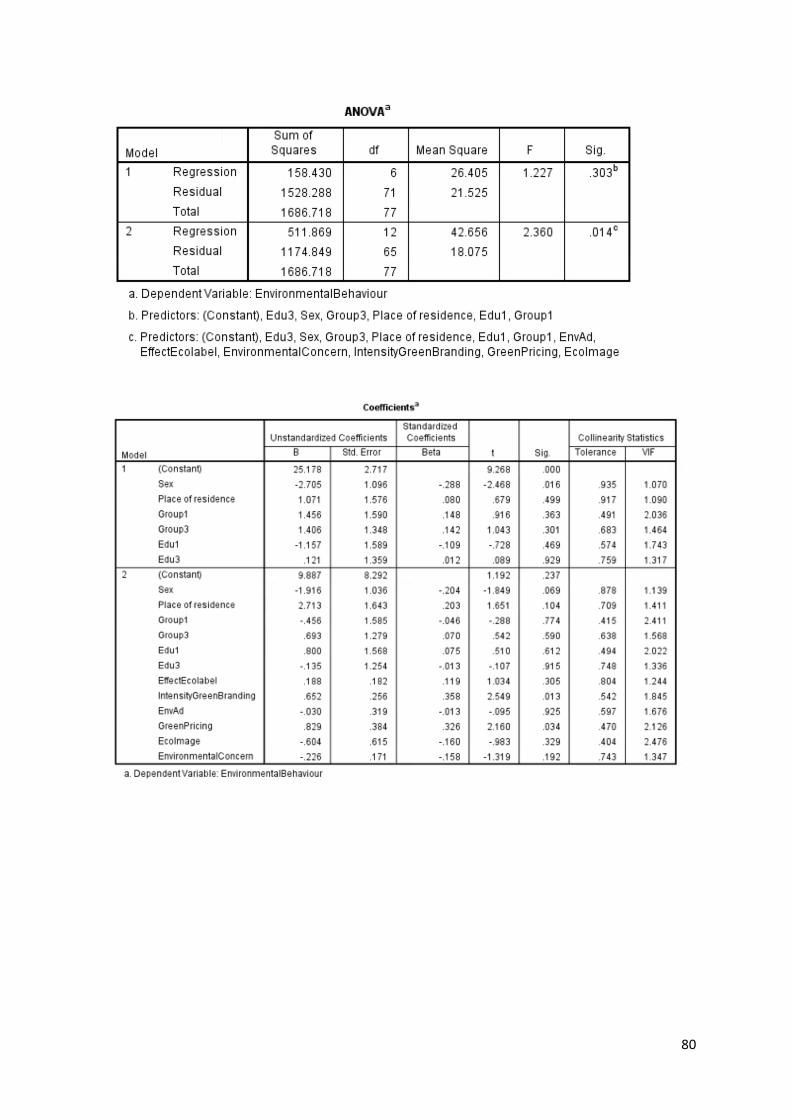
80
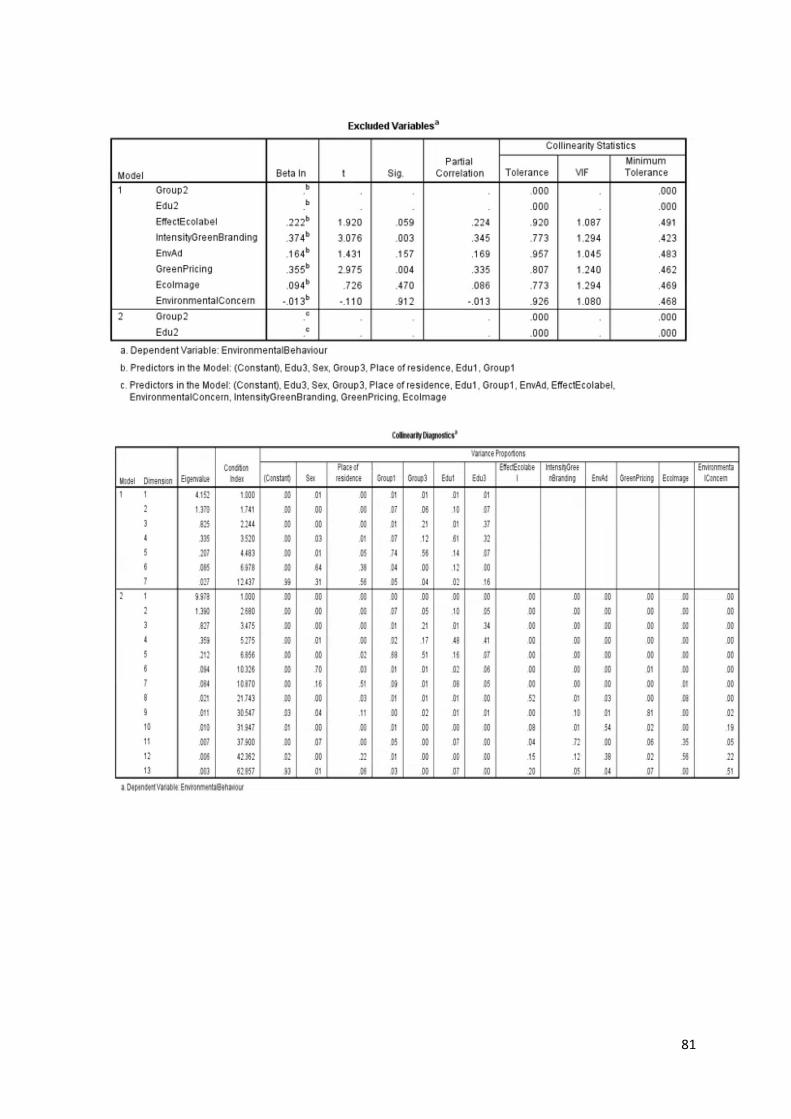
81

82

83

84

85

86

87

88