a study of toluene diisocyanate based polyurethane … · 2020-01-18 · 127 7. a study of...
TRANSCRIPT
127
7. A Study of Slabstock Flexible Polyurethane Foams Based on Varied
Toluene Diisocyanate Isomer Ratios
7.1 Chapter Summary
The morphological features of three flexible slabstock polyurethane foams based on
varied contents of the 2,4 and 2,6 toluene diisocyanate (TDI) isomers have been investigated.
The three commercially available TDI mixtures, i.e., 65:35 2,4/2,6 TDI, 80:20 2,4/2,6 TDI, and
100:0 2,4/2,6 TDI were utilized. The foams were characterized at different length scales using
several techniques. Differences in the cellular structure of the foams were noted using SEM.
SAXS was used to demonstrate that all the three foams were microphase separated and possessed
similar interdomain spacings. TEM revealed that the aggregation of the urea phase into large
urea rich regions decreased systematically on increasing the asymmetric TDI isomer content.
FTIR showed that the level of bidentate hydrogen bonding of the hard segments increased with
the 2,6 TDI isomer content. DSC and DMA were used to note changes in the soft segment glass
transition temperature of the foams on varying the diisocyanate ratios and suggested that the
perfection of microphase separation was enhanced on increasing the 2,6 TDI isomer content. The
above observations were utilized to explain why the foam containing the highest content of the
symmetric 2,6 TDI isomer exhibited the highest rubbery storage modulus, as measured by DMA.
7.2 Introduction
Polyurethanes are a broad class of materials which find applications in the areas of
foams, fibers, elastomers, coatings, and adhesives.1 The mechanical properties of polyurethanes
are strongly influenced by the microphase separated morphology which results from an
incompatibility between soft flexible aliphatic polyether (or polyester) segments alternating with
the commonly utilized aromatic, isocyanate-based hard segments. The hard segments which are
formed from the reaction of an isocyanate moiety with a chain extender containing amine or
alcohol groups, react with the soft segments forming urethane linkages. SAXS has been widely
used to investigate the microphase separated morphology of polyurethanes, for example in the
studies by Neumüller et. al.,2 Tyagi et. al.,3 and Koberstein et. al.4 This phase separated
morphology is known to play a key role in determining the overall polymer properties and has
been of interest to several workers.5, 6 More recently, the use of AFM to probe phase separation

128
in polyurethane7 and poly(urethane urea)8 elastomers, as well as in polyurethane foams9, 10 has
also been reported.
An important application of polyurethanes is the area of flexible polyurethane foams
which are used in transportation, packaging, and furnishing applications.11 This class of
polyurethanes typically contains water-extended, toluene diisocyanate based urea hard segments
which are covalently bound to soft polyether segments based on ethylene oxide, or propylene
oxide, or both kinds of repeating units. When the concentration of the urea segments exceeds a
system dependent solubility limit, they microphase separate and form urea microdomains. Also,
the reaction of water with the isocyanate component is known to result in the production of
carbon dioxide, which along with the heat generated due to the exothermic nature of the
reactions, helps in expanding the foaming reactants and giving the foam its cellular structure. In
addition to the microphase separation discussed above, another level of structure is known to
exist in the solid portion of flexible polyurethane foams. Workers have observed using TEM and
x-ray microscopy (XRM), the presence of urea rich macrophases, ca. 0.3 µm in size, which are
commonly referred to as urea �balls� or urea �aggregates�.11, 12 These macrophases have been
noted to be more pronounced in slabstock formulations as compared to molded formulations
with similar hard segment contents.11
Flexible polyurethane foam production in North America relies heavily on the
commercially available 80:20 2,4/2,6 TDI mixture, although some European countries also
utilize MDI. Structure-property relationships of foams based on the 80:20 2,4/2,6 TDI mixture
have been studied extensively and are available in the literature.11, 13, 14, 15 There are also
commercially available the pure 2,4 TDI isomer and the 65:35 2,4/2,6 TDI mixture - however,
the literature describing foams based on these isocyanates is relatively sparse.16, 17 Also, the pure
2,6 TDI isomer is far more expensive than the pure 2,4 TDI isomer and the other two
commercial mixtures, and has therefore found no economically feasible applications.
The 2,4 vs 2,6 TDI isomers differ markedly with respect to their structure as well as
reactivity. The chemical structures of the two isomers are shown in Figure 7.1. Firstly, the 2,6
isomer is symmetric as compared to the 2,4 isomer, and is therefore expected to form hard
segments which have better packing characteristics. Secondly, the relative reaction rates of the
different isocyanate groups on each molecule differ significantly.11 The reactivity of the ortho
position in the 2,4 isomer is known to be approximately 12% of the reactivity of the isocyanate

129
group in the para position due to the steric hindrance caused by the methyl group. However,
when the reaction temperature approaches 100 °C, steric hindrance effects are overcome and
both the positions react at nearly the same rate. In comparison, the isocyanate groups on the 2,6
isomer have equal reactivities when both groups are unreacted. However, after one of the
isocyanate groups reacts, the reactivity of the second group drops by a factor of ca. 3.
As mentioned earlier, there are only very limited studies which describe the effect of
varying the ratio of the 2,4 vs. 2,6 isomers on the structure-property relationships of flexible
polyurethane foams.16, 17 However, the influence of this variable has been somewhat more
extensively studied in the area of polyurethane elastomers. For instance, Sung and Schneider
carried out infrared studies on polyurethane elastomers based on the pure 2,4 and 2,6 TDI
isomers which utilized poly(tetramethylene oxide) (PTMO) as the soft segment and 1,4-
butanediol (BDO) as the chain extender.18 They reported that in the 2,6 TDI polyurethanes, 80%
of the carbonyl groups were hydrogen bonded to urethane NH groups, where as in comparable
2,4 systems, only 50% of the carbonyl groups were hydrogen bonded. Nierzwicki also studied
PTMO/BDO based polyurethane elastomers which utilized varied contents of the 2,4 and 2,6
TDI isomers.19 In that study, it was observed that increasing the content of the 2,6 TDI isomer
led to a systematic increase in both the tensile strength as well as the modulus of the elastomers
investigated. It was suggested that the symmetric nature of the 2,6 TDI isomer enhanced the
�stiffness� of the hard domains. Also, in the same study, the soft segment glass transition
temperature was found to decrease as the 2,6 TDI isomer content was increased, which
suggested that the perfection of the microphase separation was enhanced on increasing the
content of the symmetric 2,6 TDI isomer.
Figure 7.1 The chemical structures of 2,4 and 2,6 TDI isomers. The numbers indicate relative rates of reaction of the
isocyanate groups at the different positions.
CH3
NCO
NCO
CH3
NCOOCN(12)
(100)
(56) (56)*
*drops to 17 afterother group reacts
2,4 TDI 2,6 TDI
130
Molau has described the influence of varying the content of �A� and �B� blocks on the
morphology of an �A-B� block copolymer.20 On increasing the volume fraction (φ) of component
A in a mixture of A and B phases, the morphology was described as spheres of A in a matrix of
B (for φA < 20%), cylinders of A in a matrix of B (for 20% ≤ φA ≤ 35%), and as an alternating
lamellar structure for 35% ≤ φA ≤ 50%. Phase inversion occurs on further increasing the content
of component A which then leads to component B being dispersed in a similar manner in a
matrix of component A. In addition to these morphologies, the presence of a gyroid phase has
also been predicted21 and recently discussed by Bates and Fredrickson.22 These idealized
morphologies reflect that the on increasing the content of, say component A in B, a more
continuous and connected texture of A is established. Although polyurethane foams, and other
segmented polyurethanes in general, do not exhibit these systematic morphologies due to their
segmented nature, and polydispersity of the segments; it is expected based on volume fraction
arguments, that on exceeding a certain hard segment content, the connectivity of the urea hard
phase would occur which in turn would strongly affect mechanical and related properties. In fact,
on studying segmented polyurethane elastomers with varied hard segment content, the formation
of an interlocking connected morphology at a hard segment content of ca. 35 wt % was proposed
by Abouzahr and Wilkes.5 Also, in a study carried out on a series of polyurethane elastomers of
different hard segment content, Seymour and Cooper concluded that above a certain hard
segment content, ca. 25%, it is impossible, due to spatial limitations, to have discrete separated
microdomains.23 They also suggested that instead, an interlocking microdomain morphology
developed. The connectivity of the urea hard phase is thus thought to play an important role in
determining structure-property relationships of the current class of foams investigated which
have a hard segment content of ca. 32 wt %.
As discussed in a recent study from our laboratory, urea phase connectivity in
polyurethane foams is thought to be present at different scale lengths.10 Hydrogen bonding
between adjacent urea hard segments leads to connectivity of the urea phase at the segmental
level. There is also the possibility of the larger scale urea aggregates in polyurethane foams to
have physical associations with each other and thus provide connectivity at the urea aggregate
level. These issues will be raised later to explain the dynamic mechanical behavior of the foams
discussed in the present study.
131
7.3 Experimental
7.3.1 Materials
The three commercially available mixtures of the TDI isomers, namely 65:35 2,4/2,6
TDI; 80:20 2,4/2,6 TDI; and 100:0 2,4/2,6 TDI were used to synthesize foams to investigate the
effect of varying the isomer ratios. These foams were supplied by Dow Chemical. The foams
utilized Voranol 3322® which has an equivalent weight of 1220 with an EO content of 12.5 %.
Water level was maintained at 5 pphp and an isocyanate index of 105 was used which led to all
foams containing approximately 32% hard segment content by weight. The foams also made use
of 1.2 pphp BF2370 (surfactant), and catalyst contents were 0.09 pphp Dabco 33LV, and
0.02pphp Niax A1. Dabco 33LV is 33 % triethylene diamine in propylene glycol; Niax A1 is a
70:30 mixture of bis(dimethylaminoethyl) ether and dipropylene glycol. In order to obtain foams
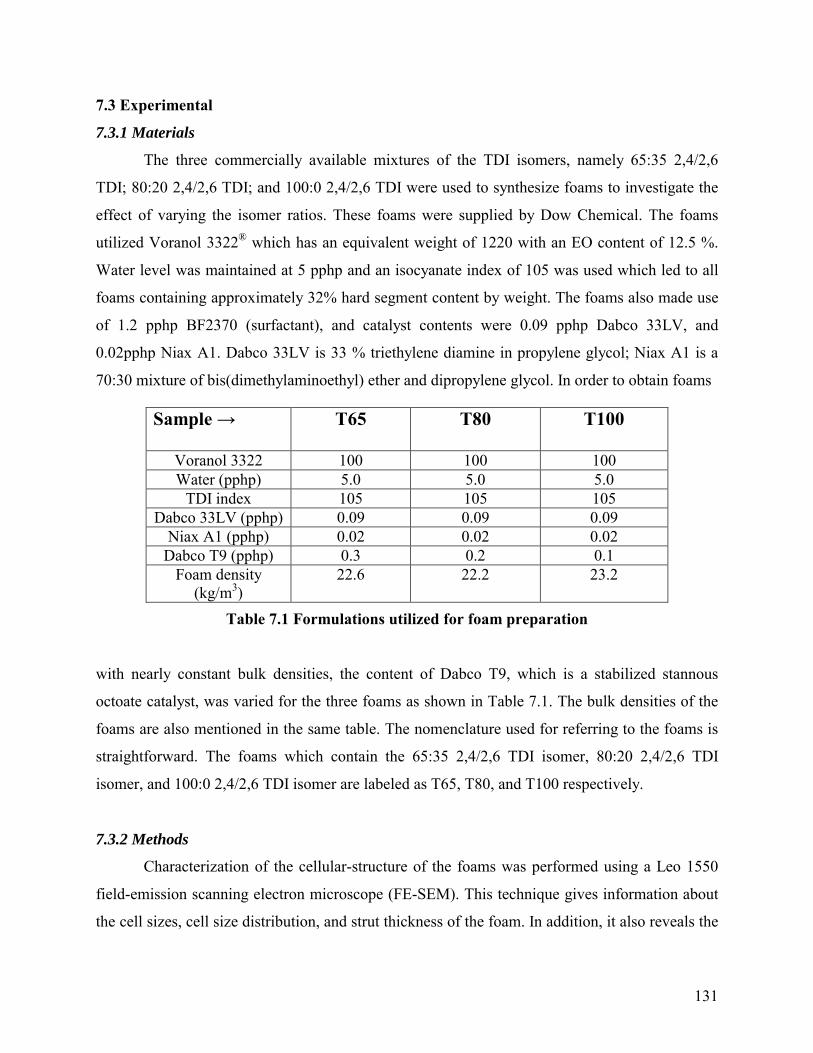
Table 7.1 Formulations utilized for foam preparation
with nearly constant bulk densities, the content of Dabco T9, which is a stabilized stannous
octoate catalyst, was varied for the three foams as shown in Table 7.1. The bulk densities of the
foams are also mentioned in the same table. The nomenclature used for referring to the foams is
straightforward. The foams which contain the 65:35 2,4/2,6 TDI isomer, 80:20 2,4/2,6 TDI
isomer, and 100:0 2,4/2,6 TDI isomer are labeled as T65, T80, and T100 respectively.
7.3.2 Methods
Characterization of the cellular-structure of the foams was performed using a Leo 1550
field-emission scanning electron microscope (FE-SEM). This technique gives information about
the cell sizes, cell size distribution, and strut thickness of the foam. In addition, it also reveals the
Sample → T65 T80 T100
Voranol 3322 100 100 100 Water (pphp) 5.0 5.0 5.0
TDI index 105 105 105 Dabco 33LV (pphp) 0.09 0.09 0.09
Niax A1 (pphp) 0.02 0.02 0.02 Dabco T9 (pphp) 0.3 0.2 0.1
Foam density (kg/m3)
22.6 22.2 23.2

132
anisotropy in the cellular structure of slabstock polyurethane foams which blow under free
conditions and result in cells which are elongated along the blow or rise direction.11, 13 Foam
samples of ca. 5 mm thickness were mounted to aluminum stubs using copper tape. The samples
were then coated with a ca. 15 nm gold layer using a sputter coater. The microscope was
operated at 5 kV and images were taken at a magnification of 30x.
To investigate the local ordering of the hard segments at the 1-10 Å level, wide angle x-
ray scattering (WAXS) was employed. WAXS experiments were carried out using a Phillips
model PW1720 generator equipped with a Warhus camera. Pinhole collimated (ca. 0.02 in.
diameter), nickel filtered CuKα radiation with a wavelength of 1.542 Å was used. Foam samples
were cut approximately 15 mm thick and compressed to ca. 3 mm before exposure to x-rays. The
sample to film distance for the foam samples was 5.5 cm and exposure times were ca. 8 hours.
The compression of foams in order to carry out x-ray scattering experiments is common practice
as has been reported in previous studies.9, 13 The degree of compression is only to densify the
initial foam so as to reduce the sample thickness which helps minimize line broadening effects in
the WAXS experiment. The compression load is not so great so as to alter the morphological
features of the microphase texture since complete reversibility (expansion) occurs upon release
of the compressive load.
Small angle X-ray scattering (SAXS) was utilized to study the microphase separation
characteristics of the foams investigated. The x-ray source was a Philips model PW1729
generator operating at 40 kV and 20 mA. A Kratky camera with slit collimated (0.03 x 5 mm2)
nickel filtered CuKα radiation having a wavelength of 1.542 Å was utilized. The detector used
was a Braun OED 50 position-sensitive platinum wire detector. The raw data was corrected for
parasitic scattering and normalized using a Lupolen standard. Foam samples were cut
approximately 10 mm thick and then compressed to approximately 3 mm, before exposing to x-
rays.
Fourier transform infrared (FTIR) spectroscopy was utilized to evaluate the hydrogen
bonding characteristics of the materials studied. A Nicolet 510 spectrometer with a Spectra-Tech
ATR attachment utilizing a horizontal ZnSe crystal was used. The collected spectra were
analyzed using Omnic 3.0 software. The scans were normalized using the CH2 absorbance which
occurs at 2970 cm-1.
133
Transmission electron microscopy (TEM) was used to examine the effect of varying the
isomer ratios on the urea aggregation behavior. Small samples were cut from the center of the
foam buns and embedded in epoxy which was allowed to cure overnight at ambient conditions.
No changes in the sample dimensions were noted before and after the embedding, suggesting
that there was no chemical interaction between the epoxy and the samples. The samples were
then trimmed using a razor blade in order to expose a single foam strut to the surface. A diamond
knife was used to cryogenically microtome the trimmed surfaces into ultra-thin sections (ca. 80
nm) on a Reichert-Jung ultramicrotome Ultracut E equipped with a model FC-4D cryo-
attachment operating at �90°C. The microtomed sections were collected on 600 mesh copper
grids using ethanol as a solvent. Micrographs were taken using a Philips 420T scanning
transmission electron microscope (STEM) operating at an accelerating voltage of 100 kV.
Dynamic mechanical analysis (DMA) was carried out in the tensile mode using a Seiko
model 210. The samples, which had dimensions of approximately 15 x 5 x 5 mm3, were heated
from �120 °C to 250 °C at a rate of 2.0 °C/min. The storage modulus and tanδ data were
collected at a frequency of 1 Hz. The grip-to-grip distance was set at 10 mm. Storage moduli for
the foams were arbitrarily normalized to 3 x 10⁹ Pa in the glassy state to remove the effect of
differences in cellular structure and bulk foam densities.
Differential scanning calorimetery (DSC) experiments were conducted using a Seiko
DSC 220C at a heating rate of 10 °C/min and using a nitrogen purge. DSC was carried out to
observe any changes in the soft segment glass transition temperature position and breadth on
changing the ratios of the isocyanate isomers.
7.4 Results and Discussion
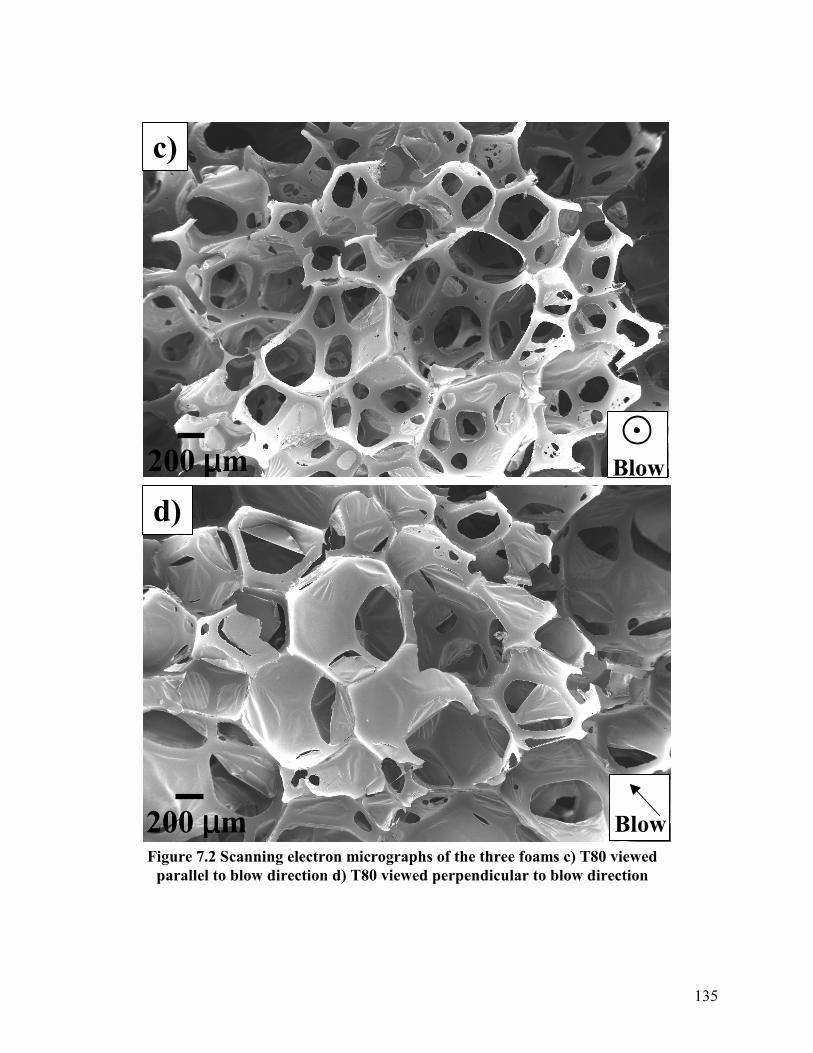
SEM images for foams T65, T80, and T100, parallel and perpendicular to the blow
direction, are shown in Figure 7.2. All three foams exhibit anisotropic cellular structures, as
expected, where the cells appear more elongated along the blow direction. This anisotropy in
cellular structure and its importance with respect to mechanical behavior has been reported in
previous studies.13, 14, 24 It can be observed from these images that the size of the cells, cell size
distribution, and strut thickness are comparable for all the three foams investigated. It is noted
from Figures 7.2a and 7.2b that foam T65 possesses a fair number of open cells when viewed
from the two orthogonal directions. The SEM of foam T80 reveals that although most of the cells

134
200 µµµµm
200 µµµµm
a)
b) Blow
Figure 7.2 Scanning electron micrographs of the three foams a) T65 viewed parallel to blow direction b) T65 viewed perpendicular to blow direction c) T80 viewed parallel to blow direction d) T80 viewed perpendicular to blow direction e) T100 viewed parallel to blow direction f) T100 viewed perpendicular to blow direction.
Blow
135
200 µµµµm
200 µµµµm
c)
d) Blow
BlowFigure 7.2 Scanning electron micrographs of the three foams c) T80 viewed
parallel to blow direction d) T80 viewed perpendicular to blow direction

136
200 µµµµm
200 µµµµm
e)
f) Blow
BlowFigure 7.2 Scanning electron micrographs of the three foams e) T100 viewed
parallel to blow direction f) T100 viewed perpendicular to blow direction

137
appear to be open when viewed parallel to the blow direction (Figure 7.2c), there are numerous
cells which are still intact as seen perpendicular to the blow direction in Figure 7.2d. This
difference in cell openness in the two directions is due to the differences in cell membrane
characteristics (size, thickness) that are associated with the rise or blow axis relative to those
orthogonal to this same axis. Finally, SEM images of foam T100 reveal that most of the cell
windows of this foam are closed when viewed from both orthogonal directions. The bulk
densities of the foams are presented in Table 7.1. These are noted to be in agreement with
reported bulk densities of 16 � 64 kg/m3 (1 � 4 lb/ft3) of flexible polyurethane foams.11 Also, the
bulk foam density would be expected to be a function of the amount of intact cellular material.
Accordingly, it is observed from Table 7.1 that foam T100 has a density which is slightly higher
compared to the other two foams which have comparable densities.
The urea aggregation behavior of these materials was investigated using TEM, and the
results from this technique are presented in Figure 7.3. The urea aggregates appear as darker
regions on the micrographs due to their greater electron density as compared to the surrounding
polyol phase which appears lighter. It can be seen from these images that the three foams display
marked differences in the urea aggregation behavior. (Recall that all three foams are based on 5
water pphp, i.e., the hard phase content is the same and equal to 32 wt. % for all the three foams.)
Foam T65 distinctly displays the largest urea aggregates, approximately 0.4 � 0.5 µm in size.
This foam also displays urea aggregates which are lathe-like in appearance in contrast to foams
T80 and T100 where the aggregates are more spherical in shape. It can also be observed that the
size of urea aggregates is ca. 0.2 � 0.3 µm in foam T80, where as in foam T100 most of the urea
aggregates are typically smaller than 0.2 µm in size. Previous studies have shown that the
precipitation of the urea phase and the formation of urea aggregates are directly related to the
cell-opening event in flexible polyurethane foams.25, 26 Clearly, foam T65 displays the highest
level of urea aggregation and thus results in the maximum number of open cell windows, as
observed earlier by SEM. Foam T80 possessed smaller aggregates as compared to foam T65 and
thus leads to it possessing an intermediate number of closed windows. Foam T100, which
utilizes pure 2,4 TDI exhibits the least urea phase aggregation and the maximum amount of
closed cellular material.
SAXS profiles for foams T65, T80, and T100 are shown in Figure 7.4. At lower values of
the scattering vector �s�, (where s = (2/λ)sin(θ/2), λ is the wavelength of the X-ray source, and θ

138
b)
1 µµµµm
c)
1 µµµµm
1 µµµµm
a)
Figure 7.3 Differences in urea aggregation as observed by TEM a) T65 b) T80 c) T100. Note that the epoxy which was used to embed the samples is visible in the micrographs of
foams T80 and T100. The foam struts are only those regions which display the urea aggregation, and are enclosed by a dashed boundary.
139
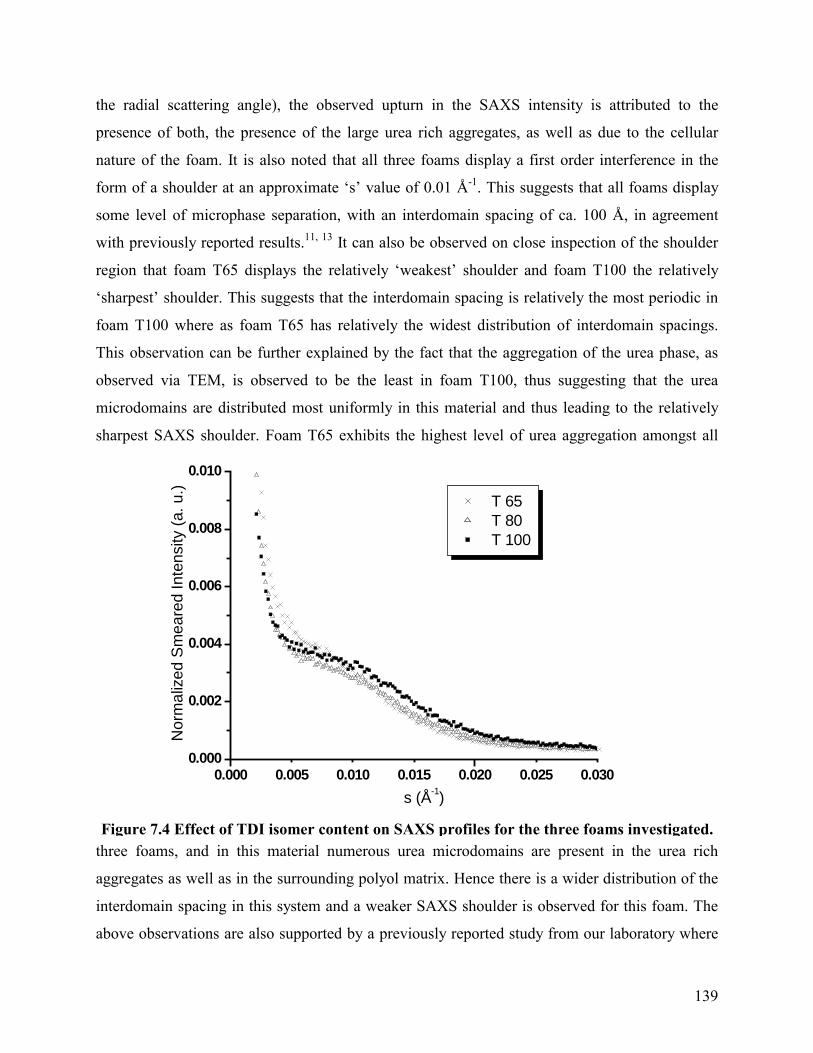
the radial scattering angle), the observed upturn in the SAXS intensity is attributed to the
presence of both, the presence of the large urea rich aggregates, as well as due to the cellular
nature of the foam. It is also noted that all three foams display a first order interference in the
form of a shoulder at an approximate �s� value of 0.01 Å-1. This suggests that all foams display
some level of microphase separation, with an interdomain spacing of ca. 100 Å, in agreement
with previously reported results.11, 13 It can also be observed on close inspection of the shoulder
region that foam T65 displays the relatively �weakest� shoulder and foam T100 the relatively
�sharpest� shoulder. This suggests that the interdomain spacing is relatively the most periodic in
foam T100 where as foam T65 has relatively the widest distribution of interdomain spacings.
This observation can be further explained by the fact that the aggregation of the urea phase, as
observed via TEM, is observed to be the least in foam T100, thus suggesting that the urea
microdomains are distributed most uniformly in this material and thus leading to the relatively
sharpest SAXS shoulder. Foam T65 exhibits the highest level of urea aggregation amongst all
three foams, and in this material numerous urea microdomains are present in the urea rich
aggregates as well as in the surrounding polyol matrix. Hence there is a wider distribution of the
interdomain spacing in this system and a weaker SAXS shoulder is observed for this foam. The
above observations are also supported by a previously reported study from our laboratory where
0.000 0.005 0.010 0.015 0.020 0.025 0.0300.000
0.002
0.004
0.006
0.008
0.010
T 65 T 80 T 100
Nor
mal
ized
Sm
eare
d In
tens
ity (a
. u.)
s (Å-1)
Figure 7.4 Effect of TDI isomer content on SAXS profiles for the three foams investigated.

140
it was noted that the incorporation of lithium chloride in plaques based on molded foam
formulations suppressed the formation of urea aggregates and resulted in a corresponding
sharpening of the SAXS shoulder.10
Hydrogen bonding is known to play an important role in determining the morphology as
well as mechanical properties of a variety of polymers such as polyurethanes, poly(urethane
ureas), polyamides, polyvinyl alcohol amongst other polymers which are capable of forming
hydrogen bonds.27, 28, 29 The urea microdomains in polyurethane foams are known to possess
bidentate hydrogen bonding which is associated with a 1640 cm-1 absorbance observed via
FTIR.9 The presence of hydrogen bonding also leads to the hard segments packing in an
organized manner, which is not truly crystalline, but can be detected by a 4.7 Å reflection via
WAXS.9 Normalized FTIR scans for the three foams investigated are shown in Figure 7.5. It can
be noted that the hard segments in all the three foams possess bidentate hydrogen bonding as
observed by the presence of a 1640 cm-1 peak. On comparing the data for the three foams, it is
seen that foam T65 exhibits the maximum absorbance at 1640 cm-1, suggesting that the hard
segments in this foam possess the highest level of bidentate hydrogen bonding. The 1640 cm-1
absorbance is found to decrease as the 2,4 TDI isomer content is increased, thus suggesting that
the symmetry of the isocyanate moiety has a considerable impact on the packing behavior of the
1740 1720 1700 1680 1660 1640 1620 1600
0.08
0.12
0.16
0.20
0.24
0.28
Abso
rban
ce
Wavenumber (cm-1)
T 65 T 80 T 100
Figure 7.5 Portion of FTIR spectrum showing influence of the TDI isomer content on the hydrogen bonding characteristics of foams T65, T80, and T100.

141
urea hard segments within the urea microdomains. As referenced earlier, studies carried out by
Sung and Schneider also suggested that polyurethane elastomers based on the 2,6 TDI isomer
exhibit a higher extent of hydrogen bonding as compared to elastomers based on 2,4 TDI.18
WAXS patterns (not shown in this chapter) for all three foams display a 4.7 Å d-spacing,
suggesting that the nature of short-range ordering of the hard segments is similar in all three
foams.
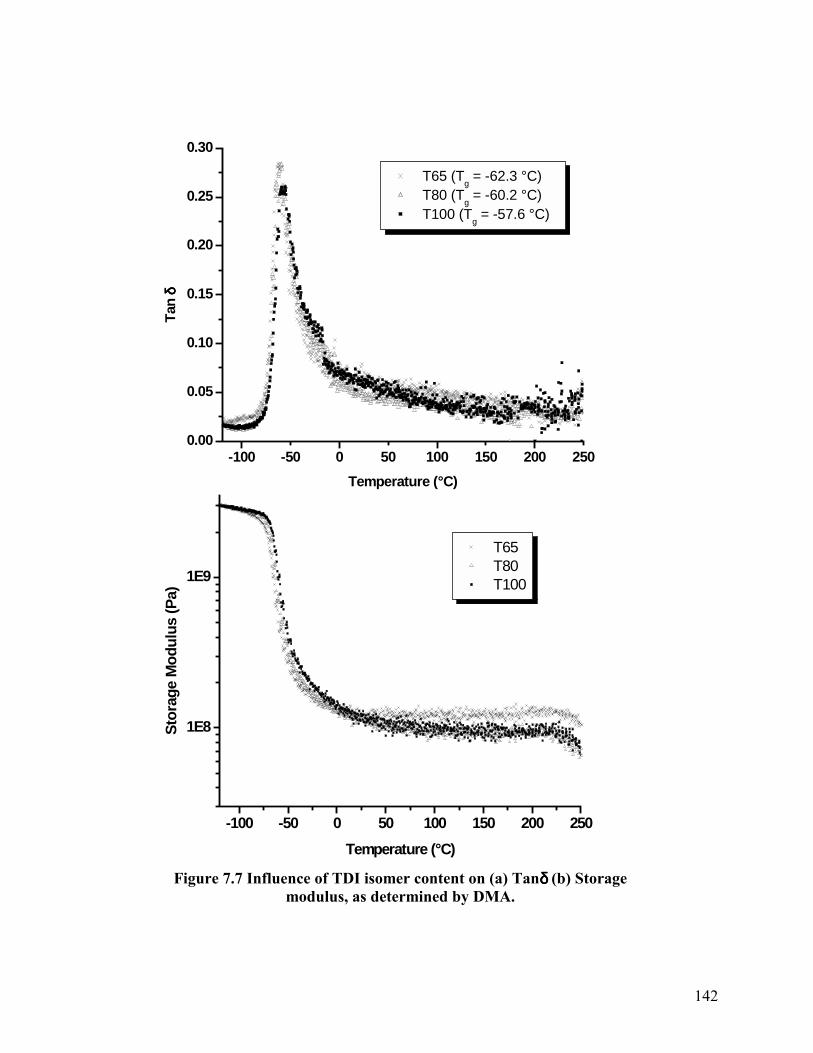
DSC and DMA were used to ascertain differences in the soft segment glass transition of
the three foams analyzed. The soft segment Tg was determined as the inflexion point from the
DSC glass transition region and as the peak Tanδ position from DMA. DSC results are presented
in Figure 7.6, DMA results in Figure 7.7(a) and the soft segment Tg values obtained are
summarized in Table 7.2. Clearly, both techniques demonstrate that the soft segment Tg
decreases as the content of the symmetric 2,6 TDI isomer is increased. As discussed earlier, a
similar trend was noted by Nierzwicki on examining a series of polyurethane elastomers with
varied contents of the 2,4 and 2,6 TDI isomer ratios.19 This observed trend suggests that an
increase in the content of the symmetric isomer enhances the perfection of microphase-
-75 -50 -25 0 25
Tg = -52.6 °C
Tg = -55.1 °C
Tg = -55.8 °C T65 T80 T100
Endo
ther
mic
Temperature (°C)Figure 7.6 Soft segment glass transition region as observed from DSC
for foams T65, T80, and T100.
142
-100 -50 0 50 100 150 200 2500.00
0.05
0.10
0.15
0.20
0.25
0.30Ta
n δδ δδ
Temperature (°C)
T65 (Tg = -62.3 °C) T80 (Tg = -60.2 °C) T100 (Tg = -57.6 °C)
-100 -50 0 50 100 150 200 250
1E8
1E9
Stor
age
Mod
ulus
(Pa)
Temperature (°C)
T65 T80 T100
Figure 7.7 Influence of TDI isomer content on (a) Tanδδδδ (b) Storage modulus, as determined by DMA.
143
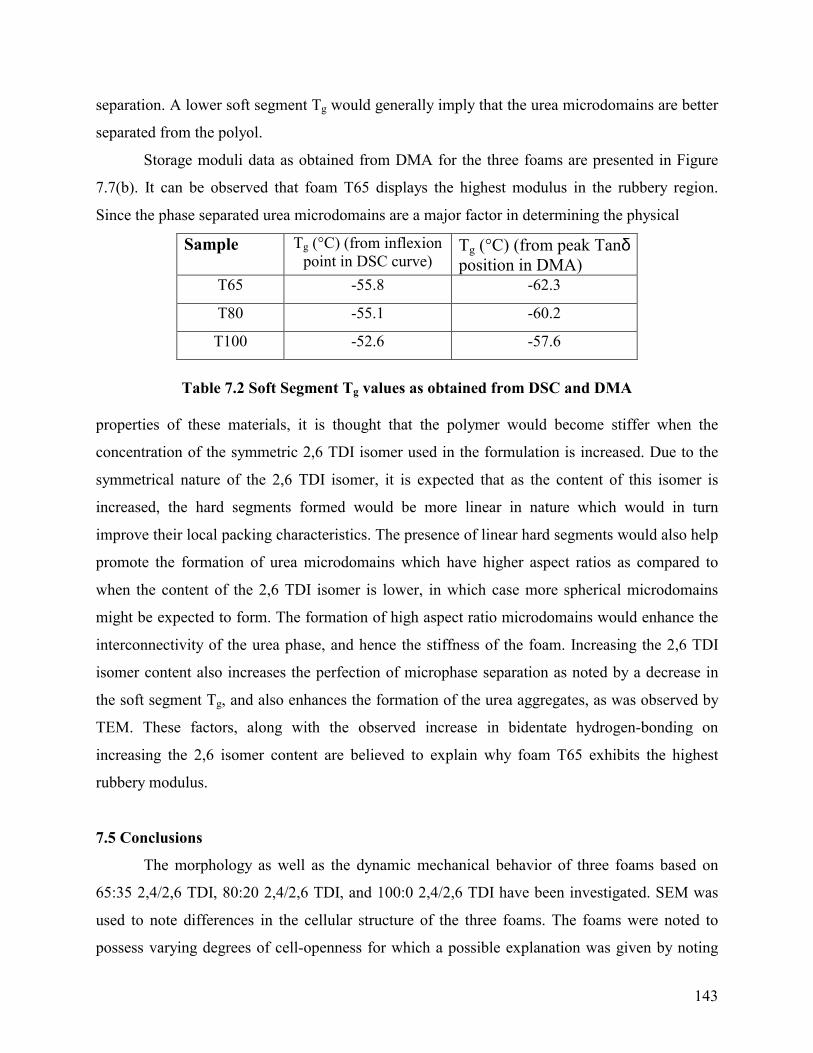
separation. A lower soft segment Tg would generally imply that the urea microdomains are better
separated from the polyol. Storage moduli data as obtained from DMA for the three foams are presented in Figure
7.7(b). It can be observed that foam T65 displays the highest modulus in the rubbery region.
Since the phase separated urea microdomains are a major factor in determining the physical
Sample Tg (°C) (from inflexion point in DSC curve)
Tg (°C) (from peak Tanδ position in DMA)
T65 -55.8 -62.3
T80 -55.1 -60.2
T100 -52.6 -57.6
Table 7.2 Soft Segment Tg values as obtained from DSC and DMA
properties of these materials, it is thought that the polymer would become stiffer when the
concentration of the symmetric 2,6 TDI isomer used in the formulation is increased. Due to the
symmetrical nature of the 2,6 TDI isomer, it is expected that as the content of this isomer is
increased, the hard segments formed would be more linear in nature which would in turn
improve their local packing characteristics. The presence of linear hard segments would also help
promote the formation of urea microdomains which have higher aspect ratios as compared to
when the content of the 2,6 TDI isomer is lower, in which case more spherical microdomains
might be expected to form. The formation of high aspect ratio microdomains would enhance the
interconnectivity of the urea phase, and hence the stiffness of the foam. Increasing the 2,6 TDI
isomer content also increases the perfection of microphase separation as noted by a decrease in
the soft segment Tg, and also enhances the formation of the urea aggregates, as was observed by
TEM. These factors, along with the observed increase in bidentate hydrogen-bonding on
increasing the 2,6 isomer content are believed to explain why foam T65 exhibits the highest
rubbery modulus.
7.5 Conclusions
The morphology as well as the dynamic mechanical behavior of three foams based on
65:35 2,4/2,6 TDI, 80:20 2,4/2,6 TDI, and 100:0 2,4/2,6 TDI have been investigated. SEM was
used to note differences in the cellular structure of the three foams. The foams were noted to
possess varying degrees of cell-openness for which a possible explanation was given by noting

144
differences in the urea aggregation behavior of the foams via TEM. SAXS results indicated that
all three foams were microphase separated and possessed similar interdomain spacings. DSC and
DMA showed that the soft segment Tg decreased as the content of the 2,6 TDI isomer was
increased � thus suggesting that the perfection of microphase separation was enhanced on
increasing the symmetric isomer content. FTIR revealed that an increase in the content of the
symmetric 2,6 TDI isomer increased the level of hydrogen bonding of the hard segments. The
increased level of phase separation and hydrogen bonding in the foam containing the 65:35 TDI
isomer mixture led to its possessing the highest rubbery modulus as noted by DMA.
The issue of �connectivity� or the continuity of the hard phase has been of interest to
workers in the area of polyurethanes. Hydrogen bonding of the hard segments results in these
materials possessing inter-segmental connectivity. In the case of polyurethane foams,
aggregation of the urea phase at the micron level leading to an increase in connectivity at the
urea aggregate level may play an important role in determining the mechanical properties of the
foam. Greater inter-segmental connectivity as observed by FTIR, and also greater urea aggregate
connectivity as observed via TEM is thought to play an important role in enhancing the rubbery
modulus of foam T65. The issue of urea phase connectivity at different length scales has been
indirectly addressed in the same laboratory using the cross-linking agent diethanol amine
(DEOA)30 and is currently being probed more directly using LiCl as an additive.10, 31
7.6 References
1. Hepburn, C. In Polyurethane Elastomers, 2nd ed.; Elsevier Applied Science: London,
1991. 2. Neumüller, W.; Bonart, R. J Macromol Sci Phys 1982, B(21)2, 203-217. 3. Tyagi, D.; McGrath, J.E.; Wilkes, G.L. Polym Eng Sci 1986, 26, 1371-1398. 4. Koberstein, J.T.; Stein, R.S. J Polym Sci Polym Phys 1983, 21, 1439-1472. 5. Abouzahr, S.; Wilkes, G.L.; Ophir Z. Polymer 1982, 23, 1077-1086. 6. Christenson, C.P.; Harthcock, M.A.; Meadows, M.D.; Spell, H.L.; Howard, W.L.;
Creswick, M.W.; Guerra, R.E.; Turner, R.B. J Polym Sci Polym Phys 1986, 24, 1401-1439.
7. McLean, R.S.; Sauer, B.B. Macromolecules 1997, 30, 8314-8317. 8. Garrett, J.T.; Runt, J.; Lin, J.S. Macromolecules 2000, 33, 6353-6359. 9. Kaushiva, B.D.; McCartney, S.R.; Rossmy, G.R.; Wilkes, G.L. Polymer 2000, 41, 285-
310. 10. Aneja, A.; Wilkes, G.L. J Appl Polym Sci 2002, 85, 2956-2967.

145
11. Herrington, R.; Hock, K. In Flexible polyurethane foams, 2nd ed.; Dow Chemical Co.:
Midland, MI, 1998. 12. Ade, H.; Smith, A.P.; Cameron, S.; Cieslinski, R.; Mitchell, G.; Hsiao, B.; Rightor, E.
Polymer 1995, 36, 1843-1848. 13. Armistead, J.P.; Wilkes, G.L.; Turner, R.B. J Appl Polym Sci 1988, 35, 601-629. 14. Moreland, J.C.; Wilkes, G.L.; Turner, R.B. J Appl Polym Sci 1994, 52, 549-568. 15. Moreland, J.C.; Wilkes, G.L.; Turner, R.B. J Appl Polym Sci 1994, 52, 569-576. 16. Gmitter, G.T.; Gruber, E.E. SPE Journal 1957, 13/1, 27-30. 17. Smith, C.H.; Petersen, C.A. SPE Journal 1962, 18/4, 455-459. 18. Sung, C.S.P.; Schneider N.S. Macromolecules 1975, 8, 68-73. 19. Nierzwicki, W. J Appl Polym Sci 1990, 41, 907-915. 20. Molau, G.E. In Colloidal and Morphological Behavior of Block and Graft Copolymers;
Plenum Press: New York, 1971. 21. Matsen M.W.; Schick, M. Phys Rev Lett 1994, 72, 2660-2663. 22. Bates, F.S.; Fredrickson, G.H. Phys Today 1999, 52/2, 32-38. 23. Seymour, R.W.; Cooper, S.L. Adv Urethane Sci 1974, 3, 66-80. 24. Moreland, J.C.; Wilkes, G.L.; Turner, R.B.; Rightor, E.G. J Appl Polym Sci 1994, 52,
1459-1476. 25. Rossmy, G.L.W.; Schator, H.; Wiemann, M.; Kollmeier, H.J. J Cell Plast 1981, 17, 319-
327. 26. Neff, R.A.; Macosko, C.W. Rheologica Acta 1996, 35, 656-666. 27. Abouzahr, S.; Wilkes, G.L. J Appl Polym Sci 1984, 29, 2695-2711. 28. Yilgör, E.; Burgaz, E.; Yurtsever, E.; Yilgör, İ. Polymer 2000, 41, 849-857. 29. Marten, F.L. Vinyl Alcohol Polymers. Encycl Polym Sci Tech, Wiley, New York, 1985,
17, 167-198. 30. Kaushiva, B.D.; Wilkes, G.L. J Appl Polym Sci 2000, 77, 202-216. 31. Aneja, A.; Wilkes, G.L. Polymer 2002, 43, 5551-5561.