a study of wildland fire direction indicator …
TRANSCRIPT

1
A STUDY OF WILDLAND FIRE DIRECTION INDICATOR RELIABILITY FOLLOWING TWO
EXPERIMENTAL FIRES
Albert Simeoni, Zachary C. Owens, Erik W. Christiansen, Abid Kemal Exponent, Inc. USA
Michael Gallagher, Kenneth L. Clark, Nicholas Skowronski Northern Research Station, USDA Forest Service, USA
Eric V. Mueller, Jan C. Thomas, Simon Santamaria, Rory M. Hadden School of Engineering, University of Edinburgh, UK
ABSTRACT
Two experimental fires, with contrasting intensities, were conducted in March 2016, in the Pinelands National Reserve (PNR) of New Jersey, United States in order to provide a preliminary assessment of the reliability of the fire direction indicators used in wildland fire investigation. The experiments were part of a larger project intended to measure firebrand production in a forested ecosystem. As part of this project, fire behavior, as well as the environmental and fuel conditions were also measured. Two burn parcels, covering an area of approximately 30 hectares each, were ignited from unimproved forest roads which delimited them. The forest canopy was comprised primarily of pitch pine with intermittent oaks. The understory contained a mixed shrub layer of huckleberry, blueberry, and scrub oaks. In order to explore a wide range of indicators, objects such as bottles, cans and small fence elements were planted in the burn area, and photographed before and after the fire. To obtain an accurate measure of pre- and post-fire fuel properties, fuel load, fuel bulk density, and fuel moisture content were also measured. In addition, environmental data (wind velocity and direction, air temperature and humidity) were recorded. The fire behavior can be reconstructed using measurements of fire rate of spread, fire front temperatures, fire front geometry, and heat fluxes. Video and infrared cameras were used to document the general fire behavior in selected locations. This paper represents the first step in the analysis of the fire indicators and focuses on the more intense of the two burns and on the appearance of the macro- and microscale fire pattern indicators. A majority of the indicators were assessed, although the configuration of the burn parcels, the ignition technique, and precipitation immediately following the fires limited a full study. The results show that some fire direction indicators are highly dependent on local fire conditions and fire behavior and may be in contradiction with the general spread of the fire. Overall, this study demonstrates that fire pattern indicators are a useful tool but must be interpreted in the frame of a general analysis of the fire, combined with a good understanding of fire behavior and fire dynamics. INTRODUCTION
Wildland fires have a dramatic impact on the environment, human life, and property and cause significant economic losses, as demonstrated by the devastating wildfires that have occurred over the last few years1. The impact of these fires is expected to increase dramatically2 with the rapid expansion of the Wildland Urban Interface (WUI)3,4 and because changing climate will likely increase the probability and intensity of wildland fires5. In order to face this challenge and properly address the issues related to the ignition of those fires, it is necessary to ensure that their origin and cause are accurately determined. In the United States, the Guide to Wildland Fire Origin and Cause Determination (a revised version of which was published earlier this year)6, and NFPA 921: Guide for Fire and Explosion Investigations7 provide guidance on conducting wildland fire origin and cause investigations. This study will refer to the Guide6 as it is more detailed and it is dedicated only to wildland fire investigation. The Guide presents a systematic method of investigation for the origin and cause determination and relies on fire pattern indicators. A fire pattern indicator is a physical object that displays changes when affected by a fire. An overall fire pattern is derived from the accurate analysis of individual fire direction indicators and shows the general fire progression. The Guide presents the following 11 indicators6: protection, grass stem, freezing, angle of char, spalling, curling, sooting, staining, white ash, cupping, and V or U patterns. The

2
Guide also includes a discussion on the reliability of fire pattern indicators and exceptions that may apply under certain conditions.
The indicators are further divided in two classes: The Macroscale Fire Pattern Indicators and the Microscale Fire Pattern Indicators6. Macroscale Fire Pattern Indicators are associated with large objects and are easily noticeable, for example an angle of char on a tall tree. On the other hand, Microscale Fire Pattern Indicators are only observable by getting up close to an object, such as studying a blade of glass using a magnifying glass. Interpreting Microscale Fire Pattern Indicators typically becomes more important as investigators work closer to the ignition area.
The focus of this paper is to provide a first analysis of the fire pattern indicators recorded on one of two experimental fires conducted in the New Jersey Pine Barrens in Spring 2016. The experimental fires happened in the context of a research project linked to the study of ember production and fire behavior in large-scale, medium to high intensity field experiments8. The fire of interest displayed a high intensity due to passive crowning when going through the study area of the fire pattern indicators. This investigation of indicators is symbiotic with the ember and fire spread studies because the fire behavior and other environmental conditions were observed in detail by using a large set of instruments. Several items were planted inside the burn parcels to support the appearance of certain microscale indicators in addition to microscale indicators that appeared on natural vegetation. The analysis of the fire pattern indicators coupled with the measurement of the fire properties provide an exceptional scientific framework to study the reliability of the indicators in the specific conditions of the experimental fires and to complement the studies supporting the Guide to Wildland Fire Origin and Cause Determination9. We hope that this study will help fire investigators to better use the fire pattern indicators by better understanding their reliability and how they appear in relation to fire behavior. In this work, we focused on the fire behavior as observed through the visual cameras. In the future, the measurements of the physical properties of the fire, along with the data from the weather station and the sonic anemometer will also be included to provide a more detailed analysis. METHODS Study Site
The experimental fire was conducted in the Pinelands National Reserve (PNR) of New Jersey, United States. The PNR is over 1 million acres, and is host to an active fuel management program by the New Jersey Forest Fire Service and federal wildland fire managers. The climate is classified as cool temperate, with mean monthly temperatures of 0.3°C in January and 24.3°C in July, and a mean annual precipitation of 1159 mm. The terrain consists of plains, low-angle slopes, and wetlands, with a maximum elevation of 62.5 m. Two burn parcels covering areas of approximately 28 and 38 hectares were used for the experiments. The forest canopy in the parcels were comprised primarily of pitch pine (Pinus rigida Mill.), with intermittent oaks (Quercus spp.). Understory vegetation was dominated by huckleberry (Gaylussacia baccata), blueberry (Vaccinium palladum), inkberry (Ilex glabra), briar (Smilax rotundifolia), scrub oak (Quercus marilandica and Quercus ilicifolia), wintergreen (Gaultheria procumbens), and sedge (Carex pennsylvanica) in relative order of importance. Measurement Techniques
Point measurements of fire behavior were made using two Fire Behavior Packages (FBP), each supporting various instruments, such as thermocouples, heat flux sensors and pressure probes for the measurement of air velocity10. Additionally, a raised platform (17 m) supported a 3D sonic anemometer, a visual camera, an infrared camera, and a weather station. 18 video cameras were positioned around the FBPs to obtain front, back and side views of the fire at different view angles, showing fire spread at ground and canopy levels. All the instruments were distributed within the area to be burned, excluding a few cameras to obtain a large view of the fire front and the raised platform, which was situated at the edge of the fire and allowed for the measurement of ambient, near-fire wind, and weather conditions during the time of the fire. Fire indicators were planted in clusters in three different areas on the two parcels as shown

3
in Figures 1.a and 1.b. Figure 1.b details the close locations of the fire indicators on Parcel 1 as this paper is focused on the results from the burning of Parcel 1.
For each parcel, fifteen destructive harvest locations were randomly chosen before and after the fires. At each location, surface fuels in a 0.5 m2 area were harvested down to mineral soil. Pre-burn sampling was conducted within the two weeks prior to the burns, and post- burn sampling was conducted within the week following treatment. All shrub and forest floor materials present down to and excluding the duff layer (Oi soil horizon), were dried at 70ºC for a minimum of 48 h, sorted into different fuel classes and types, and weighed. Since destructive harvest sampling cannot be resampled again after treatments, assessing fuel consumption is challenging. We used the OpenBUGS (OpenBUGS, version 3.2.3 rev 1012) MCMC simulator11 to resample and derive the distributional properties of the fuels in each plot from the harvested samples. These distributions allowed for estimates of pre-burn loading, post-burn loading, and consumption for each fuel type across each burn unit (Table 1).
Forest canopy biomass was estimated before and after treatments in 3 permanent 20 x 20 m plots, using a Riegl Laser Rangefinder (Model # LD90-3100VHS-FLP, Riegl USA, Orlando, FL). Following the methods described by Clark et al.12, 21 parallel transects spaced 1 m part were paced at a consistent rate with the LiDAR unit and logged to a Trimble Ranger. The device was carried at a height of 2 m, at the top of the shrub layer, providing canopy data above that height. Raw transect data was summarized into 1 m height bins across each plot, and were used to estimate available canopy fuel loading from the equation for pitch pine dominated stands in Clark et al.12 Available canopy fuels include live and dead needle, 1-hr, and 10-hr biomass. We estimated a canopy height of range 14-22 m for both burn units from the LiDAR data.
Moisture content was estimated for surface and canopy fuel components at each parcel. Five samples, including the forest floor, shrub, pine needles, and pine 1- and 10-hr twigs were harvested for each burn, weighed wet, dried for 48 hours at 70ºC, and weighed dry.
Figure 1. a) Burn parcels and location of planted fire indicator plots
b) Parcel 1 with location of 3 fire indicator plots Burn Conditions
The fires were conducted in the Penn State Forest part of the PNR on March 18th and 19th, 2016 for Parcels 1 and 2, respectively. Figure 2.a shows a typical vegetation layout on the parcels. As this paper only discusses the fire pattern indicators found on Parcel 1, the burn conditions and the results will only be presented for Parcel 1.
Parcel 1
Parcel 2
N
0 1 km
Z Y
X
0 400 m
N

4
Two simultaneous ignitions of Parcel 1 were carried out by the New Jersey Fire Service, using drip torches along the whole length of the roads bordering the western and northern sides of the parcel. Ignitions started from the northwest corner of the parcel at 5:55 pm (EST) and lasted for approximately 15 minutes, until the opposite end of the parcel sides were reached. The duration of the fire was determined to be approximately 25 minutes, though much of the parcel was consumed in 15 minutes. During this 25-minute period, mean ambient temperature was around 13.4°C and mean relative humidity was 21.7%. The wind was also quite constant with a direction of WNW and an average speed of 1.4 ± 0.6 m/s (mean ± 1 SD). Occasional gusts of 4.4 m/s were observed, as well as lulls of 0.5 m/s (1-minute maximum and minimum values).
Fuel moisture content (FMC), expressed as a percentage of water mass over oven dry mass, for all forest floor fuels and surface fuels were 30.6 ± 10.8% and 64.5 ± 7.6%, respectively. For the canopy, pine needle and 1-h FMC were 122.3 ± 6.9% and 83.5 ± 5.4%, respectively.
The fuel loads for the finest fuels that supported the fire spread are presented in Table 1. For these fine fuels, an average of 37% of the canopy was consumed, as well as 62% of the surface fuels and 67% of the forest floor.
Table 1 – Measurements of fuel load (± relative standard deviation) for the vegetation samples collected on Parcel 1
Fuel Pre-burn (T/ha)
Post-burn (T/ha)
Consumption (T/ha)
Canopy (pitch pine) Pine needles, 1-h, 10-h 26.24 ± 0.88 16.48 ± 3.90 9.70 ± 8.72
Surface fuel Leaves 0.07 ± 5.68 0.00 ± 0.04 0.04 ± 0.21 1-h stems 5.35 ± 0.36 2.04 ± 1.19 3.31 ± 1.24
Forest Floor Fine 13.94 ± 5.68 4.20 ± 2.50 9.74 ± 6.20 1-hr wood 1.31 ± 0.98 0.76 ± 0.64 0.55 ± 1.17
Fire Pattern Indicators
Figure 2. a) Typical vegetation layout on the parcels
b) One set of items for creating a fire pattern indicator cluster Some of the usual types of support for fire pattern indicators were very scarce or not present at all
on the parcels. This was due to the type of landscape and ecosystem, as well as the fact that the parcels were located in interior forest, quite far from paved roads. Hence, some supporting items were planted in clusters at different locations (X, Y and Z in Parcel 1) to support the appearance of microscale fire pattern indicator

5
clusters6. Figure 2.b displays a set of supporting items used at every location. The set consists of fence elements (plastic, wood and metal), soda cans, aluminum and wooden poles, tomato nets, ornamental bricks, stones and metal flowers, as well as beer bottles (not included in Figure 2.b).
Due to the type of vegetation, the ignition procedure (line fire), the intense fire behavior, the supporting items used for the indicators (small planted items), and the post-fire weather conditions (rain), it was not possible to observe all the indicators mentioned in the Guide6. Only the following ones are described hereafter: protection, freezing, angle of char, spalling, curling, sooting, staining, and cupping. Grass stems, white ash, as well as V or U patterns could not be observed and are not included in the analysis. RESULTS Fire Behavior The wind was pushing the western fire line eastward (in the ENE direction) whereas the northern ignition line spread slower because it was not aligned with the wind and was much less influenced by it. The two lines finally joined as the northern line pulled towards the western line, converging in a zone located on the east side of the planted items (east of Plot X on Figure 3). When the fire reached the planted items, it was very intense, due to a combination of the fuel layout (ladder fuel) and wind13. The fire line was also orientated WSW (see Figure 3) because of the convergence of the two fires, making the more intense fire line from the west rotate slightly towards the fire line coming from the north ignition. The average consumptions in the floor and canopy (Table 1) show a quite intense surface fire with episodes of passive crowning that was previously observed in similar experimental fires in the PNR13.
The fire pattern can be observed in Figures 1.a and 1.b. The vegetation close to the ignition lines was only consumed on the ground, showing an untouched canopy for a few meters. Then, the surface fire gained in intensity and the canopy was dried and discolored by the heat from the fire plume. Fair and dark spots show locations of low intensity surface fires and of torching trees, respectively. The large black spot in the middle of the parcel and close to the fire pattern indicator clusters represents totally consumed trees, making the blackened soil below visible. This was the area of highest fire intensity, just ahead of the fire indicator study sites. For the three indicator plots X, Y and Z, the fire spread approximately from west to east. The fire was decreasing in intensity when traveling from Z to X, Z being impacted by the fully developed crown fire while X was in the transition area from crown to surface fire (see Figure 1.b, where the canopy over X is not fully consumed). This decrease was mainly due to the fuel load on the ground as Z was containing a very dense layer of shrubs of an approximate height of 2-2.5 m, while X was containing lower shrubs around 50-80 cm height. Y was in a transition zone but was mainly covered by thick and high shrubs. However, for all sites the fire had the characteristics of an advancing fire and was not representative of the fire starting to spread around the origin area6.
The analysis of the fire indicators will thus be focused on the determination of the direction of spread in the fully developed fire. For a wildland fire investigation, this would represent the beginning of the analysis when the fire investigator is working from the advancing side of the fire towards the area of origin6. Fire Indicators Figure 3 displays as a line the overall direction of fire spread as observed with the video cameras and the arrows pointing to the planted items and trees represent the direction of maximum heat impact. The arrows show that the maximum heat impact generally comes from the fire front, as displayed by the soda can, the purple flower, the shrub, the yellow flower and the pine cone. The soda can and pine cone are offset by around 45 degrees, which is still in an expected range due to local fire behavior variability6.
Figures 4 show the microscale fire pattern indicators found on the soda can (a), the pine cone (b), the shrub (c), and the wooden pole and the yellow flower (d). The soda can revealed staining and protection, the pine cone charring and protection, the shrub freezing and curling, and the flowers a combination of staining and charring of the coating (they were ornamental garden items made of painted steel).
The stain on the soda can was very pronounced and the protection behind it showed untouched pine litter (Figure 4.a). The pine cone was charred in the direction of the upcoming fire front and the litter behind

6
it was untouched (above the pine cone in Figure 4.b). The few shrubs that were not totally consumed showed clear freezing in the direction of the fire spread. Curling of the leaves did not exhibit any clear directionality (see Figure 4.c) because freezing obfuscated any directionality that may have been present. Curling usually happens ahead of the fire front and freezing usually happens behind the fire front, during the time the leaves are cooling down, and will orientate the leaves in the wind direction. This is why the microscale curling indicator is more reliable for low intensity, backing fires when freezing is less likely to happen6. In addition, this species of shrubs (briar) has a very thick cuticle, which makes curling by the heat from the fire front less likely to happen in the fire direction6. The wooden pole showed a clear angle of char (Figure 4.c). The low side of the char was located on the side facing the fire, which is characteristic of an advancing fire, according to the Guide6. The ornamental steel flowers were planted to identify some natural features, such as logs or trees and allow them to be found after the fire. However, they displayed a very clear staining and charring pattern that was very consistent with the direction of spread (see yellow and purple flowers and their arrows in Figure 3). This is attributed to the curved surface of the top the flowers that had an optimal view angle to capture radiative heat coming from the fire front. A tree trunk showed a direction of heat impact opposed to the fire spread (see “Tree” on Figure 3). The tree trunk displayed a char angle similar to the one of the wooden pole, consistent with the characteristic of an advancing fire, according to the Guide6. Its canopy was mostly intact and did not exhibit much scorching. The other planted items (the plastic fence, one soda can, the aluminum pole, the tomato net, the ornamental bricks, and the beer bottles) did not show a clear directionality and were not included in Figure 3.
Figure 3. Fire Indicators at plot X (Parcel 1), the arrows show the direction of heat impact
Figure 5 shows the wooden and metallic fences. The plastic fence was totally consumed. The wood
fence exhibited charring and the metallic fence sooting and charring of its coating. These two fences showed a direction of maximum heat impact almost parallel to the fire front. This is mostly attributed to the fact that these fence elements were long and very thin and could only show a direction aligned with their orientation on the parcel, which was almost exactly perpendicular to the arrows shown on Figure 3.
Shrub
SodaCan
PurpleFlower
Tree
WoodenPostWoodenFence
YellowFlower
MetallicFence
PineCone
FIRE
0 30m
N
7
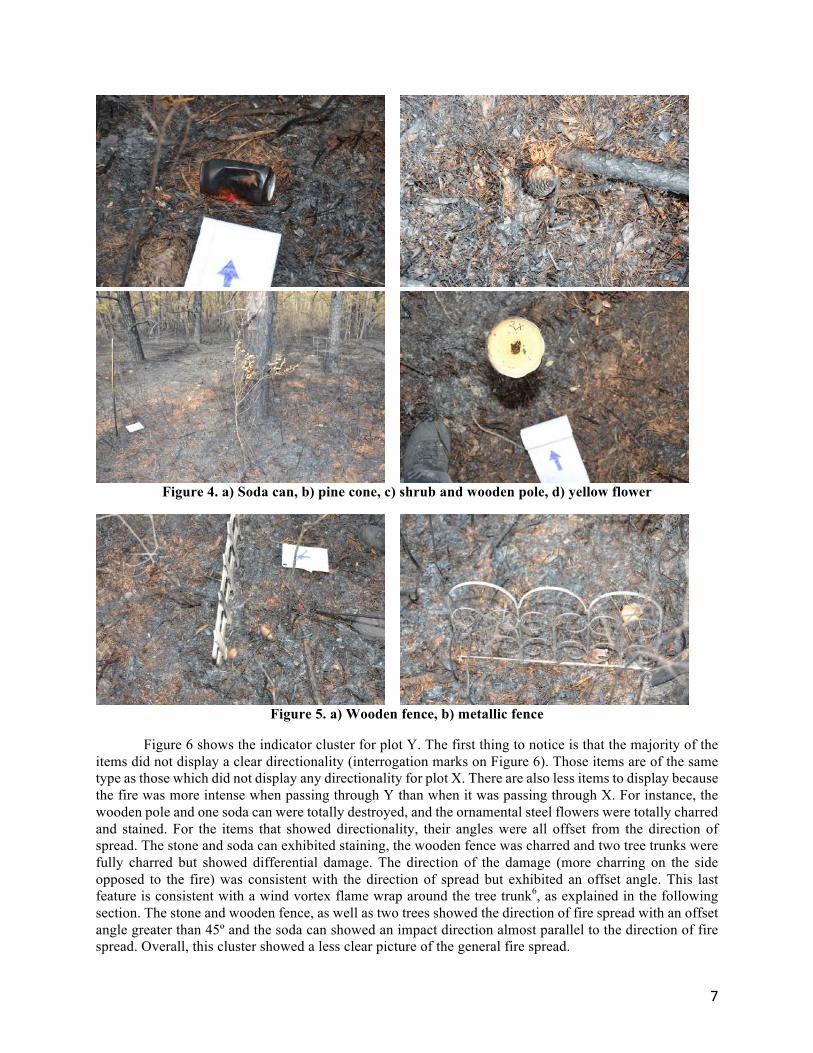
Figure 4. a) Soda can, b) pine cone, c) shrub and wooden pole, d) yellow flower
Figure 5. a) Wooden fence, b) metallic fence
Figure 6 shows the indicator cluster for plot Y. The first thing to notice is that the majority of the
items did not display a clear directionality (interrogation marks on Figure 6). Those items are of the same type as those which did not display any directionality for plot X. There are also less items to display because the fire was more intense when passing through Y than when it was passing through X. For instance, the wooden pole and one soda can were totally destroyed, and the ornamental steel flowers were totally charred and stained. For the items that showed directionality, their angles were all offset from the direction of spread. The stone and soda can exhibited staining, the wooden fence was charred and two tree trunks were fully charred but showed differential damage. The direction of the damage (more charring on the side opposed to the fire) was consistent with the direction of spread but exhibited an offset angle. This last feature is consistent with a wind vortex flame wrap around the tree trunk6, as explained in the following section. The stone and wooden fence, as well as two trees showed the direction of fire spread with an offset angle greater than 45º and the soda can showed an impact direction almost parallel to the direction of fire spread. Overall, this cluster showed a less clear picture of the general fire spread.

8
Figure 6. Fire Indicators at plot Y (Parcel 1), the arrows show the direction of the heat impact.
The interrogation marks mean that no direction could be determined.
No figure was included for plot Z because none of the items displayed a clear pattern. It is worth mentioning that plot Z was located in the most intense zone of the fire, where all the tree canopy, shrubs and forest floor fuels were totally consumed (even some of the thicker fuels not displayed in Table 1 fully disappeared). Plot Z displayed very few macroscale indicators as well, because all the vegetation was heavily damaged, blurring the directionality. This is consistent with a very intense head fire6.
Figure 7. Crown freezing
In addition to the clusters of microscale fire pattern indicators, some macroscale indicators were
also noticeable around plots X and Y. Figure 7 shows crown freezing. The direction of freeze (circled in Figure 7) was consistent with the direction of fire spread all around plot X and mostly around plot Y. It was not distinguishable around plot Z because all crowns were fully consumed. Figure 8 displays cupping on shrubs, which were clearly showing the direction of fire spread. There was more cupping for the branches facing the fire front (circled in Figure 8) and less cupping in the opposite direction, as it can be seen in the back face of the shrub on Figure 8. The shrubs were burned to the ground on plot Z, so this feature was not observable.
?
? ?
?
Beer bottle
Two trees Brick Beer bottle
N
Soda Can
?
Stone
Brick Aluminum pole
0 30 m
FIRE

9
Figure 8. Cupping
DISCUSSION
The specificity of the ecosystem, the ignition procedure, the weather conditions, and the nature of the planted items did not allow for the observation of all the eleven fire pattern indicators from the Guide6Error! Bookmark not defined.. The ground in the Pine Barrens is covered by pine needles so very little grass is present, making the grass stems indicator not possible to observe. Most of the planted indicators that could display any sooting (metallic fence and tomato net) were quite thin and the precipitations following the fire made pinpointing any specific direction not possible. Larger indicators mostly displayed charring and not sooting (even if the metallic fence had some). In addition, the aluminum poles did not collect enough soot to provide any meaningful results. Any white ash present after the burn was likely washed away by heavy rains a few hours after the fire. The sandy soil did not have any rocks present on the ground, so some stones and bricks were planted but even if some spalling was observed, it did not indicate any specific fire direction. Only one stone (over more than 30 overall) that was located on plot Y was stained enough to show the fire spread direction with an offset angle (see Figure 6). A “U” or “V” pattern could not be observed because of the line ignitions and the lack of slope on the parcel.
In general, the planted items supported the appearance of microscale fire pattern indicator clusters that gave a good indication of the direction of fire spread. The addition of the macroscale indicators, such as freezing, angle of char, degree of damage and cupping allowed an accurate determination of the direction of spread for plots X and Y. Plot Z, where the fire was the most intense, did not allow for the determination of any obvious direction of fire spread. However, it should be noticed that fire pattern indicators were visible around plot Z, before and after the zone where the fire exhibited full crown involvement (large dark area in Figure 1.b). Thus, it was possible to determine the direction of fire spread around this zone. These observations are consistent with the Guide to Wildland Fire Origin and Cause Determination6.
However, some indicators showed a lack of consistency that deserves to be noted: • Some of the tree trunks in plots X and Y displayed wind vortex flame wrap (see Figure 9).
If this effect is mentioned in the Guide6, it is attributed to the wind. In the case of Parcel 1, the wind was quite low (1.4 m/s in average) but the fire was very intense. Thus, most of the degree of damage observed on the leeward side of the trunks was due to the air sucked into the fire front from the back of the fire.
• This fire front effect also applied to crown freezing (Figure 7). For this fire, crown freezing was mostly showing the direction of the spread (ENE as seen in Figures 3 and 6) and not the direction of the wind (pointing ESE). The Guide mentions that foliage freezing generally shows the wind direction but can also be due to the draft from the fire6. This was

10
the case here due to the low average wind velocity and the gusts of wind did not change the direction of foliage freezing.
• There was a large amount of spotting on the parcel. Figure 10 shows spotting occurring on plot Y, at the approximate location of the soda can (the wood fence can be observed on the right of the spotting fire). This spot fire is likely to have caused the soda can indicator to have pointed north (see Figure 6).
• The flat fence elements could not show any direction that was not perpendicular to them. • Protection as a macroscale indicator was very difficult to observe for the intense part of the
fires (in and around plots Y and Z) because a lot of post-fire front smoldering occurred due to the combination of wind and air sucked into the fire front. At some locations, the degree of damage was inconsistent with the direction of fire spread.
• The different vegetation layers involved in the fire spread blurred all the microscale indicators on plot Z and most of those on plot Y because a large amount of radiative heat was coming from the crowning fire in addition to the heat created by the surface fire. Heterogeneities in vegetation also influenced the indicators, particularly where the load of surface fuel was very high (plot Z).
Figure 9. Tree trunk displaying wind vortex flame wrap
Figure 10. Spotting on plot Y (occurred at the approximate location of the soda can)
Direction of Fire Spread

11
CONCLUSIONS This preliminary study of the fire pattern indicators created on one of two experimental fires shows
that the indicators are useful tools for the wildland fire investigator to determine the direction of fire spread in order to pinpoint the area of origin. However, some discrepancies between indicators as well as the study of their reliability highlight the fact that the indicators must always be interpreted in the frame of a global analysis of the fire. A very good understanding of the mechanisms driving fire behavior and fire dynamics is also mandatory to understand more complex fire patterns and their underlying uncertainties.
This preliminary work will be continued in the future to tie the appearance of the fire pattern indicators to a quantification of fire behavior by using the physical properties of the fire measured during the two fires. The second fire should be able to show fire pattern indicators representative of the area of origin as the items were planted close to the ignition lines as the fire was much less intense at those locations.
Beyond the two fires mentioned in this work, the experimental program will be continued to span more types of indicators and contribute to a more general understanding of the processes creating the fire pattern indicators, a better assessment of their reliability, and will act as a guide for the potential development of new indicators. ACKNOWLEDGEMENTS
The authors wish to thank the Joint Fire Science Program (JFSP) for funding the field experiments (project #15-01-04-55) and the NJFFS for their strong support in the planning and execution of the experimental fires, as this was critical to the success of this study. ABOUT THE AUTHORS
Dr. Albert Simeoni is an internationally recognized leader in fire science. He has more than 15 years of experience developing experimental, analytical, and numerical techniques to better understand fire dynamics and to predict fire behavior. He has also spent over 10 years volunteering and working for the Fire Department of North Corsica, France. Starting as a volunteer firefighter, he ultimately led all aspects of fire, wildland fire, and rescue operations, in the capacity of Chief of Fire Station.
Dr. Zachary C. Owens specializes in solving complex problems relating to fluid flow, heat transfer, mass transport, combustion, and thermodynamics. Application areas have included fire and explosion cause & origin investigations, failure analysis of gas turbines and consumer appliances, medical device performance evaluations relating to drug delivery and dermal heating, analysis of multiphase flows for the oil and gas industry, and thermal management of electronics and battery systems.
Dr. Erik W. Christiansen specializes in fire science, combustion chemistry, fluid mechanics, thermodynamics, and heat transfer. He performs origin and cause investigations of fires and explosions, ranging from small residential fires to large-scale industrial incidents to multi-acre wildland fires. Dr. Christiansen has investigated numerous vehicle related fires. He also investigates thermal related failures of consumer appliances; cooking equipment; and HVAC&R systems.
Dr. Abid Kemal analyzes and investigates fires, explosions, and detonations. He carries out work on combustion, thermodynamics, gas dynamics, macro- and micro-scale heat transfer, feedback control of complex dynamic plants and micromachining. He studies air-breathing propulsion systems and stationary gas turbines. Dr. Kemal also maintains an interest in international environmental law and policy and authored the first ever draft of fire laws for the government of Pakistan.
Michael R. Gallagher is the lead research technician at the USDA Forest Service’s Silas Little Experimental Forest. He is a PhD. candidate at Rutgers University, and has over 10 years of experience as a wildland firefighter. His research interests include forest biometrics, remote sensing of fuels and fire effects, and wildland fire ecology.
Dr. Kenneth L. Clark is a Research Forester with the USDA Forest Service, Northern Research Station, stationed at the Silas Little Experimental Forest in New Lisbon, New Jersey. His research focusses on fire weather, hazardous fuel assessments, and the use of eddy flux measurements to quantify turbulence, energy, water and carbon dioxide exchanges in the fire environment.

12
Dr. Nicholas Skowronski is a Research Forester with the USDA Forest Service’s Northern Research Station. His work is focused on the characterization of three-dimensional forest structure as it applies to forest productivity, forest disturbance, and wildland fire dynamics. He also investigates the effectiveness of landscape-scale fire management activities and developing techniques to perform large-scale fire risk assessment within WUI communities.
Eric V. Mueller is a PhD student at the University of Edinburgh in the United Kingdom. His topic is focused on the testing and development of physics-based numerical models of wildland fire behavior. His additional research interests include the development of in-situ sensors for measuring fire environments and the study of fluid dynamics in porous media.
Jan C. Thomas is a PhD student at the University of Edinburgh in the United Kingdom. His thesis examines the flammability of porous wildland fuels. His additional research interests include the characterization of firebrand fluxes from real fires and the assessment of structural ignition potential, as well as the emissions from the burning of wildland fuels. Simon Santamaria is a PhD student at the University of Edinburgh. His research focuses on the study of ignition of solid fuels with an emphasis on the effects of transient incident heat fluxes and the development of ignition and flame spread theory. Rory Hadden is the Rushbrook Lecturer in Fire Investigation at the University of Edinburgh. His research interests include pyrolysis, ignition and flammability of solid fuels with application to the built and natural environments. Rory specialises in experimental work ranging from laboratory scale studies to field scale measurements of fire phenomena with novel sensing methods.
ENDNOTES 1 National Interagency Fire Center, Year-to-Date Statistics, Available at: http://www.nifc.gov/fireInfo/nfn.htm (2016). 2 Manzello, S.L., Foote, E.I.D., Characterizing Firebrand Exposure from Wildland–Urban Interface (WUI) Fires: Results from the 2007 Angora Fire, Fire Technology, 50, 105-124 (2014). 3 Maranghides, A., Mell, W., Framework for Addressing the National Wildland Urban Interface Fire Problem - Determining Fire and Ember Exposure Zones Using a WUI Hazard Scale, NIST Technical Note 1748 (2013). 4 Hammer, R.B., Radeloff, V.C., Fried, J.S., Stewart, S.I., Wildland-Urban Interface Housing Growth During the 1990s in California, Oregon, and Washington, International Journal of Wildland Fire, 16, 255-265 (2007). 5 Flannigan, M.D., Stocks, B.J., Wotton, B.M., Climate Change and Forest Fires, Science of The Total Environment, 262, 221-229 (2000). 6 The National Wildfire Coordinating Group, Guide to Wildland Fire Origin and Cause Determination, PMS 412, NFES 1874 (2016). 7 National Fire Protection Association, NFPA 921: Guide for Fire and Explosion Investigations, Quincy, MA (2014).8 Joint Fire Science Program, Measurement of Firebrands Generated During Fires in Pine-Dominated Ecosystems in Relation to Fire Behavior and Intensity, Project ID: 15-1-04-55, www.firescience.gov/JFSP_research.cfm, (2015). 9 Bourhill, R., A Guide to Natural Cover Wildfire Fire Direction Indicators. s.l.: Oregon Department of Forestry (1982). 10 El Houssami, M., Mueller, E., Filkov, A., Skowronski, N., Gallagher, M., Clark, K., Thomas, J.C., Simeoni, A., Investigation of firebrand generation in a pine stand fire. Fire Technology, 52(3), 731-751 (2016). 11 http://www.openbugs.net/Manuals/Tutorial.html. 12 Clark, K.L., Skowronski, N., Gallagher, M., Carlo, N., Farrell, M., Maghirang, M.R., Assessment of Canopy Fuel Loading Across a Heterogeneous Landscape Using LiDAR, Joint Fire Sciences Program, Project ID: 10-1-02-14, Final Report, 1-47, (2013). 13 Mueller, E., Skowronski, N., Clark, K.L., Kremens, R., Gallagher, M., Thomas, J.C., El Houssami, M., Filkov, A., Butler, B., Hom, J., Mell, W., Simeoni, A. A coupled approach to the evaluation of prescribed fire behavior via experimentation and numerical modeling, 7th International Conference on Forest Fire Research, Coimbra, Portugal, November 17-20 (2014).