a study on cash flow statement of - …docshare04.docshare.tips/files/31110/311107559.pdf · a...
TRANSCRIPT

A STUDY ON CASH FLOW STATEMENT
OF
TCS- ION Company
A project report submitted to the Punjab Technical University in partial fulfillment of therequirements for the award of the degree
of
Bachelor of Commerce (Professional)
(2013-2016)
Under the Guidance of Submitted By
Prof. (Department of Management Studies) B.com (P)
1328956
DAV College, BATHINDA
(Affiliated to PunjabI University, PATIALA)
Page | 1

TABLE OF CONTENTS
S.NO NAME OF TOPIC PAGE NO.
CERTIFICATE
DECLARATION
ACKNOWLEDGEMENT
EXECUTIVE SUMMARY
CHAPTER-1 COMPANY PROFILE
CHAPTER-2 INTRODUCTION TO TOPIC
CHAPTER-3 REVIEW OF LITERATURE
CHAPTER-4 RESEARCH METHODOLOGY
-RESEARCH OBJECTIVES
-SCOPE OF STUDY
-IMPORTANCE OF STUDY
-LIMITATIONS OF STUDY
CHAPTER-5 DATA ANALYSIS & INTERPRETATION
CHAPTER-6 FINDINGS & CONCLUSION
CHAPTER-7 RECOMMENDATION/
SUGGESTION
CHAPTER-8 BIBLIOGRAPHY
Page | 2

DECLARATION
I hereby declare that the project entitled “A STUDY ON CASH FLOW STATEMENT OF TCS-
iON ” Submitted in partial fulfillment of the requirements for award of the degree of B.B.A. at
DAV College Bathinda, Affiliated to Punjabi University, Patiala is an authentic work and has not
been submitted to any other University/Institute for award of any degree/diploma.
Name-
Page | 3

ACKNOWLEDGEMENT
Firstly I would like to express our immense gratitude towards our institution DAV College
Bathinda, which created a great platform to attain profound technical skills in the field of
B.com(P) thereby fulfilling our most cherished goal.
I would thank all the finance department of “TCS- iON“ specially Mr. Aman Kumar, and the
employees in the finance department for guiding me and helping me in successful completion of
the project.
I will also specifically thank to Prof., Department, Head, Dav college Bathinda for the (Internal
Guide) for extending his cooperation in doing this project.
I shall be failing in my duty if I do not acknowledge the affection, assistance, blessings an
moral support given to me by my family, specially my father who encouraged me and instilled
me the self belief and never to say die attitude.
Last but not the least, I will like to thank God for blessing me and giving me such a wonderful
opportunity.
Page | 4

CHAPTER-1
COMPANY PROFILE
Page | 5

TATA Consultancy Service
Type Public
Traded as BSE: 532540
NSE: TCS
BSE SENSEX Constituent
CNX Nifty Constituent
Industry IT services, IT consulting
Founded 1968
Founder J.R.D Tata
Headquarters Mumbai, Maharashtra, India
Area served Worldwide
Key people N Chandrasekaran
(CEO & MD)
Services IT, business consulting and outsourcing services
Revenue US$ 15.5 billion (2015)
Operating income US$ 3.7 billion (2015)
Profit US$ 3.5 billion (2015)
Total assets US$ 54.58 billion (2015)
Total equity US$ 84.35 billion (2015
Number of 335,620 (August 2015)
Page | 6

employees
Parent Tata Group
Subsidiaries iON Limited, TCS China, TRDDC, Computational Research
Laboratories
Slogan Experience certainty
Website www.tcs.com
Tata Consultancy Services Limited (TCS)is an Indian multinational information technology (IT)
service, consulting and business solutions company head quartered in Mumbai, Maharashtra. It is a
subsidiary of the Tata Group and operates in 46 countries.TCS is one of the largest Indian companies
by market capitalization ($80 billion). TCS is now placed among the ‘Big 4’ most valuable IT
services brands worldwide. In 2015, TCS is ranked 64th overall in the Forbes World's Most
Page | 7

Innovative Companies ranking, making it both the highest-ranked IT services company and the first
Indian company. It is the world's 10th largest IT services provider, measured by the revenues.
History:
2000 to present
On 25 August 2004, TCS became a publicly listed company.
In 2005, TCS became the first India-based IT services company to enter the bioinformatics market.
In 2006, TCS designed an ERP system for the Indian Railway Catering and Tourism Corporation.
In 2008, TCS's e-business activities were generating over US$500 million in annual revenues.
In 2008, TCS undertook an internal restructuring exercise which aimed to increase the company's
ability.
TCS entered the small and medium enterprises market for the first time in 2011, with cloud-based
offerings. On the last trading day of 2001 TCS overtook RIL to achieve the highest market
capitalization of any India-based company.
In the 2011/12 fiscal year, TCS achieved annual revenues of over US$10 billion for the first time.
In May 2013, TCS was awarded a six-year contract worth over ₹ 1100 crores to provide services to
the Indian Department of Posts.
In 2013, TCS moved from the 13th position to 10th position in the League of top 10 global IT
services companies
In July 2014, TCS became the first Indian company to cross the Rs 5 lakh crores mark in market
capitalization.
In Jan 2015, TCS ends RIL's 23-year run as most profitable firm.
Products and services:
TCS and its 67 subsidiaries provide a wide range of information technology-related products and
services including application development, business process outsourcing, capacity planning,
consulting, enterprise software, hardware sizing, payment processing, software management and
Page | 8

technology education services. Its established software products are TCS Banks and TCS
Master Craft.
Service lines:
TCS' services are currently organized into the following service lines (percentage of total TCS
revenues in the 2012-13 fiscal year generated by each respective service line is shown in
parentheses):
Application development and maintenance (43.80%) value;
Asset leverage solutions (2.70%);
Assurance services (7.70%);
Business process outsourcing (12.50%);
Consulting (2.00%);
Engineering and Industrial services (4.60%);
Enterprise solutions (15.20%); and
IT infrastructure services (11.50%).
Operations:
TCS have 230 offices across 46 countries and 147 delivery centers in 21 countries.At the same date
TCS had a total of 58 subsidiary companies.
Locations:
TCS has operations in the following locations:
India: Ahmedabad, Bangalore, Baroda, Bhubaneswar, Chennai, Coimbatore, Patna, Delhi, Gandhina
gar, Goa, Gurgaon,Guwahati, Hyderabad, Bhopal , Indore, Jamshedpur, Kochi, Kolkata, Lucknow ,
Kalyanpur, Mumbai, Nagpur, Noida, Puneand siliguri, Trivandrum
Africa: South Africa, Morocco
Asia
Page | 9

(excludingIndia): Bahrain, China, Israel, UAE, Hon
g kong, Indonesia, Japan, Malaysia, Philippines, Saudi Arabia, Singapore, South
Korea, Taiwan, Thailand, Qatar
Australia: Australia
Europe: Belgium, Denmark, Finland, France, Germany, Hungary, Iceland, Republic of
Ireland, Italy, Luxembourg,Netherlands, Norway, Portugal, Spain, Sweden, Switzerland and United
Kingdom.
North America: Canada, Mexico and United States.
South America: Argentina, Brazil, Chile, Colombia, Ecuador, Peru and Uruguay.
Tata Research Development and Design Centre:
TCS established the first software research centre in India, the Tata Research Development and
Design Centre, in Pune, India in 1981. TRDDC undertakes research in Software
engineering, Process engineering and systems research. Research at TRDDC has also resulted in the
development of Sujal, a low-cost water purifier that can be manufactured using locally available
resources. TCS deployed thousands of these filters in the Indian Ocean Tsunami disaster of 2004 as
part of its relief activities. This product has been marketed in India as Tata swach, a low cost water
purifier.
Innovation Labs:
In 2007, TCS launched its co-innovation network, a network of innovation labs, start up alliances,
university research departments, and venture capitalists. In addition, TCS has 19 innovation labs
based in three countries.TCS' partners include Collabnet, Cassatt, academic institutions such
as IITs, Stanford, MIT, Carnegie Mellon and venture capitalists like Sequoia and Kleiner Perkins.
Employees:
TCS is one of the largest private sector employers in India, and the second-largest employer among
listed Indian companies (after Coal India Limited).
TCS had a total of over 335,620 employees as of October 2015, of which 31% were women. The
number of non-Indian nationals was 21,282 as at March 31, 2013 (7.7%).The employee costs for the
FY 2012-13 were US$4.38 billion, which was approx. 38% of the total revenue of the company for
Page | 10

that period. In the fiscal year 2012-13, TCS recruited a total of 69,728 new staff, of whom 59,276
were based in India and 10,452 were based in the rest of the world. In the same period, the rate of
attrition was 10.6%. The average age of a TCS employee is 28 years. The employee utilisation rate,
excluding trainees, for the FY 2012-13 was 82%. TCS was the fifth-largest United States visa
recipient in 2008 (after Infosys, CTS, Wipro and Mahindra Satyam).In 2012, the Tata group
companies, including TCS, were the second largest recipient of H-1B visas.
Subramaniam Ramadorai, former CEO of TCS, has written an autobiographical book about his
experiences in the company called The TCS Story...and beyond.
As of June 2014, TCS has over 300,000 employees. It is world's third largest IT employer behind
IBM and HP..
Class action lawsuit:
On 14 February 2006, U.S. law firm LieffCabraserHeimann& Bernstein, LLP filed a nationwide
class action lawsuit against Tata. In July 2013, judge Claudia Wilken of the U.S. District Court,
Northern District of California in Oakland, California, granted final approval to the settlement of the
lawsuit on behalf of all non-U.S. citizens employed by TCS within the state of California from 14
February 2002 to 30 June 2005. The workers claimed that they were forced to sign over their federal
and state tax refunds to their employer, as well as stating their Indian salaries were wrongfully
deducted from their U.S. pay. On February 22, 2013, the Company entered into an agreement to
settle for a sum of INR 16,163 lakhs ($29.75 million), this class action suit filed in a United States
Court relating to payment to employees on deputation.
TATA Consultancy Service- iON
Type Public
Traded as NSE: TCS-iON
Page | 11
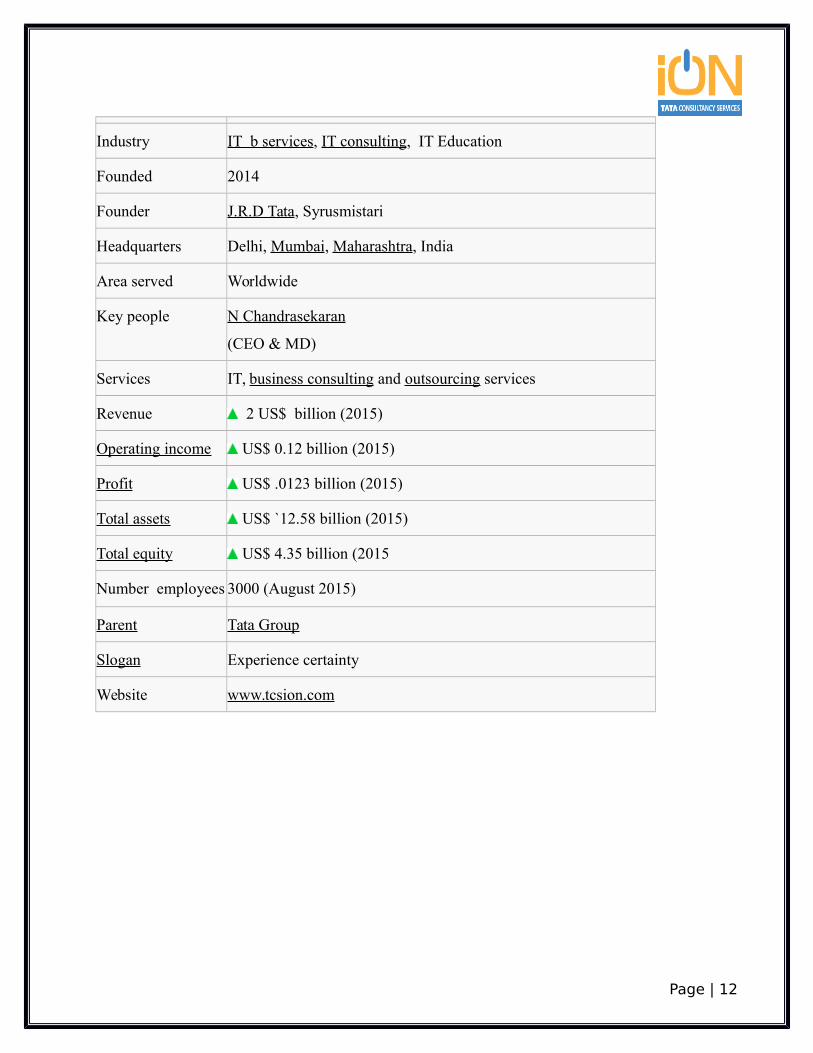
Industry IT b services, IT consulting, IT Education
Founded 2014
Founder J.R.D Tata, Syrusmistari
Headquarters Delhi, Mumbai, Maharashtra, India
Area served Worldwide
Key people N Chandrasekaran
(CEO & MD)
Services IT, business consulting and outsourcing services
Revenue 2 US$ billion (2015)
Operating income US$ 0.12 billion (2015)
Profit US$ .0123 billion (2015)
Total assets US$ `12.58 billion (2015)
Total equity US$ 4.35 billion (2015
Number employees 3000 (August 2015)
Parent Tata Group
Slogan Experience certainty
Website www.tcsion.com
Page | 12

TCS- iON
Now TCS is dealing in education and web development under the name of iON. TCS-iON
is at present, the most rapidly growing online web solutions company in India, providing IT
enabled services, consultation and outsourcing to companies spread in more than 165
countries across 7 continents. Their advanced delivery model blends technology practices
with functional expertise to help us improve our business processes and boost performance.
Their professional website design, Website development, logo design, Flash design, and
SEO services, among others, can go a long way in determining the success of your business.
Custom creation also includes, but is not limited to, incorporating images, video and other
interactive content into our site, apart from the usual text element
They offer their clients a repertoire of services like ecommerce website creation and portal
development, brand marketing on leading ad networks, digital marketing, web analytics and
much more. Their talented and experienced team of professionals comprise Web 2.0
development executives who offer advanced solutions for publishers and advertisers. They
Page | 13
create professional and dynamic pages for us using intelligent and smart practices.
They also double up as a digital marketing agency that serves leading brands, corporate
clients, as well as other players. Their cost-effective and customized web development, and
online media solutions are tailor-made to suit our specific needs and requirements. TCS-iON
offers us cutting edge services for website designing, development and internet marketing.
Their aim is to convert our “Creating Global Profeesionate’’.
Get Quality and Economic Web Services
TCS-iON is a web design and development company based in India .A fully integrated ITEsfirm, we provide world-class web design services to their global clientele spread across 7continents and major countries including USA, UK, Australia, and several throughout Asiaand Europe .
TCS-iON provides a wide range of highly cost-effective and customized web services tocompanies in varied industries such as entertainment, fashion, music, finance, environment,business, commerce, IT and telecommunications, travel and tourism, hospitality, education,etc. Their affordable web services are ideal for small, medium and large scaled private andcorporate organizations and also start-up businesses and aspiring entrepreneurs
TCS-iON is One-stop Shop for Comprehensive Web Services!
Page | 14

Their comprehensive list of web design and development services includes graphics design,corporate identity design and custom logo design services, custom web programming, blogcustomization and e-commerce solutions, Flash designs, search engine optimization servicesand much more.
.
Website Design Services:
At TCS iON India, creative talent meets technical expertise to produce smart and effective designs
with high appeal and usability value. They understand your need to be different from regular selling
or informative sites, increase visitor inflow and decrease bounce rates. Their professional web
Page | 15
designers employ fresh innovative ideas and advanced designing tools to produce optimized and
profit generative websites for you.
Their website design services are focused on producing uniquely appealing and result-oriented
websites for our specialized business. Leverage our quality web design services for dynamic
and flexible websites and enjoy maximum benefit.
IT - as - a Service:
The IT-as-a Service business model of iON a cloud based ERP solution was conceptualized by TCS
through close interactions with Small and Medium Businesses (SMB) across relevant stakeholders,
developing a deep understanding of their ICT consumption pattern and business challenges. An
innovative service model, iON uses emerging technologies like cloud computing and virtualization
to create a holistic, fit-for-purpose solution stack for SMBs integrating hardware, network, software
and services. And all of this is backed by business, technical and consulting services by iON. The
iON Cloud ERP Solution is highly modular, scalable and configurable giving SMBs the benefits of
increased efficiencies; faster go to market, predictability of technology as well as spend, IT talent on
call and better business results.
You gain from:
Integrated solutions:
We as a Cloud ERP Solution for SMBs offer single- window IT with a pre-integrated suite of
hardware, network, software and services. We ensure that your functions are digitized, automated
and connected. For example, if you are using a CRM solution along with a core ERP (e.g a
Manufacturing ERP) and have a document management system to organize supporting files and an
HRMS, we ensure that these solutions are connected and work as one. So for you, it is simply one IT
and not multiple applications. Integrated applications thus provide a comprehensive view of business
enabling better decisions.
Page | 16
Increased agility:
We bring in the agility to keep pace with changing processes or a new line of business. We help you
configure the processes to work as you currently do or the software recommends and allows you to
choose industry best practices based on your business parameters. iON gives you increased
convenience allowing you to perform various tasks from your mobile device, no matter where you
are. Being automatically compliant with statutory requirements, the solution ensures your company
is always audit ready and legally compliant.
A pay-as-you-use model:
Our model eliminates capital investment up front as we facilitate procurement of the IT
infrastructure and software on rent for the duration of the contract. Additionally, you only pay for the
number of users who actually use the software. Thus, you pay as you use on a monthly basis which
includes maintenance and training. Typically, with the iON Cloud ERP the ROI exceeds rental
within three months, when best practices are well followed.
Personalized solution:
Although iON is a cloud service for small and medium businesses, the software is configurable to
each business. You will always get the flavor of your business by picking and choosing what
processes you would need. Furthermore, the multilingual capability of the software allows you to
customize the solution label names to read in vernacular languages (like Hindi, Marathi, Tamil etc)
enabling users to learn and operate the solution with ease.
Automatic upgrades:
We continuously invest in our cloud based ERP solutions to incorporate best practices. The software
is constantly enriched based on user feedback and industry and statutory changes. You will get the
upgrades without disrupting your business operations or any additional cost. Being in perpetual beta
ensures that there is no technology obsolescence.
Enhanced Business Continuity
Page | 17

Our solution offers optimal performance in normal broadband connectivity along with a stringent
security mechanism to ensure your data privacy is maintained. The capacity of the iON Cloud ERP
solution grows with your increasing computing needs and reduces the need for IT staff. The solution
is resilient to failures as the service works from back-up data centers in the event of a disaster,
ensuring continuity of business operations.
PARTNER:
iON Partners play a key role in helping organisations of all sizes transform their businesses. We help
customers buy and implement solution that best fit their unique needs. iON Partners also provide
continuous support to customers after the implementation of the solution.
iON Sales and Implementation Partners
iON Sales and Implementation Partners (SIPs) are specially trained to help customers choose and
implement the best solution from a range of iON Education solution. SIPs have years of expertise in
the educational technology domain, and are well acquainted with the delivery model of our
solutions.
iON Channel Sales Partners
iON Channel Sales Partners have in-depth understanding of the education segment. The Channel
Sales Partners help customers across different education segments implement the most appropriate
iON solution.
A Manufacturing nervous system
Recording orders, sales and purchases would have little meaning unless they were connected. At the
heart of our manufacturing solution lies a production system that ensures that these are in sync. You
procure as much as you produce; and produce as much as you are able to sell. The goal is as simple
as keeping the lowest inventory.
At iON, we tend to make the complex manufacturing process look simple by connecting the
different parts of the operations. The software is organized into planning and execution. Production
plan for instance, would tell your operations to expect the right amount of sales, and then initiate the
right quantity of procurement. But what happens when the execution slips from what is planned?
Vigilant reports and dashboards would alert you in time.
Page | 18

Solution Stack:
Power your workforce performance:
Across industries, organizations are looking at new ways to manage their workforce and measure
performance through HR analytics, performance management systems, and social media.
The iON Human Capital Management (HCM) Solution is an integrated solution that helps you
effectively manage your employees and increase productivity across your workforce. You can align
employee goals with business objectives, cultivate employee skills, measure and reward
Page | 19

performance. iON HCM is a complete Enterprise Resource Planning (ERP) solution that automates
your human resource management and payroll processes with on-demand Business Intelligence (BI)
reporting capabilities and dashboards to help make quick decisions while maintaining statutory
complianc iON Human Resources Management Solution (HRMS) manages your recruitment and
performance evaluation processes, while also managing employee records and validating their
financial detailsiON Payroll Solution manages every stage of the payroll process, ensuring effective,
accurate payroll cycles and helps in faster decision making with on-demand business intelligence
(BI) reporting capabilities In addition, iON HCM has additional solution and services to further
enhance the productivity and learning environment in your organization iON Human Capital
Management (HCM) is delivered as a:
Managed Service: Manages the process end-to-end with the service delivered as an output.
Implementation Service: Delivers a completely configured system ready for end users to transact
and extract output on a day-to-day basis.
Page | 20

TCS in education:
Campus System:
iON Campus Management System comprises a suite of offerings, catering to seasonal academic
events, mapped to specific departments of an institution. Our solution facilitates the entire student
lifecycle management from enquiry to alumni. Offerings are integrated, yet modular in nature, which
can help automate certain functions within the institution depending on preference and suitability.
With Pre-built business processes and easy-to-configure solution capabilities, institutions can start
using the system with minimal implementation time and effort. To make the delivery process smooth
and effective for the end users, some of the modules are available in a Managed Services model as
well.
Page | 21

Assessment Management:
iON Assessment Management solution provides end-to-end services to configure and schedule
examinations starting from creating online and offline assessments to configuring attendance, hall
tickets, creating drives, as well as assigning a test center and exam shift to candidates. The solution
also manages the distribution of question papers, the Evaluation process, in addition to Results
Management and providing Support Service.
Digital evaluation:
iON Digital Evaluation solution enables evaluation of physical answer scripts made available in
electronic form. All the pages of the answer script and respective tabulated reports can be accessed
by the Evaluator, Supervisor and select members of the Institution. The solution combines ease of
manual evaluation coupled with flexibility, accuracy and efficacy of a computer.
The manual evaluation method is transformed into a digital process starting with electronic scanning
of answer scripts, where student details are masked with fictitious code, questions and relevant
marking scheme is uploaded into the solution, evaluators assigned with individual ID and password,
supervisor reviews or re-assigns evaluated scripts in case of discrepancies and finally the overall
status of answer scripts evaluated, reviewed and pending are known through the detailed Reports
functionality. Thus, iON Digital Evaluation solution from TCS addresses the major issues of the
current evaluation process like missing answer scripts in transit, human error in evaluation,
tabulation and award lists and most importantly struggling to announce results on time.
Demat Service:
iONDemat Services helps universities in leveraging IT to manage the entire lifecycle of issuing
certificates; starting from student record collection up to printing of certificates, along with digital
verification in a secured, organized, and cost-effective manner.
For student records that were maintained in physical registers before digitization, the services
include scanning and digitizing of the records along with secured storage and retrieval on-demand.
The solution makes use of digital encryption technologies for providing the highest degree of Data
Security and Integrity along with increased speed of certificate issuance and digital verification.
Page | 22
Communicator:
iON Communicator is the ultimate communication tool for Schools. Enabling the school
administration and teachers to connect with parents and students in real-time, from anywhere, iON
Communicator lets you communicate almost anything - news, alerts, calendar events, photographs,
activities or homework, from one, easy-to-use system. Giving you the flexibility to communicate the
way you want, it also includes a user-friendly smartphone app to access all the communications. Be
assured, that parents will never miss a communication, anymore.
Exam management:
TCS iON Exam Management Solution digitizes and automates University and Boards Examination
processes end-to-end, providing uncompromised 'Secrecy' in Examination Question Paper creation
and its distribution to various examination centers with significant reduction in administrative and
logistical overheads and costs. Increasing automation at every step like enrolling students for each
examination, scheduling of exams, exam centre management, allocating students to exam centers,
assigning subjects to faculties for question paper creation, alerts and notifications to various
stakeholders significantly reduces manual effort, schedule compliance failures and unforeseen errors.
Course management:
iON In-Course Assessment is designed to enable Institutions delivering Professional higher
education an opportunity to leverage Computer Based Testing to empower their teaching staff and
enhance the value delivered to students. iON In-Course Assessment allows for secure and
collaborative content development and vetting by faculty, seamless delivery of tests and capturing of
student responses and generation of multiple meaningful stakeholder specific reports on student
performance data.
Leading Exchange:
iON Learning Exchange is a collaborative Learning Platform designed to provide an incremental and
interactive learning environment to enable an Institute increase participant learning outcomes.
Powered by best-in-class Learning Management System (LMS), the learning spaces are enriched
with a suite of collaboration tools helping learners to learn from one another in a community
structure.
Page | 23

Empower Learning:
iON Learning Exchange empowers teachers with tools to personalize learning for every learner. A
teacher can design & host course catalogues, enlist students into learner communities and deliver
incremental learning material in an immersive way using video, audio, power point presentations
and a variety of SCORM Compliant learning aids. External links to world-class learning material in
the world wide web of learning enables the learner to dip into best resources on a subject or topic.
Teacher can co-share delivery responsibilities with Industry professionals or subject experts to
provide relevancy to curriculum and meet Industry employability expectations.
Personalized Feedback:
The power to conduct assessments after every learning module and provide personalised feedback in
an on-going manner helps learners to be ahead on the learning curve. Personalized mentoring can be
provided to each learner using Taxonomy and LOD tagging of assessments linked to feedback and
"incremental assist publishing". Results and Analytics of learner groups help teachers to undertake
remedial interventions for bringing parity in learning.
Peer learning:
Learning outcomes can be paced faster by enabling room for peer learning. iON Learning Exchange
is designed for community based learning where learners share their expertise and concerns using a
suite of collaboration tools including Forums, Blog, Debate, Surveys, Questions, Wiki and more.
Peer to peer benchmarking and peer speak provide the necessary impetus for pacing each other for
better outcomes.
Content Management System:
Create Courses for various topics and subjects engaging members of the Institution in a collaborative
learning environment. Populate course content in multiple modes (SCORM Compliant) and co-
create content repository, co-deliver curriculum, collaborate with industry and experts across
geographies to bring best of class value delivery to your class rooms.
Testing Engine:
Page | 24

Effectively create, schedule and track Assessments & Assignments, with multiple modes of response
submission (online/offline/both). Create Question Bank with numerous Question types (Multiple
choice multiple answer, Multiple choice single answer, Fill in the blank, True/False, Reading
comprehension) and enrich the tests by tagging them to Syllabus, Difficulty Level and Blooms
Taxonomy parameters. Create Question Papers based on Rule Engine, which fetches Questions
based on Question Types, Syllabus, Difficulty Level and Blooms Taxonomy Parameters.
Analytics Engine:
Analyze the assessment results on various parameters and provide dashboard for providing right
learning interventions to the participants of the Course to improve performance, hence closing the
learning-loop of 'Learn-Assess-Improve'.
Communication tools:
Leverage Communication features (Banner/ Multiple In-Focus & Notice-board items/ Notifications
via Email/SMS) to engage and inform members. All this with the flexibility to communicate with an
individual or with all the members of a Community on general broadcasts.
Page | 25

Page | 26

About Us
Page | 27

WEB PROGRAMMING
Every online business is different from other, even similar niche website. TCS-iON India
understands and respect individual clients needs and provide custom web programming
services to serve unique web requirements. Their team of qualified professionals uses strategic
planning and smart development process with quick operationally efficient and productive
website. Their aim is to provide smart and practical solutions from their website. TCS-iON
India’s custom website programming services cause dramatic and measureable growth in their
website.
FLASH DESIGN
Creative heads at TCS-iON India exploit Flash’s vector technology to produce, beautiful and
eye-catching designs for you. From Flash intros, banners logos and advertisements to full-
blown Flash websites, they give our website the interactive zing it desires. Their creative
Flash design services help transform our website into an effective communication interface.
Page | 28

LOGO DESIGN
TCS-iON India's logos are designed to successfully introduce your company to its
consumers and competitors. Their logos are stylish and aesthetic bearing superb color
scheme and graphical detailing that create long-lasting impressions. Their logo design
services give brand a simple, creative, and appealing quality capable of significant impact
on viewers. They guarantee quality logo design at minimal rates only at TCS-iON India.
LOGO DESIGNS
Branding that delivers your message.
The quickest way to increase the value of the company’s brand is with a well-integrated design
theme that is consistent across the web as well as on paper. A great logo is the keystone of this theme
and will attract the attention you want and deliver the sales that company needs.
Page | 29

Their logos don’t just create an identity; they create a connection with the audience they speak to and
differentiate the product or service being offered. Their logo and branding should allow their
customer to see you as providing a distinct solution to their unique problem. A logo speaks volumes
about what the company does, what its values are and what it can achieve. They make sure the logo
has as much personality as you do.
Logos that are designed by TCS-iON are as follows in march 2016 :-
SERVICES OF COMPANY
HTML5 & CSS3
At ION they offer PSD to CSS3 / JS / HTML5 services for their custom web design needs. We will
help us in getting the best web site design coded in HTML5 which is rich in structural functionality
Page | 30

and in CSS3 to enhance the presentation of your website’s content. Also HTML5/CSS3 expert takes
into account page’s loading time, SEO and web browsers compatibility
CMS
Their Content Management Systems (CMS) service revolutionizes the manner in which we manage
our online information and content – from web copy, published articles, press releases, audio/video
files, marketing brochures and other sales related assets. These applications will help us enterprise
store, maintain version control, publish content on the web and manage documents or digital assets.
Ecommerce Website Development
Ecommerce is a type of business that continues to grow every day. As more people get comfortable
with the Internet, more people are willing to make purchases and do business in this convenient way.
Therefore, ecommerce website design and development is increasingly important for any business
looking to be successful on the Internet. Let SuffesCom be our ecommerce solution provider and
they will be sure to have thousands of satisfied customers.
The focus for an ecommerce business will be a website incorporating product information and the
ability to purchase or make orders online. At Suffes.Com they use the latest database technology to
create ecommerce solutions for our new or existing business.
SEO
Search Engine Optimization (SEO) is a technical cum marketing technique with which SuffesCom
assists its clients to realize their dream of making their websites rank high in web searches. Search
Engine Optimization is a process through which websites are honed in order to make them visible to
Page | 31

online searchers. It’s worth pointing out that SEO is not a “magic bullet” that will necessarily drive
traffic and sales through the roof. SEO makes the website stand out
from the crowd, especially if your industry is highly competitive or if you want to attract a captive
audience for a popular keyword or keywords.
Our process involves the following crucial steps:
Research
Their research team makes a research using various secondary research tools to better understand the
requirements of the client. They prefer to seek assistance from the client by asking them various
questions related to their Business (read website), Target Audience, Strategic Keywords, etc. and
then they formulate the clear and measurable objective for the projects.
Page | 32

Analyze
After research they analyze the market potential and the present competition. They analyze the
market potential to ensure that the website is optimized in compliance with search engine guidelines
and they study the competition to identify the potential gap which needs to be addressed by you.
STRONG RELATIONSHIPS BETWEEN CLIENTS
One of their biggest priorities of all is close collaboration with their clients. Whatever the size of our
company or, indeed, your proposed project, they take steps here at TCS - iON to ensure that your
project is carefully tracked and monitored, from the initial user analysis to the final stage of usability
testing.
This is certainly a thoroughness of approach that has been appreciated by our clients down the years,
who have included business owners, consultants and team leaders alike. It gives you all the more
reason to contact TCS iONwhen your firm next requires a high quality software solution that brings
with it a significant ROI.
Why Choose TCS- iON?
iON is the company which gives the guarantee that we can help your business or organization to be
the best by improving your profitability and efficiency.
They understand that you could be concerned about why you should utilize our services for your
requirements. It is but natural that you logically put these questions to yourself. In an era where there
are many others out there offering similar services claiming similar advantages, it is worth
considering the following points. At SuffesCom we thoroughly undertake the following globally
acknowledged advanced practices.
Page | 33

Latest technologies
They deploy the latest technologies to meet your unmatched IT requirements.
Excellent support
They offer the most excellent support and dedicated service by a full fledged web experts team.
Best talent
They hire only the best talent available in the market and ensure that we utilize the cutting edge top
range methodologies and techniques to develop and execute your projects.
Productive work environment
They share a healthy work environment where our employees continually learn and mature as a
habitual practice.
Strict adherence to quality
Not only do we strictly adhere to the highest international level quality standards, but they regularly
communicate with our clients and keep them aware of the latest developments.
Satisfied Clientele
Needless to say, they have been able to develop a large list of satisfied clients in countries around the
globe. They are really proud to say that all this is due to our honest and equilateral commitment in
understanding the needs of our clients and providing them with precise solutions in accordance with
their individual requirements.
WHAT CLIENTS SAYS
Scott Adams
Remind people that profit is the difference between revenue and expense. This makes you look smart
and also significantly increases your chances.
Page | 34

Tasia
Amrinder worked diligently until he produced something I was happy with. We communicated over
Skype as often as needed and sometimes he’d work afterhours to get the revisions done before he
went home for the day. He’s very patient and that makes life easy when youre trying to produce
something wonderful.
Brandon Doe
Engineers like to solve problems. If there are no problems handily available, they will create their
own problems. That is a very known fact there.
THEIR SERVICES
Their e-commerce solutions are the best blend of:
Website Development
There are many variations of passages of LoremIpsum available, but the joy have suffered alteration
in some format, by injected humour.
Website Designing
There are many variations of passages of LoremIpsum available, but the joy have suffered alteration
in some format, by injected humor.
Internet Marketing
There are many variations of passages of LoremIpsum available, but the joy have suffered alteration
in some format, by injected humor.
Website Maintenance:
Let Your Website Speak For You... Manage It Like Your SALESMAN..!!
They offer you fast and efficient website maintenance services. They will update, enhance, backup
Page | 35

and repair our site quickly and efficiently, while you can go on running your business. They will
maintain the quality of our website, keeping it fresh for our return clients. If you need to add more
images, new banners, new calendar events, change the content of the site, backup
any important data, add new plug-in and functionality, let us do it for you .Their website
maintenance services are professional and affordable with quick turnaround and delivery times. They always
have custom solutions to website functionality problems at an affordable cost. They offer professional
help with any bugs or misfortunes which may happen to your site. Their site monitoring is effective
and professional. As soon as they receive maintenance requests, the sites get updated or fixed right
away. All the website development and maintenance is being performed in a secure way, with non-
disclosure of the passwords or any site information.
Some other Services they offer:
a) Phone Business Application Developmentb) iPhone Multimedia Application Developmentc) iPhone Internet Apps Developmentd) iPhone GPS Based Application Developmente) iPhone Entertainment Application Developmentf) iPhone Gaming Application Development.
.
Page | 36

INTRODUCTION TO THE
TOPIC
INTRODUCTION OF CASH FLOW STATEMENTEvery big and small firms performs cash transactions. Cash transaction refers to cash inflows and
outflows. Cash inflows and outflows help to review success, failure of a firm and its ability to meet
maturing debts. Such review and evaluation are possible if the statement of cash flow is prepared. Accounting standard Board (ASB) at international level in 1996 suggested every firm to publish the
statement of cash flow along with the final accounts. Since then the statement of cash flow is getting
more recognition than funds flow statement.
The statement that shows cash inflows and outflows of a firm for a specified period is called the cash
flow statement. Cash flow statement demonstrates where the cash has come during the period and
what the firm has done with the available cash. Therefore, cash flow statement shows a picture of
cash movement occurred in and out from a firm during a year in a summarized form. Cash flow
statement gives a picture of sources and applications of cash of a firm for a year.
Page | 37

DEFINITION:
“Cash Flow is the money that comes in and goes out of a company. It is the generation of
income and the payment of expenses. Cash inflows result from either the generation of revenue
through the selling of goods and services, money borrowed, or money earned through
investments.”
If more cash is coming into the company than leaving the company, you are experiencing positive
cash flow. But if more cash is leaving the company than coming into the company, then you are
experiencing negative cash flow. Keep in mind that just because you are experiencing negative cash
flow for the moment doesn't mean you are going to suffer a loss, because cash flow is dynamic. Cash
flow is reported on the company’s cash flow statement, which is also called a statement of cash
receipts and disbursements.
The cash flow statement was previously known as the flow of Cash statement. The cash flow
statement reflects a firm's liquidity.
The balance sheet is a snapshot of a firm's financial resources and obligations at a single point in
time, and the income statement summarizes a firm's financial transactions over an interval of time.
These two financial statements reflect the accrual basis accounting used by firms to match revenues
with the expenses associated with generating those revenues. The cash flow statement includes only
inflows and outflows of cash and cash equivalents; it excludes transactions that do not directly affect
cash receipts and payments. These non-cash transactions include depreciation or write-offs on bad
debts or credit losses to name a few. The cash flow statement is a cash basis report on three types of
financial activities: operating activities, investing activities, and financing activities. Non-cash
activities are usually reported in footnotes.
Important definitions As per Accounting Standard -3 (revised)
‘Cash’ comprises cash in hand and demand deposits with banks.
Page | 38

‘Cash equivalents’ are short term highly liquid investments that are readily convertible into known
amount of cash and which are subject to an insignificant risk of changes in value. Examples of cash
equivalents are
a) Treasury Bills
b) Commercial papers
c) Investment funds
d) Free Saving Account.
STRUCTURE OF CASH FLOW STATEMENT:
The cash flow statement is distinct from the income statement and balance sheet because it does not
include the amount of future incoming and outgoing cash that has been recorded on credit.
Therefore, cash is not the same as net income which, on the income statement and balance sheet,
includes cash sales and sales made on credit.
Cash flow activities
The cash flow statement is partitioned into three segments, namely:
1. cash flow resulting from operating activities;
2. cash flow resulting from investing activities;
3. cash flow resulting from financing activities.
The money coming into the business is called cash inflow, and money going out from the business is
called cash outflow.
Page | 39

Operating activities
Operating activities include the production, sales and delivery of the company's product as well as
collecting payment from its customers. This could include purchasing raw materials, building
inventory, advertising, and shipping the product.
Under IAS 7, operating cash flows include:
a. Receipts from the sale of goods or services
b. Receipts for the sale of loans, debt or equity instruments in a trading portfolio
c. Interest received on loans
d. Payments to suppliers for goods and services
e. Payments to employees or on behalf of employees
f. Interest payments (alternatively, this can be reported under financing activities in IAS 7)
g. Buying Merchandise
Items which are added back to [or subtracted from, as appropriate] the net income figure (which is
found on the Income Statement) to arrive at cash flows from operations generally include:
a. Depreciation (loss of tangible asset value over time)
b. Deferred tax
c. Amortization (loss of intangible asset value over time)
d. Any gains or losses associated with the sale of a non-current asset, because associated cash
flows do not belong in the operating section (unrealized gains/losses are also added back from
the income statement).
Page | 40

e. Dividends received
f. Revenue received from certain investing activities
Investing activities
These are the acquisition and disposal of long term assets such as land, building, plant machinery etcand other investments not included in cash equivalents. Cash flow from investing activitiesrepresents the extent to which expenditure has been made for resources intended to generate futureincome and cash flows.
Examples of Investing activities are
i. Purchase or Sale of an asset (assets can be land, building, equipment, marketable securities,
etc.)
ii. Loans made to suppliers or received from customers
iii. Payments related to mergers and acquisition.
Financing activities
Financing activities include the inflow of cash from investors such as banks and shareholders, as
well as the outflow of cash to shareholders as dividends as the company generates income. Other
activities which impact the long-term liabilities and equity of the company are also listed in the
financing activities section of the cash flow statement.
Under IAS 7,
a) Payments of dividends
b) Payments for repurchase of company shares
c) For non-profit organizations, receipts of donor-restricted cash that is limited to long-term
purposes
Page | 41

O
pe r
a ti n
g A
c ti vi t i
e s
C
as
h
In
flo
ws
C
as
h
Sa
les
C
as
h p
ur
cha
se
s
C
as
h
ou
tfl
ow
s
C
as
h
Sa
les
C
as
h p
ur
cha
se
s
Items under the financing activities section include:
a. Dividends paid
b. Sale or repurchase of the company's stock
c. Net borrowings
d. Payment of dividend tax
e. Repayment of debt principal, including capital leases.
Page | 42

I n
ve s
t in
g A
c ti vi t i
e s
C
as
h
in
flo
ws
S
a le
o f f
xe
d a ss e
t s
P u r
c ha s
e o f
f xe d
a ss e ts
C
as
h
ou
tfl
ow
s
S
a le
o f f
xe
d a ss e
t s
P u r
c ha s
e o f
f xe d
a ss e ts
F inanc ing Ac ti vi t ie s
Cash inflows
I s su e o f S ha r es f o r c as h
Repayment of loan
Cash outflows
I s su e o f S ha r es f o r c as h
Repayment of loan
Page | 43
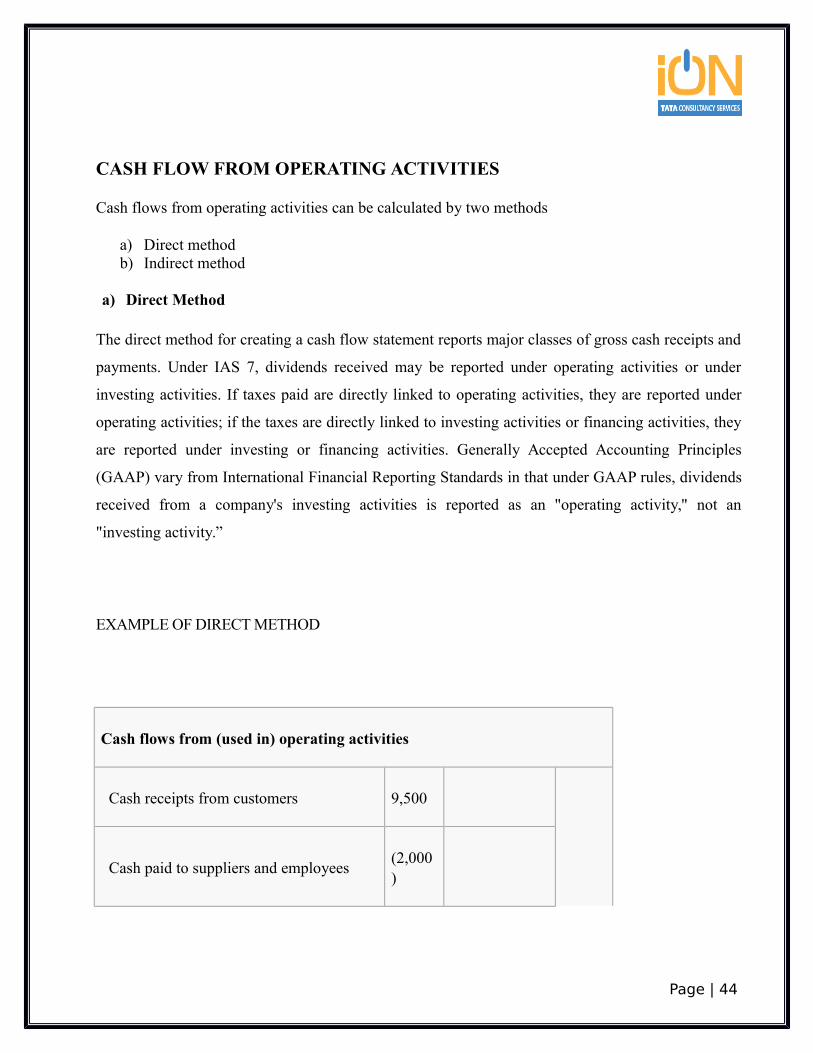
CASH FLOW FROM OPERATING ACTIVITIES
Cash flows from operating activities can be calculated by two methods
a) Direct methodb) Indirect method
a) Direct Method
The direct method for creating a cash flow statement reports major classes of gross cash receipts and
payments. Under IAS 7, dividends received may be reported under operating activities or under
investing activities. If taxes paid are directly linked to operating activities, they are reported under
operating activities; if the taxes are directly linked to investing activities or financing activities, they
are reported under investing or financing activities. Generally Accepted Accounting Principles
(GAAP) vary from International Financial Reporting Standards in that under GAAP rules, dividends
received from a company's investing activities is reported as an "operating activity," not an
"investing activity.”
EXAMPLE OF DIRECT METHOD
Cash flows from (used in) operating activities
Cash receipts from customers 9,500
Cash paid to suppliers and employees(2,000)
Page | 44

Cash generated from operations (sum) 7,500
Interest paid(2,000)
Income taxes paid(3,000)
Net cash flows from operating activities 2,500
Cash flows from (used in) investing activities
Proceeds from the sale of equipment 7,500
Dividends received 3,000
Net cash flows from investing activities 10,500
Cash flows from (used in) financing activities
Dividends paid(2,500)
Net cash flows used in financingactivities
(2,500)
.
Page | 45

Net increase in cash and cash equivalents 10,500
Cash and cash equivalents, beginning ofyear
1,000
Cash and cash equivalents, end of year $11,500
b) Indirect MethodThe indirect method uses net-income as a starting point, makes adjustments for all transactions for
non-cash items, then adjusts from all cash-based transactions. An increase in an asset account is
subtracted from net income, and an increase in a liability account is added back to net income. This
method converts accrual-basis net income (or loss) into cash flow by using a series of additions and
deductions.1. Decrease in non-cash current assets are added to net income2. Increase in non-cash current asset are subtracted from net income3. Increase in current liabilities are added to net income4. Decrease in current liabilities are subtracted from net income5. Expenses with no cash outflows are added back to net income (depreciation and/or amortization
expense are the only operating items that have no effect on cash flows in the period)6. Revenues with no cash inflows are subtracted from net income7. Non operating losses are added back to net income8. Non operating gains are subtracted from net income.
Rules (financing activities)
Finding the Cash Flows from Financing Activities is much more intuitive and needs little
explanation. Generally, the things to account for are financing activities:
a. Include as outflows, reductions of long term notes payable (as would represent the cash
repayment of debt on the balance sheet)
b. Or as inflows, the issuance of new notes payable
Page | 46

c. Include as outflows, all dividends paid by the entity to outside parties
d. Or as inflows, dividend payments received from outside parties
e. Include as outflows, the purchase of notes stocks or bonds
f. Or as inflows, the receipt of payments on such financing vehicles.
In the case of more advanced accounting situations, such as when dealing with subsidiaries, the
accountant must
a. Exclude intra-company dividend payments.
b. Exclude intra-company bond interest.
FORMAT OF CASH FLOW STATEMENTINDIRECT METHOD:
Page | 47

Particulars Amount Amount
Page | 48

Cash Flow from operating activities
Net profit as per profit and loss A/C
Add-Transfer to reserve
Add-proposed Dividend
Add- Interim dividend
Add- Provision for Taxation
Less-Refund of tax
Less- Extraordinary Items
Net profit before taxation and extraordinary items
Adjustments for non-cash and non- operating items
Items to be added:
Depreciation
Goodwill write off
Interest on borrowings
Loss on sale of investment
Loss on issue of shares/ debentures.
Items to be deducted:
Profit on sale of fixed asset
Profit on sale of investments
Rental income
Operating profit before working capital changes
Adjustments for change in current operating assets and liabilities:
Add- Decrease in current assets
Stock-in-trade
Page | 49

Bill receivable
Prepaid expenses
Add- Increase in current liabilities
Creditors
Bills payable
Outstanding expenses
Less- Increase in current assets
Stock-in-trade
Bill Receivable
Prepaid expenses
Less- Decrease in current liabilities
Creditors
Bills Payable
Outstanding Expenses
Cash generate from or used in operations before tax
Less- Income tax paid
Cash flow before extraordinary items
Less- Extraordinary items
Net cash flow from or used in operating activities
2.Cash flow from investing activities
Proceeds from sale of fixed assets
Proceeds from sale of investments
Interest or dividend received
Purchase of fixed assets
Page | 50

Purchase of Intangible asset like Goodwill
Net flow from (used in) investing activities
3.Cash flow from financing activities
Proceeds from issue of shares and debentures
Final dividend paid
Interim Dividend paid
Repayment of loans
Interest on debentures and loan paid
Redemption of debentures/ Preference shares
Net cash flow from (used in) Financing activities.
Net increase/ decrease in cash and cash equivalent(1+2+3)
Add- cash and cash equivalent in the beginning of the year
Cash in hand
Cash at bank(less Overdraft)
Short term deposits or Investments
Marketable Securities
Cash and cash equivalent in the end of the year
Cash in hand
Cash at bank (less Overdraft)
Short term deposits or investments
Marketable Securities
Notes:
Examples of Extraordinary items are:
Page | 51
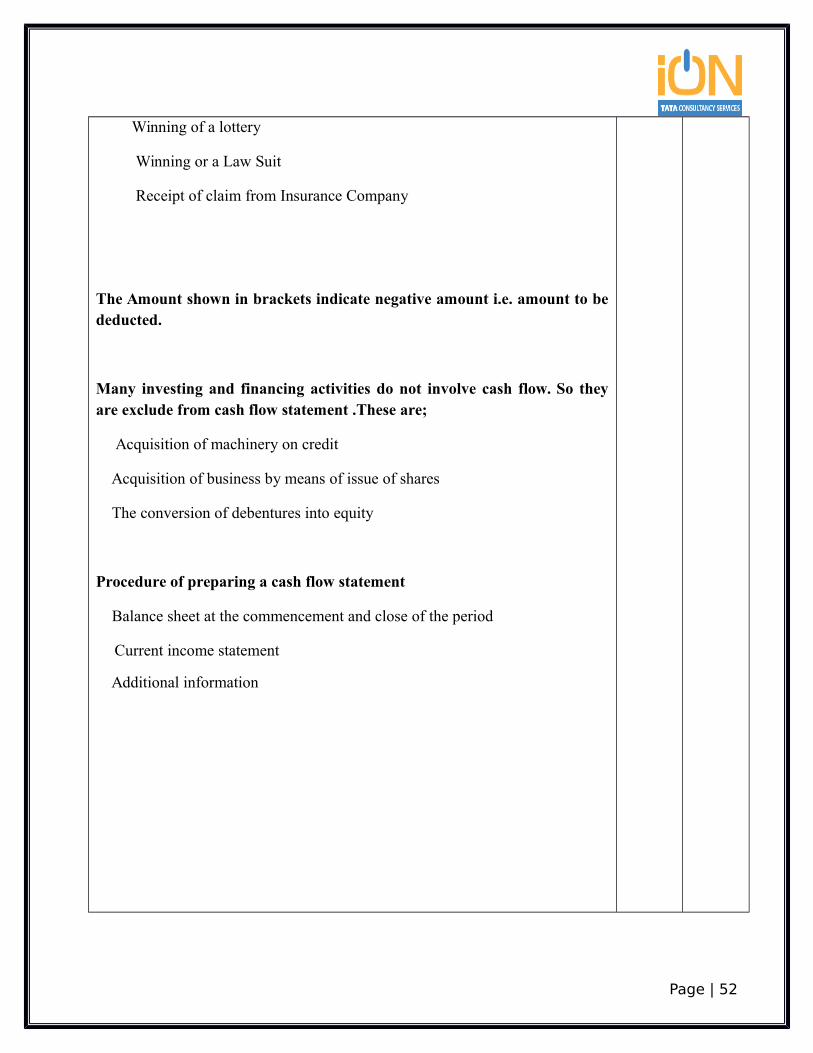
Winning of a lottery
Winning or a Law Suit
Receipt of claim from Insurance Company
The Amount shown in brackets indicate negative amount i.e. amount to bededucted.
Many investing and financing activities do not involve cash flow. So theyare exclude from cash flow statement .These are;
Acquisition of machinery on credit
Acquisition of business by means of issue of shares
The conversion of debentures into equity
Procedure of preparing a cash flow statement
Balance sheet at the commencement and close of the period
Current income statement
Additional information
Page | 52

NEED / IMPORTANCE / USES OF CASH FLOW STATEMENT
Therefore cash flow statement is important on the following grounds.
1. Cash flow statement helps to identify the sources from where cash inflows have arisen within a particular period and also shows the various activities where in the cash was utilized.
2. Cash flow statement is significant to management for proper cash planning and maintaining a proper matching between cash inflows and outflows.
3. Cash flow statement shows efficiency of a firm in generating cash inflows from its regular operations.
4. Cash flow statement reports the amount of cash used during the period in various long-term investing activities, such as purchase of fixed assets.
5. Cash flow statement reports the amount of cash received during the period through various financing activities, such as issue of shares, debentures and raising long-term loan.
6. Cash flow statement helps for appraisal of various capital investment programmers to determine their profitability and viability.
There are uses of cash flows on the following grounds.
External uses
1. To assess the ability of the firm to manage cash flows.2. To assess the ability of the firm to generate cash through its operations.3. To assess the ability of the firm its obligations and dividend policy.4. To assess the ability of the firm the effectiveness of firm to convert the revenue its cash.5. Estimating the company’s need for additional financing.
Internal uses
1. To assess liquidity.2. Determine if short term financing is necessary.3. To determine the dividend policy.4. To evaluate the investment and financial decision.
Page | 53

OBJECTIVES OF CASH FLOW STATEMENT
a) To find the liquidity position of the TCS-iON. For the availability cash and utilization of
the cash by the organization.b) It will help find to assess the company's ability to generate positive cash flows in the future
c) To assess its ability to meet its obligations to service loans, pay dividends etc.
d) To assess the effect on its finances of major transactions in the year.
e) To study the firms liquidity.
f) To learn about how company manage its cash & become such well recognized profitable
industry & if there is any problem arise then what steps taken by company.
g) To study the techniques used in organization.
h) To study methods & techniques use for cash flow analysis.
i) Meeting day to day cash requirement of firm.
Page | 54

EXECUTIVE SUMMARY(OVERVIEW)
Page | 55
INFORMATION ABOUT CASH FLOW STATEMENT
Cash flow is the money that comes in and goes out of a company. It is the generation of income and
the payment of expenses. Cash inflows result from either the generation of revenue through the
selling of goods and services, money borrowed, or money earned through investments.
If more cash is coming into the company than leaving the company, you are experiencing positive
cash flow. But if more cash is leaving the company than coming into the company, then you are
experiencing negative cash flow. Keep in mind that just because you are experiencing negative cash
flow for the moment doesn't mean you are going to suffer a loss, because cash flow is dynamic. Cash
flow is reported on the company's cash flow statement, which is also called a statement of cash
receipts and disbursements.
Complementing the balance sheet and income statement, the cash flow statement (CFS), a
mandatory part of a company's financial reports since 1987, records the amounts of cash and cash
equivalents entering and leaving a company. The CFS allows investors to understand how a
company's operations are running, where its money is coming from, and how it is being spent.
Here you will learn how the CFS is structured and how to use it as part of your analysis of a
company.
People and groups interested in cash flow statements include:
a. Accounting personnel, who need to know whether the organization will be able to cover
payroll and other immediate expenses
b. Potential lenders or creditors, who want a clear picture of a company's ability to repay
c. Potential investors, who need to judge whether the company is financially sound
d. Potential employees or contractors, who need to know whether the company will be able to
afford compensation
e. Shareholders of the business.
Page | 56

HISTORY AND VARIATIONS
Cash basis financial statements were very common before accrual basis financial statements. The
"flow of funds" statements of the past were cash flow statements.
In 1863, the Dowlais Iron Company had recovered from a business slump, but had no cash to invest
for a new blast furnace, despite having made a profit. To explain why there were no funds to invest,
the manager made a new financial statement that was called a comparison balance sheet, which
showed that the company was holding too much inventory. This new financial statement was the
genesis of cash flow statement that is used today.[6]
In the United States in 1973, the Financial Accounting Standards Board (FASB) defined rules that
made it mandatory under Generally Accepted Accounting Principles(US GAAP) to report sources
and uses of funds, but the definition of "funds" was not clear. Net working capital might be cash or
might be the difference between current assets and current liabilities. From the late 1970 to the mid-
1980s, the FASB discussed the usefulness of predicting future cash flows.[7] In 1987, FASB
Statement No. 95 (FAS 95) mandated that firms provide cash flow statements.[8] In 1992, the
International Accounting Standards Board issued International Accounting Standard 7 (IAS 7), Cash
Flow Statement, which became effective in 1994, mandating that firms provide cash flow statements
US GAAP and IAS 7 rules for cash flow statements are similar, but some of the differences are:
IAS 7 requires that the cash flow statement include changes in both cash and cash
equivalents. US GAAP permits using cash alone or cash and cash equivalents.
IAS 7 permits bank borrowings (overdraft) in certain countries to be included in cash
equivalents rather than being considered a part of financing activities.
IAS 7 allows interest paid to be included in operating activities or financing activities. US
GAAP requires that interest paid be included in operating activities.
US GAAP (FAS 95) requires that when the direct method is used to present the operating
activities of the cash flow statement, a supplemental schedule must also present a cash flow
Page | 57

statement using the indirect method. The IASC strongly recommends the direct method but
allows either method. The IASC considers the indirect method less clear to users of financial
statements. Cash flow statements are most commonly prepared using the indirect method, which
is not especially useful in projecting future cash flows.
The cash flow statement is partitioned into three segments, namely
1. cash flow resulting from operating activities;
2. cash flow resulting from investing activities;
3. cash flow resulting from financing activities.
The money coming into the business is called cash inflow, and money going out from the business is
called cash outflow.
Cash flow from operating activities can be calculated by two methods:
Direct Method
Indirect Method
TCS-ION uses the Indirect Method for calculating operating activities.
Page | 58

CHAPTER -2
REVIEW OF LITERATUREPage | 59

This chapter looks at the concept of cash flow statement as given by other authors and researchers
with importance to accountability, profit measurement, solvency, ambiguity, and disclosure and their
specific relevance for proper financial management of commercial company .one of the aim and
objectives of this dissertation was to review conceptual though and theoretical framework related to
cash flow analysis. Developing a critical review of cash flow literature and any related issues help
the researcher, manager and any potential reader to better understand the subject and also provide a
framework for data analysis. Governance as stated in the UK charity commission standard for good
governance code is “the systems and processes concerned with ensuring the overall direction,
effectiveness, supervision and accountability of an organization.”
This chapter begins with a clarified concept of cash flow as stated by the Financial Accounting
Standard Board (FASB) and also develop and update and utility of cash flow when managing
commercial activities. How the better knowledge on that topic helps in business decision making
nowadays.
Expansion of the reporting standard
The Financial Accounting Standards Board (FASB) introduced Statement of Financial Accounting
Standards No. 95 which is the Statement of Cash Flows in November 1987. The requirement of
Page | 60
FASB 95 regarding a full set of financial statements classified cash flow as the fourth required
financial statement (along with a balance sheet, income statement, and statement of retained
earnings). This statement established standards for cash flow reporting, and dated out the Accounting
Principles Board (APB) Opinion No. 19, Reporting Changes in Financial Position. In March 1971,
the APB Opinion No.19 gave chances to enterprises to report cash flow information in a statement of
changes in financial position commonly called a funds statement. During that time, there was no
formal or universally accepted definition to catalogue each statement even though the term “funds”
was not sufficiently defined (Alves et al 2008). Every single industry however had different funds
constitution to others since the statement referred to changes in funds. The term funds referred
sometimes to cash for some company meanwhile some used cash and short term investment and
some used quick asset, some used working capital. The relevance and the valuation of funds
statement has been recognized in most company but the lack of consistency in format and focus from
one firm to another was responsible of the main reason that the FASB obviously took up the matter
and with extensive commentary from accountants and any other interested parties, adopted the
standards espoused in FASB 95.it effectively took place in 1988 had not encouraged use of the world
“funds” because it had been stated with so much (Alves et al 2008).
Cash flow statement
A cash flow statement is an important indicator of financial health because it is possible for a
company to show profits while not having enough cash to sustain operations. It is a financial report
that shows to the user the source of a company's cash and how it was spent over a specific period of
time. A cash flow statement counters the ambiguity regarding a company's solvency that various
accrual accounting measures create. It also categorizes the sources and uses of cash to provide the
reader with an understanding of the amount of cash a company generates and uses in its operations,
as opposed to the amount of cash provided by sources outside the company, such as borrowed funds
or funds from stockholders. The cash flow statement also tells the reader how much money was
spent for items that do not appear on the income statement, such as loan repayments, long-term asset
purchases, and payment of cash dividends (Ryan 2007).
Requirements for cash flow statement
Page | 61

Thornton (2008) indicated that FASB 95 requires a statement of cash flows to classify cash receipts
and cash payments in accordance with the prescribe format whether they start from operating
activities, investing activities, or financing activities. The provisions given by FASB are as follows
on the presentation of cash flow statement are:
a. it provides that the cash flows statement should be prepared under either direct or indirect
method and provides examples of how to use each method when preparing statements.b. It also provides that under the core concept, cash is stated as “cash and cash equivalents”.
while cash is the most liquid assets within the asset portion of a company’s balance sheet
including currency and bank deposit, in the other hand cash equivalents are asset that are
ready to be converted into cash such as money market holding, short term government bond,
bills, marketable securities and commercial paper. Other sources of investments such as
stocks, bonds, futures contracts, and so forth are not considered cash.
Cash and profitability concepts
Cash
Cash is one of the most important aspects of running any large or small business. It is one of the
single most important reasons why many businesses fail regardless of how good the business is. The
physical aspect of cash can be any currency, coins on hand, bank balances, negotiable money and so
forth. Managing cash flow therefore is vitally important in the soft running, survival and success of a
business (Atrill P. 2004).
The use of some examples has illustrated how cash flow can make the difference between success
and failure. The meaning of failure in this case is insolvency that is, the company is unable to pay its
debts. The term bankrupt is sometimes used to describe that situation, even though it is only
individual who can be declared bankrupt. But sometimes both terms can be confusing.
Significance of non-cash transactions
Page | 62

Also known as profitability, non-cash transactions are not included in the statement of cash flows,
but often they need to be disclosed elsewhere in financial statements. Examples of these types of
transactions include:
a) Conversion of bonds to stockb) Acquisition of assets by assuming liabilities.
When there are some few of such transaction, it may be fairly recommended to include them on the
same page as the statement of cash flows but in a separate schedule at the bottom of the statement of
cash flows. Otherwise, the transactions may be reported elsewhere in the financial statements,
clearly referenced to the statement of cash flows. Some other transactions are generally reported in
combination with statement of cash; these include stock dividends, stock splits, and appropriation of
retained earnings.
Classifications/ Presentation of cash flow statement
Nearly all business transactions completed during the fiscal year impact cash flow in one way or
another, and in summary form they are factored into the year's cash flow statement. Exactly where
on the statement depends on the nature of the transaction. As noted, the three essential categories of
cash flow are operating activities, investing activities, and financing activities. The components of
each of these will be addressed separately.
Operating activities
Operating activities are the fundamental transactions that keep the business running. Most notably,
they include incoming revenue (also known as net income) from the sale of goods or services and
most kinds of outgoing payments. Cash flow from operating activities doesn't include principal paid
on or received from loans, and only includes transactions that were completed during the period.
This simply means that an operating transaction is not considered cash flow until the cash is actually
received or paid, as opposed to just being recorded as accounts receivable or payable. In general, if
an activity would appear on the company's income statement, it would be a candidate for the
operating section of the cash flow statement. Net changes in balance sheet categories from period to
period also represent cash flow; thus, a net decrease in accounts receivable from year to year
normally suggests an increase in cash flow for that period. Sometimes goods or services are paid for
Page | 63

prior to the period in which the benefit is matched to revenue (recognized). This results in a deferred
or prepaid expense. Items such as insurance premiums that are paid in advance of the coverage
period are classified as prepaid. Sometimes goods or services are received and used by the company
before they are paid for, such as telephone service or merchandise inventory. These items are called
accrued expenses, or payables, and are recognized on the income statement as an expense before the
cash flow occurs. Operating activities include the production, sales and delivery of the company's
product as well as collecting payment from its customers. This could include purchasing raw
materials, building inventory, advertising, and shipping the product.
Under IAS 7, operating cash flows include:
a) Receipts from the sale of goods or servicesb) Receipts for the sale of loans, debt or equity instruments in a trading portfolioc) Interest received on loansd) Dividends received on equity securitiese) Payments to suppliers for goods and servicesf) Payments to employees or on behalf of employeesg) Interest payments (alternatively, this can be reported under financing activities in IAS 7, and
US GAAP)
Items which are added back to [or subtracted from, as appropriate] the net income figure (which is
found on the Income Statement) to arrive at cash flows from operations generally include:
a. Depreciation (decline in value of assets and, loss of tangible asset value over time)b. Deferred taxc. Amortization (loss of intangible asset value over time)
Any gains or losses associated with the sale of a non-current asset, because associated cash flows do
not belong in the operating section.(unrealized gains/losses are also added back from the income
statement
Investing activities
Investment activities represent the cash flow from the purchase of long term assets ( such as property
and equipment) required to make or sell goods and services. Investment activities also include
purchases of stocks or other securities, loans made to other businesses. A major issue that potential
investors have with the investing activities section is that the money listed here represents activities
Page | 64

paid for in cash. In other words, it includes only the principal or book value of the investment. So, if
an example of company that wanted to purchase $5 million dollars worth of equipment with only $1
million cash and $4 million in financing, only the $1 million will show up under investing activities.
Interest and depreciation are classified as operating cash flow, as are net gains or losses on
investments. Because of these distinctions, cash flow from investment activities is typically more
complex to calculate than that from other categories. Examples of investing activities are
a) Purchase or Sale of an asset (assets can be land, building, equipment, marketable securities,
etc.)b) Loans made to suppliers or received from customers
Financing activities.
Financing activities consist of transactions affecting a company's liabilities and shareholder equity.
Mainly involving how the company obtains capital and enhances the value of its stock, they include
such things as issuing bonds, payments on debt, paying dividends, and issuing and buying back
stock.
Financing activities include the inflow of cash from investors such as banks and shareholders, as
well as the outflow of cash to shareholders as dividends as the company generates income. Other
activities which impact the long-term liabilities and equity of the company are also listed in the
financing activities section of the cash flow statement.
Under IAS 7,
a) Proceeds from issuing short-term or long-term debtb) Payments of dividendsc) Payments for repurchase of company sharesd) Repayment of debt principal, including capital leasese) For non-profit organizations, receipts of donor-restricted cash that is limited to long-term
purposesf) Items under the financing activities section include:g) Dividends paidh) Sale or repurchase of the company's stocki) Net borrowingsj) Payment of dividend tax
Disclosure of non-cash activities
Page | 65

Under IAS 7, noncash investing and financing activities are disclosed in footnotes to the financial
statements. Under US General Accepted Accounting Principles (GAAP), noncash activities may be
disclosed in a footnote or within the cash flow statement itself. Noncash financing activities may
include
a) Leasing to purchase an assetb) Converting debt to equityc) Exchanging noncash assets or liabilities for other noncash assets or liabilitiesd) Issuing shares in exchange for assets
Wrongly recommends the direct method but allows either method. The International Accounting
Standard Committee (IASC) considers the indirect method less clear to users of financial statements.
Cash flow statements are most commonly prepared using the indirect method, which is not
especially useful in projecting future cash flows.
The cash flow statement was previously known as the flow of funds statement. The cash flow
statement reflects a firm's liquidity.
The balance sheet is a snapshot of a firm's financial resources and obligations at a single point in
time, and the income statement summarizes a firm's financial transactions over an interval of time.
These two financial statements reflect the accrual basis accounting used by firms to match revenues
with the expenses associated with generating those revenues. The cash flow statement includes only
inflows and outflows of cash and cash equivalents; it excludes transactions that do not directly affect
cash receipts and payments. These noncash transactions include depreciation or write-offs on bad
debts or credit losses to name a few. The cash flow statement is a cash basis report on three types of
financial activities: operating activities, investing activities, and financing activities. Noncash
activities are usually reported in footnotes.
The cash flow statement is intended to
a) provide information on a firm's liquidity and solvency and its ability to change cash flows in
future circumstancesb) provide additional information for evaluating changes in assets, liabilities and equityc) improve the comparability of different firms' operating performance by eliminating the
effects of different accounting methodsd) indicate the amount, timing and probability of future cash flows
Page | 66
The cash flow statement has been adopted as a standard financial statement because it eliminates
allocations, which might be derived from different accounting methods, such as various timeframes
for depreciating fixed assets
Cash inflows and cash outflows
The concept of cash flow can be broadly divided into two categories, namely the inflow and outflow.
The cash inflow, which is also known as inward cash flow or just cash flow, is generated as a result
of financing, ventures and sales. The cash outflow which is also known as onward flow of cash is
seen as a result of many factors such as purchases, investments, salaries and administrative
expenditures. The importance of cash flow statement was realized in the wake of the 2007 recession
cycle. Business organizations have realized the importance of cash flow analysis, and have started
regular audits of cash outflows as well as inflows. This study of inflow and outflow tends to play a
highly instrumental role on general financial planning and financial management.
Ideally, during the business cycle, money flows in than flows out. This allows manager to build
up cash balances with which to plug cash flow gaps, seek expansion and reassure lenders and
investors about the health of their business.
A point to note is that income and expenditure cash flows rarely occur together, with inflows often
filling behind. The aim of this knowledge was to speed up the inflows and slow down the outflows.
Cash inflows key elementsa) Payment for goods or services from your customers.b) Receipt of a bank loan.c) Interest on savings and investments.d) Shareholder investments.e) Increased bank overdrafts or loans.
Cash outflows key elements
a) Purchase of stock, raw materials or tools.b) Wages, rents and daily operating expenses.c) Purchase of fixed assets - PCs, machinery, office furniture, etc.d) Loan repayments.e) Dividend payments.f) Income tax, corporation tax, VAT and other taxes.g) Reduced overdraft facilities.
Page | 67

Many of your regular cash outflows, such as salaries, loan repayments and tax, have to be made on
fixed dates. You must always be in a position to meet these payments in order to avoid large fines or
a disgruntled workforce.
Methods of preparing cash flow statement
FASB Statement No. 95 allows the preparer a choice of the direct or the indirect method of cash flow
statement presentation, although the FASB prefers the direct method. The difference lies in the
presentation of the operating cash flow information.
Direct method.
Companies that use the direct method are required, at a minimum, to report separately the following
classes of operating cash receipts and payments:
Receipts:
a) Cash collected from customersb) Interest and dividends receivedc) Other operating cash receipts, if any
Payments:
a) Cash paid to employees and suppliers of goods or services (including suppliers of insurance,
advertising, etc.)b) Interest paidc) Income taxes paidd) Other operating cash payments, if any
Companies are encouraged to further break down any operating cash receipts and payments that they
consider meaningful.
Indirect method.
The indirect method, by contrast, reports operating cash flow based on changes in the balance sheet
(the distribution of assets and liabilities) from period to period as they relate to net income. Thus,
Page | 68

instead of reporting the total cash received from customers, an indirect statement only lists the
change in cash received from the previous period. The net cash flow reported should be the same as
in the direct method, but in the indirect method the level of detail tends to be less.
The key elements of the operating activities section using the indirect method are as follows:
a) Net incomeb) Depreciation and amortizationc) Deferred income taxesd) Interest incomee) Change in accounts receivablef) Change in accounts payableg) Change in inventoriesh) Net gains from sale of investments or assets
The presentation of the investing and financing sections of the statement is the same in each
method.
Balance sheet accounts and cash flow:
Every balance sheet account reflects specific activity. There are only a few distinctive transactions
that affect each account. Following are examples of some of the common changes in balance sheet
accounts that register as cash flow.
Accounts receivable increases when the company sells merchandise or does a service on credit, and
decreases when the customer pays its bill. Accounts receivable is associated with sales or revenue on
an income statement. The change in accounts receivable or the cash collected from customers is
classified as an operating activity.
Inventory increases when the company buys merchandise for resale or use in its manufacturing
process, and decreases when the merchandise is sold. Inventory is associated with the income
statement account cost of goods sold (COGS). The change in inventory or the cash paid for
inventory purchases is classified as an operating activity.
Prepaid insurance increases when the company pays insurance premiums covering future periods
and decreases when the time period of coverage expires. The change in prepaids or the amount paid
for insurance is classified as an operating activity.
Page | 69

Land, building, and equipment accounts increase when the company purchases additional assets and
decrease when the assets are sold. The only time the income statement is affected is when the asset is
sold at a price higher or lower than book value, at which time a gain or loss on sale of assets appears
on the income statement. The amount of cash used or received from the purchase or sale of such
assets is classified as an investing activity. The gain or loss is reported as operating cash flow.
Accumulated depreciation increases as the building and equipment depreciates and decreases when
building and equipment is sold. Depreciation expense does not appear on a cash flow statement
presented using the direct method. Depreciation expense is added back to net income on a cash flow
statement presented using the indirect method, since the depreciation caused net income to decrease
during the period but did not affect cash.
Significance of cash flow
There is a significant importance of cash flow to a business. Cash flow as defined above is the
inflow and outflow of cash or liquidized finances. The following are some advantages of inward and
outward flow of cash.
a) Income Assurance: The biggest importance of cash flow is that the business organization
tends to have an assured income irrespective of the outside economic condition. Many
business corporations have a very well balanced and uniform inward and outward cash flow.b) Ensures Timely Payment: The uniform and assured cash flow, in both the directions,
ensures two principal payments, namely, the salaries of employees are paid on time and
installments of all loans are made on time. This safeguards the trust of employees and
upholds the credit rating.c) Return Ratio: The analysis of cash flow ensures that the business is not investing finances in
the wrong avenues, and investments already made are paying off well. This ratio is often
termed as return over asset ratio.d) Keeps You Out of Debt: The timely cash inflow plays a very instrumental role in keeping
you out of debt, as a timely inflow of cash prevents you from taking small loans.e) Saves Unnecessary Expenditure: The use of inward and outward cash flow prevents all
unnecessary expenditure such as piled up interest, late payment charges, etc.f) Timely Investments: As the inflow and outflow of cash is on time, you are left with
adequate free and liquid finances, which you may invest in time bound instruments and
securities.
Page | 70

g) Good cash flow practices ensure smooth operation of the company when accrued revenue is
still sitting in accounts receivable. Often an increase in sales does not automatically mean an
increase in cash flow at least not right away. for instance, a company with £3 million annual
revenue and 30day gap days between the day of payment and the day of sales is likely to be
more cash rich than the company with£5 million in sales and a 3 days float. By using cash
flow forecasting practices, the company can anticipate when they are most likely to be cash
flush and when they are most likely to be cash-strapped so that they can plan their capital
purchase.h) Effective cash flow management is vital to every organization; it is an important aspect when
planning business functioning. Earning income is (or should be ) one the main focus of
company objectives. It can be profitable in and of itself. Cash shortages result in increased
cost, such as interest charges on loans, late payment penalties, and loss of vendors discount
for paying bill promptly. Cash flow improvements can eliminate these costs and create the
opportunity for more favorable payment terms on some type of payments. A better
understanding of cash flow management can be benefit to many organization with a
comprehensive guide for:i) Identifying and understanding organization’s cash flow characteristics, strengths and
weaknessesj) Improving cash flow through implementing relevant strategies.k) Improving overall performance by using cash flow.
COMPARISION OF CASH FLOW AND FUND FLOW STATEMENT
Fund flow statements (FFS) is prepared to show movement of funds during a period, while the term
funds used to denote
Net working capital (NWC).
The statement has mainly two segments –uses of funds and sources of funds. The difference
between sources and uses represent change in
Net working capital (NWC).
One the other hand, cash flow statement (CFS ) is prepared, in interpreting the term funds as cash.
The statement shows the sources and uses of cash and cash equivalent and mainly it is used for short
term cash planning. Only changes in non-current items of the balance sheet appear in the body of
Page | 71

fund flow statement (FFS) and other changes effecting individual current assets or current liabilities
do not find place in the fund flow statement (FFS). This involves preparation of a statement
of changes in Net Working Capital.
Fund flow statement reflects the movement of changes in Net Working Capital , while
cash flow statement shows the movement in cash inflow and outflow of the company. Fund from
operation in the fund flow statement contain net profit after meeting all the expenses as shown in
profit and loss account plus non-fund expenses like depreciation. On the other hand, cash from
operation in the cash flow statement is the net profit plus noncash expenses like depreciation, writing
off bad debts, outstanding preliminary expenses, etc.
Adjustments for changes in theof current assets and current liability are also made to
compute cash from operations. Cash flow statement is useful in short-term planning for making cash
budget, while fund flow statement is useful in long-term planning to know the net working capital of
the company.
Cash flow statement, reflecting movement in cash indicates liquidity of theenterprise
and is of interest of bankers and lenders. On the other hand, fund flow statement
indicates changes in working capital which is important for internal management of the
company
LIMITATIONS OF THE CASH FLOW STATEMENT
Some of the limitations of the cash flow statement are as follows:
As the enterprise shifts from strictly cash basis, enters into credit transactions as well takes into
account prepared and accrued items, the net income no doubt would generally represent an increase
in working capital. Yet equating net income in cash flow for such enterprise would be inaccurate and
misleading since a number of noncash items affects the net income of the firm.
Cash flow is part of working capital. The volume of cost flowing in any part of the system and the
speed at which it flows determines the amount of capital. Tied up sometimes in any segment of
the enterprise or business. At any given time cash flow analysis used in connection with ratio
Page | 72

analysis provided a barometer for measuring the aforesaid change and financing problem of the business
much more manageable
There are two methods of preparing cash flow statement:
1)DIRECT METHOD
2) INDIRECT METHOD
Sometimes it can be possible that due to the of wrong method the accurate cash the company cannot
make proper cash planning.
Page | 73

RESEARCH
METHODOLOGY
Page | 74
Research refers to a search for knowledge. It is a systematic method of collecting and recording the
facts in the form of numerical data relevant to the formulated problem and arriving at certain
conclusions over the problem based on collected data.
Thus formulation of the problem is the first and foremost step in the research process followed by
the collection, recording, tabulation and analysis and drawing the conclusions. The problem
formulation starts with defining the problem or number of problems in the functional area. To detect
the functional area and locate the exact problem is most important part of any research as the whole
research is based on the problem.
According to Clifford Woody research comprises defining and redefining problems,
formulating hypothesis or suggested solutions: collecting, organizing and evaluating data:
making deductions and reaching conclusions: and at last carefully testing the conclusions to
determine whether they fit the formulating hypothesis.
Research can be defined as “the manipulation of things, concepts or symbols for the purpose of
generalizing to extend, correct or verify knowledge, whether that knowledge aids in
construction of theory or in the practice of an art”
In short, the search for knowledge through objective and systematic method of finding solution to a
problem is research.
Research is the systematic collection, analysis and reporting of data and making relevant finding to
deal with a specific situation faced by the company. The data can be collected and analyzed with the
help of diagram and charts, which help in arriving to a conclusion.
In general sense research methodology means how to research and which best way select for finding
out data from the company during the industrial training. The main objective of there search
Page | 75

methodology is choosing the best path for collecting required data .The report is on “cash
flow statement”. The following research methodology is being followed for the project work.
Type of data used
For the preparation of report the data used is secondary data.
RESEARCH DESIGN & METHODOGY
Research design is blue print of data collection, measurement & analysis of data. It indicate both
structure of problem & plan of investigation used to obtain empirical evidence on those relationship
.There are generally three types of research design which are as follows.
1 Exploratory studies
2. Descriptive studies
3. Causal studies
For the research design I have selected DESCRIPTIVRE STUDIES because as cash flow
analysis is topic in which there must detail description of all transaction are
required to study so that we get idea how cash is collect from various sources & utilized in
organization. Further while doing in depth study we get complete picture of
process that follow in organization.
Significant of study
Aim of work help to reach destination by problems arises in the way work become more
efficient if purpose for doing work is clear.
Scope Statement of Cash Flows
1. Consolidated cash flow is a financial statement that presents information about the company's
cash receipts and disbursements during the accounting period.
2. The purpose of cash flow statement is to provide information on sources and uses of cash and cash
equivalents during the period of accounting and cash reconciliation at the beginning of the period
with cash at the end of the period plus the cash equivalent balances.
3. The general form of the cash flow statement shows cash receipts and disbursements are divided
into three categories, namely: cash flow from operating activities, cash flows from investing
activities and cash flows arising from financing activities.
Page | 76

4. Operating activities are the principal revenue-producing activities of the company (principal
revenue producing activities) and other activities that are not investing activities and financing
activities. Cash flows from operating activities can be reported with the use of two methods, either
directly or indirectly. E-code uses the indirect method for operating activities.
5. Investment activity is the acquisition and disposal of long-term assets and other investments that
do not include cash equivalents
.
CHAPTER-3
DATA ANALYSIS
&
INTERPRETATION
Page | 77

DATA ANALYSIS
TCS-ION
CASH FLOW STATEMENT
Year Ended Year Ended
31.03.2014 31.03.2015
Rs. Crores Rs. Crores
A, Cash Flow from Operating Activities
Net profit before tax (17.33) 34.44
Adjustment for:
Loss on sale/ Provision for diminution in value of Long Term
Investments & loans to Group Companies 1.89 40.18
Gain on sale of Long Term Investments (1.22) (94.92)
Page | 78

Gain on sale of Asset (0.13) -
Depreciation 44.97 39.55
Misc. Exp./ Assets Write off/ Provisions 8.08 7.50
Interest Expense 72.22 79.99
Dividend Income (0.02) (0.01)
Interest Income (20.82) -
Operating Profit before working capital changes 87.64 106.73
Adjustments for:
Trade and other Receivables (88.17) (120.35)
Inventories 13.79 (46.92)
Trade Payables 67.05 190.46
Miscellaneous Expenditure (7.50) (5.11)
(14.83) 18.08
Cash Generated from Operations 72.81 124.81
Direct Taxes (Paid)/Refunds 17.85 31.66
Net Cash Flow from operating activities 54.96 156.47
B, Cash Flow from Investing Activities
Purchase of Fixed Assets (30.95) (27.94)
Page | 79

Proceeds from sale of Fixed Assets 0.86 1.77
Movement in Loans and Advances (16.27) (16.44)
Sale of Investments 32.33 114.52
Short Term Deposits with schedule Banks (2.31) (10.48)
Interest Received 20.70 -
Dividend Received 0.02 0.01
Net Cash Flow from Investing activities 4.38 61.44
Proceeds from Share Capital & Securities Premium 114.44 -
Proceeds from Long Term Borrowings 86.60 -
Less : Repayment of Long Term Borrowings (0.54) (78.96)
Proceeds/ (Repayment) from short term borrowings (net) (227.26) -
Interest Paid (77.40) (82.23)
Net Cash used in financing activities (104.16) (161.19)
Net Increase/(Decrease) in Cash and Cash equivalents (44.82) 56.72
Cash and Cash equivalents as at 01.10.2008 105.65 48.93
Cash and Cash equivalents as at 30.09.2009 . 60.83 105.6
Page | 80

ANALYSIS OF CASH FLOW
a. From the cash flow statements of the TCS-ION. It can be analyzed from the two years that
the net cash balance of the company has increased manifold in 31-03-2014 than the year 31-
03-2015.
b. The net profit in 31-03-2015 is higher than the 31-03-2014, but due to certain changes there
has been increase in the cash balance.
c. The interest paid this year is one of the last year, which implies that the company has not
repaid his borrowed capital, due to which the interest has got down.
d. The depreciation has increased but it does not affect cash to an extent, as it is a non-cash
item. In the head of working capital there is drastic change in the cash balance in the form of
“Trade and other Receivables; which has affected the cash balance.
e. There is outflow of cash for receivables rather than the inflow in the last year. So, the net
effect is that the cash from operating activities has been decreased two times from the last
year.
f. The company has no accumulated losses as at the end of the financial year i.e. march 31,
2015.
Page | 81

g. Provision for taxation has been made in accordance with the requirement of AS-22 issued by
Institute of Charted Accountants of India.
h. Pursuant to that, current year deferred tax liability have been charged to profit & loss
account
i. In opinion of the board of directors of thee company, the current assets, loans and advances
have a value on realization in the ordinary course of the business at least equal to the amount
stated in the balance sheet and provision for all liabilities have been made.
Balance of sundry debtors, creditors, loans and advances are subject to confirmation by the
concerned parties.
METHOD OF ANALYSIS
a) Data analysis is done using the following statistical tools wherever required, in order to
extract meaningful information from the collected data.
i. Simple percentage and averages
ii. Bar diagram
iii. Cone diagram
iv. Pie diagram
b) The collected data from the questionnaire has been put together in the form of tables.
c) Percentage has been calculated wherever necessary for generalization of the data.
d) . Data analysis and interpretation has been done on the basis of primary and secondary data
e) . The findings researches have been recorded based on the analysis.
f) All bank balances (debit/credit) have been confirmed by the concerned bank. Identified from
the available information which has been relied upon by the auditors.
Page | 82

1. The names of small-scale industrial units to whom outstanding for more than thirty days
within agreed terms.
2. The company has 99.96% of shareholders in its subsidiary company named as TCS-ION as at
31-03-2008.
3. So the net effect is that the net cash from investing activities has many more times than the
last year, which is negative. Now the company has repaid its long term borrowing more than
the last year, which has decreased the cash balance by the little amount.
4. Balance with the schedule banks under the head current & collection account amounting to
represent funds in transit lying with schedule banks pending transfer against loan liabilities
under the head cash credit & bill discounting.
LIQUIDITY RATIO
1. CURRENT RATIO
(Amount in Rs. )
Current Ratio
Year Current Assets Current Liabilities Ratio
2011 58,574,151 7,903,952 7.41
2012 69,765,346 31,884,616 2.19
2013 72,021,081 16,065,621 4.48
2014 91,328,208 47,117,199 1.94
2015 115,642,068 30,266,661 3.82
Page | 83

GRAPHICAL REPRESENTATION
2011 2012 2013 2014 20150
1
2
3
4
5
6
7
8
7.41
2.19
4.48
1.94
3.82
Ratios
Ratios
Interpretation
1) As a rule, the current ratio with 2:1 (or) more is considered as satisfactory position of the
firm.2) When compared with 2011, there is an increase in the provision for tax, because the debtors
are raised and for that the provision is created. The current liabilities majorly included of
company for consultancy additional services.3) The sundry debtors have increased due to the increase to corporate taxes.4) In the year 2011, the cash and bank balance is reduced because that is used for payment of
dividends. In the year 2012, the loans and advances include majorly the advances to
employees and deposits to government. The loans and advances reduced because the
employees set off their claims. The other current assets include the interest attained from
the deposits. The deposits reduced due to the declaration of dividends. So the other current
Page | 84

assets decreased.5) The huge increase in sundry debtors resulted an increase in the ratio, which is above the
benchmark level of 2:1 which shows the comfortable position of the firm.
Page | 85

2. QUICK RATIO
(Amount in Rs.)
Quick Ratio
Year Quick Assets Current Liabilities Ratio
2011 58,574,151 7,903,952 7.41
2012 52,470,336 31,884,616 1.65
2013 69,883,268 16,065,620 4.35
2014 89,433,596 47,117,199 1.9
2015 115,431,868 30,266,661 3.81
GRAPHICAL REPRESENTATION:
2011 2012 2013 2014 20150
1
2
3
4
5
6
7
8
7.41
1.65
4.35
1.9
3.81
QUICK RATIOS
QUICK RATIOS
Page | 86

Interpretation
Quick assets are those assets which can be converted into cash within a short period of time,
say to six months. So, here the sundry debtors which are with the long period does not
include in the quick assets.
Compare with 2011, the Quick ratio is increased because the sundry debtors are increased
due to the increase in the corporate tax and for that the provision created is also increased.
So, the ratio is also increased with the 2011.
Page | 87
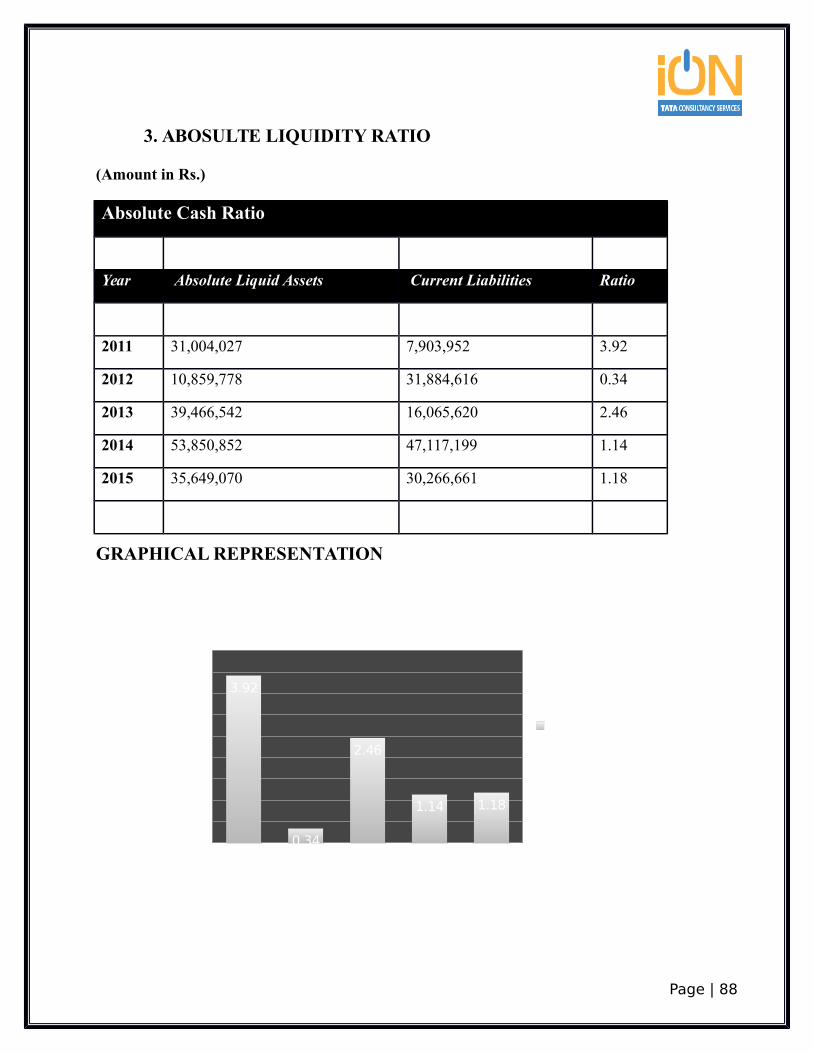
3. ABOSULTE LIQUIDITY RATIO
(Amount in Rs.)
Absolute Cash Ratio
Year Absolute Liquid Assets Current Liabilities Ratio
2011 31,004,027 7,903,952 3.92
2012 10,859,778 31,884,616 0.34
2013 39,466,542 16,065,620 2.46
2014 53,850,852 47,117,199 1.14
2015 35,649,070 30,266,661 1.18
GRAPHICAL REPRESENTATION
2011 2012 2013 2014 20150
0.5
1
1.5
2
2.5
3
3.5
4
4.5
3.92
0.34
2.46
1.14 1.18
LIQIDITY RATIOS
LIQIDITY RATIOS
Page | 88

Interpretation
The current assets which are ready in the form of cash are considered as absolute liquid
assets. Here, the cash and bank balance and the interest on fixed assets are absolute liquid
assets.
In the year 2014, the cash and bank balance is decreased due to decrease in the deposits and
the current liabilities are also reduced because of the payment of dividend. That causes a
slight increase in the current year’s ratio.
LEVERAGE RATIOS
PROPRIETORY RATIO
(Amount in Rs.)
Proprietary Ratio
Year Share Holders Funds Total Assets Ratio
2011 67,679,219 78,572,171 0.86
2012 53,301,834 88,438,107 0.6
2013 70,231,061 89,158,391 0.79
2014 56,473,652 106,385,201 0.53
2015 97,060,013 129,805,102 0.75
Page | 89
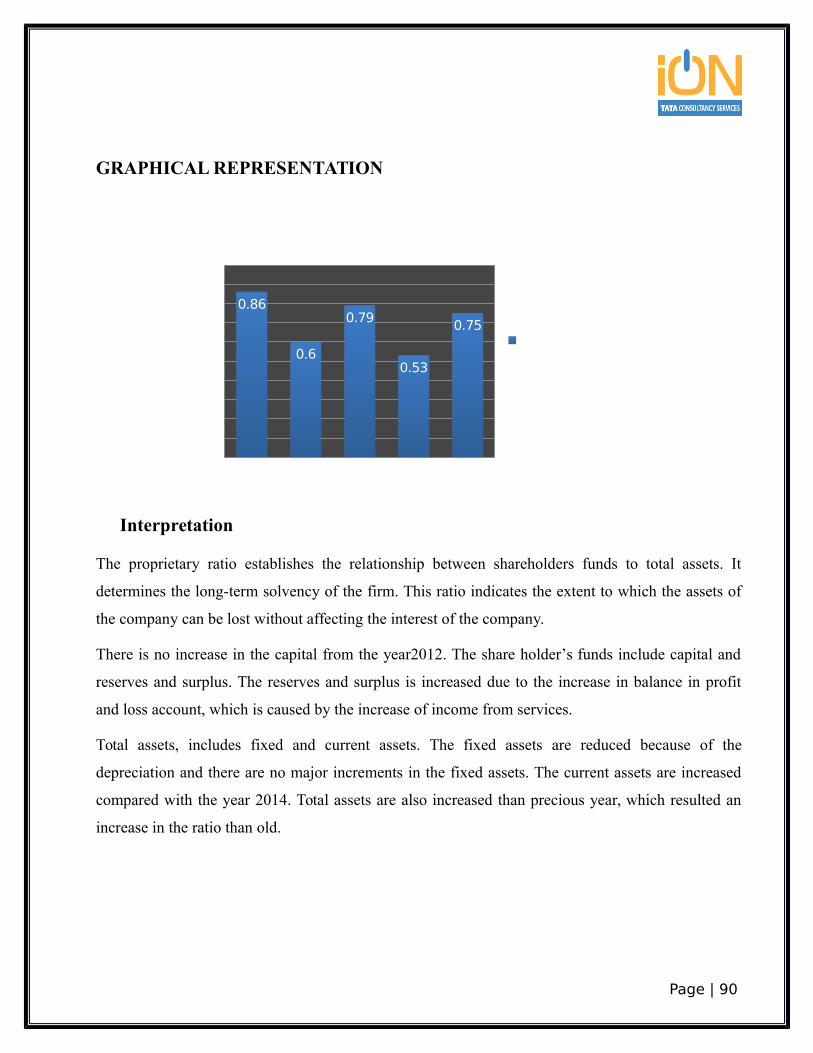
GRAPHICAL REPRESENTATION
2011 2012 2013 2014 20150
0.10.20.30.40.50.60.70.80.9
1
0.86
0.6
0.79
0.53
0.75
PROPRIETARY RATIOS
PROPERIETARY RATIOS
Interpretation
The proprietary ratio establishes the relationship between shareholders funds to total assets. It
determines the long-term solvency of the firm. This ratio indicates the extent to which the assets of
the company can be lost without affecting the interest of the company.
There is no increase in the capital from the year2012. The share holder’s funds include capital and
reserves and surplus. The reserves and surplus is increased due to the increase in balance in profit
and loss account, which is caused by the increase of income from services.
Total assets, includes fixed and current assets. The fixed assets are reduced because of the
depreciation and there are no major increments in the fixed assets. The current assets are increased
compared with the year 2014. Total assets are also increased than precious year, which resulted an
increase in the ratio than old.
Page | 90

ACTIVITY RATIOS
WORKING CAPITAL TURNOVER RATIO
(Amount in Rs.)
Working Capital Turnover Ratio
Year Income From Services Working Capital Ratio
2011 36,309,834 50,670,199 0.72
2012 53,899,084 37,880,730 1.42
2013 72,728,759 55,355,460 1.31
2014 55,550,649 44,211,009 1.26
2015 96,654,902 85,375,407 1.13
GRAPHICAL REPRESENTATION
Page | 91

2011 2012 2013 2014 20150
0.05
0.1
0.15
0.2
0.25
0.3
0.35
0.4
0.45
0.31 0.3
0.24
0.32
0.42
Return on Investment Ratios
Return on Investment Ratios
Interpretation
Income from services is greatly increased due to the extra invoice for Operations & Maintenance
fee and the working capital is also increased greater due to the increase in from services because
the huge increase in current assets.
The income from services is raised and the current assets are also raised together resulted in the
decrease of the ratio of 2015 compared with 2014.
Page | 92

6. FIXED ASSETS TURNOVER RATIO
(Amount in Rs.)
Fixed Assets Turnover Ratio
Year Income From Services Net Fixed Assets Ratio
2011 36,309,834 28,834,317 1.26
2012 53,899,084 29,568,279 1.82
2013 72,728,759 17,137,310 4.24
2014 55,550,649 15,056,993 3.69
2015 96,654,902 14,163,034 6.82
GRAPHICAL REPRSENTATION
2011 2012 2013 2014 20150
0.05
0.1
0.15
0.2
0.25
0.3
0.35
0.4
0.45
0.31 0.3
0.24
0.32
0.42
Return on Investment Ratios
Return on Investment Ratios
Page | 93
Interpretation
Fixed assets are used in the business for producing the goods to be sold. This ratio shows the firm’s
ability in generating sales from all financial resources committed to total assets. The ratio indicates
the account of one rupee investment in fixed assets.
The income from services is greaterly increased in the current year due to the increase in the
Operations & Maintenance fee due to the increase in extra invoice and the net fixed assets are
reduced because of the increased charge of depreciation. Finally, that effected a huge increase in the
ratio compared with the previous year’s ratio.
Page | 94

7. CAPITAL TURNOVER RATIO
(Amount in Rs.)
Capital Turnover Ratio
Year Income From Services Capital Employed Ratio
2011 36,309,834 37,175,892 0.98
2012 53,899,084 53,301,834 1.01
2013 72,728,759 70,231,061 1.04
2014 55,550,649 56,473,652 0.98
2015 96,654,902 97,060,013 1.00
GRAPHICAL REPRESENTATION
2011 2012 2013 2014 20150
0.05
0.1
0.15
0.2
0.25
0.3
0.35
0.4
0.45
0.31 0.3
0.24
0.32
0.42
Return on Investment Ratios
Return on Investment Ratios
Page | 95

Interpretation
This is another ratio to judge the efficiency and effectiveness of the company like profitability
ratio.
The income from services is greaterly increased compared with the previous year and the total
capital employed includes capital and reserves & surplus. Due to huge increase in the net profit
the capital employed is also increased along with income from services. Both are effected in the
increment of the ratio of current year.
Page | 96

9. CURRENT ASSETS TO FIXED ASSETS RATIO
(Amount in Rs.)
Current Assets To Fixed Assets Ratio
Year Current Assets Fixed Assets Ratio
2011 58,524,151 19,998,020 2.93
2012 69,765,346 18,672,761 3.74
2013 72,021,081 17,137,310 4.20
2014 91,328,208 15,056,993 6.07
2015 115,642,068 14,163,034 8.17
GRAPHICAL REPRESENTATION
Page | 97

2011 2012 2013 2014 20150
0.05
0.1
0.15
0.2
0.25
0.3
0.35
0.4
0.45
0.31 0.3
0.24
0.32
0.42
RATIOS
Interpretation
Current assets are increased due to the increase in the sundry debtors and the net fixed assets of
the firm are decreased due to the charge of depreciation and there is no major increment in the
fixed assets.
The increment in current assets and the decrease in fixed assets resulted an increase in the ratio
compared with the previous year
PROFITABILITY RATIOS
GENERAL PROFITABILITY RATIOS
NET PROFIT RATIO
(Amount in Rs.)
Net Profit Ratio
Year Net Profit After Tax Income from Services Ratio
2003 21,123,474 36,039,834 0.59
Page | 98
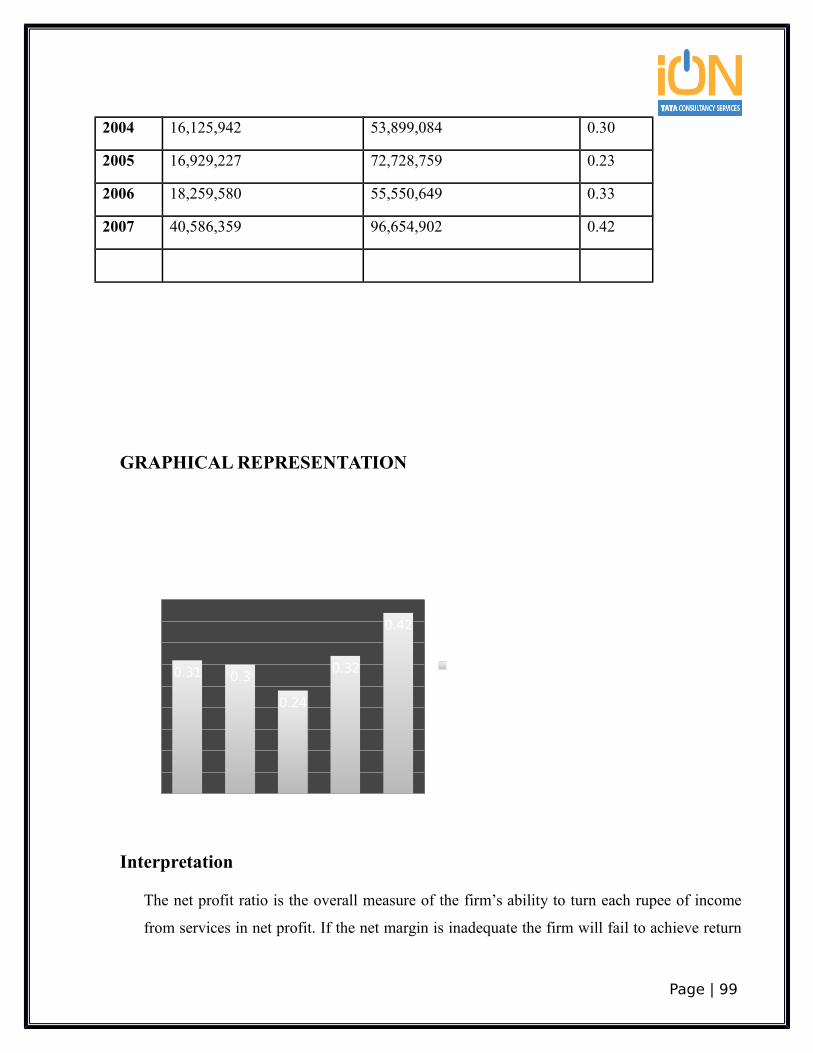
2004 16,125,942 53,899,084 0.30
2005 16,929,227 72,728,759 0.23
2006 18,259,580 55,550,649 0.33
2007 40,586,359 96,654,902 0.42
GRAPHICAL REPRESENTATION
2011 2012 2013 2014 20150
0.05
0.1
0.15
0.2
0.25
0.3
0.35
0.4
0.45
0.31 0.3
0.24
0.32
0.42
Return on Investment Ratios
Return on Investment Ratios
Interpretation
The net profit ratio is the overall measure of the firm’s ability to turn each rupee of income
from services in net profit. If the net margin is inadequate the firm will fail to achieve return
Page | 99

on shareholder’s funds. High net profit ratio will help the firm service in the fall of income
from services, rise in cost of production or declining demand.
The net profit is increased because the income from services is increased. The increment
resulted a slight increase in 2015 ratio compared with the year 2014.
Page | 100

OPERATING PROFIT RATIOS
(Amount in Rs.)
Operating Profit
Year Operating Profit Income From Services Ratio
2003 36,094,877 36,309,834 0.99
2004 27,576,814 53,899,084 0.51
2005 29,540,599 72,728,759 0.41
2006 31,586,718 55,550,649 0.57
2007 67,192,677 96,654,902 0.70
GRAPHICAL REPRESENTATION
Page | 101

2011 2012 2013 2014 20150
0.05
0.1
0.15
0.2
0.25
0.3
0.35
0.4
0.45
0.31 0.3
0.24
0.32
0.42
Return on Investment Ratios
Return on Investment Ratios
Interpretation
The operating profit ratio is used to measure the relationship between net profits and sales of a
firm. Depending on the concept, it will decide.
The operating profit ratio is increased compared with the last year. The earnings are increased
due to the increase in the income from services because of Operations & Maintenance fee. So,
the ratio is increased slightly compared with the previous year.
Page | 102
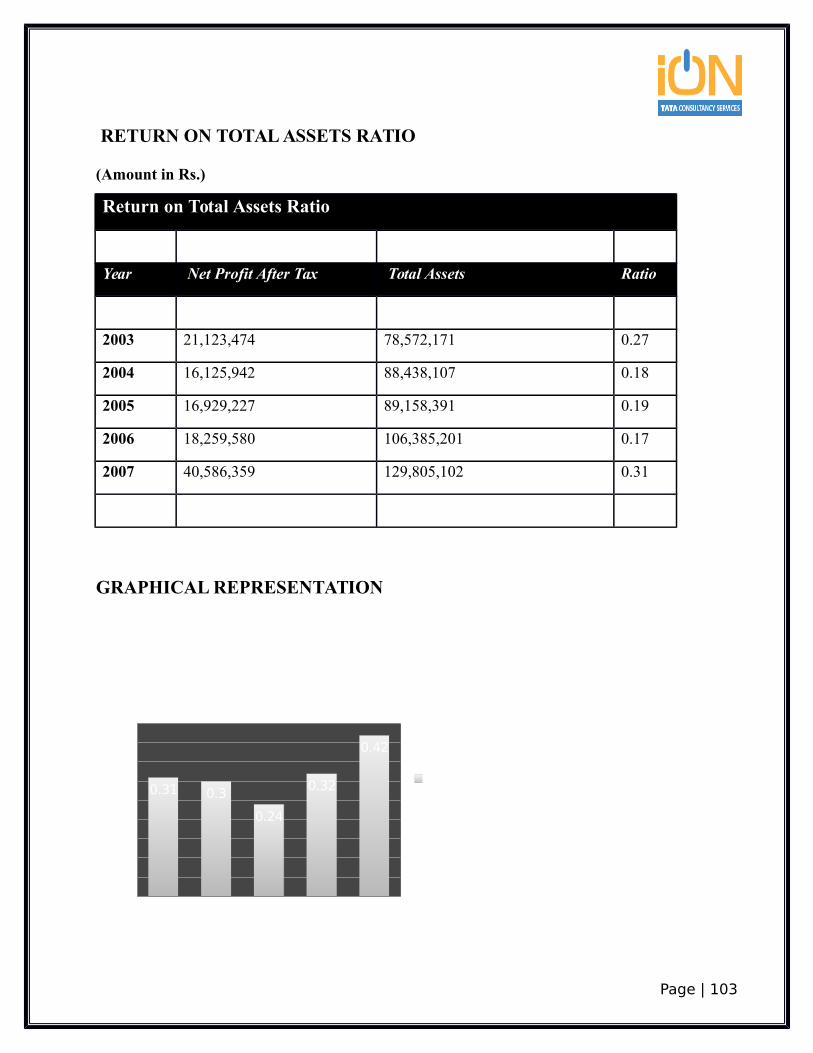
RETURN ON TOTAL ASSETS RATIO
(Amount in Rs.)
Return on Total Assets Ratio
Year Net Profit After Tax Total Assets Ratio
2003 21,123,474 78,572,171 0.27
2004 16,125,942 88,438,107 0.18
2005 16,929,227 89,158,391 0.19
2006 18,259,580 106,385,201 0.17
2007 40,586,359 129,805,102 0.31
GRAPHICAL REPRESENTATION
2011 2012 2013 2014 20150
0.050.1
0.150.2
0.250.3
0.350.4
0.45
0.31 0.3
0.24
0.32
0.42
RETURN ON TOTAL ASSETS RATIO
Return on Investment Ratios
Page | 103

Interpretation
This is the ratio between net profit and total assets. The ratio indicates the return on total assets in
the form of profits.
The net profit is increased in the current year because of the increment in the income from
services due to the increase in Operations & Maintenance fee. The fixed assets are reduced due
to the charge of depreciation and no major increments in fixed assets but the current assets are
increased because of sundry debtors and that effects an increase in the ratio compared with the
last year i.e. 2014.
Page | 104

12. RESERVES & SURPLUS TO CAPITAL RATIO
(Amount in Rs.)
Reserves & Surplus To Capital Ratio
Year Reserves & Surplus Capital Ratio
2003 65,599,299 2,079,920 31.54
2004 34,582,554 18,719,280 1.85
2005 51,511,781 18,719,280 2.75
2006 37,754,372 18,719,280 2.02
2007 78,340,733 18,719,280 4.19
Page | 105

2011 2012 2013 2014 20150
0.05
0.1
0.15
0.2
0.25
0.3
0.35
0.4
0.45
0.31 0.3
0.24
0.32
0.42
RESERVES & SURPLUS TO CAPITAL RATIO
Return on Investment Ratios
Interpretation
The ratio is used to reveal the policy pursued by the company a very high ratio indicates a
conservative dividend policy and vice-versa. Higher the ratio better will be the position.
The reserves & surplus is decreased in the year 2014, due to the payment of dividends and in the
year 2015the profit is increased. But the capital is remaining constant from the year 2012. So the
increase in the reserves & surplus caused a greater increase in the current year’s ratio compared
with the older.
Page | 106

OVERALL PROFITABILITY RATIOS
EARNINGS PER SHARE
(Amount in Rs.)
Earnings Per Share
Year Net Profit After Tax No of Equity Shares Ratio
2011 21,123,474 207,992 101.56
2012 16,125,942 1,871,928 8.61
2013 16,929,227 1,871,928 9.04
2014 18,259,580 1,871,928 9.75
2015 40,586,359 1,871,928 21.68
GRAPHICAL REPRESENTATION
Page | 107

2011 2012 2013 2014 20150
0.05
0.1
0.15
0.2
0.25
0.3
0.35
0.4
0.45
0.31 0.3
0.24
0.32
0.42
EARNINIG PER SHARE RATIOS
Return on Investment Ratios
Interpretation
Earnings per share ratio are used to find out the return that the shareholder’s earn from their shares.
After charging depreciation and after payment of tax, the remaining amount will be distributed by all
the shareholders.
Net profit after tax is increased due to the huge increase in the income from services. That is the
amount which is available to the shareholders to take. There are 1,871,928 shares of Rs.10/- each.
The share capital is constant from the year 2012. Due to the huge increase in net profit the earnings
per share is greaterly increased in 2015.
Page | 108

14. PRICE EARNINGS (P/E) RATIO
(Amount in Rs.)
Price Earning (P/E) Ratio
Year Market Price Per Share Earnings Per Share Ratio
2011 32.54 101.56 0.32
2012 28.47 8.61 3.30
2013 37.52 9.04 4.15
2014 30.17 9.75 3.09
2015 51.85 21.68 2.39
GRAPHICAL REPRESENTATION
2011 2012 2013 2014 20150
0.05
0.1
0.15
0.2
0.25
0.3
0.35
0.4
0.45
0.31 0.3
0.24
0.32
0.42
PRICE EARNINIG(P/E) RATIOS
Return on Investment Ratios
Page | 109

Interpretation
The ratio is calculated to make an estimate of application in the value of share of a company.
The market price per share is increased due to the increase in the reserves & surplus. The
earnings per share are also increased greaterly compared with the last year because of increase in the
net profit. So, the ratio is decreased compared with the previous year.
Page | 110

RETURN ON INVESTMENT
(Amount in Rs.)
Return on Investment
Year Net Profit After Tax Share Holders Fund Ratio
2011 21,123,474 67,679,219 0.31
2012 16,125,942 53,301,834 0.3
2013 16,929,227 70,231,061 0.24
2014 18,259,580 56,473,652 0.32
2015 40,586,359 97,060,013 0.42
GRAPHICAL REPRESENTATION
2011 2012 2013 2014 20150
0.05
0.1
0.15
0.2
0.25
0.3
0.35
0.4
0.45
0.31 0.3
0.24
0.32
0.42
RETURN ON INVESTMENT RATIOS
Return on Investment Ratios
Page | 111

Interpretation
This is the ratio between net profits and shareholders’ funds. The ratio is generally calculated as
percentage multiplying with 100.
The net profit is increased due to the increase in the income from services ant the shareholders
funds are increased because of reserve & surplus. So, the ratio is increased in the current year.
Page | 112

CHAPTER-4
FINDINGS OF STUDY
RECOMMENDATIONS
CONCLUSIONS
BIBLIOGRAPHY
Page | 113

FINDING OF SUDY
According to cash flow statement of the company, The finding of the study are as follows:-
1. The company has not taken any loans, secured or unsecured from companies, firms or other
parties.
2. The company has not accepted any deposit from the public during the year.
3. The company is not a sick industrial company.
4. The company has not granted any loan, secured or unsecured to company, firms or other
parties.
5. The company has paid the entire long term and short term borrowing during the year.
6. The company has buy back the company’s own share this year.
7. The interest paid in 2013 is more than the previous year.
I. The Net sales of SERVICES has increased considerably from 2012-13 to 2014-15, This can
be mainly attributed to changes in Variable and material costs and in the price.II. The Net sale of it services has increased considerably from 2012-13 to 2014-15, that is an
decrease of Rs.7216 per servives products. This can be mainly attributed to changes in
variable and material costs and in the prices.
RECOMMENDATIONS
Page | 114

According to cash flow statement of the company, The suggestions of the study are as
follows:-
1. The time durations for training program have to increase.
2. Buy regular review and consultations develop a career progression, which is sensitive
to performance and ability.
3. Create an environment where by people are trend developed to enable.
4. To take advantages of opportunities that arise.
5. The job can be redesigned where the work man stay in what is normally the same job
but has elements of it changed.
6. The principle amount must be paid in time, which can be reducing the interest the out
flow.
7. The purchase of the fixed asset must be made only when there is extreme
requirement.
8. In order to avoid taxes the company should go for more investment.
9. The company’s borrowings should go for more investment.
I. The company should try to reduce the depreciations as maximum as possible.
CONCLUSION
1. The study on competency level of employees at TCS-ION gave an insight about the
acceptance of competency mapping by employees.
2. The employees at the company welcome with the introduction of competency mapping in
their organization as they felt it was very much essential in enhancing their skills and
organizational development.
Page | 115

3. The organization has provided the recourses guidance and support to facilitate the
introduction of competency level easily and develop the employees in such a way that they
can face any kind of challenge.
4. However the level of competency in employees is found to be satisfactory. Providing proper
training, education and guidance to the employees can enhance the level.
5. This study was mainly carried out to find out whether thee competency mapping being
followed by the company is effective till date. If the competency mapping and fitment to the
organization.
6. By looking at the graphs and tables it is quite that the employees still are not up to the level
of competent pool, they still have to be trained and made competent in order to fill the gap.
As the organization has just applied the mapping, it has to see to that it meets all the
requirements for competency mapping.
7. Therefore the graphs make it quite clear that, the potential of the employees is not up to the
mark, and i.e. they are not competent enough to meet the competency-mapping requirement.
Hence by further training and counseling this gap can be closed.
8. This report includes the training requirements of employees and it highlights skills possessed
by each employee and skill required. All employees get training so that skill can be improved
and maintain balance between standard performance with their actual performance to avoid
gap.
BIBLIOGRAPHY
Ifarihttps://www.google.co.in/search?
newwindow=1&safe=active&q=cash+flows&oq=cash+flows&gs_l=serp.3..0l10.2184.15018
.0.15449.46.23.3.1.1.0.701.3485.3-5j1j1j1.8.0....0...1c.1.64.serp..34.12.3499.HzcOUU http://www.accountingcoach.com/cash-flow-statement/explanation https://en.wikipedia.org/wiki/Cash_flow_statements
Page | 116

http://www.investopedia.com/articles/04/033104.asp https://www.google.co.in/search?
q=cash+flows+statement&newwindow=1&safe=active&tbm=isch&tbo=u&source=univ&sa
=X&ved=0ahUKEwjA4uT5l_7LAhXFkI4KHY82B_MQsAQIQA https://www.google.co.in/search?
newwindow=1&safe=active&q=cash+flows+statement+technique&oq=cash+flows+stateme
nt+technique&gs_l=serp.3..0i22i30.166131.170423.0.170805.12.11.1.0.0.0.152.1477.0j11.11
.0....0...1c.1.64.serp..0.12.1487.A88uX3_qz5M http://www.charteredclub.com/cash-flow-statement-direct-indirect-method/ http://www.dummies.com/how-to/content/methods-for-preparing-the-statement-of-cash-
flows.html https://en.wikipedia.org/wiki/Cash_flow_statement http://www.accountingtools.com/questions-and-answers/how-to-prepare-a-cash-flow-
statement.html
Page | 117

Page | 118

Page | 119

Page | 120

Page | 121

Page | 122