a study on consumer perception and satisfaction towards
TRANSCRIPT
© 2018 JETIR June 2018, Volume 5, Issue 6 www.jetir.org (ISSN-2349-5162)
JETIR1806754 Journal of Emerging Technologies and Innovative Research (JETIR) www.jetir.org 421
A Study on consumer perception and satisfaction
towards restaurants with reference to Coimbatore
city
1 Mrs.R.Kalaivani, 2 Mrs. P.Girija
Assistant professor in Commerce, Rathinam College of Arts and Science.
ABSTRACT
Food industry is one of the world’s fastest growing sectors. However, over a period of time, with a
growth in the number of nuclear families, economic growth and increasing per capita income as well as
globalization, food culture gained prominence in India. The purpose of this to investigate the different
elements which affect the customer's satisfaction or which can increase the customer satisfaction, such like
promotion is one variable through which you can enhance the satisfaction level in promotion through
personal selling and public relation ,advertising. This research is mainly based on hotels in Coimbatore, a
major city of Indian state of Tamil Nadu. Coimbatore which is known as Manchester of South India is the
fastest growing cities in India and a major hub for various industries. Coimbatore cuisine is predominantly
south Indian with rice as its base. Most local restaurants still retain their rural flavour, with many restaurants
serving food over a banana leaf. Coimbatore has an active food culture and various cuisine options for
dining.
Keywords: Food, Consumer perception, promotion and satisfaction
INTRODUCTION
Globalization has made drastic changes in world economy and it has offered lots of opportunities for
business houses and industries. The Restaurant industry today is a diverse composite of ownership patterns
and varying management structures which offer a variety of services. However, the basic product, which is
the Food - Drink remains the same. With the emergence of weekend culture in metros, increment in
standard of living of service class people, emergence of mall and retail culture, the Indian restaurant
industry has a profitable future. Customers usually consider various factors before making a choice of a
restaurant. These factors may be understood as service, taste, cleanliness, location, charge, payment mode,
loyalty, free gifts, variety in terms of food available, brand name etc. These are the reasons due to which
identification of customer preference becomes a needy element for restaurant management.
The present study found links between consumers preference towards the restaurant attributes and
satisfaction. This study depicts (by analysis of various factors) how consumers get attracted towards a

© 2018 JETIR June 2018, Volume 5, Issue 6 www.jetir.org (ISSN-2349-5162)
JETIR1806754 Journal of Emerging Technologies and Innovative Research (JETIR) www.jetir.org 422
restaurant. This study provides guidelines for the marketer to formulate the marketing strategies to maintain
the consumer demand.
A restaurant is an establishment that serves prepared food and beverages to be consumed on the
premises. The term covers a multiplicity of venues and a diversity of styles of cuisine. Restaurant means a
business whose principal purpose is the sale of food or beverage served in paper, plastic or other disposable
containers for immediate consumption inside, outside or away from the building, including businesses that
provide delivery of food for immediate consumption. A restaurant owner is called a restaurateur; both
words derive from the French verb restaurer, meaning "to restore". Professional artisans of cooking are
called chefs, while prep staff and line cooks prepare food items in a more systematic and less artistic
fashion. In the restaurants, products and suppliers are used on a “first-in, first- out” basis to ensure
freshness. All restaurants provide warm and inviting environment and a variety of comfortable seating
arrangements to accommodate anyone – from a single individual to a large family.
STATEMENT OF THE PROBLEM
The diverse culinary habits, wide range of cuisines and the diverse cooking techniques are some of
the main factors behind the growth of restaurants in India. With the high standard of living and the change
in the lifestyle of the people, more and more consumers are also flocking various restaurants. Recent
surveys have shown that there has been a growing trend among the Indians to taste various types of
gastronomical delights. This has also led to the growth of restaurants which serve regional and international
delicacies.
According to recent surveys, the rate of growth of the restaurant industry in India is expected to be
around 4.5% on an average. A significant number of the workforce in the country is also engaged in the
restaurant industry. According to recent survey, by the end of the year 2012, the overall restaurant industry
in the world will employ around 13.3 million people, of which India will have a significant share.
A restaurant takes a basic drive-the simplest act of eating-and transforms it into a civilized ritual
involving hospitality, imagination, satisfaction, graciousness, and warmth. Physiological and social needs
are listed in Maslow's hierarchy of needs. Hunger is a need that produces physiological discomfort, which
can be satisfied by eating. Restaurants can satisfy this physiological need and can also satisfy a person's
higher level needs. Going to a restaurant is a social experience, an opportunity to meet old friends, amazed
by exciting food presentations, and to even be entertained by a small musical ensemble or a chef preparing
the meal at the table in front of the customers.

© 2018 JETIR June 2018, Volume 5, Issue 6 www.jetir.org (ISSN-2349-5162)
JETIR1806754 Journal of Emerging Technologies and Innovative Research (JETIR) www.jetir.org 423
The demand for food away from home increases due to changing demographics, more disposable
income and increasing standard of living. Dining out also is considered a leisure activity. So people are
visiting a restaurant to entertain friends and relatives, celebrate a birthday or special occasion, or do not
want to cook. These consumers are concerned with satisfaction for themselves or for that group with whom
he/she is dining. At this juncture it is felt by the researcher that it is pertinent to study the opinion and level
of satisfaction about the various service aspects in the restaurant industry.
SCOPE OF THE STUDY
The Indian restaurant industry worth 43000 Crore is growing at the rate of 5-6 percent annually,
although the majority of these restaurants fall in the unorganized segment which comprises 84 percent, as of
2010. The key drivers of the industry are the changing demographics of the country, increasing prosperity,
greater exposure to various lifestyles, and the willingness to experiment with various cuisines. The
restaurants are having wide opportunities to serve in airports, railways stations, bus terminals, medical
institutions, educational institutes and office complexes. The restaurant industry posted modest job
growth last year, and that growth is expected to accelerate in 2011. This year, the industry will add jobs at a
rate of 2.4%, compared with the 1.8% expected for the national economy. In the next decade, the industry
will add 1.3 million positions. According to the National Restaurant Associations 2011 Restaurant Industry
forecast, consumers today spend 49% of their food budget in the restaurant community, compared with on
25% in 1955.
In today’s world there is more number of working population among us. Women are also equally
engaged in outside work and are playing an active role in their career development. In such a scenario the
demand for the restaurants has grown exponentially.
The number of restaurants in Coimbatore has seen a phenomenal increase in the past few years. This
study mainly concentrates on the reasons of why people prefer restaurants, the attributes of restaurants that
attract people and the differences in consumer expectations and what actually is being delivered.
So the findings will help the restaurant industry to adopt themselves to the changes in order to meet
the consumer demand.
OBJETIVES OF THE STUDY
The following are the objectives formulated for the purpose of the study
To examine the awareness of respondents about the Restaurants in the selected city.
To study the respondents perception about the various aspects of the restaurants.
To find out the reasons for preferring a particular restaurant.

© 2018 JETIR June 2018, Volume 5, Issue 6 www.jetir.org (ISSN-2349-5162)
JETIR1806754 Journal of Emerging Technologies and Innovative Research (JETIR) www.jetir.org 424
To analyze the level of satisfaction of consumers towards the services provided by the Restaurants.
RESEARCH METHODOLOGY
Methodology is a way to solve the research problems systematically by appealing the various
research techniques along with the logic behind the problem. Research methodology is a collective term for
the structured process of conducting research. There are many different methodologies used in various
types of research and the term is usually considered to include research design, data gathering and data
analysis. The methodology planned for the purpose of the study as follows,
AREA OF THE STUDY
The area of the study is Coimbatore city. Coimbatore, popularly known as Manchester of South
India, is situated in western part of the state Tamil Nadu. The district was ruled successively by several
dynasties of South India. Under the Cholas during the 11th century, the present-day Coimbatore came into
existence as a jungle village under an Irula chieftain.
Coimbatore district lies in the western part of Tamil Nadu, part of the Kongu Nadu region. The
district borders with Palakkad district of Kerala in the West, Nilgiris district in the north, Erode district in
the North East and East, Idukki district of Kerala in the South and Dindigul district in the south east. The
district has an area of 7,649 square kilometers. The South Western and Northern parts are hilly, part of the
Western Ghats, and enjoys pleasant climate all throughout the year with heavy rainfall.
Coimbatore is known for its pleasant climate, textiles, electric motors, pumps, automobile spares,
iron steel and aluminum costing from major exports from Coimbatore, due to which it has earned the title
“Detroit of the South”. The per- capita income of consumer was comparatively higher and their expenditure
level was also be higher.
The people in Coimbatore are friendly and very courteous, their openness and hospitality make them
a pleasure to talk and be with the city and the regions owe its prosperity to this quality of its people. It is
also known for its educational institutions of great repute and hence based on these advantages the study has
been conducted in Coimbatore
DATA SOURCES
Both primary data and secondary data have been used for the study purpose. The primary data are
collected from the customers of restaurants with the help of a structured questionnaire. The questionnaire
was prepared in such a way that they are simple and understandable so as to enable the respondents to

© 2018 JETIR June 2018, Volume 5, Issue 6 www.jetir.org (ISSN-2349-5162)
JETIR1806754 Journal of Emerging Technologies and Innovative Research (JETIR) www.jetir.org 425
express their views and opinions freely and frankly. The secondary data has been collected by referring to
Journals, Articles, and Magazines and various relevant websites.
SAMPLE SIZE AND SAMPLING METHOD
The sample of 250 respondents was chosen for the study. For purpose of the study, convenient
random sampling technique has been adopted. The customers who made a visit to the restaurants form the
sample unit and among them 250 respondents were selected for the study purpose.
STATISTICAL TOOLS USED IN THE STUDY
The data collected were analyzed on parallel with the objectives of the study on hand. Conventional
tools like descriptive tables and percentages were used for the purpose of analysis. The graphs and charts
have also been made use of where ever necessary. Further, the following specific tools were used.
Chi – square test
Average ranking analysis
Average Scoring analysis
LIMITATIONS OF THE STUDY
The study is subject to the following limitations
This study is restricted to Coimbatore city only. Its findings and suggestions may not be applicable
to all other regions.
Time and cost are the factors which have limited the size of sample as 250.
REVIEW OF LITERATURE
Molly Thompson; April 16, 2018, Article named How to Improve Customer Service in a Restaurant, In his
article he concluded that, A restaurant's managers and its employees all share the responsibility for ensuring
the customers are treated well and left with an overall positive impression of their dining experience.
Rezende and Avelar (2012) attempted to describe the eating out habits of consumers in Brazil. The study
revealed that a ‘search for variety’ was a motivator for eating outside the home. The desire for
‘convenience’ was an important element on many occasions of consumption. The younger people and
people with higher incomes possessed more intensive consumption and more favorable attitudes towards
eating out. The study also revealed that although eating out was a very popular trend, many of the
consumers did not voice any intention of eating out more frequently. An attitude towards eating out was not
© 2018 JETIR June 2018, Volume 5, Issue 6 www.jetir.org (ISSN-2349-5162)
JETIR1806754 Journal of Emerging Technologies and Innovative Research (JETIR) www.jetir.org 426
all so positive, with certain levels of suspicion or mistrust on the part of the consumers’ frequency of
buying.
Anand (2011) explored the impact of demographics and psychographics on young consumer’s food choice
towards fast food in Delhi, India. The key determinants impacting consumers food choice were found out to
be passion for eating out, socialize, ambience and taste of fast food and convenience for dual-income
families in urban India. Findings indicated that fast food companies can no longer rely on convenience as
USP in India, unless the implication of same on consumer’s health is given equal importance in the years to
come.
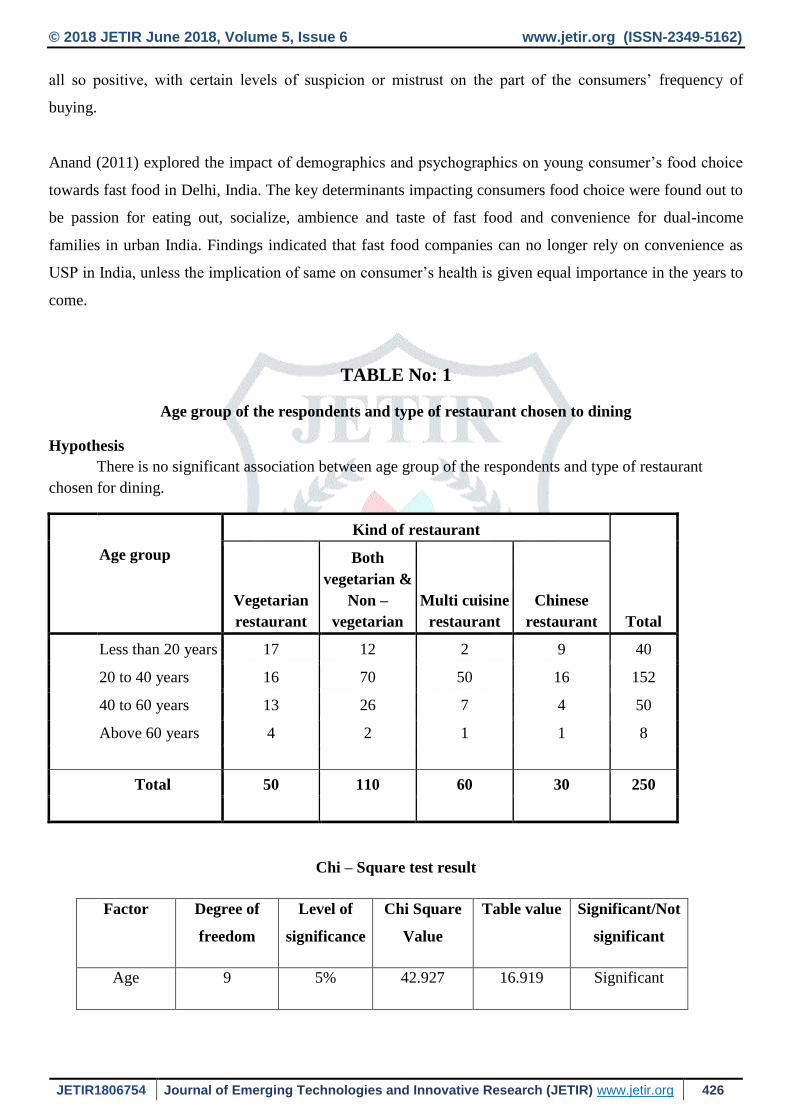
TABLE No: 1
Age group of the respondents and type of restaurant chosen to dining
Hypothesis
There is no significant association between age group of the respondents and type of restaurant
chosen for dining.
Kind of restaurant
Total
Age group
Vegetarian
restaurant
Both
vegetarian &
Non –
vegetarian
Multi cuisine
restaurant
Chinese
restaurant
Less than 20 years 17 12 2 9 40
20 to 40 years 16 70 50 16 152
40 to 60 years 13 26 7 4 50
Above 60 years 4 2 1 1 8
Total 50 110 60 30 250
Chi – Square test result
Factor Degree of
freedom
Level of
significance
Chi Square
Value
Table value Significant/Not
significant
Age 9 5% 42.927 16.919 Significant

© 2018 JETIR June 2018, Volume 5, Issue 6 www.jetir.org (ISSN-2349-5162)
JETIR1806754 Journal of Emerging Technologies and Innovative Research (JETIR) www.jetir.org 427
Inference
Since the calculated value of χ2 is greater than the table value, the hypothesis is rejected.
Hence it can be concluded that there is a significant association between age group of the
respondents and type of restaurant chosen to dining. So it can be concluded that age is influencing while
choosing the restaurants.
TABLE No: 2
Age group of the respondents and frequency of dining at the restaurants
Hypothesis
There is no significant association between age group of the respondents and frequency of dining
at the restaurants.
Age group
Frequency of dining at the restaurants
Total
Daily
Once a
week
Twice a
week
Once a
month
Twice a
month Occasionally
Less than 20 years 3 8 7 5 4 13 40
20 to 40 years 4 22 38 36 28 24 152
40 to 60 years 1 5 5 15 11 13 50
Above 60 years 0 0 0 1 4 3 8
Total
8 35 50 57 47 53 250
Chi – Square test result
Factor Degree of
freedom
Level of
significance
Chi Square
Value
Table value Significant/Not
significant
Age 15 5% 27.366 24.996 Significant
Inference
Since the calculated value of χ2 is greater than the table value, the hypothesis is rejected.
Hence it can be concluded that there is a significant association between age group of the
respondents and frequency of dining at the restaurants.

© 2018 JETIR June 2018, Volume 5, Issue 6 www.jetir.org (ISSN-2349-5162)
JETIR1806754 Journal of Emerging Technologies and Innovative Research (JETIR) www.jetir.org 428
TABLE A.4
Age group of the respondents and items enjoyed at the restaurants
Hypothesis
There is no significant association between age group of the respondents and items enjoyed at the
restaurants.
Items enjoyed at the restaurants
Total
Age group Breakfast
items
Lunch
items
Dinner
items
Beverage
items All items
Less than 20 years 7 13 16 4 0 40
20 to 40 years 19 55 48 26 4 152
40 to 60 years 2 22 18 7 1 50
Above 60 years 2 0 5 1 0 8
Total
30 90 87 38 5 250
Chi – Square test result
Factor Degree of
freedom
Level of
significance
Chi Square
Value
Table value Significant/Not
significant
Age 12 5% 13.712 21.026 Not significant
Inference
Since the calculated value of χ2 is lesser than the table value, the hypothesis is accepted.
Hence it can be concluded that there is a no significant association between age group of the
respondents and items enjoyed at the restaurants.
TABLE A.6
Gender and type of restaurants chosen to dining
Hypothesis
There is no significant association between gender and type of restaurants chosen to dine at the
restaurants.

© 2018 JETIR June 2018, Volume 5, Issue 6 www.jetir.org (ISSN-2349-5162)
JETIR1806754 Journal of Emerging Technologies and Innovative Research (JETIR) www.jetir.org 429
Type of restaurants choose for dining
Total
Gender
Vegetarian
restaurant
Both
vegetarian &
Non –
vegetarian
Multi cuisine
restaurant
Chinese
restaurant
Male 25 62 24 24 135
Female 25 48 36 6 115
Total
50 110 60 30 250
Chi – Square test result
Factor Degree of
freedom
Level of
significance
Chi Square
Value
Table value Significant/Not
significant
Gender 3 5% 13.468 7.815 Significant
Inference
Since the calculated value of χ2 is greater than the table value, the hypothesis is rejected.
Hence it can be concluded that there is a significant association between gender and type of
restaurants choose to dine at the restaurants.
TABLE A.7
Family monthly income and amount spent per visit to dine at the restaurant
Hypothesis
There is no significant association between family monthly income of the respondents and amount
spent per visit to dine at the restaurant.
Amount spent to dine at the restaurant
Total
Family monthly
income Below Rs.
500
Rs. 501 –
1000
Rs. 1001-
1500
Above Rs.
1500
Below 20000 19 20 13 6 58
20000 – 40000 9 36 27 3 75
40000 – 60000 5 13 27 12 57
Above 60000 4 34 13 9 60

© 2018 JETIR June 2018, Volume 5, Issue 6 www.jetir.org (ISSN-2349-5162)
JETIR1806754 Journal of Emerging Technologies and Innovative Research (JETIR) www.jetir.org 430
Amount spent to dine at the restaurant
Total
Family monthly
income Below Rs.
500
Rs. 501 –
1000
Rs. 1001-
1500
Above Rs.
1500
Below 20000 19 20 13 6 58
20000 – 40000 9 36 27 3 75
40000 – 60000 5 13 27 12 57
Above 60000 4 34 13 9 60
Total
37 103 80 30 250
Chi – Square test result
Factor Degree of
freedom
Level of
significance
Chi Square
Value
Table value Significant/Not
significant
Family monthly
income
9 5% 43.484 16.919 Significant
Inference
Since the calculated value of χ2 is greater than the table value, the hypothesis is rejected.
Hence it can be concluded that there is a significant association between family monthly income of
the respondents and amount spent per visit to dine at the restaurant.
Occupational status of the respondents and type of restaurants chosen to dining
Hypothesis
There is no significant association between occupational status of the respondents and type of
restaurants chosen for dining.
Type of restaurants choose for dining
Total
Occupational
status
Vegetarian
restaurant
Both vegetarian
&
Non –
vegetarian
Multi cuisine
restaurant
Chinese
restaurant
Agriculture 3 6 4 2 15

© 2018 JETIR June 2018, Volume 5, Issue 6 www.jetir.org (ISSN-2349-5162)
JETIR1806754 Journal of Emerging Technologies and Innovative Research (JETIR) www.jetir.org 431
Business 10 19 9 5 43
Employed 14 31 24 8 77
Professional 7 19 16 10 52
Others 16 35 7 5 63
Total
50 110 60 30 250
Chi – Square test result
Factor Degree of
freedom
Level of
significance
Chi Square
Value
Table value Significant/Not
significant
Occupational
status
12 5% 15.796 21.026 Significant
Inference
Since the calculated value of χ2 is lesser than the table value, the hypothesis is accepted.
Hence it can be concluded that there is a significant association between occupational status of the
respondents and type of restaurants chosen to dining.
A. Average Ranking Analysis
In this section, average ranking analysis is used to analyze the ranks given by the respondents for
various factors. The weights have been assigned to various ranks and total scorings are calculated.
The average ranking scores are calculated based on the total scores and then the ranks are allotted.
Ranks assigned by the respondents for choose a restaurant
TABLE B. 1
Average Rank Analysis – Factors influencing to choose a restaurant
S.
N
o
Promotion
Rank
I
Rank
II
Rank
III
Rank
IV
Rank
V
Rank
VI
Rank
VII
Rank
VIII Total Mean Ranks
Value 8 7 6 5 4 3 2 1

© 2018 JETIR June 2018, Volume 5, Issue 6 www.jetir.org (ISSN-2349-5162)
JETIR1806754 Journal of Emerging Technologies and Innovative Research (JETIR) www.jetir.org 432
1 Availability
of food
items
No 8 27 60 82 45 13 12 3 250
score 64 189 360 410 180 39 24 3 1269 35.25 V
2 Variety of
items
No 65 65 50 27 15 13 7 8 250
score 520 455 300 135 60 39 14 8 1531 42.53 II
3 Quality of
food
No 107 62 40 13 18 7 3 - 250
score 856 434 240 65 72 21 6 - 1694 47.06 I
4 Reasonable
price
No 30 58 35 40 52 18 7 10 250
score 240 406 210 200 208 54 14 10 1342 37.28 III
5 Service No 32 25 40 55 60 22 8 8 250
score 256 175 240 275 240 66 16 8 1276 35.44 IV
6 Infrastructu
re
No 3 5 10 13 17 50 80 72 250
score 24 35 60 65 68 150 160 72 634 17.61 VII
7 Parking
facility
No - - 5 5 15 65 75 85 250
score - - 30 25 60 195 150 85 545 15.14 VIII
8 Popularity No 5 8 10 15 28 62 58 64 250
score 40 56 60 75 112 186 116 64 709 19.69 VI
Total 250 250 250 250 250 250 250 250 9000 250
From the data collected, Average Ranking Scores have been calculated for the factors which
influence the respondents to choose a restaurant.
From the analysis it was understood that the respondents were given first rank to quality of food,
second rank to variety of items, third rank to reasonable price, fourth rank to service, fifth rank to
availability of food items, sixth rank to popularity, seventh rank to infrastructure and eighth rank to parking
facility.
Hence it can be concluded that quality of food has been given priority by the majority of the
respondents.
A. Average Scoring Analysis
In order to use this technique first the qualitative information is converted into quantitative
one through a 5 point scaling technique. After converting into scores the average score is calculated
mainly to assess the level of opinion / satisfaction of the different categories of respondents on
various aspects.

© 2018 JETIR June 2018, Volume 5, Issue 6 www.jetir.org (ISSN-2349-5162)
JETIR1806754 Journal of Emerging Technologies and Innovative Research (JETIR) www.jetir.org 433
TABLE C.1
Level of satisfaction towards the service aspects of the restaurants
Aspect
Highly
satisfied Satisfied Neutral Dissatisfied
Highly
dissatisfied Total
Mean
5 4 3 2 1
Food portion size
32 127 68 15 8
Score 160 508 204 30 8 910 3.68
Temperature of food 15 105 82 43 5
Score 75 420 246 86 5 832 3.328
Variety of food/
beverage 43 150 40 12 5
Score 215 600 120 24 5 964 3.856
Quality and taste of
food 52 155 35 5 3
Score 260 620 105 10 3 998 3.992
Cleanliness of the
dining area 40 97 95 15 3
Score 200 388 285 30 3 906 3.624
Value you received
for the price paid 32 113 87 13 5
Score 160 452 261 26 5 904 3.616
Comfortable and
welcoming feeling 22 120 80 20 8
Score 110 480 240 40 8 878 3.512
Convenience of
washroom 20 107 90 28 5
Score 100 428 270 56 5 859 3.436
Timeliness of service
20 120 80 30 0
Score 100 480 240 60 0 880 3.52
Accuracy of order –
taking 32 138 65 12 3
Score 160 552 195 24 3 934 3.736
Communication skills
of the staff 27 120 80 20 3
Score 135 480 240 40 3 898 3.592
Attentiveness of the
staff 20 115 75 37 3
Score 100 460 225 74 3 862 3.448
Payment of bill
30 162 45 13 0
Score 150 648 135 26 0 959 3.836
Working hours
32 165 42 8 3
Score 160 660 126 16 3 965 3.86
Working of parcel
section 22 127 80 20 1

© 2018 JETIR June 2018, Volume 5, Issue 6 www.jetir.org (ISSN-2349-5162)
JETIR1806754 Journal of Emerging Technologies and Innovative Research (JETIR) www.jetir.org 434
Score 110 508 240 40 1 899 3.596
Total Score 2195 7684 3132 582 55 13648
From the above analysis it was understood that the respondents are satisfied towards food portion
size, variety of food/ beverage, quality and taste of food, cleanliness of the dining area, value received for
the price paid, comfortable and welcoming feeling, timeliness of service, accuracy of order – taking,
communication skills of the staff, payment of bill, working hours, working of parcel section and the
respondents are neutrally satisfied towards temperature of food, convenience of washroom, attentiveness of
the staff.
CONCLUSION
Rapid transformation in the lifestyle of Indians, particularly those living in urban India, has resulted
in dramatic increase in the demand for processed food. The main reason why processed food is luring the
urban Indians is the convenience that it offers to cooking, as they do not need to spend hours in kitchen to
get that appetizing food. Growth in working women’s population and prevalence of nuclear families with
double income are other trends causing this change in the lifestyle of Indians. Food culture in India is as
complex as the tapestry of its heritage. The diverse culinary rituals, wide range of cuisines and the varied
cooking techniques make for layer upon layer of an overwhelming yet enriching experience. No holiday is
complete without good food and India makes sure it offers a wide selection. Growth of restaurants in the
country has put on the table not only diverse local flavors but a huge variety of international cuisines. Indian
food choices are a gastronomical delight with each region offering its signature cuisine. Eating out today is
considered an experience; it has always been a way of life for Indians. Independent outlets therefore
continue to dominate the industry in India. There are a total of 1.5 million eating outlets in India and the
number is expected to grow very rapidly in the near future. Today’s customers are price – value oriented.
Therefore acting on their needs may help the restaurant industry to gain loyalty of the customers.
REFERENCE:
1. Rezende and Avelar. 2012),”Factors that influence the consumption of fast food outside the home”,
International Journal of Consumer Studies,Vol.36,pp 213-240.
2. Anand R., (2011), “A study of determinants impacting consumers food choice with reference to the
fast food consumption in India”, Society and Business Review,Vol.6, No.2,pp 176-187
3. Molly Thompson; April 16, 2018 How to Improve Customer Service in a Restaurant in business
chron.
4. Michael Lynn, Cornell University 2001, Restaurant Tipping and Service Quality: A Tenuous
Relationship