a study on flood forecasting at sungat lembing
TRANSCRIPT

PERPUSTAKAAN UMP
111111111 111111111 0000092800
A STUDY ON FLOOD FORECASTING AT SUNGAT LEMBING USING ARTIFICIAL NEURAL NETWORK
SITI NOOR ALINA BINTI MOHD ZULKAPLY
Thesis submitted in partial fulfilment of the requirements for the award of the degree of
B. Eng. (Hons.) Civil Engineering
Faculty of Civil Engineering and Earth Resources UNIVERSITI MALAYSIA PAHANG
JUNE 2014

Vi
ABSTRACT
Industrial countries which are rapidly developing had to faced environmental disaster. Flood occurs due to the excessive rainfall in the river catchment. The effects from flood are damage of properties and loss of life. Flood forecasting is necessities which will help in reduce the effects of flood and help better management planning of flood events. Statistical method such as Auto Regressive Moving Average (ARMA) is commonly used, but it is only a rough estimation of the flow. There is an alternative computing model that has been successfully tested in flood forecasting studies called Artificial Neural Network (ANN). It helps to produce an accurate forecasting result. The study is conducted to make accurate prediction of the flood event using Artificial Neural Network(ANN). The objective of the study is also to gain more understanding about Artificial Neural Network in data forecasting. Besides that, the objective of the study is to issue the flood warning. In this study, three iterations were conducted which is 1000, 2000 and 5000 iterations with six datasets of network model. The performance of training and validation data were evaluated using Nash Sutcliffe(NSC), correlation coefficient(R2), and Root Mean Square Error(RMSE). Error distribution graph are presented to show the accuracy and reliability of the forecasting models. The results showed that ANN able to provide accurate forecasting using sample historical datasets.
ABSTRAK
Negara-negara industri yang pesat membangun terpaksa mengahadapi bencana alam sekitar. Banjir berlaku disebabkan oleh hujan yang berlebihan di kawasan tadahan sungai. Kesan-kesan dari banjir adalah kerosakan harta benda dan kehilangan nyawa. Ramalan banjir adalah satu keperluan yang akan membantu mengurangkan kesan-kesan banjir dan perancangan banjir. Kaedah statistik seperti Auto Regressive Moving Average(ARIvIA) biasanya digunakan, tetapi ia adalah hanya anggaran kasar aliran. Terdapat satu alternatif model komputer yang telah berjaya diuji dalam kajian ramalan banjir adalah Artificial Neural Network(ANN). la membantu untuk menghasilkan keputusan ramalan yang tepat. Kajian mi dijalankan untuk membuat ramalan yang tepat tentang kejadian banjir menggunakan ANN. Objektif kajian mi juga untuk mendapat lebih kefahaman tentang Artificial Neural Network dan data ramalan. Di samping itu, objektif kajian mi adalah untuk memberi amaran banjir. Dalam kajian ini, tiga lelaran telah dijalankan iaitu 1000, 2000, dan 5000 dengan enam set data model rangkaian. Prestasi latihan dan pengesahan data telah diuji rnenggunakan Nash Sutcliffe(NSC), correlation coefficient(R2) dan Root Mean Square Error(RMSE). Graf pembahagian ralat dibentangkan untuk menunjukkan ketepatan dan kebolehpercayaan model ramalan tersebut. Hasil kajian menunjukkan ANN dapat menyediakan ramalan yang tepat menggunakan set data sampel terdahulu.
VII.

VIII
TABLE OF CONTENTS
Page SUPERVISOR'S DECLARATION 11
STUDENT'S DECLARATION 111
DEDICATION iv
ACKNOWLEDGEMENTS V
ABSTRACT vi
ABSTRAK vii
TABLE OF CONTENTS viii
LIST OF TABLES
ix
LIST OF FIGURES x
LIST OF SYMBOLS xi
LIST OF ABBREVIATIONS xii
CHAPTER 1 INTRODUCTION
1.1 Introduction 1
1.2 Problem Statement 2
1.3 Objectives of the Study 2
1.4 Scope ofthe Study 2
CHAPTER 2 LITERATURE REVIEW
2.1 Introduction 5
2.2 Flood Forecasting 5
2.3 What is Artificial Neural Network
6
2.3.1 Multilayer Perceptron 7
2.4 Types of Statistical Mathematical Equation 7
2.4.1 Auto Regressive Moving Average(ARMA)
7 2.4.2 Linear Regression 8
2.5 Important of Using Water Level
8

CHAPTER 3 RESEARCH METHODOLOGY
3.1 Introduction 9
3.2 Modelling Details 9
3.2.1 Artificial Neural Network 9
3.3 BASIC 256 11
3.4 Data Collection 12
3.5 Flowchart 12
3.6 Gantt Chart 13
CHAPTER 4 DATA ANALYSIS
4.1 Introduction 15
4.2 Performance Measures 15
4.3 Results and Discussion 16
CHAPTER 5 CONCLUSION AND RECOMMENDATIONS
5.1 Conclusion 24
5.2 Recommendations 25
ix
REFERENCES 26

LIST OF TABLES
Table No. Page
4.1 Network models in the study i
4.2 Value ofNSC for 1000,2000, and 5000 epochs 17
4.3 Value of Correlation Coefficient (R)
18
4.4 Value of Root Mean Square Error (RMSE) 19
4.5 NSC,R2, and RMSE value for Net-2 for 1000,2000,5000 19 and 10 000 epochs

LIST OF FIGURES
Figure No. Page
1.1 Sungai Lembing, Kuantan Pahang map 3
1.2 River cross section at Bukit Kenau 4
1.3 Water level recorded at Bukit Kenau station for January 2003 to 4 December 2009
3.1 Multilayer Perceptron 11
3.2 Work flow in this study 13
3.3 Gantt Chart of the work progress 14
4.1 Data Validation for Net-2 20
4.2 Data Validation Net-2 Error 21
4.3 Percentage of Error in Net-2 Data Validation 22
4.4 Comparison between observed and forecasted water level during 23 model validation
A

LIST OF SYMBOLS
0, Observed value
i i Forecasted value
C Observed value mean
F Forecasted value mean
N Number of records evaluated
Correlation coefficient
Qo Value of observed
Q. Value of forecasted
XII

LIST OF ABBREVIATIONS
ANN Artificial Neural Network
ARMA Auto Regressive Moving Average
BASIC Beginner's All-purposed Symbolic Instruction Code
DID Department of Irrigation and Drainage
MLP Multilayer Perceptron
NSC Nash-Sutcliffe efficiency coefficient
RMSE Root Mean Square Error
XIII

CHAPTER 1
INTRODUCTION
1.1 INTRODUCTION
An overflow of water that submerges land which is usually dry is called flood.
From a strict hydrological sense, flood also can be defined as a rise, usually brief, in the
water level in a stream to a peak from which the water level recedes at a slower rate
(UNESCO-WMO 1974). It is a dangerous phenomenon which bring to economic losses
and life losses. Floods can occur in any region, in the countryside or in cities. Floods
can also occur because of the flow rate exceeds the capacity of the river.
Flood forecasting can be defined as the use of real-time precipitation and stream
flow data in rainfall-runoff and stream flow models to forecast flow rates and water
levels for periods ranging from a few hours to days ahead, depending on the size of the
watershed or river basin. In order to make the most accurate flood forecasting, it is
better to have a long time-series of historical data that relates stream flows to measured
past rainfall events. Flood forecasting is significant to give flood warning to people.
Flood warning purpose is to make decisions whether warnings of floods should be
issued to the public or previous warnings should be invalidated.
The study are mainly about the hydrological flood forecasting using Artificial
Neural Network(ANN). ANN is a model approach from the structure of the brain which
well suited to certain tasks related to the hydrological. Numerous studies related to the
application of AJ'4Ns in order to overcome water resources variables problems. Data
used are depends on the study such as rainfall-runoff relationship(Hsu et
al, 1 995),regional flood frequency analysis(Hall and Minns, 1998) and river runoff

2
forecasting (Tokar and Johnson, 1999,Cigizoglu,2003),In this study daily water level
data will be used. Data training and data validation with forecasted value will be
produced once the ANN is running. ANN application does not require hard learning
process. In the following section will describe more on neural network model.
1.2 PROBLEM STATEMENT
Industrial countries which are rapidly developing had to faced environmental
disaster. Flood occur due to the excessive rainfall in the river catchment. The effects
from flood are damage of properties and loss of life. Flood forecasting is a necessity
which will help in reduce the effects of flood and planning for flood events. Statistical
method such as Auto Regressive Moving Average (ARMA) is commonly used, but it is
only a rough estimation of the flow. There is an alternative computing model that has
been successfully tested in flood forecasting studies called Artificial Neural Network
(ANN). It helps to produce an accurate forecasting results.
1.3 OBJECTIVES OF STUDY
1. Make a more accurate prediction of the flood event using Artificial Neural
Network (ANN)
2. To issue the flood warning more earlier to the peoples.
3. More understanding about Artificial Neural Network.
1.4 SCOPE OF STUDY
Commonly, flood forecasting be done in the river catchment area. So, scope of
the study is focused at Sungai Lembing. Sungai Lembing located in northwest of
Kuantan in Pahang, Malaysia. There is a station at Bukit Kenau, The station number is
3930401 .Catchment area of Bukit Kenau is 582km 2 .All the information are get from
Department of Irrigation and Drainage.(DID) Sungai Lembing has a low level land area
and risk of flood during heavy rain. Frequent flooding is usually happen because of
exceed water level of the river catchment. Many other factors are related with the flood
phenomena in Sungai Lembing such as uncontrolled logging activities and the depth of

3
the river could not support the capacity of excessive rainfall. Figure 1.1 shows Sungai
Lembing location. The normal water levels at Bukit Kenau is 17.00m while flood levels
at the station is 21.50m.Figure 1.2 shows the normal, alert and danger water levels at
Sungai Lembing. All the flooding events at Bukit Kenau which happen from year 2003
to 2009 are shown in Figure 1.3.
--' \ i___ _•; I'I'i;.
\.
•___'_j r\ / 2 -__f
) -,., I,
,8kIt'f
_X7 5 _•-_',,/ nt_fl
I \ — rn
Kuantank.
'1 / I / ( cUr -' I
i'
Senl.mbu -
I (-lj&Kuantan
I I- Ta \ / . z Pa I
I -PUfl
Figure 1.1 Sungai Lembing, Kuantan Pahang map
(www.googlemap/Sg Lembing)

- - Hydrograph for Sg.Kuantan at Bukit Kenau (PHO) -- - -
t1l2003 I j D. £nd 3O912OO9 I +"
t Kflt fl di eot Ken I
11
2 2222
222
2826 aaaS8
.
2 *
4
Figure 1.2 : River cross section at Bukit Kenau
(infobanjir.water.gov.my)
Figure 1.3 Water level recorded at Bukit Kenau Station for
January 2003 to December 2009
(infobanjir.water.gov.my)

CHAPTER 2
LITERATURE REVIEW
2.1 INTRODUCTION
This chapter briefly shows the previous studies about the topic. Flood
forecasting using Artificial Neural Network have been conducted with some journal
from other researchers. All the journals are made as a reference for my study in order to
complete this thesis. However the different are only the scope of study and different
modelling approaches use in each studies.
2.2 FLOOD FORECASTING
According to Ahmed El Shafie (2011), river flow forecasting is essential in
water resources management because it can facilitate the management of water
resources, thereby optimizing the use of water. The ability to forecast river flow also
helps predict the occurrence of future flooding, enabling better preparation to avoid the
loss of lives and minimize property damage.
Sungwon Kim et. Al (2000) also state that flood stage forecasting is an
important subject in water resources planning and management.. Flood stage forecasting
is often used for warning cities of impending flood flows.
Forecasting river flow after heavy rain is important for several purpose.M.
Campo lo et Al(1999) in their studies explain the significant purpose of flood forecasting
which are for public safety, environmental issues, and water management.

2.3 WHAT IS ARTIFICIAL NEURAL NETWORK
Current studies have shown that a parallel computing model has an ability to
predict river flow which called Artificial Neural Network. Ahmed El Shafie et Al
(2009) explain the definition of artificial neural network. He states that an artificial
neural network or known as ANN is a npn-linear mathematical approach that has been
proven the ability to map inputs and output pattern and mimic different dynamic
experienced in the data.
A simple definition is state by H. Kerem Cigizoglu(2003) that ANN is a model
inspired from the structure of the brain, is well suited to such tasks as pattern
recognition, combinatorial optimization and discrimination.
Many study about Artificial Neural Network. ANNs have been widely applied in
many areas including the financial, mathematical, computer, medicinal, weather
forecasting and engineering fields. In water resources studies, ANNs are employed to
forecast daily river flow (Atiya et al. 1999; Coulibaly et al. 2000; Ahmed and Sarma
2007; El-Shafie et al. 2008; Wu et al.2009)
Moreover, other studies by Hsu et al( 1995) make a comparison between ANN
models and traditional approach and conclude that ANN is more effective and more
efficient.
Many reasonable reason why Artificial Neural Network is chosen for the study.
The study by M Campolo et al(1999) conclude that ANN has an advantages of low cost
and simplicity with respect to complex physically based model.
6

FA
2.3.1 Multilayer Perceptron
There are many types of Artificial Neural Network, but commonly used is
Multilayer Perceptron(MLP),It is because MLP is easy to be understand and suitable for
our study.
As stated by Ahmed El Shafie (2009) in his journal, MLP is known as a
supervised feed forward back propagation learning ANN model. It consists of an input
layer, one or more hidden layers, and an output layer. The term supervised means that
the model requires output data to learn the pattern of data input. There are no cycles or
loops in the network. It is the most commonly used of artificial neural network in river
flow study.
2.4 TYPES OF STATISTICAL MATHEMATICAL EOUATION
The flood forecasting method is change from day to day. There are also
traditional approach research had be found in a few journals which called Statistical
Mathematical Equation. However, the method is less used and has come out with poor
results. Examples of Statistical Mathematical Equation used is Auto Regressive Moving
Average(ARMA) and Linear Regression.
2.4.1 Auto Regressive Moving Average(ARMA)
There is a journal called 'Parameter Estimation of an ARMA Model For River
Flow Forecasting Using Goal Programming' cited that there are still applications where
the accurate estimation of linear processes such as Auto Regressive Moving Average
models are sufficient especially when they are used for linear time series
analysis(Hwarng,200 1).
Others study which is by Abrahart and See(2000) make a comparison between
ARMA models and Artificial Neural network(ANN) for river flow data forecasting data
for two contrasting catchments. The result is quite similar relative performance between
both approach.
8
The objective of the study between ARIVIA and ANN are the same which is to
minimize the estimation error in forecasted time series as stated by H.R. Eslami et
al(2006).
The weakness of ARMA using Goal Programming method to calculate the
model coefficients is the high computational cost especially foe a large number of
model parameters.(K.Mohammadi et al,2006)
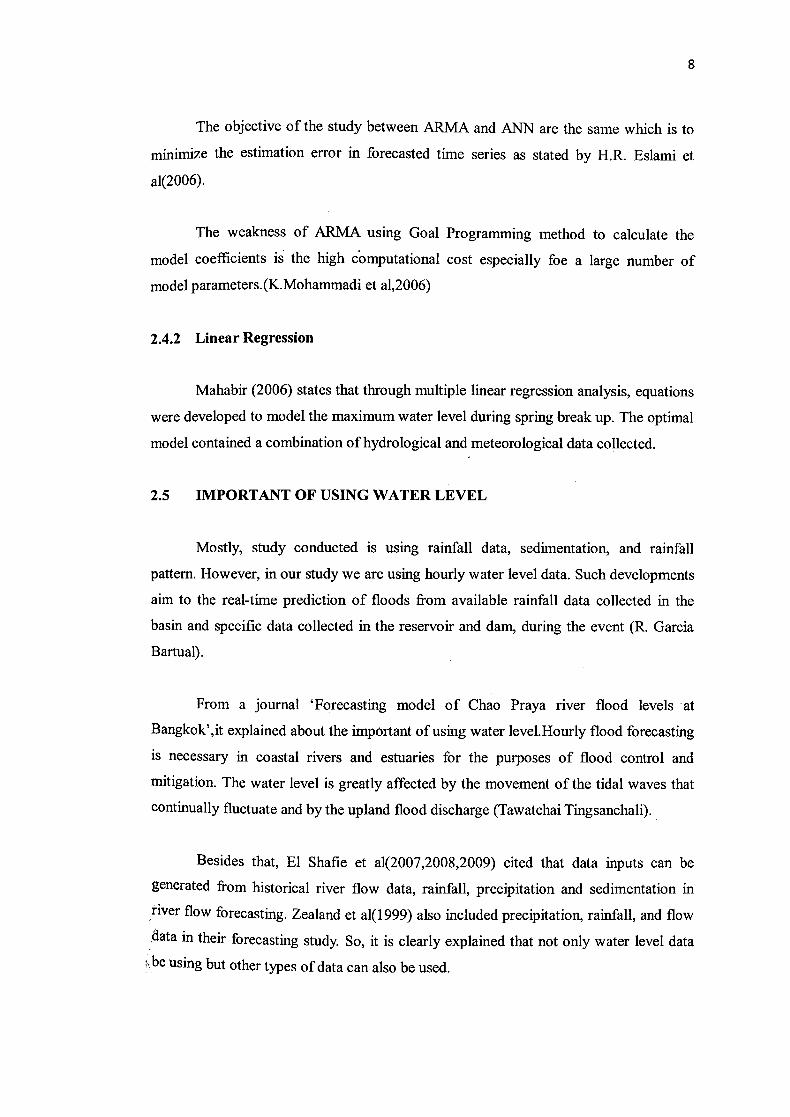
2.4.2 Linear Regression
Mahabir (2006) states that through multiple linear regression analysis, equations
were developed to model the maximum water level during spring break up. The optimal
model contained a combination of hydrological and meteorological data collected.
2.5 IMPORTANT OF USING WATER LEVEL
Mostly, study conducted is using rainfall data, sedimentation, and rainfall
pattern. However, in our study we are using hourly water level data. Such developments
aim to the real-time prediction of floods from available rainfall data collected in the
basin and specific data collected in the reservoir and dam, during the event (R. Garcia
Bartual).
From a journal 'Forecasting model of Chao Praya river flood levels at
Bangkok',it explained about the important of using water level.Hourly flood forecasting
is necessary in coastal rivers and estuaries for the purposes of flood control and
mitigation. The water level is greatly affected by the movement of the tidal waves that
continually fluctuate and by the upland flood discharge (Tawatchai Tingsanchali).
Besides that, El Shafie et al(2007,2008,2009) cited that data inputs can be
generated from historical river flow data, rainfall, precipitation and sedimentation in
river flow forecasting. Zealand et al(1 999) also included precipitation, rainfall, and flow
data in their forecasting study. So, it is clearly explained that not only water level data
be using but other types of data can also be used.

CHAPTER 3
RESEARCH METHODOLOGY
3.1 INTRODUCTION
Type of method used in this study is modelling. This chapter will clearly
explained about the method use in this study.The modelling details is describe in next
section. Next , this chapter will represent on how the data are collected and a flowchart
and Gantt Chart is shown as a tentative of the method used in this study.
3.2 MODELLING DETAILS
Artificial Neural Network will be used to forecast water level at Sungai
Lembing. The performance of ANN data training and validation will be determine using
statistical index called Nash-Sutcliffe efficiency coefficient. Correlation Coefficient(R2)
and Root Mean Square Error (RMSE) will also be used to measure the accuracy of the
data performance. Multilayer Perceptron of ANN will be used to adjust the connection
weight. BA51C256 software is used to run ANN.
3.2.1 Artificial Neural Network
There have been many recent papers and contributions proving the ability and
potentials of artificial neural networks (ANN) modelling approaches in the field of
rainfall-runoff modelling and time series forecasting, both rainfall and runoff series
(Lachtermacher, G. and Fuller, J. D.,1994; Boogard et a!, 1998; Zealand et a!, 1999;
Luck et al,2000; Coulibaly et a!, 2000; Toth et a!, 2000; DeoDeo et al, 2000).

10
The ANN is a non-linear mathematical computing model that can solve
arbitrarily complex non-linear problems such as time series data forecasting. Type of
Arificial Neural Network used is Multilayer Perceptron(MLP) Multilayer
perceptron(MLP) is used to adjust the connection weight. MLP consists of three layer
which are input, hidden and output layer. There are only one input and output layer but
more than one in hidden layer. Each layer contains neuron. The neuron is connected to
each other. In input layer, it can contains numbers of neuron as it is by the data input
study from user selection. However, in output layer, there must be only one neuron in
order to gain output. Hidden layer is up to user selection. In the input layer, an
additional dummy neuron known as bias neuron is to be found. Bias neuron act as one
of the competitor in the network.
The activation function is used to compute the incoming value and produce the
value in output layer. So, the actual computational process may occur. Input layer
applied linear transfer function. But in hidden and output layer, a sigmoid function is
commonly used.
After the activation transfer function, the connection weight can be determined
by data training. The process of the weight adjustment starts from the output layer and
proceeds backward toward the input layer. The process of feed-forward and back-
propagation continues until the performance target is achieved. Once the data training
process is completed, the weights of the c values are determined. Then a single feed
forward computation is employed. The results are then assessed by applying
performance measures to the observed data versus the model output values. Figure 3.1
shows the Multilayer Perceptron with three layers as stated before.

11
Irut date Inniil Iavi' Hidden lag Outut lag Mut
Figure 3.1 : Multilayer Perceptron
3.3 BASIC 256
BASIC 256 is a simple version of BASIC. In BASIC 256, edit window, text
output, and graphic output are shown in the same screen. In this study, BASIC is an
acronym for Beginner's All-purposed Symbolic Instruction Code which design to ease
use for general purpose and high level programming. The acronym BASIC comes from
the name of an unpublished paper by Thomas Kurtz. BASIC 256 is used to run ANN in
arrangement of data. BASIC 256 has their own typical keyword and command that need
to be study first in order to obtain our results in text output. BASIC 256 will run the
arithmetic expressions such as multiplication, addition, division and subtraction.
Besides that, BASIC 256 allows matrix manipulations, plotting of functions and data,
implementation of algorithms, creation of user interfaces, and interfacing with programs
written in other languages. BASIC 256 is widely used for beginner who interested in
learning programming.
In this study, BASIC 256 software is used to run ANN. Include the suitable
coding in order to gain the output. In this study, all data are arranged using BASIC 256.
The advantages are to save time and easy calculation can be made using BASIC 256.
Besides that, to fmd a suitable coding to be include in the text output is not easy.
Example of coding used in this study are print, open, if, close, write line, string, read,
and others. A few symbols also be used to show what we want to make as outnut.

12
3.4 DATA COLLECTION
Data that will be used in our study is daily water level data. Daily water level
data will be obtained from Department of Irrigation and Drainage(DID).A formal letter
is needed in order to make sure they give a cooperation. Data from year 2003 to 2009
are used for forecasting result. The data are then will be divided due to missing daily
data in the historical records. The training and validation data were divided into smaller
groups of continuous datasets. In this study, one third is for training data and two thirds
for validation data.
3.5 FLOWCHART
Figure 3.2 shows the flow chart are used to clearly show the step in this study.
The flow shows the steps from data collection until finding out performance measures.

Data collected from DID—Logger data/Hourly data/National data
Arrange data in BASIC 256 software
I Training process in finding parameter I
I Validation process
I Performance measure I
End
Figure 3.2 : Work flow in this study
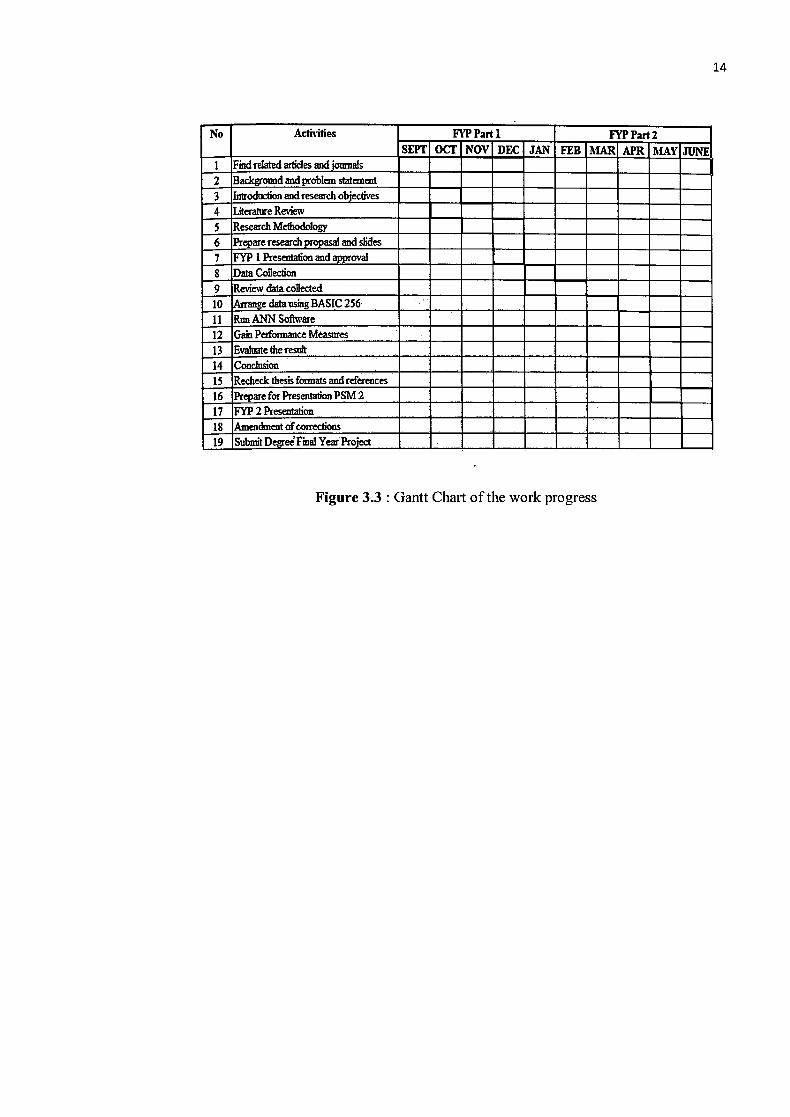
3.6 GANTT CHART
Figure 3.3 shows the Gantt chart which is the progress of the work in order to finish this
study.
13
14
Figure 3.3 : Gantt Chart of the work progress

CHAPTER 4
DATA ANALYSIS
4.1 INTRODUCTION
The procedure of forecasting water level using Multilayer Perceptron(MLP) was
described in the previous chapter. ANN model tested in this study is 2,3,4,5,6,and 7
input data values were investigated. The number of neurons in the hidden layer was
equal to the number of input neurons. Data analysis had be done in two stages. First
stages is to determine the best number of data input that produce the best performance.
Second stage is to use best data input with increased number of iteration. The data
training and data validation results for the six ANN architectures, with 2,3,4,5,6,7 input,
seven data sets, and with 1000,2000 and 5000 epochs had been done. The architecture
of the six network models is shown in Table 4.1
4.2 PERFORMANCE MEASURES
There are a few performance measures that are used to evaluate the results in
this study. Three of these come from common statistical indices that evaluate the
goodness of fit between two data series. These are the Nash-Sutcliffe efficiency
coefficient (NSC), the correlation coefficient (R2),and root mean square error
(RMSE).me equations for these are shown below inEq. (4.1), (4.2), and (4.3)
NSC = 1 -- (O—F)2(4.1)