a study on improved algorithm for mimo antenna measurement
DESCRIPTION
Master Thesis. A Study on Improved Algorithm for MIMO Antenna Measurement. Thanh-Ngon Tran Supervisor: Professor Kyeong-Sik Min. SRANT Laboratory, Korea Maritime University November, 2006. Contents. Chapter 1: Introduction - PowerPoint PPT PresentationTRANSCRIPT

SRANT Lab., Korea Maritime University
A Study on Improved Algorithm for MIMO Antenna Measurement
Thanh-Ngon Tran
Supervisor: Professor Kyeong-Sik Min
SRANT Laboratory, Korea Maritime University
November, 2006
Master Thesis
2SRANT Lab., Korea Maritime University
Contents
Chapter 1: Introduction Chapter 2: Algorithm of antenna measurement
software with noise reduction Chapter 3: Measurement of key parameters of
MIMO antenna Chapter 4: Design of multi-band MIMO test-bed Chapter 5: Conclusion

3SRANT Lab., Korea Maritime University
Introduction (1)
Cordless phone
Voice
Wireless LANHigh Data rate
Home/office systems
Multi-media
Channel capacity increase
Voice/DataMobile phone
Single Antenna
Single Antenna
Single/Multiple Antenna
Multiple Antenna
Antenna development vs. Antenna measurement system
Chapter 1

4SRANT Lab., Korea Maritime University
Introduction (2) – The goal and limitation
The goal: Develop measurement software & system for MIMO antenna & channel measurement.
Apply the improved mea.
software for MIMO ant. mea.
Improve single antenna measurement
software
Design 22 MIMO testbed
for MIMO measurement
Future works
Diversities, Correlation,
Mutual Coupling
Gain, 2D/3D pattern,
Polarization, w/ Filter algorithm
Direct up/down converters,
Software structure and algorithm
MIMO antenna and
channel characterizat
ion
(1) (2) (3) (…)Steps:
Chapter 1

5SRANT Lab., Korea Maritime University
Single antenna measurement system
EL-AZ Positioner
Positioner Controller
Microwave Receiver
CW Signal Generator
Directional Coupler
Frequency Converter
Polarization Positioner
Computer
Linear Polarization
Antenna
Antenna Under Test
GPIB GPIBMicrowave Amplifier
Chapter 2
6SRANT Lab., Korea Maritime University
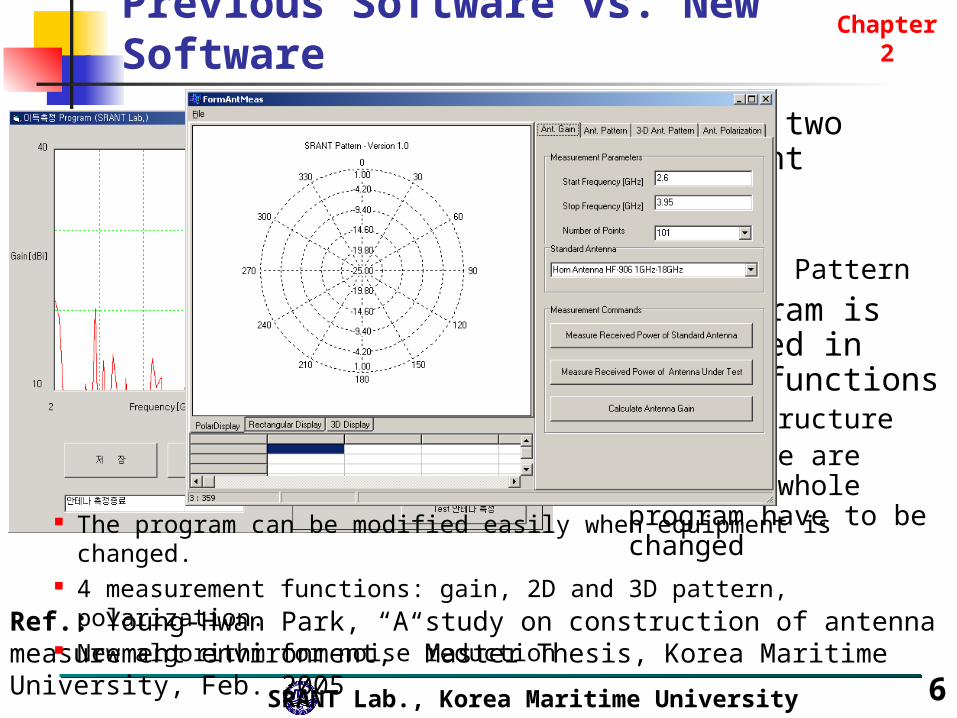
Previous Software vs. New Software
There are two independent programs Gain Radiation Pattern
This program is not divided in specific functions Simple structure When there are
changes, whole program have to be changed
Chapter 2
Ref.: Young-Hwan Park, “A study on construction of antenna measurement environment,” Master Thesis, Korea Maritime University, Feb. 2005
The program can be modified easily when equipment is changed. 4 measurement functions: gain, 2D and 3D pattern, polarization. New algorithm for noise reduction
7SRANT Lab., Korea Maritime University
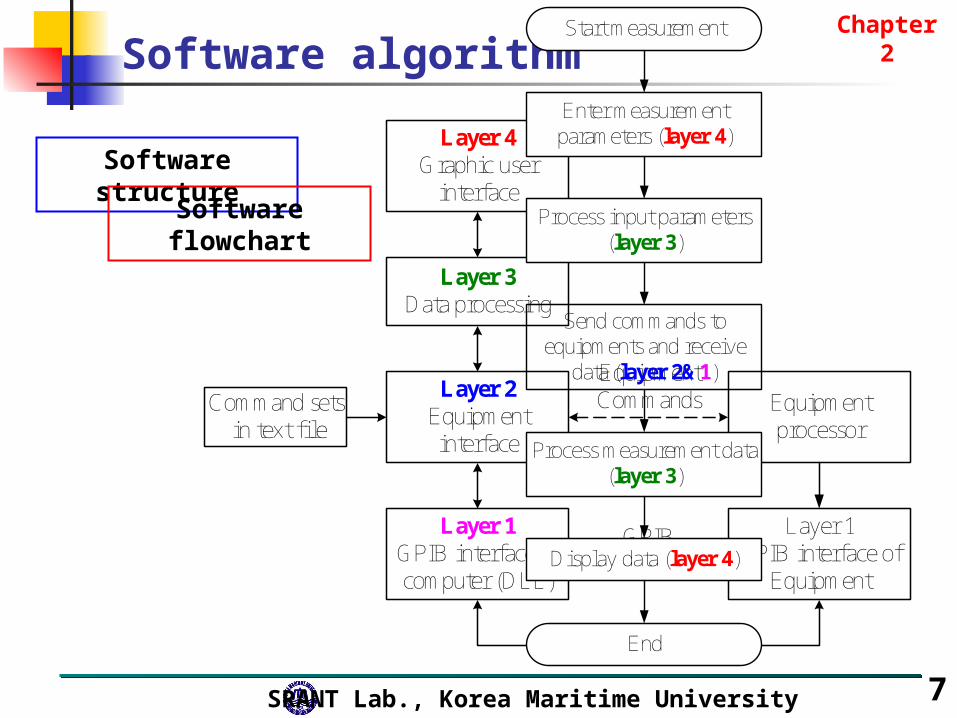
Software algorithmChapter 2
Layer 4Graphic user
interface
Layer 3Data processing
Layer 2Equipment interface
Layer 1GPIB interface of computer (DLL)
Layer 1GPIB interface of
Equipment
Equipment processor
GPIB
Equipment CommandsCommand sets
in text file
Software structure
Enter measurement parameters (layer 4)
Start measurement
Process input parameters (layer 3)
Send commands to equipments and receive
data (layer 2&1)
Process measurement data (layer 3)
Display data (layer 4)
End
Software flowchart

8SRANT Lab., Korea Maritime University
TX-RX Antenna in anechoic chamber
TX Ant
AUT
4m
Chapter 2
For experimental measurement:
TX Ant.: Horn antenna, 1-18 GHz
RX Ant.: Helical antenna, ~ 3 GHz
Distance: ~4 meter

9SRANT Lab., Korea Maritime University
Measurement Results with filter algorithm
Original Signal (pattern)
Measured by conventional measurement system
Filtered Signal (pattern)
Measured and processed real-time by noise reduction algorithm
Chapter 2
-100-95-90-85-80-75-70-65-60-55-50
0 50 100 150 200 250 300 350Angle (degree)
Pow
er L
evel
(dB
)
Time 1
Time 2
-100-95-90-85-80-75-70-65-60-55-50
0 50 100 150 200 250 300 350Angle (degree)
Pow
er L
evel
(dB
)
Signal processing algorithm

10SRANT Lab., Korea Maritime University
Noise Reduction Algorithm Combination of time and space mean filter Noise in measurement system is Additive White
Gaussian Noise (AWGN) Mean filter is suitable for removing AWGN
d[j-1]d[j-W/2]
d[j] d[j+1]d[j+W/2]
Angle[degree]
Power[dB]
Space Mean FilterTime Mean Filter
2
2
][1
][
Wi
Wij
jdW
iD
N
jjtid
NiD
1
],[1
][
d[i-1]d[i, tj]
d[i+1]
Angle[degree]
Power[dB]
d[i, tj+1]
Time[ms]
d[i, tj+1]
d[i, tj+N]
],[],[],[ jjj tintiDtid
Measured Power
Expected Power
Noise
Chapter 2

11SRANT Lab., Korea Maritime University
MIMO antenna measurement
Metal box, PDA-size with 4 IFA antennas(PDA: Personal Data Assistant)
(a) Front view (b) Inside view
Measure and evaluate: Diversities: pattern, polarization. Pattern correlation. Mutual coupling.
Chapter 3
#1
#2#3
#4
75 mm
110
mm
7 m
m
z
y
x
This EUT is chosen because it is: One of MIMO appli-cation. Elements have differ-ent polarization, pattern, gain, coupling …

12SRANT Lab., Korea Maritime University
Pattern (gain) diversityChapter 3
-30
-25
-20
-15
-10
-5
0
5
-30
-25
-20
-15
-10
-5
0
5
0
30
60
90
120
150
180
210
240
270
300
330
Element #1Element #2 Element #3Element #4
-30
-25
-20
-15
-10
-5
0
5
-30
-25
-20
-15
-10
-5
0
5
0
30
60
90
120
150
180
210
240
270
300
330
Element #1Element #2 Element #3Element #4
-30
-25
-20
-15
-10
-5
0
5
-30
-25
-20
-15
-10
-5
0
5
0
30
60
90
120
150
180
210
240
270
300
330
Element #1Element #2 Element #3Element #4
Gain of antenna elements on x-y plane
Gain of antenna elements on x-z plane
Gain of antenna elements on y-z plane
x
yz
x
z
y
#4 is the best choice#3 is the best choice #1 is the best choice
#2 is thebest choice
Maximum gain of EUT antenna elements on three planes is about 6 dBi (y-z plane). In any direction, there is at least one element with high gain. Difference between the
highest and lowest gain is higher than 3 dB at any direction. Conclusion: This difference of gain pattern shows good gain diversity.

13SRANT Lab., Korea Maritime University
-40
-35
-30
-25
-20
-15
-10
-40
-35
-30
-25
-20
-15
-10
0
30
60
90
120
150
180
210
240
270
300
330
E-theta E-phi
-40
-35
-30
-25
-20
-15
-10
-40
-35
-30
-25
-20
-15
-10
0
30
60
90
120
150
180
210
240
270
300
330
E-theta E-phi
-40
-35
-30
-25
-20
-15
-10
-40
-35
-30
-25
-20
-15
-10
0
30
60
90
120
150
180
210
240
270
300
330
E-theta E-phi
-40
-35
-30
-25
-20
-15
-10
-40
-35
-30
-25
-20
-15
-10
0
30
60
90
120
150
180
210
240
270
300
330
E-theta E-phi
Polarization diversityChapter 3
Element #1 and #4: linear horizontal polarization. Element #2 and #3: linear vertical polarization. Conclusion: Good the polarization diversity.
Element #1, x-z planeXPD = 22dB @ 178o
Element #4, x-z planeXPD = 20dB @ 183o
Element #2, x-y planeXPD = 20dB @ 89o
Element #3, x-y planeXPD = 20dB @ 268o
dBcrossdBcocross
co EEE
EXPD log20 Eco and Ecross are
co-polarization and cross-polarization components of E-field, respectively.
x
yz
x x
y z
x

14SRANT Lab., Korea Maritime University
Pattern Correlation
Elements
x-y plane x-z plane y-z plane x-y plane x-z plane y-z plane
#1 and #2 0.103 0.426 0.022 0.331 0.222 0.175
#1 and #3 0.152 0.481 0.260 0.071 0.131 0.269
#1 and #4 0.100 0.616 0.352 0.382 0.607 0.073
#2 and #3 0.486 0.822 0.198 0.107 0.847 0.027
#2 and #4 0.196 0.616 0.085 0.186 0.118 0.244
#3 and #4 0.147 0.543 0.270 0.110 0.343 0.139
E E
Chapter 3
359
0
359
0
222
211
359
02211
)][()][(
)][)(][(
i i
ic
EiEEiE
EiEEiE
-40
-35
-30
-25
-20
-15
-10
-40
-35
-30
-25
-20
-15
-10
0
30
60
90
120
150
180
210
240
270
300
330
E-theta E-phi
-40
-35
-30
-25
-20
-15
-10
-40
-35
-30
-25
-20
-15
-10
0
30
60
90
120
150
180
210
240
270
300
330
E-theta E-phi
x
y
x
y
Element #2, x-y plane Element #3, x-y plane

15SRANT Lab., Korea Maritime University
Mutual Coupling Measurement
Frequency (GHz)
5.0 5.1 5.2 5.3 5.4 5.5
Mu
tual
cou
pli
ng
(dB
)
-40
-35
-30
-25
-20
-15
-10C12
C13
C14
C23
Chapter 3
MW Receiver & Freq. converter
EUT
16SRANT Lab., Korea Maritime University
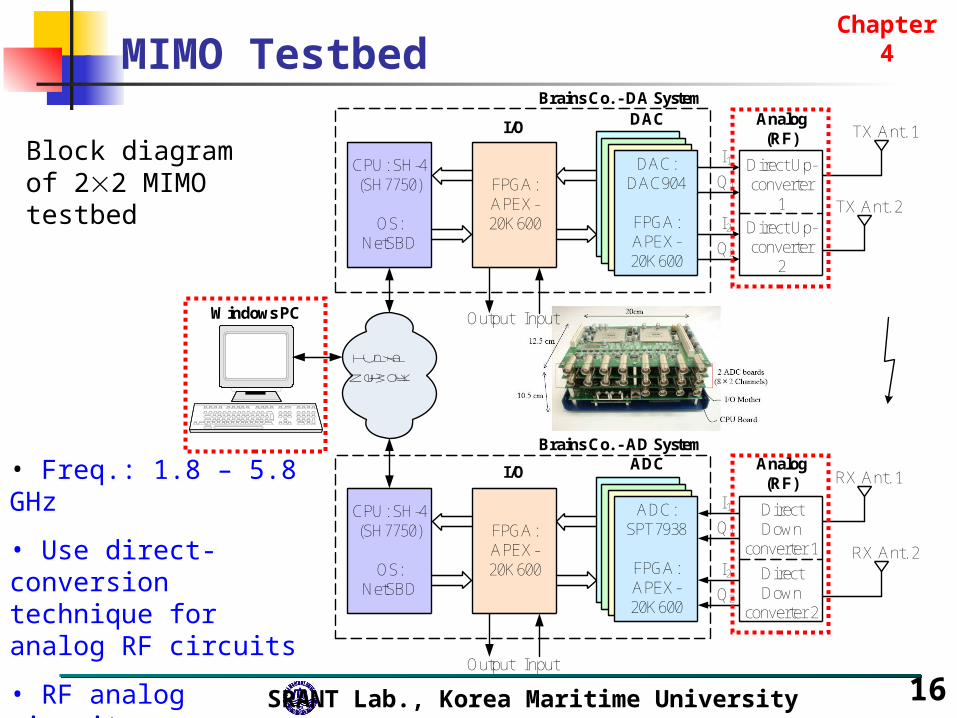
MIMO TestbedChapter 4
Block diagram of 22 MIMO testbed FPGA:
APEX-20K600
Output
CPU: SH-4 (SH7750)
OS: NetSBD
Analog (RF)
DACI/O
DAC: DAC904
FPGA: APEX-20K600
Input
Direct Up-converter
1
Direct Up-converter
2
TX Ant. 1
TX Ant. 2
I1
I2
Q1
Q2
T C P / I P
N e t w o r k
FPGA: APEX-20K600
Output
CPU: SH-4 (SH7750)
OS: NetSBD
Analog (RF)
ADCI/O
ADC: SPT7938
FPGA: APEX-20K600
Input
Direct Down
converter 1
Direct Down
converter 2
RX Ant. 1
RX Ant. 2
I1
I2
Q1
Q2
Windows PC
Brains Co. - DA System
Brains Co. - AD System
• Freq.: 1.8 – 5.8 GHz
• Use direct-conversion technique for analog RF circuits
• RF analog circuits are coupled with DSP algorithm

17SRANT Lab., Korea Maritime University
RX - Design of Down-converter
FPGA: APEX-20K600
Output
CPU: SH-4 (SH7750)
OS: NetSBD
Analog (RF)
DACI/O
DAC: DAC904
FPGA: APEX-20K600
Input
Direct Up-converter
1
Direct Up-converter
2
TX Ant. 1
TX Ant. 2
I1
I2
Q1
Q2
T C P / I P
N e t w o r k
FPGA: APEX-20K600
Output
CPU: SH-4 (SH7750)
OS: NetSBD
Analog (RF)
ADCI/O
ADC: SPT7938
FPGA: APEX-20K600
Input
Direct Down
converter 1
Direct Down
converter 2
RX Ant. 1
RX Ant. 2
I1
I2
Q1
Q2
Windows PC
Brains Co. - DA System
Brains Co. - AD System
Design the wide bandwidth direct down-conversion receivers by:
Combine the analog front-end circuit with base-band DSP
Freq.: 1.8 – 5.8 GHz
Analog front-end
Baseband DSP
Bandwidth is Wider
RF LNA
I
Q
Quadrature down-converter
90° LO
A
B
LPF
LPF
A/D
A/D
DSP
xLO,I (t) = cos(2p fC t)
xLO,Q (t) = – gsin(2p fC t + )
xI (t)
xQ (t)
Analog front end circuit is simpler
LORF
Q
12
3
Phase shifterMixer
Baseband Amp.
Power div. I
Chapter 4

18SRANT Lab., Korea Maritime University
0.00
0.20
0.40
0.60
0.80
1.00
1.20
1.40
1.60
1.80
2.00
1.6 2.0 2.4 2.8 3.2 3.6 4.0 4.4 4.8 5.2 5.6 6.0
Frequency (GHz)
Am
plit
ude
Imba
lanc
e
Simulation
Measurement
5% amplitude imbalance
Imbalance parameters
-90.00
-70.00
-50.00
-30.00
-10.00
10.00
30.00
50.00
70.00
90.00
1.6 2.0 2.4 2.8 3.2 3.6 4.0 4.4 4.8 5.2 5.6 6.0
Frequency (GHz)
Pha
se I
mba
lanc
e (d
egre
e) Simulation
Measurement
Conventional bandwidth: 0.25 GHz
(5o imbalance)
Chapter 4

19SRANT Lab., Korea Maritime University
RX - I/Q signalsChapter 4
Lissajuos graph of the I and Q signal at 1.8 GHz
V_Q (Volts)
Measured sig.Processed sig.Reference sig.
V_I
(V
olts
)
Frequency: 1.8 GHz
Amp. imbalance: 0.898
Phase imbalance: -75.74 degree
Lissajuos graph of the I and Q signal at 4.0 GHz
V_Q (Volts)
Measured sig.Processed sig.Reference sig.
V_I
(V
olts
)
Frequency: 4.0 GHz
Amp. imbalance: 1.118
Phase imbalance: -13.25 degree
Lissajuos graph of the I and Q signal at 5.6 GHz
V_Q (Volts)
Measured sig.Processed sig.Reference sig.
V_I
(V
olts
)
Frequency: 5.6 GHz
Amp. imbalance: 1.125
Phase imbalance: 44.50 degree
I
Q
A/D
A/D
xI (t)
xQ (t)+
cos
1
g
cos
sin
DSP
'Iz
'Qz
20SRANT Lab., Korea Maritime University
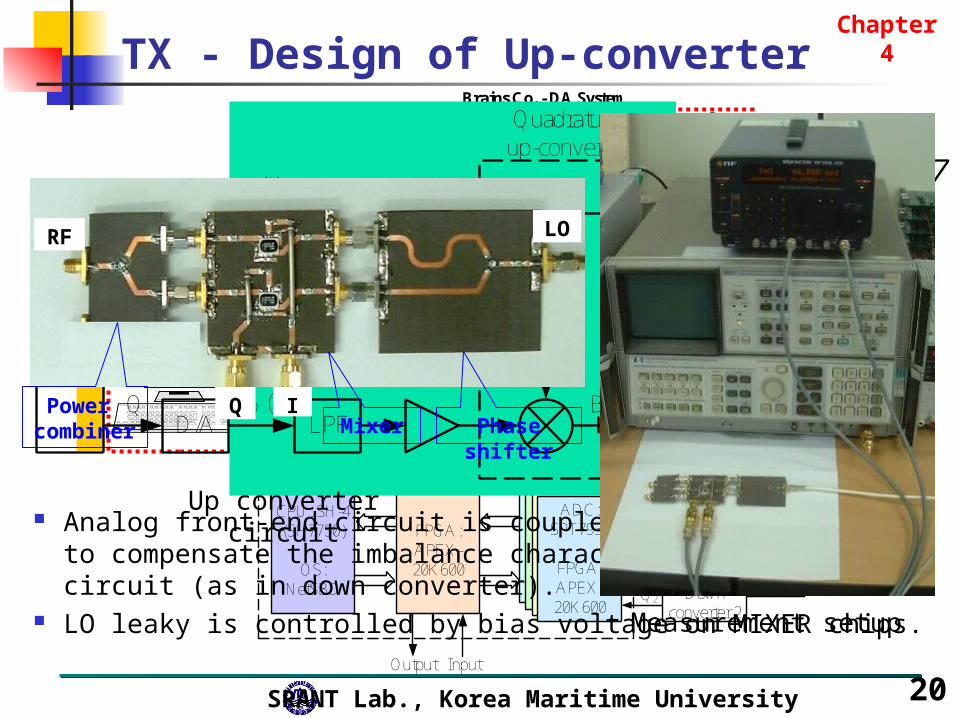
TX - Design of Up-converter
FPGA: APEX-20K600
Output
CPU: SH-4 (SH7750)
OS: NetSBD
Analog (RF)
DACI/O
DAC: DAC904
FPGA: APEX-20K600
Input
Direct Up-converter
1
Direct Up-converter
2
TX Ant. 1
TX Ant. 2
I1
I2
Q1
Q2
T C P / I P
N e t w o r k
FPGA: APEX-20K600
Output
CPU: SH-4 (SH7750)
OS: NetSBD
Analog (RF)
ADCI/O
ADC: SPT7938
FPGA: APEX-20K600
Input
Direct Down
converter 1
Direct Down
converter 2
RX Ant. 1
RX Ant. 2
I1
I2
Q1
Q2
Windows PC
Brains Co. - DA System
Brains Co. - AD System
RF AMP
I
Q
Quadrature up-converter
90°LO
A
B
LPF
LPF
D/A
D/A
DSP
xLO,I (t) = cos(2p fLO t)
xLO,Q (t) = – gsin(2p fLO t + )
xI (t)
xQ (t)
LPF
Analog front-end circuit is coupled with DSP algorithm to compensate the imbalance characteristics of analog circuit (as in down converter).
LO leaky is controlled by bias voltage on MIXER chips.Measurement setup
Up converter circuit
LORF
QPhase shifterMixer
Power combiner
I
Chapter 4
21SRANT Lab., Korea Maritime University
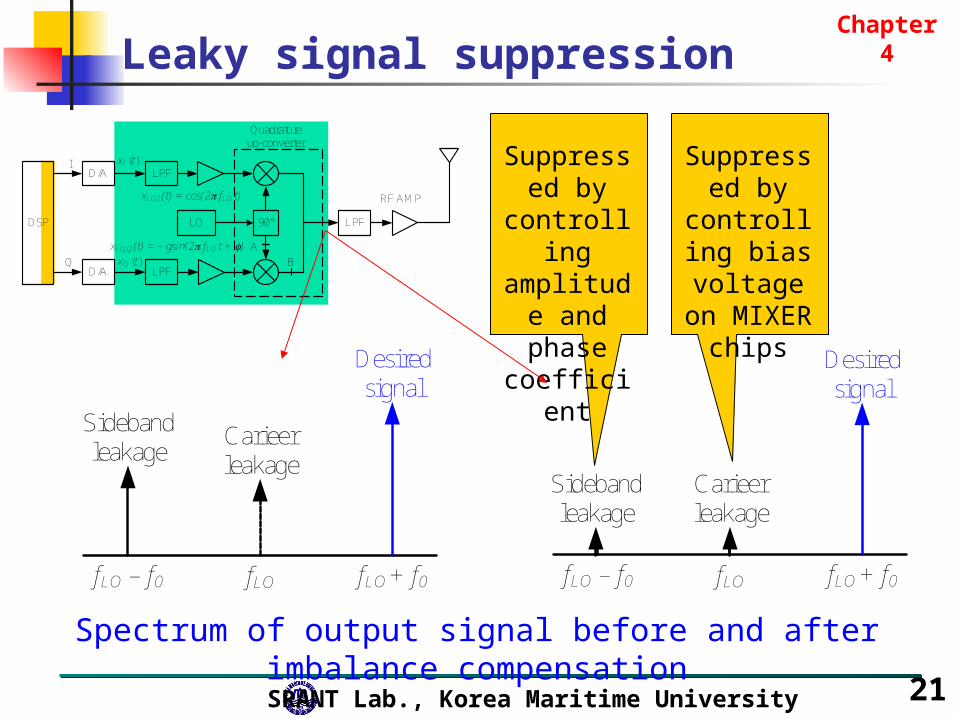
Leaky signal suppression
RF AMP
I
Q
Quadrature up-converter
90°LO
A
B
LPF
LPF
D/A
D/A
DSP
xLO,I (t) = cos(2p fLO t)
xLO,Q (t) = – gsin(2p fLO t + )
xI (t)
xQ (t)
LPF
fLO + f0fLO – f0 fLO fLO + f0fLO – f0 fLO
Desired signal
Desired signal
Sideband leakage
Carieer leakage
Carieer leakage
Sideband leakage
Spectrum of output signal before and after imbalance compensation
Suppressed by
controlling amplitude and phase coefficient
Suppressed by
controlling bias voltage on MIXER
chips
Chapter 4
22SRANT Lab., Korea Maritime University
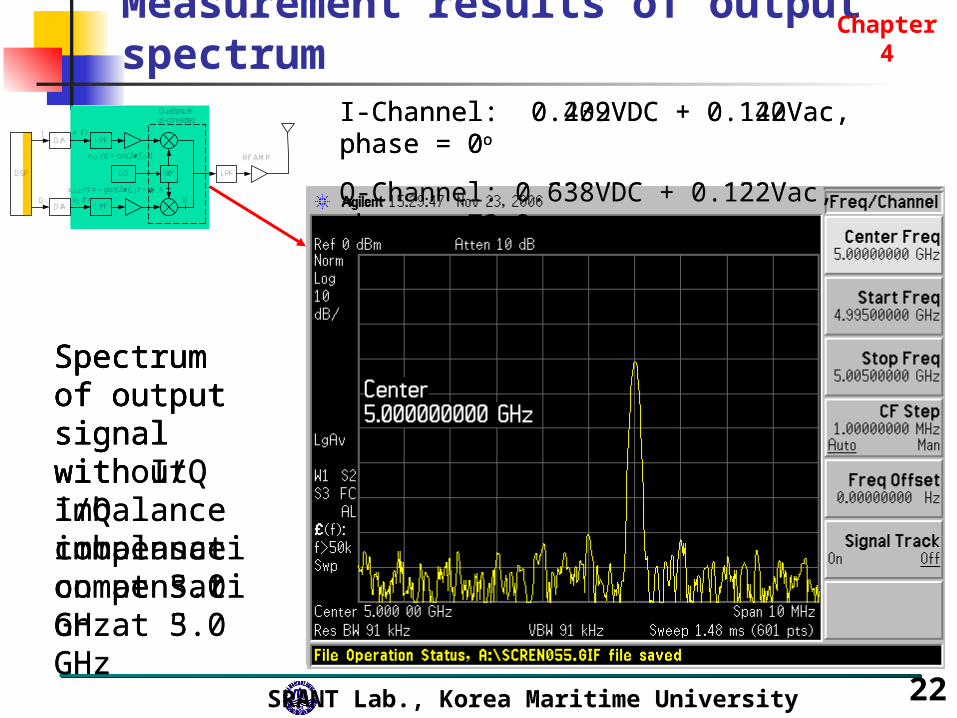
Measurement results of output spectrum
RF AMP
I
Q
Quadrature up-converter
90°LO
A
B
LPF
LPF
D/A
D/A
DSP
xLO,I (t) = cos(2p fLO t)
xLO,Q (t) = – gsin(2p fLO t + )
xI (t)
xQ (t)
LPF
Spectrum of output signal without I/Q imbalance compensation at 3.0 GHz
Spectrum of output signal with I/Q imbalance compensation at 3.0 GHz
I-Channel: 0.402VDC + 0.142Vac, phase = 0o
Q-Channel: 0.308VDC + 0.150Vac, phase = 112.3o
Spectrum of output signal without I/Q imbalance compensation at 5.0 GHz
Spectrum of output signal with I/Q imbalance compensation at 5.0 GHz
I-Channel: 0.239VDC + 0.120Vac, phase = 0o
Q-Channel: 0.638VDC + 0.122Vac, phase = 73.9o
Chapter 4
23SRANT Lab., Korea Maritime University
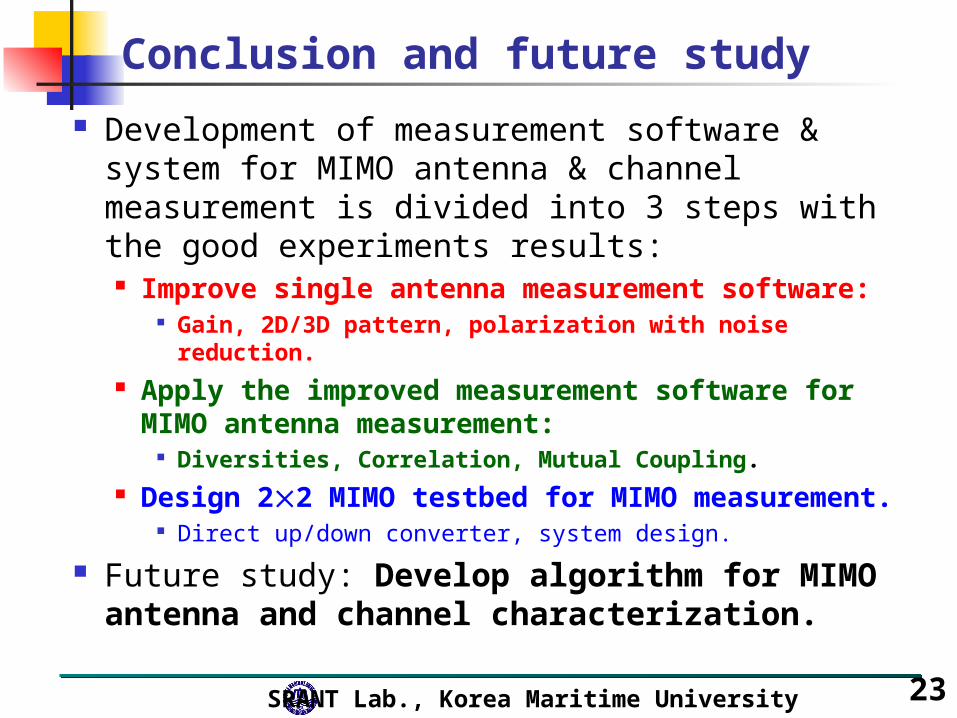
Conclusion and future study
Development of measurement software & system for MIMO antenna & channel measurement is divided into 3 steps with the good experiments results: Improve single antenna measurement software:
Gain, 2D/3D pattern, polarization with noise reduction. Apply the improved measurement software for MIMO
antenna measurement: Diversities, Correlation, Mutual Coupling.
Design 22 MIMO testbed for MIMO measurement. Direct up/down converter, system design.
Future study: Develop algorithm for MIMO antenna and channel characterization.
24SRANT Lab., Korea Maritime University
THANK YOU FOR YOUR ATTENTION!