a study on natural user interface usability22661980/22661980.pdf1. nui natural user interface 2. ui...
TRANSCRIPT

KAUNAS UNIVERSITY OF TECHNOLOGY
FACULTY OF INFORMATICS
DEPARTMENT OF MULTIMEDIA ENGINEERING
Melkote Shivashankar Sandesh
A STUDY ON NATURAL USER INTERFACE USABILITY
Master Thesis
Supervisor:
Doc. Dr. T.Blažauskas
KAUNAS, 2017

2
KAUNAS UNIVERSITY OF TECHNOLOGY
FACULTY OF INFORMATICS
DEPARTMENT OF MULTIMEDIA ENGINEERING
Melkote Shivashankar Sandesh
A STUDY ON NATURAL USER INTERFACE USABILITY
Master Thesis
Supervisor Signature: ___________________
Supervisor Name: Doc. Dr. T.Blažauskas
Reviewer Signature: ___________________
Reviewer Name: Lect. dr. Dominykas Barisas
Research Conducted by: Melkote Shivashankar Sandesh
Signature: ___________________
KAUNAS, 2017

3
KAUNAS UNIVERSITY OF TECHNOLOGY
Faculty of Informatics
(Faculty) Melkote Shivashankar Sandesh
(Student's name, surname)
621I10003 Informatics (Title and code of study programme)
DECLARATION OF ACADEMIC HONESTY
2017 -05-30. Kaunas
I confirm that a final project by me, Melkote Shivashankar Sandesh, on the subject "A study on Natural User Interface Usability" is written completely by myself; all provided data and research results are correct and obtained honestly. None of the parts of this thesis have been plagiarized from any printed or Internet sources, all direct and indirect quotations from other resources are indicated in literature references. No monetary amounts not provided for by law have been paid to anyone for this thesis. I understand that in case of a resurfaced fact of dishonesty penalties will be applied to me according to the procedure effective at Kaunas University of Technology.
(name and surname filled in by hand) (signature)

4
SUMMARY
The NUI devices created an extraordinary new possibility for user interface designers and developers
to explore. NUI devices like Kinect and “Leap Motion” provide users an interaction where they can interact
using their hands and bodies. A typical example for NUI is an Xbox 360 game that uses Kinect as its input
method. The interface in PC version is more efficient than its Xbox 360 counterpart. This made us to
research new ways and methods to keep them in terms of improved usability. Since there is no haptic feed
back NUI takes us step backwards in terms of usability. The existing theory for NUI is very old but
advancement in the technology has made it to be reality for users and customers.
The main drawback of NUI is we are interacting with the system with our hand and body, using them
for the interaction may be slow and error-prone sometimes. Our goal is to find out method to speed up with
the interaction and keep it easy, accurate and nearly error-free.
The main focus of this research is to analyse the existing methods and technologies for Leap Motion
device and design and develop prototypes with different user interface option and conduct experiments
with users and observe the user interaction behaviour with respect to the developed system.
The data from the experiments are evaluated and compared the evaluated data to all the exercise that
are conducted. By comparison, the best user interface method is noted and well described. This descriptions
will help the developers and designers to follow this method and it could save them lot of time and may be
less errors while developing.

5
TABLE OF CONTENTS
SUMMARY.........................................................................................................................................3
1 Introduction...............................................................................................................................101.1 Purposeofthedocument.................................................................................................................101.2 Aim..................................................................................................................................................101.3 WorkObjective................................................................................................................................101.4 ScientificNovelty.............................................................................................................................10
2 ANALYSIS ON NATURAL USER INTERFACE INTERACTION........................................112.1 Naturaluserinterface......................................................................................................................11
2.1.1 Cursor-basedorcursor-lessinterfaces................................................................................................122.2 KinectBasedusercontrols...............................................................................................................12
2.2.1 TileButtons..........................................................................................................................................132.2.2 CircleButtons......................................................................................................................................162.2.3 PanningandScrolling..........................................................................................................................162.2.4 ScrollViewer........................................................................................................................................182.2.5 Zooming(Z-AxisPanning)....................................................................................................................192.2.6 TextEntry.............................................................................................................................................21
2.3 “LeapMotion”userinteraction........................................................................................................222.3.1 Button..................................................................................................................................................222.3.2 Slider....................................................................................................................................................232.3.3 Scroll....................................................................................................................................................232.3.4 ArmHUD..............................................................................................................................................232.3.5 BrowsingInternetusing“LeapMotion”..............................................................................................24
2.4 ConclusionofAnalysis......................................................................................................................26
3 SYSTEM DESIGN....................................................................................................................273.1 SystemFunctionality........................................................................................................................27
3.1.1 Functionalrequirements.....................................................................................................................273.1.2 Non-FunctionalRequirements.............................................................................................................283.1.3 DesignConstraints...............................................................................................................................283.1.4 ProcessModel.....................................................................................................................................28
3.2 “LeapMotion”systemcomponents.................................................................................................293.2.1 FSMApproach.....................................................................................................................................313.2.2 DesigningFSMsystem.........................................................................................................................313.2.3 SystemDeployment.............................................................................................................................33
3.3 Implementationofthesystem.........................................................................................................353.3.1 GUIComponents:................................................................................................................................353.3.2 GUIprototypes:...................................................................................................................................37
4 “Leap Motion” UI usability study and experiments..................................................................424.1 Experimentsetup.............................................................................................................................424.2 Participants......................................................................................................................................424.3 UsabilityExercises............................................................................................................................43
4.3.1 Exercise1:Calculatorwithbigsizedbuttonwithnodelayandnoattractors.....................................434.3.2 Exercise2:Calculatorwithmediumsizedbuttonwith3000m/sdelayandnoattractors.................444.3.3 Exercise3:Calculatorwithsmallsizedbuttonwith3000m/sdelayandbuttonattractors...............444.3.4 Exercise4:Paintapplicationwithrestrictedframe.............................................................................454.3.5 Exercise5:Paintapplicationwithmulti-fingeroperations..................................................................454.3.6 Exercise6:Paintapplicationwithstickycursor...................................................................................45
5 Evaluation and Results..............................................................................................................475.1 Performanceoftheuserinterfacewithrespectuserinteraction......................................................48
5.1.1 Observations........................................................................................................................................49

6
5.1.2 Accuracyevaluation.............................................................................................................................505.1.3 Dataevaluation...................................................................................................................................525.1.4 SystemUsabilityScale(SUS)................................................................................................................53
6 Conclusion.................................................................................................................................58
7 Appendix...................................................................................................................................607.1 SUSquestionnaireforoverallsystem...............................................................................................607.2 SUSquestionnaireforindividualexercise.........................................................................................60

7
TABLE OF FIGURES
FIGURE1NATURALUSERINTERFACEEVOLUTION...................................................................................................................................11FIGURE2TILEBUTTONSSUGGESTEDBYMICROSOFTKINECTUSERINTERFACEGUIDE[1]................................................................................13FIGURE3HOVERBUTTONANIMATION[2]............................................................................................................................................14FIGURE4CONFIRMHOVERBUTTONWHENTHECURSORISOVERTHEBUTTON[2].........................................................................................14FIGURE5CONFIRMHOVERBUTTONANIMATIONWHENTHECURSORISOVERTHEOKBUTTON[2]...................................................................15FIGURE6CONFIRMBUTTON[2].........................................................................................................................................................15FIGURE7CIRCLEBUTTONSVARIANTS[1].............................................................................................................................................16FIGURE8SCROLLINGUSINGHOVERMETHOD.[1]..................................................................................................................................17FIGURE9SCROLLINGUSINGGRIPPINGMETHOD.[1]...............................................................................................................................18FIGURE10KINECTSCROLLINGVIEW[1]...............................................................................................................................................18FIGURE11TRIGGEREDZOOMMODE[1]..............................................................................................................................................20FIGURE12ZOOMCONTROLUI[1]......................................................................................................................................................20FIGURE13VOICEUSERINTERFACE[1].................................................................................................................................................21FIGURE14PROPORTIONOFCHANGEINTWO-HANDEDZOOM[1].............................................................................................................21FIGURE15Z-AXISZOOM[1]..............................................................................................................................................................21FIGURE16VIRTUALKEYBOARD[1]......................................................................................................................................................22FIGURE17BUTTONSFOR“LEAPMOTION”INTERFACE.[12].....................................................................................................................22FIGURE18SLIDERFOR“LEAPMOTION”.[12]......................................................................................................................................23FIGURE19SLIDERIN“LEAPMOTION”.[12].........................................................................................................................................23FIGURE20ARMHUDIN“LEAPMOTION”.[12]...................................................................................................................................23FIGURE21SPATIALSYSTEMS[12]......................................................................................................................................................24FIGURE22SPATIALCONSISTENCYWITHINTHEBROWSER.[12].................................................................................................................25FIGURE23SPATIALPROPERTYWITHRESPECTTOTIME[12]......................................................................................................................25FIGURE24SPATIALPROPERTYWITHRESPECTTORECENCYANDFREQUENCY[12].........................................................................................26FIGURE25USECASEDIAGRAMFORNUIINTERFACE...............................................................................................................................27FIGURE26PROCESSMODEL..............................................................................................................................................................29FIGURE27SOFTWAREARCHITECTUREOFTHEAPPLICATION......................................................................................................................30FIGURE28BASICEXAMPLEOFFSM....................................................................................................................................................31FIGURE29CLASSDIAGRAMFORFSMEVENTS.......................................................................................................................................31FIGURE30SIMPLIFIEDFSMFORSWIPEGESTURE...................................................................................................................................32FIGURE31DEPLOYMENTMODEL........................................................................................................................................................34FIGURE32BASICWORKFLOWOFTHEDEVELOPEDSYSTEM.......................................................................................................................35FIGURE33(A)CURSORWITHOUTPERFORMINGANYOPERATION.(B)CURSORPERFORMINGCLICKOPERATIONLOADSTHEANIMATION...................36FIGURE34PROTOTYPE1:SIMPLECALCULATORAPPLICATIONFOR“LEAPMOTION”CONTROLLER...................................................................38FIGURE35WORKFLOWFORSIMPLECALCULATORAPPLICATION................................................................................................................39FIGURE36PROTOTYPE2:SIMPLEPAINTAPPLICATIONFOR“LEAPMOTION”CONTROLLER.............................................................................40FIGURE37WORKFLOWOFPAINTAPPLICATION.....................................................................................................................................41FIGURE38PRIOREXPERIENCEUSING“LEAPMOTION”DEVICE..................................................................................................................47FIGURE39COMPUTERRELATEDSKILLSOFTHEPARTICIPANTS...................................................................................................................47FIGURE40MEANFORTOTALTIMETAKENVSTOTALEXERCISE...................................................................................................................50FIGURE41STANDARDDEVIATIONOFTHEOBTAINEDDATA.......................................................................................................................50FIGURE42ERRORRATEFOREACHEXERCISE..........................................................................................................................................51FIGURE43ACCURACYRATEOFTHESYSTEM..........................................................................................................................................52FIGURE44SUSSCORESFORINDIVIDUALEXERCISE..................................................................................................................................55FIGURE45SUSSCOREFORUSERFEEDBACK..........................................................................................................................................57FIGURE46SUSSCOREANDAVERAGE.................................................................................................................................................57

8
List of tables
TABLE1“LEAPMOTION”USAGEANDTHEPARTICIPANTSDISTRIBUTION......................................................................................................42TABLE2COMPUTEREXPERIENCEANDTHEPARTICIPANTDISTRIBUTION.......................................................................................................42TABLE3GENDERDISTRIBUTION..........................................................................................................................................................43TABLE4TIMETAKENTOACCOMPLISHTHEEXERCISEBYTHEUSERS.............................................................................................................49TABLE5ERRORRATEFOREXERCISES....................................................................................................................................................51TABLE6SUSSCOREFORINDIVIDUALEXERCISE......................................................................................................................................55TABLE7SUSSCORESOBTAINEDBYUSERS.............................................................................................................................................56
List of equations
EQUATION1FORMULATOCALCULATEMEAN........................................................................................................................................49EQUATION2FORMULATOCALCULATESTANDARDDEVIATION...................................................................................................................49EQUATION3EVALUATINGTHEERRORRATE...........................................................................................................................................50EQUATION4FORMULATOCALCULATEACCURACY..................................................................................................................................51

9
GLOSSARY OF TERMS AND ABBREVIATIONS
1. NUI Natural User Interface
2. UI User Interface.
3. GUI Graphical User Interface.
4. HIG Human interface Guidelines.
5. CLI Command-line interface.
6. HCI Human-computer interaction.
7. RUI Reality user interface.
8. OUI Organic user interface.
9. KUI Kinetic user interface.
10. HUD Heads Up Display
11. SUS System Usability Scale

10
1 Introduction
A NUI in terms of computing commonly used by developers and designers for human-computer interfaces.
The name “Natural” refers to the user interface techniques which is been operated by control devices. These
operations have to be learnt by the user. The usability of NUI depends on how fast the user learns to operate
with the interface. While interface requires educating users, educating is eased through design which gives
the users the feeling that they are continuously successful with the interaction.
Thus, “natural” refers to a process where user interaction comes naturally, while doing so with the
technology, rather than that the interface itself is nature. This is called as intuitive interface that one can be
used without previous knowledge.
1.1 Purpose of the document
This paper provides an analysis of the usability of natural user interfaces, which provides an overview of
methods and procedure to design and develop NUI based applications. The paper describes the methods to
reduce time latency during the interactions.
1.2 Aim
Investigate different types of UI’s that could be used for the “Leap Motion” based NUI and perform user
side experiments and evaluate the results.
1.3 Work Objective
• To analyse the different GUI for different NUI devices
• To analyse different techniques used to develop and design the user interface for NUIs.
• To design and develop different GUI prototypes for “Leap Motion” applications.
• To perform user-based experiments on developed prototypes and evaluate the results.
1.4 Scientific Novelty
• This paper proposes several new button types to improve the usability, accuracy and speed of
user interaction in “Leap Motion” based NUI.
• Design and develop button types and incorporate with available hand gestures.
• Design different forms of transitions and event handlers based on the existing methods.
• Perform different user-based tests to find out which GUIs is more convenient.
In the analysis chapter, we will first briefly explain what a NUI is and how the existing NUI user controls
work, and the problems that occurred during the designing new interface button types for the same. Finally,
conclusion for the analysis of the existing technique used for the NUI’s and similar solutions available for
the proposal has been described.

11
2 ANALYSIS ON NATURAL USER INTERFACE INTERACTION
The Human interface guidelines document [1] and “Leap Motion” UI Guidelines [11] are the current
standards for designing and developing Kinect and “Leap Motion” devices. The basic standards for
designing the interface for both the devices are well described in these documents. Using the guidance,
even though the guidance is on high standards, there are many improvements required in the interface for
both the devices.
However, as Nielsen [6] states, there are no such universal standards for designing the interface for gestural
interactions. This statement made a positive impact on our research. The documents provided by the
manufacturer clearly mentions dos and don’s of designing and developing for these devices. For example,
the HIG document recommends to use specific button types and attributes. But it will limit the freedom of
the developers and designers to design new. So we have decided to use HIG document as main reference
and develop new interface keeping in the important regulation into consideration.
2.1 Natural user interface
The NUI is the third step in the evolution of the user interfaces. The first ever to develop was CLI which
was used for HCI before the GUI. Input to CLI was only provided by Keyboard which was consist entirely
of symbols. There are some operating systems like UNIX still uses CLI, but GUI’s has taken over them
decades ago.
Figure 1 Natural User interface evolution 1
The second step of the user interface evolution was the GUI. GUIs are nowadays the most common UI
type, which allows user interaction using images rather than text commands. Any major personal computer
operating system, such as Windows 7, can be considered a typical GUI interface [15].
User interfaces can also be categorized using less familiar acronyms, such as the RUI, the OUI [3] or the
KUI [4]. The NUI Group Community [2009] describes the term natural user interface as:
“its an emerging computer interaction methodology which can able to provide users to interact with
human abilities like touch, vision, voice, motion. Higher cognitive functions like expression, perception
and recall”.
1 Image: Wikipedia, Natural User Interface, https://en.wikipedia.org/wiki/Natural_user_interface

12
The NUI concept is fairly large, and includes parts, such as touch, that are outside the capabilities of the
Kinect device. We would have loved to include touch as part of our research, but it was not possible at the
current level of technology. The closest to touchable holograms are airborne ultrasound tactile displays [9],
but the technology is still in its infancy. In our research, we have solely focused on the NUI subcategories
of motion and computer vision.
2.1.1 Cursor-based or cursor-less interfaces
The modern personal computer more or less dependent on cursor based interactions, where cursor is used
to interact with the GUI. Console-based UIs are usually cursor-less interface, where a controller/joystick
for game will be used to navigate the cursor less menus. Nintendo Wii was the first console to bring the
cursor-based UI and navigation back to consoles [15], and soon Xbox 360 offered an alternative cursor-
based dashboard UI for the Kinect device. Although the Kinect-based UI for the Xbox 360 dashboard can
be used with both the Xbox controller and the Kinect device, it is mainly designed for the latter.
Cursor-based user interfaces also have sub-categories, such as the traditional PC interface that are used
with a mouse. Other cursor-based UIs are mainly extensions of the traditional interfaces, such as the hover
button [2]. These extensions can either be on the UI ‘s side, or on the controller device ‘s side. A UI
extension can be, for example, a special button that is activated automatically after the cursor has hovered
over the button a for specified time. A controller side extension can be, for example, a special hand gesture
that is used to activate a normal button [2].
Freeman [4] reflects on the solutions Harmonix [8] made in their NUI and states rules for making better
gestural UIs for Kinect. Like the HIG document [1], these rules also contradict with our research and results.
Freeman [4] quite boldly lays out rules such as
“...don‘t use a cursor and ―arm extension does not work. We felt that these rules were quite absurd
and we were delighted to prove them wrong.”
Almost every cursor less UI is different from one another, some being easier, some harder to use. The
cursor less UI offers a great challenge for the developers and designers, since there are no well-established
standards. Every user control on the cursor less UI must be developed separately, which greatly increases
time required for the development. One of the most successful cursor less NUIs is the menu navigation in
the Xbox 360 game Dance Central by Harmonix [8] and thoroughly covered by Freeman [4] and Nitsch
[7].
2.2 Kinect Based user controls
Microsoft Kinect [1] for windows provides two variants of button styles. Which could be applied according
to the requirement of the user interface design.
The two variants suggested by Microsoft Kinect are;
13
• Tile Buttons
• Circle Buttons
Let us study the important features and development procedure for these two styles provided by the
manufacturer, our analysis mainly based on how these buttons can be implied to overcome the erroneous
user interactions with respect to the Kinect sensor.
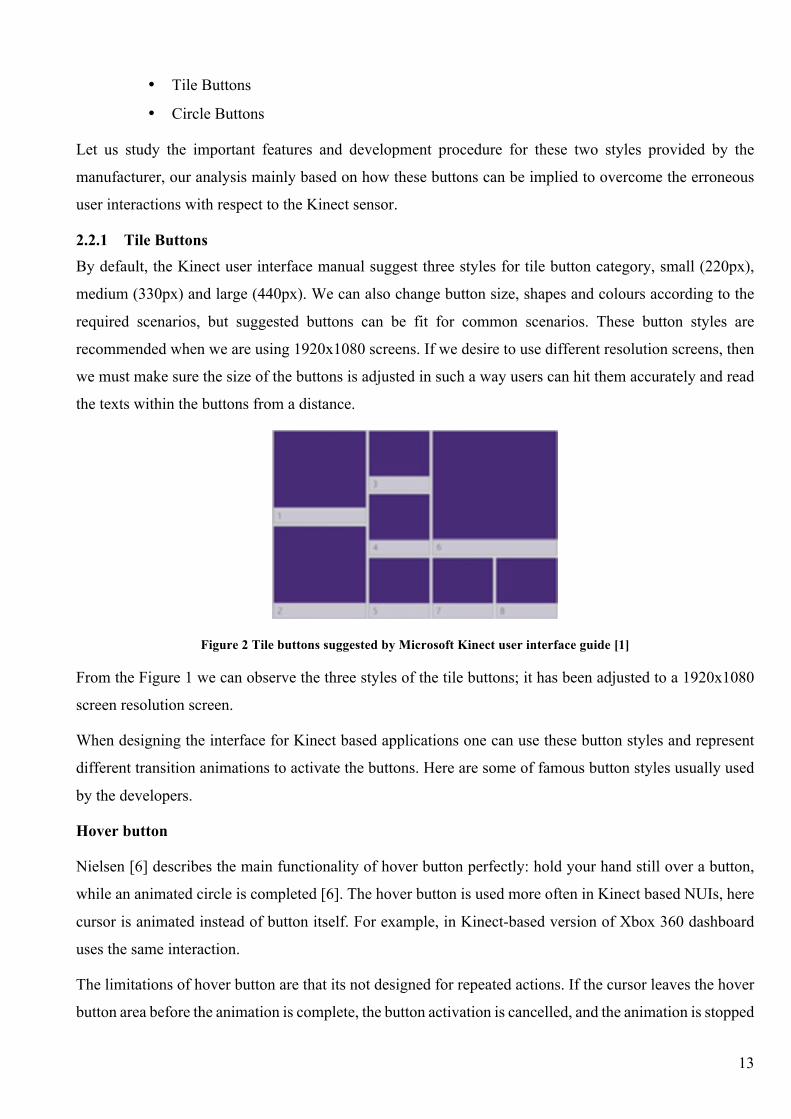
2.2.1 Tile Buttons By default, the Kinect user interface manual suggest three styles for tile button category, small (220px),
medium (330px) and large (440px). We can also change button size, shapes and colours according to the
required scenarios, but suggested buttons can be fit for common scenarios. These button styles are
recommended when we are using 1920x1080 screens. If we desire to use different resolution screens, then
we must make sure the size of the buttons is adjusted in such a way users can hit them accurately and read
the texts within the buttons from a distance.
Figure 2 Tile buttons suggested by Microsoft Kinect user interface guide [1]
From the Figure 1 we can observe the three styles of the tile buttons; it has been adjusted to a 1920x1080
screen resolution screen.
When designing the interface for Kinect based applications one can use these button styles and represent
different transition animations to activate the buttons. Here are some of famous button styles usually used
by the developers.
Hover button
Nielsen [6] describes the main functionality of hover button perfectly: hold your hand still over a button,
while an animated circle is completed [6]. The hover button is used more often in Kinect based NUIs, here
cursor is animated instead of button itself. For example, in Kinect-based version of Xbox 360 dashboard
uses the same interaction.
The limitations of hover button are that its not designed for repeated actions. If the cursor leaves the hover
button area before the animation is complete, the button activation is cancelled, and the animation is stopped

14
[2]. According to the HIG document [1], the slow click pace of the hover buttons gets in the way of fluent
user interaction, and the user must wait for the animation to finish before they can repeat the action. In
addition to this if the button needs to reactivate, the cursor has to leave the button area and replace. This
makes the hover button very inefficient on the UIs that require multiple button activations [2]. If the hover
button is modified to resume the animation when returning to the hover button area, the possibility of a
false activation is too great [2].
Figure 3 Hover button animation [2]
The functionality of the hover button can be built into a special cursor or into a special button animation.
Using these special buttons or special cursor helps to learn the interaction quickly. The possibility of
activating the hover button by accident is very low. The current version of the hover button functionality is
the same as the original version. However, we changed the animation to be in line with our other interaction
types. The animation was changed from cursor animation to button animation. The fill duration of the
animation is approximately the same for the button animation as it is in the actual Kinect-based cursor
animation, 1.5 seconds [2].
Confirm hover button
Nielsen [6] describes the interaction type we call the confirm hover button as follows: ―first select a
command, and then keep your hand still over a small confirmation button that pops up next to that
command. Without interaction, the confirm hover button is identical to the hover button. However, the
confirm part is revealed after the cursor lands on the button area. This additional step slows down the user
interaction compared to the hover button. The confirm hover button was the slowest button interaction type
in our existing button interaction type review, but also had the least false button activations.
Figure 4 Confirm hover button when the cursor is over the button [2]

15
Figure 5 Confirm hover button animation when the cursor is over the Ok button [2]
This button interaction type is only used in a handful of NUIs, such as in the game called Your Shape:
Fitness Evolved [10]. The confirm hover button in the previously mentioned game works exactly the same
as it does on our version of the confirm hover button.
Swipe button
The third major UI navigation type we call the swipe button is not really a button at all. Swipe button is a
special type of cursor less navigation where the menu items are browsed and activated through horizontal
and vertical swipe movements. Nielsen [6] describes the swipe button as: -after selecting a menu item,
swipe your hand left - unless you want the "back" feature, in which case you swipe right.
Confirm button
Confirm button is another variant of Confirm hover button, but the animation part in the confirm hover
button is redundant and more erroneous. So confirm button was introduced. The button visually identical
to normal button at first, when the cursor is over the button area, a small ‘Ok’ appears in the top right/left
of the button. When the cursor enters the ‘Ok’ button area, the button will be automatically activated.
This button helps to reduce the redundancy of the animation, and false activation of the button, this button
can be deployed when the user has to choose the option faster.
Figure 6 Confirm Button [2]
General guidelines for using tile buttons as described by Microsoft Kinect sensor. By following the
guidelines one can develop these buttons for required application.(Windows, 2013)
• Any tile button can be fitted in to a grid, only if there are proper padding between the tiles. We have

16
to make sure that the padding should not overlap the button areas. Button size is more important
than the padding.
• Tile buttons can be comprising of a background (may be solid colour/ image/ symbol) and a text
area can be fitted within the button area.
• If we remove the image, solid colour will be retained.
• We can easily resize them to fit our design.
• Tile buttons can be used for listing items, launching pages, or navigating within the page or next
page.
• Tile buttons can be built for ease of access for the user to target the specific item. Bigger the buttons
easier the target hits.
• We should make the buttons border invisible which allows buttons without dead space between
them, which will make users to select within a group of items.
2.2.2 Circle Buttons
Circle buttons are commonly used for simple navigation such as back, home and settings etc. [1]
Figure 7 Circle Buttons variants [1]
The circle buttons are more user friendly and less time consuming to activate since the animation for the
buttons are not necessary. Practical implementation of these buttons should follow certain regulations.
• Circle button and its surrounding hieroglyphic character can be written above or below the circle.
• Circle button can be scaled to required size and can insert text inside the circle.
• We can replace circle element with image of our choice.
• We must make sure the circle resolution fit to screen resolution, so that it is easy to target.
• We must keep the button and text within a rectangular area that is all hit-targetable, this will help
the user to hit the button less accurately.
• The colour of the button is black and white by default. We can modify the colours according to our
requirements.
2.2.3 Panning and Scrolling Another important UI feature in the Kinect applications other than buttons are scrolling and panning,
scrolling enables users to navigate up and down, or left and right, panning can enable users to navigate
freely in X and Y within a canvas like dragging a finger over a mapon a touchscreen. Scrolling can be

17
used for selecting audio/video from the playlist. This can also be applied for gallery of images.
Users can scroll and pan continuously with experience of using this feature. It is possible to scroll between
the interval of a surface or page. In Kinect scroll viewer component, a new direction-manipulations has
been introduced i.e. continues panning and scrolling with the help of grip and move operations. Gripping
can be achieved when the user closes the hand into a fist. This feature can be used for scrolling through the
page and scrolling through the canvases. But this might not be the strongest interaction for navigation
between different screens, views or pages.
Limitations of Scrolling and Panning.
• Grip recognition has been built specifically for scrolling and panning, only interactions like
zooming, drag and drop and rotation features can be performed using grip recognition.
• It works best when the distance between the sensor and the user is not more than 2m away.
• It works efficiently when the user’s fists are easily seen. Large coats or items on wrists has to be
removed before interacting with gripping.
• During the scenarios like view-changing scrolling, its better to use Kinect buttons in the scroll to
view, or to jump to the place where the users are looking for. When there are different sections, it
may be easier to navigate straight wilt less frustration and fast scrolling.
Why is gripping to scroll better than hovering?
The Figure 8 and Figure 9 [1] are sample from developer toolkit example showing the scrolling through a
list of items using hover approach. Hover approach is relatively easy and targeting the items is efficient,
but its also frustrating and slow. Even though there are many ways to make hovering to scroll, such as
giving acceleration, it has been found that using grip interaction will be fun and allows users to control their
own speed and distance according to their need.
Figure 8 Scrolling using Hover method. [1]

18
Figure 9 Scrolling using Gripping method. [1]
Main goals to achieve the above interaction were set in such a way that; system should provide feedback
when the user grips and releases; enables users to successfully scroll short distances with precision; Enable
users to scroll longer distances without frustration or fatigue [1].
2.2.4 Scroll Viewer To achieve the best panning and scrolling through lists by gripping Microsoft [1] built the Kinect Scroll
Viewer to use in our applications as a component from the Developer Toolkit. Even though it was preferred
to use for Kinect input, it can also respond for input from keyboard, mouse and touch.
Figure 10 Kinect Scrolling view [1]
User experience for the scrolling view as follows;
• To manipulate the canvas, users should use grip anywhere within the scroll viewer and drag.
• By using scroll viewer, users can be able to grip and filing to scroll for longer distances, and canvas
will be continued for a certain amount of friction.
• If a user accidentally scrolls in the wrong direction Kinect scroll viewer corrects them and help user
to scroll in right direction.
• By gripping and pressing on the scrolling area users can stop the moving canvas at any time.
• Once the scrollable area is reached to an end, a feedback will be provided to users by a slight elastic
bounce.
• Kinect Cursor Viewer provides a feature where users should be able to pan or scroll by gripping

19
any part of the screen which scrolls along with scrolling. The background colour of the Kinect
viewer will get changed by default to indicate the graspable area, which helps users to understand
it easily without ambiguity. If the user wants a finer control he has to move his fist slow, and this
will enable the user to filing the content if they want to reach a long distance. The filing gesture is
useful when the user wants to reach the top/bottom of the content. Kinect sensor will detect the
user’s hand, if the gesture is gripped then it ignores pressing.
• The end of the list in the viewer is indicated by an elastic effect during the scrolling, and bounce
back when the end is hit from filing. This will help to provide an idea to the users that they have
reached the beginning and end of the viewer.
• It is best practice to avoid long lists for scrolling, we should keep the components of the lists for
minimal quantity.
• It is less reliable to use the Grip and move to scroll or pan for critical tasks, users might move their
hand quickly, where the UI may not be responsive for such quick movement, but this will add a
novel experience for users to interact with such interface. Its better to use this interface for the lists
having 2 to 3 items.
• Comparatively, horizontal scrolling is easier and more comfortable than vertical scrolling. But
horizontal scrolling should be properly structured to enable ease of access to users.
Also, with new gesture and interface, users might find difficulty to operate, proper education is necessary.
Grip recognition works well when the user has perfect idea about their hand positions. There might be some
scenarios where a half-closed hand is misrecognized as grips. We can educate people by providing proper
feedback while interacting with the interface.
The colour of the cursor which enters the Kinect Scroll viewer can be altered according to the requirement.
By default, it is semi-transparent grey. From Figure 9 we can observe the only visible part of the scroll
viewer is the scrollbar. Microsoft Kinect [1] user guidance states that a small panning indicator shows the
users’ current location in the canvas and the amount of canvas available. Users cannot grab the panning
indicator; it is only provided as visual feedback. The panning indicator only appears when the user is
actively scrolling by gripping (not witha mouse). If mouse movement is detected, the scrollbar appears,
with a traditional thumb control and two arrows. After mouse movement stops, the scrollbar times out and
disappears, returning to the panning indicator.
2.2.5 Zooming (Z-Axis Panning) Zooming makes an item or an object on the screen larger or smaller, or display more or less detail. Its been
a famous option in courser based and touch based interfaces, by using mouse or by pinching on the screen
zooming can be achieved in such interfaces. But Zooming in NUI is challenging because its hard to be
precise about the start and end points or distance.

20
Currently, there is no controls or interactions that help with zooming, but using grip recognition if we do
our own implementation of zooming, to keep it consistent with the scroll interaction. The following
implementation rules are based on existing zooming UI that people might be familiar with.
Triggered Zoom mode
Figure 11 Triggered Zoom mode [1]
In this method the zooming is initiated when the user holds both the hands up, UI can be represented by
arrows indicating the zooming has been initiated (See Figure 11).
Zoom control UI
Figure 12 shows the UI that can be represented similar to a slider from 0 to 100%. Using grab and drag
slider users can zoom in or zoom out. Press forward or backward button to do the same operation.
Figure 12 Zoom control UI [1]
VUI
By using voice commands like “Zoom 100%,” “Zoom in,” or “Zoom out,” which enable users to
zoom accordingly (See Figure 13). But its good practice not to repeat the commands over.
21
Figure 13 Voice User Interface [1]
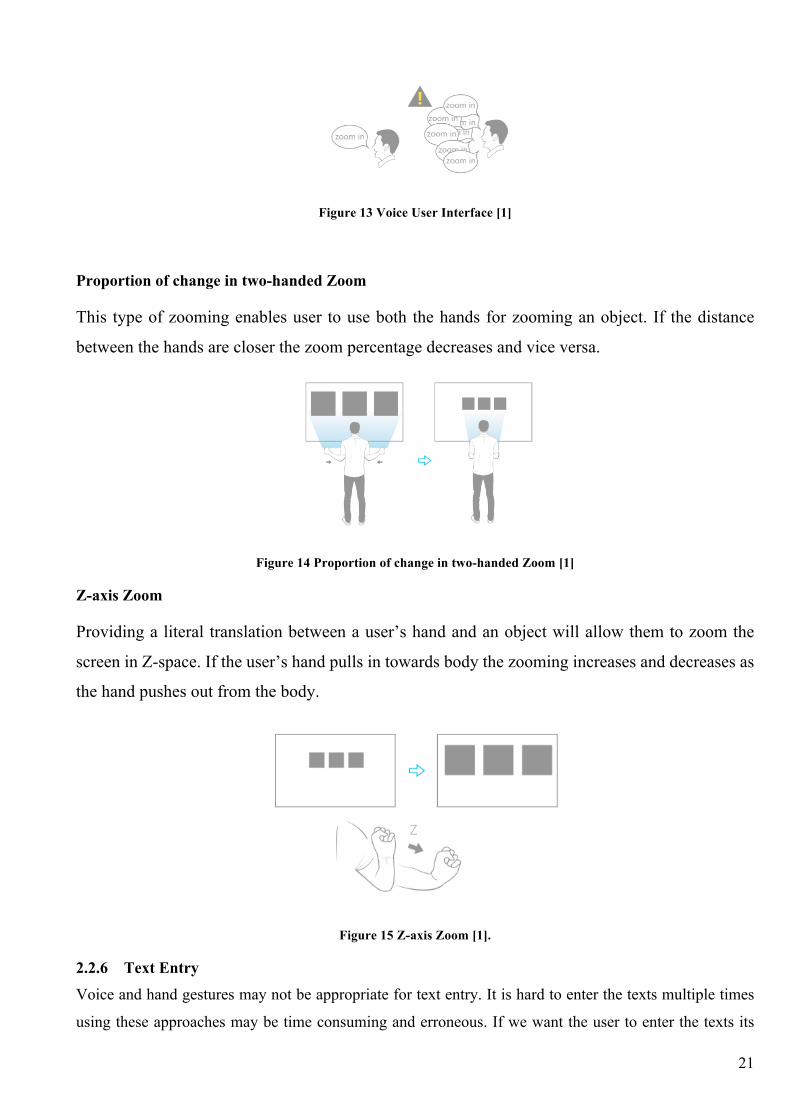
Proportion of change in two-handed Zoom
This type of zooming enables user to use both the hands for zooming an object. If the distance
between the hands are closer the zoom percentage decreases and vice versa.
Figure 14 Proportion of change in two-handed Zoom [1]
Z-axis Zoom
Providing a literal translation between a user’s hand and an object will allow them to zoom the
screen in Z-space. If the user’s hand pulls in towards body the zooming increases and decreases as
the hand pushes out from the body.
Figure 15 Z-axis Zoom [1].
2.2.6 Text Entry
Voice and hand gestures may not be appropriate for text entry. It is hard to enter the texts multiple times
using these approaches may be time consuming and erroneous. If we want the user to enter the texts its

22
advised to have access to alternative inputs like touchscreen or traditional keyboard. Its better to direct them
to use that input methods
Virtual keyboard
A virtual keyboard is the one UI component which give access to enter the texts using the hand gestures.
Lists of letters must be provided and user can able to enter the text within the given lists of alphabets.
Figure 16 Virtual keyboard [1].
2.3 “Leap Motion” user interaction
The “Leap Motion” system recognizes and tracks hands and fingers. The device operates in an intimate
proximity with high precision and tracking frame rate and reports discrete positions and motion. The “Leap
Motion” controller uses optical sensors and infrared light. The sensors are directed along the y-axis –
upward when the controller is in its standard operating position – and have a field of view of about 150
degrees. The effective range of the “Leap Motion” Controller extends from approximately 25 to 600
millimetres above the device (1 inch to 2 feet) [11].
2.3.1 Button
Using Unity widgets provided by “Leap Motion” Developer toolkit [12] we can design buttons to interact
with “Leap Motion” device. These buttons can be designed as similar to Kinect Button UI, size of the button
and spacing between the buttons make it easy to trigger and activate the button and do the operation. When
the button is pressed, the button compress in z-space until they are triggered or light up. See Figure 17
Buttons for “Leap Motion” interface.

23
Figure 17 Buttons for “Leap Motion” interface.[12]
2.3.2 Slider
Slider provides the user to trigger an event when the slider reaches the end of the sliding length. The slider
highlights when activated, an additional colour indicates the activation of the slider to provide feedback to
user. See Figure 18.
Figure 18 Slider for “Leap Motion”. [12]
2.3.3 Scroll
As we discussed earlier in Kinect Slider view the elements can be placed either vertically or horizontally
according to the canvas of the screen. We have to make sure that the items in the lists must be responsive
for different size of the screen. Proper padding between the items within the slider provide ease of handling
for the user. See Figure 19.
Figure 19 Slider in “Leap Motion”. [12]
2.3.4 Arm HUD
In “Leap Motion” user can choose option within an interface similar to smart watch called Arm HUD which
allows user to select option within the surface around the arm. See Figure 20.

24
Figure 20 Arm HUD in “Leap Motion”. [12]
2.3.5 Browsing Internet using “Leap Motion” “Leap Motion” VR Guidelines describes that there is an opportunity to increase and improve spatial
cognition in the browser by developing a strong spatial system and allowing for dynamic data
dimensionality [11]. Using these strong spatial system users can quickly setup spatially optimized tasks.
AR in particular creates opportunities for users to map their virtual spatial systems to their real ones –
opening up rapid development of spatial cognition. In both cases, however, we have a theoretically infinite
canvas to spread out [11].
Figure 21 Spatial Systems [12]
Spatial Semantics
1. At the same time, allow users the full reach of their space to organize data into spatially relevant areas
using simple drag-and-drop interactions over that baseline grid.
2. Regardless of dynamic reshuffling of space, it is essential that this canvas retain the spatial location of
each item until specifically altered by the user.
3. To lean on users’ existing expectations based on over a decade of tab browsing, we can maintain the
existing “launch tab to right” pattern.

25
4. The key to a successful spatial browser is a strong baseline grid.
External Memory
With this spatial consistency, the user can maintain “memory tabs” and return to them through spatial
memory. This also helps the user create muscle memory for frequent tasks and activities.
Figure 22 Spatial consistency within the browser. [12]
Dynamic Spatial Semantics
Now that the user can always return to their baseline spatial system, we can capitalize on the digital power
of data by providing dynamic spatial semantics. Two projects from Microsoft, Pivotand and SandDance,
demonstrate the power of dynamic movement between data visualizations to reveal patterns within data.
The animated transitions between the views help users understand the context.
Figure 23 Spatial property with respect to time [12]

26
Figure 24 Spatial property with respect to recency and frequency [12]
Dynamic Dimensionality
However, both Pivot [13] and SandDance [14] were developed for screens – a 2D environment. While this
reaches the limit of today’s shells, AR/VR offers us the opportunity to create 3D intersections of data
visualizations. In other words, the intersection of two 2D data visualizations providing a 3D sense of data
dimensionality. Data is given a dynamic volume as defined by the values of the intersecting graphs.
In practice, one application of this approach would be that items most related to the two visualizations
become large and nearer to the user, while items that are not likely to be relevant fall away. In this way, by
quickly looking at the dimensions involved, the user can instantly understand the difference between
various items – just like in the real world [12].
2.4 Conclusion of Analysis
1. In this Chapter, we looked into what NUI really is, and what are the current practices for Kinect-
based and “Leap Motion” natural user interaction types. However, the current practices are more
like guidelines than well-established standards, and that gave us perfect opportunity to design our
own alternatives.
2. Based on our review, we found many drawbacks of current user interface design techniques for both
the NUI devices. We have found the better ways to interact with the NUI and we are proposing
them in our next phase of research.
3. In the next phase, we will cover thoroughly our proposed new interaction types, how we will test
them, and how they are developed. We also discuss our research methods and what programming
related choices are made.

27
3 SYSTEM DESIGN
From the analysis we have found the pros and cons of the NUI for existing system, in our proposed system
we have taken some of the guidelines provided by “Leap Motion”. Using those guidelines, we have
designed our proposed system. This section deals with the system design for the proposed system.
3.1 System Functionality
Below Figure 25 Use case diagram for NUI Interface shows the Use case diagram for NUI Interface, we
can observe that the user performs operations by moving the cursor over the screen and perform click
operation, which is included with loading the animation.
Figure 25 Use case diagram for NUI Interface2
3.1.1 Functional requirements
• Move cursor - User move the cursor over the screen. Cursor may be either shown as a palm of
a hand or regular traditional arrow.
• Detect Gesture - Once the user starts to move the cursor using it also performs gesture
recognition. If the gesture is recognized, then the user can do further operations.
2 Created using Cordately- https://creately.com/app/?tempID=h9e5ynbx1&login_type=demo#

28
• Perform Click - Once the user’s hand gesture is recognized, the designed click operation will
be performed it might be any way to activate an event.
• Load Animation - To activate any event it is required to show some animation in order to give
feedback to user. User’s learn to activate any events but knowing the animations.
• Perform transitions - Another way of representing the activation of any event, example, sliding
transition to activate an event.
• Trigger an Event - After animation completes, the event which is related to the button will be
triggered.
• Performing operation - The event which triggered by the animation/ transition will be initiated
to perform the operation. Example, Navigation, Increase/Decrease volume etc.
3.1.2 Non-Functional Requirements
• Computer must have USB 3.0 input slot to run ““Leap Motion”” controller
• The system should have modern browsers to run JavaScript API.
• The device should be placed in an accessible space where user’s hands are correctly calibrated.
• The software supports only one active user at a time.
Performance Requirements
• CPU: Intel i5 processor, 3.0GHz / AMD Athlon 64 X2 6400+, 3.2GHz
• RAM: 4 GB
• OS: Windows 8.1, 10.
• Video card: NVIDIA GeForce GTX 660 TI / ATI Radeon HD 6650
• Free Disk Space: 1 GB required.
• USB port: Only 3.0 USB support.
3.1.3 Design Constraints
The prototype for the “Leap Motion” user interface has been developed by combination of JavaScript SDK
provided by “Leap Motion” for developers and leap strap a cross over UI available on open source.
3.1.4 Process Model
After our research on the process model we decided on Iterative and Incremental Model. Since Waterfall
processing model discourages revisiting and revising any prior phase once it's complete we do not want
choose it. We have seen that Iterative and Incremental development is at the heart of a cyclic software
development process developed in response to the weaknesses of the waterfall model. It starts with an initial
planning and ends with deployment with the cyclic interactions in between. It follows a similar process to
the plan-do-check-act cycle

29
Figure 26 Process Model
3.2 “Leap Motion” system components
From our analysis, we found that there are many options to implement a GUI application for “Leap Motion”
device. Using external libraries like Qt, FLTK etc. [12]. These libraries generally are in programming
languages like C++ or Java. These libraries are costly to learn and needs high source lines of codes.
Therefore, they are not considered as an ultimate option for the application. In order to give more
importance to usability study than implementations, the GUI part is designed as a web application, using
HTML 5, CSS3 and JavaScript. With the help of LeapJs 2.0 library, the GUI part and the interaction process
can be developed within no matter of time with less resource. The resulting application would consist fair
amount of animations and transitions.
The second part of the application is to control the “Leap Motion” device and process the data extracted
from the device. The device’s controlling and processing are coupled into two different modules. Each
module is considered to be running on an independent thread. The importance of this design is to enhance
each module and can reuse the same module for future works.
The “Leap Motion” listener is running on thread 1. The listener will control the “Leap Motion” device. The
LeapJs 2.0 listener will receive the information from the device by call-back function. That means whenever
the device detects the hand it updates the frame by calling frame() call-back. The listener keep updating the
frame() call-back function when there is hand() and finger() functions triggered by the device.
The main logic of the application will be running in thread 2. It first pulls the information from listener.
The data is shared between two threads and each time only one thread will be manipulated. The gesture
recognized by the “Leap Motion” device is not always reliable. If the user uses swipe gesture, the device
detects three different gesture types, with a single swipe the device recognized 3 times the swipe from left
to right and one circle gesture. These types of ambiguity in the gesture recognition is not desired for the
developed application.

30
To avoid this type of gesture ambiguity, the detected gestures are processed using FSM [12]. FSM return
the processed gesture corresponding to the gesture performed by the user.
Figure 27 Software architecture of the application
Finally, the processed gesture is which is outputted from FSM should passed to FSM. The GUI will be a
web application which is running on web browser, while the controlling application being LeapJs 2.0
library. Both library and FSM will be running as a single thread see Figure 27. When the user starts to
interact with the system, the device triggers thread 1 event. The listener sends the frame data and velocity
of the user’s input to the FSM. Each processed data then be fed to the LeapJs library to perform the user
desired operation. Once the interface processes the gesture, the data will be sent to the backend server where
PHP back end process will have initiated and user session will be created and store the user’s behaviour
observed during the process will be stored in the MySQL database. The web GUI will retrieve the
information from the server where the applications are stored.

31
3.2.1 FSM Approach
In the FSM approach, a gesture can be modelled as an ordered sequence of states in a spatio–temporal
configuration space [13]. According to the definition of FSN, FSM provides finite set of states in finite set
of event [12]. Therefore, processing the data from listener to FSM avoids multiple events triggers. A basic
example for understanding the FSM can be described as follows:
Figure 28 Basic example of FSM
The FSM starts from one state and terminates at another state defining the termination of the event. The
Figure 28 shows the transition of event from state A and terminates at state C. This basic idea integrated to
our proposed system enhances the gesture recognition allowing the user to perform smooth and glitch free
operation.
Normally a gesture will be sequence of movement. Easy and straightforward approach is to determine
whether a gesture is performed is a new gesture or the previous gesture. FSM does not require high
computation time and memory. The information of the past state can be encoded into the current state
results in efficient processing.
3.2.2 Designing FSM system
In our prototype designing, the FSM is integrated with LeapJs 2.0 library. To avoid expensive development
time, the LeapJs library is modified according to the proposed approach rather than developing FSM system
from scratch. The class diagram for the FSM state transitions are shown in the Figure 29. For demo purpose,
the class diagram describes for swipe gesture. But in practice, the library automatically detects the gesture
and feeds into FSM system as a single threaded event [12].
Figure 29 Class diagram for FSM events
32
Since the LeapJs uses OOP principle to interact with the listener, its easy to design the FSM on the same
principle. There are two template types in the class, state and event. Class defines only one type of method
called updateState. When there is an event triggered from the previous thread, the FSM takes it as an input
and updates the current state of FSM. There are also many virtual methods are defined in order to initiate
the class. A derived class in FSM consist of the state type and event type which are considered as abstract
class. In the class diagram illustrated in the Figure 29 two enumerated types SwipeState and SwipeEvent
are considered. The SwipeFSM which inherits FSM with newly created state and event type representing
the template types. initStateTable overrides SwipeFSM in order to recognize new state. FSM for the
proposed prototypes follows the following state transitions, all the prototype categories are implemented
with the same architecture. According to the LeapJs 2.0 documentation [11]. The gesture information
includes gesture types like swipe, circle, keytap, screentap etc. for every gesture a unique ID will be
generated. The listener pulls the data to the FSM thread and constantly updates the status of the gesture.
The gesture may be start, update or stop. The state transition of every gesture can be observed in the
following FSM state transition diagram.
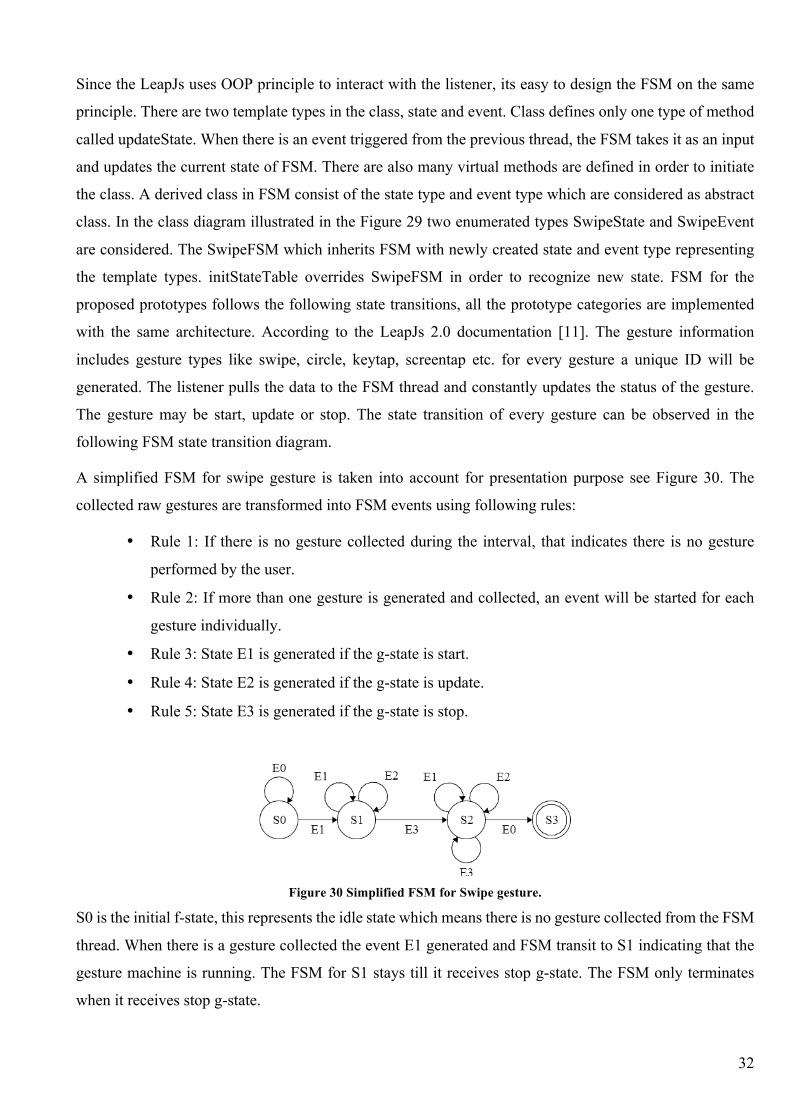
A simplified FSM for swipe gesture is taken into account for presentation purpose see Figure 30. The
collected raw gestures are transformed into FSM events using following rules:
• Rule 1: If there is no gesture collected during the interval, that indicates there is no gesture
performed by the user.
• Rule 2: If more than one gesture is generated and collected, an event will be started for each
gesture individually.
• Rule 3: State E1 is generated if the g-state is start.
• Rule 4: State E2 is generated if the g-state is update.
• Rule 5: State E3 is generated if the g-state is stop.
Figure 30 Simplified FSM for Swipe gesture.
S0 is the initial f-state, this represents the idle state which means there is no gesture collected from the FSM
thread. When there is a gesture collected the event E1 generated and FSM transit to S1 indicating that the
gesture machine is running. The FSM for S1 stays till it receives stop g-state. The FSM only terminates
when it receives stop g-state.

33
3.2.3 System Deployment
There are many option to build GUI application for “Leap Motion” device, the latest version “Orion” have
many development toolkits which are available in “Leap Motion” developer site [11]. Considering the
available tools and resources the prototypes has been implemented using JavaScript API to track the motion
and track the fingers of “Leap Motion” device.
3.2.3.1 JavaScript API
The “Leap Motion” API tracks following physical quantities with the following units.
Distance: millimetres.
Time: microseconds.
Speed: millimetres/second.
Angle: radians.
Motion tracking data:
The controller tasks in “Leap Motion” includes hand and finger class. When the device tracks the motion,
it updates and sets frame data. The frame acts as the root of the “Leap Motion” data model.
Hands:
The hands model provides the information about the position, identity and angle of the detected hands. The
hand() class initializes the tracking procedure when the user’s hand has been detected. The hand tracking
data consists of physical quantities like palm position and velocity.
Fingers:
The next important class in LeapJs 2.0 is finger class which detects each fingers and provides the
information about it. The fingers are identified buy the type name thumb, index, middle, ring and pinkie.
Considering these physical data, the API tracks the position and orientation of the fingers.
Sensor Image:
The LeapJs 2.0 also provides raw sensor images from the leap controller. The image data consists of
measured IR brightness values and calibration data required to correct the complex lens distortion.

34
In the designed prototype, the LeapJs 2.0 has been integrated along with PHP programming as backend to
observe the user behaviour and track the time consumed by the users to accomplish the tasks. The
development deployment for the leap sensor is shown in the Figure 31.
Figure 31 Deployment model
User interface of the designed prototype are designed using Leapstrap [11] components. The motion
detection and other physical entities are provided by LeapJs 2.0 SDK. The UI utilizes the API components
provided by LeapJs SDK and runs the motion recognition. The LeapJs 2.0 SDK is mandatory in order to
make the communications possible. The the design also uses PHP for backend support and MySQL to store
the user behaviour data.
Work Flow of the system:
The user behaviour is monitored and stored into MySQL database, the backend programming used to track
the user behaviour will be PHP. Here the time taken to performed by the user are calculated using PHP
sessions, when the user enters the application page, the timer will be triggered and stored in the PHP session.
The session expires when the user completes the task, the time taken to perform the task then will be stored
to database. The basic work flow of the operation can be shown in the activity diagram see Figure 32.

35
Figure 32 Basic work flow of the developed system
The system allows user to register, and check for the existing user. If the entry is unique, the system
approves the user registration and redirects the user to task page. Where the user can select the tasks to
perform.
3.3 Implementation of the system
Considering the designed development system, the system shall consist of certain prototypes developed in
order to investigate the user behaviour with respect to “Leap Motion”. These prototypes help us to retrieve
the user behaviour with the system and also help us to extract the interaction data from the user.
The prototype shall have different button types and button characteristics. Using these button types and
characters all the prototypes has been designed. The hand gestures from the API library help to interact
with the system.
3.3.1 GUI Components:
The designed system shall have following GUI components:
• Cursor
• Buttons
Cursor:
The system shall have a cursor to navigate and perform the scenarios, the property of the cursor shall consist
of following characteristics.
• The cursor will be circular in shape with animation loader to perform click operation
• The cursor shall have diameter of 15mm.
• The cursor shall be change the colour on performing click operation.

36
• The cursor shall load the animation according to the delay provided for the specific button types.
The basic design of the cursor shall be pretty simple and easy to operate for the user with no experience
operating NUI interface.
Figure 33 (a) Cursor without performing any operation. (b) Cursor performing click operation loads the animation.
For interactive purpose, the cursor shall have static outer circle and dynamic inner circle, when the user
performs click operation the inner circle shrinks into smaller circle and disappears when the event is
triggered.
The animation is performed with respect to the cursor are designed in HTML 5 and CSS3. As the user
hovers on any button to perform operation the colour of the button changes. This will help the users to
understand the operations.
Buttons:
The UI has been developed using Leapstrap library which provides verities of design classes in CSS3. The
buttons are categorized as follows:
• Button with click.
• Button with click delay.
• Multi-tap Button.
• Button with attractors.
Button with click is a simple form of button, where the user can use the cursor and activate the button. This
button triggers an event and perform the assigned operation. Button with click delay consists of delay to
activate the button and trigger the event. The delay will be provided in milliseconds. Multi-tap button
performs multiple taps on singe hover. Finally, the button with attractors attracts the cursor and points to
the centre of the button and perform animation to load the event.
37
3.3.2 GUI prototypes:
For experiment purpose, the system shall have 2 important prototype:
3.3.2.1 Prototype 1: Simple Calculator Application
The main aim of having this prototype is to understand the user behaviour with respect to the button types
available. The button properties in this prototype are categorized into 3 types:
1. Big sized button with no delay and no attractors.
2. Medium sized button with 2000 m/s delay and no attractors.
3. Small sized buttons with attractors.
Having different characteristics with the button types and characteristics helps us to investigate the user
behaviour with respect to ease of use, accuracy and false activations. The following section explains in
detail about the design constraints.
1. Big sized button with no delay and no attractors:
In this category the calculator’s buttons shall have big sized buttons. The button will have hover property
which changes the colour when the user hovers the cursor on the button. This will help the user to activate
accordingly. The user has all the degrees of freedom to operate the buttons.
2. Medium sized button with 3000 m/s second delay and no attractors:
In this category the calculator’s buttons shall have medium sized buttons with 2000 milliseconds of delay.
The button will have hover property which changes the colour when the user hovers the cursor on the
button. User shall hold on the button till the animation completes. This will help the user to activate the
buttons.
3. Small sized buttons with attractors:
In this category the calculator’s buttons shall have small sized buttons with attractor property. The attractors
will grab and points the cursor into the centre of the button. When the user hovers the cursor 20mm near to
the button the button shall attract the cursor to the centre of the button. The button will have hover property
which changes the colour when the user hovers the cursor on the button. User shall hold on the button till
the animation completes. This forces the user to perform the operation more precisely. The general design
outline for this prototype is shown in the Figure 34

38
Figure 34 Prototype 1 : Simple calculator application for “Leap Motion” controller.
The calculator shall be developed using JavaScript to perform mathematical operations. The user behaviour
will also be tracked using PHP environment and store the time taken to perform the task into the database.
Work flow for prototype 1: Simple Calculator Application
The basic work flow for the calculator application can be described as flow of control from one activity to
another activity. These activities can be denoted using activity diagram, figure shows the basic work flow
of prototype 1. See Figure 35. As described in the section 3.2.3, the system allows registered user to select
the tasks. If the user chooses calculator application, the timer will be set to the user’s login session. The
start time will be initiated when the user starts to perform the assigned task. The calculator application takes
the user input and compute the input and displays the result. When the user completes the task, the end time
will be noted and stored into database. The same work flow principle applies to all the sub categories of
calculator application. The user will be provided with SUS questionnaire the user provides the feedback for
that particular task.

39
Figure 35 Work flow for simple calculator application

40
3.3.2.2 Prototype 2: Paint Application
The main aim of this prototype is to observe the user behaviour with respect to the hand gestures. The
prototype shall have simple painting tools which allows the user to select certain tools and perform the
tasks. The cursor acts like a traditional mouse pointer. The user shall use the push gesture to activate the
cursor and start drawing the objects.
The prototype shall be developed with JavaScript library to perform the painting operations and PHP as a
backend technology to track the user behaviour and store the user’s behavioural data into the database. The
basic outline of the prototype is shown in the figure.
Figure 36 Prototype 2: Simple paint application for “Leap Motion” controller.
The basic work flow for the leap paint shown in the Figure 37. The workflow describes the basic
functionality of the paint i.e. to draw the object according to the task assigned to the user. The activity
control will be initiated when the “Leap Motion” detects the hand gesture.
When the user selects the tasks that are associated to paint will be redirected to the paint application page,
the system first initiate the user’s session as soon as the user enters the task page and the user gesture has
been detected. The system allows the user to choose tool accordingly, the user chooses the tool according
to the task assigned to them. When the user finishes the task, end time will be assigned to user’s session
and then will be stored to the database, then the user will be provided with SUS questionnaire to provide
the feedback.

41
Figure 37 Work Flow of paint application

42
4 “Leap Motion” UI usability study and experiments
To understand the usability of the UI components that are developed and incorporated into the system.
These implementations were subjected to user usability tests.
4.1 Experiment setup
The usability tests were run in the at the University Dormitory. First they were asked to sign a consent
form, and we did emphasize that they could withdraw their consent and stop the test at any given time.
After signing the consent form, we asked them to fill out a questionnaire. Finally, we explained the general
test procedure to them step by step [6].
4.2 Participants
We chose 20 participants for the actual usability tests as suggested by Nielsen [2006] [6]. We collected
relevant background information with a questionnaire that could be used to categorize participants [7]. The
first question in our questionnaire was whether the participants had used the “Leap Motion” device before.
We divided usage into four categories:
Often 1
Few 10
Once 3
Never 6
Table 1 “Leap Motion” usage and the participants distribution
We also asked participants to rank their computer-related skills into one of the three predetermined
categories. High number of participants ranking themselves as experts can be explained by their technical
background.
Beginner 2
Intermediate 13
Expert 5
Table 2 Computer experience and the participant distribution
None of the participants reported any kind of disability concerning hand or arm movements, so
unfortunately we were not able to study how much disabilities would affect the usability of the “Leap
Motion” device. The gender of the participants was not asked in the questionnaire, but was still recorded.

43
Male 17
Female 3
Table 3 Gender distribution
4.3 Usability Exercises
The users were provided with self descriptive instructions for certain tasks. The task was simple and easy
to understand. The users were provided with 3 tasks from prototype 1 and 3 tasks from prototype 2. The
users were asked to perform certain arithmetic calculations with respect to prototype 1. The arithmetic
operations were asked to the users were consisted of following calculations:
• 1 + 3
• 5 * 6
• 6 / 3
• 888 – 777
• 9 + 4 + 2
The tasks from the both the prototypes are formulated as follows
4.3.1 Exercise 1: Calculator with big sized button with no delay and no attractors Aim: The main aim of conducting this exercise is to observe the user’s behaviour when there are big sized
buttons with no special characteristics.
Methodology: The registered users were provided with the instruction of the selected exercise. The users
were asked to read the instructions before starting the task. The task consisted of the first category of
prototype 1. When the system detects the hand gesture, the start time for the task has been initiated to the
user’s session. The users were asked to perform arithmetic operation with respect to the provided scenario.
User were asked to hit submit once they complete performing the task. When the user hits the submit button,
the end time was assigned to the user’s session, and calculated the time taken to complete the exercise. The
total time taken was stored to database according to the user’s ID.
Outcome: Identifying the user performance over the prototype were noted and calculated. The time spent
by the users to complete the task were stored into database and a report was generated and mean values and
standard deviation values were calculated. The users were also given with the SUS questionnaire where
they could provide the feed backs for the respective task. The questions were provided with respect to the
comfort, accuracy and ease of use of the device and user interface for that particular task.
Once the user completes the task the system redirects to the page to select another exercise.

44
4.3.2 Exercise 2: Calculator with medium sized button with 3000 m/s delay and no attractors
Aim: The main aim of this exercise is to observe the user’s behaviour when there are medium sized buttons
with 3000 m/s of delay. By conducting this exercise, we can compare the user’s behaviour with respect to
different button characteristics and positions.
Method: Since the user have already accomplished the exercise 1, the users were provided with different
UI design with medium sized buttons and delays in the button. When the system detects the gesture, a start
time was assigned to the user’s session, and counts the total time spent on the exercise till the user finish
the task. The user behaviour then stored to database along with the total time spent to accomplish the
exercise. The same arithmetic operations were conducted for this exercise as well. Once the user
accomplishes the exercise, they were provided with the questionnaire about the exercise.
Outcome: Identifying the user performance over the prototype were noted and calculated. The time spent
by the users to complete the task were stored into database and a report was generated and mean values and
standard deviation values were calculated. The users were also given with the SUS questionnaire where
they could provide the feed backs for the respective task. The questions were provided with respect to the
comfort, accuracy and ease of use of the device and user interface for that particular task.
4.3.3 Exercise 3: Calculator with small sized button with 3000 m/s delay and button attractors
Aim: The main aim of this exercise is to observe the user’s behaviour when there are medium sized buttons
with 3000 m/s of delay. The buttons are also consisting of attractors, which points the cursor to the centre
of the button. Here the user will not have degree of freedom while operating the application. By conducting
this exercise, we can compare the user’s behaviour with respect to different button characteristics and
positions.
Method: The users follow the same procedure as described in the earlier exercise, the difference with this
exercise is that the buttons are small in size and it attracts the cursor. This will allow user to select the
particular button very accurately. The accuracy reduces the time spent to complete the task. The user’s
behaviour is observed and stored into database.
Outcome: Identifying the user performance over the prototype were noted and calculated. The time spent
by the users to complete the task were stored into database and a report was generated and mean values and
standard deviation values were calculated. The users were also given with the SUS questionnaire where
they could provide the feed backs for the respective task. The questions were provided with respect to the
comfort, accuracy and ease of use of the device and user interface for that particular task.
By conducting these exercise, we can compare the total time spent by the users, comfort, accuracy and ease
of use of the prototype.

45
The second prototype which has been used for the experiment consists of 3 exercise with different tasks for
observations. The following section describes the exercise methodology and outcome.
4.3.4 Exercise 4: Paint application with restricted frame Aim: The main aim of conducting this exercise is to analyse and observe user behaviour with free hand
movement with restricted frame of the application.
Method: The exercise is designed in such a way that users can only draw the object with specific frame of
the screen. For instance, the users were asked to draw rectangle and triangle using pencil tool within the
space provided to draw. Here the push and hold gesture has been implemented in order to draw the object.
The total time spent by the users were stored and accuracy of the hand gesture was observed during this
exercise. Users were also provided with SUS questionnaire to provide the feedback on the usability.
Outcome: The user’s performance with restricted space and accuracy of the hand gesture can be observed
in this exercise. The exercise also helps to compare difficulty with the hand gestures and potential usability
of the device.
4.3.5 Exercise 5: Paint application with multi-finger operations Aim: The main aim of conducting this exercise is to observe the user’s behaviour when there is multi-
finger option to draw the object and find the accuracy of the gesture.
Method: The exercise provides full width frame to give wider frame to draw the object. users can use
multiple fingers to draw the object. For instance, the users were asked to draw a rectangle and triangle. The
gesture used in this exercise in push and hold. The user’s performance and gesture accuracy were taken
into account and stored the user information into the database. Users were also provided with SUS
questionnaire to provide the feedback on the usability.
Outcome: With this exercise the precision and accuracy of the user interaction can be observed, along with
multi-finger interaction, the user’s performance to accomplish the tasks were observed.
4.3.6 Exercise 6: Paint application with sticky cursor
Aim: The main aim of this exercise is to identify the performance and accuracy when the user’s cursor is
sticky, the cursor will have the delay to draw the object.
Method: Users were asked to draw the triangle and rectangle with full width screen and delay in the cursor.
This exercise will have cursor with sticky characteristic. When the user perform push and hold gesture the
cursor will be stuck to the screen and when the user drags the cursor, the cursor draws the object attached
to the screen frame. When the user releases the gesture the cursor comes back to the original state. The
user’s time taken to perform the task has been stored to database and users were also provided with SUS
questionnaire to provide the feedback on the usability.

46
Outcome: With this exercise the precision and accuracy of the user interaction can be observed, along with
sticky cursor, the user’s performance to accomplish the tasks were observed.
Once the user accomplish all the exercise overall feedback was taken by providing the SUS questionnaire
regarding the total usability and interaction of the device.

47
5 Evaluation and Results
After conducting several exercise as described in the section 4.3, we have quantified the results for the
usability study. There were several cases where the users were completely unaware of interaction with the
“Leap Motion” device. As per the survey, 35% of the users never used the “Leap Motion” control, there
was no instance of the users used the device often. The chart shows the percentage of the users according
to the prior knowledge about the device.
Figure 38 Prior experience using “Leap Motion” device
We also examine the expertise regarding to computer skills and we categorized them into three predominant
categories – Beginner, intermediate and expert. 65% of the users were having intermediate skills whereas
10% of the users were beginners and 25% of the users were experts. Figure 39 shows the pie chart for the
categorized users.
Figure 39 Computer related skills of the participants

48
This survey helped us to understand the importance of training for using the device, we showed the users a
demo on how to use the developed system.
Usability experiments were conducted according to setup as described in the section 4.1, each user was
provided with all the exercises in a simple and understandable self explanatory interface. We observed the
performance of the system for each exercise and generate total time taken accomplish the tasks were noted.
Apart from this data from the system, we also took the feedback from the users after conducting each
exercise. The results obtained from the experiments are quantified as follows:
5.1 Performance of the user interface with respect user interaction
As described in the section 4.1 the time consumed by each user to perform all exercise were stored into
database, we exported the database entry to CSV and evaluated the results. The time taken to perform each
exercise can be seen in the Table 4.
Time taken to
complete the
Exercises / Users
PROTOTYPE 1 : SIMPLE CALCULATOR PROTOTYPE 2 : LEAP PAINT APPLICATION
Total time in Sec -
Exercise 1
Total time in Sec
- Exercise 2
Total time in Sec -
Exercise 3
Total time in Sec -
Exercise 4
Total time in Sec -
Exercise 5
Total time in Sec –
Exercise 6
User 1 112.5 sec 150.5 sec 95 sec 310.5 sec 516 sec 520 sec
User 2 130.7 sec 144 sec 92.5 sec 308 sec 512.75 sec 523 sec
User 3 132.2 sec 152 sec 89.3 sec 312 sec 520 sec 529.23 sec
User 4 124.5 sec 143 sec 94 sec 320 sec 521.53 sec 530 sec
User 5 140 sec 155 sec 99.4 sec 325 sec 518.33 sec 532 sec
User 6 139.2 sec 149 sec 94 sec 312 sec 517 sec 521 sec
User 7 125 sec 159.5 sec 95.4 sec 311.5 sec 511.9 sec 519 sec
User 8 133 sec 144.33 sec 98.84 sec 310 sec 513.14 sec 522.12 sec
User 9 114.34 sec 140.9 sec 97 sec 311 sec 514 sec 529.2 sec
User 10 120.3 sec 152.5 sec 98 sec 319 sec 520.35 sec 530.15 sec
User 11 130 sec 149 sec 92.34 sec 321.3 sec 509 sec 532.5 sec
User 12 119.9 sec 144 sec 93 sec 322.2 sec 530.5 sec 524.25 sec
User 13 124 sec 142 sec 89.9 sec 312 sec 521.3 sec 529.5 sec
User 14 132 sec 158 sec 90 sec 306 sec 511.5 sec 522.5 sec

49
User 15 128 sec 155 sec 93.5 sec 301 sec 525.3 sec 523.5 sec
User 16 121.4 sec 153.23 sec 102 sec 309 sec 511.3 sec 520 sec
User 17 122.3 sec 149.32 sec 91.67 sec 320 sec 521.3 sec 519.5 sec
User 18 130.1 sec 140.8 sec 101.5 sec 331 sec 510 sec 523.5 sec
User 19 117 sec 162.3 sec 95 sec 311 sec 520.3 sec 523 sec
User 20 120 sec 160 sec 96.8 sec 309 sec 517.2 sec 530 sec
Mean 125.822 sec 150.219 sec 94.9575 sec 314.075 sec 517.135 sec 525.1975 sec
Standard Deviation (σ)
7.41
6.56 3.5
7.10 5.41 4.45
Table 4 Time taken to accomplish the exercise by the users
5.1.1 Observations
Table 4 shows the total time spent by the users to accomplish different tasks according to the manual
provided for them. As described earlier all the users were able to accomplish without any complications.
There were some glitches during the execution of tasks those tasks were resettled and initiated again.
From the obtained data we calculate mean and standard deviation of the obtained results. These calculations
provide us to obtain an accumulative statistical data to observe. The mean of the system is calculated using
the formula:
Mean = !"#(%)'
Equation 1 Formula to calculate mean
Where,
- n is number of elements
- N is total count of the elements
Finding mean of the time spent provide us an average time spent by all the users for all the tasks. The
standard deviation is calculated for the obtained data and its been calculated by formula:
Standard Deviation (𝝈) = 𝟏𝑵
(𝒙𝒊 − 𝝁)𝟐𝑵𝒊2𝟏
Equation 2 Formula to calculate standard deviation
Where,
- µ is the expectation
- xi is one sample value
- N is the total number of samples

50
- σ2 is called variance.
After calculating the mean and standard deviation we can obtain the following graph. We can observe the
mean and standard deviation. See Figure 40 and Figure 41.
Figure 40 Mean for total time taken vs total exercise
Standard deviation of the obtained result can be shown in the Figure 41
Figure 41 Standard deviation of the obtained data
5.1.2 Accuracy evaluation Accuracy here normally evaluated according to the error rate. The error rate is the percentage of trials failed
per task and can be calculated using the formula
Error rate = 𝑵𝒖𝒎𝒃𝒆𝒓𝒐𝒇𝒇𝒂𝒊𝒍𝒆𝒅𝒕𝒓𝒊𝒂𝒍𝒔𝑵𝒖𝒎𝒃𝒆𝒓𝒐𝒇𝒕𝒓𝒊𝒂𝒍𝒔
Equation 3 Evaluating the error rate
Errors are trials performed by the users where the intended objective not fulfilled. For instance, in the
calculator task, an error would occur when a user unintentionally fails to perform certain arithmetic
operation. Accuracy is scaled from 0-1, where 1 being 100% accurate, and 0 being 0% accurate. The
accuracy is calculated using the formula:
125.822150.21994.9575
314.075
517.135 525.1975
0
100
200
300
400
500
600
1 2 3 4 5 6
Timeinse
c
TotalExercise
Mean
Prototype1:Exercise1
Prototype1:Exercise2
Prototype1:Exercise3Prototype2:Exercise4
Prototype2:Exercise5
Prototype2:Exercise6
7.41 6.56
3.5
7.15.41 4.45
012345678
1 2 3 4 5 6
Standarddeviatio
nexpe
ditio
n
Totalexercise
StandardDeviation
Prototype1:Exercise1
Prototype1:Exercise2
Prototype1:Exercise3Prototype2:Exercise4
Prototype2:Exercise5
Prototype2:Exercise6

51
Accuracy = 1 – Error Rate
Equation 4 Formula to calculate accuracy
When calculating the final performance only successful trials are considered, the failed trials are stored as
failed trial. Since the users were aware of the tasks, the error rate were not predominant. But it was
complimentary.
Exercises Total Trials Successful Trials Failed Trials Error Rate Accuracy
1 32 20 12 0.375 0.625
2 25 20 5 0.200 0.8
3 23 20 3 0.130 0.87
4 28 20 8 0.285 0.715
5 40 20 20 0.500 0.5
6 37 20 17 0.459 0.55
Table 5 Error rate for exercises
The Table 5 represents the error rate for each exercise performed by the users. Using the error rate, we can
identify the accuracy of the system. Error rate can be denoted as below Figure 42 and accuracy can be
observed for each exercise in Figure 43.
Figure 42 Error rate for each exercise
0.375
0.20.13
0.28
0.5 0.45
0
0.1
0.2
0.3
0.4
0.5
0.6
1 2 3 4 5 6
Errorrate
Exercises
ErrorRate
Prototype1:Exercise1
Prototype1:Exercise2
Prototype1:Exercise3
Prototype2:Exercise4
Prototype2:Exercise5
Prototype2:Exercise6
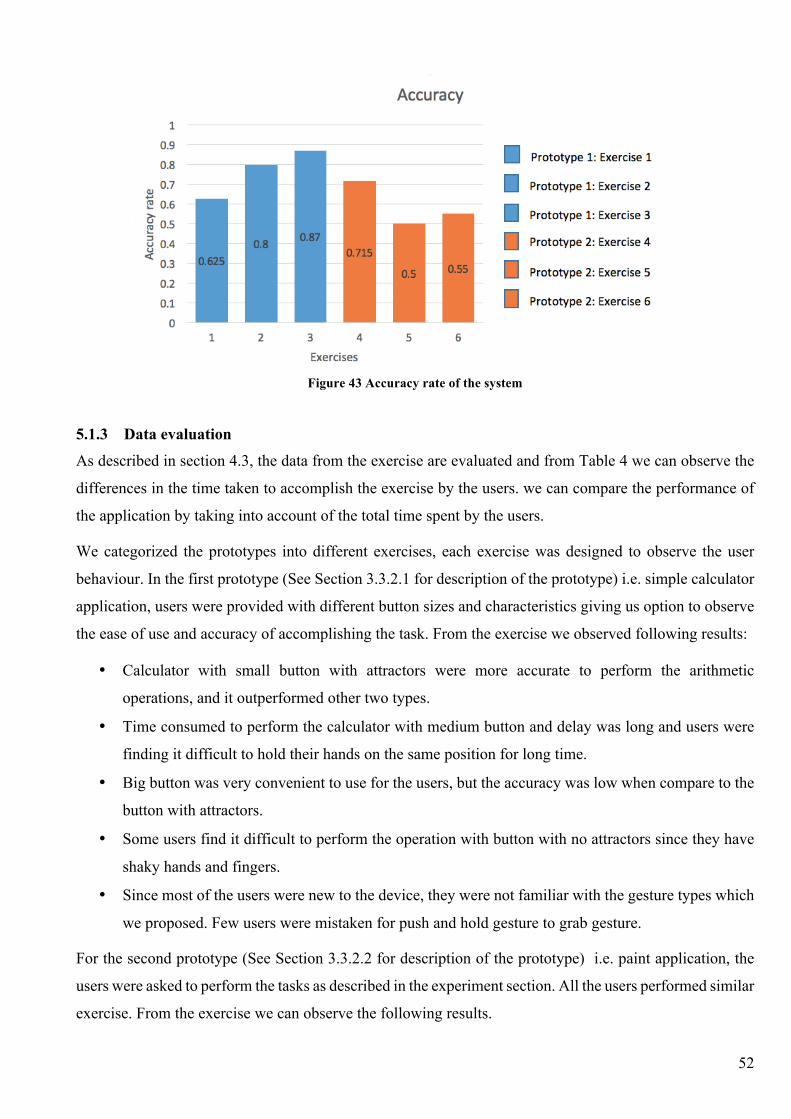
52
Figure 43 Accuracy rate of the system
5.1.3 Data evaluation
As described in section 4.3, the data from the exercise are evaluated and from Table 4 we can observe the
differences in the time taken to accomplish the exercise by the users. we can compare the performance of
the application by taking into account of the total time spent by the users.
We categorized the prototypes into different exercises, each exercise was designed to observe the user
behaviour. In the first prototype (See Section 3.3.2.1 for description of the prototype) i.e. simple calculator
application, users were provided with different button sizes and characteristics giving us option to observe
the ease of use and accuracy of accomplishing the task. From the exercise we observed following results:
• Calculator with small button with attractors were more accurate to perform the arithmetic
operations, and it outperformed other two types.
• Time consumed to perform the calculator with medium button and delay was long and users were
finding it difficult to hold their hands on the same position for long time.
• Big button was very convenient to use for the users, but the accuracy was low when compare to the
button with attractors.
• Some users find it difficult to perform the operation with button with no attractors since they have
shaky hands and fingers.
• Since most of the users were new to the device, they were not familiar with the gesture types which
we proposed. Few users were mistaken for push and hold gesture to grab gesture.
For the second prototype (See Section 3.3.2.2 for description of the prototype) i.e. paint application, the
users were asked to perform the tasks as described in the experiment section. All the users performed similar
exercise. From the exercise we can observe the following results.

53
• The tasks are formulated to observe the accuracy of the gestures and device response to the
performance.
• We compared the exercise 4, 5 and 6 that are associated with this prototype. The users were more
comfortable drawing the objects with free hand movement. As we can observe, the performance of
the exercise 4 outperforms rest of the exercises.
• We can observe that with limited frame the users could able to draw the object easily and accurately.
• The hand gesture associated with all these tasks was push and hold and drag. Some users find it
easy to activate to tool by the designed gesture.
• Users find difficulties performing the same tasks with multi-finger option.
• Multi-finger option performed with least accuracy and less comfort. Users were not comfortable
using multiple fingers to draw the objects.
• Sticky cursor performed better than multi-finger option, but it failed to provide comfort to users.
users felt restless with their hands using this option.
The conclusion for the exercise we conducted were partially from the system data that are stored, for other
part of the conclusion, we are considering the system usability scale (SUS) questionnaire that we provided
to the users. where we can study the usability from the feedback provided by the users.
The accuracy for each exercise was also calculated and observed the following:
• From prototype 1, calculator with small buttons and attractors outperformed with accuracy by 7%
and 27% compare to other two forms of button types big button with no delay and medium button
with 3000 m/s respectively.
• From prototype 2, paint application with limited frame was more accurate when compare to other
options. There was difference of 20% and 27% with respect to other options provided. See Figure
43.
5.1.4 System Usability Scale (SUS)
After finding the performance of the system, its worth taking the feedback from the users, but the feedbacks
should be scaled and should be able to quantified. This can be achieved by using System Usability
Scale(SUS). System usability scale (SUS) is a reliable tool for measuring the usability. It consists of a 10
item questionnaire with five response options for respondents; from Strongly agree to Strongly
disagree. Originally created by John Brooke in 1986, it allows you to evaluate a wide variety of products
and services, including hardware, software, mobile devices, websites and applications [18].
In our current usability study, the SUS questionnaire was provided to each user after the completion of
tasks. The SUS questionnaire consisted of 10 questions, before considering the SUS we have observed
following regulations.

54
• The scoring system is somewhat complex.
• There is a temptation, when we look at the scores, since they are on a scale of 0-100, to interpret
them as percentages, they are not.
• The best way to interpret the results involves “normalizing” the scores to produce a percentile
ranking.
• SUS is not diagnostic - its use is in classifying the ease of use of the site, application or environment
being tested.
Keeping these regulations in mind we formulated 10 questions for the usability of the device. These
questions are provided in Appendix 1.
The SUS scores are calculated using following method:
• For all odd items: subtract one from the user response.
• For all even-numbered items: subtract the user responses from 5.
• This scales all values from 0 to 4 (with four being the most positive response).
• Add up the converted responses for each user and multiply that total by 2.5. This converts the range
of possible values from 0 to 100 instead of from 0 to 40.
Considering above calculation method we extracted the feedback from the users and calculated accordingly.
Table shows the extracted results and calculations.
5.1.4.1 SUS Score for individual exercise
All the users were provided with SUS questionnaire after accomplishing each tasks, these SUS feedbacks
gave a wider prospective on how user feel about the usability of the application. The SUS questionnaire for
each exercise is formulated to understand the comfort and accuracy of the system. The questionnaire is
modified according to different buttons and hand gesture usability of the exercise. The feedback was scaled
between 1-5, where 1 being strongly disagree and 5 being strongly agree. The average of the SUS data has
been calculated and described in the table for each exercise.
Exercise Q1 Q2 Q3 Q4 Q5 Q6 Q7 Q8 Q9 Q10 SUS Score
1 4.1 2.8 4.1 2.2 4.0 2.2 3.8 2.1 4.1 2.9 69.8
2 4.0 2.2 4.3 2.0 3.9 2.2 3.6 2.2 4.2 2.5 72.3
3 4.6 1.8 4.8 1.7 4.4 1.6 4.2 1.9 4.4 2.0 83.5
4 4.5 2.0 4.4 1.9 4.2 1.9 4.0 2.0 4.2 2.2 78.3
5 3.2 2.9 3.0 2.9 4.0 2.8 3.6 2.8 3.9 2.8 58.8

55
6 3.6 3.1 3.7 2.7 3.9 2.8 3.9 3.0 3.8 3.0 60.8
Table 6 SUS Score for individual exercise
As describe in the section, exercise 1-3 are categorised under prototype 1 and rest of the exercise under
prototype 2. From the above table we can observe that the SUS score of exercise 3 under prototype 1
outperformed other 2 exercises of the same prototype by score difference of 11.2 for exercise 2 and 13.7
for exercise 1. This can be comparable with the time consumed by the users to complete the task.
From prototype 2 we can observe, SUS score of exercise 4 outperformed other 2 exercise by 19.5 and 17.5
for exercise 5 and 6 respectively. The visual representation of the scores can be observed in the Figure 44.
Figure 44 SUS scores for individual exercise
From the obtained results we can make the comparison as follows:
Prototype 1:
• Users were comfortable with using small buttons with attractors, because of the attractor property
of the button, users need not to point at the button till it gets activated.
• This increased the accuracy of the usage and users did not experienced discomfort.
• The SUS score for the exercise 3 is above the SUS average according to the SUS standards.
Prototype 2:
• In exercise 4, users were comfortable drawing the object within particular frame giving them precise
space to draw.
• Users experienced difficulties drawing with multi-fingers and sticky cursor options.
0
1
2
3
4
5
6
1 2 3 4 5 6 7 8 9 10
SUSScale
Questions
Exercise1
Exercise2
Exercise3
Exercise4
Exercise5
Exercise6

56
• As observed from the SUS score, only exercise 4 stands above average and other exercises are
below average.
5.1.4.2 SUS Score for overall system
After conducting SUS for each exercises, users were also asked to give the feedback for the overall
experience of using the “Leap Motion” device and the user interface prototypes. The following are the
results of the feedback gained, the SUS questionnaire can be seen in Appendix 1.
The questions were asked with regard to the standard SUS questions. This allow us to identify the
importance of interface design in order to provide the best experience with handling such new devices. The
following Table 7 shows the scores obtained by the users for the overall experience with the system.
Users Q1 Q2 Q3 Q4 Q5 Q6 Q7 Q8 Q9 Q10 SUS Score
User 1 4 2 4 2 4 2 4 3 4 2 72.5
User 2 4 3 4 3 4 2 4 2 4 3 67.5
User 3 4 2 4 2 4 2 4 2 4 2 75.0
User 4 4 2 5 3 3 3 5 2 4 1 75.0
User 5 5 3 4 2 3 2 4 1 4 3 72.5
User 6 4 3 4 3 4 3 4 1 3 1 70.0
User 7 4 2 4 2 3 2 4 3 3 1 70.0
User 8 3 3 4 2 4 3 4 2 4 3 65.0
User 9 3 2 4 1 5 2 5 3 4 3 75.0
User 10 3 2 4 2 4 1 4 1 3 3 72.5
User 11 4 1 4 2 4 2 3 2 4 1 77.5
User 12 4 3 4 2 4 1 4 2 3 2 72.5
User 13 4 1 4 1 4 3 4 2 5 2 80.0
User 14 4 2 4 1 3 2 4 3 4 3 70.0
User 15 3 2 3 2 3 3 4 3 4 3 60.0
User 16 4 3 3 1 4 1 5 3 4 3 72.5
User 17 4 2 4 3 3 3 4 1 4 3 67.5
User 18 3 3 4 1 4 1 4 1 4 2 77.5
User 19 4 2 4 2 3 3 3 2 3 2 65.0
User 20 4 3 3 1 3 1 4 3 3 3 65.0
Avg. 3.8 2.3 3.9 1.9 3.65 2.1 4.05 2.1 3.75 2.3 71.125
Table 7 SUS scores obtained by users

57
After calculating the SUS score for each questions for 1-5 scale range, we get the graph as shown in Figure
45.
Figure 45 SUS Score for user feedback
Table 7 provide us the overall feedback from the users after performing all the exercises. The average scale
value for all 10 questions are calculated and can be observed from Figure 45. All the questions were
formulated according the usability of the device. Out of scale 1-5 all the positive feedbacks were above
3.65 and all the negative feedbacks were below 2.3.
Figure 46 SUS score and average
From this observation we can conclude that the users were comfortable using the device even with fewer
or no prior experience of using the device. Table 7 also provide us the SUS score for individual users.
According to the SUS standards [18], the average performance of the system should be above 68,5 provided
the implemented system scored over 71.1 during the usability test. See Figure 46.
From all these evaluations, we have found the possible usability of the NUI device, understanding the
importance of the best practices before developing any NUI based user interface is vital.
72.567.575.075.072.570.070.065.075.072.577.572.580.070.060.0
72.567.577.565.065.071.125
0.0
20.0
40.0
60.0
80.0
100.0
User1
User2
User3
User4
User5
User6
User7
User8
User9
User10
User11
User12
User13
User14
User15
User16
User17
User18
User19
User20
Avg
SUSScale

58
6 Conclusion
The objectives of our research are fulfilled and we have studied the usability of NUI devices by analysing,
designing and deploying user interfaces for such devices. After experimenting and evaluating the developed
systems, we could able to accomplish the work objectives. The aim of the research is well understood and
could able to achieve the expected goal of the research. The following describes how these objectives were
accomplished and what we have understood from each objective.
Objective 1: To analyse the different GUI for different NUI devices
• The initial focus of this work is to analyse the existing UI interaction types for available NUI
devices. From analysis we have found the traditional approach to develop the UI for Kinect and
Leap motion devices. During analysis we observed the importance of user interaction methods for
NUI devices, and also studied the current practices for Kinect-based and “Leap Motion” natural
user interaction types. However, the current practices are more like guidelines than well-established
standards, and that gave us perfect opportunity to design our own alternatives.
• Based on our analysis, we found many drawbacks of current user interface design techniques for
both the NUI devices. We have found the better ways to interact with the NUI and we are proposing
them in our research.
Objective 2: To analyse different techniques used to develop and design the user interface for NUIs.
• The next important phase of our research is to analyse different techniques available and possibly
identify the relevant technique to design and develop the user interfaces for NUI devices.
• From investigation, we have found potential techniques that could be used to develop a suitable UI
that would be more user friendly and robust.
• For experimentation and Usability study we considered to design the system for “Leap Motion”
controller. This device is newly emerging and not many usability studies has been made for the User
Interface interaction types for this device. This motivated us to concentrate on one type of NUI
device and design the system effectively.
Objective 3: To design and develop different GUI prototypes for “Leap Motion” applications
• After investigating the different techniques for designing and developing the user interfaces for
Leap Motion device, we designed the system architecture for the better usability of the hand
gestures.
• While developing the system, we faced quite a problem with gesture detection from the device. We
were interested in one type of gesture to be recognized for one process. But the device was detecting
multiple gestures instead of one.

59
• This forced us to change the system architecture and introduce FSM approach to streamline the
gesture recognition. Implementing this approach eased to achieve our objective.
• After series of investigation, we decided to develop a web based system to interact with the Leap
Motion device. Where the main logic of the system will be running in the backend server with PHP
environment and MySQL database to store the user behaviours.
• For saving the expensive implementation time, we have used LeapJs 2.0 library provided by the
Leap Motion. These Library had to be modified according our system design. We developed button
types and other interaction types using simple HTML5 and CSS3.
• For experiment purpose, we have developed 2 prototypes and each prototypes had sub categories
and we divided them into each exercises.
• We successfully implemented a working prototype for the usability test and accomplished the
objective effectively.
Objective 4: To perform user-based experiments on developed prototype and evaluate the results
• With the developed prototypes, we chose 20 users to conduct the experiment. All the users were
provided with the same exercises and took the user feedback for each experiments.
• From the experiments we found that users were comfortable with using natural user interface
interactions even with limited or no prior experience.
• We extracted the results and evaluated the performance and accuracy for each UI interaction types.
• We also provided SUS questionnaire in order to understand the usability factors that has been
experienced by the users.
• After evaluating the results, we compared each UI interaction types and found the best possible
method that we have developed in order to study the usability of Leap Motion device.
Finally, we were able to accomplish all the objectives that were formulated to conduct our research. Our
research is limited only for the user interface for existing methods and we are optimistic about expanding
our research into further level by considering other forms of interactions like voice commands etc.
Our research gave us a wide perspective on what is necessary to make the human computer interaction with
these NUI technologies more error free and robust. By conducting various experiments, we also learnt what
users experienced during interacting with the device. We strongly support open source and all our source
code is stored in GIT repository and its open to public. We also open for any suggestions and comments on
the improvement of present work

60
7 Appendix
In this section, miscellaneous data regarding to the usability study are described. This section contains all
the questionnaires and other documentations regarding the implementation, experiments etc.
7.1 SUS questionnaire for overall system.
The following form was given to all the users after the accomplishment of the tasks.
• I think that I would like to use this system frequently
• I found the system unnecessarily complex
• I thought the system was easy to use
• I think that I would need the support of a technical person to be able to use this system
• I found the various functions in this system were well integrated
• I thought there was too much inconsistency in this system
• I would imagine that most people would learn to use this system very quickly
• I found the system very cumbersome to use
• I felt very confident using the system
• I needed to learn a lot of things before I could get going with this system
Each questions were scaled from 1 to 5, where 1 being strongly disagree to 5 being strongly agree. The
forms can be found in google drive
7.2 SUS questionnaire for individual exercise As described in the section 4.3, the users were provided with various exercises. After accomplishments of
each exercise, users were asked to give the feedbacks. The feedbacks were taken in the form of
questionnaire and each questions were having the scale factor from 1 to 5. The following questionnaire
represents for each exercise.
Exercise 1: Calculator with large buttons with no delay and no attractors
• I think that I found this button type more comfortable to use.
• I found this button type unnecessarily complex.
• I thought this button type performed accurately.
• I think that I would need the support of a technical person to be able to use this button type.
• I found the functions in this button type were well integrated.
• I thought there was too much inconsistency in this button type.
• I would imagine that most people would be comfortable to use this button type.
• I found this button type very cumbersome to use.

61
• I felt very confident using this button type.
• I needed to learn a lot of things before I could get going with this button type.
Exercise 2: Calculator with medium buttons with 3000 m/s delay and no attractors
• I think that I found this button type more comfortable to use.
• I found this button type unnecessarily complex.
• I thought this button type performed accurately.
• I think that I would need the support of a technical person to be able to use this button type.
• I found the functions in this button type were well integrated.
• I thought there was too much inconsistency in this button type.
• I would imagine that most people would be comfortable to use this button type.
• I found this button type very cumbersome to use.
• I felt very confident using this button type.
• I needed to learn a lot of things before I could get going with this button type.
Exercise 3: Calculator with small buttons with attractors
• I think that I found this button type more comfortable to use.
• I found this button type unnecessarily complex.
• I thought this button type performed accurately.
• I think that I would need the support of a technical person to be able to use this button type.
• I found the functions in this button type were well integrated.
• I thought there was too much inconsistency in this button type.
• I would imagine that most people would be comfortable to use this button type.
• I found this button type very cumbersome to use.
• I felt very confident using this button type.
• I needed to learn a lot of things before I could get going with this button type.
Exercise 4: Paint application with restricted frame
• I think that I found this paint option more comfortable to use.
• I found this paint option unnecessarily complex.
• I thought this paint option performed accurately.
• I think that I would need the support of a technical person to be able to use this paint option.
• I found the functions in this paint option were well integrated.
• I thought there was too much inconsistency in this paint option.
• I would imagine that most people would be comfortable to use this paint option.

62
• I found this paint option very cumbersome to use.
• I felt very confident using this paint option.
• I needed to learn a lot of things before I could get going with this paint option.
Exercise 5: Paint application with multi-finger operation
• I think that I found this paint option more comfortable to use.
• I found this paint option unnecessarily complex.
• I thought this paint option performed accurately.
• I think that I would need the support of a technical person to be able to use this paint option.
• I found the functions in this paint option were well integrated.
• I thought there was too much inconsistency in this paint option.
• I would imagine that most people would be comfortable to use this paint option.
• I found this paint option very cumbersome to use.
• I felt very confident using this paint option.
• I needed to learn a lot of things before I could get going with this paint option.
Exercise 6: Paint application with sticky cursor
• I think that I found this paint option more comfortable to use.
• I found this paint option unnecessarily complex.
• I thought this paint option performed accurately.
• I think that I would need the support of a technical person to be able to use this paint option.
• I found the functions in this paint option were well integrated.
• I thought there was too much inconsistency in this paint option.
• I would imagine that most people would be comfortable to use this paint option.
• I found this paint option very cumbersome to use.
• I felt very confident using this paint option.
• I needed to learn a lot of things before I could get going with this paint option.

63
References [1] Windows, M. K. for. (2013). Interface Guidelines. Human Interface Guidelines, v1.8, 1–142. [2] Tommi Pirttiniemi.(2012). Usability of natural user interface buttons using Kinect. 5-7.
[3] Bruegger and Hirsbrunner, 2009. Pascal Bruegger and Béat Hirsbrunner, Kinetic user interface: interaction through motion for pervasive computing systems. In: Constantine Stephanidis (ed.), Universal Access in Human-Computer Interaction. Intelligent and Ubiquitous Interaction Environments. Springer, 2009, 297-306. doi: 10.1007/978-3- 642-02710-9_33 [4] Freeman, 2010.Will Freeman, Should Kinect UI be Standardized? 2010. Retrieved from http://www.develop-online.net/news/36304/Should-Kinect-UI-be-standardised [5] Dix, 2002. Alan Dix, Incidental Interaction. 2002. Retrieved from http://alandix.com/academic/topics/incidental/dix-incidental2002.pdf (27.11.2012) [6] Nielsen, 2010. Jakob Nielsen, Kinect Gestural UI: First Impressions. 2008. Retrieved from http://www.useit.com/alertbox/kinect-gesture-ux.html [7] Nitsch, 2011. Peter Nitsch, Insights into Kinect UI. 2011. Retrieved from http://www.teehanlax.com/labs/insights-into-kinect-ui/ [8] Harmonix, 2010. Harmonix, Dance Central. 2010. Retrieved from http://www.dancecentral.com/
[9] Iwamoto, 2008. Takayuki Iwamoto, Mari Tatezono, Takayuki Hoshi, Hiroyuki Shinoda, Airborne Ultrasound Tactile Display. SIGGRAPH 2008 New Tech Demos, 2008. [10] Ubisoft, 2010. Ubisoft, Your Shape: Fitness Evolved. 2010. Retrieved from http://yourshapegame.ubi.com/fitness-evolved-2012/en-us/index.aspx.
[11] Guidlines, L.M.V.(2015). VR Best Practices Guidelines. Retrieved from https://developer.leapmotion.com/assets/”Leap Motion” VR Best Practices Guidelines.pdf
[12] Lu, X. (2014). Natural Human-Computer Interaction with Kinect and “Leap Motion”. [13] Mitra, S., & Acharya, T. (2007). Gesture recognition: A survey. IEEE Transactions on Systems, Man
and Cybernetics Part C: Applications and Reviews, 37(3), 311–324. http://doi.org/10.1109/TSMCC.2007.893280 Windows, M. K. for. (2013). Interface Guidelines. Human Interface Guidelines, v1.8, 1–142.
[14] Microsoft Research, Pivot, available from http://research.microsoft.com/en-us (17 December 2010).
[15] Microsoft Research, SandDance, available from http://research.microsoft.com/en-us/projects/sanddance/ (accessed 27 January 2015).
[16] Wikipedia, Natural User Interface-Grapgical User Interfac. Retrieved from: https://en.wikipedia.org/wiki/Natural_user_interface.
[17] Nitendo Wii, Tech Specifications.Retrived from: http://www.nintendo.com/wiiu/features/tech-specs/. [18] System Usability Scale. Retrived from: https://www.usability.gov/how-to-and-tools/methods/system-usability-scale.html 6