a study on the impact of the use of electricity on socio ...eru/erudp/2003-10.pdf · 1 a study on...
TRANSCRIPT

1
A Study on the Impact of the Use of Electricity on Socio-economic
Activities and Environmental Awareness of the Inhabitants of Sagar
Dweep, an Island in West Bengal, India*
Snigdha Chakrabarti
Subhendu Chakrabarti
Amita Majumder
Robin Mukherjee
Indian Statistical Institute, Kolkata
_______________________________________*Address for correspondence
Snigdha ChakrabartiEconomic Research Unit, Indian Statistical Institute203 B. T. Road, Kolkata 700 108, IndiaEmail : [email protected]
2
1. IntroductionAccess to adequate as well as affordable power services is a necessary condition
for socio-economic development of a society. In a country like India where the major
economic activity is agriculture, supply of power, particularly to rural areas, is of great
significance in accelerating growth. It is also needed to promote other economic activities
for growth and development. The impressive, above the average, observed growth rate in
the energy sector of many of the East and Southeast Asian countries during the last two
decades proves that there is tremendous demand for power. But precisely what is lacking
in underdeveloped and developing countries like India is the supply of power and this is
what is constraining growth. Besides, supply of electric power has remained uneven here
and the per capita availability of power in the least developed countries has remained
below 400 kwh compared to that of 900 kwh in developed countries. It indicates that in
spite of this rapid growth there is a large amount of un-served demand for power in these
underdeveloped and developing countries. In this respect the adoption of rural
electrification in India has been regarded as an essential step towards achievement of a
high rate of growth. However, as the major source of energy is the conventional grid
power produced from coal and to some extent from oil, the setting up of the long and
costly transmission and distribution lines coupled with high transmission and distribution
loss, increasing price of fossil fuels and high cost of centralized management system
make the programme unattractive in many places, in some cases impossible. Also, there
are financial and technological constraints due to lack of funds for investment to expand
the capacity.
Alternatively, the use of non-conventional renewable energies is being recognised
gradually as a source of supply of power in the programme of total electrification. In
remote places and in some isolated regions, like islands, locally supplied non-
conventional power, despite its inherent disadvantages, has been considered as a viable
solution to the problem of power supply and as an alternative to living without power.
It is not possible to generate power on the main land and distribute it to places like
islands. What is needed, therefore, is production in the island itself. In doing this,

3
production by conventional means may not be found economic because the total
consumption on the island would perhaps not justify setting up of a plant, even of a
smaller size. There is also requirement of a large amount of investment. Alternatively,
one may think of another conventional system, the diesel based generator. But because of
its dependence on exhaustible resources, like diesel oil, and its high transportation cost to
carry to an island it too is not proving economic. Presently the households in these places
can enjoy only a limited number of hours of illumination based on kerosene or diesel.
However, these are not easily available and not affordable by majority of the rural
masses.
Small-scale renewable energy plays an important role in this context as it can be
produced according to the needs (Sinha and Kandpal, 1991). Among the abundant
sources of alternative renewable energy like hydro, bio-mass, wind etc.,the significance
of solar energy may be further recognized as superior for its free and continuous flow.
The development of modern technology like solar photovoltaic (SPV) cell has sparked its
possible use both in terms of scale and geographic distribution linked to end use needs.
The main objective of the present study, based on a survey project, is to ascertain
and assess the impact of guaranteed supply of power using SPV system, on the economic
and social life of the people of an island, Sagar Dweep. The plan of this report is as
follows.
In the next section the limitations of the conventional sources of power supply has
been discussed briefly. This would help in appreciating the possibilities and potentialities
of the use of non-conventional energy. The history of the use of solar power has been
described in brief in the section three. A comparative analysis of costs of conventional
methods of power supply and power from SPV plant has been presented in section four.
A brief description of the socio-economic profile of the island, Sagar Dweep, has been
presented in section five. Section six is devoted to a detailed presentation and analysis of
the survey result. Finally, section seven presents the concluding remarks.
4
2. Limitation of the conventional sourcesThe first and most significant problem of supply of conventional power lies in the
dependence on resources which are exhaustible. Even if we think globally, the existing
quantity may be used for some more years to generate energy. But in countries like India,
which do not have enough natural resources and have to depend on the import of fuel, the
rapid upward shift in the cost of imported oil has increased the cost of generation of
electricity significantly over the years. In India till now electricity has not reached in
80000 out of 576000 villages. On the other hand, the estimated coal and oil reserves are
66 billion tons and 770 million tons, respectively, and the corresponding per year
requirements are 260 million tons of coal and 70 million tons of oil (Saha, 1999). It is
clear from this that one single energy technology cannot be adequate to meet the energy
requirement in India. So it is high time for us to identify which specific technology or
which other sources of energy can be harvested to bridge the gap between demand and
supply.
The second major problem is that the use of fossil fuel is increasingly recognized
as a prime threat to human health resulting in disruption of normal human activities.
Emission of CO2, nitrogen oxide and sulfur dioxide react in the atmosphere to form acids,
that fall as rain, snow or fog or turn to acid on direct contact corroding constructions and
damaging vegetation, soils, rivers, lakes and crops.
Thirdly, though the necessity of power is unquestionably recognized, nearly half
of the global population does not enjoy its benefit due to the distance from grid point or
because of small local demand which does not justify the interconnections of locations
that can not be connected readily. In India, in 18000 villages, of which 900 villages are in
the state of West Bengal, grid supply is very difficult due to remoteness. The cost of
centralized network of fossil fuel based electrification in such places would be
prohibitively high. Even in the case of localized centre for power generation the cost of
transportation of fossil fuel to remote areas should be compared with that of transmission
cost for centralized electricity production. Therefore, as an alternative, or at least as a
complementary to the grid power, decentralized small-scale and renewable energy

5
technologies can play a very important role in these regions in helping the process of
development. ‘To achieve energy self-sufficiency, rather than self reliance, is becoming
new major development goal’(Penner and Icerman, 1975, ch.14).
It seems, therefore, that for the new supplies of energy, the possibilities of
exploiting decentralized locally available non-conventional sources of energy, like solar
energy, must be explored along with the conventional source of power. Apart from the
economic, social, and environmental advantages, the use of such technologies may be
justified in the following ways. Firstly, solar energy is a continuous flow of energy
whether we use it or not. Secondly, the technologies based on such renewable resources
are flexible, easy to understand and hence can be used without requiring highly skilled
personnel. Thirdly, the technologies are matched both in terms of scale and geographic
distribution linked to end use needs, and can take advantage of free distribution of
natural energy flows. Further, these technologies can be operated at high capacity with
low loss of power. Operation and maintenance are simple and do not need any raw
materials or components except battery upkeeping and maintenance of a clean surface
over the modules calling for attention from time to time. These features are attractive and
conform to appropriate technology as necessary for remote places. SPV system judged
from this aspect score as best amongst all other renewable resources.
3. History of Solar energy useThe use of solar energy is not new. It was there in ancient times, though on a
limited scale. Solar heating was first done by J. Priestly in 1774. A unit producing a
maximum of 6000 gallons of fresh water per day, using solar energy, was set up in the
mines in the North Chillean desert in 1872 and it continued to supply fresh water for 40
years. Solar heated system boilers were developed and demonstrated in exhibition in
1878 in Paris. But the development of production of power using other energy sources
like fossil fuels led to a neglect, so to say, in developing technologies based on solar
energy, though the importance and efficiency of solar energy in remote areas were
realized. It was only since around 1950’s that modern technologies for production of
solar energy started. The development of solar photovoltaic cell (SPV), the technology
which is more modern and less sensitive to system size, is indeed an achievement. In this
6
technology solar photovoltaic cells convert solar light directly to electric current through
the electronic structure. It can be used in a system as small as the size of a wrist watch or
as large as a power station. The use of SPV in the space programme is now well
recognized. It is being used directly in different fields viz.; domestic power supply,
industrial power supply like garden lighting, communications, signal lighting, telephone,
electric fencing etc. Apart from these the supply of grid quality power through SPV
power plant has also started as an alternative to grid power though not in a large scale. A
SPV plant consists of solar arrays, charge controller, battery system, inverters,
distribution lines etc. The power generation arrangement does neither have any fuel input
like in conventional system nor there is any rotating part to develop wear and tear.
Exclusive of basic materials making solar cells which are imported, complete equipment
is manufactured on indigenous technology and developed to international quality
standard.
4. Comparative assessment of different modes of electric supplyUse of power generated through off-grid power plants e.g., solar energy through
SPV plant, has already been recognized as a possible alternative from the technological
point of view. What is now needed is to assess specifically, the (a) economic, (b)
environmental and social viability of its use.
(a) Economic aspect
So far as the economic viability is concerned, one has to look at the cost structure
of the production of solar energy and compare it with those of the major conventional
sources, by taking into account both the direct and indirect costs incurred at different
stages of production and distribution.
The cost of energy in the fossil fuel based centralized power stations consists of
the generation, transmission and distribution costs, whereas in the decentralized power
generating system energy cost is primarily the generation cost.
While a thermal power station (coal based) enjoys its economy of scale in generating
power in large scale and distributing a significant part through high tension lines for

7
industrial consumption, it suffers a diseconomy of scale in distributing power through
medium/low tension line in rural areas and in places located far away from the centre.
This high distribution cost is associated with high line loss which increases with the
distance from the grid point and with low capacity utilization due to lack of adequate
demand for power specifically in the rural areas characterised by the absence of industrial
activities in a large scale.
The per unit cost of generation of power by conventional systems, coal and diesel
based, and also by the SPV system have been estimated and presented in Table 1 for a
comparative study1. The result shows, quite expectedly, that centralized thermal system
produces power at the lowest cost compared to the other systems because of its large size
resulting in scale economy and greater efficiency in generation which is not possible in a
locally installed plant of smaller size adjusted according to the local demand. The cost in
another conventional system, diesel generator, is comparatively high due to its high
operation and maintenance cost, shorter system life and high fuel cost. This cost is
highest in SPV plant primarily due to its high capital cost2.
The cost incurred for distribution of power from a centralized conventional
system to the distant areas from 33KV grid point, presented in Table 2, is quite high
compared to its generation cost (which is zero in case of decentralized SPV system). The
cost of distribution network depends on the length of the 11 KV line along with
substation cost, transformer rating or peak demand and the demand of the area i.e. load
factor. Assuming peak demand/ transformer rating to be 25 KW which is usually used for 1 The per unit generation cost in diesel based system and in SPV system have been estimatedusing information collected from the existing plants in the island, considered in the study, the‘Sagar Dweep’. Here due to high cost of diesel fuel two out of three generators with 160 KWcapacity run four hours a day. On the other hand, all the SPV plants each with 26 KW capacityrun five hours a day. Hence, the estimated load factor is found to be very low in each of the cases.
2 Theoretically, the generation cost in diesel based system would be cost effective as consumerdemand increases because of higher load factor and greater capacity utilization. But in case of aremote region continuous increase in price of diesel because of high transportation cost alongwith high import duties, the diesel system may not be cost effective in future compared to SPVsystem, the price of which is gradually declining as a result of continuous development oftechnologies.
8
rural areas and 20 per cent load factor, it is observed that the distribution cost /kwh is
sufficiently high and increases with the increase in the length of the line3. In addition to
this, the cost of energy increases further due to heavy line losses at the time of
transmission and distribution. These line losses have gone up steadily in India during the
last two decades. The national average of the loss is now 21 per cent of the production
whereas in the rural areas it may have gone up even to 40 percent of the production.
As mentioned earlier, one has to have a critical minimum size power plant and
there may be a loss due to excess production and supply of power for which there is no
demand. It has been estimated that for supplying 1 kwh in rural areas a plant producing
1.67 kwh has to be set up (Sinha and Kandpal, 1991). Considering this amount of loss
due to excess production, the cost of generation of utilized power from the grid in rural
areas goes up to Rs 3.95/kwh. Adding this cost to the amount due to distribution network
would give the cost of delivered power (presented in Table 3). Comparison of the direct
cost per unit of delivered power from three sources indicates that the cost of conventional
energy is much lower in the vicinity of the supply point. On the other hand, with the
increase in the distance from the centralized supply point the use of locally generated
power from solar energy is gradually becoming more viable.
The most significant problem of supply of conventional power lies in its
dependence on the limited exhaustible resources as against the unlimited supply of solar
power in SPV plants. Even if we think globally, the existing quantity of fossil fuel may
be used for some more years to generate energy( Saha, 1999). The U.N. conference in
Rio-de-jenerio, held in June 1992, addressed itself to the challenge of achieving
worldwide sustainable development and it was felt that it cannot be achieved without
major changes in the world’s energy system. In countries like India, dependent mostly on
3 The cost has been under-estimated because of the following assumptions included in the estimation: (1)the cost of supply upto the 33 KV grid point, which could be realized by supplying power for industrialconsumption at a higher rate, has not been included in the distribution cost in the rural areas; (2)consideration of 20 per cent load factor as average demand, which is difficult to be realized in remote ruralareas.

9
the import of fuel, the rapid upward shift in the cost of imported oil has increased the cost
of generation of electricity significantly over the years. On the other hand, the cost of
SPV cells is declining progressively over time as a result of Research and Development
(R & D) (see Table 4)4. So a time would come when the per unit energy cost from the
SPV plants would be comparable with that of the centralized system at all levels for a
rural electrification programme.
Assuming the same rate of change of prices of capital goods and fossil fuels
(given in Table 4) for the years up to 2010, the costs of delivered power supplied by coal
based thermal plant, diesel based system and SPV plant have been estimated separately
and have been presented in Table 5. The analysis of the results indicates that compared to
SPV system the use of diesel fuel in power generating system will not be viable beyond
5 km distance even in the year 2005. As we are to depend on imported oil for
consumption there is every possibility of increase in price of oil enhancing the diesel fuel
further5. On the other hand, coal based thermal power plant would be viable up to the
year 2005 only up to a 10 km. distance. SPV system would be economically cheaper by
the year 2010 than the coal based thermal system in remote rural areas even for a distance
of 5 km. It may be further mentioned here that because of the continuous research on the
development of thin film, the use of solar energy for the power generation is expected to
become more cost effective by the year 2005.
However, the estimation of only the direct cost is not sufficient to justify the
investment involved in each of the systems. One should also include the indirect impact
of such investments of the cost of generation. One of the most significant indirect effects
of investment in solar SPV power plant is the saving of exhaustible resources like coal /
diesel needed for the generation of electricity. The generation of one kwh power using
solar energy saves at least Rs. 4.38/kwh at 1999 price level by saving the consumption of
4 The present average cost of SPV plant of one kw capacity is Rs.0.27 million which indicates a10 per cent decrease in the price within the last one year.
5 The evidence from the specific case of island shows that the price of diesel has gone up bynearly 18 per cent during 1999 to 2000.

10
0.35 lt. of imported diesel oil resulting in the saving of foreign currency of about $0.10 at
the 1999 exchange rate. This saving amounts to Rs. 1.16 at 1999 prices by way of saving
of 0.7kg. coal in generating one kwh power by the thermal system. Further, the high
transmission and distribution losses over a long distance from the grid point to a remote
area is also a social cost, the impact of which has to be taken care of at the time of
estimation of production cost. On the other hand, supply from local centre through
renewable sources is much more assured with almost zero loss in distribution.
(b) Environmental Aspect
The use of fossil fuel is increasingly being recognized as a prime threat to human
health, environmentally one of the most disruptive human activities and one of the prime
causes of global warming leading to the change in agricultural production and other
catastrophic events. In our country electricity generation sector alone contributes 40 per
cent of the total emission of CO2 from the use of the energy (Murthy et al., 1997). An
estimate shows that emission of carbon dioxide to the atmosphere amounts to about 1.2kg
and 0.9 kg per kwh produced from coal and oil, respectively (Meidav, 1998). This
environmental cost, called externality cost, of generation of energy which has negative
impact on human health and habitat, is not included in the calculation of per unit
production cost of energy. This cost may be estimated indirectly by considering the cost
of remedial activities such as the cost of planting trees for absorbing the CO2 of
equivalent amount. The willingness to pay for the preservation of human habitat, or for
avoiding damage to human health due to the environmental degradation are also ways of
estimating the external cost. The estimates of external cost associated with different
fuels, which are ($/kwh) 0.05 for coal, 0.03 for oil and 0.02 (Meidav, 1998) for
natural gas indicate the significance of such costs, inclusion of which in the production
cost of energy through conventional systems would increase it to a significant level. The
production of power from solar energy like other non-conventional energy sources is free
from such pollutive consequences.
In another estimate by the World Health Organization it is seen that the external
effects account for more than 3.5 million of deaths of children under the age of five years

11
each year due to respiratory problems. The respiratory and other diseases associated with
coal burning affect 14 per cent of China’s population11. The indoor air pollution for
burning of bio-mass fuel for cooking is not only high but also common in rural areas in a
country like India. The high incidence of the use of biomass fuel is owing to its easy
availability and low or zero cost. The solar energy may not still be an economically
viable source in this regard, but it can partially replace the use of oil for light, and may
reduce, though in a limited scale, the adverse impact of oil burning on human health.
Hence, the indirect costs associated with the production of energy by the conventional
systems must be included in the estimation of production cost to obtain the true economic
value. This would help in assessing the economic viability of the SPV system in the
context of rural electrification programme.
(c) Social Aspect
The most significant social benefit of the use of decentralized energy sources is
that it can be made available to isolated and remote areas, like islands. In India in 18000
villages, of which 900 villages are in the state of West Bengal, grid supply is very
difficult due to the remoteness of location and / or being isolated from mainland. The cost
of coal based electrification in such places, either from centralized network with high
transmission and distribution loss or from localized centre with high cost of
transportation of fossil fuel, is prohibitively high. The only possible source of
conventional power from diesel generation on the island itself, adjustable with local
demand, does not also prove to be viable for increasing price and high transportation cost
of diesel. Under this situation non-conventional power like solar power may be taken as
the best possible way of power supply in such places. Admittedly, in places like the
island under consideration, the demand is at present low primarily due to the low
purchasing power of the local people. However, with the improvement in the standard of
living of the people, the demand is expected to increase and one can imagine that supply
of energy is essential in bringing about such improvements. Supply of power is to be
ensured for the development of small industries, to facilitate irrigation for agriculture, for
promoting trade and business during extended hours, to help in studies and human capital

12
formation and for many other developmental activities of sustainable nature. Remote
regions may find that the local supplies, though more expensive from the point of view of
financial cost than the grid connected electricity, is the only viable solution to
electrification. The case of Sagar Dweep, an island in West Bengal in India, is an ideal
case for a study of the socio-economic impact of power supplied by SPV plants.
5. Socio-economic profile of Sagar Dweep
5.1 General description of Sagar Dweep
The Sagar Dweep lying in the Sundarbans area in West Bengal is unusual in more
ways than one. It is a part of the vast delta of the Ganga – an area characterised by
mangrove swamps and islands interwoven by a network of small rivers and waterways.
The tidal swamp forests of the delta with its unique eco-system is the habitat of the
endangered Royal Bengal Tiger.
Sagar Dweep with an area of around 300 sq km, is a large island in the estuary,
about 90 km south of Kolkata. It is accessible by road and a regular ferry service links
Kacuberia, a village on the island, to the mainland, which is 6km away, across the
Muriganga River. With a population of 1,50,000 spread over 16 villages, farming and
fishing are the main occupations on the island. Besides the usual food crops like rice,
lentils, bananas and vegetables, cash crops like betel leaves (pan), chillies, water melons,
etc. are also grown. Prawn cultivation for export is a new development on the island and
some Kolkata based business houses have already started their operations on Sagar.
Located at the point where the river Hoogly enters the Bay of Bengal, Ganga
Sagar is also a sacred place of pilgrimage. It attracts thousands of devotees each year,
especially during the annual Ganga Sagar Mela (fair) which is held during Makara
Sankranti in mid January.

13
5.2. Existing sources of fuel and light
Presently, the households can enjoy only a limited number of hours of
illumination based on kerosene and diesel. The West Bengal State Electricity Board
(W.B.S.E.B.) supplies electricity through the diesel driven generators with a capacity of
300 KW to only 650 consumers concentrated in places along the side of the main artery
road of the island for 4 hours a day. A programme for introducing new lightning
technology, solar lantern, in place of existing exhaustible resource based kerosene lamp,
was launched in 1994 in this island. The Lantern works for about 4 to 5 hours after full
charging of the battery through solar photovoltaic module of capacity 12wp. The
subsidised price of a solar lantern varies from Rs. 2,500.00 to Rs. 3,000.00. Besides this,
home lightning system and solar-street has also been introduced in the island. The home
lighting system comprises two light points and one portable TV point. This is the most
popular Solar Photovolataic unit in the Sundarbans. Cost of a complete solar home
lighting system varies from Rs.14,000.00 to Rs. 16,000.00 depending on the site of
installation. Stand-alone solar street lighting system comprises a CF lamp, two modules,
battery poles and other accessories. Generally the street light operates for 12 hours. The
subsidised price of a solar photovoltic light varies from Rs. 13,000.00 to Rs. 14,000.00.
To supply power on a much larger scale and to electrify the interior places of the
island the first SPV power plant was established towards the end of 1995 in Kamalpur
village. The plant started supplying power at the beginning of 1996. The next plant was
installed in the year 1998 at Mrityunjoy Nagar and three others were started in the year
1999 at Khasmahal, GayenBazar and Mahendragange. Each of these SPV power plants
has a capacity of 25KW and can take a load of 3 light points and two plug points. The
tariff structure for the SPV power plant is Rs. 120.00 per month for 5 hours of operation6.
Till the beginning of 2000, 475 consumers have been served through these five SPV
power plants.
6 The funds for investment for installing the SPV plants, here, have been taken as loan fromWorld Bank at one per cent rate of interest, and the maintenance works are being done by therespective suppliers of the machines. Therefore, the cost of generation has been estimated asabout Rs. 8.0 per unit , which is charged as price per unit of power delivered.

14
6. Survey results
6.1. Data and Methodology
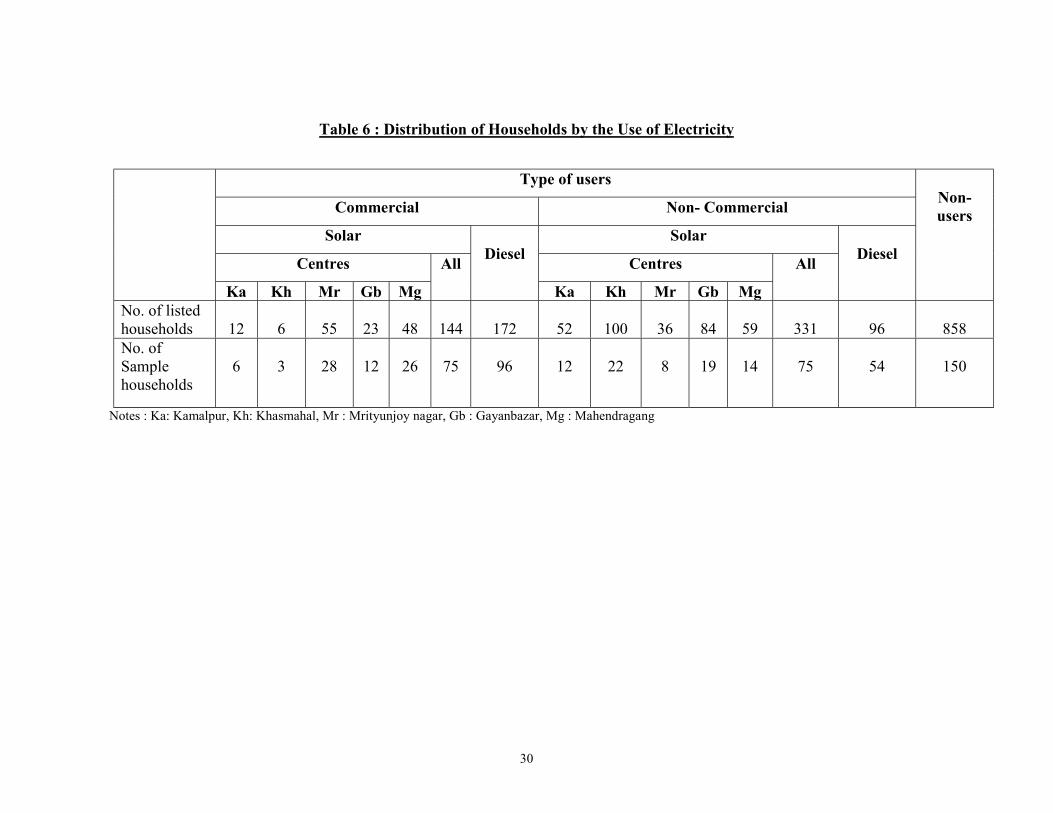
The study is based on a sample survey. A multistage sampling method was
adopted to select the sample separately from solar-power users, diesel generator power
(supplied by W.B.S.E.B) users and non-users.
Solar PV
Samples were collected from each of the five SPV centres. At the first stage of
sampling a list of users along with their address was collected from the respective
centres. Information was also collected on the purpose of use (e.g. domestic/
commercial). In the next step the users were stratified by these purposes. At the final
stage samples were selected from each stratum in each of the five centres with sample
proportion equal to the population proportion of the stratum. The overall sample size is
150.
Diesel Generator Centre (supplied by W.B.S.E.B.)
In this case an initial list of users by place of use was collected from the SEB
office. Two types of stratification were made in the second step, viz, by place of use and
then by purpose of use. In the next step three places were selected purposively. These are
for getting a comparative analysis between solar and diesel users. But the sample selected
from W.B.S.E.B. centres and those from solar centres are independent. The total sample
of 150 users have been taken using the proportional sampling scheme mentioned above.
Solar-nonusers
In selecting samples from this group, we have considered only solar-nonusers as
the characteristics of diesel non-users are similar. To get a full list of non-users, a listing
schedule was canvassed among the establishments (households plus commercial) residing
in the electoral booths rather than individual villages as the administrative boundary of a
village is too large to make such a listing. In the next stage, the units were stratified into
15
two groups, those having and not-having electric line (solar or diesel) in their locality.
Then an equal number of samples were selected from each of the two strata. Here again
the total 150 samples were drawn using the above scheme. The distribution of sample
households for all three cases has been shown in Table 6.
6.2 Analysis of the resultsIt should be noted that in the island the consumers of W.B.S.E.B. have been
enjoining the benefit of power for quite a long time but for limited hours. As a result they
might have better experience of the impact of electricity on their socio-economic life and
environment. On the other hand, only few have a maximum of four years of experience
with solar power on a limited scale with most of them having only two years of
experience. Therefore, proper assessment of socio-economic impact of solar power on the
people of the island may not be possible. However, it is observed from the results that
solar power has induced significant development in the island with respect to various
socio-economic and environmental aspects.
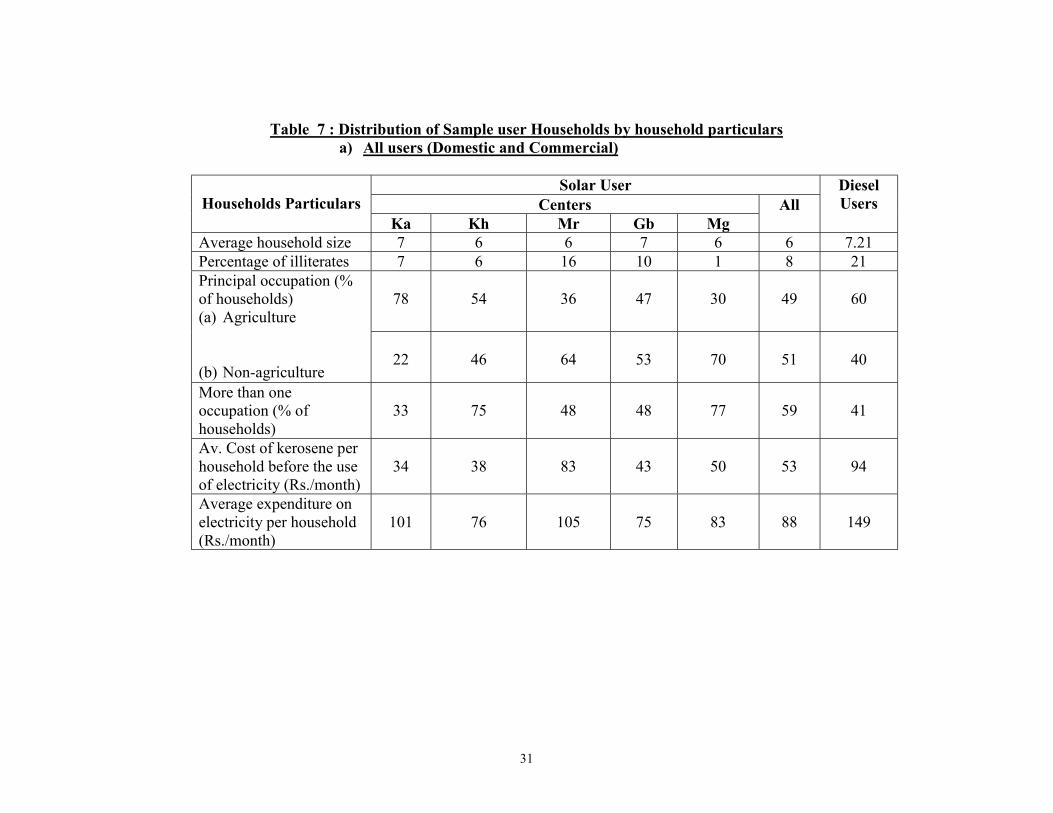
The results obtained from the survey data on solar as well as diesel users have
been presented in different tables. Table 7a shows that the average household size of the
solar users is 6, which is 7 in case of diesel users. It is interesting to note that the
proportion of illiterates is much lower among solar users (7 percent) compared to diesel
users (21 percent). Agriculture is the primary occupation of the 49 per cent of the sample
households using solar power, whereas 51 per cent have non-agricultural occupations.
The situation is reverse in case of diesel users where more households are engaged in
agricultural activity (60 per cent) and the remaining are in non-agricultural activities as
their principal occupation. In both the cases a substantial number of sample households
have more than one occupation (59 per cent for solar users and 41 per cent for diesel
users). It indicates that they are enjoying the benefit of power by engaging themselves in
different economic activities.
It is seen from the table that solar users, at present, are willingly spending, on an
average, Rs. 88 per month on electricity, which is much higher than that which they used
to pay for kerosene before getting power (Rs. 53 per month). In case of diesel users these
16
costs are Rs.149 and Rs.94, respectively. From some additional information collected for
the solar(domestic) users it is seen from Table 7b that about 71 per cent of the
households live in kachha houses. Only a few (13 per cent) live in pacca houses and the
remaining live in semi-pacca houses. The main sources of fuel for cooking for them are
wood and cow-dung. About 43 per cent of them have latrine in their houses. For all of
them tube well is the major source of drinking water, while some also use pond or other
sources of water. It may also be noted that because of limited hours of supply, along with
electric power they have to use kerosene for light. On the other hand, the proportion of
kachha house is much lower in case of diesel users as they reside in a relatively urbanised
area. But along with the others they too use wood and cow-dung as fuel for cooking.
Surprisingly a few households have their own latrine. Majority of them (92 per cent)
fetch drinking water from tube wells and none of them uses pond as a source of drinking
water. Because of limited hours of services most of them (89 per cent) also use kerosene
for light along with electricity.
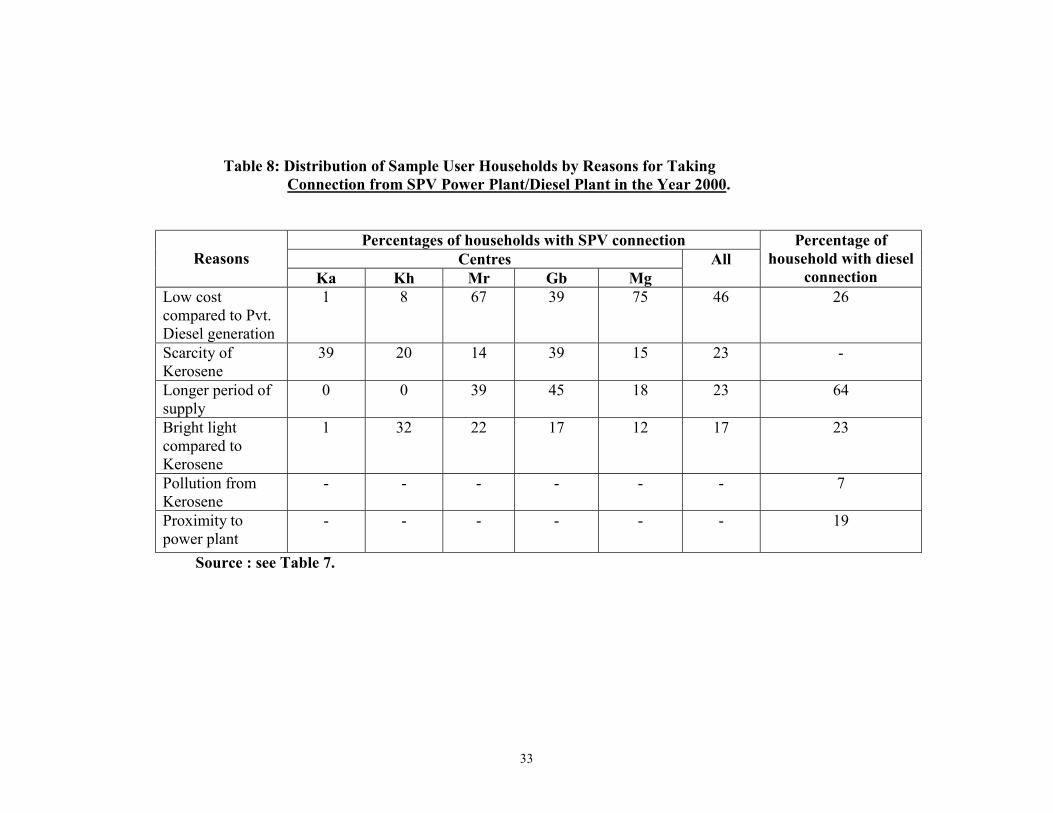
The distribution of households by reasons for taking power connection is
presented in Table 8. The reasons given by the solar users were as follows: as the
authority postponed the programme of electrification by using diesel oil for high
generation and distribution cost, there was only one alternative source of power supply
which was through private diesel generator. The cost of that power was too high and
supply was also restricted to 4 hours in the evening. Solar power was cheaper compared
to that and the period of availability was longer.
Other important reasons for demand of solar power are the scarcity of kerosene
and brightness of light. Though the cost of kerosene is lower (see Table 7) as it is
obtained from public distribution system (PDS), it is not available regularly and the price
is increasing over time with the scarcity in supply. On an average one consumer requires
at least 12 litres of kerosene for lighting. The cost of this was Rs. 39 at PDS rate in 1999,
while the open market price was Rs. 120 for the zone. At the present PDS price rate the
cost is Rs. 96 for the same amount; but this is also higher than the for solar power.
Besides these, the level of illumination from solar power is 12 times better than that from
kerosene lamp. If this benefit is considered then the consumer may save a considerable
amount from using solar power.
17
To the diesel users the longer duration of period as well as brightness of light
compared to light from kerosene are two important reasons (64 per cent and 23 per cent
respectively) for demand of diesel power. 19 per cent of the households has also
mentioned the proximity to power plant as a reason for taking electric line. Like solar
users, they have also mentioned about the high cost of electricity supplied from privately
owned diesel generator.
Though the solar power plant has been supplying electricity since 1996, till the
time of survey most of the users have gathered only two years of experience on the use of
solar power. So it is difficult to develop various activities within this short spell of time.
In spite of this like diesel users the solar users have been able to recognize the benefits
they have obtained from the supply of solar power. Results depicted in Table 9 show that
supply of solar power has been a great boon to the students in terms of longer study
hours. They are now getting, on an average, an extra amount of 2.25 hours per day for
their study. Further opening up of a tutorial home has helped the students to a large extent
in carrying out their studies.
The solar users engaged in cultivation of betel leaf have also benefited from
power supply as a significant part of their work like arrangement of leaf for supply,
watering in the field etc. can be done now smoothly at night.
Like diesel users they have also mentioned that the higher illumination of solar
light facilitates indoor work. Women can work easily at night and save time for cooking.
This can save cooking time at night by 1.5 hours which can be used for other purpose.
Trade and business have been continuing their activities at night for a longer
period and serving more customers. Markets have developed, though on a small scale,
with new activities like small battery charging centre, video shops etc.. As a result of
extended hours of work in the existing activities and the initiation of new activities there
is likely to be an increase in income of the people of the island. This view has been
supported both by solar users and diesel users. The supply of power has also helped the
people to avail themselves of the entertainment facilities like television, musical system.
They are also enjoying physical comfort by using electric fan.
It may be mentioned here that a large majority of diesel users, who have longer
period of experience with light in the island, have reported that they have benefited from

18
entertainment and extended hours of work in business and trade (90 per cent and 94 per
cent respectively). One can, therefore, expect that there will be social and economic
development in the island in future by increasing the power supply from solar plant.
It is stated that burning of kerosene oil for light and fuel has a number of adverse
effects, both short and long term, on human health. However, while it is difficult to
identify the long term effect, one of the short term effects is the eye problem. About 21
per cent of solar users and 7 per cent of diesel users have reported that their family
members suffered from eye problems (see Table 10), which could have been avoided by
using electric power. Another observation is that a significant proportion of the solar-user
households (49 per cent) are aware of the fact that there exist environmental problems in
generating power using oil, while the use of solar energy is free from such problems. But
the more interesting observation is that, though 88 per cent of the diesel users are aware
of this fact, most of them would not like to switch to solar power due to its high cost
compared to diesel power (which is subsidised).
Despite higher cost, the people, irrespective of their income level, are demanding
more power now for entertainment, comfort and development work. Presently solar users
are paying Rs. 8.0- per unit. It is observed from Table 11 that about 57 per cent of the
solar users is willing to pay an extra amount over and above the per unit charge they are
paying now. More surprisingly, though about 75 per cent of them is willing to pay less
than Rs. 2, about 14 per cent is ready to pay an extra amount of more than Rs. 5 over and
above the current rate of payment. In case of diesel users, percentage of households
willing to pay more for diesel power is about 93 which quite natural for its lower price.
Among them 45 per cent is willing to pay more than Rs. 5 over and above the present per
unit charge of Rs. 3.
From the above analysis it may be concluded that all users of power, be it diesel
or solar, demand the service. Some of them are also willing to pay more over the current
rate to continue with the service. An interesting feature to note is that though solar users
are paying more than the diesel users, they would still like to continue receiving the
service as they do not have any other alternative.
19
It has already mentioned that to find the demand for electric power another set of
samples has been drawn from non-users within the solar power plant area whom we call
solar-nonusers(SNU). An analysis using this sample shows that the general
characteristics of the SNU are same as power users (both solar and diesel) (see Table 12).
The average household size is 6 and percentage of illiterates is 17, which is relatively
high compared to solar users. They mainly depend on kerosene for their light, average
cost of which is Rs. 52 per month per household. Their major activity is agriculture and
45 per cent of them have more than one occupation, 83 per cent of the houses are
kachha, only a few (4 per cent) are pacca houses. All of them use wood and cow dung as
fuel for cooking, 99 per cent of the households use water for drinking from tube well and
the average distance of source of drinking water is about 383 meters from home.
Table 13 depicts the reasons they have given for not taking power connection till
date. 43 per cent gave economic reasons, that is relatively high cost of solar power, 60
per cent of the people gave reasons as insufficiency / non-existence of power supply.
However, if the problems can be solved all would be willing to get the service.
The experience of the solar users in the neighbouring places has also helped them
to realise the benefits of light. In their perception, they would be benefited in many ways
like solar users if the service is provided to them (see table 14). The data also show that
although they do not belong to beneficiaries, 14 per cent of them have expressed their
willingness to pay an extra amount over the existing charge.
Regarding the choice of source of light, Table 15 shows that among the users of
power as well as non-usersthose who are willing to get electricity, 39 per cent of them are
in favour of diesel power supplied by W.B.S.E.B. because of its low price, though they
are aware of the fact that there is a problem of pollution in generating power from diesel.
However, 61 per cent prefer solar power to avoid the pollution problem.
It is observed from the above descriptive statistics that there is high demand for
electricity among both the users and non-users of power. Many households are even

20
willing to pay an extra amount for the service. The average willingness to pay per unit
over the existing rate by the respondents is Rs.2.09 for solar users, Rs.0.24 for diesel
users and Rs 2.91 for non users (see Table 16). If all the users and non-users are
considered then the respective values are Rs. 0.97, Rs. 0.18 and Rs. 0.41 per unit over the
existing rate.
To find out the factors which may affect the willingness to pay higher than the
existing rate separate logit models were fitted for solar users, diesel users and solar non
users. We confine our attention to domestic users only to utilize the data on household
related variables.
The dependent variable is a binary variable taking the value of 1 if the household
is willing to pay more than the existing per unit charge for electricity, and 0 otherwise.
The possible explanatory variables are taken to be
i) Households size (HHS)
ii) Occupation dummies defining six categories of occupations, viz oc1:
agriculture; oc2 : services; oc3 : business; oc4 : teacher; oc5 : technical
professional; oc6 : others.
iii) Dummy variable indicating whether or not the household has more than one
occupation (OMO)
iv) Percentage of Illiterates in a household (PIL)
v) Perhousehold Expenditure on Electricity (PCE)
vi) Perhousehold Expenditure on Fuel (PCEF)
vii) Percentage of Students in a household (POS)
viii) Highest Education Level in the household (HYE)
ix) House Type – Pacca, Semipacca = 1; Kachha = 0 (HT)
x) Dummy variables indicating whether or not the household is aware of the
pollution from diesel generated electric power (AW).
The Logit models for diesel users and non users of electricity failed to provide
any significant explanation in terms of these variables. Possibly for these groups the
21
decision on willingness to pay is influenced by some other factors other than the ones
listed here.
However, for solar users some plausible results were obtained. These results are
presented in Table 17. The effects of HHS and PCE are significant at 5% level, while
those of OMO, POS and HT turn out to be significant at 10% level. Coefficients of HHS,
OMO, PCE and HT have positive sigh, indicating that (i) probability of willingness to
pay increases with household size and perhousehold expenditure on electricity (i,e. those
who are already paying more are likely to be willing to pay even more); (ii) households
having more than one occupation and households with pacca houses are likely to pay
more for solar power.
Coefficient of POS turns out to be negative. This implies that probability of
willingness to pay decreases with an increase in the percentage of students in households.
This may be due to the fact that as the household already incurs some expenditure on
education, it is unlikely to be able to bear the extra cost for electricity.
7. Summary and Concluding RemarksIn rural India inadequate supply of electric power is the major constraint of
development process. This is more severe in remote areas where supply through
conventional system is either highly expensive or almost impossible. As a result the
government’s programme for total electrification in rural remote places could not be
successful through the conventional system. Alternatively, an attempt is being made to
electrify rural remote areas by abundant renewable resources like hydro, bio-mass, wind,
solar etc. Amongst these, solar energy may be considered to be superior for its free and
continuous flow. A comparative analysis shows that the production of solar power is not
yet viable in terms of financial cost involved, but the social and economic significance is
also much higher in the remote areas like forests, islands etc. This is important from the
point of view of total electrification programme. Sagar Dweep in West Bengal, India is
22
an example in this regard. In this island the extension programme on power generation
through conventional diesel generator system was postponed due to its increasing cost of
production. As a result the solar system was implemented few years ago to meet the
demand of the people of island.
Of course a maximum of four years of experience with solar light is not enough to
study the social and economic impact of any development work. But a comparative
analysis shows that even within this short spell of time solar power users have felt
improvement in different fields. According to them there has been an increase in
educational level of the people of the island, significant development has been observed
in the commercial activities also, as can be seen from the activities running for a longer
time compared to the pre-SPV period. Productivity of the people has also increased,
especially in case of cultivation of betel leaf. Other significant benefits being enjoyed by
the women in the island are their movement and carrying out of additional work at night,
which were not possible earlier. Some of them have also got engaged in other work, like
running tea stall, sewing etc.
Besides the above, a SPV plant is also supplying power to run a hospital, services
of which is essential to the society. Another essential service, the telephone booth, is
being run by the help of solar energy in an individual capacity.
Similar to diesel users the solar users are also demanding more power for
entertainment, extra work despite of higher cost. Like diesel users they have also
expressed their willingness to pay, although the factors affecting the decision for paying
extra amount are different for different types of users.
Another noticeable feature observed from the analysis that irrespective of their
preference for a particular type of supply of power almost all the users are aware of the
environmental problem related to the generation of power through conventional system
with diesel generator. Similar types of observation obtained from the non-users of power
residing within the solar power plant region indicate growing demand for power in the
island.
It may be concluded that when supply of electricity is a necessity for the
development process and its supply through conventional system is almost impossible,
decentralised non-conventional system like solar power should be implemented in remote

23
rural areas or areas cut off from the mainland even if it is not economically viable. In
trying to estimate the true cost of electricity generated by solar energy, it would be useful
to analyse how and in what ways availability of electric power influences the social and
economic life of people in such places. It is not easy to make proper valuation of all the
benefits but then these should not be ignored either.

24
Table 1: Cost of Generation of Power Through Thermal, Diesel Generator and SPV
Systems in the Year 1999.
Generating
system
Average
cost/KW
(Rs.’000)
Annual
capital
cost/KW
(Rs.’000)
Annual
O & M
cost/KW
(Rs.’000)
Annual
generation
at bus
(’000kwh)
Annual
fuel cost
(Rs.’000)
Total
cost
(Rs.’000)
Cost of
generation
(Rs./kwh)
Thermal 40.00 4.97 1.00 5.52 7.10 13.07 2.37
Diesel 12.00 2.12 1.20 1.28 5.58 8.90 6.97
Solar 300.00 38.28 7.50 1.75 --- 45.74 26.10
Source : Chakrabarti et al, 2001
Notes:
1. Annualized capital cost is based on capital recovery factor using (a) interest rate at 12 per cent, (b)discount rate at 12 per cent (c) system life as 30 years for thermal and 25 years for SPV systems and(d) annual operation and maintenance (O & M) costs are 2.5 per cent of capital investment.
2. Average capital cost of 1 KW capacity thermal plant has been estimated from a plant of 100 MWcapacity where the capital cost is Rs. 40 billion.
3. (a) Coal price has been taken as Rs. 1.65/kg. and consumption rate as 0.7kg. coal/ kwh; (b) oil pricehas been taken as Rs. 12.5/lt. and consumption rate as .35 lt./ kwh
4. PLF ( load factor) has been taken as 70 per cent for thermal power station, 16.7 per cent for dieselbased system and 20 per cent for SPV system. Internal consumption of power is assumed to be 10 percent for thermal system and 3 per cent for diesel based system.

25
Table 2: Distance-wise Cost of Distribution of Power (per kwh) by the ConventionalSystem in the Year 1999.
Distance (km.) from 33 KV grid pointItem ofexpenditure
5 10 15 20 25
Capital cost(Rs.Million)
1.5 3.0 4.5 6.0 7.5
Annualcapital cost(Rs.Million)
0.20 0.40 0.60 0.80 1.00
O & M cost(Rs.Million)
0.04 0.08 0.11 0.15 0.19
Total cost(Rs.Million)
0.24 0.48 0.72 0.95 1.19
Cost/Kwh(Rs)
5.44 10.88 16.32 21.76 27.20
Source : Chakrabarti et al, 2001..
Notes :
1. Cost per km of distribution line (11 KV) from the 33 KV grid point is Rs.0.3 million.
2. Rate of interest/ discounting has been assumed as 12 per cent and O&M cost as 2.5 per cent of capitalcost. Life of distribution line has been taken as 20 years.
3. Peak load has been taken as 25 KW whereas the average load has been assumed as 20 per cent of peakload.

26
Table 3: Cost (Rs.) of Delivered Power in A Remote Village in the Year 1999
Distance (km.)from 33 KV grid pointGenerating
system5 10 15 20 25
Thermal
Station
9.39 14.38 20.27 25.71 31.15
Diesel
generator
14.12 19.56 25.00 30.44 35.88
Solar PV 26.10 26.10 26.10 26.10 26.10
Source : Chakrabarti et al, 2001.
Notes: Cost of delivered power is the sum of generation cost of power supplied at bus and distribution cost
including cost for line loss. The line loss as a percentage of production has been taken as 40 for thermal
system, 21 for diesel based system and 0 for SPV system.

27
Table 4: Rate of Change of Cost of Different Items
Cost of items (Rs.’000 at 90-91prices)
Item
1990 – 91 1998 – 99
Rate ofchange peryear (per
cent)
‘A’ grade coal(per ton)
0.74 1.02 5.20
Diesel(per kiloliter)
3.66 5.02 4.00
Thermal PowerPlant (per kilowatt)
25.00 23.61 -0.70
Solar PV (per kilowatt)
400.00 177.04 -9.70
Distribution linecost (per km)
200.00 177.04 -1.50
Source : Chakrabarti et al, 2001..

28
Table 5 : Cost of Delivered Power by Distance for Different Power GeneratingSystems for the Years 2005 and 2010
Distance(km.) from 33 KV grid point
5 10 15 20 25
Sources ofPower
Generation
Year 2005
Thermal 9.55 14.60 19.64 25.45 29.69
Diesel 14.85 19.90 24.94 30.75 34.99
*Solar PV 15.18 15.18 15.18 15.18 15.18
YEAR 2010
Thermal 9.76 14.43 19.15 23.83 28.59
Diesel 15.76 20.43 25.15 29.83 34.54
*Solar PV 9.67 9.67 9.67 9.67 9.67
Source : Chakrabarti et al, 2001.
Note : * : Locally installed plant,
See note below Table 3.

29
30
Table 6 : Distribution of Households by the Use of Electricity
Type of users
Commercial Non- Commercial
Solar Solar
Centres Centres
Ka Kh Mr Gb Mg
All Diesel
Ka Kh Mr Gb Mg
All Diesel
Non-users
No. of listedhouseholds 12 6 55 23 48 144 172 52 100 36 84 59 331 96 858No. ofSamplehouseholds
6 3 28 12 26 75 96 12 22 8 19 14 75 54 150
Notes : Ka: Kamalpur, Kh: Khasmahal, Mr : Mrityunjoy nagar, Gb : Gayanbazar, Mg : Mahendragang
31
Table 7 : Distribution of Sample user Households by household particularsa) All users (Domestic and Commercial)
Solar UserCentersHouseholds Particulars
Ka Kh Mr Gb MgAll
DieselUsers
Average household size 7 6 6 7 6 6 7.21Percentage of illiterates 7 6 16 10 1 8 21
78 54 36 47 30 49 60Principal occupation (%of households)(a) Agriculture
(b) Non-agriculture22 46 64 53 70 51 40
More than oneoccupation (% ofhouseholds)
33 75 48 48 77 59 41
Av. Cost of kerosene perhousehold before the useof electricity (Rs./month)
34 38 83 43 50 53 94
Average expenditure onelectricity per household(Rs./month)
101 76 105 75 83 88 149

32
b) Domestic Users only
Solar UserCenters
HouseholdsParticulars
Ka Kh Mr Gb MgAll
DieselUsers
58 82 50 95 42 71 4733 14 13 0 29 16 23
Type of house (% ofhouseholds )1. Kachha2. Semi Pacca3. Pacca 9 22 37 5 29 13 30
100 100 100 100 100 100 1000 27 25 0 21 15 26
Fuel used for cooking(% of households )1. Wood & Cow-dung2. Kerosene3. others 8 23 0 37 42 25 11
Having latrine(% of households )
42 32 100 21 57 43 6
100 100 100 100 100 100 92
50 0 0 0 0 8 08 0 0 0 0 1 23
Drinking water1) Sourcesa) Tube wellb) Pondc) Others2) Average distancefrom house (meter)
563 264 231 228 257 312 162
100 100 12 68 71 77 89Sources of light (% ofhouseholds )a) Keroseneb) Solar/Diesel
100 100 100 100 100 100 100Source : Chakrabarti et al, 2001 and survey
33
Table 8: Distribution of Sample User Households by Reasons for Taking Connection from SPV Power Plant/Diesel Plant in the Year 2000.
Percentages of households with SPV connectionCentresReasons
Ka Kh Mr Gb MgAll
Percentage ofhousehold with diesel
connectionLow costcompared to Pvt.Diesel generation
1 8 67 39 75 46 26
Scarcity ofKerosene
39 20 14 39 15 23 -
Longer period ofsupply
0 0 39 45 18 23 64
Bright lightcompared toKerosene
1 32 22 17 12 17 23
Pollution fromKerosene
- - - - - - 7
Proximity topower plant
- - - - - - 19
Source : see Table 7.

34
Table 9: Distribution of Sample User Households by Type of Benefits Derived from Getting Power from SPV Plant/Diesel Plant
Percentage of households with SPV connectionCentresType of Benefit
Ka Kh Mr Gb MgAll
Percentage ofhouseholds with diesel
connection
Availability for longer periodfor study
67 80 28 54 30 47 52
Saving of time for cooking 56 80 17 48 13 38 40Movement at night 6 4 8 29 0 9 2Entertainment 17 28 39 13 8 21 90Time for household work atnight
6 48 22 10 2 17 11
Physical comfort 6 24 17 10 53 25 39Doing agriculture work at night 28 24 3 3 13 12 0Availability for longer periodfor trade and business
17 4 75 35 68 46 94
Increase in income for extendedhours of work
22 16 83 58 35 46 57
Source : See Table 7

35
Table 10: Distribution of Sample User Households Aware of Different Environmental Aspects of the Use of ConventionalResources
Percentage of households with SPV connectionCentresEnvironmental aspects
Ka Kh Mr Gb MgAll
Percentage ofhouseholds withdiesel connection
Problems in generatingpower from diesel
67 60 42 35 52 49 88
Suffering from eyeproblems owing to use ofKerosene
0 28 25 26 20 21 7
Source : See Table 7

36
Table 11 : Distribution of Sample User Households Willing to Pay (WTP) Extra Amount Over the Current Per Unit Chargeby Amount of Additional Payment:
Percentage of households willing to pay moreby amount of additional payment
Type ofUsers No. of
house-holds
% ofhouseholdswilling topay more
LessthanRe. 1
Rs. 1 <Rs. 2
Rs. 2 <Rs. 3
Rs. 3 <Rs. 5
Rs. 5 andabove
100 54 46 30 7 2 15
50 62 61 7 16 3 13
Solar users
3 Points5 PointsAll 150 57 52 21 11 2 14
Diesel users 149 93 53 3 - - 45
Source : See Table 7