a study on weed discrimination through wavelet transform, texture feature extraction and...
TRANSCRIPT

International Journal of Computer Science & Information Technology (IJCSIT) Vol 7, No 3, June 2015
DOI:10.5121/ijcsit.2015.7304 41
A STUDY ON WEED DISCRIMINATION THROUGH
WAVELET TRANSFORM, TEXTURE FEATURE
EXTRACTION AND CLASSIFICATION
D.Ashok Kumar
1 and
P.Prema
2
1 Government Arts College, Trichy, TamilNadu, India.
2Agricultural College and Research Institute, Madurai-625104. TamilNadu, India
ABSTRACT
Texture based weed classification has played an important role in agricultural applications. In the recent
years weed classification based on wavelet transform is an effective method. But the feature extraction is
main issue for proper classification of weed species. In this paper, the issue of statistical and texture
classification based on wavelet transform has been analysed. The efficient texture feature extraction
methods are developed for weed discrimination. Three group feature vector can be constructed by the mean
and standard deviation of the wavelet statistical features (WSF), Texture feature as Contrast, Cluster
Shade, Cluster Prominence and Local Homogeneity (WCSPH) and Energy, Correlation, Cluster Shade,
Cluster Prominence and Entropy features (WECSPE) which are derived from the sub-bands of the wavelet
decomposition and are used for classification. Experimental results show that Rbio33 Wavelet with
WECSPE texture feature obtaining high degree of success rate in classification.
KEYWORDS
Pre-processing, Wavelets, Texture Features, Neural Network.
1. INTRODUCTION
Unwanted plants growing in a place at the wrong time and wrong place in the field can be defined
as Weed. The weeds compete with crop for nutrient, water, light and space”. Controlling of weed
in the agricultural field is more expensive and time-consuming activities. Weed control is a
necessary management practice for all cropping systems. Weeds are controlled by manual
removal by labourer and applying herbicide uniformly within the field.
Actually the weed infestation rates vary from low to high densities. Based on the weed infection
some dosage of herbicide can be applied in the particular location an position.
Mostly all existing weed detection methods the image has been processed in two steps. In the first
step, segmentation of vegetation against the background (soil and/or harvest residues) and in
second step, detection of the vegetation pixels that represent weeds.
The vegetation can be extracted by combination of color planes such as HIS, RGB and YCbCr
method. Green vegetation segmentation can be achieved using vegetative indices techniques such
as excess green index (ExG), [1,2] the excess red index (ExR), [3], the excess green minus excess
red index (ExGR), Offset Excess Green(OEG)[4], vegetative index (VEG) [5],HIS color model
combined with classification methods such as Bayes networks and clustering [6]. The author [7]
has explained several vegetation segmentation methods for greenness extraction.

International Journal of Computer Science & Information Technology (IJCSIT) Vol 7, No 3, June 2015
42
Our approach Global Histogram Equalization with excess green index (ExG) pre-processing
techniques was designed to cope with the variability of natural daylight illumination. The
vegetation pixels have been identified, color, position, shape, texture features of weed has
extracted for classification. These features are depends on the way the photographic images are
taken and the weed species involved. Development of feasible site-specific weed control
technology makes the above property.
Wavelet transform is widely used in machine vision in an image processing technique for object
detection and classification. For real-time specific weed leaf discrimination that is employing haar
wavelet decomposition[8] and 200 highest coefficients was extracted, that is used to classify the
broad and narrow weed leaves using a classifier k-Nearest Neighbor (k-NN) and classification
accuracy is 94% for broad weed and 92% for narrow weed and 97% for little or no weed. The
overall accuracy for weed discrimination is 94.3%.
The author [9] reported that Symlet wavelet transforms along with stepwise linear discriminant
analysis (SWLDA) and support vector machines (SVMs) for crop and weed classification for real
time selective herbicides systems . Classification accuracy obtained using the symlet wavelet
family was 98.1%. To recognize radish and weeds from the field an artificial neural network
(ANN) was used and the successful recognition rate in the farms was 93.3% for radish and 93.8%
for weeds [10].
For automatic detection is based on machine vision or spectroscopy [11]. Geometrical, textural or
other statistical features are used to detect the weeds [3] particularly in machine vision methods
shape features can be used to discriminate between corn and weeds. Other features such as mean
of color information [12, 13] and non-morphological analysis based on the texture of the image
[13] are used for weed discrimination. For texture analysis [4] wavelet transform provide better
multi resolution analytical tool. Higher accuracy rate can be achieved in weed classification.
Texture image feature provides vital characteristics for surface and object identification from
image[14]. Major component of image processing is texture analysis and texture features are used
in many applications such as remote sensing, quality inspection, medical imaging, etc. So the in
this paper texture features are used for weed discrimination. Compared to other features color and
shape, wavelet based textures feature provide high degree of accuracy in weed discrimination for
site specific real-time for site-specific spraying of infested areas [15].
Our objective of the weed discrimination study was to develop weed discrimination image
processing algorithms that are based on texture feature of the image to detect broad and narrow
leafed weed with high accuracy without any prior assumptions about environmental factors such
as lighting conditions. Our proposed pre-processing technique global histogram equalization
method is used to normalize the histograms of the images to illuminate the lighting effect. The
vegetation extraction method Excess Green method (2G-R-B) is used to enhance the green pixels
of the image. After pre-processing, segmentation techniques have applied to retrieve the weed
portion of the image. The retrieved weed RGB image was given as input to the wavelet transform.
We evaluated and compared four different wavelet families such as symlet , Daubechies ,
biorthogonal and reverse biorthogonal wavelet family for weed classification. Using Gray level
co-occurrence matrix (GLCM) meaningful statistical and texture features are extracted from the
sub-band images and Neural Network techniques are used for classification. Our proposed
segmentation method and the reverse biorthogonal 3.3 wavelet families with texture features
such as Energy , Correlation, Cluster Shade, Cluster Prominence and Entropy (WECSPE) gave
the lesser execution time 19.20ms and higher accuracy of 98.9% for weed discrimination from
the agricultural field.
International Journal of Computer Science & Information Technology (IJCSIT) Vol 7, No 3, June 2015
43
2. MATERIALS AND METHODS
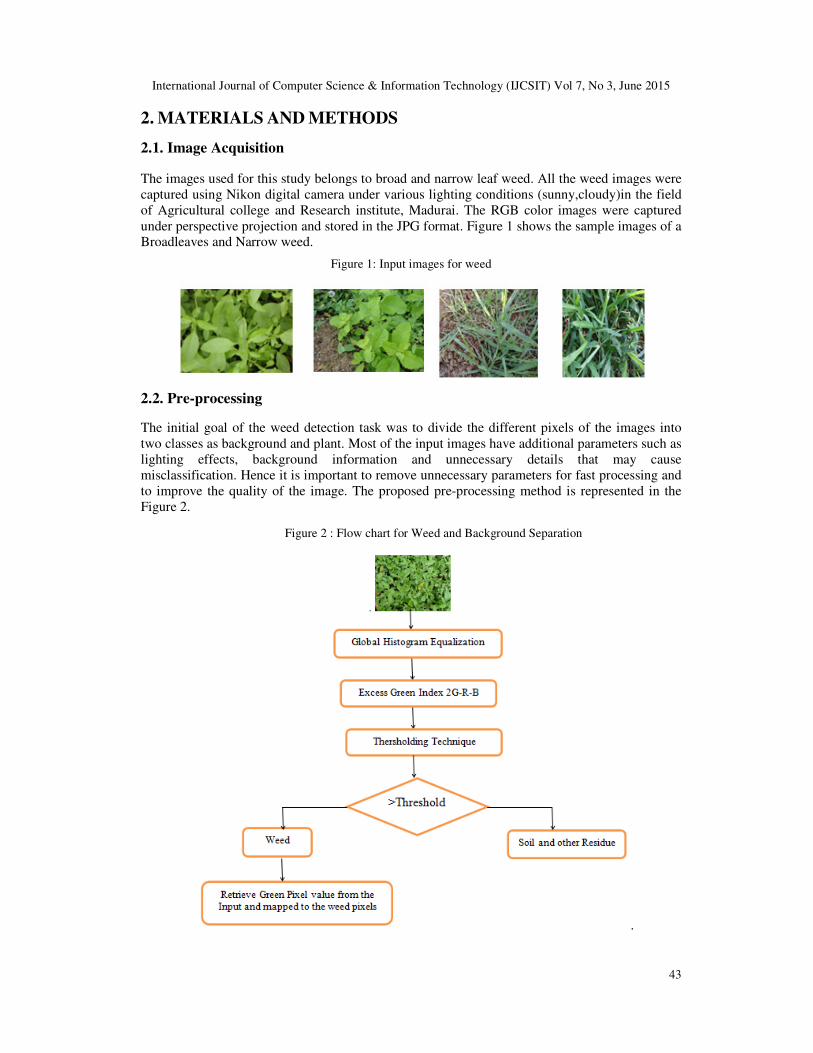
2.1. Image Acquisition
The images used for this study belongs to broad and narrow leaf weed. All the weed images were
captured using Nikon digital camera under various lighting conditions (sunny,cloudy)in the field
of Agricultural college and Research institute, Madurai. The RGB color images were captured
under perspective projection and stored in the JPG format. Figure 1 shows the sample images of a
Broadleaves and Narrow weed.
Figure 1: Input images for weed
2.2. Pre-processing
The initial goal of the weed detection task was to divide the different pixels of the images into
two classes as background and plant. Most of the input images have additional parameters such as
lighting effects, background information and unnecessary details that may cause
misclassification. Hence it is important to remove unnecessary parameters for fast processing and
to improve the quality of the image. The proposed pre-processing method is represented in the
Figure 2.
Figure 2 : Flow chart for Weed and Background Separation
.

International Journal of Computer Science & Information Technology (IJCSIT) Vol 7, No 3, June 2015
44
In the pre-processing stage, Global Histogram Equalization (GHE) was used to improve the
quality of the image by lengthening the intensity of the dynamic range using the histogram of the
whole image. Excess green index is used to extract the greenness of the image. The next goal is to
isolate the green parts from the background. For this purpose several thresholding methods were
applied. For automatic weed discrimination we computed the average gray level was set as
threshold [16]. The binary image can be obtained based on the threshold. The pixel values greater
than the threshold are labelled as white, i.e. they contain a high degree of greenness. The outputs
of the pre-processing stage are represented in Figure 3.
Figure 3 : Result of Pre-processing techniques
Sample Input Image Global Histogram Equalization
Image
Excess Green output
Binary image of
weed(white)
Binary image of
Background(White)
RGB Image for weed
2.3. Wavelets transform
Wavelet is a widely used multi-resolution tool in image processing [4,9,15]. Wavelet transform is
the best method to represent both time and frequency content of the image. There are number of
ways to separate the low(smooth variations in color) and the high frequency components(the
edges which give details). The input image can be decomposed using discrete wavelet
transform.To extend the wavelet transform to two dimensions, the input image is down sample in
the horizontal and vertical directions. The output produces four sub bands at each decomposition
denoting the horizontal frequency, vertical frequency represented as high-high (HH), high-low
(HL), low-high (LH) and low-low (LL) image sub bands. Continuously applying the same
scheme to the low-low sub band a multiresolution decomposition can be achieved. Figure 3
shows the normal layout of such decomposition. At each scale the sub bands are sensitive to
frequencies and the LH, HL and HH sub bands are sensitive to vertical, horizontal and diagonal
frequencies respectively. Figure 4 shows a DWT decomposition of the narrow weed image.
Figure 4: Three level decomposition of Discrete Wavelet Transform

International Journal of Computer Science & Information Technology (IJCSIT) Vol 7, No 3, June 2015
45
The Input images were decomposed using different types of wavelet families. The 2D RGB
image was represented as I, the decomposition of the wavelet transform first level can be
expressed as I = A1+D1, where A1 and D1 represent the approximation and details coefficients
respectively. In the image is decomposed up to multilevel the Equation can be written as
I=Aj+Dj+Dj-1+Dj-2+…..D2+D1 ---------- (1)
Where j represents number of wavelet decomposition. For feature extraction, only approximation
coefficients are used, the detail coefficients consist of noise. Each image was decomposed up to
three levels j=3. Figure 5 shows the result of applying wavelet transform (Reverse
Biorthogonal3.3) up to three levels on a sample image. In this study three different level of
decomposition based on the four different wavelet function namely
Daubechies(db4,db10),Symlets(sym4,sym8),Biorthogonal(bior3.3,bior6.8),Reverse Biorthogonal
(rbio3.3,rbio6.8) were used.
Figure 5 : Reverse Biorthogonal3.3 Wavelet Transform (a). Three level wavelet decomposition (b)
Reconstructed image
2.4. Feature Extraction
Texture is defined as an entity having group of mutually related pixels within an image. This
group of pixels is represented as texture elements [4,18].The aim of the weed discrimination
analysis was to classify the objects derived by image segmentation into defined number of classes
according to their specific features. The wavelet energy texture features were efficiently used for
texture classification and segmentation. First order statistical features mean, standard deviation
and second order statistical features like cluster shade and cluster prominence are calculated from
GLCM and used for classification of broad and narrow leaf weed [3].Five texture features such as
Energy, Entropy, Inertia and local homogeneity were extracted from coefficient of Discrete
wavelet transform are used texture classification of crop and weed. In real time automatic spray
control system [17], hundred highest average feature coefficients were selected from each level of
decomposition and Euclidian distance method was used to recognize and differentiate broad and
narrow weed. Sum of all the approximation coefficients at each level of decomposition are
considered as feature vector for classification of Broad and Narrow leaf weed [9].
The proposed work introduces a new texture based feature extraction method for weed
discrimination called Multi Resolution Combined Statistical and Texture Feature (MRCST).
MRCST is a combination of first order, second order statistical and texture properties. Using
GLCM [17] number of texture features are extracted from the input image and stored in a
database for weed discrimination. Texture classification involves learning and classification. In
the learning phase, the original image is decomposed using Discrete Wavelet Transform (DWT)
with three level of decomposition of different wavelet family. Features such as mean µ and
standard deviation σ are calculated from each of these wavelet sub-bands and are used to

International Journal of Computer Science & Information Technology (IJCSIT) Vol 7, No 3, June 2015
46
construct a global feature vectors as Wavelet Mean Standard deviation G=[Gµ,Gσ],where Gµ=[µ1
, µ2,…. µS ], Gσ =[σ1, σ2, σS],From the GLCM texture feature as Contrast ,Cluster Shade,
Cluster Prominence and Local Homogeneity (WCSPH) and Energy , Correlation ,Cluster Shade,
Cluster Prominence and Entropy features (WECSPE) and stored in the Features set for the
purpose of weed classification.
We use the following notation: G is the number of gray levels used. P(i,j) is the Grey level co-
occurrence matrix. µ is the mean value of P. µx, µy are the means of Px and Py. Px(i) is the ith
entry in the marginal-probability matrix obtained by summing the rows of P(i, j):
Four Texture features were extracted from coefficient of DWT. The texture features of Contrast,
Cluster shade, Cluster Prominence and Local Homogeneity are calculated using the following
formula
2.5. Feature Classification
Various classification techniques are used for weed discrimination and disease identification.
Most of the classification is based on population variance [5], weed coverage rate (2D-WCR) [6],
histogram analysis [7]. All the above methods, the value of image pixels are summed up and set
the threshold value for weed image classification. This may cause misclassification of real time
weed images, because there are no specific criteria for selecting a threshold value. To overcome
the above problem automated classification methods have also been used. The classification
methods are support vector machines (SVMs) [17], and neural networks (NNs) and active shape
model [19] used for weed discrimination and seed identification. In this paper Back propagation
Neural Network was used to classify the input weed as broad and narrow leaf weed. Figure 6
represent the texture feature extraction and classification process.

International Journal of Computer Science & Information Technology (IJCSIT) Vol 7, No 3, June 2015
47
Fig 6 : Process flow of texture feature extraction and classification
2.6. Neural Network
For weed recognition and classification a back propagation neural network was used. The node or
elements are composed, which is operating in parallel. These elements are stimulated by
biological nervous systems. The network function is determined largely by the connections
between elements. A neural network can be trained to perform a particular function by adjusting
the values of the connections (weights) between elements. The network is adjusted, based on a
comparison of the output and the target, until the network output matches the target image.
Feature of 50 images of broad and narrow leaf weeds were used to build ANN model. Set of
Feature values are assigned to the input layer of neural network. The number hidden layer will be
selected based on the following formula.
No. of hidden layer = (number of attribute + number of classes)/2.
The expected output in the training file was {1} for Broad weed and {0} for narrow weed.
2.7. Result and Discussion
Multilevel wavelet decomposition is a technique used in weed discrimination. In this crop/weed
discrimination technique is based on wavelet transforms comprised of Daubechies, Mayer and
Biorthogonal and compared it to a Gabor filtering. From this wavelet algorithm comparison
Daubechies and Mayer gave the best results (84.6% & 84.1%) and the Biorthogonal is the worst
one. Biorthogonal wavelet gave the result 76.4% and Gabor filter contributed the result as 73.7%
[15] . For weed classification the author[17] used wavelet based algorithm as Symlets,
Daubechies, Biorthogonal and Reverse Biorthogonal. Among those the Biorthogonal wavelet
with energy features gave the best result (97.64%).
In this paper the proposed algorithm classified real-time site specific weed discrimination based
on wavelet families Daubechies(db4,db10), Symlets(sym4,sym8), and Reverse Biorthogonal
(rbio3.3,rbio6.8) with three group of texture features as Mean and standard deviation , texture
feature as Contrast ,Cluster Shade, Cluster Prominence and Local Homogeneity (WCSPH) and
Energy , Correlation ,Cluster Shade, Cluster Prominence and Entropy features (WECSPE). To
build the database 50 images are used for each class (broad and narrow weed. Three levels of
decomposition are applied to all the type of wavelet families. And three group of features
International Journal of Computer Science & Information Technology (IJCSIT) Vol 7, No 3, June 2015
48
sets(MWS, WCSPH, WECSPE) are extracted from approximation and details coefficients of
from different wavelet families and all the decomposition level and are stored. All the coefficients
(detail and approximation) contains some useful information, it will necessary requires for proper
classification and higher accuracy. Feature sets are assigned as input to the Neural Network.
Number of Hidden layer is chosen based on the number of inputs. Neural network techniques
were applied separately to all the three features set of different wavelet families. Confusion
matrix is used to find the Broad and narrow weed classification accuracy.
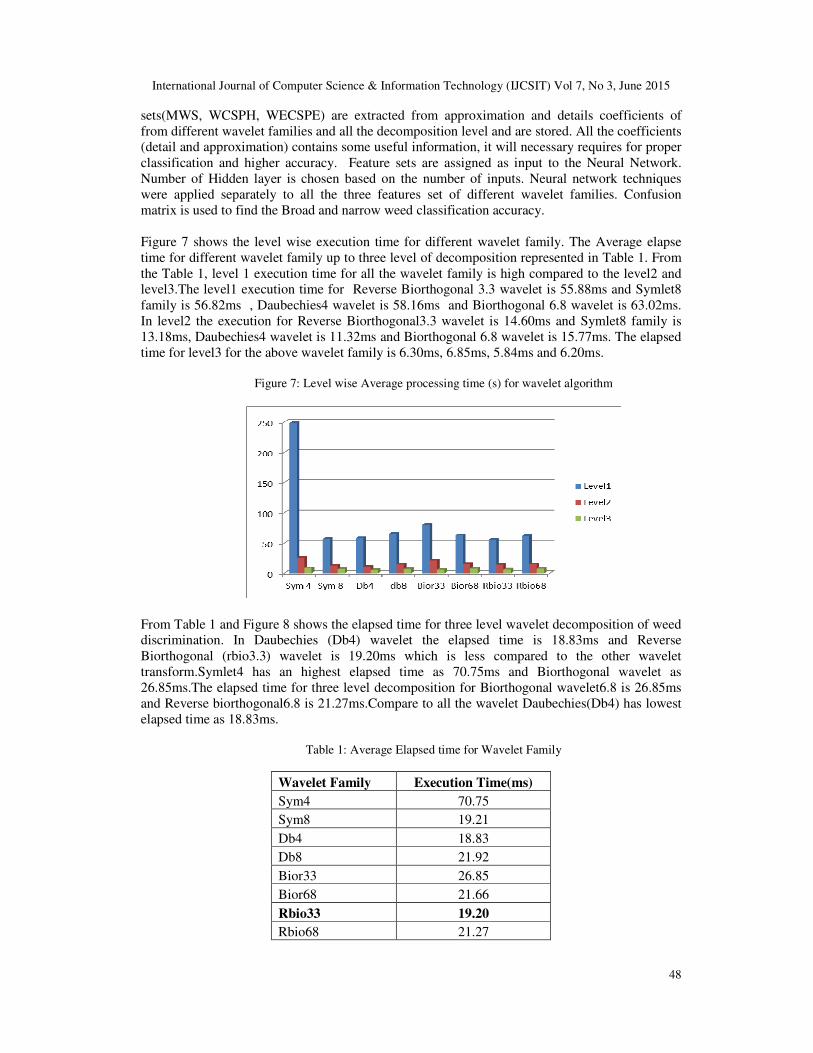
Figure 7 shows the level wise execution time for different wavelet family. The Average elapse
time for different wavelet family up to three level of decomposition represented in Table 1. From
the Table 1, level 1 execution time for all the wavelet family is high compared to the level2 and
level3.The level1 execution time for Reverse Biorthogonal 3.3 wavelet is 55.88ms and Symlet8
family is 56.82ms , Daubechies4 wavelet is 58.16ms and Biorthogonal 6.8 wavelet is 63.02ms.
In level2 the execution for Reverse Biorthogonal3.3 wavelet is 14.60ms and Symlet8 family is
13.18ms, Daubechies4 wavelet is 11.32ms and Biorthogonal 6.8 wavelet is 15.77ms. The elapsed
time for level3 for the above wavelet family is 6.30ms, 6.85ms, 5.84ms and 6.20ms.
Figure 7: Level wise Average processing time (s) for wavelet algorithm
From Table 1 and Figure 8 shows the elapsed time for three level wavelet decomposition of weed
discrimination. In Daubechies (Db4) wavelet the elapsed time is 18.83ms and Reverse
Biorthogonal (rbio3.3) wavelet is 19.20ms which is less compared to the other wavelet
transform.Symlet4 has an highest elapsed time as 70.75ms and Biorthogonal wavelet as
26.85ms.The elapsed time for three level decomposition for Biorthogonal wavelet6.8 is 26.85ms
and Reverse biorthogonal6.8 is 21.27ms.Compare to all the wavelet Daubechies(Db4) has lowest
elapsed time as 18.83ms.
Table 1: Average Elapsed time for Wavelet Family
Wavelet Family Execution Time(ms)
Sym4 70.75
Sym8 19.21
Db4 18.83
Db8 21.92
Bior33 26.85
Bior68 21.66
Rbio33 19.20
Rbio68 21.27

International Journal of Computer Science & Information Technology (IJCSIT) Vol 7, No 3, June 2015
49
Figure 8 : Execution time for Wavelet Family Decomposition upto three level
Broad and narrow weed texture feature set for wavelet families are classified with neural network.
The Figure 9 and Table 2 show the classification of broad and narrow weeds using different types
of wavelets at three levels of decompositions.
Table 2: Accuracy of Wavelet Texture Features
WMS :Wavelet statistical features(WMS), WCSPH : Contrast ,Cluster Shade, Cluster
Prominence and Local Homogeneity Texture feature WECSPE : Energy , Correlation, ,Cluster
Shade, Cluster Prominence and Entropy features
Wavelet
Family WMS WCSPH WESPEnt
Sym4 76.67 91.67 96.33
Sym8 73.67 93.33 96.67
Db4 77.34 95.33 96.33
Db10 75.67 90.42 83.33
Bior33 76.87 90.67 96.67
Bior68 76.87 92.33 93.33
Rbio33 83.67 98.7 98.9
Rbio68 76.67 93.33 96.67
In Figure 9 the classification accuracy for the texture for Mean and standard deviation for the
wavelet family Sym4, Sym8, Db4, Db10, Bior33, Bior68, Rbio33 and Rbio68 are 76.67%,
73.67%, 77.34%,75.67%,76.87%,76.87% ,83.67 and 76.67. The wavelet Reverse Biorthogonal
wavelet3.3 wavelet have high accuracy as 83.67%. For the texture feature Contrast ,Cluster
Shade, Cluster Prominence and Local Homogeneity (WCSPH) the classification accuracy the
wavelet family are represented in Figure 9. Compare to the other wavelet the highest accuracy
86.67% achieve from the Reverse Biorthogonal3.3. It is obvious form the Table 2 and Figure. 9
that the classification through Reverse Biorthogonal3.3 wavelet (Rbio33) with Energy,
Correlation, ,Cluster Shade, Cluster Prominence and Entropy features (WESPEnt) texture features

International Journal of Computer Science & Information Technology (IJCSIT) Vol 7, No 3, June 2015
50
is more efficient due to highest accuracy 98.9% and less execution time for three level of
decomposition.
Figure 9: Accuracy of Wavelet Texture Features as WMS, WCSPH and WECSPE
Comparison with Existing Algorithm
The classification accuracy of Broad and narrow weed was compared to the existing
algorithm the author [19] has proposed a real-time system had an accuracy of about 81% due to
the classification based on the highest intensity value taken from the histogram. The author [4]
developed a method using Offset Excess Green , Db4 wavelet transform and Multiresolution
combined statistical an spatial frequency features for the broad and narrow weed classification.
The overall classification accuracy is this method is 98.55% . Using Global Histogram
Equalization, Symlet wavelet and approximation coefficient of each level (four level) feature
values and SVM classification method, the accuracy of 98.1% can be obtained [9]. Our proposed
algorithm use Global Histogram equalisation, Offset excess green and thresholding techniques are
used for segmentation and three level wavelet decomposition of different wavelet families , and
three group of texture features are extracted detail and approximation coefficient of three levels
and Neural network and confusion matrix are used for classification. From the result of the
proposed algorithm Reverse Biorthogonal 3.3 wavelet families with texture features as Energy ,
Correlation, ,Cluster Shade, Cluster Prominence and Entropy features (WECSPE) gave the
accuracy of 98.9 %.The results are shown in Fig 10. Compared with the existing algorithm for
weed discrimination, our approach gave best results for weed discrimination and useful for site
specific herbicide application.
Fig. 10. The Comparison result for proposed algorithm and the existing algorithm

International Journal of Computer Science & Information Technology (IJCSIT) Vol 7, No 3, June 2015
51
3. CONCLUSIONS AND FUTURE SCOPE
In this study, we proposed an accurate and efficient method for real-time specific weed
discrimination using Global Histograms Equalization, Excess Green Index pre-processing
techniques and multilevel (three level) wavelet decomposition to extract the prominent texture
features from images and Neural Network classification techniques. To increase the accuracy and
efficiency, we developed efficient pre-processing methods and feature extraction techniques. We
verified four different types of wavelet families Daubechies(db4,db10),Symlets(sym4,sym8) and
Reverse Biorthogonal (rbio3.3,rbio6.8) with three group of texture features are extracted and used
for Neural Network classification techniques. Our proposed approach using Reverse Biorthogonal
(rbio3.3) wavelet family with Energy, Correlation, Cluster Shade, Cluster Prominence and
Entropy (WECSPE) features yielded a classification accuracy of 98.9%. Compared to the existing
algorithm our proposed algorithm indicates that Rbio3.3 is a promising wavelet due to its high
accuracy, less error rate and elapsed time and it is suited for real-time specific weed
discrimination. To improve the classification accuracy curvelet can be used.
REFERENCES
[1] Woebbecke, D., Meyer, G., VonBargen, K., Mortensen, D.,(1995),”Color indices for weed
identification under various soil, residue, and lighting conditions”, Trans. ASAE, vol 38 (1), pp 271–
281.
[2] Ribeiro, A., Fernández-Quintanilla, C., Barroso, J., García-Alegre, M.C., (2005).”Development of an
image analysis system for estimation of weed”, Proceedings 5th
European Conf. On Precision
Agriculture (5ECPA) , pp. 169–174.
[3] Meyer, G.E., von Bargen, K., Woebbecke, D.M., Mortensen, D.A.,(1994),”Shape features for
identifying young weeds using image analysis”, ASAE paper 94-3019, American Society of
Agricultural Engineers, St. Joseph,MI, USA.
[4] R.S. Sabeenian and V. Palanisamy,(2010),”Crop and weed discrimination in agricultural field using
MRCSF”. Int. J. Signal and Imaging Systems Engineering, Vol. 3, No. 1, pp.61-69.
[5] Hague, T., Tillet, N., Wheeler, H.,(2006).”Automated crop and weed monitoring in widely spaced
cereals”, Precis. Agr, Vol 7, pp 21–32.
[6] Hemming, J., Rath, T.,(2001),”Computer-vision based weed identification under field conditions
using controlled lighting”,J. Agr. Eng. Res. Vol 78 (3), pp 233–243.
[7] Meyer, G., Neto, J.,(2008),”Verification of color vegetation indices for automated crop imaging
applications”,Comput. Electron. Agr. Vol 63, pp 282–293.
[8] Irshad Ahmad, Muhammad Hameed Siddiqi ,Iram Fatima ,Sungyoung Lee, Young-Koo Lee,(2011)
“Weed Classification Based on Haar Wavelet Transform via k-Nearest Neighbor (k-NN) for Real-
Time Automatic Sprayer Control System”,ICUIMC ’11, February 21–23, Seoul, Korea.
[9] Muhammad Hameed Siddiqi, Seok-Won Lee And Adil Mehmood Khan,(2014) ”Weed Image
Classification using Wavelet Transform,Stepwise Linear Discriminant Analysis, and Support Vector
Machines for an Automatic Spray Control System”, JOURNAL OF INFORMATION SCIENCE AND
ENGINEERING , Vol 30, pp 1253-1270.
[10] S. I. Cho; D. S. Lee; J. Y. Jeong, (2002),”Weed–plant Discrimination byMachine Vision and
Artificial Neural Network”, Biosystems Engineering, Vol. 83 (3), pp 275–280.
[11] Wang, N., Zhang, N., Dowell, F.E., Sun, Y., Peterson, D.E.,(2001),”Design of an optical weed sensor
using plant spectral characteristics”. Trans. ASAE, Vol. 44 (2), pp 409–419.
[12] Cho, S.I., Lee, D.S., Jeong, J.Y.,(2002),”Weed-plant discrimination by machine vision and artificial
neural network”,.Biosyst. Eng. Vol 83(3), pp 275–280.
[13] Lamm, R.D., Slaughter, D.C., Giles, D.K.,(2002),”Precision weed control system for cotton”,Trans.
ASAE, Vol 45 (1),pp 231–238.
[14] Haralick, R.M. (1979) ‘Statistical and structural approaches to texture’, IEEE Proceedings, Vol. 67,
pp.786–804.
[15] J. Bossu, Ch. Gée, G. Jones, F. Truchetet ,(2009),”Wavelet transform to discriminate between crop
and weed in perspective agronomic images”, computers and electronics in agriculture”,Vol
65,pp133–143.

International Journal of Computer Science & Information Technology (IJCSIT) Vol 7, No 3, June 2015
52
[16] M. Guijarro, G. Pajares, I. Riomoros, P.J. Herrera, X.P. Burgos-Artizzue, A.
Ribeiroe,(2011),”Automatic segmentation of relevant textures in agricultural images”,Computers and
Electronics in Agriculture, Vol 75,pp 75–83.
[17] Siddiqi, M.H.,S.B.T Sulaiman,I,Faye and I.Ahmed(2009), “A Real Time Specific Weed
Discrimination System using Multi-Level Wavelet Decomposition”, International Journal of
Agricultural and Biology,Vol 11, pp 559-565.
[18] K.K.Ghazali ,M.F.Mansor,M.M.Mustafa and A.Hussain,(2007),”Feature Extraction Techniques using
Discrete Wavelet transform for Image classification”, IEEE 5th Student conference on Research and
Development.
[19] C.Anucti and P.PBekaert,” SIFT-CCH:Increasing the SIFT distinctness by color co-occurrence
histogram” in proceeding of the 5th International symposium on Image and Signal Processing and
Analysis,2007,pp.130-135.
Authors
P.Prema received her B.Sc(Computer Science) degree in V.V.Vanniya Perumal College,Virudhunagar, in
1995 and MCA degree in Thiagarajar College of Engineering,Madurai and M.Phil (Computer Science) in
Manonmaniam Sundaranar University,Tirunelveli. She has 15 years of teaching experience and she is
currently working as Assistant Professor (Computer science) in Agricultural College an Research Institute,
Madurai, TamilNadu, India. Her current research interest includes Image Processing, Wavelet, Curvelet and
Neural Network.