a study to compare the effect of lumbar spine adjustments
TRANSCRIPT

THA 615. 534 BOS
A Study to Compare the Effect of Lumbar Spine Adjustments,
Rectus Femoris Muscle Stretches and a Combination of Both
Treatments on the Flexibility of the Rectus Femoris Muscles
A Dissertation Submitted in Partial Fulfilment of the Requirements for the Master's Degree in
Technology: Chiropractic, in the Faculty of Health Sciences at the
University of Johannesburg
By
Angie Boshoff (Student number: 802001415)
Johannesbuig 2005
UJ LI C LIBRARY TEM: 123808

DECLARATION
I, Anee Boshoff declare that the conception and execution of this dissertation represents my
own work. It is being submitted for the Masters Degree of Technology at the University of
Johannesburg. It has not been submitted for any degree or examination at any other
Technikon, College or University previous to this date.
Signature of Candidate:
Anee Boshoff
On this Tmksda
the 2!(}1 of Felorn(q
2006
Signature of Supervisor:
Dr. S. Wilcox M. Tech (Chiro) SA, B.Sc (Med)(Hons) Biokinetics (UCT), BA Phys Ed (UP)
On this 11(\,lAreA the Andk of
(Foiolcuo-j 2006
Signature of Co-supervisor:
Dr. M. Moodley (M. Tech Chiropractic, SA)
On this 774÷,,e_s D Al the `@-.13b of ee> g_u r)(aH
2006
ii

DEDICATION
Firstly I want to thank my Creator for health, intelligence and guidance throughout my studies
but more so in life.
I want to thank my parents who taught me the value of hard work and perseverance. Thank
you for your support both financially and emotionally. I am eternally grateful.
Thank you to my fiancé who gave me constant support and motivation, without you the road
would have been much harder.
To my family and friends, thanks for your input and interest in my studies it pushed me
through the tough times.
I am grateful for all of you in my life and I hope I made you proud.
iii

ACKNOWLEDGEMENTS
I would like to thank my supervisor, Dr. Wilcox, for her high standard of work ethics, prompt
and very competent input and guidance to make this dissertation worthwhile. Without your
help and support I would never have finished this study so efficiently.
Dr. Moodley, my co-supervisor, your wisdom and competence assisted me until the end of
this long road. Thanks for all the valuable input and advice.
Thanks go out to Adam for all your patience to help me make sense of the statistical
information in this study. The amount of time and frustration you saved me is priceless.
iv

ABSTRACT
This unblinded, randomised pilot study was performed to determine and compare the effect of
innervation specific lumbar spine adjustments and stretching on the flexibility of the rectus
femoris muscles in asymptomatic subjects.
Twelve asymptomatic subjects between the ages of 20 and 30 years were recruited by the use
of advertisements placed around the University of Johannesburg, Doornfontein Campus. The
inclusion criteria required that the patient had decreased rectus femoris muscle flexibility
(testing positive on the rectus femoris contracture test) and no history of, or any current
osteoarthritis or pathology of the hips or knees. The patients were randomly placed into one
of three groups by drawing a group number from a closed bag. Group 1 consisted of four
subjects receiving a single lumbar spine adjustment per treatment relating to the most
restricted segment in the L2-L4 area as well as bilateral proprioceptive neuromuscular
facilitation (PNF) of the rectus femoris muscles; Group 2 consisted of four subjects receiving
bilateral rectus femoris muscle stretches (PNF); and Group 3 consisted of four subjects who
received a single lumbar spine adjustment at the L2-L4 area to the most restricted segment
found. One adjustment per treatment was performed. With the subject in the rectus femoris
contracture test position, a goniometer was used to measure the knee range of motion
bilaterally before and after treatments. These measurements were used as objective data.
Each subject was treated twelve times over a four to six week period.
The objective results indicated that there was a statistically significant improvement in rectus
femoris muscle flexibility in both Group 1 and Group 3.
In conclusion, it was shown that specific adjustments at the spinal level of the nerve
innervation for the rectus femoris muscle resulted in an improvement of the flexibility of the
rectus femoris muscle and with a greater effect on the leg ipsilateral to the side of the spinal
adjustment. This gives support for the effectiveness of innervation specific spinal
adjustments.

TABLE OF CONTENTS
DECLARATION ii
DEDICATION iii
ACKNOWLEDGEMENTS iv
ABSTRACT v
TABLE OF CONTENTS vi
LIST OF FIGURES ix
LIST OF GRAPHS ix
LIST OF TABLES x
LIST OF APPENDICES xi
CHAPTER ONE - INTRODUCTION 1
1.1 WHY DO RESEARCH ON THE RECTUS FEMORIS MUSCLE FLEXIBILITY? 1
1.2 AIM 2
1.3 HYPOTHESES 2
1.4 EXPECTED OUTCOMES 3
CHAPTER TWO - LITERATURE REVIEW 4
2.1 NEUROLOGICAL CONNECTIONS BETWEEN MUSCLE AND THE SPINAL
CORD 4
2.2 SPINAL MANIPULATIVE THERAPY 10
2.2.1 The Effect of Spinal Manipulative Therapy on Muscle Tone 10
2.3 STRETCHING 12
2.3.1 Definition and Stretching Techniques 12
2.3.2 Proprioceptive Neuromuscular Facilitation (PNF) 13
2.4 MUSCLE FLEXIBILITY 13
2.4.1 Definition 13
2.4.2 The Importance of Flexibility 13
vi

2.5 THE RECTUS FEMORIS MUSCLE 14
2.5.1 Anatomical Attachments 14
2.5.2 Innervation 15
2.5.3 Functions 17
2.5.4 Actions that Shorten the Rectus Femoris Muscles 17
2.6 POSTURE 18
2.6.1 Ideal Posture 18
2.6.2 Posture Types 19
2.6.3 Posture and Shortened Rectus Femoris Muscles 20
CHAPTER THREE - METHODOLOGY 25
3.1 PATIENT RECRUITMENT 25
3.2 PATIENT SELECTION AND INCLUSION CRITERIA 25
3.3 PATIENT ETHICS 26
3.4 SAMPLE SIZE AND TREATMENT REGIME 26
3.5 PROCEDURE 27
3.5.1 First Visit 27
3.5.2 Follow-Up Visits 27
3.5.3 Treatment at Follow-Up Visits 27
3.6 OBJECTIVE MEASUREMENTS AND THE EXECUTION THEREOF 30
3.7 VALIDITY AND RELIABILITY OF THE GONIOMETER 30
3.8 STATISTICAL ANALYSIS 31
CHAPTER FOUR - RESULTS 32
4.1 INTRODUCTION 32
4.2 DEMOGRAPHIC DATA 33
4.3 BEFORE AND AFTER TREATMENT MEASUREMENTS IN GROUPS 34
4.4 WILCOXON TESTING 38
4.5 SCATTERPLOT OF PERCENTAGE CHANGES 40
4.6 ONE-SAMPLE T-TEST STATISTICS 43
vii

CHAPTER FIVE - DISCUSSION 47
5.1 TREATMENT EFFECT ON THE RECTUS FEMORIS MUSCLE FLEXIBILITY 47
5.2 BEFORE AND AFTER TREATMENT MEASUREMENTS IN GROUPS 47
5.3 WILCOXON TESTING 48
5.4 SCATTERPLOT OF PERCENTAGE CHANGES 49
5.5 ONE-SAMPLE T-TEST STATISTICS 49
5.6 SUMMARY 50
CHAPTER SIX - CONCLUSION AND RECOMMENDATIONS...... 51
6.1 CONCLUSION 51
6.2 RECOMMENDATIONS 51
REFERENCES 53
APPENDICES 58
viii

Figure 2.1:
Figure 2.2:
Figure 2.3:
Figure 2.4:
Figure 2.5:
Figure 2.6:
Figure 2.7:
Figure 2.8:
Figure 2.9:
Figure 2.10:
Figure 2.11:
Figure 2.12:
LIST OF FIGURES
Neurological Connections Between Muscle and the Spinal Cord 5
Diagrammatical Illustration of the Stretch Reflex 7
Diagrammatical Representation of Reciprocal Inhibition 8
The Neurological Effect of GTO's of Skeletal Muscle 9
The Dual Effect of an Isometric Contraction in Skeletal Muscle 9
Anatomical Attachments of the Rectus Femoris Muscle 15
Arteries and Nerves of Anterior Thigh 16
Ideal Posture 19
Four Types of Postural Alignment 20
Excessive Anterior Pelvic Tilt Resulting in an Increased Lumbar
Lordosis 21
Kyphosis-Lordosis Posture 22
Military-Type Posture 23
LIST OF GRAPHS
Graph 4.1: Loess Curve Fit per Group Average (Right Leg) 41
Graph 4.2: Loess Curve Fit per Group Average (Left Leg) 42
ix

LIST OF TABLES
Table 4.1: Demographic Data 33
Table 4.2: Group 1-Treatment Results 34
Table 4.3: Group 2-Treatment Results 36
Table 4.4: Group 3-Treatment Results 37
Table 4.5: Wilcoxon Test (Right Leg) 39
Table 4.6: Wilcoxon Test (Left Leg) 40
Table 4.7: Combination Group: Adjusted Side's Leg Measurements (One Sample
T-Test Statistics) 43
Table 4.8: Adjustment Group: Adjusted Side's Leg Measurements (One Sample
T-Test Statistics) 44
Table 4.9: Combination Group: Unadjusted Side's Leg Measurements (One
Sample T-Test Statistics) 45
Table 4.10: Adjustment Group: Unadjusted Side's Leg Measurements (One
Sample T-Test Statistics) 46
x

APPENDIX A:
APPENDIX B:
APPENDIX C:
APPENDIX D:
APPENDIX E:
APPENDIX F:
APPENDIX G:
APPENDIX H:
APPENDIX I:
APPENDIX J:
APPENDIX K:
APPENDIX L:
APPENDIX M:
APPENDIX N:
APPENDIX 0:
APPENDIX P:
APPENDIX Q:
APPENDIX R:
APPENDIX S:
LIST OF APPENDICES
ADVERTISEMENT 58
RECTUS FEMORIS CONTRACTURE TEST 59
CONTRA-INDICATIONS TO SPINAL MANIPULATIVE
PROCEDURE 60
SUBJECT INFORMATION AND CONSENT FORM 62
CASE HISTORY 64
PERTINENT PHYSICAL 69
LUMBAR SPINE AND PELVIS REGIONAL 71
HIP REGIONAL 77
KNEE REGIONAL 82
USING A GONIOMETER TO MEASURE THE PASSIVE
LENGTH OF THE RECTUS FEMORIS MUSCLE 88
SOAP NOTE 89
SEATED TRANSVERSO-DELTOID ADJUSTMENT 90
PNF STRETCH OF RECTUS FEMORIS MUSLES 91
HI-LOW GRAPH FOR COMBINATION GROUP
(RIGHT LEG) 92
HI-LOW GRAPH FOR STRETCH GROUP
(RIGHT LEG) 93
HI-LOW GRAPH FOR ADJUSTMENT GROUP
(RIGHT LEG) 94
HI-LOW GRAPH FOR COMBINATION GROUP
(LEFTLEG) 95
HI-LOW GRAPH FOR STRETCH GROUP
(LEFT LEG) 96
HI-LOW GRAPH FOR ADJUSTMENT GROUP
(LEFT LEG) 97
xi

CHAPTER ONE — INTRODUCTION
1.1 WHY DO RESEARCH ON THE FLEXIBILITY OF THE RECTUS FEMORIS
MUSCLE ?
The rectus femoris muscle was chosen because it is the only quadriceps muscle that crosses
two-joints, more specifically the hip joint. This was important because by crossing the hip
joint and attaching to the pelvis, the rectus femoris muscle can have a direct effect on the
orientation of the pelvis and therefore on posture. (Travell and Simons 1997)
The rectus femoris muscle is one of the major postural muscles on the anterior aspect of the
body. Under both normal and pathological circumstances postural muscles have the
predisposition to shorten and lead to pathological postures. (Chaitow 1996)
The second reason for choosing the rectus femoris muscle was because there were reliable
and valid testing procedures available to assess its flexibility.
Flexibility and strength are universally accepted as playing a huge role in the rehabilitation of
patients with pathological postures (Luttgens and Wells 1982). The degree of postural
balance can be restored by releasing the tense and tight muscle through stretching prior to
initiating a strengthening program. Joint manipulation is another way to normalise hypertonic
and shortened muscles. (Chaitow 1996)
The stretching method of proprioceptive neuromuscular facilitation focuses on the
significance of the closely related components in the function of joints and muscles. It makes
use of this by applying a resisted isometric exercise. When a muscle is isometrically
contracted, the antagonist will be inhibited, and will relax immediately following this.
Therefore the antagonist of the shortened muscle may be isometrically contracted, to attain a
degree of ease and additional movement in the shortened muscle tissues. (Chaitow 1996)
Good evidence exists proving that displacement of vertebrae; changes nerve activity in
afferent nerves innervating muscle spindles and other threshold receptors (Bolton 2000).
1

Spinal manipulative therapy influences the mechanoreceptors, proprioceptors and nociceptive
afferents of both joint capsules and musculotendinous structures; resulting in decreased
muscle tone (Evans 2001). Knutson and Owens (2003) proposed that a muscle stretch
produced through manipulation, can affect the hypertonic muscle to normalise passive tone by
re-establishing co-ordination between intrafusal and extrafusal fibres. It is hypothesized that
an inhibitory reflex response may be produced by spinal manipulative therapy that is
segmental in origin with the clinical efficacy of a decreased motoneuron activity, which in
turn may lead to a reduction of muscle hypertonicity (Dishman, Ball and Burke 2002).
1.2 AIM
The aim of this study was to determine if level specific chiropractic adjusting will have a
measurable effect on the flexibility of the distal muscle it innervates and how the effect of
chiropractic adjusting alone relates to the effect of stretching and a combination of adjusting
and stretching on the flexibility of the relevant muscle.
1.3 HYPOTHESES
Hypothesis 1:
Innervation specific (L2-L4) chiropractic spinal adjustment and PNF stretching of the rectus
femoris muscles will result in an increase in rectus femoris muscle flexibility. This increase
in rectus femoris muscle flexibility will be superior to the other two groups.
Null hypothesis 1:
Innervation specific chiropractic spinal adjustment and PNF stretching of the rectus femoris
muscles will not result in an increase in rectus femoris muscle flexibility and will not be
superior to the other two groups.
Hypothesis 2:
PNF stretching of the rectus femoris muscle alone will result in an increase in rectus femoris
muscle flexibility.
2

Null hypothesis 2:
PNF stretching of the rectus femoris muscle alone will not result in an increase in rectus
femoris muscle flexibility.
Hypothesis 3:
Innervation specific (L2-L4) chiropractic spinal adjustment on its own will cause an increase
in rectus femoris muscle flexibility. This increase in rectus femoris muscle flexibility will be
superior to the stretching group.
Null hypothesis 3:
Innervation specific (L2-L4) chiropractic spinal adjustment on its own will not cause an
increase in rectus femoris muscle flexibility and will not be superior to the stretching group.
1.4 EXPECTED OUTCOMES
The expected outcome of this study is an improvement in the flexibility of the rectus femoris
muscles. It is proposed that the group that undergoes adjustments and PNF stretching will
have the best improvement in the flexibility; followed by the adjustment group and then the
stretching group.
The study will benefit the chiropractic community by proving or disproving the importance of
level specific adjustments when treating muscle flexibility.
3

CHAPTER TWO — LITERATURE REVIEW
2.1 NEUROLOGICAL CONNECTIONS BETWEEN MUSCLE AND THE
SPINAL CORD
Two general types of specialised receptors exist in muscles namely: golgi tendon organs
(GTO's) and muscle spindles. A schematic illustration of the afferent and efferent
innervation of muscle is shown in figure 2.1. GTO's are tension receptors in tendons and are
stimulated during muscle contraction and muscle relaxation. These receptors give rise to fast
conducting lb afferent nerve fibres that enter the dorsal horn of the spinal cord. The lb fibre
then splits into two directions, sending fibres into the dorsal or posterior column which
signals higher centres regarding tendon tension, and sending fibres to the dorsal horn where
they synapse on an inhibitory interneuron which then synapses on the cell body of the alpha-
motoneuron serving the same muscle. Therefore "autogenic inhibition" is the general
function of the GTO excitation and involves the inhibition of the contraction of the muscle
within which it is found in order to help prevent damage due to overloading of the muscle
tissues. Muscle spindles are a complex subdivision of muscle anatomy. (Knutson and Owens
2003)
Muscle spindles are primarily length-measuring receptors that are rooted in the bulk of the
muscle tissue. The muscle fibres termed "extrafusal" are found outside the spindle and the
"intrafusal" fibres are situated inside the muscle spindle. Alpha-motoneurons supply the
extrafusal muscle fibres, while the intrafusal fibres are innervated by the gamma fibres. Both
infra and extrafusal muscles are supplied by beta-motoneurons and receive monosynaptic
inputs from both Ia and II afferent fibres, which are sensory fibres from the muscle spindle.
The central, non-contractile portion of the muscle spindle gives rise to the Ia and II afferent
nerve fibres. When stretching a muscle, both extra and intrafusal muscle fibres are stretched
simultaneously. Spindle sensory excitation and Ia and II output occurs when the intrafusal
muscle fibres are stretched. Spindles can be excited independently of extrafusal muscle
stretching via gamma-motoneurons that supply the contractile ends of the intrafusal fibres.
Stimulation of the gamma afferents causes the ends of the spindle to contract separately from
the extrafusal fibres, thus stretching the central region of the spindle and exciting the spindle
4

Long Descending Fibers
Gaigi Tendan Organ
ORG
Intratusal Fibers Chain Fiber BegFiber
r Stretch ending
1° Stretch Ending
Extrefu sal Fibers
telesonesece
eitsoceeuron
sensory Ia and II fibres. One study found that an increase in sympathetic outflow depresses
the feedback control of muscle length. Muscle spindle afferents are thought to form a
proprioceptive chain, from the eye to the foot, involved in controlling posture and position by
their cortical projections. (Knutson and Owens 2003)
Figure 2.1: Neurological Connections between Muscle and the Spinal Cord. (Knutson and
Owens 2003)
Bolton (2000) reviewed the segmental afferent input from spinal structures, stating that
muscles contain multiple sensory receptors and that each spinal structure has its own neural
receptors.
Evidence exists stating that the displacement of vertebrae alters nerve activity in afferent
nerves innervating muscle spindles and other low (mechanical) threshold receptors. These
receptors are responsive to mechanical changes which occur during a spinal manipulation.
(Bolton 2000)
5

Stimulation of these receptors has been shown to activate central reflex pathways and specific
somato-somatic reflexes in experimental animals. It has been demonstrated that these reflexes
can be brought about by a spinal adjustment. (Haldeman 2000)
Because muscle fibres only contract with an action potential that stimulates the muscle,
skeletal muscle tone results entirely from a low rate of nerve impulses sent from the spinal
cord. In the majority of hypothetical models regarding joint dysfunction, muscle hypertonicity
is an active part in the cause, maintenance and effects of the pathological complex. Studies
have shown that spinal manipulation normalised muscle function. (Knutson and Owens 2003)
Two neurophysiological phenomena help to explain facilitation and inhibition of the
neuromuscular systems. The first being autogenic inhibition, illustrated by figure 2.2; which
is mediated by afferent fibres from a stretched muscle, acting on the alpha motor neurons
supplying that muscle, ultimately causing it to relax. By stretching a muscle, the motor
neurons supplying that muscle receive both excitatory and inhibitory impulses from the
receptors. If the stretch is continued for an extended period of time, the inhibitory impulses
from the golgi tendon organs eventually overrule the excitatory impulses and therefore cause
relaxation. Because inhibitory motor neurons receive impulses from the golgi tendon organs,
while the muscle spindle creates an initial reflex excitation leading to contraction, the golgi
tendon organs send inhibitory impulses that last for the duration of increased tension. This
occurs due to either passive stretching or active contractions that eventually dominate weaker
impulses from the muscle spindle. This inhibition seems to protect the muscle from injury
through reflex contractions that occur as result of excessive muscle stretching. (Prentice and
Voight 2001)
6

Type II afferent nerve fibers from Golgi
tendon organs Dorsal
Type la afferent nerve fibers from muscle spindle
Ventral
00% Golgi tendon
organ
Muscle spindle
Gamma efferent fiber .....___causes reflex
relaxation Alpha motor neuron causes reflex contraction
Figure 2.2: Diagrammatical Illustration of the Stretch Reflex. (Prentice and Voight 2001)
Reciprocal inhibition is the second mechanism and involves the relationship between the
agonist and the antagonist muscles. The agonists are the muscles that contract to produce
joint motion and the agonistic pattern is the resulting movement. The muscles that stretch to
allow the agonist pattern to occur are called the antagonistic muscles. This is represented in
figure 2.3. When motor neurons of the agonist muscles receive excitatory impulses from
afferent nerves, the motor neurons that supply the antagonist muscles are inhibited by afferent
impulses. Thus contraction or prolonged stretch of the agonist muscle must elicit relaxation
or inhibit the antagonist. Similarly a quick stretch of the antagonist muscle facilitates a
contraction of the agonist. For both facilitation and inhibition, proprioceptive neuromuscular
facilitation (PNF) relies greatly on the actions of the agonist and the antagonist muscle
groups. (Prentice and Voight 2001)
7

Quadriceps .
Ventral
Hamstrings
Dorsal
Figure 2.3: Diagrammatical Representation of Reciprocal Inhibition. (Prentice and Voight
2001)
During an isometric muscle contraction, the antagonistic muscle will be inhibited and will
relax immediately after the agonist contraction. Therefore the agonist of a shortened muscle
may be isometrically contracted to achieve a degree of relaxation and additional movement in
the shortened tissues. Figure 2.4 is a schematic representation of the neurological effects of
the loading of the golgi tendon organs of skeletal muscle by means of an isometric
contraction, which produces a post-isometric relaxation effect in that muscle (Chaitow 1996).
8

Response from Golgi tendon organ
Strong contraction of skeletal muscle
Motor end plate
lb afferent
fibre )
Cessation of discharge
Dorsal root ganglion
Dorsal root
I ntemeu rone releasing inhibitory
J mediator
Motor neurone
Ventral root
Dorsal root ganglion
Interneurone releasing inhibitory mediator
Motor neurone — of agonist
muscle Motor neurone of antagonist muscle
Muscle spindle
Agonist muscle
Antagonist muscle
Figure 2.4: The Neurological Effect of GTO's of Skeletal Muscle. (Chaitow 1996)
Figure 2.5 represents the reciprocal effect of an isometric contraction of a skeletal muscle,
resulting in an inhibition of its antagonist (Chaitow 1996).
Figure 2.5: The Dual Effect of an Isometric Contraction in Skeletal Muscle. (Chaitow 1996)
9

2.2 SPINAL MANIPULATIVE THERAPY
2.2.1 THE EFFECT OF SPINAL MANIPULATIVE THERAPY ON MUSCLE TONE
The neurological effects, of a spinal manipulative adjustment (SMT) on the human motor
system, are a commonly researched topic (Haldeman 2000). Cailliet (1995) stated that one of
the benefits from a manipulation, is a reflex stimulation that relaxes the extrafusal muscle
fibres (Cailliet 1995). Joint manipulation that results in an articular cavitation has a particular
reflex effect on the periarticular and muscular structures, which is different from a
mobilisation that involves progressive stretching (Maigne 1995).
Knutson and Owens (2003) proposed that a muscle stretch produced via manipulation or other
methods, can affect the hypertonic muscle to normalise passive tone by re-establishing co-
ordination between intrafitsal and extrafusal fibres (Knutson and Owens 2003).
Spinal manipulative therapy (SMT) may result in a global inhibitory response through the
integration of afferent feedback along the entire neuraxis, producing a hypoalgesic effect.
SMT may also create an inhibitory reflex response that is segmental in origin. Although the
exact mechanisms are not known, SMT may involve a decline in motoneuron activity, which
may result in a reduction of hypertonicity in muscles. (Dishman, Ball and Burke 2002)
Muscle tone is defined as the stiffness or resistance of the muscle to passive movement.
Stiffness is the result of the inherent viscoelastic or the mechanical properties of muscle
tissues. (Knutson and Owens 2003)
Mechanoreceptors, proprioceptors and nociceptive afferents of both joint capsules and
musculotendinous structures are seen as the probable "gateway" through which the nervous
system (motor "tone") would be influenced by a manipulation. It is implied that a reduction
of alpha-motorneurone excitability or the activity to innervated muscles results in the
"relaxation of hypertonic muscles". An explanation for the behaviour of this "hypertonic
muscle" is that its innervation is mediated by sensitized spinal interneurones. These muscles
elicit properties of secondary hyperalgesia; often described in association with "myofascial
trigger points" and have spontaneous electromyographic activity. "Taut bands" within the
10

muscle will give rise to increased muscle "stiffness" resulting from these hyperalgesic
regions. (Evans 2001)
It has been demonstrated that after a high-velocity, low-amplitude manipulation of the
zygapophyseal joints, reductions in spontaneous electromyographic activity of paraspinal
muscles as well as reduced hyperalgesia of paraspinal myofascial trigger points occurred.
(Hsieh and Hong 1990)
A study conducted by Herzog, Scheele and Conway (1999) concluded that high-speed, low-
amplitude spinal manipulative therapy results in clear, measurable and repeatable
electromyographic responses in a distinct area that is specific to the treatment administered
and that there is a direct link between the electromyographic response associated with SMT
and a reduction in electromyographic activity in hypertonic muscles.
The articular mechanoreceptor afferent nerve fibres travel to the motoneuron pools within the
central nervous system exerting coordinated reflexogenic effects on muscle tone. Collateral
branches from these afferent nerve fibres allow manipulation of an individual joint to effect
motor unit activity both in the muscle over the joint being manipulated, as well as in more
remote muscles, including those on the opposite side of the body. This mechanism gives rise
to the reflex changes in muscle tone with joint manipulation. (Wyke, Glasgow, Twomey,
Scull, Kleynhans and Idczak 1985)
It is anticipated that a high-velocity low-amplitude thrust activates mechanoreceptors and
proprioceptors from structures within and surrounding the manipulated joint. The distorted
afferent input coming from the stimulation of these receptors is thought to result in changes in
motoneuron excitability, leading to the disturbance of a projected pain-spasm cycle. (Suter,
McMorland, Herzog and Bray 2000)
The nervous system has been viewed as the intermediary of health and strength to all
individual organs and tissues. The dorsal root ganglia lie within the intervertebral canal in
close proximity to the articular capsule, except for the first and second cervical segments.
They contain all the cell bodies of all sensory neurons, except for those found in the cranial
nerves. The dorsal root ganglions are far more sensitive to mechanical stimulation than are
nerve roots, spinal nerves or peripheral nerves. (Lantz 1995)
11

The anterior primary divisions of L2 to S3 innervate the anterior part of the sacroiliac joint,
these divisions also project onto the femoral and tibial nerves which supply the main lower
limb. When the sacroiliac joint is being adjusted a change in the sensory input may affect
efferent pathways at different segmental levels of the spine. Neurophysiological effects of
spinal manipulation have been detected in distant body segments from where the
manipulations were performed. (Suter, McMorland, Herzog and Bray 2000)
2.3 STRETCHING
2.3.1 DEFINTION AND STRETCHING TECHNIQUES
Gatterman (1990) defines stretching as the separation of the origin and insertion of a muscle
or the attachments of fascia or ligaments by applying constant pressure at a right angle to the
fibre of the muscle or fascia.
Stretching refers to the process of muscle lengthening. There are five stretching techniques.
Static stretching involves stretching a muscle to the point of discomfort and then holding it at
this point for a certain time. Although this form of stretching is the safe and efficient; it does
very little to improve coordination and lacks specificity. Ballistic or dynamic stretching
makes use of bobbing, bouncing, rebounding and rhythmic types of movement where
momentum moves the body or limb to forcibly increase the length of the muscle. This is a
controversial method of stretching as it does not provide enough time for the muscle tissues to
adapt to the stretch. It increases muscle tension by initiating the stretch reflex, but makes it
more difficult to stretch connective tissue. The passive stretching technique is done with the
muscle relaxed and not making any contribution to the range of motion. An external force is
used to increase range of motion. It allows for stretching beyond the active range but has a
greater risk of soreness and injury if the external force is not used correctly. One
accomplishes active stretching by using your own muscles to increase range of motion
without external help. The advantage of this type of stretching is that one develops active
flexibility which is known to have a higher correlation with sport achievements than does
passive flexibility. Major disadvantages are that it initiates the stretch reflex and cannot be
used during injury or dysfunction. The fifth stretching technique is known as proprioceptive
neuromuscular facilitation which is discussed below. (Alter 1998)
12
2.3.2 PROPRIOCEPTIVE NEUROMUSCULAR FACILITATION (PNF)
Modified PNF-techniques have been shown to be superior to conventional stretching
techniques (Schuback, Hooper and Salisbury 2004). This stretching technique was initially
developed as a rehabilitative physical therapy procedure to improve range of joint motion
(Alter 1998). It applies neurophysiological principles which are grounded on the theory that
motor output is dependent on the sensory input and that antagonistic muscles are linked by
reflexes through reciprocal inhibition. Under the hypothesis that an inhibitory interneuron
decreases the activity in the alpha-motor neuron to the antagonist muscle, it is suggested that
PNF-methods, especially those concerning reciprocal activation, provide the best potential for
muscle lengthening. (Schuback, Hooper and Salisbury 2004)
2.4 MUSCLE FLEXIBILITY
2.4.1 DEFINITION
Flexibility is crucial to allow for the greatest effectiveness of the musculoskeletal system
(Buschbacher 2002). Gatterman (1990) defines flexibility as the ability of a structure to
deform under the submission of load. Kendall, McCreary and Provance (1993) expand on
this definition stating flexibility to be the ability to willingly adapt to changes in position or
alignment. Prentice and Voight (2001) defined flexibility as the ability to move a joint or
series of joints through a full, non-restricted, pain-free range of motion.
2.4.2 THE IMPORTANCE OF FLEXIBILITY
Flexibility is reliant on both joint range of motion and muscle flexibility. For most activities
of daily life "normal" flexibility is required. However sport related activities require
increased flexibility for peak performance. Therefore a lack of flexibility may result in poor
sport performance and uncoordinated or uncomfortable movement patterns. It is also true that
poor flexibility increases the chance of musculotendinous injuries. (Prentice and Voight
2001)
13

Schuback, Hooper and Salisbury (2004) confirm and elaborate on this by stating that the
flexibility of the quadriceps muscles, thus including the rectus femoris muscle, is vital in
injury prevention, postural and muscular imbalance, preservation of full joint range of motion,
finest musculoskeletal function and advanced performance in sports.
2.5 THE RECTUS FEMORIS MUSCLE
The rectus femoris muscle forms part of the quadriceps femoris muscle group. This muscle
group forms the anterior muscle bulk of the thigh and consists of four muscles; the rectus
femoris, vastus lateralis, vastus intermedius and the vastus medialis muscles. Distally all four
muscles in the quadriceps femoris group have a common attachment on the patella and a
sesamoid bone; which is attached to the tibial tuberosity by the patellar ligament. (Travell
and Simons 1997)
The quadriceps muscle group is the largest and most powerful muscle in the body and is
known as the great extensor of the leg (Moore and Dailey 1999).
2.5.1 ANATOMICAL ATTACHMENTS
The rectus femoris muscle crosses both the hip and the knee joints. As illustrated in figure 2.6
it is located between the vastus lateralis and vastus medialis muscles and on top of the vastus
intermedius muscle. Proximally the rectus femoris has two tendons that attach to the anterior
inferior iliac spine and to the furrow above the posterior brim of the acetabulum. Its distal
tendon joins the three vasti muscles to attach to the proximal border of the patella. It is
indirectly linked to the tibia via the patellar ligament that spans the distal border of the patella
and the tibial tuberosity. The rectus femoris muscle is crossed obliquely by the sartorius
muscle from the anterior inferior iliac spine to its medial border. Anatomical variations are
rare, where the rectus femoris muscle has only one proximal attachment to either the anterior
inferior iliac spine or to the rim of the acetabulum. (Travell and Simons 1997)
14

Rectus femoris
Vastus lateralis
Lateral patellar
retinaculum
Patellar ligament_
Vastus medialis
Patella
Medial patellar
retinaculum
Tibial tuberosity
Tibia
Anterior inferior
iliac spine
Level of Cross
section
Figure 2.6: Anatomical Attachments of the Rectus Femoris Muscle. (Travell and Simons
1997)
2.5.2 INNERVATION
The quadriceps femoris muscle group shares nerve innervation from branches of the femoral
nerve, which is composed of the second, third and fourth lumbar spinal nerves. The femoral
nerve runs deep to the sartorius muscle and then enters the adductor canal along the medial
border of the vastus medialis, which receives direct innervation from branches of the femoral
nerve. Branches of the femoral nerve then travel between the rectus femoris and the vastus
intermedius muscles to supply the remaining three quadriceps muscles. A strand from one of
the branches of the femoral nerve that supplies the vastus intermedius muscle pierces the
muscle and innervates the articularis genu muscle and the knee joint. (Travel! and Simons
1997) The innervation of the rectus femoris muscle is shown in figure 2.7.
15

Lateral circumflex femoral artery •
Deep femoral artery
Rectus femoris --muscle
Adductor - longus muscle
Lateral femoral cutaneous nerve (cut) Tensor fasciae latae muscle (retracted)
Sartorius muscle (cut)
Gluteus scle minim us
and medius muscles Femoral nerve,
artery and vein
Pectineus muscle
Vastus Adductor canal medialis (opened by muscle removal of
sartorius muscle)
Saphenous nerve
Nerve to vastus medialis muscle
Adductor magnus muscle
Membranous roof of distal adductor canal covers entrance of femoral vessels to popliteal space
Saphenous nerve and saphenous
• branch of descending genicular artery
Sartorius muscle (cut)
Articular branch of descending genicular artery (emerges from vastus medialis muscle)
Patellar plexus
Infrapatellar branch of Saphenous nerve
Medial superior genicular artery (from popliteal artery)
Medial inferior genicular artery (from popliteal artery)
Figure 2.7: Arteries and Nerves of Anterior Thigh. (Netter 1994)
16

2.5.3 FUNCTIONS
The four heads of the quadriceps femoris muscle work together as the main extensors of the
leg at the knee when the leg and foot are free to move. The rectus femoris muscle crosses
both the hip and the knee joint and therefore, depending on the segment that is fixed, either
flexes the thigh at the hip or flexes the pelvis on the thigh, it also aids in abduction of the
thigh in supine subjects. During standing and body positioning there is late activation of the
rectus femoris muscle with hip flexion, backward bending, squatting and sitting down.
During stair climbing the rectus femoris muscle activity starts at the beginning of the stance
phase until the second phase of double support, when the opposite foot is placed on the step
above. When descending stairs, the rectus femoris muscle is active during the stance period,
but is most active at the start and end of stance. The rectus femoris muscle is very active
when one lifts an object with the knees flexed and the activity in the rectus femoris doubles
when the load being lifted is held away from the body. (Travell and Simons 1997)
2.5.4 ACTIONS THAT SHORTEN THE RECTUS FEMORIS MUSCLES
Overload of any muscle will result in it becoming shortened over a prolonged period of time.
Therefore use a safe technique that spares your quadriceps as well as your paraspinal muscles
to lift heavy objects off the floor, when doing the squatting exercise never bend the thigh
lower than horizontal or parallel to the floor and when rising from a deep seated chair use
your arms to assist your quadriceps muscles. Prolonged immobilisation of the rectus femoris
will also result in it becoming shortened. Therefore avoid sitting in an acute angle of hip
flexion, do not sit with one foot under the other buttock for prolonged periods of time and do
not sleep with your hips flexed and your knees extended as it will place your rectus femoris
muscles in a shortened position resulting in it becoming shortened. (Travell and Simons
1997)
17

2.6 POSTURE
2.6.1 IDEAL POSTURE
The ideal posture viewed from the side, is described by making use of a plumb alignment with
both anatomical structures and surface landmarks on the body that coincide with the plumb
line (Kendall, McCreary and Provance 1993).
When examining ideal posture from a side view, surface landmarks can be used in relation to
the plumb line. The plumb line should run through the ear, through the bodies of the cervical
vertebrae and through the shoulder joint, provided that the arms hang in normal alignment in
relation to the thorax. The plumb line then roughly halves the trunk and runs approximately
through the greater trochanter of the femur. It continues slightly anterior to a midline through
the knee and ends a little anterior to the lateral malleolus of the ankle. (Kendall, McCreary
and Provance 1993)
When using anatomical structures that concur with the line of reference, the apex of the
coronal suture is somewhat anterior to the plumb line. The plumb line should run through the
external auditory meatus, through the axis of the odontoid process, through the bodies of the
lumbar vertebrae and through the sacral promontory. The centre of the hip should lie slightly
anterior to the plumb line and the axis of the knee joint should be posterior in relation to the
plumb line. Lastly the plumb line should intersect the calcaneocuboid joint. (Kendall,
McCreary and Provance 1993)
Figure 2.8 illustrates this posture analysis with both the surface landmarks and the anatomical
structures. The subject in the figure shows excellent postural alignment except for slight
anterior head carriage. In the lateral view, the anterior and posterior muscles attaching to the
pelvis should maintain it in ideal alignment. Anteriorly the abdominal muscles pull upwards
and the hip flexors pull downward. On the posterior aspect the back muscles pull upward and
the hip extensors pull downward. (Kendall, McCreary and Provance 1993)
18

Back Extensors Abdominals
Rectus abdominis External oblique
Hip Flexors Psoas major Iliacus
Tensor fasciae latae
Rectus femoris
Hip Extensors
Gluteus maximus
Hamstrings
Figure 2.8: Ideal Posture (Kendall, McCreary and Provance 1993)
2.6.2 POSTURE TYPES
The normal curves of the spine consist of a slight cervical and lumbar lordosis and a slight
thoracic kyphosis. A normal lumbar curve will result in a neutral pelvis alignment. In faulty
postural positions the pelvis may be anterior, posterior or laterally tilted. Any tilting of the
pelvis results in a faulty alignment of the spine and hip joints. In figure 2.9 view B the pelvis
is tilted anteriorly resulting in flexion of the hip joint; the lower back arches forward causing
19

B
Kyphosis-lordosis posture. Flat-back posture. Sway-back posture. Ideal alignment
an excessive lumbar lordosis. A posteriorly tilted pelvis is demonstrated in views C and D.
The pelvis tilts backwards and the hip joints then extend causing the lumbar spine to flatten.
In a lateral pelvic tilt, the one hip is higher than the other and this then creates a spinal
scoliosis with the convexity toward the low side of the pelvis. (Kendall, McCreary and
Provance 1993)
Figure 2.9: Four Types of Postural Alignment (Kendall, McCreary and Provance 1993)
2.6.3 POSTURE AND SHORTENED RECTUS FEMORIS MUSCLES
Shortening of different muscle groups, particularly in the hip and the two joint muscles, can
add to a range of postural and joint dysfunctions (Scully and Barnes 1989).
20

Increased cervical curve
Increased thoracic curve
Increased lumbar curve
Anterior pelvic tilt
Shortened rectus femoris muscles may result in an anterior pelvic tilt due to its attachment to
the pelvis. An anterior pelvic tilt, illustrated in figure 2.10, leads to biomechanical changes in
the entire body that result in unhealthy postures like; the "Kyphosis-Lordosis Posture" (Figure
2.11) and the "Military-Type Posture" (Figure 2.12). (Kendall, McCreary and Provance
1993)
Figure 2.10: Excessive Anterior Pelvic Tilt Resulting in an Increased Lumbar Lordosis.
(Levangie and Nortin 2001)
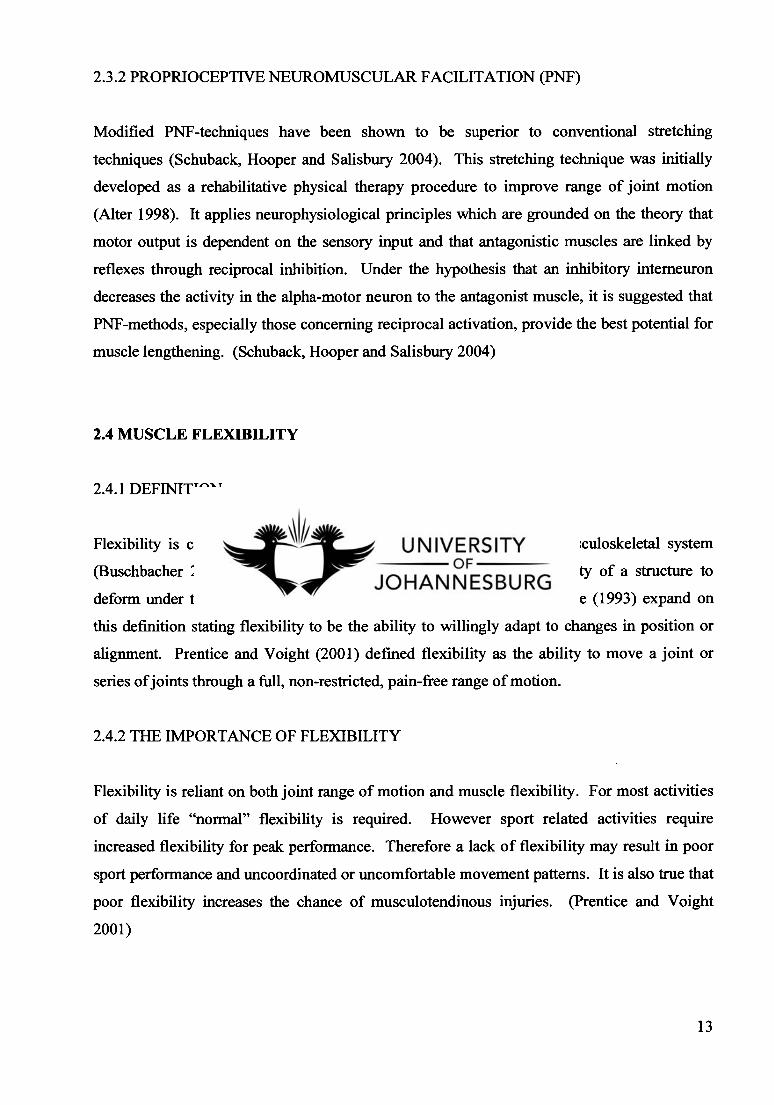
Figure 2.11 illustrates the resultant kyphosis lordosis posture type due to an anterior pelvic
tilt. Anterior head carriage and cervical hyperextension are present. The scapulae are
abducted on the hyperkyphotic thoracic spine. The lumbar lordosis is excessive, the pelvis is
tilted anteriorly and the hip joints are flexed. The knee joints are slightly hyperextended
while the ankle joints exhibit slight plantar flexion due to the backward inclination of the leg.
21
The neck extensor and hip flexor muscles; including the rectus femoris muscles, are short and
strong. The weak and elongated muscles include the neck flexors, the erector spinae and
external oblique upper back muscles. The hamstring muscles are slightly elongated but may
not be weak. The rectus abdominis is not necessarily elongated but due to the depressed
position of the chest it offsets the effect of the anterior pelvic tilt. (Kendall, McCreary and
Provance 1993)
Figure 2.11: Kyphosis-Lordosis Posture. (Kendall, McCreary and Provance 1993)
In the military type posture (figure 2.12) the head is in the neutral position with normal
cervical and thoracic curves. A hyperlordosis is noted in the lumbar spine as well as an
anterior pelvic tilt, slightly hyperextended knees and slightly plantar flexed ankle joints. The
anterior abdominals are weak and elongated while the hamstrings are elongated but may not
22

be weak. The lower back and hip flexor muscles are perceived as short and strong. (Kendall,
McCreary and Provance 1993)
Figure 2.12: Military-Type Posture. (Kendall, McCreary and Provance 1993)
In these postures where there is excessive anterior pelvic tilt as a result of shortened hip
flexors like the rectus femoris muscles, the lower lumbar vertebrae are forced anteriorly. The
upper lumbar vertebrae compensate for this by moving posteriorly to keep the head over the
sacrum. The result is an increase in the lumbar lordosis and in order to balance the lordotic
lumbar curve and keep the head over the sacrum, the posterior convexity of the thoracic spinal
curve increases and becomes kyphotic. The cervical concave curve will also increase to keep
the head over the sacrum. (Levangie and Nortin 2001)
23

Facet joints are innervated by the medial branch of the dorsal rami and are pain sensitive.
These unhealthy postures cause positional changes in facet joint orientation. This results in
biomechanical dysfunction of the facet joints and is a possible source of lower back pain.
(Souza 2001)
Mechanical dysfunctions that may develop as a result of the posture changes may be altered
by correcting the flexibility of the rectus femoris muscle (Kendall, McCreary and Provance
1993).
The body makes its own compensations to maintain the head over the sacrum, but these
postural changes are never as proficient as the posture being replaced. A person with
shortened hip or knee flexors, thus including rectus femoris muscles, is not able to maintain a
normally contoured and upright spinal posture. Instead, the body reacts by tilting the pelvis
anteriorly creating an increased lumbar lordosis. Resulting compensations include an
increased thoracic kyphosis and a cervical lordosis with an anterior head carriage. In this
resultant posture the head is still oriented over the sacrum but most points on the trunk have
been displaced farther from the centre of gravity, therefore the torque necessary to maintain
alignment of these segments is far greater. In turn this results in excessive joint degeneration.
Finally as a result of the hip and knee flexors being tight the sternocleidomastoid muscles
become tight due to the forward head posture and the lumbar erector spinae muscles tighten
up from the increased lumbar lordosis. In addition to these shortened muscles their
antagonistic muscles weaken. (Scully and Barnes 1989)
Previous studies have shown that adjusting the specific spinal level of innervation of a certain
organ or muscle had an effect on that structure due to reflex responses resulting from the
adjustment (Budgell 2000).
Therefore by adjusting a certain spinal level to affect a specific muscle's flexibility will in
turn have a positive effect on posture and a good posture is necessary for optimal spinal health
(Levangie and Nortin 2001).
24

CHAPTER THREE - METHODOLOGY
The purpose of this study was to determine and compare the effect of innervation specific
lumbar spine adjustments and stretching; on the flexibility of the rectus femoris muscles in
asymptomatic subjects with bilateral rectus femoris muscle contracture.
3.1 PATIENT RECRUITMENT
Recruitment of subjects was done by placing advertisement posters around the University of
Johannesburg, Doornfontein Campus (Appendix A).
3.2 PATIENT SELECTION AND INCLUSION CRITERIA
Subjects who responded to the advertisement were contacted to schedule an appointment to
determine whether or not the subject fulfilled all the inclusion criteria. Subjects who fulfilled
the following criteria were included in the study:
• Positive bilateral rectus femoris contracture tests:
Rectus femoris muscle shortening demonstrated with the Rectus Femoris
Contracture test (Appendix B). This test is also known as the Kendall Test and
was used to measure the knee flexion angle of the tested leg. This angle is
linked to the length of the rectus femoris muscle. The subject lay supine with
their pelvis close to the edge of the plinth. The subject then flexed one knee
and hip and held it close to their chest until their spine was passively pushed
flat on the plinth. The opposite leg was the test leg and remained relaxed and
hanging over the edge of the plinth. The test leg's angle of knee flexion should
remain at 90 degrees when the opposite leg is flexed to the chest to indicate a
negative or normal test. This knee flexion angle was then measured with a
goniometer by using the line of the femur as zero degrees. A straight test leg
would be measured as 0 degrees. If the test leg extends beyond 90 degrees of
25

knee flexion a positive rectus femoris contracture is present and indicates a
shortened rectus femoris muscle. (Magee 2002)
Between the ages of 20 and 30 years.
Subjects were excluded if they displayed:
A history or presence of osteoarthritis, pathology or any symptoms of pain, stiffness,
swelling and decreased range of motion in the hips, knees or lower back.
Any conditions that were contraindicated to chiropractic adjusting (Appendix C).
3.3 PATIENT ETHICS
During this study ethical measures were applied by; ensuring autonomy of the participating
subjects, informing them about their voluntary participation and freedom to withdraw at any
time during the study. Privacy, confidentiality and anonymity were strictly applied at all
times. All subjects were informed about the benefits of the study and feedback concerning
the study was given on request. After the subjects received and understood all the above
information they gave their informed consent through their signature on the subject
information and consent form (Appendix D).
3.4 SAMPLE SIZE AND TREATMENT REGIME
Subjects who fitted all the inclusion criteria for this study were randomly placed into one of
three groups. The subjects were asked to pull a designated group number out of a closed bag.
Each group consisted of two males and two females. Group 1 received a combination of
lumbar spine rotary adjustments (L2-L4) and PNF stretching of their rectus femoris muscles.
Group 2 was the stretching group and only received PNF stretching. Group 3 was the
adjustment group and only received a rotary lumbar spine adjustment on each treatment.
26

3.5 PROCEDURE
3.5.1 FIRST VISIT
All subjects that fitted the inclusion criteria received identical diagnostic assessments after
being placed in their designated groups. The first visit was scheduled and involved the
following:
Completing a case history (Appendix E)
Under going a pertinent physical examination (Appendix F)
Assessments of the lumbar spine and pelvis (Appendix G), hip (Appendix H) and
knee (Appendix I) regional examinations.
Signing an informed consent form (Appendix D)
All these regional examinations were done to confirm that no hip, knee and or spinal
osteoarthritis, or any other condition affecting normal knee and hip range of motion existed.
3.5.2 FOLLOW-UP VISITS
All subjects were treated twelve times over a four to six week period.
Follow-up visits were 10-15 minutes in duration.
A maximum of three days between follow-up treatments was allowed.
Objective measurements in the rectus femoris contracture test position were performed
with a goniometer before and after each treatment in the follow-up visit (Appendix J).
3.5.3 TREATMENT AT FOLLOW-UP VISITS
All follow-up treatments for group 1 consisted of the following:
Bilateral objective measurements in the rectus femoris contracture test (Appendix J)
position performed with a goniometer.
This pre-treatment reading was then documented in the SOAP notes (Appendix K). A
SOAP note is a summary of the objective and subjective findings, as well as the
diagnosis and the treatment plan.
Segmental lumbar spine rotary motion palpation was performed to determine which of
the L2/3, L3/4 or L4/5 segmental motion units were the most restricted. The subject
27

was seated and faced away from the examiner. The subject's arms were then crossed
over their chest. The examiner stood at the side of the subject and took a thumb
contact on the ipsilateral aspect of the lumbar spinous process. The subject was
rotated ipsilaterally to end range of motion. Segmental motion was felt while the joint
was challenged into further rotation. Loss of the segmental motion; where the spinous
process should approximate the palpating thumb, or loss of the springy end feel; which
is felt as the segment is challenged for joint play, indicates restricted motion. The
entire lumbar spine was palpated in this manner from cephalad to caudad. (States
1985)
Only one seated rotary lumbar spine adjustment known as the transverso-deltoid
adjustment (Appendix L) was then performed on the most restricted segment of L2/3,
L3/4 or L4/5 spinal motion unit. This adjustment can be applied to rotary restrictions
of the lower thoracic joints and all the lumbar vertebrae. The subject sat straddling the
table. Their arms were crossed over the chest; homolateral arm on top and their hands
placed onto the opposite shoulders. The doctor's position was 90 degrees posterior to
the patient. The doctor's contralateral arm reached around the subject and held onto
the subject's contralateral deltoid area. The doctor's homolateral hand made a
pisiform contact on the transverse or mamillary process of the restricted segment. The
doctor's contralateral arm rotated the subject's torso until the "joint slack" in the
restricted segment was removed. Simultaneously the doctor's homolateral contact
hand thrusted anteriorly with the elbow supported in the inguinal region. (Kirk,
Lawrence and Valvo 1991)
The level and side of the adjustment was recorded on the SOAP notes.
PNF stretching of both rectus femoris muscles was then performed (Appendix M).
The subject lay prone with the operator standing on the opposite side of the leg being
stretched. The operator used their cephalad hand to stabilise the subject's pelvis. The
subject's affected leg was flexed at the knee until maximum resistance in the rectus
femoris muscle was reached. This stretch was held for 10-15 seconds. This was
followed by a 7-10 second isometric contraction of the involved rectus femoris muscle
as the subject tried to straighten the leg against the operator's resistance. The subject
then activated the antagonistic muscles by actively flexing their knee. Finally the 10-
15 second stretch was repeated with the operator flexing the subject's knee (Chaitow
1996). A continued sustained stretch of anywhere between 6 to 60 seconds is
28

sufficient time for the golgi tendon organs to respond to the increase in tension. The
maximum time for the isometric contraction of the muscle being stretched is 10
seconds. This causes an increase in the tension that stimulates the golgi tendon organs
to result in a reflex relaxation of the antagonist before the muscle is stretched again.
This process is referred to as autogenic inhibition. (Prentice and Voight 2001)
Bilateral objective measurements in the rectus femoris contracture test (Appendix J)
position were performed with a goniometer.
This post-treatment reading was then documented in the SOAP notes (Appendix K).
All follow-up treatments for group 2 consisted of the following:
Bilateral objective measurements in the rectus femoris contracture test (Appendix J)
position performed with a goniometer.
This pre-treatment reading was then documented in the SOAP notes (Appendix K).
PNF stretching of both rectus femoris muscles was then performed as described for
group 1 (Appendix M).
Bilateral objective measurements in the rectus femoris contracture test (Appendix J)
position performed with a goniometer.
This post-treatment reading was then documented in the SOAP notes (Appendix K).
All follow-up treatments for group 3 consisted of the following:
Bilateral objective measurements in the rectus femoris contracture test (Appendix J)
position performed with a goniometer.
This pre-treatment reading was then documented in the SOAP notes (Appendix K).
Segmental lumbar spine rotary motion palpation was performed, as for group 1 to
determine which of the L2/3, L3/4 or L4/5 segmental motion units were the most
restricted.
Only one seated rotary lumbar spine adjustment known as the transverse-deltoid
adjustment (Appendix L) was then performed, as described for group 1 on the most
restricted segment of L2/3, L3/4 or L4/5 spinal motion unit.
The level and side of the adjustment was recorded on the SOAP notes.
Bilateral objective measurements in the rectus femoris contracture test (Appendix J)
position performed with a goniometer.
This post-treatment reading was then documented in the SOAP notes (Appendix K).
29

3.6 OBJECTIVE MEASUREMENTS AND THE EXECUTION THEREOF
The universal goniometer was used to achieve objective measurements. This measured the
knee flexion angle when the subject was positioned in the rectus femoris contracture test
position. Measurements were taken bilaterally on each knee before and after treatment. The
knee flexion angle in this test position relates to the length or flexibility of the rectus femoris
muscle. The goniometer is essential to assess improvement in joint flexibility and has an
important place in the clinical rehabilitation setting (Prentice 1997).
The axis of the goniometer was placed on the lateral aspect of the knee joint line above the
head of the fibula. This area was marked with a permanent marker on the first measurement
to ensure more accurate future measurements. The greater trochanter of the femur and the
lateral malleolus of the fibula were used as reference points for the protractor arms of the
goniometer. The stationary arm was placed on the femur while the other arm was movable
and aligned with the fibula.
3.7 VALIDITY AND RELIABILITY OF THE GONIOMETER
The goniometer is essential to assess improvement in joint flexibility and has an important
place in the clinical rehabilitation setting (Prentice 1997).
The protractor measures 180-degrees, with one axis that joins two arms. When measuring,
one arm is kept stationary on a definite landmark while the other arm is movable around the
axis or fulcrum of the protractor (MacDougall, Wenger and Green 1989).
Rothstein, Miller and Roettger (1983) did a study to assess the reliability of goniometeric
measurements of passive elbow and knee positions in symptomatic patients. The results
proved that intratester reliability and intertester reliability was highly reliable. (Rothstein,
Miller and Roettger 1983)
The reliability and validity of goniometric measurements at the knee joint was proved again in
1987 by Gogia, Braatz, Rose and Norton when they did a study on thirty healthy subjects
using a standard goniometer. (Gogia, Braatz, Rose and Norton 1987)
30

In 1997 the intertester and intratester criterion validity and reliability of the universal
goniometer were compared with the parallelogram goniometer for active knee flexion in
healthy subjects. The study proved to be of clinical importance and found that both types of
goniometers were equally reliable and valid when measuring active knee flexion. (Brouseau,
Tousignant, Budd, Chartier, Duciaume, Plamondon, O'Sullivan, O'Donoghue and Balmer
1997)
3.8 STATISTICAL ANALYSIS
One sample T-testing and curve fitting tests were done. Statistical data analysis was
performed by applying the results to mathematical graph patterns in order to obtain a visual
representation of the data and trends for each consecutive treatment.
The data was transformed into a percentage change to make the data more assessable. A five
percent significance level (p < 0.05) was used throughout the analysis.
Tests were then performed to see what percentage change for a given treatment was
significant from zero. The tests calculated the p-value, which is used to assess if the data was
statistically significant.
31

CHAPTER FOUR — RESULTS
4.1 INTRODUCTION
The objective data collected for this study was accumulated by using a universal goniometer
to measure the passive knee flexion angle, with the subject in the rectus femoris contracture
test position. The universal goniometer was shown to be a valid and reliable instrument
(Brouseau, Tousignant, Budd, Chartier, Duciaume, Plamondon, O'Sullivan, O'Donoghue and
Balmer 1997). Measurements were taken bilaterally before and after each treatment.
Graphs were constructed to determine if any of the groups followed recognisable
mathematical graph patterns to obtain a visual representation of the data and the trends for
each consecutive treatment.
To make the data more quantifiable, it was transformed into a percentage change. A five
percent significance level (p < 0.05) was maintained throughout the analysis. The after
treatment reading minus the before treatment reading divided by the before treatment reading
formula was used to calculate the percentage change. A positive value for the percentage
change indicates an improvement from the before treatment to the after treatment results for
the given treatment. Tests were then performed to see what percentage change for a given
treatment was significant from zero.
During the statistical testing both the parametric and non-parametric tests were adopted due to
the nature of the data and the p-value. A p-value is considered significant ifp<0.05.
This study proved to be of clinical importance and showed statistical significance.
32

4.2 DEMOGRAPHIC DATA
The subjects used for this study were aged between 20 and 30 years, the mean age was 25.3
years. Each group consisted of 50% male and 50% female subjects.
Subjects in group 1 were between 22 and 29 years of age, with a mean age of 25.5 years. In
group 2 the subjects were between 23 and 28 years of age and the mean age was 24.5 years.
Subjects in group 3 were between 23 and 29 years of age, with a mean age of 26 years.
Table 4.1 shows the above data in an all-inclusive format.
Table 4.1: Demographic Data
Data
Group 1
Combination
Group
Group 2
Stretch
Group
Group 3
Adjustment
Group
Combined
Total
Age Distribution 22-29 23-28 23-29 22-29
Mean Age 25.5 24.5 26 25.3
Gender
Distribution
2 Females
2 Males
2 Females
2 Males
2 Females
2 Males
6 Females
6 Males
33

4.3 BEFORE AND AFTER TREATMENT MEASUREMENTS IN ALL THREE
GROUPS
Before and after treatment results tables are a useful way to demonstrate the before and after
treatment changes in each group in comparison to consecutive treatments. In Table 4.2
(group 1), Table 4.3 (group 2) and Table 4.4 (group 3) the measurements are given as the
average value of the measurements of all the subjects in the specific group.
When analysing Table 4.2, it was noted that on the right leg that not all the before treatment
values on consecutive treatments were lower than the previous treatments' after treatment
values. On all treatments the after treatment values were higher than the before treatment
values.
Table 4.2: Group 1-Treatment Results
COMBINATION GROUP
Treatment
Number
Right Leg Left Leg
Before After Before After
1 52.3 56.0 50.0 56.3
2 57.3 62.3 52.5 55.8
3 56.5 62.8 56.3 63.3
4 58.3 62.8 56.8 60.3
5 63.5 64.8 58.8 63.5
6 67.0 68.5 60.0 63.8
7 60.5 64.3 56.5 60.5
8 63.8 64.8 57.5 61.3
9 59.0 63.3 58.3 65.3
10 61.0 65.5 59.8 62..8
11 65.3 67.8 59.3 61.5
12 62.8 66.0 57.3 60.0
The measurements of the left leg also showed that not all the before treatment values on
consecutive treatments were lower than the previous treatments' after treatment values. On
all treatments the after treatment values were higher than the before treatment values. The
biggest ranges between before and after treatment values were seen at treatment 1, 3, and 9.
34

A clinical significance of the treatment results in the combination group was noted. The
measurements on the right rectus femoris muscle showed that the average group reading
before treatment one was 52.3 degrees and the average group reading before treatment twelve
was 62.8. Therefore there was an improvement of 10.5 degrees in the flexibility of the right
rectus femoris muscle in the combination group. The difference for the combined group
readings before treatment one and before treatment twelve of the rectus femoris muscle on the
left leg indicated a clinically significant improvement in the rectus femoris flexibility of 7.3
degrees.
On the combined group readings for the right leg in the combination group the treatment
results after the first treatment was 56 degrees on average and 66 degrees on average for the
after treatment twelve readings. This showed a clinical significant improvement in the rectus
femoris muscle flexibility of 10 degrees for the group on average after the treatments. The
improvement in the flexibility of the rectus femoris muscle on the left leg after treatment one
was 56.3 and 60 after treatment 12. Therefore a 3.7 degree rectus femoris muscle flexibility
improvement was observed in the left leg.
In table 4.3 results of the right leg showed a gradual rise from treatment 1, with the peak of
the results at treatment 8 followed by a decrease in values with the fmal treatment value
higher than the starting value. On all treatments the after treatment values were higher than
the before treatment values. The results of the left leg indicates that in all treatments the after
treatment values were higher than the before treatment values. Treatment 1 showed the
biggest improvement between before and after treatment values and a slightly improved norm
value at treatment 12, although this final reading was higher than the reading at the start of the
treatment 1.
35

Table 4.3: Group 2-Treatment Results
STRETCH GROUP
Treatment
Number
Right Leg Left Leg
Before After Before After
1 49.0 55.0 47.8 56.8
2 49.3 52.5 54.0 52.8
3 53.0 56.5 54.5 55.3
4 55.8 57.3 54.8 56.0
5 60.0 62.3 57.8 61.8
6 59.8 67.0 55.8 59.3
7 61.5 62.3 58.8 59.8
8 63.5 65.5 58.0 58.5
9 63.3 64.3 58.0 60.0
10 62.3 63.0 57.8 58.8
11 60.3 57.5 58.8 57.3
12 57.3 58.8 56.3 56.5
A clinical significance of the treatment results in the stretch group was noted. The
measurements on the right rectus femoris muscle showed that the average group reading
before treatment one was 49 degrees and the average group reading before treatment twelve
was 57.3. Therefore there was an improvement of 8.3 degrees in the flexibility of the right
rectus femoris muscle in the combination group. The difference for the combined group
readings before treatment one and before treatment twelve of the rectus femoris muscle on the
left leg indicated a clinical significant improvement in the rectus femoris flexibility of 8.5
degrees.
On the combined group readings for the right leg in the stretch group the treatment results
after the first treatment was 55 degrees on average and 58.8 degrees on average for the after
treatment twelve readings. This showed a clinically significant improvement in the rectus
femoris muscle flexibility of 3.8 degrees for the group on average after the treatments. The
flexibility of the rectus femoris muscle on the left leg after treatment one was 56.8 and 56.5
after treatment 12.
36

Table 4.4 showed that in the right leg measurements there were a constant gradual rise from
treatment 1 through to treatment 12. It was noted that there was a decrease in the range of
before and after treatment values towards the end of the treatment program. The consecutive
before treatment values are lower than the previous after treatment values. On all treatments
the after treatment values are higher than the before treatment values. The results of the left
leg measurements indicated that a gradual rise in the graph pattern was noted. Gradual
consistent improvements were seen from treatment 1 to treatment 12. On all treatments the
after treatment values are higher than the before treatment values.
Table 4.4: Group 3-Treatment Results
ADJUSTMENT GROUP
Treatment
Number
Right Leg Left Leg
Before After Before After
1 57.3 64.8 56.8 65.5
2 60.8 68.8 55.8 58.5
3 59.8 65.8 61.5 62.8
4 64.0 70.0 61.3 66.8
5 63.8 66.8 61.8 67.5
6 66.0 70.8 65.0 71.5
7 68.0 72.5 67.3 71.5
8 70.0 72.8 65.3 70.3
9 70.3 72.5 68.3 71.5
10 72.5 75.7 70.0 76.0
11 75.3 80.0 68.5 76.5
12 77.3 80.3 71.8 77.8
A clinical significance of the treatment results in the adjustment group was noted. The
measurements on the right rectus femoris muscle showed that the average group reading
before treatment one was 57.3 degrees and the average group reading before treatment twelve
was 77.3. Therefore there was an improvement of 20 degrees in the flexibility of the right
rectus femoris muscle in the combination group. The difference for the combined group
readings before treatment one and before treatment twelve of the rectus femoris muscle on the
37

left leg indicated a clinical significant improvement in the rectus femoris flexibility of 15
degrees.
On the combined group readings for the right leg in the adjustment group the treatment result
after the first treatment was 64.8 degrees on average and 80.3 degrees on average for the after
treatment twelve readings. This showed a clinical significant improvement in the rectus
femoris muscle flexibility of 15.5 degrees for the group on average after the treatments. The
improvement in the flexibility of the rectus femoris muscle on the left leg after treatment one
was 65.5 and 77.8 after treatment 12. Therefore a 12.3 degree rectus femoris muscle
flexibility improvement was observed in the left leg.
4.4 WILCOXON TESTING
The Wilcoxon testing was done to determine if the improvement in rectus femoris flexibility
in each separate group was of any statistical significance. Note that in this test the level of
significance used was p < 0.10. The p-values, in bold, indicates a high level of statistical
significance. The Wilcoxon test is a non-parametric test used for the data of small groups.
Because of the size of the groups, p < 0.10 was used to indicate the significance at a 90%
level instead of a 95% level where p< 0.05.
38

Table 4.5: Wilcoxon Test (Right Leg)
GROUP MEAN STANDARD DEVIATION
TREATMENT 12 (AFTER) —
TREATMENT 1 (BEFORE) (p < 0.10)
COMBINATION
Treatment 1: Right: Before 52.25 % 7.46 %
0.066 Treatment 12: Right: After 66 % 8.29 %
STRETCH
Treatment 1: Right: Before 49 % 12.57 %
0.273 Treatment 12: Right: After 5 8.75 % 17 %
ADJUSTMENT
Treatment 1: Right: Before 57.25 % 14.98 %
0.069 Treatment 12: Right: After 0.25 % 80.25 7.93 %
The most extreme improvement in the rectus femoris flexibility on the right leg was evident in
the adjustment group, with an improvement of 23% percent; followed by the combination
group, with an improvement of 13.75% and lastly by the stretch group with an improvement
of 9.75 %. With p < 0.10 the combination group had the most statistical significance,
followed by the adjustment group and then by the stretch group.
39

Table 4.6: Wilcoxon Test (Left Leg)
GROUP MEAN STANDARD DEVIATION
TREATMENT 12 (AFTER) —
TREATMENT 1 (BEFORE)
(p < 0.10
COMBINATION
Treatment 1: Left: Before
50 % 14.99 % 0.144
Treatment 12: Left: After
60 % 4.76 %
STRETCH
Treatment 1: Left: Before
47.75 % 16.15 % 0.068
Treatment 12: Left: After
56.5 % 14.48 %
ADJUSTMENT
Treatment 1: Left: Before
56.75 % 11.53 % 0.068
Treatment 12: Left: After
77.75 % 4.65 %
The most extreme improvement in the rectus femoris flexibility on the left leg was evident in
the adjustment group, with an improvement of 21% percent; followed by the combination
group, with an improvement of 10% and lastly by the stretch group with an improvement of
8.75 %. With p < 0.10 the stretch and adjustment group had the same clinical significance,
followed by the combination group in the left leg.
4.5 SCATTERPLOT OF PERCENTAGE CHANGES
These scatterplot graphs were used to visualise the group treatment results in relation to each
other. Loess curves were fit to the treatment results per group to visually compare the
percentage change in the flexibility or muscle length per treatments. In the loess method,
weighted least squares are used to fit linear or quadratic functions of the predictors at the
centres of neighbourhoods. The radius of each neighbourhood was chosen so that the
neighbourhood contains a specified percentage of the data points. (Cohen 2001)
40

15.00—
10.00 — rV
C coo -c
n
▪
o ffs 5.00 —4-1 C IV
0_ ..ea
no 0.00—
-5.00 —
2
4 6 8
10
12
Treatment
a
Group Combo
Stretch 0 Adjust
Fit line for Combo
Fit line for Stretch
- Fit line for Adjust
Graph 4.1: Loess Curve Fit per Group Average (Right Leg)
In graph 4.1 the combination group is indicated in blue and showed an improvement until
treatment 4. From treatment 4 to 6 the treatment results of the rectus femoris muscle
flexibility slightly decreased and thereafter a gradual improvement is seen until treatment 10
where there was a slight decrease in the flexibility of the rectus femoris muscles to the end of
the treatment protocol. The green line indicates the stretch group that had a good initial
improvement in the flexibility of the rectus femoris muscles but had a great decrease in the
flexibility of the rectus femoris muscles until treatment 4 and then a more gradual decrease in
the flexibility of the rectus femoris muscles towards treatment 10. Between treatments 11 and
12 the graph rises and falls down to the same level again. The adjustment group is the red
line. This group had the best initial improvement in the flexibility of the rectus femoris
muscles and shows a gradual decrease in the flexibility of the rectus femoris muscles
throughout the treatment protocol.
41

fin C 15.00 — Id -C
01 Of 4111+ 10.00 C
11. ir 5.00 -• w
Group Combo Stretch
0 Adjust Fit line for Combo
Fit fine for Stretch
Fit fine for Adjust
1 4 8 8 10 12
Treatment
Graph 4.2: Loess Curve Fit per Group Average (Left Leg)
Graph 4.2 indicates that all the groups had the biggest improvement at treatment 1. The
combination group is indicated in blue and shows a gradual decline in the flexibility of the
rectus femoris muscles up to treatment 5. Between treatments 5 and 7 a plateau was reached.
Thereafter a rise was noted until just after treatment 8, from here to treatment 12 the graph
tapers down. The stretch group in green shows the greatest improvement in the flexibility of
the rectus femoris muscles at treatment 1, but falls dramatically from treatment 1 to treatment
3. From treatment 4 to treatment 5 a rise in the graph indicating a decrease in the flexibility
of the rectus femoris muscles are indicated but again the graph tapers down toward treatment
7. Then between treatment 8 and 9 a slight improvement in the flexibility of the rectus
femoris muscles occurs but from treatment 10 to 12 the graph drops again to a level above
zero. The red line illustrates the adjustment group. At treatment 1 there was a good initial
improvement in the flexibility of the rectus femoris muscles; from treatment 1 to 3 a fall in the
graph is indicated. Between treatment 3 and 6 the graph rises only to gradually drop in the
flexibility of the rectus femoris muscles until treatment 8. From treatment 8 to 12 an
improvement in the flexibility of the rectus femoris muscles was seen and this was noted to be
42

the greatest of all the groups. At the end of the treatment all the groups showed improvement
in the flexibility of the rectus femoris muscles.
4.6 ONE-SAMPLE T-TEST STATISTICS
One sample T-testing was done to the combination and adjustment groups. The
measurements of the leg ipsilateral to the side of the spine being adjusted as well as on the
measurements of the leg correlating to the side of the spine not being adjusted, to determine if
the side of the spine being adjusted had a greater effect on the correlating leg being measured.
The after treatment reading minus the before treatment reading divided by the before
treatment reading formula was used to calculate the percentage change. A positive value for
the percentage change indicates an improvement from the before treatment to the after
treatment results for the given treatment. Tests were then performed to see what percentage
change for a given treatment was significant from zero. Note that a 5 percent level of
significance was used where p < 0.05.
Table 4.7: Combination Group: Adjusted Side's Leg Measurements (One Sample
T-Test Statistics)
Test Value = 0
Treatment t
df Mean Standard Deviation
Significance (2-tailed) (p<0.05)
1 Percentage 2.663 3 16.6% 12.5% 0.076
2 Percentage 2.911 3 97.8% 6.7% 0.062
3 Percentage 3.462 3 14.2% 8.2% 0.041
4 Percentage 4.453 3 10.2% 4.6% 0.021
5 Percentage 14.185 3 6.5% 0.9% 0.001
6 Percentage 1.926 3 5.3% 5.6% 0.150
7 Percentage 4.090 3 8.1% 3.9% 0.026
8 Percentage 5.337 3 4.3% 1.7% 0.013
9 Percentage 0.998 3 7.1% 14.2% 0.392
10 Percentage 9.840 3 9.1% i 2% 0.002
11 Percentage 6.310 3 6.3% 2% 0.008
12 Percentage 3.332 3 8.3% 5% 0.045
43

In the combination group the mean and standard deviation of each treatment was calculated.
The mean gives an average score while the standard deviation reflects the amount by which
each score differs from, or is scattered about, the mean. From the above table we see that the
small standard deviation indicates that the scores do not vary greatly around the mean. Note
that at treatment 5, 10 and treatment 11 the biggest improvement occurred, as the significance
was 2-tailed. The sustainability of the treatment was proved by continued improvement at the
final treatments. The p-values, in bold, indicates a high level of significance (p < 0.05) in
more than 65 percent of the cases.
Table 4.8: Adjustment Group: Adjusted Side's Leg Measurements (One Sample
T-Test Statistics)
Test Value = 0
Treatment t df
Mean Standard Deviation
Significance (2-tailed) (p<0.05)
1 Percentage 2.597 3 15.% 11.6% 0.081
2 Percentage 3.910 3 13.% 6.7% 0.030
3 Percentage 4.733 3 10.6% 4.5% 0.018 4 Percentage 3.289 3 15.8% 9.9% 0.046
5 Percentage 3.747 3 12% 6.4% 0.033 6 Percentage 4.848 3 11.4% 4.7% 0.017 7 Percentage 3.477 3 10.3% 5.9% 0.040
8 Percentage 3.201 3 9.4% 5.9% 0.049 9 Percentage 4.673 3 6.8% 2.9% 0.019 10 Percentage 13.283 3 9.4% 1.4% 0.001
11 Percentage 2.328 3 14.3% 12.3% 0.102
12 Percentage 13.277 3 9.1% 1.4% 0.001
The mean and standard deviation of each treatment in the adjustment group had been
calculated. In the adjustment group the standard deviation was even smaller than in the
combination group, indicating that there is little variance around the mean. A sustained
improvement was noted throughout the treatment in the adjustment group. The p-value, in
bold, indicates a high level of significance (p < 0.05) in more than 80 percent of the cases.
44

Table 4.9: Combination Group: Unadjusted Side's Leg Measurements (One Sample
T-Test Statistics)
Test Value = 0
Treatment t df
Mean Standard Deviation
Significance (2-tailed) (p<0.05)
1 Unadjusted:Percentage 4.837 3 4.9% 2% 0.017
2 Unadjusted:Percentage 1.234 3 4.2% 6.7% 0.305
3 Unadjusted:Percentage 2.701 3 10.3% 7.6% 0.074
4 Unadjusted:Percentage 41.500 3 3.5% 0.2% 0.000
5 Unadjusted:Percentage 1.375 3 3.8% 5.6% 0.263
6 Unadjusted:Percentage 1.847 3 3.3% 3.8% 0.162
7 Unadjusted:Percentage 1.715 3 6.4% 7.4% 0.185
8 Unadjusted:Percentage 0.700 3 3.1% 8.7% 0.534
9 Unadjusted:Percentage 2.686 3 11.2% 8.3% 0.075
10 Unadjusted:Percentage 5.056 3 3.3% 1.3% 0.015
11 Unadjusted:Percentage 0.946 3 1.4% 2.95 0.414
12 Unadjusted:Percentage 2.649 3 2.1% 1.6% 0.077
In table 4.9 the mean and standard deviation of each treatment in the adjustment group had
been calculated. The standard deviation indicates little variance around the mean. Less
improvement is noted in the combination group measuring the unadjusted leg. The best
improvements occurred at treatment 4 and 10. The least improvement was noted at treatment
8. The p-value, in bold, indicates a low level of significance (p < 0.05) in less than 20 percent
of the cases.
45

Table 4.10: Adjustment Group: Unadjusted Side's Leg Measurements (One Sample
T-Test Statistics)
Test Value = 0
Treatment t df
Mean Standard Deviation
Significance (2- tailed)
(p<0.05)
1 Unadjusted:Percentage 2.321 3 13.4% 11.6% 0.103
2 Unadjusted:Percentage 5.454 3 4.8% 1.7% 0.012
3 Unadjusted:Percentage 1.504 3 2.1% 2.8% 0.230
4 Unadjusted:Percentage 1.850 3 4.6% 4.9% 0.161
5 Unadjusted:Percentage 1.642 3 1.8% 2.2% 0.199
6 Unadjusted:Percentage 1.601 3 7.4% 9% 0.208
7 Unadjusted:Percentage 1.545 3 3.7% 4.8% 0.220
8 Unadjusted:Percentage 1.147 3 3.6% 6.3% 0.335
9 Unadjusted:Percentage 1.430 3 1.4% 2% 0.248
10 Unadjusted:Percentage 2.533 3 3.5% 2.8% 0.085
11 Unadjusted:Percentage 1.594 3 4.3% 5.4% 0.209
12 Unadjusted:Percentage 5.371 3 3.2% 1.2% 0.013
In table 4.10 the mean and standard deviation of each treatment in the adjustment group had
been calculated. The standard deviation indicates little variance around the mean. Less
improvement is noted in the adjustment group measuring the unadjusted leg. The best
improvements were noted at treatment 2 and 12 and the lowest improvement occurred at
treatment 8. The p-value, in bold, indicates a low level of significance (p < 0.05) in less than
20 percent of the cases.
46

CHAPTER FIVE — DISCUSSION
5.1 TREATMENT EFFECT ON THE RECTUS FEMORIS MUSCLE
FLEXIBILITY
The results of the study will be discussed with reference to the statistical analysis performed
in Chapter 4, the hypothesis proposed in Chapter 1, and the theories to explain possible
outcomes discussed in Chapter 2.
All the subjects participating in this study had a positive rectus femoris contracture test.
Group 1 (combination group) and Group 3 (adjustment group) received a transverso-deltoid
adjustment. On each treatment a single adjustment was performed on the side of the detected
motion restriction that was perceived as being the worst. Group 1 (combination group) and
Group 2 (stretch group) received a PNF stretch of the rectus femoris muscles. The treatment
results of all groups were of clinical importance as the final measurements showed
improvement from the initial measurements (refer to tables 4.2 to 4.4).
5.2 BEFORE AND AFTER TREATMENT MEASUREMENTS IN ALL THREE
GROUPS
The results of table 4.2 indicated that there was no constant pattern of improvement or
worsening of the flexibility of the rectus femoris muscles. This might be because the
stretching and the adjustments are working against each other. Previous studies have shown
that adjusting the specific spinal level of innervation of a certain organ or muscle had an
effect on that structure due to reflex responses resulting from the adjustment (Budgell 2000;
Suter, McMorland, Herzog and Bray 1999 and Pollard and Ward 1997). It might be that the
reflex response created by the spinal adjustment works in competition with the stretch reflex
that occurs in muscles when being stretched, possibly because of the fact that "autogenic
inhibition" is the general function of the GTO excitation and involves the inhibition of the
contraction of the muscle within which it is found in order to help prevent damage due to
overloading of the muscle tissues (Knutson and Owens 2003).
47

Table 4.3 showed that the results on the flexibility of the rectus femoris muscles had an initial
improvement but then the rectus femoris muscle flexibility slightly tapered down towards the
end of the treatment. The outcome of the stretch reflex was a protective contraction, to
protect against further stretch so that the muscle maintains a constant length (Paul, Jaskoviak
and Schafer 1993). The effect of the stretch reflex can last up to a few minutes (Shankar
1999). This protective contraction, due to the stretch reflex, might be the reason why a
decrease in rectus femoris flexibility was noted towards the end of the treatment.
The results of group 3 were shown in table 4.4. A gradual and constant improvement in the
flexibility of the rectus femoris muscles was the trend and thought to be due to the stimulation
of the spinal nerve from the adjustments being delivered. Joint manipulation that results in an
articular cavitation has a particular reflex effect on the periarticular and muscular structures,
which is different from a mobilisation that involves progressive stretching (Maigne 1995).
With clinical significance the overall results indicated that the adjustment group had the
greatest improvement in the rectus femoris flexibility. The combination group had the second
best results of rectus femoris muscle flexibility improvement followed by the stretching
group.
53 WILCOXON TESTING
The results of both tables 4.5 and 4.6 showed statistical significance and prove the adjustment
group to be the most successful in improvement of the rectus femoris muscle flexibility. This
was possibly due to the stimulation of the nerves that innervate the rectus femoris muscle as
discussed previously. The combination group was second and the stretch group was third in
the level of improvement of rectus femoris muscle flexibility. The possible reasons for these
results were discussed above.
48

5.4 SCATTERPLOT OF PERCENTAGE CHANGES
Scatterplots being drawn showed the treatment results of all the groups in relation to each
other. All the groups had good initial improvement and ended with a final treatment
measurement greater than the starting measurement. The results on the right legs showed
Group 3 to have the greatest initial improvement followed by Group 2 and then Group 1.
Groups 1 and 3 showed a greater end result than Group 2 (refer to graph 4.1). On the left legs
the results of the initial treatment showed Group 2 to have the greatest improvement and
Groups 1 and 3 to start off on the same level of improvement. The final measurements
proved Group 3 to have the greatest improvement followed by Group 1 and lastly by Group 2
(refer to figure 4.8). This could be because the effect of the adjustment on the muscle
overrode the effect that the stretching had.
It is anticipated that a high-velocity low-amplitude thrust activates mechanoreceptors and
proprioceptors from structures within and surrounding the manipulated joint. The distorted
afferent input coming from the stimulation of these receptors is thought to result in changes in
motoneuron excitability, leading to the disturbance of a projected pain-spasm cycle. (Suter,
McMorland, Herzog and Bray 2000)
5.5 ONE-SAMPLE T-TEST STATISTICS
These tests in groups 1 and 3 indicated that the side of the spine being adjusted showed
greater improvement in the ipsilateral leg than in the contralateral leg. It also proved Group 3
to have had a more constant and greater improvement than the other groups. Both Groups 1
and 3 showed a statistically significant improvement in rectus femoris flexibility with Group 3
also having the greatest level of statistical significance (refer to tables 4.7 to 4.10). It may be
that when adjusting a lumbar vertebra on the right that the right nerve root is stimulated more
than on the left nerve root and therefore has a greater effect on the ipsilateral muscle that it
innervates.
The difference in the levels of rectus femoris muscle flexibility improvement between the
right and the left leg may be speculated as being related to a difference in the number of times
a certain side of the spine was adjusted in Group 1 and Group 3. In the groups that received
49

stretching dominancy of a specific leg might have affected the flexibility. It is common to
find one side of the body more resistant to stretching due to a number of factors (Shankar
1999). For example the different results in the two legs could be due to rotation in the pelvis.
If the sacroiliac joints are not being addressed pelvic rotation may lead to leg length
discrepancies which may affect the muscles in this area (Suter, McMorland, Herzog and Bray
1999).
5.6 SUMMARY
Muscle imbalances, like shortened rectus femoris muscles, are associated with habitual poor
posture, occupational or recreational activities in which there are repeated use of specific
muscles without sufficient exercise of antagonistic muscles. Imbalance that affects body
alignment is an essential factor in many painful postures. (Kendall, McCreary and Provance
1993)
Deviations from the optimal posture may be large enough to create unbalanced forces around
the joints and causes the body to compensate for these changes. Prolonged faulty postures
may over time result in structural adaptations. In the ideal posture the hip is in a neutral
position and the pelvis is level. Shortened rectus femoris muscles often result in an anterior
pelvic tilt which increases the lumbosacral angle. This causes an increase in the shearing
stress at the lumbosacral joint that in turn may produce an increased lumbar lordosis in a
standing posture. (Levangie and Nortin 2001)
Therefore the hypothesis proposed in Chapter 1 had been reached. In this study adjusting the
spinal level that is the level of innervation of the rectus femoris muscle showed statistically
significant improvement in the flexibility of the rectus femoris muscles in the group that
received only an adjustment as a treatment. The subjects in all three groups showed
improvement, with the results of the adjustment group being the best.
50

CHAPTER SIX — CONCLUSIONS AND RECOMMENDATIONS
6.1 CONCLUSIONS
Objective improvements in the flexibility of the rectus femoris muscles were shown in all the
groups but more so in the adjustment and combination groups. These improvements were
shown to be both clinically and statistically significant.
Thus, the study helps to support the hypothesis that adjusting the spine at the level that is the
level of innervation of the rectus femoris muscle showed statistically significant improvement
in the flexibility of the rectus femoris muscles in the group that received only an adjustment
as a treatment.
6.2 RECOMMENDATIONS
Improvements in the validity and accuracy of the results in the study may be achieved by
applying the following modifications to this study:
Use a larger sample group to give more statistically relevant information.
Use symptomatic subjects in the study. Patients with lower back pain or hip pain
could be used.
Have a two week post treatment follow-up measurements to determine if the treatment
had a lasting effect.
More accurate measurements could be taken by using a flexometer, as it consists of a
gravity needle and a strap that attaches to the limb. With this device there is no need to
identify the axis of rotation or to use anatomical land marks for measurements.
(MacDougall, Wenger and Green 1989)
A double-blinded study would make the study more objective and eliminate examiner
bias. A possible way to do this would be to have one doctor examine, the before
treatment measurement and treat the subject while another doctor does the
measurements after the treatment without knowing the pre-treatment readings.
51

Different lumbar spine adjustment techniques could be compared, for example, side
posture rotary lumbar adjustment.
A different stretching technique could also be applied.
Measure both passive and active knee joint flexion angle when measuring the rectus
femoris muscle flexibility.
Use subjects with the same dominant side to eliminate interference with results.
Wait a few minutes before remeasuring the resting muscle flexibility to allow the
effects of a possible stretch reflex to wear off.
52

References:
Alter MJ (1998). Sport Stretch, 2nd ed. Illinois: United Graphics, pp. 1-2, 6, 10-16.
Bolton DC (2000). Reflex Effects of Vertebral Subluxations: The Peripheral Nervous
System. An Update. Journal of Manipulative and Physiological Therapeutics, 23(2), pp.
101-103.
Brosseau L, Tousignant M, Budd J, Chartier N, Duciaume L, Plamondon S, O'Sullivan JP,
O'Donoghgue S and Balmer S (1997). Intratester and Intertester Reliability and
Criterion Validity of the Parallelogram and Universal Goniometers for Active Knee
Flexion in Healthy Subjects. Physiotherapy, 2(3), pp. 150-166.
Budgell BS (2000). Reflex Effects of Subluxation: The Autonomic Nervous System.
Journal of Manipulative and Physiological Therapeutics, 23(2), pp. 104 - 106.
Buschbacher MD (2002). Practical Guide to Musculoskeletal Disorders: Diagnosis and
Rehabilitation, 2nd ed. Boston: Butterworth-Heinemann, p. 30.
Cailliet R (1995). Lower Back Pain Syndrome, 5th ed. Philadelphia: R.G. Marton, p. 303.
Chaitow L (1996). Muscle Energy Techniques. New York: Churchill Livingstone, pp. 2, 3,
28, 29, 37, 74 and 75.
Cohen RA (2001). An Introduction to Proc Loess for Local Regression. London:
Williams and Wilkins, p.12.
Dishman JD, Ball KA and Burke J (2002). First Prize. Central Motor Excitability
Changes after Spinal Manipulation: A Transcranial Magnetic Stimulation Study.
Journal of Manipulative and Physiological Therapeutics, 25(1), pp. 1 -2.
53

Evans DW (2001). Mechanisms and Effects of Spinal High-Velocity, Low-Amplitude
Thrust Manipulation: Previous Theories. Journal of Manipulative and Physiological
Therapeutics, 25(4), p. 254.
Gattermann MI (1990). Chiropractic Management of Spine Related Disorders. London:
Williams and Wilkins, p. 144.
Gogia PP, Braatz JH, Rose SJ and Norton BJ (1987). Reliability and Validity of
Goniometric Measurements at the Knee. Physiotherapy, 76(2), pp. 192-5.
Haldeman S (2000). Neurologic Effect of the Adjustment. Journal of Manipulative and
Physiological Therapeutics, 23(2), pp. 112- 114.
Herzog W, Scheele D and Conway PJ (1999). Electromyographic Responses of Back and
Limb Muscles Associated with Spinal Manipulative Therapy. Spine, 24(2), pp. 151-152.
Hsieh J and Hong CZ (1990). Effect of Chiropractic Manipulation on the Pain Threshold
of Myofascial Trigger Point: A Pilot Study. Foundation for Chiropractic Education and
Research. Washington DC, pp. 359-363.
Kendall FP, McCReary EK and Provance PG (1993). Muscles Testing and Function, 4th ed.
Pennsylvania: Lippincott Williams & Wilkins, pp. 5, 71, 76, 102, 413.
Kirk CR, Lawrence DJ and Valvo NL, Eds (1991). States Manual of Spinal, Pelvic and
Extravertebral Technics, 2nd ed. Department of Chiropractic, National Collage of
Chiropractic, Illinois: Lombard, p. 103.
Knutson GA and Owens EF (2003). Active and Passive Characteristics of Muscle Tone
and Their Relationship to Models of Subluxation / Joint Dysfunction, Part 2. Journal of
the Canadian Chiropractic Association, 47(4), pp. 269-283.
Lantz CA (1995). The Vertebral Subluxation Complex. IN Foundations of Chiropractic
Subluxation. (Ed. Gatterman MI) Mosby. Baltimore, pp149-174.
54

Levangie PK and Nortin CC (2001). Joint Structure and Function: A Comprehensive
Analysis, 3rd ed. Philadelphia: Davis Company, pp. 412-414.
Luttgens K and Wells KF (1982). Kinesiology: Scientific Basis of Human Motion, 7th ed.
New York: CBS College Publishing, pp. 434, 435.
MacDougall I, Wenger KA and Green M (1989). Physiological Testing of the High-
Performance Athlete, 2" ed. McGraw-Hill Printers, p. 333.
Magee DJ (2002). Orthopedic Physical Assessment, 5th ed. Philadelphia: Saunders, pp.
631-632.
Maigne R (1995). Diagnosis and Treatment of Pain of Vertebral Origin. Baltimore,
Maryland: Williams & Wilkins, p. 219.
Moore KL and Dailey AF (1999). Clinically Oriented Anatomy, 4th ed. Pennsylvania:
Lippincott Williams & Wilkins, p. 532.
Netter FH (1994). Atlas of the Human Anatomy, 3rd ed. Switzerland: Ciba-Geigy
Limited, pp. 147, 470.
Paul A, Jaskoviak RC and Schafer FI (1993). Applied Physiotherapy, 2" ed. Virginia:
The American Chiropractic Association, pp. 56, 505.
Pollard H and Ward G (1997). A Study of Two Stretching Techniques for Improving Hip
Flexion Range of Motion. Journal of Manipulative and Physiological Therapeutics, 20(7),
pp. 443-447.
Prentice WE (1997). Rehabilitation Techniques, 3rd ed. McGraw-Hill Printers, p. 78.
Prentice WE and Voight MI (2001). Techniques in Musculoskeletal Rehabilitation. New
York: McGraw-Hill Companies, pp. 83-84, 198.
55

Rothstein JM, Miller PJ and Roettger RF (1983). Goniometeric Reliability in a Clinical
Setting. Elbow and Knee Measurements. Physiotherapy, 63(10), pp. 1611-5.
Schuback B, Hooper J and Salisbury L (2004). A Comparison of a Self-Stretch
Incorporating Proprioceptive Neuromuscular Facilitation Components and a Therapist-
Applied PNF-Technique on Hamstring Flexibility. Physiotherapy, 90, pp. 151-157.
Scully RM and Barnes MR (1989). Physical Therapy. Pennsylvania: Lippincott Company,
pp. 143, 457.
Shankar K (1999). Exercise Prescription. Philadelphia: Hanley and Belfus, pp. 33-36.
Souza A (2001). Differential Diagnosis and Management for the Chiropractor,
2nd ed. Maryland: Aspen Publishers, p. 112.
States AZ (1985). States Manual of Spinal, Pelvic and Extravertebral Technic, 2nd ed.
(Eds. Kirk CR, Lawrence DJ, Valvo NL) National College of Chiropractic, p. 98.
Suter E, McMorland G, Herzog W and Bray R (1999). Decrease in Quadriceps Inhibition
after Sacroiliac Joint Manipulation in Patients with Anterior Knee Pain. Journal of
Manipulative and Physiological Therapeutics, 22(3), pp. 149 - 153.
Suter E, McMorland G, Herzog W and Bray R (2000). Conservative Lower Back
Treatment Reduces Inhibition in Knee-Extensor Muscles: A Randomized Controlled
Trial. Journal of Manipulative and Physiological Therapeutics, 23(2), pp. 76-80.
Travell JG and Simons DG (1997). Myofascial Pain and Dysfunction. The Trigger Point
Manual, Vol. 2: The Lower Extremities. California: Lippincott Williams & Wilkins, pp.
254, 256-262, 283-284.
Valmassy RL (1996). Clinical Biomechanics of the Lower Extremities. Missouri: Mosby
Inc., pp. 133-138.
56

Wyke B, Glasgow E, Twomey L, Scull E, Kleynhans A and Idczak R, Eds (1985). Articular
Neurology and Manipulative Therapy. Aspect of Manipulative Therapy, 2nd ed. Churchill-
Livingston, pp. 72-77.
57

APPENDIX A: ADVERTISEMENT
Come f®l flee CilT.L-ofplaztc toeffftmellavo
At TWR Day Clinic Gate 7, Sherwell Road, Doornfontein
Take part in a research study that is aimed to improve your hip and knee flexibility.
(Participants must be between the ages of 20 to 30)
Contact Anee Boshoff For further information
083 564 7573
58

APPENDIX B: RECTUS FEMORIS CONTRACTURE TEST
Negative Rectus Femoris Contracture Test
Positive Rectus Femoris Contracture Test
A
59

APPENDIX C: CONTRA — INDICATIONS TO SPINAL MANIPULATIVE PROCEDURES (Gatterman 1990 pp. 67, 68)
1. Vascular conditions Artherosclerosis of major blood vessels Abdominal aortic aneurysm
2. Tumours Lung Thyroid Prostate Breast Bone
3. Bone infections Tuberculosis Osteomyelitis
4. Traumatic Fractures Joint instability or hypermobility Severe sprains or strains Unstable spondylolisthesis
5. Arthritic conditions Rheumatic arthritis Ankylosing spondylitis Psoriatic arthritis Unstable or late stage osteoarthritis Uncoarthritis
6. Metabolic disorders Clotting disorders Osteopaenia
7. Psychological considerations Malingering Hysteria Hypochondriasis Pain intolerance
60

8. Neurological complications Disc lesions Space-occupying lesions
61

APPENDIX D: SUBJECT INFORMATION AND CONSENT FORM
Dear Participant
I am Anee Boshoff, an MTech Chiropractic student of the Faculty of Health Sciences,
University of Johannesburg. I want to invite you to participate in my research study.
The purpose of this study is to determine the effect of chiropractic adjustments on the
flexibility of the rectus femoris muscles. These are muscles in the area of your thighs. I will
fully explain all the procedures and will answer all your questions to the best of my abilities.
Your participation in this study is voluntary and you are free to withdraw participation at
anytime, without penalty.
You must be between 18 and 30 years of age, must not have osteoarthritis of the hip and/of
knee joint and must have a shortened quadriceps (thigh) muscle to be able to participate in
this study. A permanent marker will be used in the form of a small dot on the side of your
knee to ensure more accurate measurements but will wash off completely at the end of this
trial. After you have been selected to participate in this study, you will randomly be divided
into one of three groups. Each group will receive a different treatment. You will be required
to attend twelve treatments of approximately 40 minutes each, with a maximum of three days
between treatments, at the University of Johannesburg Chiropractic Day Clinic.
Your privacy will be protected by ensuring your anonymity and confidentiality. In other
words, you will not be identified by name of by any other personal characteristics. The
benefit of this study is that you will receive free treatment in the interest of your wellness.
You may experience some discomfort, such as tenderness, due to the nature of the treatment,
but this will be carefully monitored, and will not have long lasting effects.
After this study is completed, I will provide you with feedback regarding the outcomes, if you
so wish.
62

Should you have any concerns or queries, the following persons can be contacted:
Researcher: Angie Boshoff 083 564 7573
Supervisor: Dr. S Wilcox 083 273 6974
Co-supervisor: Dr. M Moodley 011 406 2065
I have been fully informed as to my rights as to the procedure to be followed in this study. I know that any question, which I may have, will be answered.
Date: Researcher:
Date: Patient:
63

APPENDIX E: CASE HISTORY
UNIVERSITY oa
JOHANNESBURG
UNIVERSITY OF JOHANNESBURG CHIROPRACTIC DAY CLINIC
CASE HISTORY
Date:
Patient: File No:
Age: Sex: Occupation:
Student: Signature:
FOR CLINICIAN'S USE ONLY
Initial visit clinician: Signature:
Case History:
Examination:
Previous: TWR Current: TWR
Other Other
X-ray Studies:
Previous: TWR Current: TWR
Other Other
Clinical Path. Lab:
Previous: TWR Current: TWR
Other Other
Case status: PTT: Conditional: Signed off: Final sign out:
Recommendations:
1
64

Students case history
Source of history:
Chief complaint: (patents own words)
Present illness:
Location
Onset
Duration
Frequency
Pain (character)
Progression
Aggravating factors
Relieving factors
Associated Sx's and SO
Previous occurrences
Past treatment and outcome
2
65

Other complaints:
Past history
General health status
Childhood illnesses
Adult illnesses
Psychiatric illnesses
Accidents/injuries
Surgery
Hospitalisation
Current health status and lifestyle
Allergies
Immunizations
Screening tests
Environmental hazards
Safety measures
Exercise and leisure
Sleep patterns
Diet
Current medication
Tobacco
Alcohol
Social drugs
Family history: immediate family:
Cause of death
3
66

DM
Heart disease
TB
HBP
Stroke
Kidney disease
CA
Arthritis
Anaemia
Headaches
Thyroid disease
Epilepsy
Mental Illness
Alcoholism
Drug addiction
Other
Psychosocial history:
Home situation Daily life Important experiences Religious beliefs
Review of systems:
General
Skin
Head
Eyes
Ears
Nose/sinuses 4
67

Mouth/throat
Neck
Breasts
Respiratory
Cardiac
Gastro-intestinal
Urinary
Genital
Vascular
Musculoskeletal
Neurologic
HaematologIc
Endocrine
Psychiatric
5
68

APPENDIX F: PERTINENT PHYSICAL
UNIVERSITY OF "
JOHANNESBURG
UNIVERSITY OF JOHANNESBURG CHIROPRACTIC DAY CLINIC
Pertinent Physical
Student Name Doctor name ----------
Patient Information
Signature Signatu
Name Age-
Occupation Sex
Vitals:
Weight
Respiratory rate
Pulse rate----------
Blood pressure
Inspection Palpation
Percuss
Auscultation
Thorax
Abdomen
69

klilteggli Palpation Percussion Auscuitaion
,
...
Cranial Nerves Motor System Sensory Cerebellar system stens
Newelleak system
1
70

APPENDIX G: LUMBAR SPINE AND PELVIS REGIONAL
UNIVERSITY OF
JOHANNESBURG
UNIVERSITY OF JOHANNESBURG CHIROPRACTIC DAY CLINIC
REGIONAL EXAMINATION LUMBAR SPINE AND PELVIS
Date:
Patient:
Clinician:
Student:
A. STANDING
BODY TYPE POSTURE OBSERVATION:
Muscle Tone Bony + Soft Tissue Contours Skin Scars Discolouration Step deformity
4. SPECIAL TESTS
Schober's Test Spinous Percussion Treadmill Minor's Sign Quick Test Trendelenburg Test
File No:
Signature:
Signature:
71

fight Rotation Left Rotation
Left Lateral Fl xion ght Lateral Flexion
Forward flexion
40 - 602 (15cm from floor) Extension
20 - 352 UR Rotation
3 - 182 UR Lat Flexion = 15- 202
Flexion
5. RANGE OF MOTION
Extension
/ = Pain free limitation
// = Painful limitation
6. GAIT
Rhythm, pendulousness On Toes (S1) On Heels (L4, 5) Halt Squat on one leg (L2, 3, 4) Tandem Walking
7. MOTION PALPATION — sacroiliac joints
B. SITTING
01. SPECIAL TESTS
Tripod Test Kemp's Test Valsaiva Manoeuvre
2
72

2. MOTION PALPATION
Jt. Pia Lett RI ht Jt. Rai P/A Let P/A Let Fle Ext LF AR PR Fie Ext LF AR PR
T10 . T11
T12 L1 • L2
14
..- 15 11 L R1 U L
C. SUPINE
01. OBSERVATION
Hair, Skin, Nails Fasciculation
2. PULSES
Femoral Popliteal Dorsalis Pedis Posterior Tibial
MUSCLE CIRCUMFERENCE
LEFT RIGHT THIGH cm cm CALF cm cm
LEG LENGTH
LEFT RIGHT ACTUAL cm cm APPARENT cm cm
a
73

5. ABDOMINAL EXAMINATION
Observation Abdominal Reflexes Auscultation Abdomen and Groin Palpation Abdomen and Groin
Comments:
NEUROLOGICAL EXAMINATION
DERMATOMES Lett Right MYOTOMES Len Right REFLEXES Left Right T12 Hip Flexion
(1.111.2) Patellar (1.3, 4)
Lt Knee Extension (12, 3, 41
Medial Hamstring (1.5)
L2 Knee Flexion (L5/S1)
Lateral Hamstring (Si)
L3 Hip IM. Rot (1.LS)
Tibialis Posterior (L4, 5)
L4 Hip Ext. Rot (L5/S1)
Archilles (sysz
1.5 Hip Adduction (L2, 3, 4)_
Plantar Reflex
Si Hip Abduction (W)
S2 Ankle Doraillexion (LWLS)
S3 Hallux Extension (1.5) Ankle Plantar Flexion (Si/S2) Eversion (SI) Inversion (1.4) Hip Extension (L5/S1)
4
74

7. SPECIAL TESTS
SLR
WLR
Braggard's
Bowstring
Sciatic Notch Pressure
Sign of the Buttock
Bilateral SLR
Patrick Faber
Gaenslen's Test
Gapping Test
"Squish" Test
Gluteus Maximus Stretch
Thomas' Test
Rectus Femoris Contracture Test
Hip Medial Rotation
Psoas Test
LATERAL RECUMBENT
Sacroiliac Compression
Ober's Test
Femoral Nerve Stretch Test
Myotomes: - Quadratus Lumborum Strength - Gluteus Medius Strength
75

PRONE
Facet joint challenge
Myofascial Trigger points:
Quadratus Lumborum Gluteus Medius Gluteus Maximus Piriformis Tensor Fascia Late Hamstrings
Skin Rolling
Erichsen's Test
Sacroiliac Tenderness
Pheasant's Test
Gluteal Skyline
Myotomes:
Gluteus Maximus strength
NON-ORGANIC SIGNS
Pin-point pain
Axial Compression
Trunk Rotation
Bum's Bench Test
Flip Test
Hoover's Test
Ankle Dorsiflexion Test
Pin-point pain
6
76

APPENDIX H: HIP REGIONAL
UNIVFaRSITY
JOHANNESBURG
UNIVERSITY OF JOHANNESBURG CHIROPRACTIC DAY CLINIC
REGIONAL EXAMINATION THE HIP
Date:
Patient: File No:
Clinician: Signature:
intern: Signature:
OBSERVATION
Gait
Posture
Weight bearing
Use of support
Balance
Proprioception (stork standing test)
Skin
ANTERIOR VIEW
Bony contours
Soft tissue contours
Swelling
77

LATERAL VIEW
Buttock contour
Hip flexion deformity
Lumbar spine lordosis
POSTERIOR VIEW
Lumbar spine scoliosis
Body contours
Soft tissue contours
ACTIVE MOVEMENTS
I I LEFT RIGHT Flexion (110 -120) I Extension (10 -15) r
1 . Abduction (30 - 50) 1
; Adduction (30) 'Lateral rotation (40 - 60) Medial rotation (30 - 40)
COMMENTS:
PASSIVE MOVEMENTS (note end feel and range of motion)
LEFT RIGHT Flexion Extension Abduction Adduction
[ Lateral rotation [ Medial rotation
2
78

RESISTED ISOMETRIC MOVEMENTS
LEFT RIGHT Hip flexion Hip extension Hip abduction Hip adduction Hip medial rotation Hip lateral rotation Knee flexion Knee extension
COMMENTS:
(Note specific muscle involvement if applicable).
JOINT PLAY
LEFT
RIGHT Caudal glide (Long leg traction) Compression Lateral distraction
COMMENTS:
SPECIAL TESTS
Patrick — FABER test
Tredelenberg's test (assess hip instability)
Craig's test (femoral anteversion)
Sign of the buttock (assess site of lesion)
Thomas test (rectus femoris hypertonicity)
3
79

Ober's test (ITB contracture)
Noble compression test (ITB friction syndrome)
Piriformis test
Hamstring contracture test
DERMATOMES
LEFT
RIGHT Lt L2 L3 S3 S4 1
PALPATION
ANTERIOR ASPECT
Iliac crest
Greater trochanter
AS1S
InguinaI ligament
Femoral triangle
Hip joint
Symphysis pubis
POSTERIOR ASPECT
Iliac crest
PSIS
Ischia! tuberosity
4
80

Greater trochanter
Sacroiliac joints
Sacrococcygeal joints
COMMENTS:
RADIOGRAPHIC EXAMINATION
DIAGNOSIS
TREATMENT PROTOCOL
CLINICIAN'S COMMENTS
81

APPENDIX I: KNEE REGIONAL
UNIVERSITY
JOHANNESBURG
UNIVERSITY OF JOHANNESBURG CHIROPRACTIC DAY CLINIC
'REGIONAL EXAMINATION
THE KNEE
File No: Date:
Patient: D.O.B.:
X-ray No.: Pat Lab No.: ,
Intern: Clinician:
Signature: Signature:
82

2
OBSERVATION
STANDING AND SEATED
ANTERIOR 'VIEW
Q-angle
Genu Varum
Genu Valgum
Swelling / Bony enlargements
•• Patella position
Tibial torsion
Skin
POSTERIOR VIEW
Swelling
Skin
LATERAL 'VIEW
Genu Recurvatum
Patella Alta
Patella Baja
General comments
ACIREIMMELISS1
LEFT RIGHT
Flexion (0° - 135°)
Extension (0° - 015°)
Medial rotation (20° - 30°)
Lateral rotation (30° - 40°)
83

PASSIVE MOVEMENTS
(Note end feel and range of motion)
LEFT RIGHT
Flexion
Extension
Medial rotation
Lateral rotation
Patellar movement
RESISTED ISOMETRICS — KNEE
LEFT
RIGHT
Flexion
Extension
RESISTED ISOMETRICS — ANKLE
LEFT
RIGHT
Plantar flexion
Dorsiflexion
LIGAMENT • US ASSESSMENT
One - Plane Medial Instability
Valgus stress (Abduction)
- Extended
- Resting Position
One - Plane Lateral Instability
Varus stress (Adduction)
- Extended
- Resting Position
One - Plane Anterior Instability
Lachman Test
Anterior Drawer Test
84

One - Plane Posterior Instability
Posterior "Sag" Sign
Posterior Drawer Test
Anterior Medial Rotary Instability
Slocum Test (Foot laterally rotated 15°)
Anterior Lateral Rotary Instability
Slocum Test (Foot medially rotated 30°)
Macintosh Test
Losee test
Postero-medial Rotary Instability
Hughston's Drawer Sign
Postero-lateral Rotary Instability
Jacob Test
Hughston's Drawer Sign
Tests for Meniscus Injury
McMurray Test
"Bounce Home" Test
O'Donoghue's Test
Apley's Test
Helfet Test
Plica Tests
Mediopatellar Plica Test
Plica "Stutter" Test
Hughston's Plica Test
Tests for Swelling
Brush / Stroke Test
Patellar Tap Test
85

5
Tests for Chondromalacia Patella
Clarke's Sign
McConnell's Test
Other Tests
Wilson's Test (Osteochondritis Dessicans)
Fairbank's Test (Patella Dislocation)
Noble Compression Test (ITB Friction)
'• Quadriceps Contusion Test
Leg Length Discrepancy
Joint Play Movements
Backward Movement of the Tibia on the Femur
Forward Movement of the Tibia on the Femur
Medial Translation of the Tibia on the Femur
Lateral Translation of the Tibia on the Femur
Depression (Distal Movement) of the Patella
Antero-posterior Movement of the Tibiofibular Joint
Palpation
Abnormal Tenderness
Swelling
Nodules
Abnormal Temperature
Reflexes and Cutaneous Distribution
LEFT
RIGHT
Patellar Reflex (L3, L4)
Medial Hamstring Reflex (L5, SI)
Dermatomes
L2
L3
L4
86

L5
S1
S2
S3
Radiographic Examination
Diagnosis
Treatment Protocol
Clinician's Comments
87

APPENDIX J: USING A GONIOMETER TO MEASURE THE PASSIVE LENGTH OF THE RECTUS FEMORIS MUSCLE
Described as done by Valmassy R.L. (1996):
The passive length of the rectus femoris muscle is determined by measuring the knee flexion
angle. The patient is in the position for the rectus femoris contracture test while the
goniometer is centred on the lateral epicondyle of the femur. The fixed arm is placed in line
with the length of the femur, pointing to the greater trochanter. The mobile arm points to the
lateral malleolus of the fibula. Note that no overpressure is applied allowing gravity to act on
the knee joint. The normal rectus femoris length will measure a 90 degree knee flexion angle.
88

APPENDIX K: SOAP NOTE
(MNIttS We'
CHIROPRACTIC DAY CLINIC SOAP NOTE:
Patient: Visit No:
File No: Student:
Date: Clinician: S: 0:
A: P:
Comments:
Patient: I Visit No:
File No: I Student:
Date: ~, Clinician: S: 0:
A:
'P:
Comments:
89

APPENDIX L: SEATED TRANSVERSO-DELTOID ADJUSTMENT
This adjustment can be applied to rotary restrictions of the lower thoracic joints and all the
lumbar vertebrae. The subject sat straddling the table. Their arms were crossed over the
chest; homolateral arm on top and their hands placed onto the opposite shoulders. The
doctor's position was 90 degrees posterior to the patient. The doctor's contralateral arm
reached around the subject and held onto the subject's contralateral deltoid area. The doctor's
homolateral hand made a pisiform contact on the transverse or mamillary process of the
restricted segment. The doctor's contralateral arm rotated the subject's torso until the "joint
slack" in the restricted segment was removed. Simultaneously the doctor's homolateral
contact hand thrusted anteriorly with the elbow supported in the inguinal region. (Kirk,
Lawrence and Valvo 1991)
90

APPENDIX M: PNF STRETCH OF RECTUS FEMORIS MUSCLES
The subject lay prone with the operator standing on the opposite side of the leg being
stretched. The operator used their cephalad hand to stabilise the subject's pelvis. The
subject's affected leg was flexed at the knee until maximum resistance in the rectus femoris
muscle was reached. This stretch was held for 10-15 seconds. This was followed by a 7-10
second isometric contraction of the involved rectus femoris muscle as the subject tried to
straighten the leg against the operator's resistance. The subject then activated the antagonistic
muscles by actively flexing their knee. Finally the 10-15 second stretch was repeated with the
operator flexing the subject's knee. (Chaitow 1996)
91

Mean T Mart After a Right Before D
F G R
F S
O F
111111111111 1st 2nd 3rd 4th 5th 6th 7th 8th 9th 10th 11th 12th
APPENDIX N: HI-LOW GRAPH FOR COMBINATION GROUP
(RIGHT LEG - RECTUS FEMORIS FLEXIBILITY)
TREATMENT
92

(RIGHT LEG — RECTUS FEMORIS FLEXIBILITY)
Mean I Rmirt Before
It 1 1 iI(If 1st 2nd 3rd 4th 5th 6th 7th 6th 8th 10th 11th 12th
TREATMENT
APPENDIX 0: HI-LOW GRAPH FOR STRETCH GROUP
66 —
D
E 63—
R
E GEI-
S
57. F
X 51 —
0
N 48—
93

APPENDIX P: HI-LOW GRAPH FOR ADJUSTMENT GROUP (RIGHT LEG - RECTUS FEMORIS FLEXIBILITY)
D 8°- E G R
75—
S
E
0 F
65 •-•
X
0 6°— N
MO, I
II III I I I I ) ; I 1st 2nd 3rd 4th 5th 8th 7th 8th 9th 10th 11th 12th
TREATMENT
Mean T Right After J. Right Before
94

I I 4 I I I 1 1st 2nd 3rd 4th 5th 6th Ah eat Mb 10th 11th 12th
TREATMENT
APPENDIX Q: HI-LOW GRAPH FOR COMBINATION GROUP (LEFT LEG — RECTUS FEMORIS FLEXIBILITY)
65*
G R
so-
0 F
F L 55—
E
x I 0 N
so—
Mean T Left After J• Left Before
95

62.5
O ssz- F
F 52.5 — L
X 500 —
0 tV
D E
60.0-
R E E 575
IMO
I II
I I I h i
47.5 —
I I I I I I I I I I I 1st 2nd 3rd 4th 5th 6th 7th 8th 9th 10th 11th 12th
TREATMENT
APPENDIX R: HI-LOW GRAPH FOR STRETCH GROUP (LEFT LEG — RECTUS FEMORIS FLEXIBILITY)
Mean
I teelfl Vora
96

Mean Left
I Left Lore
I ilt III I It 1st 2nd 3rd 4th Sth 8th 7th 6th 9th 10th 11th 12th
APPENDIX S: HI-LOW GRAPH FOR ADJUSTMENT GROUP (LEFT LEG)
D
75 — R E E S 70 —
0 F
F 65 L E X
60 — 0 N
TREATMENT
97