a surface functionalized nanoporous titania integrated ... 2014_azahar.pdf · the fabrication of...
TRANSCRIPT

Nanoscale
PAPER
Cite this: Nanoscale, 2014, 6, 13958
Received 7th July 2014,Accepted 15th September 2014
DOI: 10.1039/c4nr03791j
www.rsc.org/nanoscale
A surface functionalized nanoporous titaniaintegrated microfluidic biochip†
Md. Azahar Ali,a,b Saurabh Srivastava,a Kunal Mondal,c Pandurang M. Chavhan,a
Ved V. Agrawal,*a Renu John,*b Ashutosh Sharma*c and Bansi D. Malhotra*a,d
We present a novel and efficient nanoporous microfluidic biochip consisting of a functionalized chitosan/
anatase titanium dioxide nanoparticles (antTiO2-CH) electrode integrated in a polydimethylsiloxane (PDMS)
microchannel assembly. The electrode surface can be enzyme functionalized depending on the appli-
cation. We studied in detail cholesterol sensing using the cholesterol esterase (ChEt) and cholesterol
oxidase (ChOx) functionalized chitosan supported mesoporous antTiO2-CH microfluidic electrode. The
available functional groups present in the nanoporous antTiO2-CH surface in this microfluidic biochip can
play an important role for enzyme functionalization, which has been quantified by the X-ray photo-
electron spectroscopic technique. The Brunauer–Emmett–Teller (BET) studies are used to quantify the
specific surface area and nanopore size distribution of titania nanoparticles with and without chitosan.
Point defects in antTiO2 can increase the heterogeneous electron transfer constant between the elec-
trode and enzyme active sites, resulting in improved electrochemical behaviour of the microfluidic
biochip. The impedimetric response of the nanoporous microfluidic biochip (ChEt-ChOx/antTiO2-CH)
shows a high sensitivity of 6.77 kΩ (mg dl−1)−1 in the range of 2–500 mg dl−1, a low detection limit of
0.2 mg dl−1, a low Michaelis–Menten constant of 1.3 mg dl−1 and a high selectivity. This impedimetric
microsystem has enormous potential for clinical diagnostics applications.
Introduction
Microfabrication techniques along with electrochemicalmethods have recently received considerable attention for thedetection of the desired biomolecules in clinical diagnostics.1,2
Impedance spectroscopy is the study of the resistive andcapacitive behavior of an electrode–electrolyte interface in agiven frequency domain.1–4 The impedimetric method isknown to be a non-destructive, sensitive and label-free analyti-cal detection technique that can be utilized to investigate abio-recognition event occurring at an electrode–electrolyte
interface.4 Besides this, EIS can be used to obtain informationon biomolecular interactions, the amount of adsorbed pro-teins, surface charge densities and the magnitude of theadsorption coefficient.5 The electrochemical impedance spec-troscopy (EIS) uses a small perturbation (usually sinusoidal)which reduces the matrix interference and rapidly responds tothe change caused due to binding of an analyte with animmobilized bio-recognition element on the transducersurface.1–5 An impedimetric cholesterol sensor based on Fe3O4
nanoparticles with a sensitivity of 6 Ω (mg dl−1)−1 cm−2 and adetection time of 25 s has recently been reported.6 However,the use of impedimetric macro-electrodes may perhaps lead topoor sensitivity, detection time and limit. Besides this, a mini-aturized microfluidic biochip or a Lab-on-a chip (LOC)-basedbiosensing device has many advantages such as the use ofreduced volumes and chemical reagents, precise control offluids, and low cost and thus provides a versatile format forintegration of the various detection platforms.7–15 As anexample, Arya et al. have recently demonstrated a microelec-trode-based EIS sensor that provides rapid reaction kinetics,improved sensitivity, a large electrode aspect ratio and anincreased signal-to-noise ratio.16
Many researchers have utilized nanostructured metaloxides for the fabrication of microfluidic biosensors.17 Nano-structured titania (TiO2) is an exciting transducer material for
†Electronic supplementary information (ESI) available. See DOI: 10.1039/c4nr03791j
aDepartment of Science and Technology Centre on Biomolecular Electronics,
Biomedical Instrumentation Section, CSIR-National Physical Laboratory,
Dr. K. S. Krishnan Marg, New Delhi-110012, India.
E-mail: [email protected], [email protected]; Fax: +91-011-45609310;
Tel: +91-011-45609152bBiomedical Engineering, Indian Institute of Technology Hyderabad, Ordnance
Factory Estate, Yeddumailaram, Hyderabad, Andhra Pradesh 502205, India.
E-mail: [email protected] of Chemical Engineering, Indian Institute of Technology Kanpur,
Kanpur-208016, India. E-mail: [email protected] of Biotechnology, Delhi Technological University, Shahbad, Daulatpur,
Main Bawana Road, Delhi-110042, India
13958 | Nanoscale, 2014, 6, 13958–13969 This journal is © The Royal Society of Chemistry 2014
Publ
ishe
d on
18
Sept
embe
r 20
14. D
ownl
oade
d by
Ind
ian
Inst
itute
of
Tec
hnol
ogy
Kan
pur
on 1
7/08
/201
5 06
:03:
21.
View Article OnlineView Journal | View Issue

the fabrication of miniaturized biosensors because of its largesurface-to-volume ratio and relatively short diffusion lengthproperties.18–20 The application of TiO2 in photocatalysis,21
solar cells,22 rechargeable lithium batteries23 and biosensors24
has recently been explored. Wang et al. demonstrated a TiO2
nanowire bundle microelectrode-based impedance immuno-sensor for the rapid and sensitive detection of Listeria mono-cytogenes.25 It has been found that nanostructured TiO2 is amultifunctional material due to its long-term chemical stabi-lity, large specific surface area, negligible protein denaturationand good biocompatibility.26 The high percentage of reactive(001) facets of anatase TiO2 nanocrystals (tetragonal, spacegroup I41/amd ) can be used to obtain enhanced catalyticactivity and improved stability and selectivity.27,28 Oxygenvacancies on the TiO2 surface (110) may perhaps govern thesurface chemistry because of their potential to stabilize thebinding of surface species.29 The point defects in TiO2 arisingdue to oxygen vacancy sites are perhaps located within the brid-ging oxygen rows of the TiO2(110)−(1 × 1) surface.30 The pres-ence of Ti3+ defects may lead to improved adsorption of enzymemolecules and a fast heterogeneous electron transfer rate ofTiO2, resulting in enhanced sensitivity and improved responsetime of a microfluidic sensor.29 Ali et al. reported that antTiO2
nanoparticles can be used to electrochemically activate theenzyme due to the presence of gibbosities on the antTiO2
surface, resulting in decreased tunneling distance between theactive sites of the enzyme and the electrode, leading to anenhanced electrochemical current.26 However, the direct attach-ment of biomolecules onto the antTiO2 surface continues to bea major limitation as its surface can absorb only a limitednumber of desired biomolecules due to weak inter-molecularinteractions with the biomolecules. We explore overcoming thislimitation by using a nanocomposite material composed of abiopolymer (e.g. chitosan) and antTiO2 nanoparticles since chit-osan could act as a template for dispersion of antTiO2 nanopar-ticles, thereby facilitating improved enzyme functionalization.
The chitosan (CH), a deacetylation product of chitin, is afunctional and basic polysaccharide composed of β-1,4-linkedglucosamine that can be extracted from the exoskeletons ofshrimps and crabs.31 This interesting biomaterial offers anexcellent film forming ability and acts as a stabilizing agent. Itis also cost-effective, biocompatible and biodegradable. Theporous structure of CH can be used to obtain enhanced dis-persion of TiO2 nanoparticles that may provide sufficient elec-tron-conducting paths and a high surface area for theadsorption of biomolecules such as enzymes, proteins etc.Crossland et al. reported an optoelectronic device using meso-porous anatase TiO2 single crystals.32 This synthesized nano-porous TiO2 shows excellent conductivity and electron mobilitycompared to that of conventional nanocrystalline TiO2.
32 Thenanoporosity of TiO2 may result in highly accessible surfaces,leading to improved biosensor characteristics. Wagner et al.have observed improved performance of mesoporous materialbased gas sensors.33 A nanoporous TiO2 biosensor may alsoresult in higher diffusion coefficient compared to that of non-ordered silica materials.34 The nanopore structure of titania
may promote both CH and biomolecules adsorption, resultingin improved electron diffusivity. The high porosity and excellentsurface area of titania could thus provide a favorable platformfor the incorporation of CH, resulting in higher biomoleculeloading. In addition, the available functional groups such as theamino (–NH2), hydroxyl (–OH) etc. of CH offer a hydrophilicenvironment for a given biomolecule. Feng et al. have developeda porous metal oxide–CH matrix for immobilization of a singlestranded DNA probe for the detection of a cancer gene.31 Thenanoporous antTiO2-CH may perhaps provide a faster electrontransfer rate, resulting in improved electrochemical properties.The semiconducting nature of anatase TiO2 nanoparticles inthis microfluidic system can enhance the impedance signal, i.e.charge transfer resistance, implying higher sensitivity. Thus, thenanoporous antTiO2-CH composite is a new, simple and low costplatform to integrate with a microfluidic device for esterifiedcholesterol monitoring.
In this study, we investigate the surface functionalization ofa microfluidic biochip based on the nanoporous antTiO2-CHcomposite matrix. This microfluidic biochip consists of nano-structured antTiO2 grafted CH dip-coated onto an ITO micro-electrode and functionalized using a bienzyme (cholesterolesterase and cholesterol oxidase). To quantify the functionalgroups and point defects on the nanoporous antTiO2-CHsurface before and after enzyme functionalization, we haveconducted X-ray photoelectron spectroscopic studies. We usean ac impedance spectroscopic technique for the estimation oftotal cholesterol concentration. The bienzyme functionalizednanoporous antTiO2-CH electrode has been characterizedusing electron microscopy, Brunauer–Emmett–Teller surfacearea, Fourier transform infra-red/Raman spectroscopy andelectrochemical techniques.
Results and discussionFabrication of biochip
Details of the fabrication of the nanoporous microfluidic biochiphave been described in the Materials and methods section.Scheme 1 (i and ii) shows the schematic and a photograph ofthe proposed microfluidic biochip. The thicknesses weremeasured using an optical profiler in the noncontact mode.Fig. 1a shows an optical 3D profiling image of the ITO filmcoated on a glass in which the thickness has been calculatedto be ∼299 ± 36 nm. Then, nanoporous antTiO2-CH was de-posited on the ITO by a dip coating method and the thicknesswas found to be ∼196 ± 30 nm. Fig. 1b shows the optical 3Dprofiling image of the antTiO2-CH film on ITO. Fig. 1c showsthe 2D atomic force micrograph image (AFM) of antTiO2 nano-particles on the ITO surface. It can be seen that antTiO2 nano-particles are well-aligned, spherical in shape, porous, andmono-dispersed and are uniformly distributed on the ITOsurface. The average size of the antTiO2 nanoparticles variesfrom 10 to 35 nm. The antTiO2 nanoparticle size distributionis shown in the inset of Fig. 1(c). It has been found that theaverage roughness of antTiO2 films is 0.60 nm.
Nanoscale Paper
This journal is © The Royal Society of Chemistry 2014 Nanoscale, 2014, 6, 13958–13969 | 13959
Publ
ishe
d on
18
Sept
embe
r 20
14. D
ownl
oade
d by
Ind
ian
Inst
itute
of
Tec
hnol
ogy
Kan
pur
on 1
7/08
/201
5 06
:03:
21.
View Article Online

Morphological studies
The surface morphology of antTiO2 nanoparticles and chito-san coated/embedded nanoparticles has been explored usingfield emission-scanning electron microscopy (FE-SEM). TheantTiO2 nanoparticles are dispersed uniformly throughout theITO surface. It also shows that the antTiO2 nanoparticles aredensely distributed. The FE-SEM analysis of titania nanoparti-cles reveals that the particle size varies from 10 to 35 nm. Theaverage diameter of the TiO2 particles was estimated to be∼27 nm. The FE-SEM (Fig. 2a) studies reveal the porous mor-phology of the (antTiO2-CH) film, indicating the formation ofthe antTiO2-CH hybrid. This may be attributed to electrostaticinteractions between cationic CH and the presence of surfacecharged antTiO2 nanoparticles grafted in the CH network(Fig. 2b). The micrograph reveals that the hybrid surface(Fig. 2b) is coated with TiO2 nanoparticles. After enzyme incor-poration on the antTiO2-CH surface (image c), the film mor-phology is altered. This may be due to the three dimensionalenvironment of the hybrid surface that promotes coating viaformation of complexes around apexes and voids, and thenanoporous surface structure of antTiO2-CH provides anincreased loading capacity of the bienzyme (ChEt-ChOx).
Spectroscopic studies
Fig. 3(i) shows the XPS wide scan spectrum obtained for theantTiO2-CH (a) and ChEt-ChOx/antTiO2-CH (b) electrodes onthe ITO surface. The peaks found at 199.5 eV, 284.2 eV, 496.5eV and 530.5 eV are attributed to Cl 2p, C 1s, Sn 3d and O 1sof antTiO2-CH, respectively. In spectrum (b), the characteristicpeak seen at 398.5 eV is assigned to the presence of N 1spresent in the bienzyme (ChEt-ChOx). The additional peakfound at 1069.5 eV is attributed to Ti-Auger. The relativeatomic concentration (%) and full width at half maximum(FWHM) of carbon, oxygen and nitrogen peaks are summar-ized in Table S1 (ESI†). The atomic concentration of N 1s ofthe ChEt-ChOx/antTiO2-CH/ITO bioelectrode increases to2.48% compared to that of the antTiO2-CH/ITO electrode(1.23%). This indicates that the antTiO2-CH/ITO electrodesurface facilitates immobilization of ChEt-ChOx via electro-static interactions.
The XPS spectra of the carbon 1s region, obtained for thedeposited antTiO2-CH/ITO electrode [Fig. 3(ii)], are deconvo-luted using Shirley type baseline and Lorentzian–Doniac–Sunsic curves with Gaussian profiles. The deconvoluted C 1score-level spectrum of the antTiO2-CH sample consists of three
Fig. 1 Optical 3D profiling images of the ITO/glass film (a) and antTiO2-CH film on ITO coated on a glass (b). (c) 2D AFM image of antTiO2 nanopar-ticles; the inset shows the nanoparticles distribution.
Scheme 1 (i) A microfluidic biochip for esterified cholesterol detection, WE = working electrode (ChEt-ChOx/antTiO2-CH/ITO), CE = counter elec-trode (ITO), and RE = reference electrode (Ag/AgCl) and (ii) a photograph of the microfluidic biochip. (iii) Randles equivalent circuit model for EISmeasurements, where Rs = solution resistance, Rct = charge transfer resistance, Qdl = constant phase element or double layer capacitance and W =Warburg impedance.
Paper Nanoscale
13960 | Nanoscale, 2014, 6, 13958–13969 This journal is © The Royal Society of Chemistry 2014
Publ
ishe
d on
18
Sept
embe
r 20
14. D
ownl
oade
d by
Ind
ian
Inst
itute
of
Tec
hnol
ogy
Kan
pur
on 1
7/08
/201
5 06
:03:
21.
View Article Online

peaks. The 284.5 eV peak is assigned to the existence of C–Cand C–N binding in CH. The second peak, located at 286.3 eV,is attributed to the chemical binding of the C atom in C–Oand C–OH bonds, and the third peak seen at 288.06 eV isrelated to the N–CvO chemical binding in the acetamidegroup of CH. After bienzyme immobilization, the peaks foundat 284.5 eV, 286.3 eV and 288.06 eV are slightly shifted towardsthe lower binding energy and an additional peak at 281.8 eV isobserved [Fig. 3(iii)]. After fitting of the N 1s core-level spec-trum of antTiO2-CH, three peaks appear at 398.3, 401.4, and406.2 eV [Fig. 3(iv)]. The first peak is assigned to thechemical binding of N in the amine and acetamide (NH2)groups, while the second peak is assigned to the chemicalbinding of the N in the protonated amine (NH3
+) group.The third peak is attributed to chemical binding of the N inthe nitrate group. In the case of the biofunctionalized film,these peaks are slightly shifted towards the higher bindingenergy [Fig. 3(v)]. The atomic ratio of element (N) and peakintensities is found to be changed, indicating bienzymeimmobilization onto the antTiO2-CH surface via electrostaticinteractions.
Fig. S1(i and ii†) shows the Ti 2p core level spectra ofantTiO2-CH films before and after enzyme immobilization.The peaks seen at around 454.4, 457.6 and 459.4 eV areresponsible for various oxidation states of titanium such asTi2+, Ti3+ (intermediate oxidation state) and Ti4+ (higher oxi-dation state), respectively. A peak seen at 464.7 eV arising dueto Ti 2p1/2 in the antTiO2-CH film has been shifted to 2.0 eVafter enzyme incorporation. A new peak has been observed at452.3 eV due to the low oxidation state of titanium (Ti0)[Fig. S1(ii)†]. Some of the peaks for Ti2+ and Ti3+ have beenshifted due to surface functionalization of antTiO2-CH/ITOwith enzyme molecules [Fig. S1(ii)†]. In addition Ti4+ withTiO2, other lower oxidation states are related to TiO2 due to thepresence of titanium suboxides. Thus, the existence of thesepeaks Ti0, Ti2+, Ti3+ etc. may result in defects in the atomicstructure of mesoporous anatase TiO2, resulting in improvedheterogeneous electron transfer properties and an enhancedloading capacity of the enzyme molecules.
FT-IR spectra of antTiO2/ITO electrode exhibit a peak at523 cm−1 in the fingerprint region due to the vibrational bandof Ti–O bonds [Fig. 3(vi), spectra a]. The peaks found at 819
Fig. 2 FE-SEM images of antTiO2 nanoparticles (a), antTiO2-CH/ITO film (b) and ChEt-ChOx/antTiO2-CH/ITO film (c).
Nanoscale Paper
This journal is © The Royal Society of Chemistry 2014 Nanoscale, 2014, 6, 13958–13969 | 13961
Publ
ishe
d on
18
Sept
embe
r 20
14. D
ownl
oade
d by
Ind
ian
Inst
itute
of
Tec
hnol
ogy
Kan
pur
on 1
7/08
/201
5 06
:03:
21.
View Article Online

and 1241 cm−1 correspond to C–H and C–O stretching bonds,respectively. The band seen at 3593 cm−1 is assigned to stretch-ing and deformation of the O–H bonds due to absorption of thewater molecules. Fig. 3(vi) shows FT-IR spectra of CH (spectra b)that exhibit bands at 3200–3450 cm−1 due to the stretchingvibration mode of OH and NH2 groups. The band seen at1652 cm−1 arises due to the amide I group (C–O stretchingalong with N–H deformation mode). The 1564 cm−1 peak isattributed to the NH2 group due to N–H deformation, the1400 cm−1 peak is due to C–N axial deformation (amine groupband), the 1317 cm−1 peak is due to the COO– group in the car-boxylic acid salt and the 1063 cm−1 is attributed to the stretch-ing vibration mode of the hydroxyl group. The peak at 612 cm−1
in the fingerprint region is assigned to antTiO2 grafted CH.This absorption band occurs at a higher wavenumber than thatof pure antTiO2 nanoparticles due to the interactions betweenCH and the antTiO2. The presence of antTiO2 nanoparticles inCH facilitates immobilization of ChEt-ChOx via amine andhydroxyl groups. After immobilization of ChEt-ChOx on theantTiO2-CH surface (spectra c), the intensity of the absorptionpeak becomes higher and broader due to the overlap of thefunctional groups of enzymes corresponding to amide I(1652 cm−1) and amide II (1545 cm−1), respectively, indicatingimmobilization of the bienzyme (ChEt-ChOx) onto this matrix.
The specific surface area and porosity of the TiO2 andantTiO2-CH have been studied by using the N2 adsorption anddesorption isotherms shown in Fig. 4a. Table 1 shows the poresize distribution of TiO2 and antTiO2-CH from Brunauer–Emmett–Teller (BET) measurements. It is found that the twoisotherms of the samples show the stepwise adsorption anddesorption pertaining to type IV curves, representing the pres-ence of nanoporous materials. A hysteresis loop with a step-wise adsorption and desorption branch is observed in theextensive range of pressure (P/Po) for the nanoporous TiO2 andantTiO2-CH, indicating that the synthesized material has ananoporous structure. To investigate the pore size and porevolume distribution, a curve of the pore size distribution isinspected by a desorption branch of the Barrett–Joyner–Halenda (BJH) data as shown in the inset of Fig. 4a. Theaverage pore diameter of mesoporous TiO2 is found to be6.287 nm with ∼80% mesoporosity and a total pore volume of0.2961 cc g−1. The total pore volume of mesoporous antTiO2-CH is 0.1265 cc g−1 and the mesoporosity is 83%. AnalyzingBET results, it is seen that titania nanoparticles have anincreased surface area of 188.2 m2 g−1 compared to that ofantTiO2-CH (90.83 m2 g−1). The decrease in the surface area ofantTiO2-CH is evident because of the blocking of poreentrances of TiO2 particles by the chitosan molecules.
Fig. 3 (i) Wide scan X-ray photoelectron spectra (XPS) of various films. The XPS measurements were performed using an X-ray photoelectronspectrometer (XPS, Multilab 2000, Thermo Scientific) equipped with an alpha 110 hemispherical electron energy analyzer and an X-ray source. (ii)XPS spectra of the C 1s region of antTiO2-CH/ITO film after deconvolution, (iii) the C 1s region of ChEt-ChOx/antTiO2-CH/ITO film, (iv) N 1s corelevel spectra of antTiO2-CH/ITO and (v) ChEt-ChOx/antTiO2-CH/ITO films. (vi) A Fourier transform infrared (FT-IR) spectrophotometer (PerkinElmer,Spectrum BX II) has been used to characterize the antTiO2-CH nanocomposite and its interaction with the bienzyme (ChEt-ChOx).
Paper Nanoscale
13962 | Nanoscale, 2014, 6, 13958–13969 This journal is © The Royal Society of Chemistry 2014
Publ
ishe
d on
18
Sept
embe
r 20
14. D
ownl
oade
d by
Ind
ian
Inst
itute
of
Tec
hnol
ogy
Kan
pur
on 1
7/08
/201
5 06
:03:
21.
View Article Online

Fig. 4b illustrates the room temperature Raman spectra ofTiO2 and antTiO2-CH. The resulting spectra indicate intensifi-cation of the lowest-frequency Eg mode. A strong Raman peakemerges at 196 cm−1 at the high-frequency side of the Eg modeassigned to the anatase phase of TiO2. In addition, B1g, A1gand Eg modes are detected at 396, 517 and 642 cm−1, respect-ively, indicating the presence of anatase phase. It appears thatthe morphology of TiO2 in the antTiO2-CH phase is preserved.
Electrochemistry and microfluidics
Fig. 5(i) shows the cyclic voltammograms of (a) the antTiO2-CH/ITO electrode and (b) the ChEt-ChOx/antTiO2-CH/ITO bio-electrode in a potential range of −0.9 V to +1.0 V performed in
PBS containing 5 mM [Fe(CN)6]3−/4−. The magnitude of the
current observed for the ChEt-ChOx/antTiO2-CH/ITO bioelec-trode is higher (curve b) compared to that of the antTiO2-CH/ITO electrode (curve a), resulting in fast electron communi-cation through antTiO2-CH and redox active sites of ChEt-ChOx molecules. Ali et al. reported that antTiO2 nanoparticlescan be used to activate the enzyme, resulting in a reduced tun-neling distance for diffusion of electrons from the bulk solu-tion, leading to enhanced current.26 Li et al. have observedthat the current response increases after enzyme immobiliz-ation on TiO2 nanodots in the presence of gibbosities on theTiO2 surface, resulting in decreased tunneling distancebetween active sites of ChOx and the electrode.35 This result
Fig. 5 (i) Cyclic voltammogram (CV) of (a) the antTiO2-CH/ITO electrode and (b) the ChEt-ChOx/antTiO2-CH/ITO bioelectrode in PBS solution(50 mM, pH 7.0, 0.9% NaCl) containing 5 mM [Fe(CN)6]
3−/4− and (ii) chronoamperometric response current vs. flow rate (µl min−1) of (a) the antTiO2-CH/ITO electrode and (b) the ChEt-ChOx/antTiO2-CH/ITO bioelectrode. (iii) Electrochemical impedance spectroscopy (EIS) of (a) the antTiO2-CH/ITO electrode and (b) the ChEt-ChOx/antTiO2-CH/ITO bioelectrode (inset: zoom image).
Table 1 Pore size distribution from BET data
Sampledetails P/P0
Total porevolume (cc g−1)
BET area(m2 g−1)
Macroporevolume (cc g−1)
Mesoporevolume (cc g−1)
Microporevolume (cc g−1)
Average porediameter (nm)
antTiO2 0.99707 0.2961 188.2 0.02286 0.2373317 0.0359083 6.287antTiO2-CH 0.99940 0.1265 90.83 0.00772 0.1059716 0.0128164 5.571
Fig. 4 (a) The N2 adsorption and desorption isotherms of antTiO2 nanoparticles; inset shows the pore size distribution of antTiO2 nanoparticles;and (b) Raman spectra of the antTiO2 and antTiO2-CH films.
Nanoscale Paper
This journal is © The Royal Society of Chemistry 2014 Nanoscale, 2014, 6, 13958–13969 | 13963
Publ
ishe
d on
18
Sept
embe
r 20
14. D
ownl
oade
d by
Ind
ian
Inst
itute
of
Tec
hnol
ogy
Kan
pur
on 1
7/08
/201
5 06
:03:
21.
View Article Online

indicates that porous CH with antTiO2-CH facilitates activationof enzyme active sites, resulting in enhanced current due toimproved heterogeneous electron transfer. The high electro-catalytic activity of antTiO2 in the presence of the bienzymereveals the improved redox phenomenon. The observed signifi-cant increase in the heterogeneous electron transfer rateresults from the strong interaction of ChEt-ChOx with thenanoporous antTiO2-CH based electrode compared to that ofthe antTiO2-CH/ITO electrode. The effect of the scan rate onthe electrochemical response of the bioelectrode is shown inFig. S2 (ESI†). The magnitude of the current increases linearlywith the increase of scan rate from 20 to 160 mV s−1 (inset).Besides this, the ChEt-ChOx/antTiO2-CH bioelectrode showsthat the peak current increases linearly with scan rate(20–110 mV s−1), indicating a surface confined electron-trans-fer process [ESI, Fig. S2 (inset)†]. The observed large separationvoltage (∼1.0 V) of CV may be attributed to the irreversible elec-trode process or large ohmic drop in the electrochemical cell.The diffusion coefficient (or diffusivity) of the electrolyte con-taining [Fe(CN)6]
3−/4− ions from the CV response at differentscan rates has been estimated. The observed fast responsetime may be assigned to the higher diffusivity (76.37 × 10⁻⁶
cm2 s−1) of the redox species at the ChEt-ChOx/antTiO2-CH/ITO bioelectrode.
The effect of the flow rate of the nonporous antTiO2-CHbased microfluidic biochip has been investigated using achronoamperometric technique. Fig. 5(ii) shows the chron-oamperometric response of the antTiO2-CH/ITO electrode (a)and ChEt-ChOx/antTiO2-CH/ITO (b) as a function of flow rate(0.01–15 µl min−1). It has been observed that the chronoam-perometric current increases with increasing flow rate (buffersolution) up to 5 µl min−1 after which the current becomessaturated (curve a). This is because the diffusivity of the redoxspecies increases with increasing buffer flow rate owing to theimproved mass transport resulting from the increased fluidvelocity. The corresponding chronoamperometric curves areshown in Fig. S3 (ESI†). In the case of the ChEt-ChOx/antTiO2-CH/ITO bioelectrode [Fig. 3(ii), (b) and ESI, Fig. S4†], it isfound that the current initially increases with the flow rate(buffer solution plus cholesterol; 25 mg dl−1) up to 1.0 µlmin−1 after which it decreases to a saturated value. This maybe assigned to the biochemical reaction at the sensor surface.It appears that the cholesterol molecules perhaps move awayfrom the sensor surface prior to completion of the biochemicalreaction, resulting in decreased current. Thus, the electro-chemical measurements have been carried out at an optimumflow rate of 1.0 µl min−1.
Electrochemical impedance analysis
Electrochemical impedance is a complex resistance and isencountered when the current flows through a circuit consistingof resistors and capacitors or inductors.1–4 The Randles circuit[Scheme 1(iii)] is an equivalent electrical circuit that is commonlyused to measure the electrochemical impedance composed of anactive electrolyte resistance RS in series with Rct (charge transferresistance) in parallel combination of the double-layer capaci-
tance Cdl or constant phase element (CPE) of a Faradaic reac-tion.5 A typical shape of the Nyquist plot includes a semicircleregion lying in the real axis followed by a straight line. The linearpart (ψ = π/4) observed in the low frequency range implies amass-transfer limited process, whereas the semicircle portionobserved in the high frequency range implies a charge-transferlimited process. Both Nyquist and Bode plots have been used todetermine the relative change in surface-charge resistance. Inter-facial Rct and Cdl in the Nyquist plot of impedance are obtainedfrom real (Z′) and imaginary (−Z″) impedance as a function of fre-quency using the following eqn (1) for a parallel RC circuit.
ZðωÞ ¼ Rs þ Rct
1þ jωRctCdl
¼ Rs þ Rct
1þ ω2Rct2Cdl
2 �jωRct
2Cdl
1þ ω2Rct2Cdl
2 ¼ Z′þ jZ′′ ð1Þ
where Rs is the electrolyte solution resistance and Rct is thecharge transfer resistance or polarization resistance. The fre-quency associated with maximum −Z″ and Rct is used to calcu-late Cdl using the following eqn (2).
RctCdl ¼ 12πfmax
¼ τ ð2Þ
where τ is the time constant and fmax is the maximum fre-quency. The Warburg resistance (Zw) can be obtained via theNyquist plot and an equivalent circuit to describe the electricalresponse at the electrode. In the plot, the Warburg impedanceis expressed by an intercept of the straight line having a slopeof unity and can be derived via eqn (3).
ZwðωÞ ¼ W int þ Rctλffiffiffi2
pω
� �1� j½ �; W int ¼ Rs þ Rct � Rct
2λ2Cd ð3Þ
where λ ¼ kfffiffiffiffiffiffiD0
p þ kbffiffiffiffiffiffiDR
p� �
, kf and kb are forward and backward
electron-transfer rate constants, and D0 and DR are thediffusion coefficients of the oxidant and the reductant. The Rsand Rs + Rct values are obtained from the standard softwareavailable with the instrument. Similar information is obtainedfrom a Bode diagram of impedance and phase shift withfrequency.
The charge transfer resistances, Rct1 and Rct2, for both cir-cuits of the antTiO2-CH/ITO electrode have been found to be22.0 kΩ and 310.0 kΩ, respectively, at 0.6 V bias potential[Fig. 5(iii), (a)]. It appears that the nanoporous antTiO2-CHmatrix in this biochip plays an important role for fast electrontransfer from the bulk solution to the electrode. In particular,the experimentally obtained Rct in the antTiO2-CH matrix maybe due to diffusion of antTiO2 nanoparticles in the CHnetwork, resulting in increased conductivity and compensationfor the observed higher resistance of CH due to larger mole-cules. The Rct further decreases (Rct1 = 16.8 kΩ and Rct2 = 2.7 ×10⁵ Ω for both equivalent circuits) after the immobilization ofChEt-ChOx onto the antTiO2-CH surface revealing thatantTiO2-CH provides a desirable microenvironment for theimmobilization of the bienzyme [Fig. 3(iii), (b)]. Thus, the
Paper Nanoscale
13964 | Nanoscale, 2014, 6, 13958–13969 This journal is © The Royal Society of Chemistry 2014
Publ
ishe
d on
18
Sept
embe
r 20
14. D
ownl
oade
d by
Ind
ian
Inst
itute
of
Tec
hnol
ogy
Kan
pur
on 1
7/08
/201
5 06
:03:
21.
View Article Online
ChEt-ChOx/antTiO2-CH/ITO bioelectrode provides easier elec-tron transfer due to increased active sites for electrical contactbetween the electrode and the redox label in solution, result-ing in lower electrochemical impedance.
Fig. S5† shows EIS spectra of a nanoporous microfluidicbiochip obtained as a function of flow rate (0.01–5 µl min−1)(ESI†). It is observed that Rct2 of the semicircle graduallyincreases with increasing flow rate of the cholesterol solutioncontaining [Fe(CN)6]
3−/4− ions. This may be due to theincreased number of [Fe(CN)6]
3−/4− ions at higher fluid velo-city. After 1.0 µl min−1, the impedance of the ChEt-ChOx/antTiO2-CH/ITO bioelectrode increases slowly and becomessaturated [ESI, Fig. S5(inset)†]. This optimum flow rate of 1.0µl min−1 has been used to make EIS measurements.
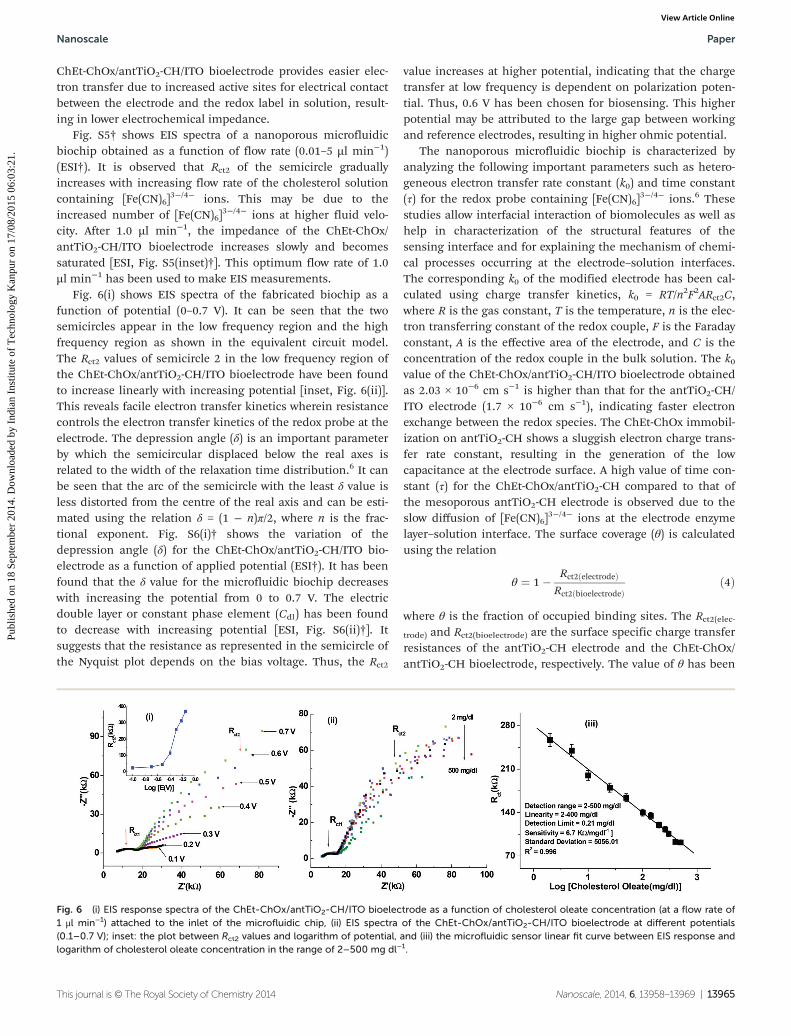
Fig. 6(i) shows EIS spectra of the fabricated biochip as afunction of potential (0–0.7 V). It can be seen that the twosemicircles appear in the low frequency region and the highfrequency region as shown in the equivalent circuit model.The Rct2 values of semicircle 2 in the low frequency region ofthe ChEt-ChOx/antTiO2-CH/ITO bioelectrode have been foundto increase linearly with increasing potential [inset, Fig. 6(ii)].This reveals facile electron transfer kinetics wherein resistancecontrols the electron transfer kinetics of the redox probe at theelectrode. The depression angle (δ) is an important parameterby which the semicircular displaced below the real axes isrelated to the width of the relaxation time distribution.6 It canbe seen that the arc of the semicircle with the least δ value isless distorted from the centre of the real axis and can be esti-mated using the relation δ = (1 − n)π/2, where n is the frac-tional exponent. Fig. S6(i)† shows the variation of thedepression angle (δ) for the ChEt-ChOx/antTiO2-CH/ITO bio-electrode as a function of applied potential (ESI†). It has beenfound that the δ value for the microfluidic biochip decreaseswith increasing the potential from 0 to 0.7 V. The electricdouble layer or constant phase element (Cdl) has been foundto decrease with increasing potential [ESI, Fig. S6(ii)†]. Itsuggests that the resistance as represented in the semicircle ofthe Nyquist plot depends on the bias voltage. Thus, the Rct2
value increases at higher potential, indicating that the chargetransfer at low frequency is dependent on polarization poten-tial. Thus, 0.6 V has been chosen for biosensing. This higherpotential may be attributed to the large gap between workingand reference electrodes, resulting in higher ohmic potential.
The nanoporous microfluidic biochip is characterized byanalyzing the following important parameters such as hetero-geneous electron transfer rate constant (k0) and time constant(τ) for the redox probe containing [Fe(CN)6]
3−/4− ions.6 Thesestudies allow interfacial interaction of biomolecules as well ashelp in characterization of the structural features of thesensing interface and for explaining the mechanism of chemi-cal processes occurring at the electrode–solution interfaces.The corresponding k0 of the modified electrode has been cal-culated using charge transfer kinetics, k0 = RT/n2F2ARct2C,where R is the gas constant, T is the temperature, n is the elec-tron transferring constant of the redox couple, F is the Faradayconstant, A is the effective area of the electrode, and C is theconcentration of the redox couple in the bulk solution. The k0value of the ChEt-ChOx/antTiO2-CH/ITO bioelectrode obtainedas 2.03 × 10⁻⁶ cm s−1 is higher than that for the antTiO2-CH/ITO electrode (1.7 × 10⁻⁶ cm s−1), indicating faster electronexchange between the redox species. The ChEt-ChOx immobil-ization on antTiO2-CH shows a sluggish electron charge trans-fer rate constant, resulting in the generation of the lowcapacitance at the electrode surface. A high value of time con-stant (τ) for the ChEt-ChOx/antTiO2-CH compared to that ofthe mesoporous antTiO2-CH electrode is observed due to theslow diffusion of [Fe(CN)6]
3−/4− ions at the electrode enzymelayer–solution interface. The surface coverage (θ) is calculatedusing the relation
θ ¼ 1� Rct2ðelectrodeÞRct2ðbioelectrodeÞ
ð4Þ
where θ is the fraction of occupied binding sites. The Rct2(elec-trode) and Rct2(bioelectrode) are the surface specific charge transferresistances of the antTiO2-CH electrode and the ChEt-ChOx/antTiO2-CH bioelectrode, respectively. The value of θ has been
Fig. 6 (i) EIS response spectra of the ChEt-ChOx/antTiO2-CH/ITO bioelectrode as a function of cholesterol oleate concentration (at a flow rate of1 μl min−1) attached to the inlet of the microfluidic chip, (ii) EIS spectra of the ChEt-ChOx/antTiO2-CH/ITO bioelectrode at different potentials(0.1–0.7 V); inset: the plot between Rct2 values and logarithm of potential, and (iii) the microfluidic sensor linear fit curve between EIS response andlogarithm of cholesterol oleate concentration in the range of 2–500 mg dl−1.
Nanoscale Paper
This journal is © The Royal Society of Chemistry 2014 Nanoscale, 2014, 6, 13958–13969 | 13965
Publ
ishe
d on
18
Sept
embe
r 20
14. D
ownl
oade
d by
Ind
ian
Inst
itute
of
Tec
hnol
ogy
Kan
pur
on 1
7/08
/201
5 06
:03:
21.
View Article Online
determined to be 0.87, indicating more than 87% of surfacecoverage of the antTiO2-CH electrode by ChEt-ChOx molecules.
Biomedical application
The electrochemical impedimetric response of the nanoporousmicrofluidic biochip obtained as a function of cholesterol con-centration (2–500 mg dl−1) in PBS solution containing [Fe-(CN)6]
3−/4− is shown in Fig. 6(ii). During the electrochemicalmeasurements, various concentrations of cholesterol areinjected into the microchannels at an optimum flow rate of 1.0µl min−1. A Faradic impedance spectrum (Nyquist plot)includes two semicircle regions observed at higher and lowerfrequencies corresponding to the electron-transfer limitedprocess. The electronic impedimetric circuit of the electro-chemical system has been shown in Scheme 1(iii). It can beseen that the change in the second semicircle diameter (Rct2)is higher compared to that of the first semicircle as shown inFig. 6(ii). The charge transfer resistance of the microfluidicChEt-ChOx/CH-antTiO2/ITO bioelectrode (Rct2) reveals elec-tron-transfer kinetics of the redox probe at the electrode inter-face which decreases with increasing cholesterol oleateconcentration [ESI, Fig. S7†]. This can be attributed to thepresence of ChEt on the antTiO2-CH/ITO electrode. The esteri-fied cholesterol converts cholesterol into cholesterol and fattyacid. Again, ChOx converts cholesterol to choleste-4-ene-3-oneand H2O2. The electrons generated during the re-oxidation ofChOx after an enzymatic reaction are transferred to theantTiO2-CH/ITO electrode via redox couples, resulting in anenhanced charge transfer rate, leading to a decreased Rct2value. A linear calibration curve [Fig. 6(iii)] has been fittedbetween Rct2 and the logarithm of the cholesterol concen-tration, revealing linearity from 2 to 400 mg dl−1 in the detec-tion range of 2–500 mg dl−1. The linear regression equation isRct2(Ω) = 27.9 kΩ − 6.77 kΩ (mg dl−1)−1 × [cholesterol oleateconcentration (mg dl−1)] with a correlation coefficient of 0.996.The nanoporous antTiO2-CH based microfluidic chip yieldsexcellent sensitivity (67.7 kΩ (mg dl−1)−1 compared to thosereported in the literature.6 The sensitivity of the present nano-porous antTiO2-CH microelectrode based impedance enzy-matic sensor is several-folds higher, revealing that coupling ofthe microfluidic impedance sensor with the biopolymer-nanostructured microelectrode provides a technology for moresensitive detection of esterified cholesterol. In addition, the
density of point defects in the nanopore anatase TiO2 mayinfluence electrochemical conduction between enzyme mole-cules and the electrode, and facilitates heterogeneous electrontransfer, resulting in higher sensitivity. The low apparentMichaelis–Menten constant (Kapp
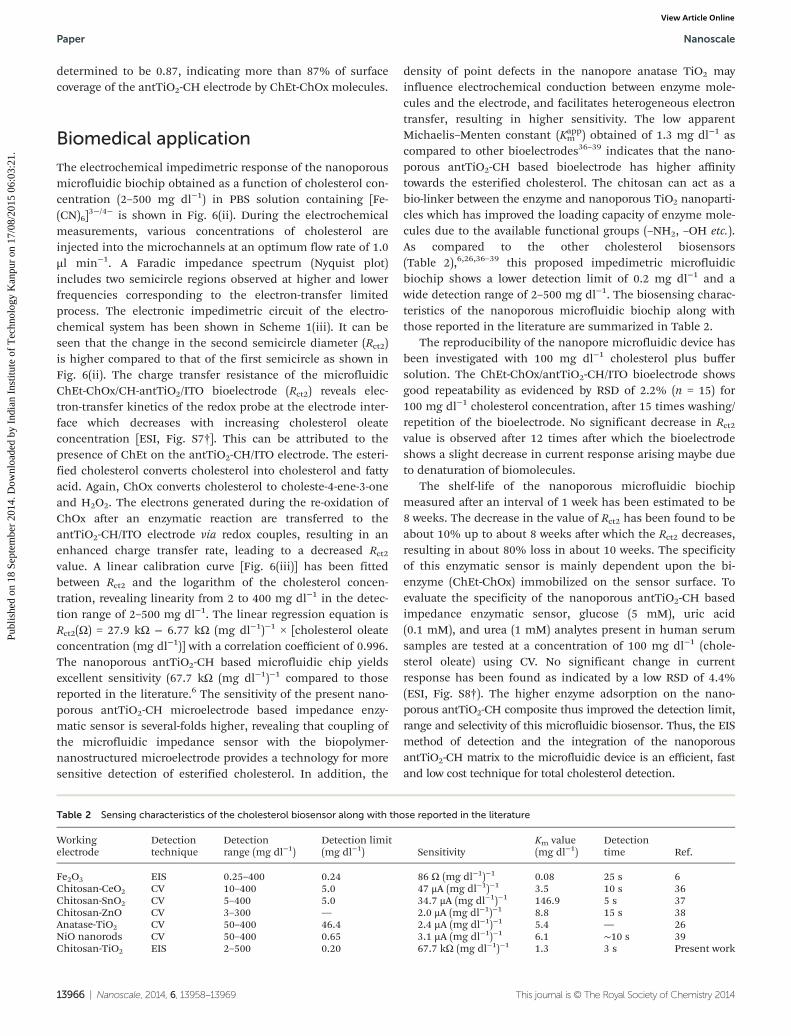
m ) obtained of 1.3 mg dl−1 ascompared to other bioelectrodes36–39 indicates that the nano-porous antTiO2-CH based bioelectrode has higher affinitytowards the esterified cholesterol. The chitosan can act as abio-linker between the enzyme and nanoporous TiO2 nanoparti-cles which has improved the loading capacity of enzyme mole-cules due to the available functional groups (–NH2, –OH etc.).As compared to the other cholesterol biosensors(Table 2),6,26,36–39 this proposed impedimetric microfluidicbiochip shows a lower detection limit of 0.2 mg dl−1 and awide detection range of 2–500 mg dl−1. The biosensing charac-teristics of the nanoporous microfluidic biochip along withthose reported in the literature are summarized in Table 2.
The reproducibility of the nanopore microfluidic device hasbeen investigated with 100 mg dl−1 cholesterol plus buffersolution. The ChEt-ChOx/antTiO2-CH/ITO bioelectrode showsgood repeatability as evidenced by RSD of 2.2% (n = 15) for100 mg dl−1 cholesterol concentration, after 15 times washing/repetition of the bioelectrode. No significant decrease in Rct2value is observed after 12 times after which the bioelectrodeshows a slight decrease in current response arising maybe dueto denaturation of biomolecules.
The shelf-life of the nanoporous microfluidic biochipmeasured after an interval of 1 week has been estimated to be8 weeks. The decrease in the value of Rct2 has been found to beabout 10% up to about 8 weeks after which the Rct2 decreases,resulting in about 80% loss in about 10 weeks. The specificityof this enzymatic sensor is mainly dependent upon the bi-enzyme (ChEt-ChOx) immobilized on the sensor surface. Toevaluate the specificity of the nanoporous antTiO2-CH basedimpedance enzymatic sensor, glucose (5 mM), uric acid(0.1 mM), and urea (1 mM) analytes present in human serumsamples are tested at a concentration of 100 mg dl−1 (chole-sterol oleate) using CV. No significant change in currentresponse has been found as indicated by a low RSD of 4.4%(ESI, Fig. S8†). The higher enzyme adsorption on the nano-porous antTiO2-CH composite thus improved the detection limit,range and selectivity of this microfluidic biosensor. Thus, the EISmethod of detection and the integration of the nanoporousantTiO2-CH matrix to the microfluidic device is an efficient, fastand low cost technique for total cholesterol detection.
Table 2 Sensing characteristics of the cholesterol biosensor along with those reported in the literature
Workingelectrode
Detectiontechnique
Detectionrange (mg dl−1)
Detection limit(mg dl−1) Sensitivity
Km value(mg dl−1)
Detectiontime Ref.
Fe2O3 EIS 0.25–400 0.24 86 Ω (mg dl−1)−1 0.08 25 s 6Chitosan-CeO2 CV 10–400 5.0 47 μA (mg dl−1)−1 3.5 10 s 36Chitosan-SnO2 CV 5–400 5.0 34.7 μA (mg dl−1)−1 146.9 5 s 37Chitosan-ZnO CV 3–300 — 2.0 μA (mg dl−1)−1 8.8 15 s 38Anatase-TiO2 CV 50–400 46.4 2.4 µA (mg dl−1)−1 5.4 — 26NiO nanorods CV 50–400 0.65 3.1 µA (mg dl−1)−1 6.1 ∼10 s 39Chitosan-TiO2 EIS 2–500 0.20 67.7 kΩ (mg dl−1)−1 1.3 3 s Present work
Paper Nanoscale
13966 | Nanoscale, 2014, 6, 13958–13969 This journal is © The Royal Society of Chemistry 2014
Publ
ishe
d on
18
Sept
embe
r 20
14. D
ownl
oade
d by
Ind
ian
Inst
itute
of
Tec
hnol
ogy
Kan
pur
on 1
7/08
/201
5 06
:03:
21.
View Article Online

Conclusion
We have fabricated a nanoporous microfluidic biochip basedon dispersive nanostructured antTiO2 nanoparticles grafted CHfor the detection of cholesterol molecules. The morphological(AFM, SEM) and spectroscopic (Raman, FT-IR, XPS) investi-gations of the nanoporous antTiO2-CH matrix indicate itssurface functionalization with ChEt-ChOx bienzyme mole-cules. The total pore volume decreases by around 57.2% (i.e.from 0.2961 cc g−1 to 0.1265 cc g−1 of pore volume) after chito-san incorporation into nanoporous anatase titania and thesurface area decreases due to blocking of the pore entrances.Using the ac impedance approach, we have investigated theimpedance change due to catalytic reactions of enzymes withtarget analyte for cholesterol detection using an antTiO2-CHbased microfluidic biochip. The impedance analysis of thismicrofluidic device offers small instrument size, low reagentconsumption, and system automation, indicating that thismicrofluidic device has a high potential for clinical appli-cations. The presence of defects (Ti3+, Ti2+, Ti0 etc.) in nano-pore antTiO2 may be responsible for the higher sensitivity, thelow detection limit and the improved stability of the fabricatedmicrofluidic chip. The improved biosensor characteristics canbe explained by the high electronic conductivity of nanoporousantTiO2-CH and good catalytic activity of the nanoparticles.The presence of CH not only enhances the film forming abilitybut also improves dispersion of antTiO2 nanoparticles at theelectrode surface. In the future, this microfluidic biochip withthe nanoporous antTiO2-CH electrode may prove to be anefficient platform for the diagnostics of other clinically impor-tant analytes such as glucose, urea, lipids, etc.
Materials and methodsBiochip design
The PDMS microchannels of desired dimensions (2 cm × 200µm × 200 µm) were fabricated using soft lithographic tech-nique.26 The inlet and outlet were fabricated by punching holesat the ends of the microchannel. Two patterned microelectrodescomposed of dimensions (0.2 × 2.5 cm2) have been prepared onan ITO coated glass slide of size 2.5 × 3.5 cm2 by photolitho-graphy. The ITO glass is cleaned with acetone prior to use.First, we spin-coated the positive photoresist (Shipley 1811)onto the ITO glass substrate with 3000 rpm for 20 s. In orderto remove the solvent, the photoresist coated substrate was softbaked using a hot plate for 1 min. Then, the substrate wasexposed to UV radiation for about 5 min through a givenoptical mask (high resolution black printed transparent sheet).The substrate was dipped into a positive photoresist developersolution for 10 s to develop the pattern. Lastly, the chemicalITO etchant (zinc dust + HCl solution 15%) was used to etchITO from the exposed region. The remaining photoresiston ITO after ITO etching was removed by acetone. This pat-terned ITO electrode was then cleaned with acetone via soni-cation (10 min), later with dichloromethane (10 min), and
finally with water several times. These clean electrodes wereplaced in a vial wherein a mixture of H2O–H2O2 (30%)–NH3
(25%) (5 : 1 : 1) is added and stirred for 1 h at 70 °C. Then, theslides were washed with plenty of water and dried in an ovenat 100 °C for 4 h.
A CH (0.50%) solution was prepared by dissolving CH(50 mg) in 100 ml of acetate buffer (0.05 M, pH 4.2) solution.The precursor material titanium(IV) butoxide was dissolved in2-methoxy ethanol in order to prepare 5 wt% sol–gel usingdeionized H2O and nitric acid treatment under continuousstirring. After hydrolysis, the thick sol was kept for aging at anintermediate temperature ∼110 °C for half an hour. Finally,the sol was annealed at 450 °C for 2 h under an air atmosphereto obtain antTiO2 nanoparticles. The calculated amount ofantTiO2 nanoparticles was dispersed in the CH solution (5 mgml−1) under stirring at room temperature after which it wasultra-sonicated. A highly viscous solution of CH with uniformlydispersed antTiO2 nanoparticles was thus obtained. The selec-tive deposition of antTiO2-CH solution has been carried out onthis fabricated patterned ITO electrode via dip coating.Initially, the glass substrate with the ITO microelectrode wasmasked using a tape and only the desired electrode was selec-tively exposed by removing the masking tape over it. The sub-strate was then dried at 40 °C for about 1 h after which theremaining masking tape film was removed from the substrate.This process resulted in a glass substrate containing antTiO2-CH/ITO (unmasked region) and the bare ITO electrode(masked region). The antTiO2-CH/ITO film was washed withdeionized water to remove any loosely bound particles.
Surface functionalization
The fresh solution was prepared by mixing 1 mg ml−1 chole-sterol esterase (ChEt) and 1 mg ml−1 cholesterol oxidase(ChOx) in PBS buffer in the ratio 1 : 1. 10 µl solution of thismixture was uniformly spread onto the antTiO2-CH surface viaphysical absorption [Scheme 2] and kept in a humid chamberfor about 12 h at 4 °C. The surface charged antTiO2 nanoparti-cles interacted with –NH2/OH groups of CH [cationic amine-rich polysaccharide (pH 4.2)] via electrostatic interactions andhydrogen bonding. The bienzyme ChEt-ChOx being negativelycharged at pH 7.0 could be immobilized on the positivelycharged antTiO2-CH via electrostatic interactions. This ChEt-ChOx/antTiO2-CH based bioelectrode was washed with 50 mMPBS (pH 7.0) in order to remove any unbound enzymes fromthe electrode surface. The bioelectrode was stored at 4 °Cwhen not in use. It has been found that the ChEt-ChOx/antTiO2-CH/ITO bioelectrode shows high catalytic behavior inphosphate buffer at pH 7.4 (50 mM, 0.9% NaCl) containing[Fe(CN)6]
3−/4− (5 mM). The PDMS microchannel was reversiblysealed to a glass substrate composed of the ITO electrode andthe ChEt-ChOx/antTiO2-CH/ITO bioelectrode, respectively. Theinlet reservoir of the microchannel was used to introduce thesyringe pump to maintain the flow rate at 1 µl min−1. An Ag/AgCl wire introduced to the outlet reservoir of the microchan-nel acts as a reference electrode and the bare ITO microelec-trode serves as the counter electrode [Scheme 1(i and ii)].26
Nanoscale Paper
This journal is © The Royal Society of Chemistry 2014 Nanoscale, 2014, 6, 13958–13969 | 13967
Publ
ishe
d on
18
Sept
embe
r 20
14. D
ownl
oade
d by
Ind
ian
Inst
itute
of
Tec
hnol
ogy
Kan
pur
on 1
7/08
/201
5 06
:03:
21.
View Article Online

The various steps relating to the functionalization of antTiO2microelectrode surface are shown in Scheme 2. During choles-terol detection, the unreacted reactants were removed bywashing microchannels with the help of phosphate buffer foreach concentration of cholesterol.
Acknowledgements
The authors thank Director CSIR-NPL, New Delhi, India for thefacilities. We thank Mr Sandeep, AFM Lab, CSIR-NPL, NewDelhi for the AFM analysis. Md. A. Ali and S. Srivastava arethankful to CSIR, India for the award of Senior ResearchFellowships. We thank Mr Tilak Joshi for providing the facilityfor ITO patterning using photolithography. Authors are thank-
ful to Dr Venu Reddy and Prof. CheolGi Kim for the XPSmeasurements. V. V. A. is thankful to a TSDP-DST & CSIRempowered project for funding. The financial support receivedfrom Department of Science and Technology, India (grant no.DST/TSG/ME/2008/18), the Indian Council of MedicalResearch, India (grant no. ICMR/5/3/8/91/GM/2010-RHN) andthe DST Unit on Nanoscience at IIT Kanpur is gratefullyacknowledged.
References
1 K.-H. Lee, J.-O. Lee, M.-J. Lee, B. Sohn, S.-H. Choi,S. K. Kim, J.-B. Yoon and G.-H. Cho, Biosens. Bioelectron.,2010, 26, 1373–1379.
Scheme 2 Functionalization of the bienzyme onto the antTiO2-CH surface for cholesterol detection.
Paper Nanoscale
13968 | Nanoscale, 2014, 6, 13958–13969 This journal is © The Royal Society of Chemistry 2014
Publ
ishe
d on
18
Sept
embe
r 20
14. D
ownl
oade
d by
Ind
ian
Inst
itute
of
Tec
hnol
ogy
Kan
pur
on 1
7/08
/201
5 06
:03:
21.
View Article Online

2 F. Lisdat and D. Schäfer, Anal. Bioanal. Chem., 2008, 391,1555–1567.
3 J.-J. Wu and D. K.-P. Wong, Adv. Mater., 2007, 19, 2015–2019.
4 J. S. Daniels and N. Pourmand, Electroanalysis, 2007, 19,1239–1257.
5 A. Bonanni and M. del Vallea, Anal. Chim. Acta, 2010, 678,7–17.
6 A. Kaushik, P. R. Solanki, K. Kaneto, C. G. Kim, S. Ahmadand B. D. Malhotra, Electroanalysis, 2010, 22, 1045–1055.
7 P. Neužil, S. Giselbrecht, K. Länge, T. J. Huang andA. Manz, Nat. Rev. Drug Discovery, 2012, 11, 621.
8 V. N. Goral and P. K. Yuen, Ann. Biomed. Eng., 2012, 40,1244–1254.
9 T. Vilkner, D. Janasek and A. Manz, Anal. Chem., 2004, 76,3373–3385.
10 D. J. Harrison, K. Fluri, K. Seiler, Z. Fan, C. S. Effenhauserand A. Manz, Science, 1993, 261, 895–897.
11 A. C. R. Grayson, R. S. Shawago, M. J. Johnson, N. T. Flynn,Y. Li, M. J. Chima and R. Langer, Proc. IEEE, 2004, 92, 6–21.
12 H. Becker and C. Gartner, Electrophoresis, 2000, 21, 12–26.13 L. Gervais and E. Delamarche, Lab Chip, 2009, 9, 3330–
3337.14 S. K. Sia and G. M. Whitesides, Electrophoresis, 2003, 24,
3563–3576.15 Z. Nie, C. A. Nijhuis, J. Gong, X. Chen, A. Kumachev,
A. W. Martinez, M. Narovlyansky and G. M. Whitesides, LabChip, 2010, 10, 477–483.
16 S. K. Arya, G. Chornokur, M. Venugopal and S. Bhansali,Analyst, 2010, 135, 1941–1946.
17 Y. B. Hahn, R. Ahmad and N. Tripathy, Chem. Commun.,2012, 48, 10369–10385.
18 P. R. Solanki, A. Kaushik, V. V. Agrawal and B. D. Malhotra,NPG Asia Mater., 2011, 3, 17–24.
19 G. Shen, P. C. Chen, K. Ryu and C. Zhou, J. Mater. Chem.,2009, 19, 828–839.
20 E. S. Kwak, W. Lee, N.-G. Park, J. Kim and H. Lee, Adv.Funct. Mater., 2009, 19, 1093–1099.
21 S. Yurdakal, G. Palmisano, V. Loddo, V. Augugliaro andL. Palmisano, J. Am. Chem. Soc., 2008, 130, 1568–1569.
22 D. Chen, F. Huang, Y.-B. Cheng and R. A. Caruso, Adv.Mater., 2009, 21, 2206–2210.
23 J. Wang, Y. Zhou, Y. Hu, R. O’Hayre and Z. Shao, J. Phys.Chem. C, 2011, 115, 2529–2536.
24 J. Cui, D. Sun, S. Chen, W. Zhou, P. Hu, H. Liu andZ. Huang, J. Mater. Chem., 2011, 21, 10633.
25 R. Wang, C. Ruan, D. Kanayeva, K. Lassiter and Y. Li, NanoLett., 2008, 8, 2625–2631.
26 Md. A. Ali, S. Srivastava, P. R. Solanki, V. V. Agrawal,R. John and B. D. Malhotra, Appl. Phys. Lett., 2012, 101,084105.
27 H. G. Yang, C. H. Sun, S. Z. Qiao, J. Zou, G. Liu,S. C. Smith, H. M. Cheng and G. Q. Lu, Nature, 2008, 453,638–641.
28 H. B. Jiang, Q. Cuan, C. Z. Wen, J. Xing, D. Wu, X.-Q. Gong,C. Li and H. G. Yang, Angew. Chem., Int. Ed., 2011, 50,3764–3768.
29 P. Xiaoa, Y. Zhangb and G. Cao, Sens. Actuators, B, 2011,155, 159–164.
30 A. C. Papageorgiou, N. S. Beglitis, C. L. Pang, G. Teobaldi,G. Cabailh, Q. Chen, A. J. Fisher, W. A. Hofer andG. Thornton, Proc. Natl. Acad. Sci. U. S. A., 2010, 107, 2391–2396.
31 K.-J. Feng, Y.-H. Yang, Z.-J. Wang, J.-H. Jiang, G.-L. Shenand R.-Q. Yu, Talanta, 2006, 70, 561–565.
32 E. J. W. Crossland, N. Noel, V. Sivaram, T. Leijtens,H. J. A. Webber and H. J. Snaith, Nature, 2013, 495, 215–219.
33 T. Wagner, S. Haffer, C. Weinberger, D. Klaus andM. Tiemann, Chem. Soc. Rev., 2013, 42, 4036–4053.
34 H. Li, T.-Y. Ma, D.-M. Kong and Z.-Y. Yuan, Analyst, 2013,138, 1084–1090.
35 Q. Li, K. Cheng, W. Weng, P. Du and G. Han, J. Mater.Chem., 2012, 22, 9019–9026.
36 B. D. Malhotra and A. Kaushik, Thin Solid Films, 2009, 518,614–620.
37 A. A. Ansari, A. Kaushik, P. R. Solanki and B. D. Malhotra,Electroanalysis, 2009, 21, 965–972.
38 R. Khan, A. Kaushik, P. R. Solanki, A. A. Ansari,M. K. Pandey and B. D. Malhotra, Anal. Chim. Acta, 2008,616, 207–213.
39 Md. A. Ali, P. R. Solanki, M. K. Patel, H. Dhayani,V. V. Agrawal, R. John and B. D. Malhotra, Nanoscale, 2013,5, 2883–2891.
Nanoscale Paper
This journal is © The Royal Society of Chemistry 2014 Nanoscale, 2014, 6, 13958–13969 | 13969
Publ
ishe
d on
18
Sept
embe
r 20
14. D
ownl
oade
d by
Ind
ian
Inst
itute
of
Tec
hnol
ogy
Kan
pur
on 1
7/08
/201
5 06
:03:
21.
View Article Online