a survey of perceived risks on the use of mobile telephone
TRANSCRIPT

A SURVEY OF PERCEIVED RISKS ON THE USE OF MOBILE TELEPHONE
SERVICES AMONG CONSUMERS IN NAIROBI
BY:
T O W E T T J .C
•vIVMVfc'WSlTY U h NAIHUtft
LUWLR KAUtHE Li&RAR)
A MANAGEMENT RESEARCH PROJECT SUBMITTED IN PARTIAL
FULFILLMENT FOR THE REQUIREMENTS FOR THE MASTER OF
BUSINESS ADMINISTRATION DEGREE, FACULTY OF COMMERCE
UNIVERSITY OF NAIROBI.« ——
SEPTEMBER, 2002

DECLARATION
This thesis is my original work and has not been submitted for a degree another university.
Signature
Josephine Towett (Candidate)
Date. rrholoa
UNfVrRCJ TV LQviLR K L̂j L:
CL NAIVQtif 1 L- LIQ RAR'
This thesis has been submitted for examination with my approval as the university supervisor.
Signature...........
Name:Dr R.M.Musyoka

Dedication
This piece of work is dedicated to:
Sasha, my sleeping beauty who never cried, may you rest in peace and to my
late Father John Kipkemoi who made me believe that the sky was the limit.

Acknowledgment
I wish to acknowledge the support of many who contributed to my success in one-way or another.
First I wish to thank my employer Telkom Kenya limited for the partial sponsorship, all my colleagues and especially Engineer Gathuri Njorohio for facilitating the sponsorship.
My family both nucleus and extended who remained a source of inspiration through out the programme.
And lot of appreciation to all the lecturers in the programme and especially my supervisor Dr.Musyoka .
Thank you all for your support.
. <
i
ABSTRACT
The study was carried out with the aim of establishing if the users of mobile
telephone service perceive any risks, the nature and extent of these risks and the
strategies they have adopted so as to cope with their perceived risks.
In order to achieve the objectives a questionnaire with both structured and semi-
structured questions was administered to the respondents by a research
assistant. A sample of one hundred respondents was selected from the two
service providers ie Safaricom and Kencell. The data was collected from the
respondents at the service provider's customer service outlets in the city center.
The data collected was analyzed using mean scores, frequencies, percentages
and presented in tables .A five point likert scale was used to identify and
measure the extent of perceived risk by the respondents. Correlation analysis
was done so as to relate the extent of risk perception on the use of mobile
telephone services to the respondents' demographics which included age,
gender, occupation and education level.
From the findings of the study the following conclusions were made:
• Mobile telephone users in Kenya perceive various risks. These are:
Performance, physical, social, psychological, financial and time loss risks.
• Users of mobile phones in Kenya have adopted various risk reduction
strategies SQ„as to cope with their perceived risks both before and after
purchase of tnobile telephone services.
i
'JMiVEPsrry of M am o t* LUWbP KACGrt LIBRARY
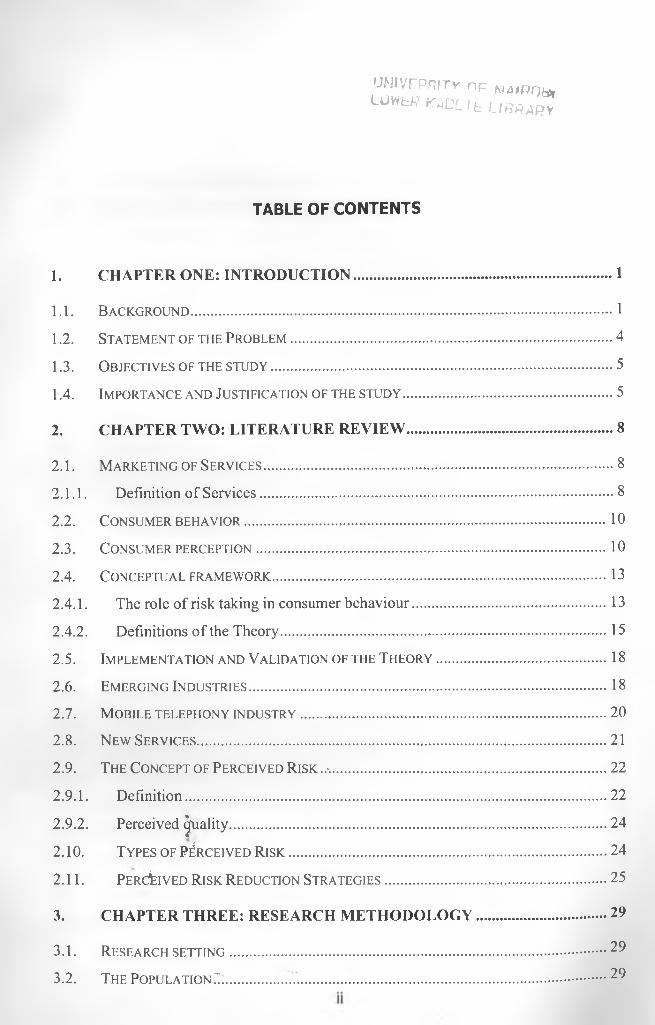
TABLE OF CONTENTS
1. CHAPTER ONE: INTRODUCTION................................................................. 1
1.1. Background..................................................................................................... 1
1.2. Statement of the Problem ...............................................................................4
1.3. Objectives of the stu d y .................................................................................. 5
1.4. Importance and Justification of the study...................................................5
2. CHAPTER TWO: LITERATURE REVIEW.................................................... 8
2.1. Marketing of Services.................................................................................... 8
2.1.1. Definition o f Services..................................................................................... 8
2.2. Consumer behavior ....................................................................................... 10
2.3. Consumer perception.................................................................................... 10
2.4. Conceptual framework................................................................................ 13
2.4.1. The role o f risk taking in consumer behaviour..............................................13
2.4.2. Definitions o f the Theory............................................................................. 15
2.5. Implementation and Validation of the T h eo ry ......................................... 18
2.6. Emerging Industries...................................................................................... 18
2.7. Mobile telephony industry......................................................................... 20
2.8. N ew Services.................................................................................................. 21
2.9. The Concept of Perceived R isk ..>...................................................................22
2.9.1. Definition..................................................................................................... 22
2.9.2. Perceived Quality...........................................................................................24
2.10. Types of Perceived R is k ............................................................................ 24
2.11. Perceived R isk Reduction Strategies.................................................... 25
3. CHAPTER THREE: RESEARCH METHODOLOGY...................................29
3.1. Research setting ............................. 29
3.2. The Population ' : ............... 29

3.3. T he Sample and Sample Design....................... 29
3.4. Data Collection M ethod............................................................................. 30
3.5. Data A n a lys is ............................................................................................... 31
3.6. Operationalization of Terms.......................................................................31
3.6.1. Perceived risks..............................................................................................31
3.6.2. Mobile telephone services......................k..................................................... 32
3.6.3. Consumers o f mobile telephone services........................................................32
4. CHAPTER FOUR: DATA ANALYSIS AND FINDINGS.............................33
4.1. Sample statistics............................................................................................33
4.2. Response rate s ...............................................................................................33
4.3. Sample demographics.................................................................................... 34
4.3.1. Respondents Gender..................................................................................... 34
4.3.2. Respondents age............................................................................................34
4.3.3. Respondents education level..........................................................................35
4.3.4. Respondents occupation................................................................................ 36
4.4. T ypes of perceived risks................................................................................ 36
4.4.1. Perceived Performance risk............................................................................36
4.4.2. Perceived Financial risk................................................................................ 37
4.4.3. Perceived social risk.....................................................................................41
4.4.4. Psychological risk.........................................................................................44
4.4.5. Physical risk................................................................................................. 45
4.4.6. Time loss risk........................... .*................................................................. 49
4.5. R isk REDUCTION STRATEGIES............................................................................ 52■*
4.6. Summary ofjmeans.........................................................................................54* <. i4.7. Correlation a n a lys is ................................................................................... 55
5. CHAPTER FIVE: DISCUSSIONS, CONCLUSIONS AND
RECOMMENDATIONS............................................................................................... 61
5.1. Introduction 61
UNIVERSITY OP NAIROBIlo w er k a d e t e l ib r a r y
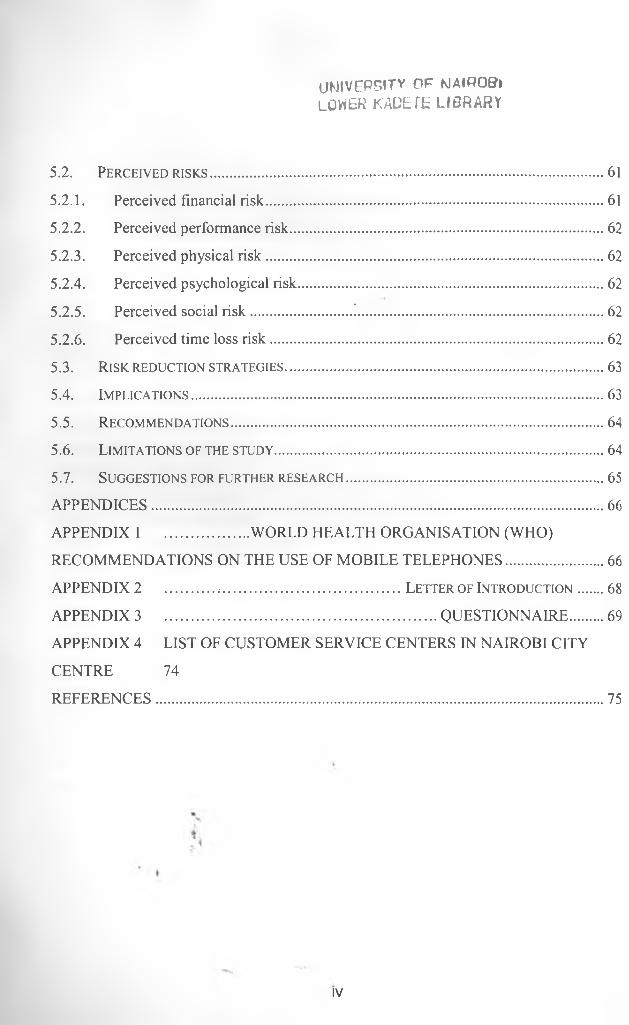
5.2. Perceived risks.....................................................................................
5.2.1. Perceived financial risk.............................................................................
5.2.2. Perceived performance risk.......................................................................
5.2.3. Perceived physical risk.............................................................................
5.2.4. Perceived psychological risk.....................................................................
5.2.5. Perceived social risk........................!....................................................... .
5.2.6. Perceived time loss risk...........................................................................
5.3. RISK REDUCTION STRATEGIES........................................................................
5.4. Implications.........................................................................................
5.5. Recommendations................................................................................
5.6. L imitations of the study......................................................................
5.7. Suggestions for further research......................................................
APPENDICES........................................................................................................
APPENDIX 1 ....................WORLD HEALTH ORGANISATION (WHO)
RECOMMENDATIONS ON THE USE OF MOBILE TELEPHONES....................
APPENDIX 2 ........................................................Letter of Introduction ...
APPENDIX 3 ................................................................ QUESTIONNAIRE.....
APPENDIX 4 LIST OF CUSTOMER SERVICE CENTERS IN NAIROBI CITY
CENTRE 74
REFERENCES.......................................................................................................
61
61
62
62
62
62
62
63
63
64
64
65
66
66
68
69
75
IV
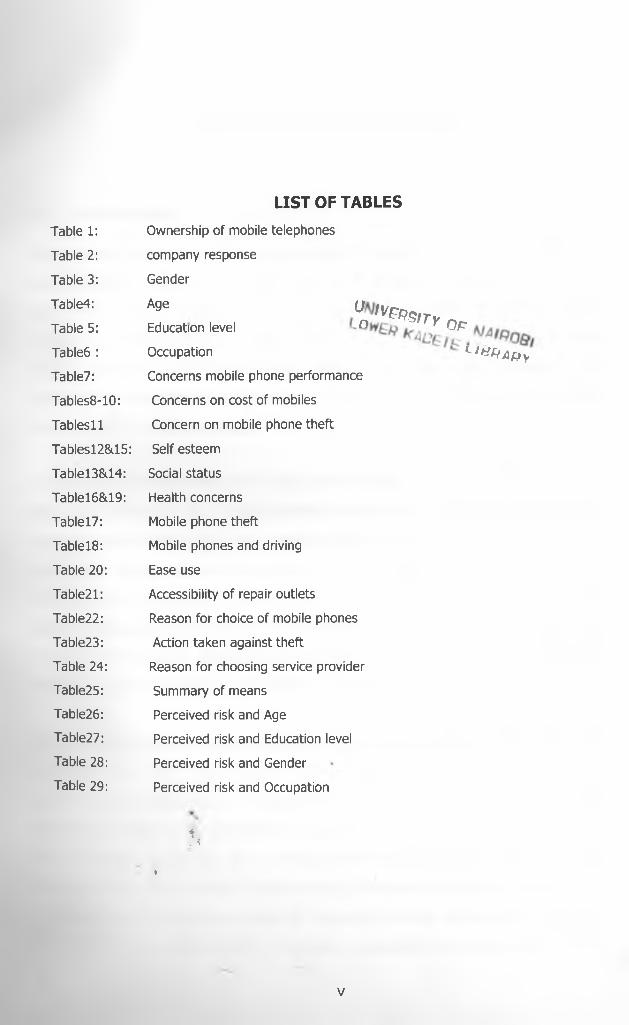
LIST OF TABLES
Table 1: Ownership of mobile telephones
Table 2: company response
Table 3: Gender
Table4:T , , Un IVe*SITY n cTable 5: Education level r O p
Table6 : Occupation L i & f jA p y
Table7: Concerns mobile phone performance
Tables8-10: Concerns on cost of mobiles
Tablesll Concern on mobile phone theft
Tablesl2&15: Self esteem
Tablel38d4: Social status
Tablel6&19: Health concerns
Tablel7: Mobile phone theft
Tablel8: Mobile phones and driving
Table 20: Ease use
Table21: Accessibility of repair outlets
Table22: Reason for choice of mobile phones
Table23: Action taken against theft
Table 24: Reason for choosing service provider
Table25: Summary of means
Table26: Perceived risk and Age
Table27: Perceived risk and Education level
Table 28: Perceived risk and Gender
Table 29: Perceived risk and Occupation
*t. *
»
V

university op nmiroe?»LOWER KAUETE LIBRARY
1. CHAPTER ONE: INTRODUCTION
1.1. Background
Today mobile telephones are an integral part of modern telecommunications. In
many countries, more than half the population already use mobile phones and
the market is still growing. In Africa, it was expected that 28 million people
would have mobile phones by the end of year 2001. Currently the African
market potential is estimated at 700 million more subscribers. Globally, it is
estimated by industry experts that there will be 1.6 billion mobile phone uses in
the year 2005 (http:www.itu.int).
In Kenya, the liberalization of the Telecommunications sector in 1998 set out the
regulatory framework for a multi-operator environment. The liberalization of the
sector saw the licensing of two mobile telephone service operators, Safaricom
Ltd a joint venture between Vodafone UK and Telkom Kenya Ltd and Kencell
Communications Limited a joint venture between Sameer investments and
Vivendi international of France. The licensing of the two operators has seen the
growth of the mobile telephony industry in Kenya from a customer base of
85,000 in 2000 to 800,000 in April 2002. (East African Standard 2002).
The mobile telephony industry in Kenya is an emerging industry and most of the
customers are first time buyers. It is important therefore to study and
understand the behaviour of consumers in this new industry. Buyers of new
products are faced with uncertainty since they cannot tell the consequences of
their purchase decisions. In a study carried out by Arndt (1970) on the♦
introduction of a new brand of coffee among housewives, it was established that
consumers perceive different levels of uncertainty when faced with a choice to
try or not to try a new product. Consumer perceptions are also said to affect
1
their buying habits and may not also be based on objective reality. (Schiffman
and Kanuk 2000).Therefore managers in this industry would have a need to
develop an insight of consumer perceptions . This would be useful in directing
marketing efforts in a profitable manner and ensuring the rapid adoption of this
new technology in Kenya.
Various issues have been raised by stakeholders in the industry on the use of
mobile telephone services both locally and internationally. Mobile phones are said
to emit radioactive waves which could cause brain cancer. Studies carried out by
the World health organization remain inconclusive but scientists involved have
observed and reported health risks which include changes in brain activity,
reaction times, and sleep patterns (htttp//www.who.int.). As a result, WHO has
issued guidelines to consumers in an attempt to minimize radiation effects if use
of mobile phones is found to be harmful.(See Annex 1)
Incidences have also been reported where use of mobile telephones by drivers
while driving not only endangered their lives but those of other road users. The
severity of this problem is seen by the legislation existing in certain countries
such as Canada and some States in the United States of America where use of
mobile phones while driving is banned.
Use of mobile phones has also been reported to jeopardize the safety and
security of the users. Consumers of these services have been exposed to
muggings, thefts and in extreme cases death. Perhaps this issue is well
expressed by a customer who was interviewed by the East African Standard on
the use of mobile phones and said:
"But the problem'is that the phone has put me in a very vulnerable
position. I have to think about its safety for I remain a target of
petty thieves as well as muggers who would seize every opportunity
to snatch it". (East African Standard, 2002).
2
There are various models or types of mobile phones as seen in the
advertisements by the vendors and the mobile phone operators . Making the
right choice may not easy for consumers. One risks making the wrong product
choice and experiencing a lot of anxiety (Keith, 1981).Greenleaf and
Lehmann(1995 ) further note that consumers think less of themselves because
they have not made the right product choice or paid an unfavorable price for it.
The cost of handsets and connectivity have come down tremendously from Ksh
150,000 in 1992 to less than Ksh 5,000 today. But despite these, call charges
remain high especially for inter-network calls. Most customers got connected in
the hope that their choice of telecommunication service will meet their
communication needs. But the story is different for many customers. Some are
seen carrying around their phones not to call but to receive messages only.
Some have resorted to subscribing to both operators so that they reach their
callers who are connected to either of the operators at a reasonable rate. So
customers feel they are paying too much for these services than they should and
therefore prohibiting constant touch with loved ones and business associates.
Baumol (1957) states that choice is the key issue in consumer behaviour and the
outcome of this choice can only be known in the future. Since the outcome can
only be known it the future, consumers therefore take risks in purchase decisions
because they have to deal with uncertainties about the future (Baumer, 1960).
Consumers are therefore said to perceive financial and performance risks if they
are not certain about4'the functionality of the product or service. They also. <
perceive social and psychological risks if they are uncertain on the effects of the
product on their self esteem. They perceive physical risks if they are uncertain on
the safety of the product on themselves and their families. They perceive time
loss risk if product search and or maintenance will be involving. (Schiffman and
Kanuk,2000, Zikmund and D'Amico 1995).
3
Though consumers perceive certain risks when making purchase decisions, it is
noted that they adapt certain strategies so as to overcome their uncertainity. The
most favorable risk reduction methods applicable to most product categories
include: Celebrity endorsements, brand loyalty, brand image, tested brands,
store image, product trials, money back guarantees, buying expensive models,
word of mouth recommendations. (Roselius 1971, Taylor 1974)
Therefore finding out consumer risk perceptions and risk-handling methods in
this new industry will aid in focusing product development and marketing efforts.
Kardes (1999) notes that managers who really understand their customers,
develop better products and services, promote their products and services more
effectively and devise marketing plans and strategies that foster sustainable
competitive advantage for their product and services.
1.2. Statement of the Problem
U M ivrP 'irrv np NAIR0BtLDKLk KADL iE LIBRARY
Mobile telephony has changed the lifestyles of many Kenyans. Today, those with
mobile phones are able to communicate any time, anywhere. Mobiles phones
provide convenience as one does not have to get home or to the office to make
or receive a telephone call.
Studies done on the perceived quality of service into the mobile phone industry
indicated that there is a significant perceived quality gap. According to Maina
(2001), the service providers do not meet the customer expectations on most of*
the service descriptors This could be an indicator of the inherent risk on the use
of these services.*
Another study on the perceived quality of service by port users established that
foreign and local port users perceive quality of service at the ports to be below
their expectations and below average and hence explained the general
satisfaction with the quality of port services (Mwendar 1996).
Locally there may be no studies carried out in the industry on consumer risk
perceptions. Identifying and documenting consumer perceived uncertainties or
risks and their risk handling methods would therefore serve to direct marketing
efforts and aid the rapid adoption of this new technology. Extensive literature
review has also revealed that consumers perceive certain risks in product
decision making and that they also adopt certain strategies so as to reduce their
uncertainties or risks. Though the industry is witnessing rapid market growth,
understanding consumer behavoiur is pertinent. Therefore the question the
study seeks to address is: Do users of mobile telephones perceive any
risks in Kenya? And if they do, what is the nature of these perceived
risks and how have they handled them?
1.3. Objectives of the study
The objectives of the study are to:
i) To establish the nature and extent of risks perceived by consumers of
mobile telephone services.
ii) To find how consumers of mobile telephone services have addressed
these perceived risks.
1.4. Importance and Justification of the study
Telecommunications services are key in the economic development of a country,
(http//.www.wto.org).*An efficient telecommunications infrastructure would not
only support the efficiency of other industries but also will attract investors into
the country. This is true especially now that major multinationals are said to
planning to relocate to other cities in Africa and the major reason is cited is poor
telecommunication services (Daily Nation 2002). Rapid spread of mobile
5

telephone services will therefore complement the public fixed telephone network
operated by Telkom Kenya Ltd and hence support the growth of the
telecommunication industries.
The creation of an information society will also depend on the availability of
telecommunications services. Currently, teledensity in Kenya based on the
landlines stands at 1.05 (International Telecommunication Union 2000),
(http//.www.itu.int). Rapid adoption of mobile telephone services will contribute
greatly to reducing the digital divide as outlined in the Poverty Reduction
Strategy paper (2001) by the government, and spread of information
communications technology (ICT).
Most customers are first time buyers and no doubt the marketers in this industry
are faced with task of inducing subscription and getting new customers.
Therefore their main task is to inform customers of the basic nature and
functions of their new services and convince them that they can actually perform
these functions and persuade them that the benefits of purchasing them
outweigh the risks (Porter 1980).
In this emerging industry, the regulator will also play the role of protecting
consumers against unfair practices. For the regulator to articulate consumer
concerns adequately, knowledge of their concerns would be required.
In the light of the above, this study will be useful to:
1. Marketers in thecellular industry in the formulation of marketing\
strategies. *<
2. Investors in the industry who will be interested in the consumer
characteristics and consumer buying behaviour.
6

3. Government as part of their wide strategy to create an information society
and development of Information Communication Technology (ICT) in
Kenya.
4. Regulator in the Telecommunications industry who will need informed
knowledge on consumer concerns.
5. Researchers who may wish to carry out further consumer research in the
mobile telephone industry.
UNIVERSITY n c .Ka b e j I
L,t- ‘-WRARy
7

2. CHAPTER TWO: LITERATURE REVIEW
2.1. Marketing of Services
Marketing of services involves different techniques from marketing products.
But before the 1970's it was thought that the traditional marketing techniques
used for physical products would work just as well for services. (Rust et al,
1996). As the developed economies changed, much emphasis was put on
producing intangible services as opposed to manufacturing physical goods.
2.1.1. Definition of Services
Various definitions of services exist by various authors. Kotler and Armstrong
(1996) have defined services as "any act or performance that one party can offer
to another that is essentially intangible and does not result in the ownership of
anything. Its production may or may not be tied to a physical product". The
American Marketing Association (AMA 1960) defines service as "activities,
benefits, and satisfaction which are offered for sale or are provided in connection
with the sale of goods.
This study will adopt the definition given by Kotler and Armstrong(1996) above,
which has the following implications:-
• Intangibility
• Occurrence of an exchange
• Acquisition of km eth ing of value by the purchaser as an act or
performance.
8
2. CHAPTER TWO: LITERATURE REVIEW
2.1. Marketing of Services
Marketing of services involves different techniques from marketing products.
But before the 1970's it was thought that the traditional marketing techniques
used for physical products would work just as well for services. (Rust et al,
1996). As the developed economies changed, much emphasis was put on
producing intangible services as opposed to manufacturing physical goods.
«
2.1.1. Definition of Services
Various definitions of services exist by various authors. Kotler and Armstrong
(1996) have defined services as "any act or performance that one party can offer
to another that is essentially intangible and does not result in the ownership of
anything. Its production may or may not be tied to a physical product". The
American Marketing Association (AMA 1960) defines service as "activities,
benefits, and satisfaction which are offered for sale or are provided in connection
with the sale of goods.
This study will adopt the definition given by Kotler and Armstrong(1996) above,
which has the following implications:-
• Intangibility
• Occurrence of an exchange
• Acquisition of something of value by the purchaser as an act or
performance.
8
2.1.2 Unique Characteristics of Services
Services have certain characteristics that distinguish them from physical goods.
These are intangibility, inseparability variability and perishability (Palmer, 2000).
Intangibility
Services are intangible: They cannot be seen, tested, heard or smelt before they
are purchased. Services are performances that can be experienced only as they
are delivered (Berry et al. 1982). They are therefore said to be riskier than
physical goods since they cannot be experienced before they are purchased
(Schiffman & Kanuk 2000).
Variability
Services cannot be produced consistently; and the customers are usually present
in the production process (Palmer 2000). Production may differ from day to day
and from time to time thus making uniform quality difficult to assure. (Booms
and Pittner, 1981)
Inseparability
Production of services and consumption is simultaneous. The two processes are
inseparable (Carmen et al, 1980). Therefore this makes checking of quality
impossible at production. Usually the service may be provided in the customers
presence (Rust et al 1996).
Perishability
Unlike most goods, sen/ices cannot be stored. This, therefore requires that
attention is given to the management of demand and supply (Palmer 2000).
9
2.2. Consumer behavior
Consumer behavior has been defined as the behavior shown by people in
planning, purchasing and using goods and services (Kibera and Waruingi 1988).
Organizations that lose sight of their customers cannot compete effectively
against firms that stay close to their customers. Analyzing consumer behavior is
therefore of utmost importance to business managers.
2.3. Consumer perception
Consumer behaviour is a complex decision process by the individual consumer
overtime. A purchase may be preceded by an involving series of related
psychological and physical activities, which influence its nature and may be
followed by other psychological and physiological activities which may influence
similar transactions in future.
According to Ennew et al (1990), the presence of any negative attitudes from
any reference group or unforeseen situational factors could affect purchase
decisions.
Individuals are said to act and react on the basis of their perceptions and not on
other basis of objective reality and each one is said to see the world in their own
special way.(Shciffman and Kanuk,2000) Therefore consumer perceptions are
of utmost importance to marketers because a customers decision to purchase a
product will be influenced to a great extent by the way he perceives a product.
The manifestation of consumer perception is captured in figure 1. It shows that
perception is among those issues that serve to direct consumer behavior.* .i .. i
Perception is th e ‘ process by which individuals select, organizes and interpret
stimuli into a meaningful and coherent picture of the world (Schiffman and
Kanuk 2000). Perceptions are therefore personal and hence people can give a
different account of a similar event. They report based on their perceptions.
10

Kibera and Waruingi (1988) note that our perception of an object or an event is
the result of the interaction of two types of factors:
i) Stimulus factors which are characteristics of the physical objectives such
as color, weight, or shape.
ii) Individual factors which are characteristics of the individual, that is past
experience, motivations and expectations.
p> Ty■t-v k-,L .',j
*. i
1 1
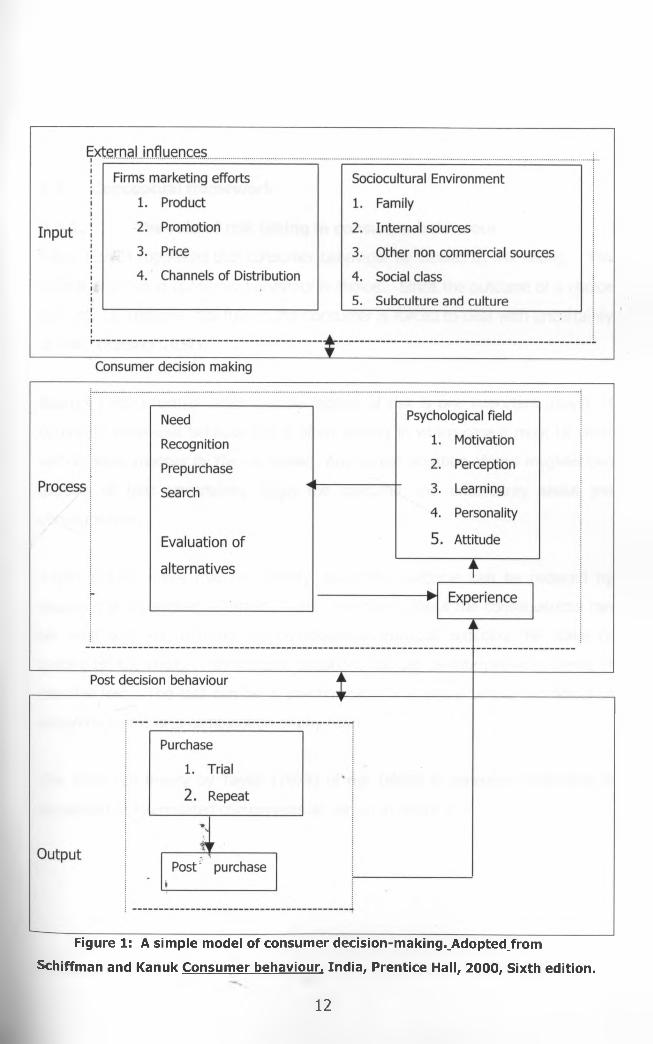
Figure 1: A simple model of consumer decision-making._Adopted_from
Schiffman and Kanuk Consumer behaviour. India, Prentice Hall, 2000, Sixth edition.
12
2.4.1. The role of risk taking in consumer behaviour
Bauer (1960) suggested that consumer behaviour be viewed as risk taking. The
central problem in consumer behaviour is choice. Since the outcome of a choice
can only be known in the future, the consumer is forced to deal with uncertainty
or risk. (Baumol 1957).
Baumol (1957) further notes that perception of risk is one important aspect of
consumer behaviour because risk is often anxiety in which case it must be dealt
with in some manner by the consumer. Any choice situation always involves two
aspects of risk: uncertainty about the outcome and uncertainty about the
consequences.
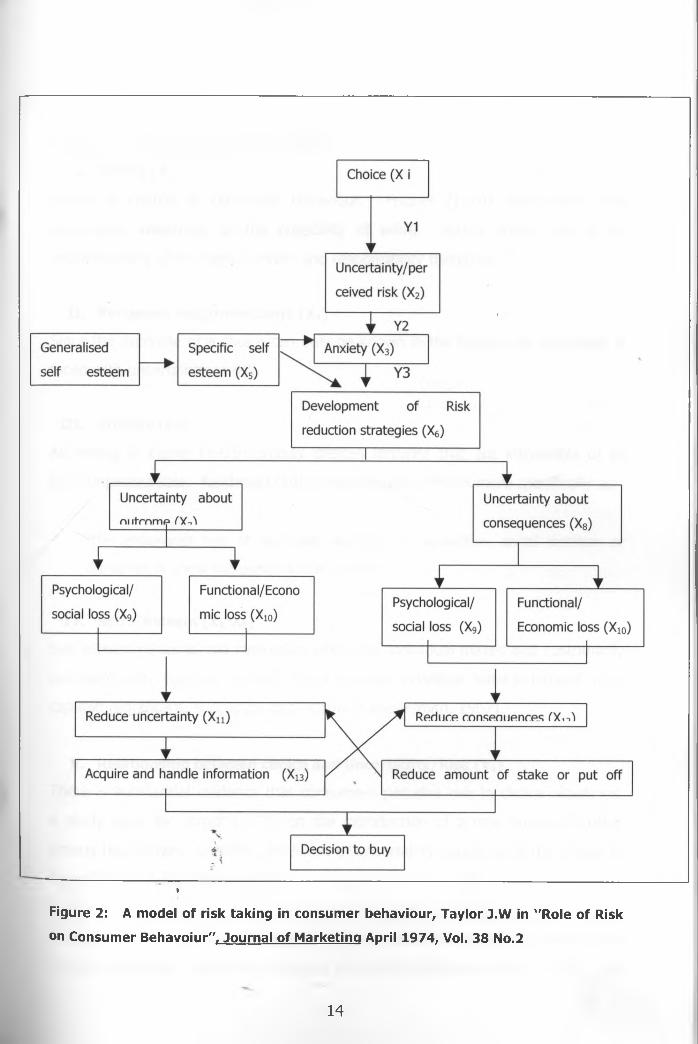
Taylor (1974) notes that uncertainty about the outcome can be reduced by
acquiring and handling information and uncertainty about the consequences can
be dealt with by reducing the consequences through reducing the stake or
putting off the choice. In a choice situation, risk can be interpreted in terms of
possible loss. The loss can be in psychological or in social terms, functional or
economic terms or a combination of any form.
The proposed theory by Taylor (1974) of risk taking in consumer behaviour is
composed of interrelated components as shown in figure 2.
2.4. Conceptual framework
♦
Figure 2 : A model of risk taking in consumer behaviour, Taylor J.W in wRole of Risk
on Consumer Behavoiur", Journal of Marketing April 1974, Vol. 38 No.2
14
2.4.2. Definitions of the Theory
I. Choice (Xi)
Choice is central to consumer behaviour. Fischer (1970) notes that the
consumers awareness of the possibility of willful action brings with it an
understanding of the fact of choice and responsibility therefore...".
II. Perceived risk/uncertainty (X2)
Since the outcome of a choice can only be known in the future, the consumer is
faced with uncertainty or risk.UMIVH; it v -LOWER ' rjAtHQktt
II I . Anxiety (X3) RY
According to Fisher (1970) anxiety creates tensions that are intorelable or at
least unpleasurable. Reichman (1955) describes the effects more specifically as:
"the anticipated loss of love and approval, or separation, social isolation or
disruption of one's interpersonal relationships".
IV. Self - Esteem (X4, X5)
Self esteem refers to the evaluation which the individual makes and customarily
maintains with regard to himself; it expresses an individual belief in himself to be
capable, significant, successful and worthy (Coppersmith, 1967).
V. Relationship between choice and Uncertainty/Risk (Yx)
There is substantial evidence that consumers perceive risk in choice situations.
A study done by Arndt (1970) on the introduction of a new brand of coffee
among housewives, identified the levels of uncertainty perceived in the choice to
try or not to try.the new product.
A study by Cox and Rich (1964), among women who shopped in department
stores, established telephone shoppers perceived significant amount of risk but
15
also seemed unwilling or unable to deal with their uncertainty in such a way as
to reduce the perceived risk to the point where it would be comfortable.
VI. Relationship between Risk and Anxiety (Y2)
There is no published research that supports this relationship but according to
May (1950) "whenever a possibility is visualised by an individual, anxiety is
potentially present".
VII. Choice, Anxiety and Risk Reducing Strategies (Y3)
According to the theory of risk taking in consumer behaviour, choice situation
involves uncertainty which creates some level of anxiety. Since anxiety is
uncomfortable, consumers are thought to develop strategies to reduce the risk in
choice situations and thereby reduce the inherent anxiety. According to a study
conducted by Roselius (1971) to rate the usefulness of eleven different methods
of reducing risk among housewives, there were significant differences in
consumer preferences for risk reducing strategies in relation to the types of loss
perceived as possible in a particular buying situation.
VIII. The Composition of Perceived Risk (X7, X8)
The theory postulates that every choice situation has two separate types of risk
involved in the decision. One risk is uncertainty about the outcomes of the
decision, and the other type of risk is uncertainty about the consequences of
making a mistake.
IX. Reduction of Uncertainty (Xn )
a) Information handling (X12)
The theory recognises that there are different channels of information available
to the consumer and that different channels are seen as more or less appropriate
in reducing various types of risk. A study done by Arndt (1970), on introduction
of a new brand of coffee supported this proposition in that it established that the
16
amount of perceived risk in trying a new product was closely related to the use
of word of mouth recommendation.
b) Transmission of Information (X13)
The flow of information was found to be a two-way process rather than a one
way by Arndt (1970). He found that as much opinion leaders volunteered
information, they were also asked for it.
c) Information processing (Xi3)
An attempt was made to understand how consumers evaluate information
relating to the buying process. Cox and Bauer (1964) studied the affects of new
information on a group of women who made judgements about the quality of
identical pairs of stockings. They found out that women put differing amounts of
confidence on the new information depending upon the individuals confidence in
her ability to judge the stockings, and her ability to judge the new source of
information.
X. Reduction of Consequences (Xi2)
Studies supporting this phase of the theory are not conclusive but suggest that
consumers either choose not to make the decision or reduce the amount of
involvement in terms of investment. (Cox, Bauer 1964).
XI. The role of self-esteem/self confidence (X*, Y5)
Self esteem and self confidence are said to influence consumer behaviour in two
ways. First, self-esteeqn contributes to the amount of anxiety that results from
perception of the situation. Fischer (1970) states that it is the realization that
something must tbe accomplished or possessed and the sense that one's
competence may be inadequate to the task, that is essential to the experience of
anxiety.
17
Secondly, self esteem influences consumers behaviour by being instrumental in
the selection of appropriate risk reduction strategies. (Coopersmith 1967 ). This
is further explained by Hirsch et al (1972) who studied 300 housewives in
Cincinnati on their store selection and product purchasing and concluded that for
each product studied, consumers self esteem and their self assessed ability to
choose a store in which to buy seemed to bear on how much risk they perceived.
Thus linking the concepts of generalized self-esteem, specific self-esteem and
perceived risk.
2.5. Implementation and Validation of the Theory
Taylor (1974) proposed the following general format for the implementation and
empirical validation of the theory of risk taking in consumer behavoiur:
• Measure self confidence in relation to choice of the product category.
• Measure perceived risk in product category.
• Measure type of loss associated with product category.
• Measure perceived risk in brand choice.
• Measure preferences for various risk-reducing strategies.
• Measure the appropriate size of groups of consumers with common
characteristics in perception of risk, self-confidence, and preferred risk -
reducing strategies for use in evaluating cost/effectiveness of various
marketing programmes.
2.6. Emerging Industries
Emerging industries aue newly formed or reformed industries that have been
recently created by technological innovations, shifts in relative cost relationships,
emergence of new consumer needs, or other economic and sociological changes
that elevate a new product or services to the level of a potentially viable business
opportunity Porter (1980)..
18
Therefore buyers of an emerging industry's product or service are inherently
first time buyers and the marketing taslds one of inducing substitution or getting
buyer to purchase the new product or service instead of something else. The
buyers must be informed about the basic nature and functions of the new
product or service and be convinced that it can actually perform these functions
and also be persuaded that the risk of purchasing it are rationally borne given
the potential benefits (Porter 1980).
One of the crucial questions for strategic purposes in an emerging industry is
often the assessment of which markets for the new industry's product will open
up early and which will come later. This assessments not only helps focus
product development and marketing efforts but also is essential since early
markets often exert a major influence on the manner in which an industry
develops (Porter 1980).
Emerging industries share common characteristics which include the following
(Porter,1980):
Technological uncertainty: The uncertainty may relate to the product
configuration that will ultimately prove to be the best or the production
technology that may prove to be the most efficient.
Strategic uncertainty: No right strategy is clearly identified in an emerging
industry. Different firms use different approaches to product or market
positioning, marketing*'servicing among others. Firms may also have poor
information about competitors, characteristics of customers and industry
conditions in an emerging phase. Reliable industry sales and market share data
are often unavailable.
19

High initial costs but cost reduction: Small production volume and initial
heavy investment combine to produce high cost. Reduction in cost is due to
increase in sales leading to accumulated volume of output, increased efficiency
of employees due to job familiarity and upcoming ideas in terms of improved
procedures.
First time buyers: Buyers of the emerging industry's product or service are*
inherently first time buyers. Thus marketing tasks is to attract customers, retain
customers and create brand loyalty.
Short time horizon: The pressure to develop customers or produce products
to meet demand in this industry is so great that bottleneck and problems are
dealt with expedience rather than as a result of an analysis of future conditions.
Industry conventions are often born out of pure chance.
Subsidy: In most cases there is subsidization of early entrants from either the
government or non-government sources. Subsidies often and a great degree of
instability to an industry.
U M fVrprjry Cf= MainQgi2.7. Mobile telephony industry LOWER Kmul !l library
The mobile telephony industry is an emerging industry whose growth rate is
high. In the year 2002, the industry registered phenomenal growth. Despite the
negative growth of the Kenyan economy at negative 0 .3% the mobile industry
expanded by Kshs 4138 in the year 2000 (Economic Survey 2001).
i. <
In June 2001, the total number of subscribers was 300,000 (Economic Survey
2001) and as of April 2002, there were about 800,000 mobile phone users in
Kenya (East African Standard). The market potential for the services in Kenya is
estimated at lOmillion people(Market trends).
20
The services are tailored around pre-paid and post paid solutions. Currently the
two operators provide the following value added services besides voice
telephony.
• Voice mail
• Short messaging services (SMS)
• International roaming
• Call forwarding
• Call conferencing
• Info-line services
• Internet browsing.
2.8. New Services
According to Schiffman and Kanuk (2000) there is no universally accepted
definition of the terms "product innovation" or "new product".
Various approaches have been considered to try and define a new product and
or a new service. They can be classified as: firms, product, market and
consumer oriented definitions of innovations.
i) Firm Oriented definitions
This approach treats the newness of a product from the perspective of the
company marketing it. If a product is new to a company, then it is considered
new. It ignores whether the product is new to the market place (Schiffman and
Kanuk, 2000).
4. *
ii) Product oriented definitions
This definition focuses on the features inherent In the product itself and on the
effects these features are likely to have on consumers established usage patterns
(Schiffman and Kanuk, 2000).
21
iii) Market - oriented definition
A market oriented approach judges the newness of a product in terms of how
much exposure consumers have to the new product. Under this approach a
product is considered new if it has been purchased by a relatively small
percentage of the potential market and it has been in the market for a relatively
short period of time.
iv) Consumer - oriented definitions
According to this approach, a new product is any product that a potential
consumer judges to be new. It is a based on consumer perceptions and not
physical features or market realities.
This study shall adopt the market-oriented definition that considers a product to
be new based on the % of sales in the potential market and the period of time it
has been in the market.
2.9. The Concept of Perceived Risk
2.9.1. Definition
Perceived risk is defined as the uncertainty or fear that a consumer feels when
considering a purchase of a new product (Schiffman, Kanuk 2000).Consumers
are uncertain because they cannot predict the outcome of their purchase
decisions.Perceived risk by consumers is subjective. That is to say that it may or
may not exist or it may not bear a strong relationship to what actually exist.
Perceived risk is also s§ld to be a function of the individual, the product and the
situation. Research on perceived risk and trials of new products indicate that the
innovative consumer is low risk perceiver whereas the high risk perceiver is not
keen on trying out new products (Schiffman and Kanuk 2000).
22
Studies of risk perceptions among adolescents revealed that adolescents who
engaged in high risk activities e.g drug use differ significantly from those who do
not engage in high risk activities (Hirsch et al 1993).
Certain product categories are also perceived to be riskier than others. For
example a consumer may perceive higher degree of risk when purchasing a
motor vehicle than when purchasing a telephone headset. Studies have also
revealed that services are perceived to be riskier than products because they do
not lend themselves to trials before purchase (Kath and John 1990)
Certain product distribution channels are also perceived to be riskier than others.
For example mail, telephone and catalogue orders were perceived to be riskier
than the traditional retail outlets since the customers do not have the
opportunity to inspect the goods before purchasing. Positive experiences and
favourable word of mouth have since seen arise in mail orders and catalog
buying(Schiffman and Kanuk 2000).
Perceived risk may also be present if the product is expensive or is complex and
hard to understand. Perceived risk can also be a factor when a product choice
is visible to others and one runs the risk of embarrassment if the wrong choice is
made (Solomon, 1979).
Perceived risk or uncertainties can influence consumer decision making to a great
extent. Greenleaf and Lehmann (1995) noted in their study that among other
things consumers delayed their purchase decisions because of perceived risks.
The nature of perceived risks identified by the study were classified as financial
and performance risks, psychological and social risk, physical and time loss risks.
23

2.9.2. Perceived quality
Broadly quality can be defined as superiority or excellence and by extension
perceived quality can be defined as the consumers judgment about a products
overall excellence or superiority.(Aaker,1983).So perceived quality is different
from the objective quality or actual quality and is not a specific attribute oOf a
product. Zeithaml (1988) also notes that perceived quality is a global
assessment that resembles attitude and is usually made within a consumers
evoked set .Organisations therefore have to strive to close the quality perception
gap. This requires them to view quality form the consumers point of view.
2.10. Types of Perceived Risk
Consumers perceive several kinds of risks in a purchase situation (Schiffman and
Kanuk,2000 ,Ennew et al,1990). These include:-
i) Financial risk: The consumers concern here would be that he may lose
money, pay too much for the product or miss buying something else.
ii) Performance risk: This is the fear that the product may not perform its
function well, or it may not work or it may breakdown.
iii) Physical risk: This is the fear that the product may be or become harmful
or injurious to one's health.
iv) Psychological risk: The product may not fit in well with the consumer's
self-image or self-concept.
•*
v) Social risk: The fear that the product may negatively affect the way
others think of the consumer.*
vi) Time risk: The fear that the product may fail completely thus wasting the
consumer's time, convenience and effort in getting it adjusted, repaired or
replaced.24
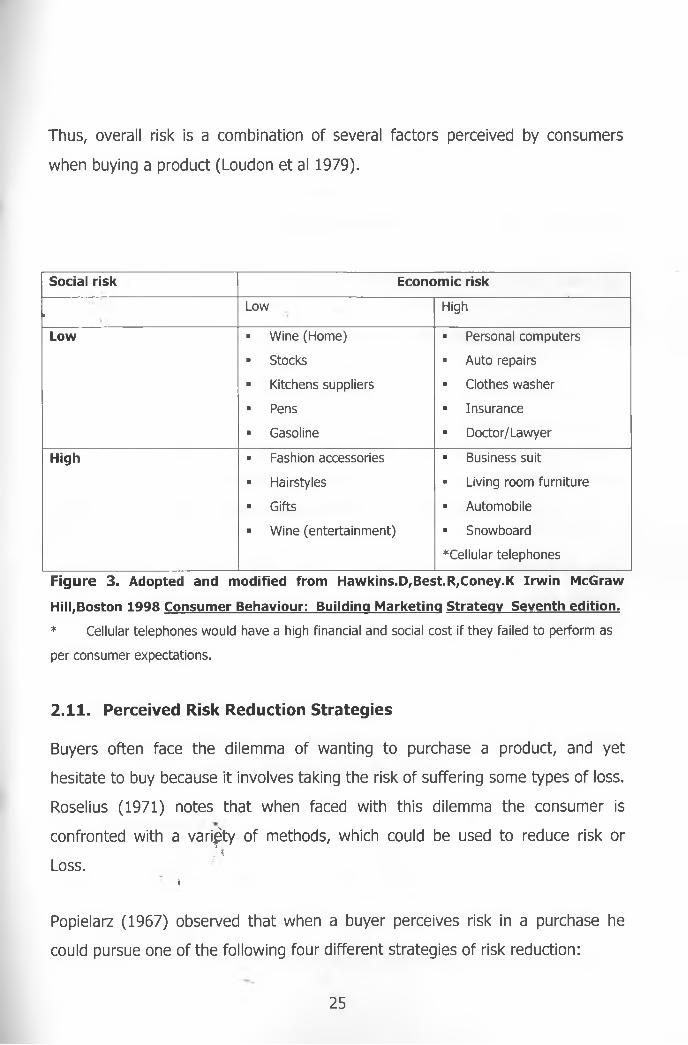
Thus, overall risk is a combination of several factors perceived by consumers
when buying a product (Loudon et al 1979).
Social risk Economic risk
i Low High
Low ■ Wine (Home)
■ Stocks
- Kitchens suppliers
■ Pens
■ Gasoline
■ Personal computers
■ Auto repairs
* Clothes washer
■ Insurance
■ Doctor/Lawyer
High ■ Fashion accessories
■ Hairstyles
■ Gifts
■ Wine (entertainment)
• Business suit
■ Living room furniture
■ Automobile
■ Snowboard
^Cellular telephones
Figure 3. Adopted and modified from Hawkins.D,Best.R,Coney.K Irwin McGraw
Hill,Boston 1998 Consumer Behaviour: Building Marketing Strategy Seventh edition.
* Cellular telephones would have a high financial and social cost if they failed to perform as
per consumer expectations.
2.11. Perceived Risk Reduction Strategies
Buyers often face the dilemma of wanting to purchase a product, and yet
hesitate to buy because it involves taking the risk of suffering some types of loss.
Roselius (1971) notes that when faced with this dilemma the consumer is
confronted with a variety of methods, which could be used to reduce risk orL. {
Loss.i
Popielarz (1967) observed that when a buyer perceives risk in a purchase he
could pursue one of the following four different strategies of risk reduction:
25
i) He could reduce perceived risk by either decreasing the probability that
the purchase will fail or by reducing the severity of real or imagined loss
suffered if the purchase does fail.
ii) He could shift from one type of perceived loss to one for which he has
more tolerance.
iii) He could postpone the purchase in which he would be shifting from one
general risk type of another.
iv) He could make the purchase and absorb the unresolved risk.
Risk relievers are advice or action initiated by the buyer or seller to relieve risk.
Risk relievers are therefore methods which relieve risk - related hesitancy to buy
by serving as catalysts to facilitate purchase. It is postulated that buyers have a
set of many risk - relieving devices which range from most preferred to least
preferred which they call upon when needed (Roselius 1971).
A study carried out by Roselius (1971) showed that brand image and brand
loyalty were most favoured risk relievers among housewives who were asked to
rank 11 risk relievers on the basis on how helpful they are in reducing the threat
of various kinds of loss.
The eleven methods of risk relief used in the study and were found to be
representative, applicable to various methods of purchase and kinds of products
by Roselius (1971) and their definitions are. listed below:
i) Endorsements: ^
Buy the brand whose Advertisement has endorsements or testimonials from a
person you like, from a celebrity or from an expert on the product.
ii) Brand Loyalty
Buy the brand you have used before and have been satisfied with in the past.
26
iii) Major brand image
Buy a major, well-known brand of the product and rely on reputation of the
brand.
iv) Private testing
Buy whichever brand has been tested and approved by a private testing
company.
v) Storage Image
Buy a brand that is carried by a store, which you think is dependable, and rely on
reputation of the store.
vi) Free Sample
Use a free sample of the product on a trial basis before buying.
vii) Money back guarantee
Buy whichever brand offers a money back guarantee with the product.
viii) Government Testing
Buy the brand that has been tested and approved by an official branch of the
government.
ix) Expensive Model
Buy the most expensive and elaborate model of the product
x) Shopping

Shop around on your own and compare product features on several brands in
several stores.
xi) Word of Mouth
Ask friends or family for advice about a product.
*. <
28
3. CHAPTER THREE: RESEARCH METHODOLOGY
A descriptive study was be carried out so as to enable the researcher to
investigate further issues raised by the respondents as opposed to using simple
data gathering.
3.1. Research setting
The study was carried out in Nairobi among users of mobile telephone services.
The definition of a user of mobile telephone services for the purposes of the
study was either consumers of Safaricom Ltd or Kencell communications
services
3.2. The Population
The population of study consisted of all consumers of mobile telephone services
within Nairobi city centre. Nairobi was selected by the researcher because of
accessibility, limitation of resources i.e. time and finances and the fact that
consumers in Nairobi have been exposed to the services for longer period
compared to those in other towns..
3.3. The Sample and Sample Design
A sample size of 100 consumers was considered adequate to provide a general
view on the perceived risks on the use of mobile telephony and form the basis
of drawing conclusions/ Maina(2001) used a sample size of 100 customersi ^
successfully when studying the perceived quality of mobile telephone services
among customers in Nairobi.
The sample size of 100 respondents were selected at the service outlets of
Safaricom and Kencell within the city centre. The list of the outlets is shown29

Appendix4. 50 users of mobile phones were be interviewed from each firm. They
were selected systematically. Every 3 rd consumer entering the service outlet
was be asked to complete the questionnaire . Anybody entering the service
outlet and was not connected was excluded from the sample. First time buyers
were also be excluded and the next consumer considered since first time buyers
did not have any post purchase experience with mobile telephone services.
t
3.4. Data Collection Method
Data for this study was collected using a questionnaire(Appendix3). The
respondents of the questionnaire were users of mobile telephone services who
are consumers of either Safaricom Ltd or Kencell Communication Ltd services.
The Questionnaires were self-administered and distributed to the selected
respondents by a Research assistant. Respondents filled in the questionnaires as
they waited to served at the customer service centers. Use of a research
assistant ensured a high return rate.
The questionnaire had both open ended and closed questions. A five point likert
scale was used to measure the extent of perceived risks on the use of mobile
telephone services. The questionnaire was divided into three parts.
Section A had two parts. Part 1 had questions which were used to identify users
of mobile phones and their service provider. Questions in Parti 1 were aimed at
identifying and measuring rate of the perceived risks on the use of mobile»
telephone services in the following areas:
• Performance risk»
• Financial risk
• Physical risk
• Social risk
30

• Psychological risk
• Time loss risk
These questions in Section A were designed to answer the first objective of the
study.Questions in section B were designed to establish the risk handling
strategies the respondents have come up with and to address the second
objective of the study .Section C was used to collect the bio-data of the
respondents. An introduction letter (See Appendix 2) was issued to the
respondents before they were asked to complete the questionnaire.
3.5. Data Analysis
The questionnaires were edited for completeness and consistency before
processing. Data was coded to enable responses to be grouped into categories.
Descriptive statistics used to summarize the data include frequencies and
percentages. Mean scores were used for comparison purposes. Data is presented
in tables.
Correlation analysis was carried out to show the magnitude and direction of
relationship between the degree of perceived risk to certain aspects of the
demographics of the respondents like occupation, age, gender and education
level.
3.6. Operationalization of Terms
3.6.1. Perceived risks
The study used a number of statements generated regarding the concerns of
consumers of mobile telephone services so as to identify and classify the type of
risks perceived and also measure the degree of risk perception using a five point
Likert scale. The study did not measure the preferences for the various risk
reduction strategies as outlined by Taylor(1974) but sought to identify them by
31
using questions in Section B which are tailored to address the perceived risks
identified in Section A .
3.6.2. Mobile telephone services
Mobile telephone services refer to wireless telecommunication services using
portable handsets based on radio technology.
3.6.3. Consumers of mobile telephone services
Consumers of mobile telephone services were defined as individuals who
actually have a subscription and a mobile number given by either Safaricom Ltd
or Kencell communications and are the users of the services
. \
32
4. CHAPTER FOUR: DATA ANALYSIS AND FINDINGS
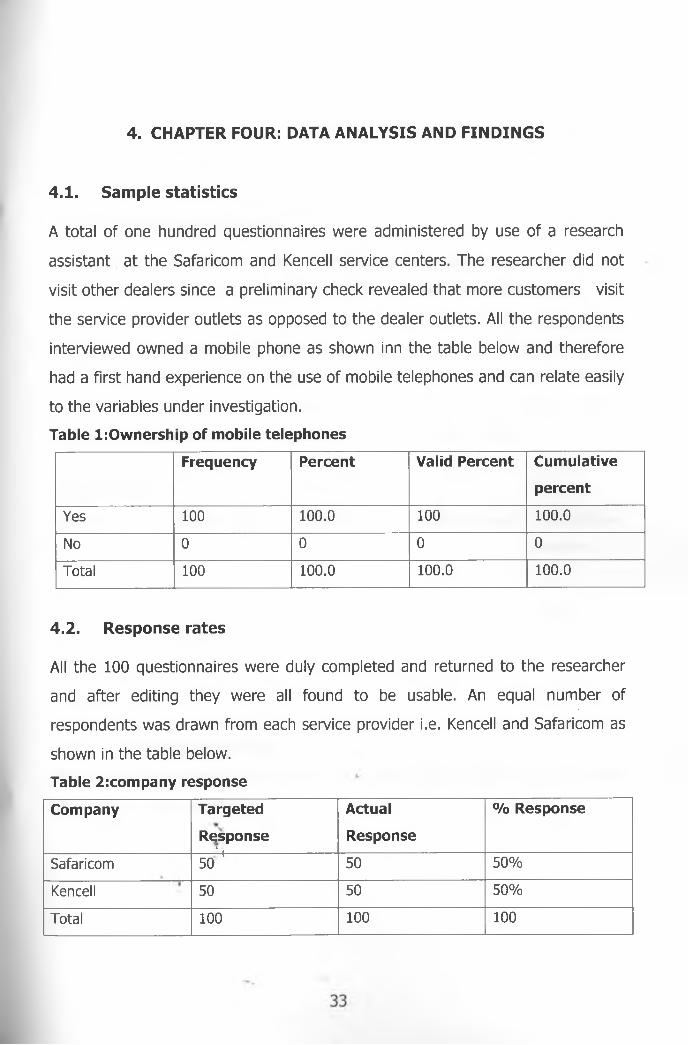
4.1. Sample statistics
A total of one hundred questionnaires were administered by use of a research
assistant at the Safaricom and Kencell service centers. The researcher did not
visit other dealers since a preliminary check revealed that more customers visit
the service provider outlets as opposed to the dealer outlets. All the respondents
interviewed owned a mobile phone as shown inn the table below and therefore
had a first hand experience on the use of mobile telephones and can relate easily
to the variables under investigation.
Table l:Ownership of mobile telephones
Frequency Percent Valid Percent Cumulative
percent
Y es 100 100.0 100 100.0
No 0 0 0 0
Total 100 100.0 100.0 100 .0
4.2. Response rates
All the 100 questionnaires were duly completed and returned to the researcher
and after editing they were all found to be usable. An equal number of
respondents was drawn from each service provider i.e. Kencell and Safaricom as
shown in the table below.
Table 2:company response
Company Targeted
Responsei
Actual
Response
% Response
Safaricom 50 + 50 5 0 %
Kencell 50 50 5 0 %
Total 100 100 100
From the above table it can be concluded that the study achieved a response
rate of 100% which was found to be adequate for the purpose of the study.
4.3. Sample demographics
The sample demographics considered for the study include gender, age,
occupation and education level. The findings are shown in the tables below.
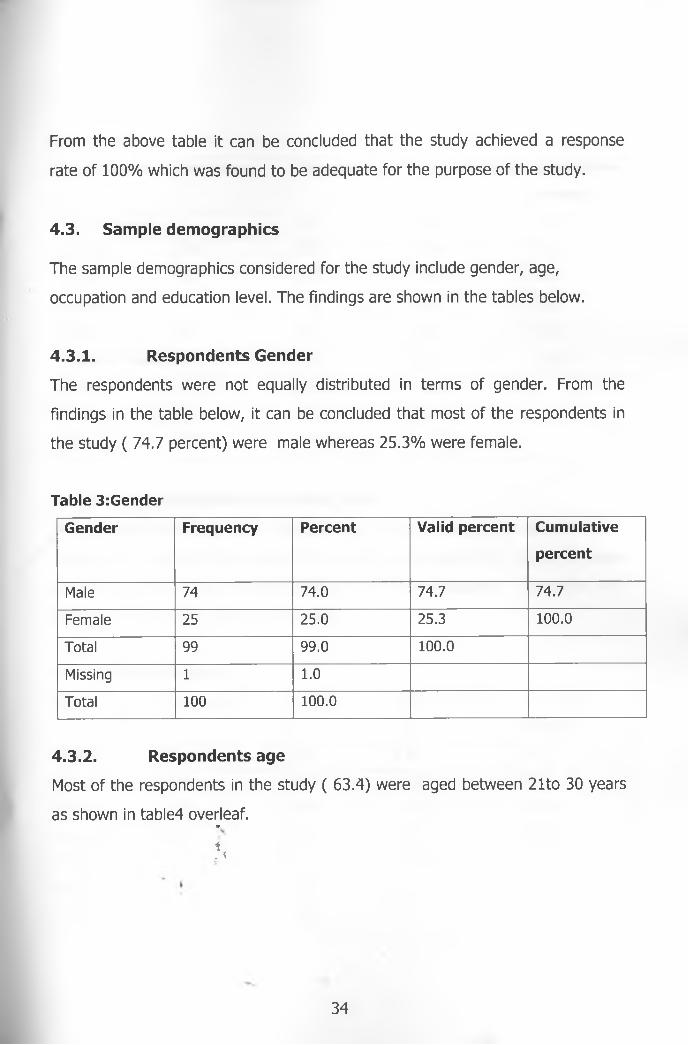
4.3.1. Respondents Gender
The respondents were not equally distributed in terms of gender. From the
Findings in the table below, it can be concluded that most of the respondents in
the study ( 74.7 percent) were male whereas 25.3% were female.
Table 3:Gender
Gender Frequency Percent Valid percent Cumulative
percent
Male 74 74 .0 74 .7 74 .7
Fem ale 25 25 .0 25 .3 100.0
Tota l 99 9 9 .0 100.0
Missing 1 1.0
Tota l 100 100.0
4.3.2. Respondents age
Most of the respondents in the study ( 63.4) were aged between 21to 30 years
as shown in table4 overleaf.■»
4 ;. {
34
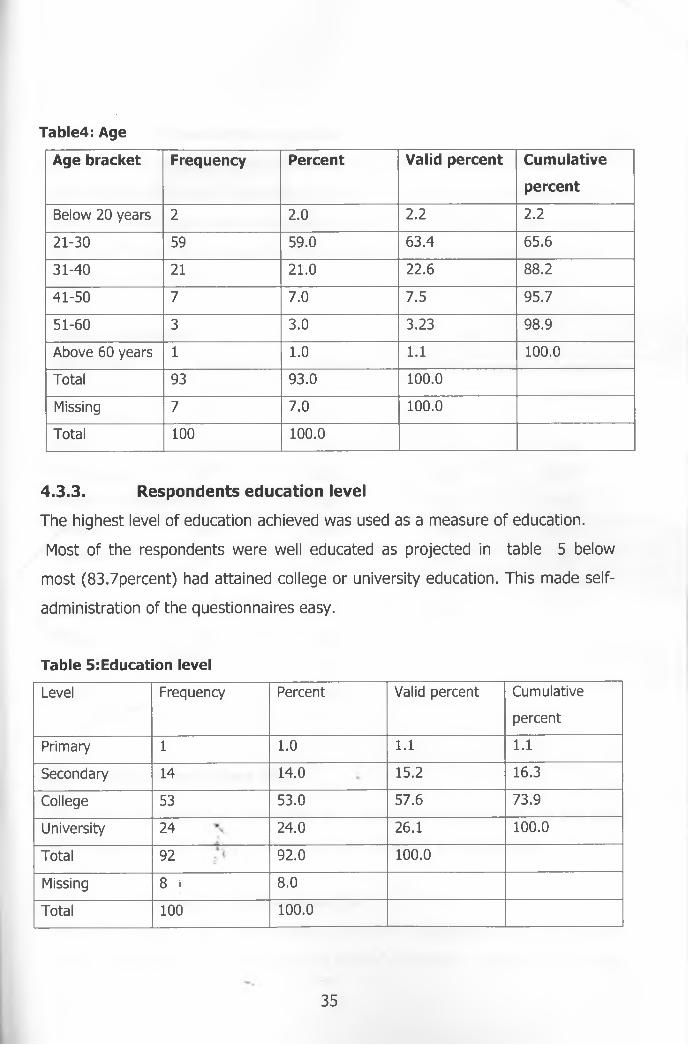
Table4: Age
Age bracket Frequency Percent Valid percent Cumulative
percent
Below 20 years 2 2 .0 2 .2 2 .2
21-30 59 59 .0 63 .4 65 .6
31-40 21 21 .0 22 .6 88 .2
41-50 7 7 .0 7 .5 95 .7
51-60 3 3 .0 3 .23 98 .9
Above 60 years 1 1.0 1.1 100.0
Tota l 93 9 3 .0 100.0
Missing 7 7 .0 100.0
Tota l 100 100.0
4.3.3. Respondents education level
The highest level of education achieved was used as a measure of education.
Most of the respondents were well educated as projected in table 5 below
most (83.7percent) had attained college or university education. This made self
administration of the questionnaires easy.
Table 5:Education level
Level Frequency Percent Valid percent Cum ulative
percent
Prim ary 1 1.0 1.1 1.1
Secondary 14 14.0 15 .2 16.3
College 53 53 .0 57 .6 73 .9
U n iversity 24 24 .0 26 .1 100.0
Tota l 92 92 .0 100.0
Missing 8 » 8 .0
Tota l 100 100.0
35
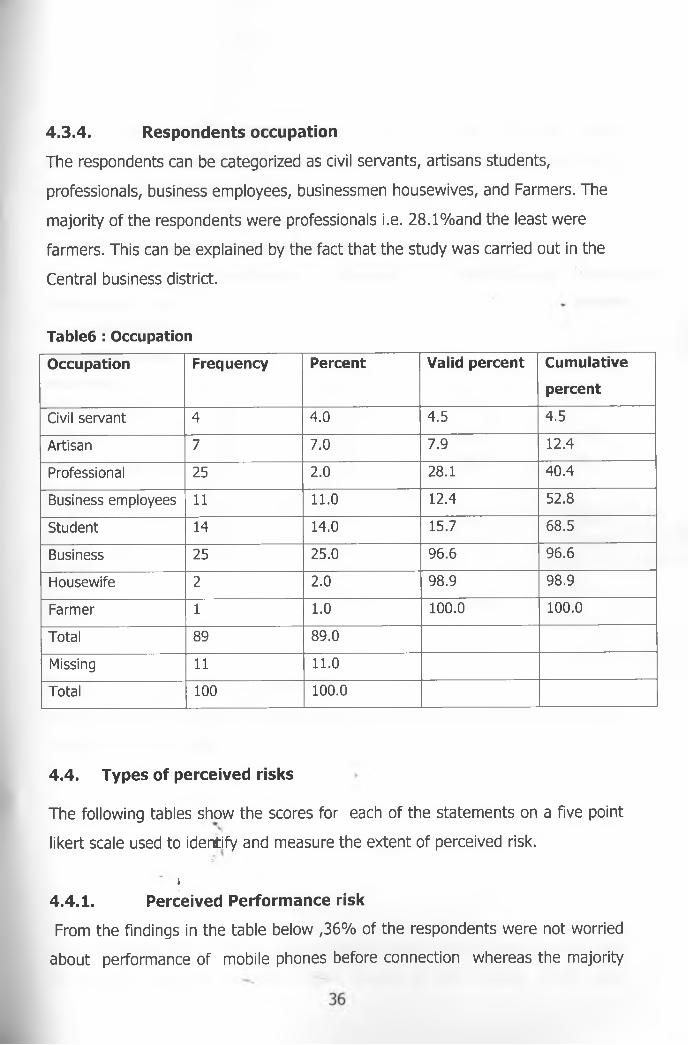
4.3.4. Respondents occupation
The respondents can be categorized as civil servants, artisans students,
professionals, business employees, businessmen housewives, and Farmers. The
majority of the respondents were professionals i.e. 28.1%and the least were
farmers. This can be explained by the fact that the study was carried out in the
Central business district.
Table6 : Occupation
Occupation Frequency Percent Valid percent Cumulative
percent
Civil servan t 4 4 .0 4 .5 4 .5
Artisan 7 7 .0 7 .9 12 .4
Professional 25 2 .0 28 .1 4 0 .4
Business em ployees 11 11.0 12 .4 52 .8
Student 14 14.0 15.7 68 .5
Business 25 25 .0 9 6 .6 9 6 .6
Housew ife 2 2 .0 98 .9 98 .9
Farm er 1 1.0 100.0 100.0
Tota l 89 89 .0
Missing 11 11.0
Tota l 100 100.0
4.4. Types of perceived risks
The following tables show the scores for each of the statements on a five point
likert scale used to identify and measure the extent of perceived risk.
i4.4.1. Perceived Performance risk
From the Findings in the table below ,36% of the respondents were not worried
about performance of mobile phones before connection whereas the majority

of the respondents (46 percent) affirmed that they were concerned about
performance of the phones before connection and 18% of the respondents were
not decided on the issue.
Table 7:Concern on performance of mobile phones
Before I was
connected I was
concerned that the
phone would not
work well
Frequency Percent Valid percent Cumulative
percent
Strong ly d isagree 10 10.0 10.0 10.0
d isagree 26 26 .0 26 .0 36 .0
N either d isagree nor
agree
18 18.0 18.0 54 .0
Agree 30 30 .0 30 .0 84 .0
Strong ly agree 16 16.0 16 .0 100.0
Missing 2 2 .0
Tota l 100 100.0 100.0
4.4.2. Perceived Financial risk
Statements in Tables 8 to 10 were used to identify and measure the extent of
perceived financial r is k .
>i. <
From the table below, 41.8% of the respondents did not think that the purchase
of a mobile phone represented a good amount of their income, 13.3% were37
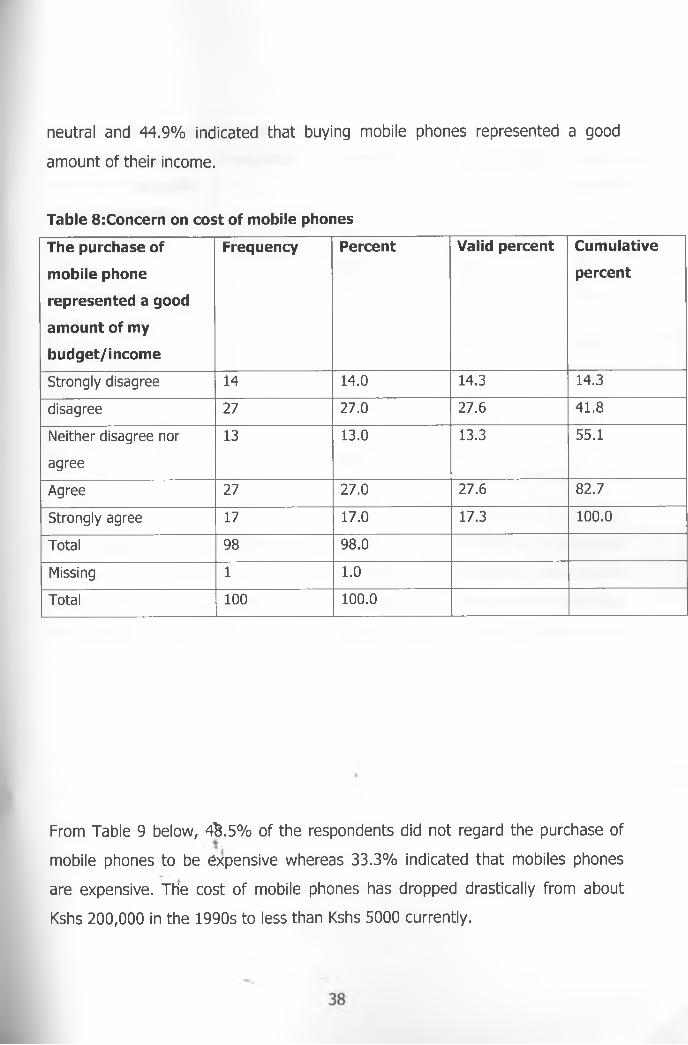
neutral and 44.9% indicated that buying mobile phones represented a good
amount of their income.
Table 8:Concern on cost of mobile phones
The purchase of
mobile phone
represented a good
amount of my
budget/income
Frequency Percent Valid percent Cumulative
percent
Strong ly d isagree 14 14.0 14.3 14.3
disagree 27 27 .0 27 .6 4 1 .8
Neither d isagree nor
agree
13 13.0 13.3 55 .1
Agree 27 27 .0 27 .6 82 .7
Strong ly agree 17 17.0 17.3 100.0
Tota l 98 98 .0
Missing 1 1.0
Tota l 100 100.0
From Table 9 below, 4£.5% of the respondents did not regard the purchase of
mobile phones to be expensive whereas 33.3% indicated that mobiles phones
are expensive. The cost of mobile phones has dropped drastically from about
Kshs 200,000 in the 1990s to less than Kshs 5000 currently.
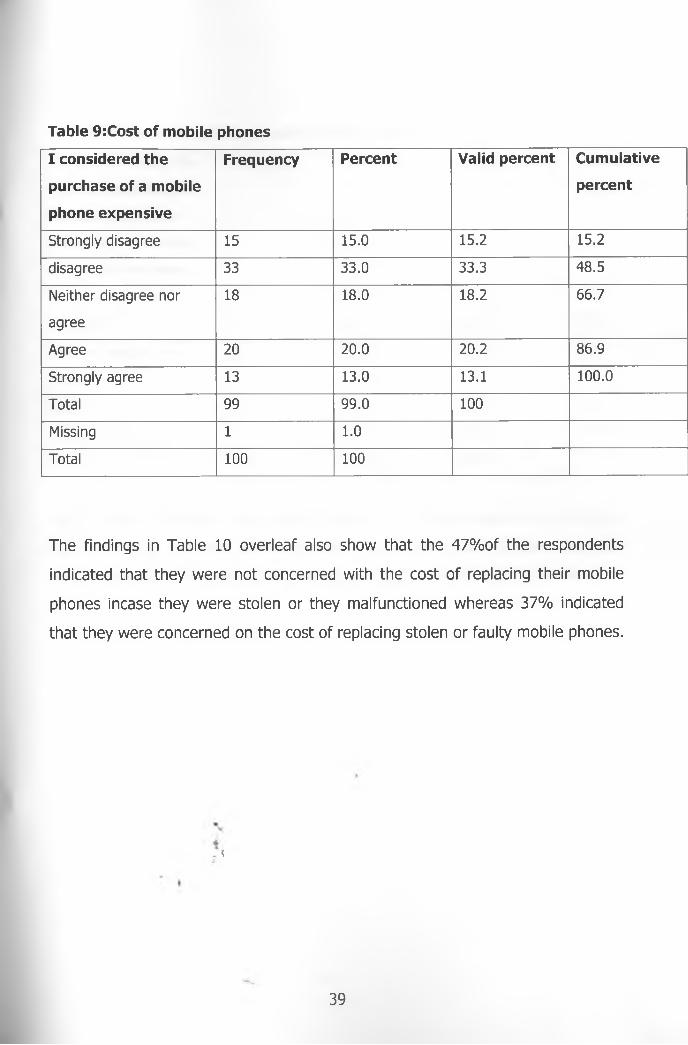
Table 9:Cost of mobile phones
I considered the
purchase of a mobile
phone expensive
Frequency Percent Valid percent Cumulative
percent
Strong ly d isagree 15 15.0 15.2 15 .2
d isagree 33 33 .0 33 .3 48 .5
Neither d isagree nor
agree
18 18.0 18 .2 6 6 .7
Agree 20 20 .0 20 .2 8 6 .9
Strong ly agree 13 13.0 13.1 100.0
Tota l 99 99 .0 100
Missing 1 1.0
Tota l 100 100
The findings in Table 10 overleaf also show that the 47%of the respondents
indicated that they were not concerned with the cost of replacing their mobile
phones incase they were stolen or they malfunctioned whereas 37% indicated
that they were concerned on the cost of replacing stolen or faulty mobile phones.
{
39
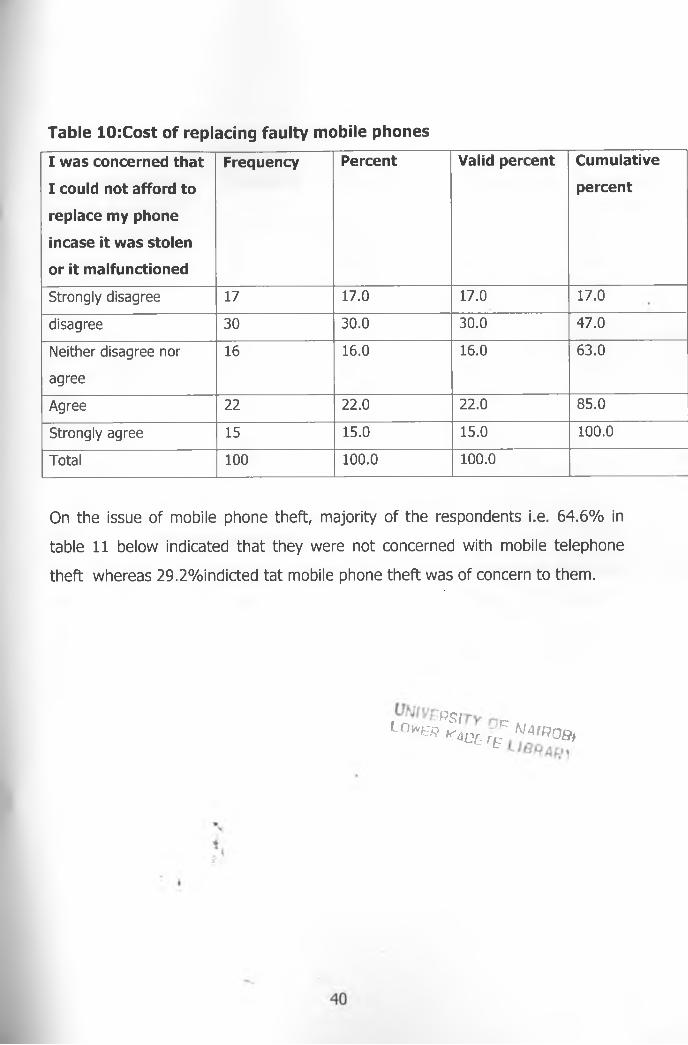
Table 10:Cost of replacing faulty mobile phones
I was concerned that
I could not afford to
replace my phone
incase it was stolen
or it malfunctioned
Frequency Percent Valid percent Cumulative
percent
Strongly d isagree 17 17.0 17.0 17 .0
d isagree 30 30 .0 30 .0 4 7 .0
Neither d isagree nor
agree
16 16.0 16.0 6 3 .0
Agree 22 22 .0 22 .0 8 5 .0
Strongly agree 15 15.0 15 .0 100.0
Total 100 100.0 100.0
On the issue of mobile phone theft, majority of the respondents i.e. 64.6% in
table 11 below indicated that they were not concerned with mobile telephone
theft whereas 29.2%indicted tat mobile phone theft was of concern to them.
Lo" « ^ O £ rgCW4«O0,
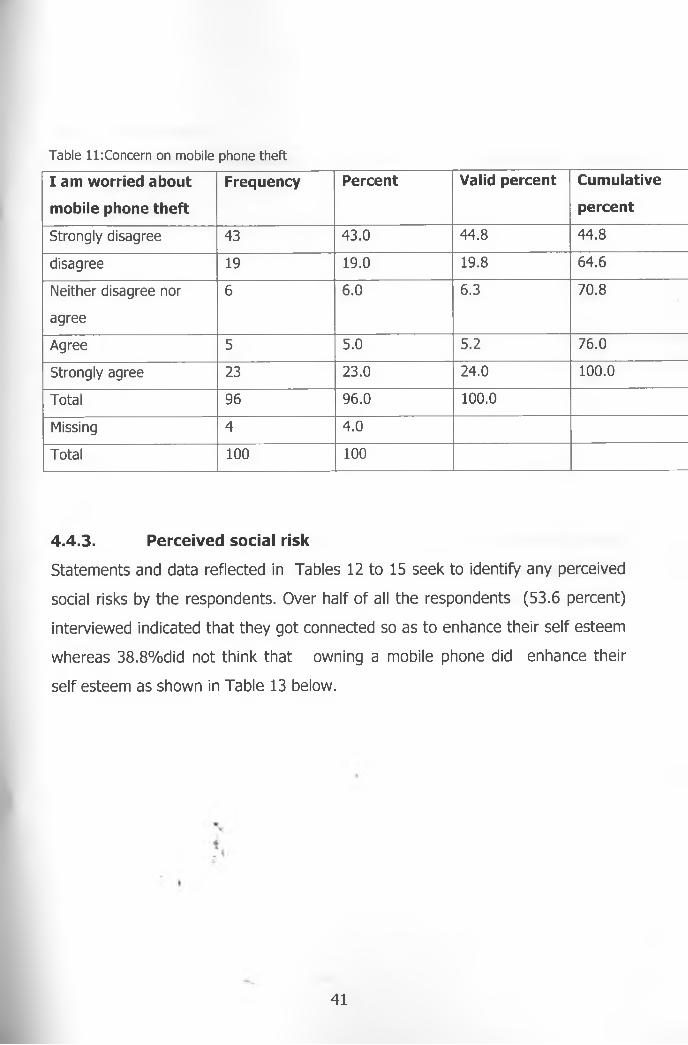
Table ll:Concern on mobile phone theft
I am worried about
mobile phone theft
Frequency Percent Valid percent Cumulative
percent
Strongly d isagree 43 4 3 .0 4 4 .8 4 4 .8
disagree 19 19.0 19.8 6 4 .6
Neither d isagree nor
agree
6 6 .0 6 .3 7 0 .8
Agree 5 5 .0 5 .2 76 .0
Strongly agree 23 23 .0 24 .0 100 .0
Total 96 96 .0 100.0
Missing 4 4 .0
Total 100 100
4.4.3. Perceived social risk
Statements and data reflected in Tables 12 to 15 seek to identify any perceived
social risks by the respondents. Over half of all the respondents (53.6 percent)
interviewed indicated that they got connected so as to enhance their self esteem
whereas 38.8%did not think that owning a mobile phone did enhance their
self esteem as shown in Table 13 below.
41
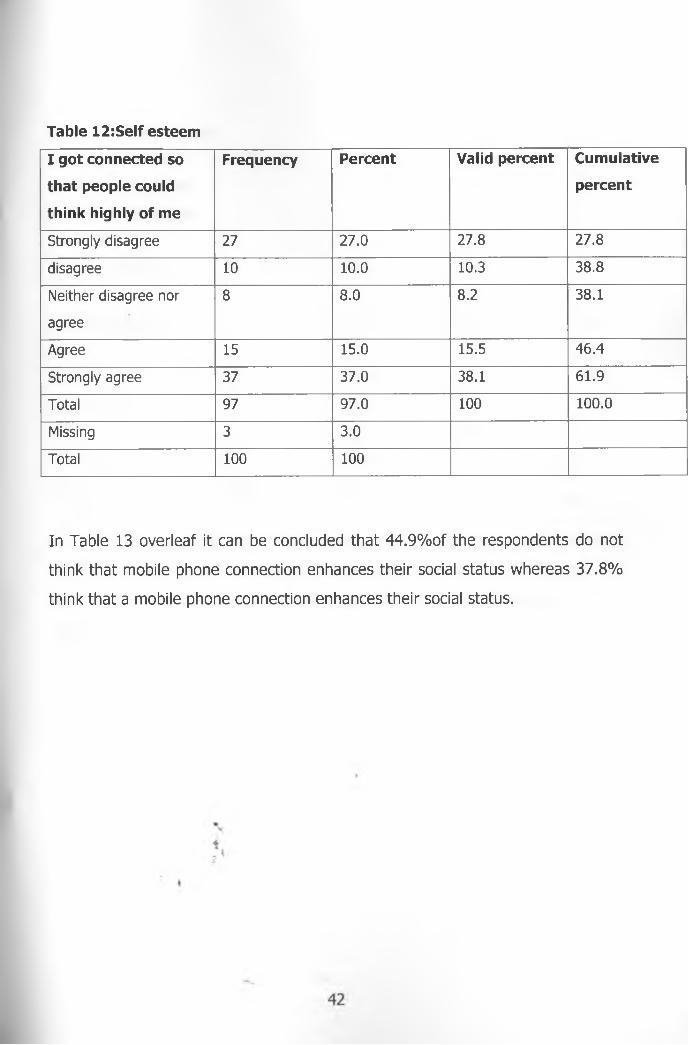
Table 12:Self esteem
I got connected so
that people could
think highly of me
Frequency Percent Valid percent Cumulative
percent
Strongly d isagree 27 27 .0 27 .8 27 .8
d isagree 10 10.0 10.3 3 8 .8
Neither d isagree nor
agree
8 8 .0 8 .2 38 .1
Agree 15 15.0 15.5 4 6 .4
Strongly agree 37 3 7 .0 38 .1 61 .9
Total 97 9 7 .0 100 100 .0
Missing 3 3 .0
Total 100 100
In Table 13 overleaf it can be concluded that 44.9% of the respondents do not
think that mobile phone connection enhances their social status whereas 37.8%
think that a mobile phone connection enhances their social status.
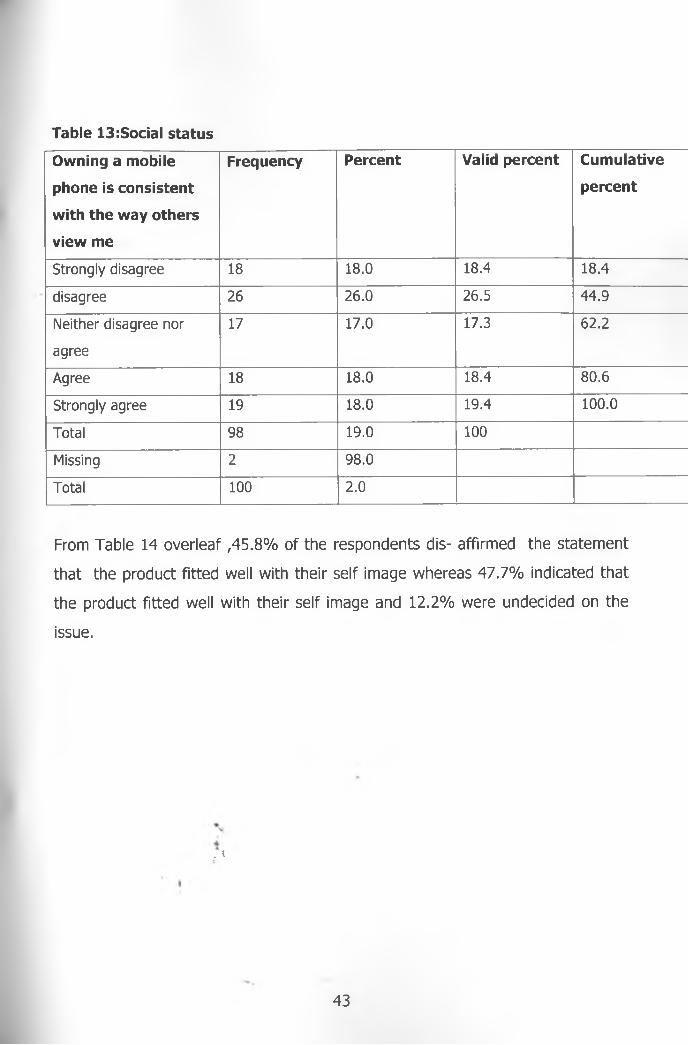
Table 13:Social status
Owning a mobile
phone is consistent
with the way others
view me
Frequency Percent Valid percent Cumulative
percent
Strongly d isagree 18 18.0 18.4 18 .4
disagree 26 26 .0 26 .5 4 4 .9
Neither d isagree nor
agree
17 17.0 17.3 62 .2
Agree 18 18.0 18.4 8 0 .6
Strongly agree 19 18.0 19.4 100.0
Total 98 19.0 100
Missing 2 98 .0
Total 100 2 .0
From Table 14 overleaf ,45 .8% of the respondents dis- affirmed the statement
that the product fitted well with their self image whereas 47.7% indicated that
the product fitted well with their self image and 12.2% were undecided on the
issue.
. {
43
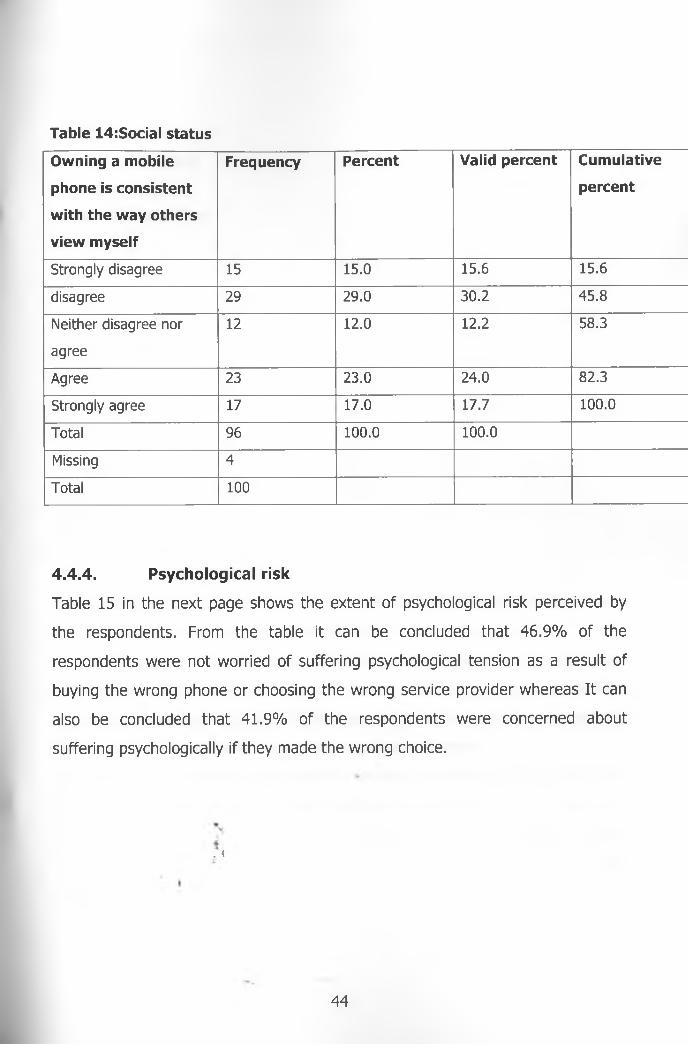
Table 14:Social status
Owning a mobile
phone is consistent
with the way others
view myself
Frequency Percent Valid percent Cumulative
percent
Strong ly d isagree 15 15.0 15.6 15 .6
disagree 29 29 .0 30 .2 4 5 .8
Neither d isagree nor
agree
12 12.0 12.2 58 .3
Agree 23 2 3 .0 24 .0 82 .3
Strongly agree 17 17.0 17.7 100 .0
Total 96 100.0 100.0
Missing 4
Total 100
4.4.4. Psychological risk
Table 15 in the next page shows the extent of psychological risk perceived by
the respondents. From the table it can be concluded that 46.9% of the
respondents were not worried of suffering psychological tension as a result of
buying the wrong phone or choosing the wrong service provider whereas It can
also be concluded that 41.9% of the respondents were concerned about
suffering psychologically if they made the wrong choice.
. {
44
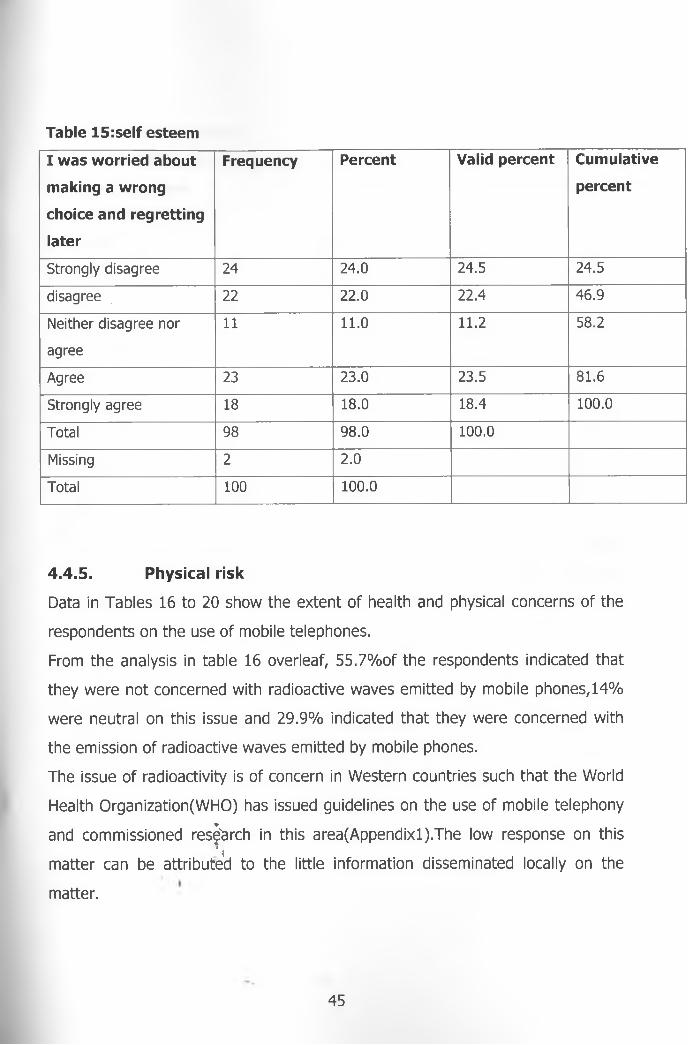
Table 15:self esteem
I was worried about
making a wrong
choice and regretting
later
Frequency Percent Valid percent Cumulative
percent
Strong ly d isagree 24 24 .0 24 .5 24 .5
d isagree 22 2 2 .0 22 .4 46 .9
Neither d isag ree nor
agree
11 11.0 11.2 58 .2
Agree 23 23 .0 23 .5 8 1 .6
Strongly agree 18 18.0 18.4 100.0
Total 98 9 8 .0 100.0
Missing 2 2 .0
Total 100 100.0
4.4.5. Physical risk
Data in Tables 16 to 20 show the extent of health and physical concerns of the
respondents on the use of mobile telephones.
From the analysis in table 16 overleaf, 55.7% of the respondents indicated that
they were not concerned with radioactive waves emitted by mobile phones, 14%
were neutral on this issue and 29.9% indicated that they were concerned with
the emission of radioactive waves emitted by mobile phones.
The issue of radioactivity is of concern in Western countries such that the World
Health Organization(WHO) has issued guidelines on the use of mobile telephony
and commissioned research in this area(Appendixl).The low response on thisi ̂
matter can be attributed to the little information disseminated locally on the
matter.
45
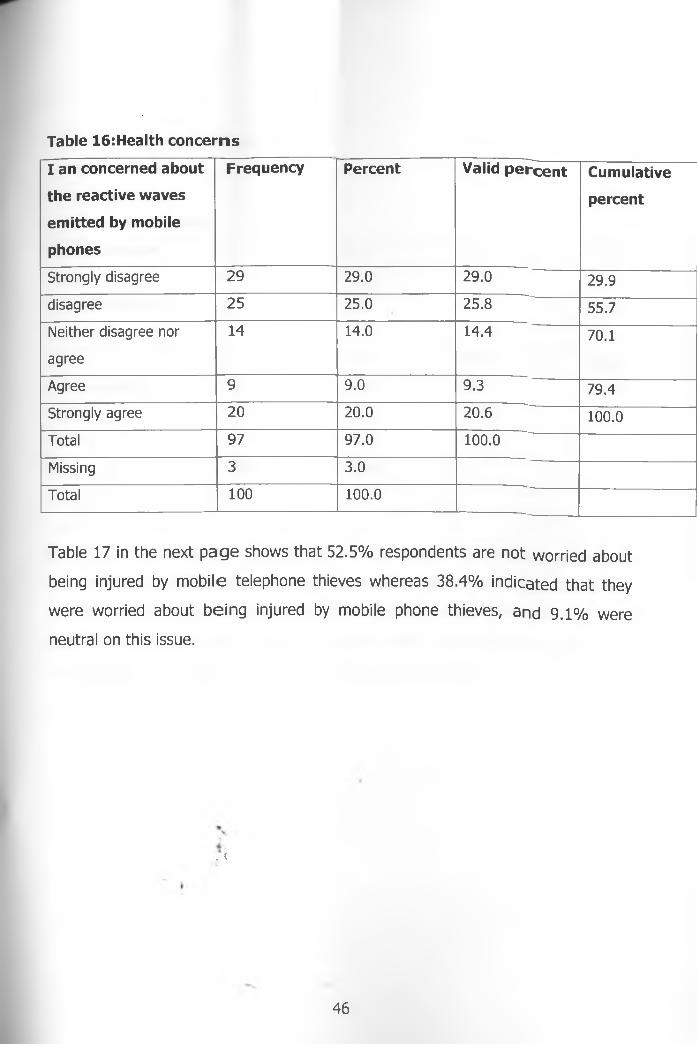
Table 16:Health concerns
I an concerned about
the reactive waves
emitted by mobile
phones
Frequency Percent Valid percent Cumulative
percent
Strong ly d isagree 2 9 29 .0 2 9 .0 29 .9
d isagree 2 5 25 .0 2 5 .8 55 .7
Neither d isagree nor
agree
14 14.0 14 .4 70 .1
Agree 9 9 .0 9 .3 79 .4
Strongly agree 2 0 2 0 .0 2 0 .6 100.0
Total 9 7 9 7 .0 100 .0
Missing 3 3 .0
Tota l 100 100 .0
Table 17 in the next page shows that 52.5% respondents are not worried about
being injured by mobile telephone thieves whereas 38.4% indicated that they
were worried about being injured by mobile phone thieves, and 9 .1% were
neutral on this issue.
. \
46
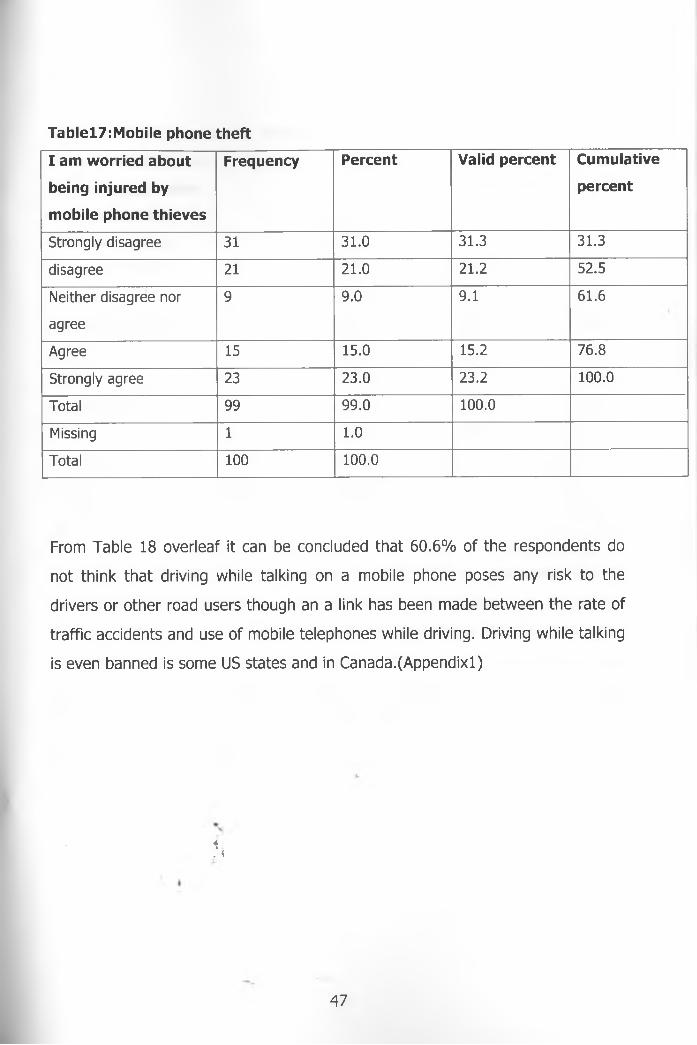
Tablel7:Mobile phone theft
I am worried about
being injured by
mobile phone thieves
Frequency Percent Valid percent Cumulative
percent
Strong ly d isagree 31 3 1 .0 31 .3 31 .3
d isagree 21 21 .0 21 .2 52 .5
Neither d isagree nor
agree
9 9 .0 9 .1 61 .6
Agree 15 15.0 15 .2 76 .8
Strong ly agree 23 23 .0 23 .2 100.0
Tota l 99 9 9 .0 100.0
Missing 1 1 .0
Tota l 100 100.0
From Table 18 overleaf it can be concluded that 60.6% of the respondents do
not think that driving while talking on a mobile phone poses any risk to the
drivers or other road users though an a link has been made between the rate of
traffic accidents and use of mobile telephones while driving. Driving while talking
is even banned is some US states and in Canada.(Appendixl)
*. <
47
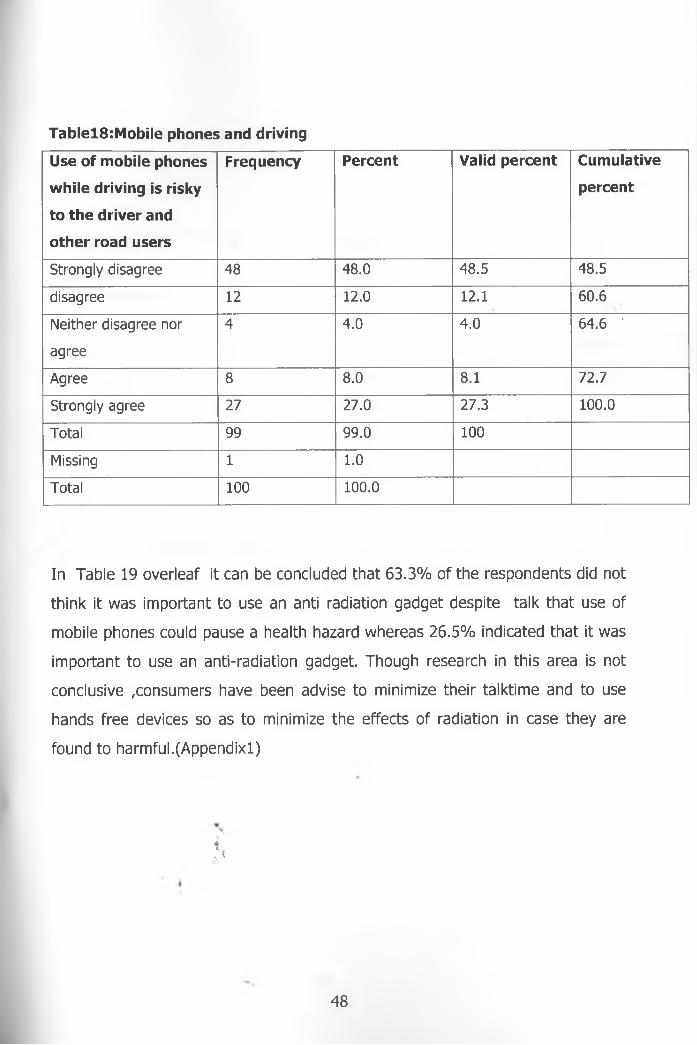
Tablel8:Mobile phones and driving
Use of mobile phones
while driving is risky
to the driver and
other road users
Frequency Percent Valid percent Cumulative
percent
Strong ly d isagree 48 4 8 .0 4 8 .5 48 .5
d isagree 12 12.0 12.1 60 .6
Neither d isagree nor
agree
4 4 .0 4 .0 6 4 .6 ’
Agree 8 8 .0 8 .1 72 .7
Strong ly agree 27 27 .0 27 .3 100.0
Tota l 99 99 .0 100
Missing 1 1.0
Tota l 100 100.0
In Table 19 overleaf it can be concluded that 63.3% of the respondents did not
think it was important to use an anti radiation gadget despite talk that use of
mobile phones could pause a health hazard whereas 26.5% indicated that it was
important to use an anti-radiation gadget. Though research in this area is not
conclusive consumers have been advise to minimize their talktime and to use
hands free devices so as to minimize the effects of radiation in case they are
found to harmful.(Appendixl)
*, <
48
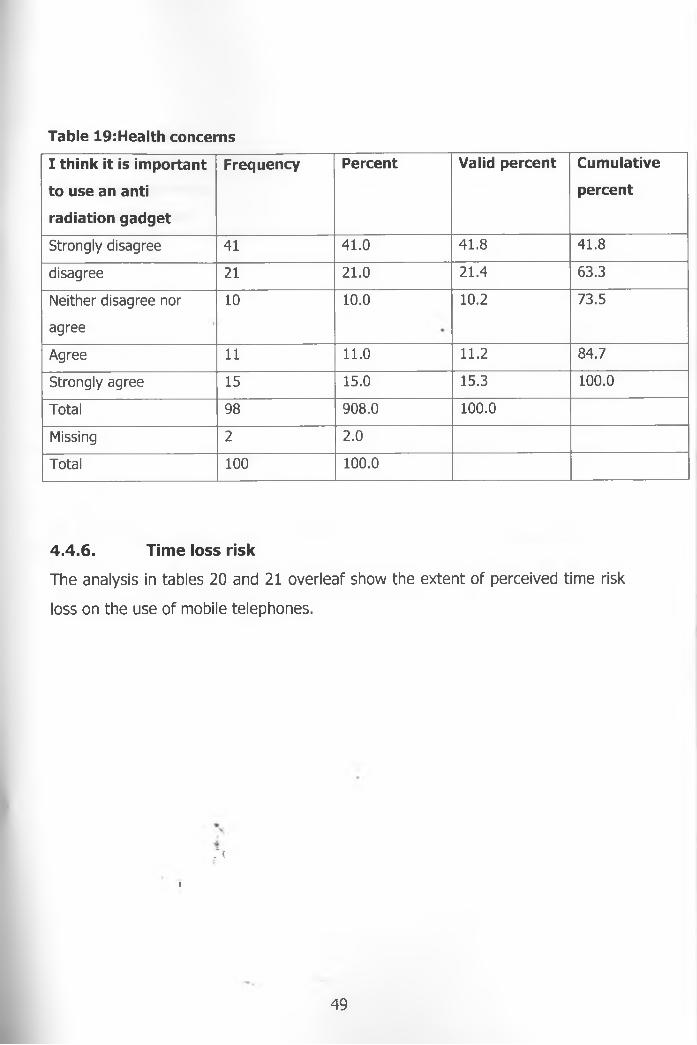
Table 19:Health concerns
I think it is important
to use an anti
radiation gadget
Frequency Percent Valid percent Cumulative
percent
Strong ly d isagree 41 4 1 .0 4 1 .8 41 .8
d isagree 21 21 .0 21 .4 63 .3
Neither d isagree nor
agree
10 10.0 10 .2 73 .5
Agree 11 11.0 11.2 84 .7
Strong ly agree 15 15.0 15.3 100.0
Tota l 98 9 08 .0 100.0
Missing 2 2 .0
Tota l 100 100.0
4.4.6. Time loss risk
The analysis in tables 20 and 21 overleaf show the extent of perceived time risk
loss on the use of mobile telephones.
7\
i
49
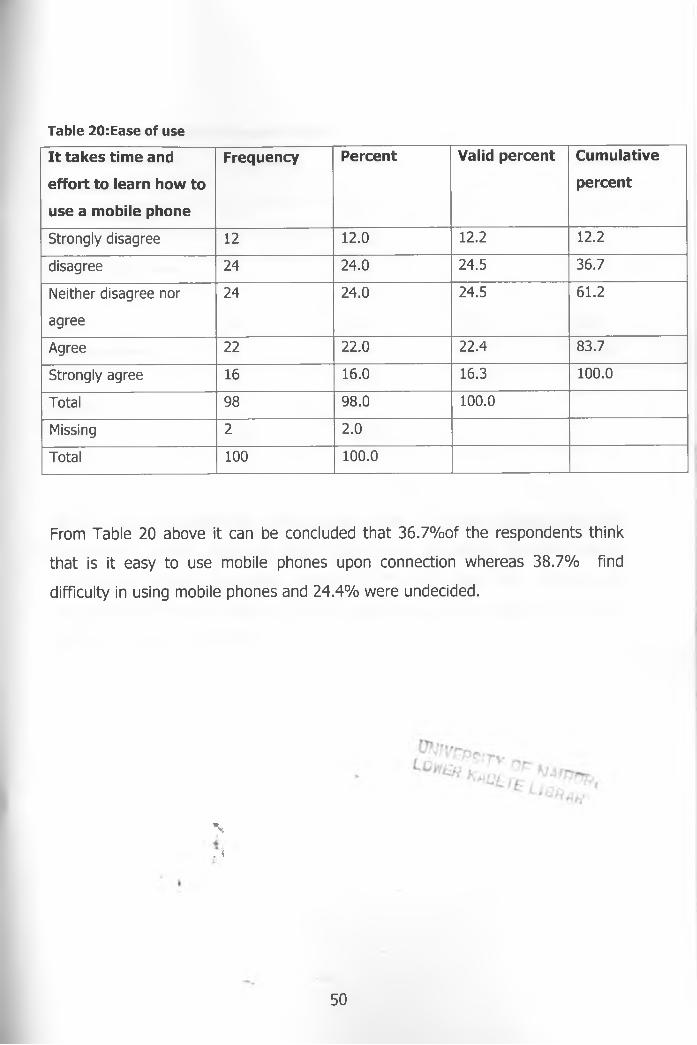
Table 20:Ease of use
It takes time and
effort to learn how to
use a mobile phone
Frequency Percent Valid percent Cumulative
percent
Strong ly d isagree 12 12.0 12.2 12.2
d isagree 24 24 .0 24 .5 36 .7
Neither d isagree nor
agree
24 24 .0 24 .5 6 1 .2
Agree 22 22 .0 22 .4 83 .7
Strong ly agree 16 16.0 16.3 100.0
Total 98 98 .0 100.0
Missing 2 2 .0
Total 100 100.0
From Table 20 above it can be concluded that 36.7% of the respondents think
that is it easy to use mobile phones upon connection whereas 38.7% find
difficulty in using mobile phones and 24.4% were undecided.
\
. <
50
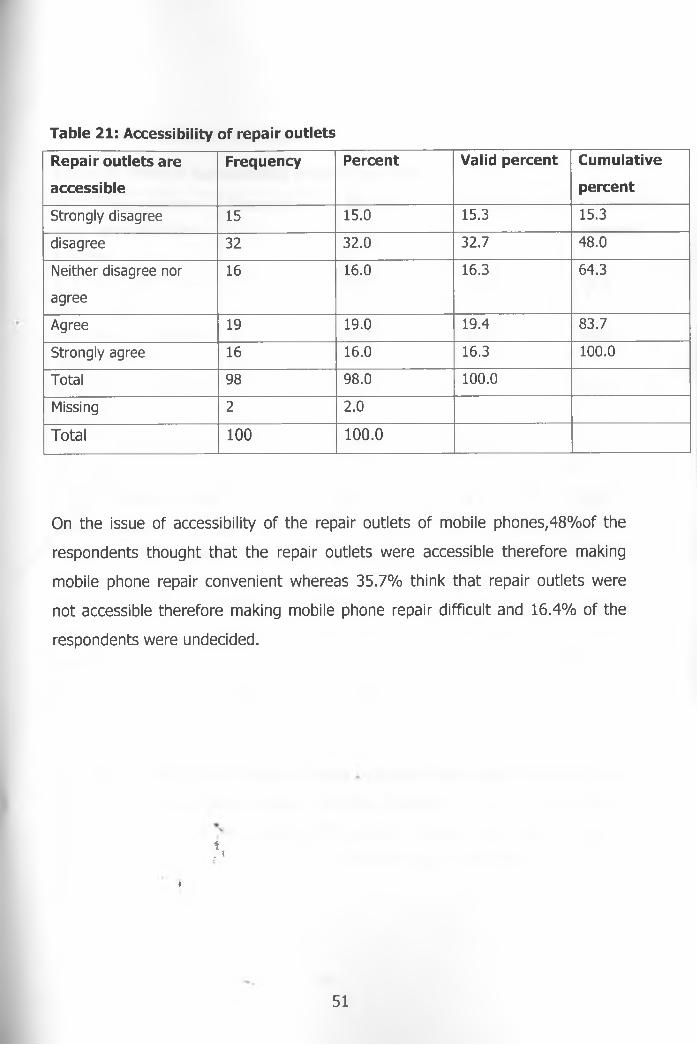
Table 21: Accessibility of repair outlets
Repair outlets are
accessible
Frequency Percent Valid percent Cumulative
percent
Strong ly d isagree 15 15.0 15.3 15.3
d isagree 32 32 .0 32 .7 48 .0
Neither d isagree nor
agree
16 16.0 16.3 64 .3
Agree 19 19.0 19.4 83 .7
Strong ly agree 16 16.0 16.3 100.0
Tota l 98 9 8 .0 100.0
Missing 2 2 .0
T o ta l 100 1 0 0 .0
On the issue of accessibility of the repair outlets of mobile phones;48%of the
respondents thought that the repair outlets were accessible therefore making
mobile phone repair convenient whereas 35.7% think that repair outlets were
not accessible therefore making mobile phone repair difficult and 16.4% of the
respondents were undecided.
i. {
♦
51

4.5. Risk reduction strategies
Table22: Reason for choosing mobile handsets
Why did you choose
your types of mobile
handset
Frequency Percent Valid percent Cumulative
percent
I t a well known mobile
phone :brand
47 4 7 .0 4 8 .0 4 8 .0
I t is sold by a reputable
dealer
15 15.0 15.3 63 .0
I t is expensive therefore
it is good
2 2 .0 2 .0 65 .3
I t can be repaired free :
w arran ty
14 14.0 14.3 79 .6
I w as allowed to test
before buying
3 3 .0 3 .1 82 .7
My friend/relative had
bought it
4 4 .0 4 .1 86 .7
O ther: specify 13 13.0 13.3 100.0
Tota l 98 98 .0 100.0
Missing 2 2 .0
Tota l 100 100.0
As outlined earlier in the literature review consumers find ways of relieving their
anxiety so as to purchase products .In Table 22 above it can be concluded that
most respondents in 'this study (48% percent) chose their type of phones
because of the brand hame. Well known brands give consumers assurance in
terms of performance.
52
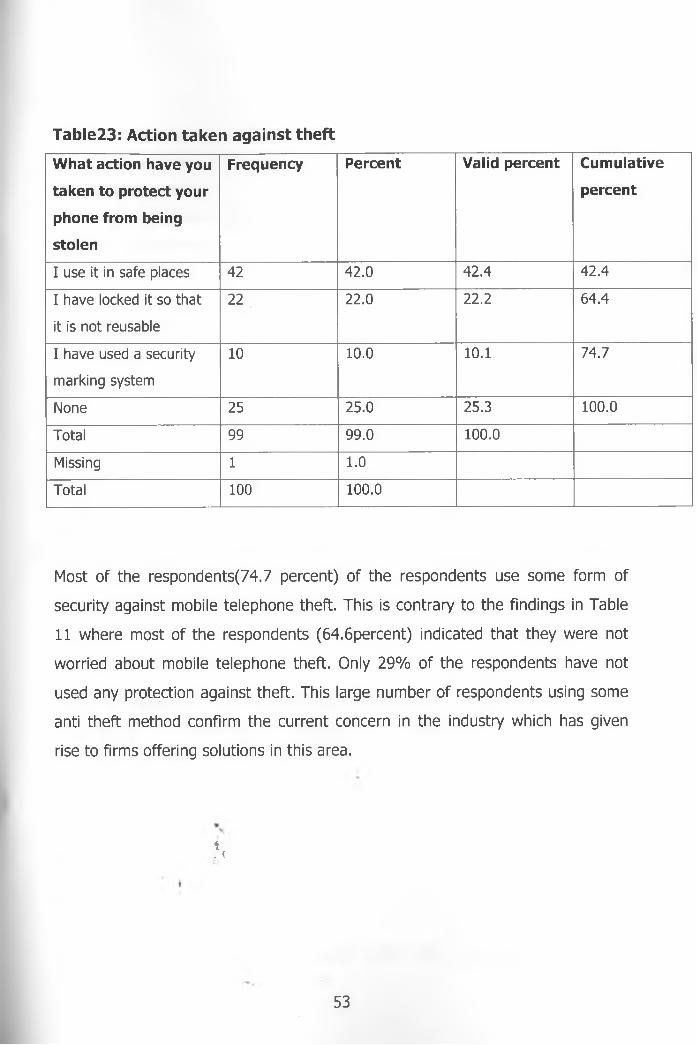
Table23: Action taken against theft
What action have you
taken to protect your
phone from being
stolen
Frequency Percent Valid percent Cumulative
percent
I use it in safe places 42 4 2 .0 4 2 .4 4 2 .4
I have locked it so that
it is not reusable
22 22 .0 22 .2 64 .4
I have used a security
m arking system
10 10.0 10.1 74 .7
None 25 25 .0 25 .3 100.0
Tota l 99 99 .0 100.0
Missing 1 1.0
Tota l 100 100.0
Most of the respondents(74.7 percent) of the respondents use some form of
security against mobile telephone theft. This is contrary to the findings in Table
11 where most of the respondents (64.6percent) indicated that they were not
worried about mobile telephone theft. Only 29% of the respondents have not
used any protection against theft. This large number of respondents using some
anti theft method confirm the current concern in the industry which has given
rise to firms offering solutions in this area.
i. \
53
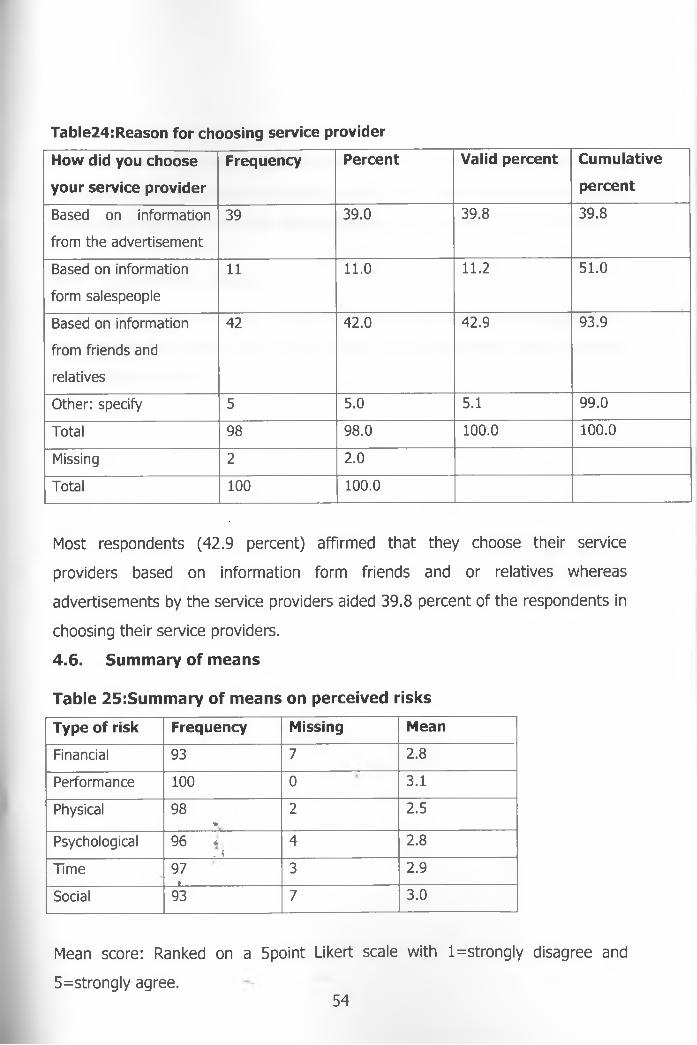
Table24:Reason for choosing service provider
How did you choose
your service provider
Frequency Percent Valid percent Cumulative
percent
Based on inform ation
from the advertisem ent
39 39 .0 39 .8 39 .8
Based on information
form salespeople
11 11.0 11 .2 51 .0
Based on inform ation
from friends and
re latives
42 4 2 .0 4 2 .9 93 .9
O ther: specify 5 5 .0 5.1 9 9 .0
Tota l 98 98 .0 100.0 100.0
Missing 2 2 .0
Tota l 100 100.0
Most respondents (42.9 percent) affirmed that they choose their service
providers based on information form friends and or relatives whereas
advertisements by the service providers aided 39.8 percent of the respondents in
choosing their service providers.
4.6. Summary of means
Table 25:Summary of means on perceived risks
Type of risk Frequency Missing Mean
Financial 93 7 2 .8
Perform ance 100 0 3 .1
Physical 98*
2 2 .5
Psychological 96 *. <
4 2 .8
T im e 97t
3 2 .9
Social 93 7 3 .0
Mean score: Ranked on a 5point Likert scale with l=strongly disagree and
5=strongly agree.54

Table 25 shows above shows the overall mean scores for the perceived risks on
the use of mobile telephone services. From the table it can be concluded that the
respondents generally perceive various risks as on the use of mobile telephony.
4.7. Correlation analysis
Correlation analysis has been carried out on the respondent's demographics i.e.
age, gender, occupation and education level and their perceived risks as shown
in the tables overleaf.
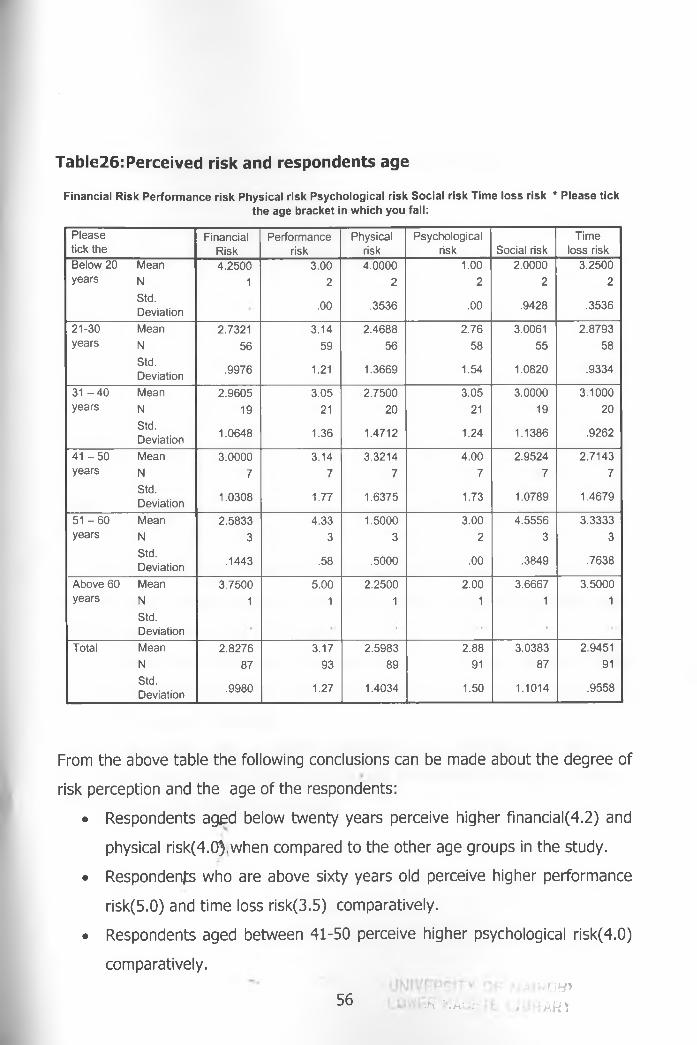
Table26:Perceived risk and respondents age
Financial Risk Performance risk Physical risk Psychological risk Social risk Time loss risk * Please tickthe age bracket in which you fall:
P le a se tick the
Financia lR isk
Perform ancerisk
P h ys ica lrisk
Psycho log ica lrisk So cia l risk
T im e lo ss risk
Below 20 M ean 4 .2500 3 .00 4 .0000 1.00 2 .0000 3 .2500years N 1 2 2 2 2 2
Std.Deviation .00 .3536 .00 .9428 .3536
21-30 M ean 2.7321 3 .14 2 .4688 2 .7 6 3.0061 2 .8793years N 56 59 56 58 55 58
Std.Deviation
.9976 1.21 1.3669 1.54 1.0820 .9334
31 - 4 0 M ean 2 .9605 3 .05 2 .7500 3 .05 3 .0000 3 .1000years N 19 21 20 21 19 20
Std.Deviation
1.0648 1.36 1 .4712 1.24 1.1386 .9262
4 1 - 5 0 M ean 3 .0000 3.14 3 .3214 4 .0 0 2 .9524 2 .7143years N 7 7 7 7 7 7
Std.Deviation
1.0308 1.77 1 .6375 1.73 1.0789 1.4679
51 - 6 0 M ean 2 .5833 4 .3 3 1 .5000 3 .00 4 .5556 3 .3333years N 3 3 3 2 3 3
Std.Deviation
.1443 .58 .5000 .00 .3849 .7638
Above 60 M ean 3 .7500 5 .00 2 .2500 2 .00 3 .6667 3 .5000yea rs N
Std.Deviation
1 1 1 1 1 1
Total M ean 2 .8276 3 .17 2 .5983 2 .88 3 .0383 2.9451
N 87 93 89 91 87 91
Std.Deviation .9980 1.27 1.4034 1.50 1.1014 .9558
From the above table the following conclusions can be made about the degree of
risk perception and the age of the respondents:
• Respondents aged below twenty years perceive higher financial(4.2) and
physical riskC4.03.when compared to the other age groups in the study.
• Respondents who are above sixty years old perceive higher performance
risk(5.0) and time loss risk(3.5) comparatively.
• Respondents aged between 41-50 perceive higher psychological risk(4.0)
comparatively.
-ft KrtLjb56J ajRiJBt * 'j’RAfil
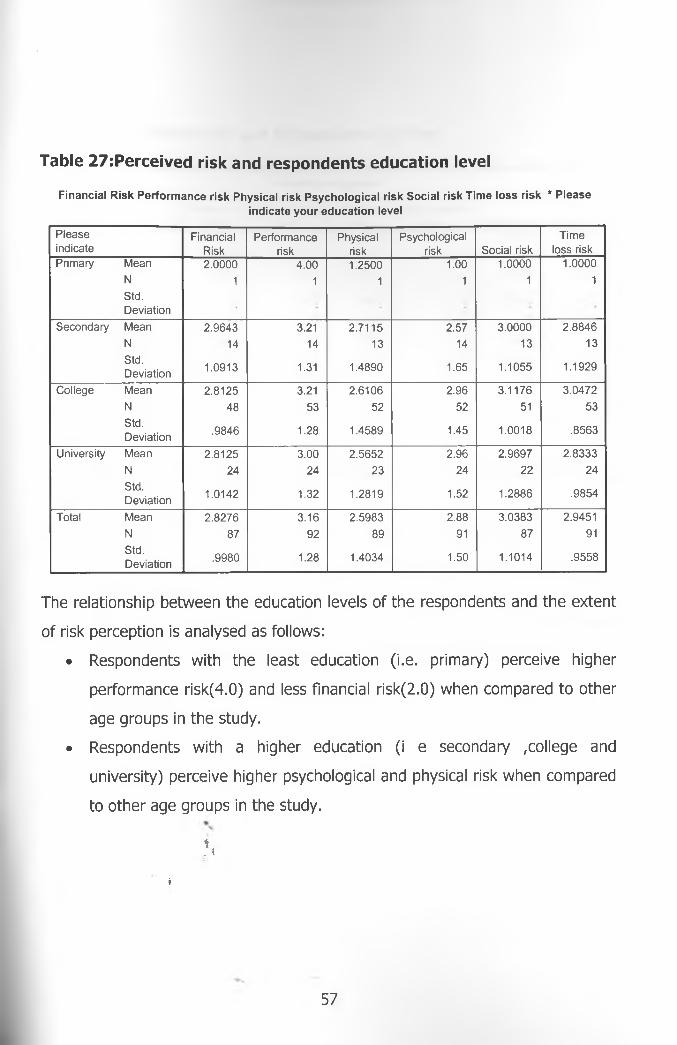
Table 27:Perceived risk and respondents education level
Financial Risk Performance risk Physical risk Psychological risk Social risk Time loss risk * Pleaseindicate your education level
P le a seindicate
F inancia lR isk
Perform ancerisk
Physica lrisk
Psychologicalrisk So cia l risk
T im e lo ss risk
Prim ary M ean 2 .0000 4 .0 0 1.2500 1.00 1.0000 1.0000
N
Std .Deviation
1 1 1 1 1 1
Second ary M ean 2 .9643 3.21 2 .7115 2 .57 3 .0000 2 .8846
N 14 14 13 14 13 13
Std.Deviation 1.0913 1.31 1.4890 1.65 1 .1055 1.1929
College M ean 2 .8125 3.21 2 .6106 2 .96 3 .1176 3 .0472
N 48 53 52 52 51 53
Std.Deviation
.9846 1.28 1.4589 1.45 1.0018 .8563
University M ean 2 .8125 3 .00 2 .5652 2 .96 2 .9697 2 .8333
N 24 24 23 24 22 24
Std.Deviation
1.0142 1.32 1.2819 1.52 1.2886 .9854
Total M ean 2 .8276 3 .16 2 .5983 2 .88 3 .0383 2.9451
N 87 92 89 91 87 91
Std.Deviation
.9980 1.28 1.4034 1.50 1.1014 .9558
The relationship between the education levels of the respondents and the extent
of risk perception is analysed as follows:
• Respondents with the least education (i.e . primary) perceive higher
performance risk(4.0) and less financial risk(2.0) when compared to other
age groups in the study.
• Respondents with a higher education (i e secondary ,college and
university) perceive higher psychological and physical risk when compared
to other age groups in the study.
i. \
i
57

Table 28: Perceived risk and Respondents gender
Financial Risk Performance risk Physical risk Psychological risk Social risk Time loss risk * Pleaseindicate your gender
P le a seindicate
F inancia lR isk
Perform ancerisk
P h ys ica lrisk
Psycho log ica lrisk So cia l risk
T im e lo ss risk
M ale M ean 2 .7899 3 .18 2 .4930 3.01 3 .1520 2 .9 1 5 5
N 69 74 71 72 68 71
Std.Deviation 1 .0215 1.28 1.3249 1.49 1 .1054 .9296
Fem ale M ean 2 .9130 3 .16 2 .8438 2 .56 2 .7639 3 .1400
N 23 25 24 25 24 25
Std.Deviation .9403 1.25 1 .5390 1.45 1 .0425 1.0054
Total M ean 2 .8207 3 .17 2 .5816 2 .90 3 .0507 2 .9740
N 92 99 95 97 92 96
Std .Deviation .9982 1.26 1.3821 1.48 1 .0972 .9497
The degree of risk perception can be related to the respondents gender as
follows:
• The perception of performance risk is similar for the both sexes.(3 .1)
• The female respondents perceive higher financial risk (2 .9) than the male
correspondents.^.7)
• The male respondents perceive higher social risk(3.1) than the female
ones and less time risk (2.9)than the female respondents(2.7).

Table 29: Perceived risks and Respondents occupation
Financial Risk Performance risk Physical risk Psychological risk Social risk Time loss risk * What is youroccupation
W hat is your Financial Perform ance Physical Psychological T im eoccupation R isk risk risk risk Socia l risk lo ss riskCivil servant Mean 3.8125 3.25 2 .6667 3.00 2 .5000 2.5000
N 4 4 3 4 4 3
Std.Deviation
.9214 2 .06 1.4216 1.83 1.1386 1.3229
Artsian Mean 3.0000 2.43 2.6071 2.43 2 .7143 3.2857
N 7 7 7 7 7 7
Std.Deviation
.6455 1.40 1.3218 1.62 1.4960 1.6293
Professional Mean 2.7386 3.32 2 .4000 3.24 3.4697 3.0417
N 22 25 25 25 22 24
Std.Deviation 1.0479 1.25 1.2374 1.48 .7535 .8712
B u s in ess Mean 2.1364 3.09 1.8409 3.18 3.0303 2.4545em ployees N 11 11 11 11 11 11
Std.Deviation .7855 1.14 .7523 1.47 .7667 .6876
Student Mean 3.2115 3.00 3.3269 2 .86 2.7381 3.1071
N 13 14 13 14 14 14
Std.Deviation
1.0147 1.11 1.3400 1.56 1.0226 .6844
business Mean 2.9565 3.28 2 .8696 2.61 3.2063 3.1667
N 23 25 23 23 21 24
Std.Deviation 1.0047 1.31 1.7170 1.47 1.2404 .8555
Housewife Mean 2.2500 4 .50 1.2500 3.50 4 .0000 2.5000
N 2 2 2 2 2 2
Std.Deviation .0000 .71 .0000 .71 .9428 .0000
Farm er Mean 1.5000 4.00 1.2500 3.00 4 .6667 3.0000
N
Std.Deviation
1 1 1 1 1 1
Total Mean 2.8404 3.19 2.5824 2.93 3.1341 3.0000
N 83 89 85 87 82 86
Std.Deviation *■.1.0065 1.27 1.4001 1.48 1.0656 .9107
I. tThe following relationship can be established between the respondents
»occupations and the degree of risk perception:
• Civil servants perceive higher financial risk(3.8) when compared to the
other professions.
59

• Housewives perceive higher performance(4.5) and psychological risk(4.0)
than the other professions
• Students perceive higher physical risk(3.3) when compared to the other
categories in the study.
• Artisans perceive higher time loss risk(3.2) when compared to the other
professions.
i. {
60
5. CHAPTER FIVE: DISCUSSIONS, CONCLUSIONS AND
RECOMMENDATIONS
5.1. Introduction
The findings in chapter four are discussed here guided by the objectives of
the study under the following headings.
5.2. Perceived risks
From the findings presented in chapter four it can be concluded that the
users of mobile telephony perceive the following outlined risks :
• Performance risks
• Financial risks
• Physical risks
• Social risk
• Time loss risk
• Psychological risk
The highest perceived risk is performance risk(mean score 3.1),followed by
social risk(mean score 3.0), time loss risk( 2.9)financial and psychological risk
(mean score 2 .8 ),and physical risk( mean score 2.5).This confirms the theory
advanced by Taylor(1974) that consumers perceive certain risks in purchase
situations.
5.2.1. Perceived financial risk
On the overall it can b£< concluded that the users of mobile telephony feel that
they would loose financially if their phones malfunctioned or were stolen.
61
5.2.2. Perceived performance risk
It can also be concluded that users of mobile telephony before purchase are
worried about the functionality of their phones. They fear that the phones would
not work well or breakdown.
5.2.3. Perceived physical risk
From the findings it can be concluded that users of mobile phones fear that
these products may become harmful to their health. This actually reaffirms the
guidelines issued by WHO on the use of mobile telephony. WHO has issued
guidelines advising consumers to limit their talk time on mobile phones so as to
minimize the effects incase use of mobile phones is found to be harmful. WHO
has also funded research whose objective is to establish the link between use of
mobile phones and cancer.(Appendixl)
5.2.4. Perceived psychological risk
The findings of the study also confirm the association made between product
choices and consumers self esteem. It can be concluded that use of mobile
telephony fits well in to the self-image of its users and gives them a positive
image.
5.2.5. Perceived social risk
The findings also show that use of mobile telephony enhances the social status
of its users and gives them a positive image. Therefore it can be concluded that
customers also get connected so as to enhance their social status.■»
5.2.6. Perceived time loss risk
From the study it can be concluded that one requires some time and effort to
learn to use a mobile phone.
62
5.3. Risk reduction strategies.
Though the respondents were not asked to rank their risk relievers in order of
the most helpful to the least it can be concluded that users of mobile telephone
services prefer to buy well known brands so as to reduce the risk of the product
not performing. This confirms the study by Roselius (1971) which showed that
brand image and brand loyalty were the most favored risk relievers. The other
risk reduction strategies found be useful by the respondents are: store image,
expensive model, warranty, testing, and Word of mouth recommendation.
5.4. Implications
The finding of the study has the following implications on the use of the mobile
telephony.
• Mobile phone users perceive certain risks that could cause delay in
making product or service purchase decisions.
• Users who perceive real or imagined fears after purchase and do not find
a suitable way of relieving their fear may continue to use the service but
remain dissatisfied customers and pass on unfavorable information.
• Favorable word of mouth may be an important marketing and sales tool
since most customers get information from their friends or relatives so as
to choose their service provider.
• Customers may not reap maximum benefits from their mobile sets or
enjoy other inherent services since the general perception is that much
time and effort is required.
• Security of mobRe phones is a priority to the users of the service.
• The mobile phone technology could still be viewed as a status symbol
• Major brands or well known brands are preferred by consumers because
of functionality.
• There is little awareness on the use of mobile telephony and any related
physical hazards like radioactivity and road safety.
63

5.5. Recommendations
In light of the above findings, it is recommended that mobile phone service
providers should:
• Create marketing communications that are aimed at resolving the
perceived risks of both current and potential consumers.
• Market only reputable brands as part of a strategy to convince customers
on functionality
• Measure the user groups with similar perceived risks and target them with
focused advertising messages.
• Provide excellent customer service to their customers so as to create
favorable word of mouth recommendation.
• Incorporate the appropriate security measures against theft of mobile in
the service package for example marking of phones.
• Intensify customer education campaigns on how to use mobile phones
especially now as they roll out their networks in to the rural parts of
Kenya.
• Market mobile phone technology as a basic tool of communication as
opposed to a status symbol.
• Provide public information on mobile telephony technology in line with the
World Health Organization (WHO) recommendations outlined in Appendix
1.
UMivehsiTy o5.6. Limitations of the study
The study's limitations can be summarized as:
a) Geographical scope
All the respondents were drawn from Nairobi city center and therefore
generalization of the conclusions would require a larger population from a
wider geographical scope.
64
b) Resources
The lack of finances and time constraints limited the sample size and
geographical scope of the study.
5.7. Suggestions for further research
There is need to further advance this research in relation to the theory of risk
taking in consumer behavior and specifically match each type of perceived
risk with the preferred risk reduction strategy on a wider scope and measure
the different customer groups with similar risk perceptions and the cost
effectiveness of having focused marketing efforts.
*. i
65
APPENDIX 1 .....................WORLD HEALTH ORGANISATION (WHO)
RECOMMENDATIONS ON THE USE OF MOBILE TELEPHONES
In response to public concerns, WHO established the International
Electromagnetic Fields (EMF) project to assess the scientific evidence of possible
health effects of EMF. A large epidemiology study is being coordinated into over
10 countries by the International Agency for Research on cancer (IARC) a special
cancer research Agency of WHO to identify if there are links between use of
mobile phones and head and neck cancers. The study is expected to be
completed in 2003.
Meanwhile WHO has issued the following recommendations:
i) Limiiting the length of calls or using hands free devices to keep mobile
phones away from the head and body.
ii) Obeying local restrictions on mobile phone use to avoid electromagnetic
frequency interference e.g at Hospitals Intensive care areas, and in
aircrafts.
iii) Driving safety: Motorists should strongly refrain from using mobile
phones while driving since research has established the risk of traffic
accidents while using mobile phones.
iv) Protective measures: Fences or barriers or other protective measures to
prepuce to areas where exposure limits may be exceeded.
v) Consultation with communities in siting base stations: Siting of base
stations should not only be accessible but should take into account public
concerns.
vi) Providing information: An effective system of health information and
communication between government, industry and the public is needed
APPENDICES
66

to raise the level of general understanding about mobile phone
technology and reduce any fears, mistrust both real and perceived.
(http//:www.who.int.)
. i
67
APPENDIX 2 Letter of Introduction
Josephine Towett
Box 759, 00100
NAIROBI
Dear Sir/Madam,
RE: REQUEST FOR RESEARCH DATA
I am a Master of Business Administration student at the University of Nairobi
carrying out a research project in partial fulfillment of the degree requirements.
The research topic is : "A survey of perceived risks on the use of mobile
telephone services among consumers in Nairobi".
I hereby request you to complete the attached questionnaire.
The information obtained is purely for academic purposes and will be held in
strict confidence.
Thank you.
Yours faithfully,*
. <
JOSEPHINE TO W ETt
68

APPENDIX 3 QUESTIONNAIRE
SECTION A
PARTI
1. Do you have a mobile phone?
Yes [ ] No [ ]
2. Which mobile phone company are you connected to?
Safaricom [ ]
Kencell [ ]
PART 11
3 . Please indicate on the scale below by ticking (V) the extent to which
you agree or disagree on the following statements on the use of mobile
phone services: Strongly Agree = 5; Agree = 4; Neither agree nor
disagree = 3; Disagree = 2; Strongly disagree = 1.
Strongly Agree Neither Disagree
agree agree or
disagree
1 Before I was connected, I
was concerned that the phone
would not work well [ ] [ ] [ ] [ ]■*
2. The purchase of hnobile phone
represented b good amount of
my budget/income [ ] [ ] [ ] [ ]
Strong
disrigrc
[ ]
[ ]
69
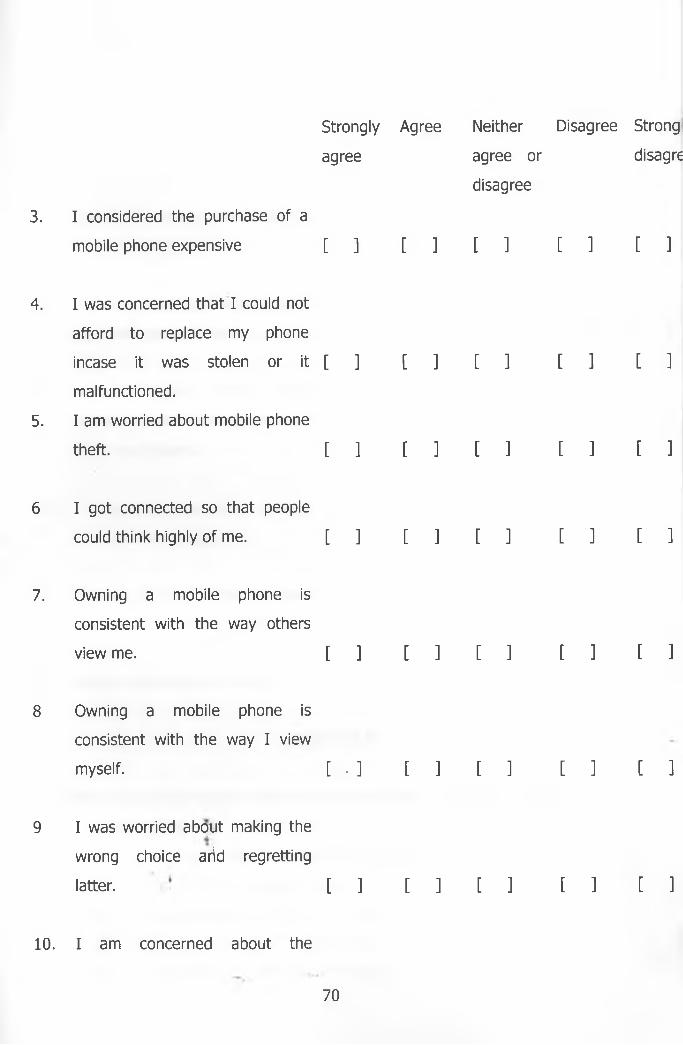
3. I considered the purchase of a
mobile phone expensive
4. I was concerned that I could not
afford to replace my phone
incase it was stolen or it
malfunctioned.
5. I am worried about mobile phone
theft.
6 I got connected so that people
could think highly of me.
7. Owning a mobile phone is
consistent with the way others
view me.
8 Owning a mobile phone is
consistent with the way I view
myself.
9 I was worried about making the
wrong choice arid regretting
latter.
10. I am concerned about the
Strongly Agree Neither Disagree
agree agree or
disagree
[ ] [ ] [ ] [ 1
[ ] [ ] [ ] [ ]
[ ] [ ] [ ] [ 1
[ ] [ ] [ ] [ ]
[ ] [ ] [ ] [ ]
[ . ] [ ] [ ] [ ]
[ ] [ ] [ ] [ ]
Strong
disagre
[ ]
[ ]
[ ]
[ ]
[ ]
[ ]
[ ]
70
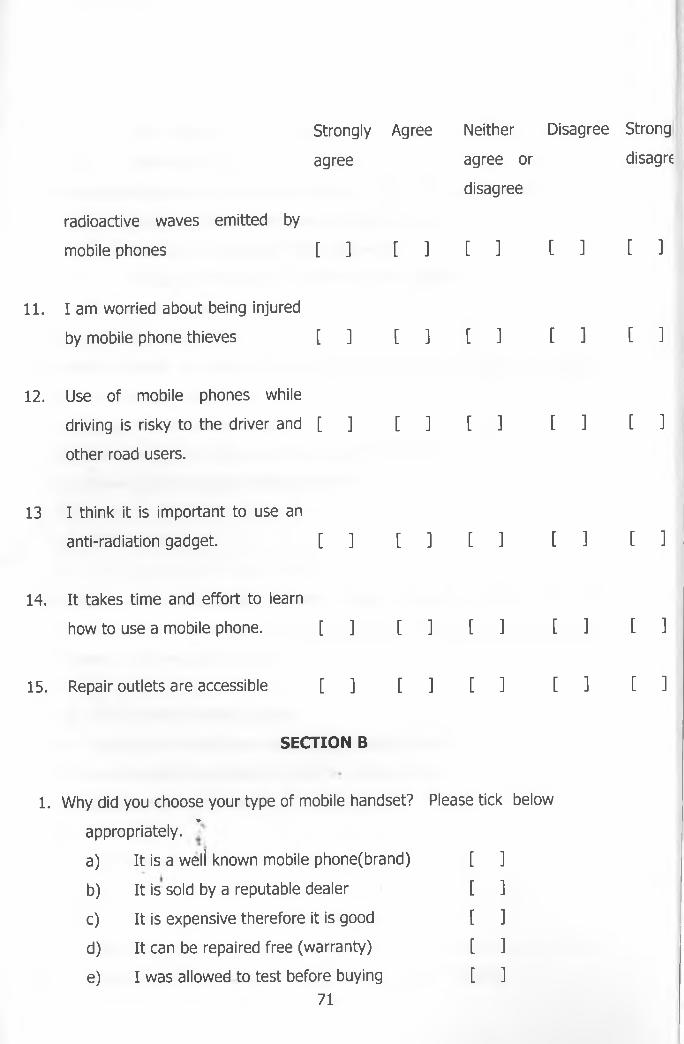
Strongly Agree
agree
radioactive waves emitted by
mobile phones [ ] [ ]
Neither Disagree Strong
agree or disagre
disagree
[ ] t ] [ 1
11. Ia m worried about being injured
by mobile phone thieves [ ]
12. Use of mobile phones while
driving is risky to the driver and [ ]
other road users.
13 I think it is important to use an
anti-radiation gadget. [ ]
14. It takes time and effort to learn
how to use a mobile phone. [ ]
15. Repair outlets are accessible [ ]
[ ] [ ] [ ] [ 1
[ ] [ ] [ ] [ ]
[ ] [ ] [ ] [ 1
[ ] [ ] [ ] [ 3
[ ] [ ] [ ] [ ]
SECTION B
1. Why did you choose your type of mobile handset? Please tick below■»
appropriately.
a) It is a weli known mobile phone(brand) [ ]
b) It is sold by a reputable dealer [ ]
c) It is expensive therefore it is good [ ]
d) It can be repaired free (warranty) [ ]
e) I was allowed to test before buying [ ]71

2.
f) My friend/relative had bought it [ ]
f) other (sp ec ify ).................................................................................................
How did you choose your service provider? Please tick appropriately.
a) Based on information from the advertisement [ ]
b) Based on information from salespeople [ ]
c) Based on information from friends and relatives [ ]
d) other (sp ec ify )..................................................................................
3. Have you taken any action to protect your mobile phone from being stolen?
Tick below appropriately
a) I use it in 'safe' places only [ ]
b) I have locked it so that it is not re-usable if stolen [ ]
c) I have used a security marking system [ ]
d) None [ ]
e) Others specify ......................................................................................
4. There is talk about mobile phones emitting radioactive waves that could
cause cancer. What action have you taken to minimize any such effects?.
Please tick below appropriately.
a) I use an anti-radiation gadget [ ]
b) I minimise my talk time when using a mobile phone [ ]
C) I use a hands-free gadget so that the phone is not
close to my head or body [ ]
d) None [ ]
e) Others specify * ’ ......................................................................................
SECTION C
1. What is your occupation-----------------
2. Please indicate your gender [ ] Male [ ] Female72
3. Please tick the age bracket in which you fall:
Below 20 years [ ]
21-30 years [ ]
31 - 40 years [ ]
41 - 50 years [ ]
51 - 60 years [ ]
Above 60 years [ ]
4. Please indicate your education level
i) Primary [ ]
ii) Secondary [ ]
ii) College [ ]
iii) University [ ]
IV) Other (specify).............................................
THANK YOU FOR YOUR COOPERATION.
i. <
73
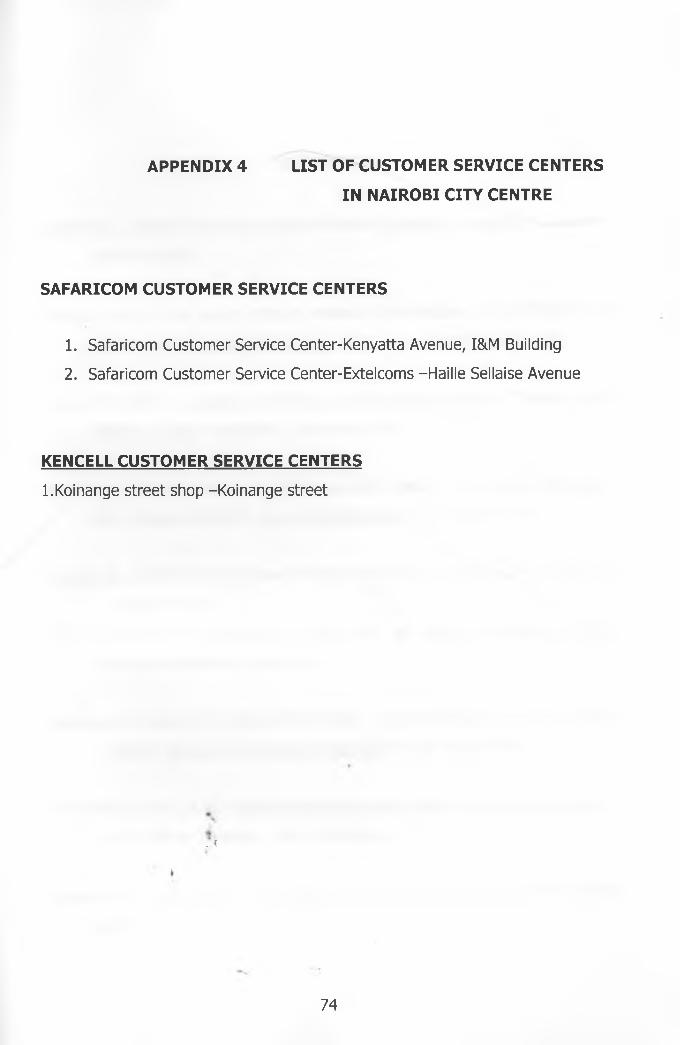
APPENDIX 4 LIST OF CUSTOMER SERVICE CENTERS
IN NAIROBI CITY CENTRE
SAFARICOM CUSTOMER SERVICE CENTERS
1. Safaricom Customer Service Center-Kenyatta Avenue, I&M Building
2. Safaricom Customer Service Center-Extelcoms —Haille Sellaise Avenue
KENCELL CUSTOMER SERVICE CENTERS
l.Koinange street shop -Koinange street
. \
74
REFERENCES
Aaker D.A., (1983) "Perceived Quality of Service Journal of Marketing. (Winter
pg 1 1 8 -1 2 2 ).
Ardnt J.(1970) 'The role of product related conversations in the diffusion of a
new Product".Journalof Marketing Vol IV,aAugust 1967 pp 291-295
Assael H. (1998), Consumer Behaviour and Marketing Actions. 6th Edition, South
Eastern College Publishing, Cinacinati, Ohio
Bauer R A, (1960) "Consumer Behaviour as Risk Taking" in Dynamic Marketing,
for a Changing World". Journal of Marketing Vol 35 pp389-398
Baumol W. J (1957) "On the Role of Marketing Theory" Journal of Marketing Vol
21.pp413-418
Berry L,Upah G,(1982) Emerging perspectives on services marketing Chicago,
American marketing Association.
Bettman, R .J. Lice F.M. Payne J.W .(1998) "Understanding Consumer Decision
Making" Journal of Consumer Research Vol. 25. ppl87-217
Churchill (Jr) G.A (1976) Marketing Strategies and Methodological Foundations
Dryden Press ,0/lando , USA Fifth Edition
Coppersmith. S fi967JThe Ancedents of selfesteem.Sanfrancisco'WHFreeman
&CO.
75

Cox D.F. Rich ,S.U (1964) "Perceived risk and consumer decision making" :The
case of Telephone shopping. Journal of Marketing Research Vol v pp32-39
Cravens D.W., Hills G.W, Woodruff R.B. (1996) Marketing Management; Prentice
Hall International.
Daily Nation (2001) Minutes or Seconds? Lets have the facts" Tuesday, May
8th.
David L.L. and Dellabitta A. J. (1979) Consumer Behavior: Concepts and
Applications. McGraw Hill, Inc
Dell. H. Roger J .B .; Kenneth A.C. (1998T Consumer Behavior: Building
Marketing Strategy. . Irwin McGraw Hill. Seventh Edition
East African Standard (2002) "The big Issue" April 15th
Economic Survey (2001) Central Bureau of Statistics, Ministry of Finance,
Republic of Kenya,Nairobi, Government Printer
Greenleaf, E.G.A. D. Lehmann (1995) "Delay in Consumer Decision Making"
Journal of Consumer Research September Vol. 22 pgl86-199.
Ennew, C. Watkings T , Wright. M (1990) Marketing of Financial Services.
Redwood Press.»
Fischer W .F. (1970) Theories of Anxiety New York, Harper and Row
Publishers. '
Glen L.U and John R.H. (1980). Design and Marketing of New Products.
Prentice Hall, International.
76
Grahame R.D ., Richard S. (1994) "A Model of Perceived Risk and Intended Risk
Handling Activity" Journal of Consumer Research July Vol 21, pp 119 —
134
Gronroos C. (1983) Strategic Management and Marketing in the Services sector
Cambridge, Marketing Association.
Grubb E, Grathwohl L. H (1967), "Consumer Self Concept, Symbolism, and
Market Behaviour" Journal of Marketing Vol. 31 pp.22-27
Herbert H.S, Slovic, P, Hampsns (1993) Adolescents Perception of Risk:
Understanding and Preventing High Risk Behaviour in Advances in
Consumer Research. Vol20 pp ll9-134
Hirsch R.D. Dornoff R .J. Kernan J.B . 1972. "Percieved Risk in Store Selection"
Journal of Marketing Research Vol. 9. pp435-439
Humer E.S. Engel F .F ., Blackwell D.R. (1970) "Perceived Risk in Mail Order and
Retail Store Buying" Journal of Marketing Research Vol. 31 pp364-369
Kath, B.M; John L.S (1990) "The Impact of Services Versus Goods on
Consumers Assessment of Perceived Risk and Variability" Journal of the
Academy of Marketing Sciences Vol.35 pp 51 - 56
Keith C.W. (1981) Behavioural Aspects of Marketing: Great Britain, Hartnolls
Limited.ONJV. f'SlTV Cc M/iirino
? L0ViBi LIBHAR)Kibera,F Waruinge C (1988 ) Marketing Management An African Perspective,
Nairobi,Kenya literature Bureau
77
Kotler P. Armstrong G (1990) Marketing: An Introduction New Jersey,Prentice
Hall. Publisher, Seventh Edition.
Kotler, P. (1994) Marketing Management Analysis, Planning; Implementation
and Control. India, D elh i, Prentice Hall
Maina P.M. (2001) Perceived Quality Service: The Case of Mobile Telephone
Services. Unpublished MBA Project, University of Nairobi, Nairobi.
Market Trends(June-July 2001):Mobile telephony, Spencer Media
Consultants,Nairobi
Martin J .E . L. Mouthintice; W. Friedman (1996). Applied Consumer Behavior
Addison - Wesley Inc
Masinde C (1986) Perceived Quality Service: The Case of Kenya Airways
Unpublished MBA Project, University of Nairobi, Nairobi.
Mwendar A.M. (1987) Perceived Quality Service: The Case of Kenya Ports
Authority. Unpublished MBA Project, University of Nairobi, Nairobi.
Palmer A (2000) Principles of Marketing ,New York, Oxford University Press
Paul G; Donald S .T , Gerald A (1988); Research for Marketing Decisions New
Jersey Prentice JHall Int.. \
♦Porter E.M. (1980) Competitive Strategy: Technioues for Analyzing Industries
and Competitors New York, Free press.
78
Popielarx D.T. (1967) "An Exploration of Perceived Risk and Willingness to Try
New Products", lonrnal of Marketing Vol. Ivpp368-372
Rao, R.V,Steckel J.H (1999) Analysis for Strategic Marketing, USA Addison -
Wesley Longman,
Reichman F.F (1955) An Outline of Psvcho analysis. New York, Random House.
Republic of Kenya (1999), National Poverty Eradication Plan, (1997 - 2001)
Government Printer, Nairobi.
Republic of Kenya, Poverty Reduction Strategy Paper (For 2001-2004)
September2001,Nairobi Government Printer
Rust R, Zahorik K. A .J., Keiningham A, J (1996) Service Marketing New York
Collins College Publishers.
Roselius T . (1971) "Consumer Rankings of Risk Reduction Methods. Journal of
Marketing Vol. 35. pp56-61
Schiffman, G. L and Kanuk L.L. (2000). Consumer Behavior Ind ia ,Delh i, Prentice
Hall
Solomon M.R (1988), Consumer Behaviour Buying, Having and Being, New
Jersey Prentice Hall, International Inc. 3rd Edition ♦
Taylor W J(1974) 'The role of risk in consumer behavour" Journal of Marketing
Vol 38 pp54-60
79
Wizenberg, L (1989) The New Products Handbook, Homewood Illino is Down
Jones - Irwin
Zeithaml, V.A. (1988) "Consumer Perceptions of Price, Quality and Value" A
Measure End Model and Synthesis of Evidence. Journal of Marketing
July 1988. Vol52 pp2-22
*
Zikmund, W.G, D'Amico (1995) Effective Marketing: Creating and Keeping
Customers: USA ,West Publishing Company.
Internet websites
http/www.itu.int/ITU-D-/ict/ststistics/at_glance/keytelecom99.html 6/4/02
http//www.abcnew.go.com/onair/2020-99/1020cellphones.ttml/4/17/02
Carlo ,G A letter from Dr George Carlos the CTIA's main defender of the
"cellphones are safe" line to the chairman and CEO of AT&T
<http//.www.electric.workds.com/JUNK/carlo/carlomainletter.html 4/17/02
Royal Society of Canada (1999) A review of the potential health risks of radio
frequency fields from wireless telecommunications devices
<http//www.who.int.4/17/02