a survey of policies, practices and effectiveness research
TRANSCRIPT

rese
arch
8 | 06
Paid Time Off and PTO Banks:
A Report by WorldatWork
Dow Scott, Ph.D., Loyola University
Tom McMullen, Bill BowbinHay Group
John Shields, Ph.D., University of Sydney
May 2009
Alignment of Business Strategies, Organization Structures and Reward Programs:
A Survey of Policies, Practices and Effectiveness

©2009 WorldatWork Any laws, regulations or other legal requirements noted in this publication are, to the best of the publisher’s knowledge, accurate and current as of this report’s publishing date. WorldatWork is providing this information with the understanding that WorldatWork is not engaged, directly or by implication, in rendering legal, accounting or other related professional services. You are urged to consult with an attorney, accountant or other qualified professional concerning your own specific situation and any questions that you may have related to that.
No portion of this publication may be reproduced in any form without express written permission from WorldatWork.
Media Contact: Marcia Rhodes14040 N. Northsight Blvd.Scottsdale, Arizona 85260-3601480-304-6885Toll free: 877-951-9191Fax: [email protected]
About WorldatWork®

WorldatWorkRewards Alignment Survey
1
Alignment of Business Strategies, Organization Structures and Reward Programs: A Survey of Policies, Practices and Effectiveness May 2009 INTRODUCTION
A competitive business advantage is derived from the alignment of business strategies and reward programs. For compensation professionals, this is practically an axiom, similar to the saying “practice makes perfect” for the musician or the formula “E=MC2” for physicists. The WorldatWork Total Rewards Model specifies that the business strategy, organization culture and HR strategy should be the primary determinants of reward strategy and program design to positively impact performance and results. Open any compensation textbook and you will find chapters dedicated to linking business strategy and reward programs. However, this compensation tenet contradicts our search for “best” reward practices, defined as reward programs and policies that are superior to other policies and programs regardless of the organization’s business or HR strategy, how the organization is structured, or other characteristics of the organization.
In a 2007 survey, WorldatWork members identified pay program alignment as one of the most important strengths or areas that needed improvement (Scott, McMullen, Sperling and Bowbin, 2007).
While academicians and consultants place great importance on the alignment of reward strategies and programs with business strategy, research on the topic is limited. As a result, the research team from Hay Group, WorldatWork and Loyola University Chicago surveyed a representative sample of WorldatWork members to determine how they formulate and align their business strategies, organization structure and reward programs. Then the team examined the effects of competitive strategy alignment with organizational structure, pay policies and programs relative to three measures of organization performance.
Rewards Alignment Model:
Competitive Strategy* − Quality Defenders − Cost Defenders − Analyzers − Prospectors − No consistent strategy Structures − Org. centralization & team
based − Pay Structures (ranges, job
evaluation & pay surveys)
− Competitive position of pay levels − Performance measurement − Pay variability − Pay communication − Non-cash rewards − Consistent strategy across
business units − Alignment of business strategy − Reinforces org. effectiveness − Reinforces org. culture
− Self-reported org. effectiveness
− Fortune’s Most Admired Companies
− Total shareholder return (TSR)
*Adapted from Miles & Snow typology.
Research for this report was conducted by members of the WorldatWork surveys and research team; Dow Scott, Ph.D., Loyola University Chicago; Tom McMullen and Bill Bowbin, CCP, Hay Group; and John Shields, Ph.D., University of Sydney. The authors would like to thank Richard Sperling, Sperling HR, and Dennis Morajda, Performance Development International LCC for their contributions to the survey initiative.
Strategy/Organizational Structures
Reward Strategies, Policies and Practices
Effectiveness Measures

WorldatWorkRewards Alignment Survey
2
The specific research questions were: o How do organizations define the linkage between business strategy,
organizational structure and reward strategies and programs? o What are the specific actions that organizations adopt to align their
business strategy, organizational structure and reward strategies? o How does the alignment of business strategies and reward strategies and
programs affect organization performance?

WorldatWorkRewards Alignment Survey
3
METHODOLOGY Data Collection and Sample Characteristics
Seven thousand WorldatWork association members were invited to participate in this study, which was open from Jan. 5 through Jan. 20, 2009.
We received 449 valid responses from WorldatWork members. To reduce the potential for statistical error, we dropped multiple responses from the same organization. The responses kept represent the most senior-level participant with the assumption that he/she would be more cognizant of the strategic issues in the organization.
Respondent Demographics
Respondents represented the range of reward/HR professionals and reported data for organizations covering a diverse range of industries and sizes.
Responsibility Level:
Organization Size:

WorldatWorkRewards Alignment Survey
4
Industry:
Study Variables and Measures The well known and highly regarded Miles and Snow typology was the basis for developing
the competitive strategies measures, categorized as:”defender,” ”analyzer” and ”prospector.” Organization structure (degree of centralization) was based on the equally well known Burns and Stalkers typology. The reward strategy, policies and program measures listed in Figure 1 were specifically developed for this study. We adopted and modified items from similar scales or added items of our own based on our knowledge and experience with these variables (e.g., pay variability, pay communications and non-cash rewards). The measures are defined in the next section, “Findings,” and individual items that make up these measures are shown in the tables.
Three measures of organizational effectiveness were also assessed. One was a self-
assessment of relative organizational performance as rated by survey respondents. “Please indicate how your organization compared to its competitors. Consider how the organization performed, on average, over the past three years.” Respondents rated their organizations’ overall performance compared to competitors as: lowest, 1% to 20% (1%); low, 21% to 40% (7%); middle, 41% to 60% (33%); high, 61% to 80% (32%); and top, 80% to 100% (28%). Even though one might expect a certain amount of upward performance bias, this subjective measure of performance was strongly correlated with the financial measure of total shareholder return (TSR) over a three-year period. TSR is the change in the organization’s stock price plus any dividends paid over a three-year period. This measure was only available for companies that were listed on public stock exchanges.
Fortune’s Most Admired Company designation was the third rating of organization
effectiveness used. Hay Group derives the Most Admired Company rankings for Fortune magazine and has first-hand knowledge of what makes the Most Admired Companies great. This rating is awarded by industry experts based on both financial results and qualitative evaluation of company performance. In determining industry rankings, Most Admired Companies are rated on nine key attributes: Raters are asked to assess each eligible company in their industry on each of the following:
� Ability to attract and retain talented people

WorldatWorkRewards Alignment Survey
5
� Quality of management � Quality of products or services � Innovation � Long-term investment value � Financial soundness � Wise use of corporate assets � Social responsibility to the community and the environment � Effectiveness in conducting business globally
A total of 49 companies in the sample were rated as Most Admired Companies, which were compared to 250 non-Most Admired Companies of similar size. Data Analysis
Once the data were collected, we confirmed that variables were valid and reliable through factor analysis and alpha coefficients. These analyses can be obtained from the senior author, Dow Scott, Ph.D. To determine the relationship between the variable Pearson correlations, t-tests were used.

WorldatWorkRewards Alignment Survey
6
SURVEY FINDINGS
Recognizing that reward alignment occurs at several junctures, the findings are first grouped by:
� Competitive strategy (Miles and Snow typology) � Organizational structure, degree of decentralization (Burns and Stalker typology) � Pay structure and competitive position of pay levels � Performance measurement � Pay variability � Pay communication � Non-cash rewards
Next, we assess the degree to which these factors are aligned and the strength of their relationship to organizational performance. Given the scope and detail of the information collected from WorldatWork members, the text below highlights the more interesting findings and refers the reader to the tables for the specific information collected and how survey participants responded.
Competitive Business Strategies
The alternative business strategies that an organization might follow to successfully compete have been defined by numerous authors; the models and definitions of these constructs are often similar. We selected the Miles and Snow (1978) typology which defines a straight-forward description of alternative strategies and a typology quite often used by researchers. Miles and Snow identified three market competitive strategies: defenders, analyzers and prospectors.
Shields (2007) provides a brief description of each: � Defenders act to protect and preserve their market share from existing
and new competitors. They will have only one core product or service line and focus on improving the technical efficiency of their existing operations. A defender will seek to maximize the efficiency of existing technical methods, hence emphasizing cost minimization or quality enhancement, or a balance of the two.
� Analyzers are cautious diversifiers. They may have one or two core products or services and one or more non-core product lines that are spin- offs from the core business. Analyzers are more likely to be market followers than market leaders and will also be inclined to compete on quality rather than cost, at least in the long term.
� Prospectors are habitual diversifiers. They are proactive and perhaps aggressive market opportunists and risk takers with a diverse and ever-changing portfolio of products and little loyalty to any particular type of product and service. They are constantly on the lookout for new and more attractive market opportunities, always trying to be first into a new product or service area. The emphasis is on speed, agility, technological dynamism, flexibility and risk taking, particularly to anticipate new customer needs and maintain a competitive advantage .” (See pages 107-108).
Tables 1 through 7 provide data as to how survey respondents describe the competitive
strategy or strategies followed by their organizations. Although these organizations did not define the defender strategy consistently as per Miles and Snow, most respondents indicated

WorldatWorkRewards Alignment Survey
7
that their organizations attempt to control costs and champion quality as a competitive advantage. Specifically, 59% of respondents indicated that they vigorously pursued cost reductions and 63% said they exercised tight control of overhead costs. An even higher percentage of respondents agreed that their organizations compete on quality (79%), vigorously pursue improvement in product and service quality (87%), and see product or service quality as more important than price in maintaining market share (59%). The importance respondents place on quality is evident because this scale has the highest average mean score of all the competitive advantage and other pay measures. We suspect this focus on cost and quality reflects the expressed need for continuous quality improvement and cost reduction to survive in the global market. (See Tables 2 and 3).
Far fewer organizations indicate that they consistently follow Miles and Snow’s Analyzer
strategy as shown in Table 4. Only 11% of organizations agreed that that they “preferred to wait” for competitors to introduce new products or services in order to learn from their experiences. However, 46% of the respondents suggest that their organizations carefully monitor the practices of major competitors before adopting those which appear to be the most promising. Most respondents indicated that their organization prefers to diversify into areas compatible with their existing product or service base (74%). The inability to obtain reasonable factor scores or a coefficient alpha of more than .5 indicates that respondents were not consistent in their responses to these items and as such, one must question the notion that there is an overall analyzer strategy to which organizations represented in this study subscribe. As a result, we did not create a scale (i.e., overall measure) for this competitive strategy for further analysis.
As shown in Table 5, respondents were consistent in their responses to the statement that
assesses the degree to which their organizations follow or do not follow a prospector strategy (coefficient alpha = .78). Although not all respondents indicate that their organizations follow a prospector strategy, most agree that innovation is “the key to achieving competitive advantage” (66%); and that they must “constantly seek to locate and exploit new product or service opportunities” (61%).
Table 6 indicates that some organizations do not follow a strategy per se or at least do not
consistently follow a strategy. Nine percent agree that their senior managers did not understand the business strategy, 16% agree that the strategy was changed frequently and 24% agree that the business strategy was not consistently executed.
We can now examine each of the scales (i.e., measures created) as to how they relate to
each other via a correlation analysis shown in Table 23. Based on the self-reported effectiveness measure, organizations attempting to follow a competitive strategy through cost reduction, quality or prospecting were more likely to do the following as compared to organizations that did not follow a consistent strategy:
� Centralize their strategic vision, planning and operations � Link compensation programs to organization effectiveness � Use compensation programs to reinforce organization culture � Have accurate performance measurement systems � Have variable pay � Use non-cash rewards � Align their business strategy with their compensation programs.
Based on the TSR effectiveness measure, organizations following a cost-reduction strategy
had a negative relationship with organization effectiveness but organizations following the

WorldatWorkRewards Alignment Survey
8
prospector strategy had a positive relationship with performance. Most Admired Companies were more likely to follow a prospector strategy and more likely to have a strategy than a non-Most Admired Company.
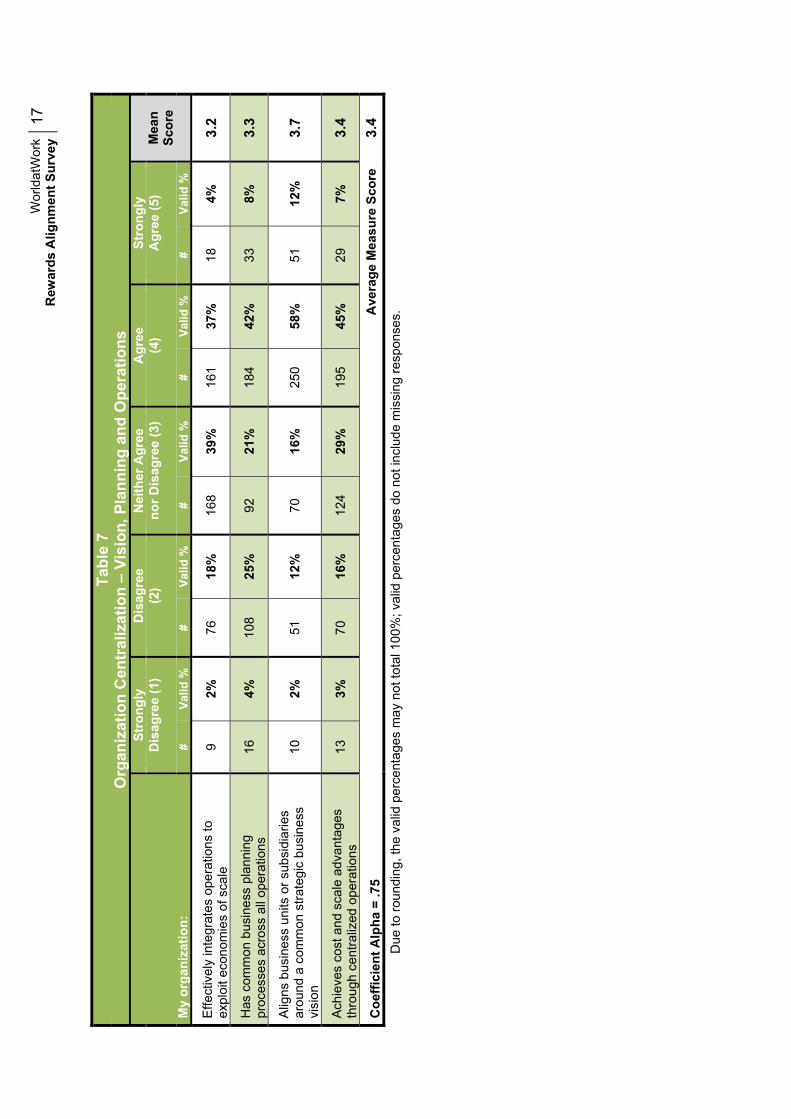
Given that organizations often compete in a variety of industries, leadership must decide to
align competitive strategy and centralize operations regardless of the markets or differentiate their strategies and decentralize operations. Table 7 indicates the majority of respondents attempt to “align business units and subsidiaries around a common strategic business vision” and to a lesser degree, centralize operations to achieve cost advantages.
Organization Structure (Degree of Centralization)
Burns and Stalker (1961) theorized that decision making is a predominate driver of organization structure centralized where consistent decisions are made by senior management or decentralized with employees at all levels in the organization having considerable influence on decisions.
Although Burns and Stalker’s scale has been widely used for research, we were unable to
discern with factor analysis or alpha coefficient that indeed respondents do assess their organizations as Burns and Stalker believed. As a result, these items in total are neither presented nor analyzed as a scale as shown in Table 8. Although most respondents indicated that their organizations are team based (57%) and encourage employees to take responsibility (85%), only a few indicated a highly decentralized decision-making process (30%) or that employees had considerable input into decisions that affect them (25%). Furthermore, 64% of respondents indicated that communication is “top down”; only 34% disagreed that employees receive close supervision, and 54% felt information is shared only with those who need to know. These findings might be viewed as troubling since many organizations purport to be team-based, encourage responsibility and participation. If these responses are indicative of U.S. organizations — few consistently live up to their espoused ideals.
However, the alpha coefficient and factor analysis of Burns and Stalker’s scale indicate our
justification for examining two subscales. (See Table 9). These items specifically focus on the extent to which the organization is team-based or sustains centralized policies.
The correlation analysis in Table 23 indicates that team-based organizations are more likely
to: � Link compensation programs to organization effectiveness � Use compensation programs to reinforce their organization culture � Use accurate performance measures � Have higher variability in their pay levels � Use non-financial rewards more frequently � Have strategic consistency across business units � Align their business, HR and compensation strategy � Consider their organizations more effective than their peers.
The correlation analysis in Table 23 indicates that centralized organizations are more likely
to: � Utilize strategies of cost and quality defenders and prospectors � Have a team-based organization structure � Have performance measurement accuracy � Offer higher variability in their pay levels � Have better pay communication

WorldatWorkRewards Alignment Survey
9
� Use non-financial rewards more often � Use compensation programs that reinforce organization culture and effectiveness � Have strategic consistency across business units � Have stronger alignment of their business, HR and compensation strategy � Have higher self-rated levels of organization effectiveness.
Finally, team-based organization structure was positively related to the three-year average
TSR.
Pay Strategies, Policies and Programs Pay structure and competitive position of pay: Since the statements on pay structure
were not designed to represent an overall measure of pay structure, Table 10 provides only descriptive information for each survey statement. Although general consensus exists among compensation professionals about the desirability of having wide pay ranges, few organizations have done so (18%). Most respondents indicate their organizations operate from traditional pay structures (71%) and grant line managers more influence over pay decisions than HR or compensation managers (55% and 34%, respectively).
Most respondents contend that their pay structures target the median for base pay (79%), total cash compensation (58%) and total direct compensation (53%), with organizations slightly more likely to pay above the median as shown in Table 11.
Performance measurement: A large percentage of respondents indicate their use of
accurate performance measures, i.e., individual employee performance (48%), team or unit performance (41%) and organization performance (75%). The coefficient alpha (.78) indicates respondents purporting to have accurate performance in one dimension, also claim accurate measures for other performance dimensions. (See Table 12). Organizations primarily engage in traditional performance appraisals to measure employee performance (80%); while only 26% suggest that their organizations use multiple measures of employee performance as shown in Table 13.
The reported degree of performance measure accuracy at the individual, team and organizational level was found to be related to self-reported organization effectiveness. Most Admired Companies also report higher levels of performance measurement accuracy than did non-Most Admired Company peers.
Pay variability: Managers and compensation professionals have long suggested that
substantial pay variability (or differentiation) is a prerequisite to motivate performance, to align company goals or strategies with employee pay, and to attract and retain high performers. However, Table 14 indicates high performers in most organizations do not, in fact, earn substantially more than their peers. Only 19% of the respondents indicated that salary increases for superior performers are at least two times the size of increases received by average performers; only 23% agreed that superior performers are paid significantly larger annual salaries (10% or more) than average performers, and only 30% acknowledged a significant variation in annual incentive payouts between superior and average individual performers. It is only with promotions that respondents acknowledge that high performers did substantially better than average performers (83%).
Fifty-seven percent of respondents agreed that employees could earn substantially more if the business unit or the organization performs well. It would appear that more than half the organizations use organization performance measures as a basis for incentive pay.

WorldatWorkRewards Alignment Survey
10
Few respondents (15%) indicated that their organizations place more pay “at risk” (i.e.,
variable pay) than do their competitors. Most organizations seem to focus on cash awards (79%) as opposed to equity awards, stock or stock equivalent (8%).
Table 23 reveals that organizations reporting increased pay variability are more likely to
operate from a common strategic vision and planning process and centralize operations. Compensation programs are also more likely linked to:
� Organization effectiveness � Use of compensation programs to reinforce culture � Report more accurate measures of performance � Use of non-financial rewards � Have a consistent strategy across business units � Align the business strategy with the team-based organization structure, HR and
compensation programs � Report that their organizations are more effective then those of their peers. Pay variability was found to be related to the self-reported organization effectiveness
and Most Admired Companies report higher levels of performance measurement accuracy than did non-Most Admired Companies as shown in Tables 23 and 24.
Pay Communication: In two previous studies of WorldatWork members, we learned that compensation professionals believe pay communication is important, yet organizations are doing too little to help employees understand how they are paid and the value of the pay packages they receive (Scott, Sperling, McMullen and Bowbin, 2008; Scott, McMullen, Sperling and Bowbin, 2007). The current study reinforces these findings per the second lowest mean score (2.8), as shown in Table 15. Only 41% of respondents agree that their employees know the pay ranges for their pay grade or position; 21% know the pay ranges for the grade or positions immediately above their own; 36% say the pay information is openly shared by the organization; and only 33% disagree that employees have very limited understanding of why they are paid what they are paid. Pay communications, like pay variability, is an area that compensation professionals contend is important, but they admit that they don’t do nearly enough to help employees understand how they are paid and the value of their pay packages.
Although Table 23 indicates that effectively communicating with employees is not associated with competitive strategies or organization performance, communications is positively associated with non-financial reward use and negatively associated with five-year TSR.
Non-cash rewards: In recent years, compensation professionals have emphasized that
employees think in terms of total rewards, which include base pay, variable or incentive pay, benefits and a long list of non-financial rewards. Employee recognition also has been given considerable attention at conferences and in the literature due to its inexpensive application and because employees place considerable importance upon being recognized for their efforts or contributions. As shown in Table 16, only 34% of respondents agreed they have an effective recognition program. Few organizations (7%) reward employees with time off for good performance, even though employee surveys indicate this is a popular reward. Respondents agree their organizations are providing flexible work schedules (65%), are offering numerous development opportunities (55%), and are attempting to maintain job security for high performing employees (71%).

WorldatWorkRewards Alignment Survey
11
Use of non-financial rewards is associated with team-based organization structures, following a prospector strategy, pay variability, and organization effectiveness.
Strategic alignment and compensation programs: As shown in Table 17, respondents
indicate that their compensation programs reinforce financial performance (80%) and customer satisfaction (53%). To a lesser extent, compensation strategy reinforces internal processes (41%) and human capital development (41%).
For the most part, respondents acknowledge their compensation programs are used to reinforce a culture of individual performance (81%) and collaboration and teamwork (58%). To a lesser extent, the compensation programs reinforce a culture of creativity and innovation (39%). (See Table 18).
Thirty-eight percent of the respondents indicate that compensation programs have changed
in the last four years, whereas, 51% indicate their programs have not changed. The business strategy (70%), HR strategy and compensation strategy are consistent (70% and 68%, respectively). (See Table 19).
Alignment of the competitive strategy, organization structure and pay system: As
shown in Table 20, most respondents indicate that their business strategy was aligned with the HR strategy, organization structure and compensation strategy (65%, 70%, and 54%, respectively). It is interesting that few respondents indicated their business strategy was aligned more with compensation strategy than either the organization structure or HR strategy.
Table 21 shows that most respondents perceive their business strategy as effective (57%), and to a lesser extent their HR strategy and their compensation strategy (43% and 40%, respectively).
Alignment of the business strategy and compensation programs was found to be related to
the self-reported organization effectiveness, and Most Admired Companies reported higher levels of alignment then did non-Most Admired Companies as shown in Tables 23 and 24.
Relationship of Strategy, Organization Structure, Pay System and Performance: In
summary, perceived organization effectiveness is positively associated with the survey’s variables with the exception of those claiming not to have strategy or number of assessors used.

WorldatWorkRewards Alignment Survey
12
CONCLUSIONS AND RECOMMENDATIONS
Unlike most surveys of compensation practices, this research attempts to test a fundamental assumption of the profession: Does alignment of business strategy with compensation strategy, policies and programs increase organizational performance? In short, our research indicates this assumption is in fact true. More specifically, we found higher levels of organization performance when the following occurred:
� Organizations utilized a defined competitive business strategy and they followed a quality defender or prospector strategy.
� The competitive business strategy was aligned with HR and compensation strategies.
� The organization adopted more centralized policies and programs across business units and was team-based.
� There were accurate measures of performance, higher levels of pay variability and use of non-cash rewards.
� There was a consistent business strategy across business units. This research has certain limitations. First, since most of the variables were collected at one
point in time and correlation analysis was used, relationships between variables could not determine causality. Second, the organization assessment of business strategy and pay strategy, policies and programs was based on the individual assessment of (typically) a senior compensation person and was not verified by other sources. Finally, TSR was substantially affected by the economic crisis in the United States. However, even with these limitations, the overall findings were consistent with alignment theory and previous research.
As a result, we suggest that organizations take the following action: � Spend adequate time in aligning their pay strategies, policies and
programs with the business strategy � Create strategies, policies and programs that are consistent across
business units � Emphasize pay strategies, policies and programs that encourage pay
variability, performance measure accuracy and non-cash rewards. � Frequently reinforce their business, performance and reward strategies
through the involvement of senior leadership and line management and via a well-crafted rewards communication strategy.

WorldatWorkRewards Alignment Survey
13
REFERENCES Miles, R.E. and Snow, C.C. (1978) Organizational Strategy, Structure, and Process. New York:
McGraw Hill. Scott, K.D., McMullen, T.D., Sperling, R.S., and Bowbin, B. (2007) Reward programs: What
works and what needs to be improved. WorldatWork Journal. 16(3), 6-21. Scott, D., Sperling, R.S., McMullen, T.D., and Bowbin, B. (2008) “A study of pay
communications: Methods for improvement of employee understanding.” WorldatWork Journal. 17(3), 6-20.
Shields, J. (2007) Managing Employee Performance and Reward: Concepts, Practices and Strategies. Port Melbourne, Victoria, Australia: Cambridge University Press.

Wor
ldat
Wor
k R
ewar
ds A
lignm
ent S
urve
y14
Ta
ble
1 C
ompe
titiv
e St
rate
gy -
Def
ende
r
Stro
ngly
D
isag
ree
Nei
ther
Agr
ee
Agr
ee
Stro
ngly
M
ean
Scor
e D
isag
ree
(1)
(2)
nor D
isag
ree
(3)
(4)
Agr
ee (5
)
#Va
lid %
#Va
lid %
#Va
lid %
#Va
lid %
#Va
lid %
Offe
rs a
nar
row
rang
e of
pro
duct
s or
se
rvic
es
51
11%
20
0 45
%
40
9%
129
29%
26
6%
2.
7
Agg
ress
ivel
y pr
otec
ts it
s ex
istin
g pr
oduc
t or
ser
vice
mar
kets
from
com
petit
ors
11
2%
32
7%
116
26%
20
7 47
%
75
17%
3.
7
Pre
fers
to p
enet
rate
dee
per i
nto
its
exis
ting
mar
kets
rath
er th
an d
iver
sify
into
ne
w p
rodu
ct o
r ser
vice
are
as
9 2%
11
5 26
%
141
32%
13
5 31
%
36
8%
3.2
Pre
fers
gro
wth
to b
e ca
utio
us a
nd
incr
emen
tal
16
4%
132
30%
10
1 23
%
172
39%
22
5%
3.
1
Com
pete
s ch
iefly
by
offe
ring
its p
rodu
cts
or s
ervi
ces
at th
e lo
wes
t pos
sibl
e pr
ices
54
12
%
217
49%
12
1 28
%
40
9%
7 2%
2.
4
Due
to ro
undi
ng, t
he v
alid
per
cent
ages
may
not
tota
l 100
%; v
alid
per
cent
ages
do
not i
nclu
de m
issi
ng re
spon
ses.
Fa
ctor
load
ing
and
the
coef
ficie
nt a
lpha
sco
re d
id n
ot ju
stify
trea
ting
thes
e ite
ms
as a
sca
le.
Tabl
e 2
Com
petit
ive
Stra
tegy
- C
ost R
educ
tion
Stro
ngly
D
isag
ree
Nei
ther
Agr
ee
Agr
ee
Stro
ngly
M
ean
Scor
e D
isag
ree
(1)
(2)
nor D
isag
ree
(3)
(4)
Agr
ee (5
) #
Valid
%#
Valid
%#
Valid
%#
Valid
%#
Valid
%
Vigo
rous
ly p
ursu
es c
ost r
educ
tions
12
3%
61
14
%
107
24%
20
9 47
%
54
12%
3.
5
Exe
rcis
es ti
ght c
ontro
l of o
verh
ead
cost
s 8
2%
68
15%
86
19
%
222
50%
59
13
%
3.6
Coe
ffici
ent A
lpha
= .6
9 A
vera
ge M
easu
re S
core
3.6
Due
to ro
undi
ng, t
he v
alid
per
cent
ages
may
not
tota
l 100
%; v
alid
per
cent
ages
do
not i
nclu
de m
issi
ng re
spon
ses.

Wor
ldat
Wor
k R
ewar
ds A
lignm
ent S
urve
y15
Ta
ble
3 C
ompe
titiv
e St
rate
gy -
Qua
lity
Def
ende
r
My
orga
niza
tion:
Stro
ngly
D
isag
ree
Nei
ther
Agr
ee
Agr
ee
Stro
ngly
M
ean
Scor
e D
isag
ree
(1)
(2)
nor D
isag
ree
(3)
(4)
Agr
ee (5
)
#Va
lid %
#Va
lid %
#Va
lid %
#Va
lid %
#Va
lid %
Com
pete
s ch
iefly
by
prov
idin
g pr
oduc
ts
and
serv
ices
of t
he h
ighe
st p
ossi
ble
qual
ity
2 0%
17
4%
71
16
%
217
49%
13
3 30
%
4.1
Vig
orou
sly
purs
ues
impr
ovem
ent i
n pr
oduc
t and
ser
vice
qua
lity
1 0%
14
3%
42
10
%
258
59%
12
4 28
%
4.1
See
s pr
oduc
t or s
ervi
ce q
ualit
y as
mor
e im
porta
nt th
an p
rice
in m
aint
aini
ng
mar
ket s
hare
5
1%
33
8%
139
32%
18
4 43
%
71
16%
3.
7
Coe
ffici
ent A
lpha
= .7
5 A
vera
ge M
easu
re S
core
3.9
D
ue to
roun
ding
, the
val
id p
erce
ntag
es m
ay n
ot to
tal 1
00%
; Vva
lid p
erce
ntag
es d
o no
t inc
lude
mis
sing
resp
onse
s.
Ta
ble
4 C
ompe
titiv
e St
rate
gy -
Ana
lyze
r
My
orga
niza
tion:
Stro
ngly
D
isag
ree
Nei
ther
Agr
ee
Agr
ee
Stro
ngly
M
ean
Scor
e D
isag
ree
(1)
(2)
nor D
isag
ree
(3)
(4)
Agr
ee (5
) #
Valid
%#
Valid
%#
Valid
%#
Valid
%#
Valid
%
Is s
eldo
m fi
rst t
o en
ter a
new
or e
mer
ging
pr
oduc
t or s
ervi
ce a
rea
32
7%
145
34%
12
6 29
%
112
26%
17
4%
2.
9
Car
eful
ly m
onito
rs th
e pr
actic
es o
f maj
or
com
petit
ors
befo
re a
dopt
ing
thos
e w
hich
ap
pear
to b
e th
e m
ost p
rom
isin
g 4
1%
81
19%
14
9 35
%
170
40%
26
6%
3.
3
Pre
fers
to w
ait f
or c
ompe
titor
s to
in
trodu
ce n
ew p
rodu
cts
or s
ervi
ces
in
orde
r to
lear
n fro
m th
eir e
xper
ienc
es
32
7%
206
48%
14
8 34
%
38
9%
8 2%
2.
5
Pre
fers
to d
iver
sify
into
are
as c
ompa
tible
w
ith it
s ex
istin
g pr
oduc
t or s
ervi
ce b
ase
2 0%
19
4%
89
21
%
262
62%
53
12
%
3.8
Due
to ro
undi
ng, t
he v
alid
per
cent
ages
may
not
tota
l 100
%; v
alid
per
cent
ages
do
not i
nclu
de m
issi
ng re
spon
ses.
Fa
ctor
load
ing
and
the
coef
ficie
nt a
lpha
sco
re d
id n
ot ju
stify
trea
ting
thes
e ite
ms
as a
sca
le.

Wor
ldat
Wor
k R
ewar
ds A
lignm
ent S
urve
y16
Tabl
e 5
Com
petit
ive
Stra
tegy
- Pr
ospe
ctor
My
orga
niza
tion:
Stro
ngly
D
isag
ree
Nei
ther
Agr
ee
Agr
ee
Stro
ngly
M
ean
Scor
e D
isag
ree
(1)
(2)
nor D
isag
ree
(3)
(4)
Agr
ee (5
) #
Valid
%#
Valid
%#
Valid
%#
Valid
%#
Valid
%
Offe
rs a
wid
e an
d co
nsta
ntly
cha
ngin
g ra
nge
of p
rodu
cts
or s
ervi
ces
11
3%
14
8 34
%
126
29%
11
9 28
%
28
6%
3.0
Use
s a
wid
e an
d co
nsta
ntly
cha
ngin
g ra
nge
of te
chno
logi
es
11
3%
107
25%
91
21
%
192
44%
34
8%
3.
3
Con
stan
tly s
eeks
to lo
cate
and
exp
loit
new
pro
duct
or s
ervi
ce m
arke
t op
portu
nitie
s 4
1%
51
12%
11
2 26
%
228
52%
40
9%
3.
6
Res
pond
s ra
pidl
y to
em
ergi
ng m
arke
t op
portu
nitie
s 8
2%
88
20%
16
8 39
%
140
32%
27
6%
3.
2
See
s in
nova
tion
as th
e ke
y to
ach
ievi
ng
com
petit
ive
adva
ntag
e 5
1%
53
12%
89
20
%
196
45%
92
21
%
3.7
Coe
ffici
ent A
lpha
= .7
8 A
vera
ge M
easu
re S
core
3.4
Due
to ro
undi
ng, t
he v
alid
per
cent
ages
may
not
tota
l 100
%; v
alid
per
cent
ages
do
not i
nclu
de m
issi
ng re
spon
ses.
Tabl
e 6
Com
petit
ive
Stra
tegy
– N
one
or In
cons
iste
nt
In m
y or
gani
zatio
n:
Stro
ngly
D
isag
ree
Nei
ther
Agr
ee
Agr
ee
Stro
ngly
M
ean
Scor
e D
isag
ree
(1)
(2)
nor D
isag
ree
(3)
(4)
Agr
ee (5
) #
Valid
%#
Valid
%#
Valid
%#
Valid
%#
Valid
%
Sen
ior m
anag
ers
do n
ot u
nder
stan
d th
e bu
sine
ss s
trate
gy
124
28
229
52
44
10
34
8 6
1 2.
0
Bus
ines
s st
rate
gy c
hang
es fr
eque
ntly
34
8
228
52
106
24
64
14
10
2 2.
5
Bus
ines
s st
rate
gy is
not
con
sist
ently
ex
ecut
ed
36
8 20
6 47
92
21
93
21
12
3
2.6
* Sel
dom
mak
es c
hang
es in
pro
duct
s or
se
rvic
es o
ffere
d un
less
forc
ed b
y th
e m
arke
t 38
9
238
55
99
23
51
12
3 1
2.4
Coe
ffici
ent A
lpha
= .7
5 A
vera
ge M
easu
re S
core
2.4
Due
to ro
undi
ng, t
he v
alid
per
cent
ages
may
not
tota
l 100
%; v
alid
per
cent
ages
do
not i
nclu
de m
issi
ng re
spon
ses.
Wor
ldat
Wor
k R
ewar
ds A
lignm
ent S
urve
y17
Ta
ble
7 O
rgan
izat
ion
Cen
tral
izat
ion
– Vi
sion
, Pla
nnin
g an
d O
pera
tions
My
orga
niza
tion:
Stro
ngly
D
isag
ree
Nei
ther
Agr
ee
Agr
ee
Stro
ngly
M
ean
Scor
e D
isag
ree
(1)
(2
) no
r Dis
agre
e (3
) (4
) A
gree
(5)
#Va
lid %
#Va
lid %
#Va
lid %
#Va
lid %
#Va
lid %
Effe
ctiv
ely
inte
grat
es o
pera
tions
to
expl
oit e
cono
mie
s of
sca
le
9 2%
76
18
%
168
39%
16
1 37
%
18
4%
3.2
Has
com
mon
bus
ines
s pl
anni
ng
proc
esse
s ac
ross
all
oper
atio
ns
16
4%
108
25%
92
21
%
184
42%
33
8%
3.
3
Alig
ns b
usin
ess
units
or s
ubsi
diar
ies
arou
nd a
com
mon
stra
tegi
c bu
sine
ss
visi
on
10
2%
51
12%
70
16
%
250
58%
51
12
%
3.7
Ach
ieve
s co
st a
nd s
cale
adv
anta
ges
thro
ugh
cent
raliz
ed o
pera
tions
13
3%
70
16
%
124
29%
19
5 45
%
29
7%
3.4
Coe
ffici
ent A
lpha
= .7
5 A
vera
ge M
easu
re S
core
3.4
Due
to ro
undi
ng, t
he v
alid
per
cent
ages
may
not
tota
l 100
%; v
alid
per
cent
ages
do
not i
nclu
de m
issi
ng re
spon
ses.

Wor
ldat
Wor
k R
ewar
ds A
lignm
ent S
urve
y18
Ta
ble
8 O
rgan
izat
ion
Stru
ctur
e - C
entr
aliz
atio
n an
d Pa
rtic
ipat
ion
In m
y or
gani
zatio
n:
Stro
ngly
D
isag
ree
Nei
ther
Agr
ee
Agr
ee
Stro
ngly
M
ean
Scor
e D
isag
ree
(1)
(2)
nor D
isag
ree
(3)
(4)
Agr
ee (5
)
#Va
lid %
#Va
lid %
#Va
lid %
#Va
lid %
#Va
lid %
Em
ploy
ees
rece
ive
clos
e su
perv
isio
n
11
3%
136
31%
15
4 35
%
128
29%
10
2%
3.
0
Follo
win
g ru
les,
gui
delin
es a
nd
proc
edur
es is
less
impo
rtant
than
get
ting
resu
lts
43
10%
18
9 43
%
90
20%
10
8 24
%
14
3%
2.7
Wor
k in
our
org
aniz
atio
n is
hig
hly
team
-ba
sed
3 1%
77
17
%
113
25%
20
0 45
%
53
12%
3.
5
Dec
isio
n-m
akin
g pr
oces
ses
are
high
ly
dece
ntra
lized
37
8%
18
1 41
%
90
20%
11
1 25
%
22
5%
2.8
Com
mun
icat
ion
is fr
om th
e to
p do
wn
5 1%
59
13
%
93
21%
22
9 51
%
60
13%
3.
6
Em
ploy
ees
have
con
side
rabl
e in
put i
nto
deci
sion
s th
at a
ffect
them
20
5%
17
5 40
%
137
31%
10
3 23
%
8 2%
2.
8
Ther
e ar
e co
nsis
tent
job
desi
gns
and
orga
niza
tion
stru
ctur
es a
cros
s th
e or
gani
zatio
n 32
7%
13
1 29
%
53
12%
19
4 44
%
35
8%
3.2
Job
dutie
s ar
e cl
early
def
ined
15
3%
74
17
%
78
18%
25
2 57
%
25
6%
3.4
Info
rmat
ion
is s
hare
d w
ith o
nly
thos
e w
ho
need
to k
now
8
2%
103
23%
95
21
%
202
46%
35
8%
3.
3
Em
ploy
ees
are
enco
urag
ed to
take
re
spon
sibi
lity
1 0%
19
4%
47
11
%
273
61%
10
7 24
%
4.0
Due
to ro
undi
ng, t
he v
alid
per
cent
ages
may
not
tota
l 100
%; v
alid
per
cent
ages
do
not i
nclu
de m
issi
ng re
spon
ses.
Fa
ctor
load
ing
and
the
coef
ficie
nt a
lpha
sco
re d
id n
ot ju
stify
trea
ting
thes
e ite
ms
as a
sca
le.

Wor
ldat
Wor
k R
ewar
ds A
lignm
ent S
urve
y19
Ta
ble
9 O
rgan
izat
ion
Stru
ctur
e –
Team
Bas
ed
In m
y or
gani
zatio
n:
Stro
ngly
D
isag
ree
Nei
ther
Agr
ee
Agr
ee
Stro
ngly
M
ean
Scor
e D
isag
ree
(1)
(2)
nor D
isag
ree
(3)
(4)
Agr
ee (5
)
#Va
lid %
#Va
lid %
#Va
lid %
#Va
lid %
#Va
lid %
Wor
k in
our
org
aniz
atio
n is
hig
hly
team
-ba
sed
3 1%
77
17
%
113
25%
20
0 45
%
53
12%
3.
5
Dec
isio
n-m
akin
g pr
oces
ses
are
high
ly
dece
ntra
lized
37
8%
18
1 41
%
90
20%
11
1 25
%
22
5%
2.8
Em
ploy
ees
have
con
side
rabl
e in
put i
nto
deci
sion
s th
at a
ffect
them
20
5%
17
5 40
%
137
31%
10
3 23
%
8 2%
2.
8
Em
ploy
ees
are
enco
urag
ed to
take
re
spon
sibi
lity
1 0%
19
4%
47
11
%
273
61%
10
7 24
%
4.0
Coe
ffici
ent A
lpha
= .5
6 A
vera
ge M
easu
re S
core
3.3
Due
to ro
undi
ng, t
he v
alid
per
cent
ages
may
not
tota
l 100
%; v
alid
per
cent
ages
do
not i
nclu
de m
issi
ng re
spon
ses.

Wor
ldat
Wor
k R
ewar
ds A
lignm
ent S
urve
y20
Ta
ble
10
P
ay S
truc
ture
Stro
ngly
D
isag
ree
Nei
ther
Agr
ee
Agr
ee
Stro
ngly
M
ean
Scor
e D
isag
ree
(1)
(2)
nor D
isag
ree
(3)
(4)
Agr
ee (5
)
#Va
lid %
#Va
lid %
#Va
lid %
#Va
lid %
#Va
lid %
Pay
rang
es a
re v
ery
wid
e. M
axim
ums
are
mor
e th
an 9
0% h
ighe
r tha
n m
inim
ums
93
21%
22
0 50
%
47
11%
61
14
%
16
4%
2.3
Our
org
aniz
atio
n ha
s a
tradi
tiona
l pay
st
ruct
ure
with
gra
des
and
rang
es
46
10%
58
13
%
21
5%
234
53%
81
18
%
3.6
Inte
rnal
com
pany
val
ues
(e.g
., jo
b ev
alua
tion)
are
prim
arily
use
d to
de
term
ine
job
valu
e 42
10
%
159
36%
73
17
%
137
31%
31
7%
2.
9
Ext
erna
l val
ues
(e.g
., pa
y su
rvey
s) a
re
prim
arily
use
d to
det
erm
ine
job
valu
e or
pa
y 8
2%
37
8%
48
11%
24
7 56
%
105
24%
3.
9
Line
man
ager
s ha
ve p
rimar
y in
fluen
ce
over
pay
dec
isio
ns
9 2%
10
6 24
%
82
18%
21
5 48
%
33
7%
3.4
Hum
an re
sour
ces
or th
e co
mpe
nsat
ion
depa
rtmen
t has
prim
ary
influ
ence
ove
r pa
y de
cisi
ons
18
4%
16
9 38
%
110
25%
12
7 29
%
20
5%
2.9
Due
to ro
undi
ng, t
he v
alid
per
cent
ages
may
not
tota
l 100
%; v
alid
per
cent
ages
do
not i
nclu
de m
issi
ng re
spon
ses.
D
iver
se s
et o
f pay
pra
ctic
es is
not
inte
nded
to fo
rm a
sca
le.

Wor
ldat
Wor
k R
ewar
ds A
lignm
ent S
urve
y21
Tabl
e 11
C
ompe
titiv
e Po
sitio
n of
Pay
Bel
ow
At
Abo
ve
Don
’t K
now
/ M
ean
Scor
e M
edia
n (1
) M
edia
n (2
) M
edia
n (3
) N
ot A
vaila
ble
#
Valid
%#
Valid
%#
Valid
%#
Base
sal
ary
stru
ctur
es
45
10%
34
3 79
%
44
10%
15
2.
0
Tota
l ann
ual c
ash
com
pens
atio
n (b
ase
pay
plus
ta
rget
sho
rt-te
rm in
cent
ives
) 62
15
%
233
58%
10
7 27
%
43
2.1
Tota
l dire
ct c
ompe
nsat
ion
stru
ctur
es (b
ase
cash
pl
us ta
rget
sho
rt- a
nd lo
ng-te
rm in
cent
ives
) 67
18
%
195
53%
10
8 29
%
71
2.1
Due
to ro
undi
ng, t
he v
alid
per
cent
ages
may
not
tota
l 100
%; v
alid
per
cent
ages
do
not i
nclu
de m
issi
ng re
spon
ses.
Tabl
e 12
Pe
rfor
man
ce M
easu
rem
ent -
Acc
urac
y
Stro
ngly
D
isag
ree
Nei
ther
Agr
ee
Agr
ee
Stro
ngly
M
ean
Scor
e D
isag
ree
(1)
(2)
nor D
isag
ree
(3)
(4)
Agr
ee (5
)
#Va
lid %
#Va
lid %
#Va
lid %
#Va
lid %
#Va
lid %
Indi
vidu
al e
mpl
oyee
per
form
ance
is
accu
rate
ly m
easu
red
17
4%
94
21%
12
0 27
%
189
43%
24
5%
3.
2
Team
, dep
artm
ent o
r uni
t per
form
ance
is
accu
rate
ly m
easu
red
17
4%
112
25%
13
1 30
%
165
37%
16
4%
3.
1
Org
aniz
atio
n pe
rform
ance
is a
ccur
atel
y m
easu
red
9 2%
39
9%
65
15
%
261
59%
70
16
%
3.8
Coe
ffici
ent A
lpha
= .7
8 A
vera
ge M
easu
re S
core
3.4
Due
to ro
undi
ng, t
he v
alid
per
cent
ages
may
not
tota
l 100
%; v
alid
per
cent
ages
do
not i
nclu
de m
issi
ng re
spon
ses.

Wor
ldat
Wor
k R
ewar
ds A
lignm
ent S
urve
y22
Ta
ble
13
Perf
orm
ance
Mea
sure
men
t - N
umbe
r of A
sses
sors
Stro
ngly
D
isag
ree
Nei
ther
Agr
ee
Agr
ee
Stro
ngly
M
ean
Scor
e D
isag
ree
(1)
(2)
nor D
isag
ree
(3)
(4)
Agr
ee (5
)
#Va
lid %
#Va
lid %
#Va
lid %
#Va
lid %
#Va
lid %
Em
ploy
ee p
erfo
rman
ce is
mea
sure
d fro
m
mul
tiple
per
spec
tives
, whi
ch m
ay in
clud
e cu
stom
ers,
sub
ordi
nate
s an
d pe
ers
(Rev
erse
d ite
m)
41
9%
202
45%
86
19
%
104
23%
13
3%
3.
3
Em
ploy
ee p
erfo
rman
ce is
prim
arily
m
easu
red
by tr
aditi
onal
per
form
ance
ap
prai
sal c
ompl
eted
onl
y by
his
/her
su
perv
isor
/man
ager
12
3%
44
10%
36
8%
28
4 64
%
71
16%
3.
8
Due
to ro
undi
ng, t
he v
alid
per
cent
ages
may
not
tota
l 100
%; v
alid
per
cent
ages
do
not i
nclu
de m
issi
ng re
spon
ses.

Wor
ldat
Wor
k R
ewar
ds A
lignm
ent S
urve
y23
Ta
ble
14
Pay
Varia
bilit
y
In m
y or
gani
zatio
n:
Stro
ngly
D
isag
ree
Nei
ther
Agr
ee
Agr
ee
Stro
ngly
M
ean
Scor
e D
isag
ree
(1)
(2)
nor D
isag
ree
(3)
(4)
Agr
ee (5
) #
Valid
%#
Valid
%#
Valid
%#
Valid
%#
Valid
%
Bas
e sa
lary
incr
ease
per
cent
ages
for
supe
rior p
erfo
rmer
s ar
e at
leas
t tw
o tim
es th
e si
ze o
f inc
reas
es re
ceiv
ed b
y av
erag
e pe
rform
ers
57
13%
22
7 52
%
70
16%
72
16
%
14
3%
2.5
Sup
erio
r per
form
ers
are
paid
sig
nific
antly
la
rger
ann
ual s
alar
ies
then
are
ave
rage
pe
rform
ers
(at l
east
10%
mor
e)
40
9%
198
45%
10
1 23
%
88
20%
13
3%
2.
6
Ther
e is
sig
nific
ant v
aria
tion
in a
nnua
l in
cent
ive
payo
uts
betw
een
supe
rior a
nd
aver
age
indi
vidu
al p
erfo
rmer
s 52
12
%
173
40%
81
19
%
105
24%
26
6%
2.
7
Hig
h pe
rform
ers
are
muc
h m
ore
likel
y to
be
pro
mot
ed th
an a
vera
ge p
erfo
rmer
s
5 1%
30
7%
40
9%
29
1 66
%
75
17%
3.
9
Em
ploy
ees
can
earn
sig
nific
antly
mor
e if
the
busi
ness
uni
t or t
he o
rgan
izat
ion
perfo
rms
wel
l 21
5%
84
19
%
78
18%
18
4 42
%
67
15%
3.
4
Em
ploy
ees
can
earn
sig
nific
antly
mor
e if
thei
r tea
m, w
ork
unit
/ dep
artm
ent o
r the
or
gani
zatio
n pe
rform
s w
ell
34
8%
14
7 34
%
116
27%
11
2 26
%
22
5%
2.9
Our
org
aniz
atio
n pu
ts m
ore
pay
“at r
isk”
(i.
e., v
aria
ble
pay)
than
our
mai
n co
mpe
titor
s 54
12
%
194
44%
12
8 29
%
53
12%
11
3%
2.
5
*Ince
ntiv
e pa
y fo
cuse
s pr
imar
ily o
n ca
sh
awar
ds
11
3%
25
6%
56
13%
26
2 61
%
79
18%
3.
9
*Ince
ntiv
e pa
y fo
cuse
s pr
imar
ily o
n eq
uity
aw
ards
, sto
ck o
r a s
tock
eq
uiva
lent
*
126
30%
17
6 42
%
86
20%
31
7%
4
1%
2.1
Coe
ffici
ent A
lpha
= .7
7 A
vera
ge M
easu
re S
core
2.9
Due
to ro
undi
ng, t
he v
alid
per
cent
ages
may
not
tota
l 100
%; v
alid
per
cent
ages
do
not i
nclu
de m
issi
ng re
spon
ses.
* I
tem
was
not
incl
uded
in th
is s
cale
.

Wor
ldat
Wor
k R
ewar
ds A
lignm
ent S
urve
y24
Ta
ble
15
Pay
Com
mun
icat
ion
Stro
ngly
D
isag
ree
Nei
ther
Agr
ee
Agr
ee
Stro
ngly
M
ean
Scor
e D
isag
ree
(1)
(2)
nor D
isag
ree
(3)
(4)
Agr
ee (5
)
#Va
lid %
#Va
lid %
#Va
lid %
#Va
lid %
#Va
lid %
Em
ploy
ees
know
the
pay
rang
es fo
r the
ir pa
y gr
ade
or p
ositi
on
67
15%
11
7 26
%
79
18%
14
4 33
%
36
8%
2.9
Em
ploy
ees
know
wha
t the
pay
rang
es
are
for t
he g
rade
or t
he p
ositi
ons
imm
edia
tely
abo
ve th
eir o
wn
87
20%
17
9 40
%
83
19%
76
17
%
17
4%
2.5
Com
pens
atio
n pr
ogra
m in
form
atio
n is
sh
ared
ope
nly
by th
e or
gani
zatio
n 55
12
%
154
35%
77
17
%
130
29%
30
7%
2.
8
Em
ploy
ees
have
ver
y lim
ited
unde
rsta
ndin
g of
why
they
are
pai
d w
hat
they
are
pai
d (R
ever
sed
Item
) 17
4%
12
8 29
%
105
24%
16
0 36
%
36
8%
2.8
Coe
ffici
ent A
lpha
= .8
3 A
vera
ge M
easu
re S
core
2.8
Due
to ro
undi
ng, t
he v
alid
per
cent
ages
may
not
tota
l 100
%; v
alid
per
cent
ages
do
not i
nclu
de m
issi
ng re
spon
ses.

Wor
ldat
Wor
k R
ewar
ds A
lignm
ent S
urve
y25
Ta
ble
16
Non
-cas
h R
ewar
ds
Stro
ngly
D
isag
ree
Nei
ther
Agr
ee
Agr
ee
Stro
ngly
M
ean
Scor
e D
isag
ree
(1)
(2)
nor D
isag
ree
(3)
(4)
Agr
ee (5
)
#Va
lid %
#Va
lid %
#Va
lid %
#Va
lid %
#Va
lid %
My
orga
niza
tion
has
effe
ctiv
e no
n-m
onet
ary
prog
ram
s fo
r rec
ogni
zing
em
ploy
ee p
erfo
rman
ce
27
6%
159
36%
10
9 24
%
125
28%
25
6%
2.
9
My
orga
niza
tion
prov
ides
num
erou
s de
velo
pmen
t opp
ortu
nitie
s fo
r em
ploy
ees
13
3%
83
19%
10
3 23
%
215
48%
32
7%
3.
4
My
orga
niza
tion
rew
ards
em
ploy
ees
with
tim
e of
f for
goo
d pe
rform
ance
11
8 27
%
250
56%
48
11
%
25
6%
4 1%
2.
0
My
orga
niza
tion
give
s em
ploy
ees
spec
ial
perk
s an
d am
eniti
es fo
r goo
d pe
rform
ance
suc
h as
spe
cial
par
king
sp
ots,
clu
b m
embe
rshi
p an
d di
nner
s ou
t
120
27%
23
7 53
%
36
8%
50
11%
2
0%
2.0
Ther
e ar
e of
ten
grou
p ce
lebr
atio
ns fo
r at
tain
ing
perfo
rman
ce g
oals
or f
or s
peci
al
even
ts
39
9%
129
29%
91
21
%
163
37%
21
5%
3.
0
My
orga
niza
tion
has
flexi
ble
wor
k sc
hedu
les
to a
ccom
mod
ate
empl
oyee
ne
eds
21
5%
64
14%
71
16
%
227
51%
62
14
%
3.6
My
orga
niza
tion
stro
ngly
atte
mpt
s to
m
aint
ain
job
secu
rity
for h
igh
perfo
rmin
g em
ploy
ees
9 2%
39
9%
79
18
%
237
53%
81
18
%
3.8
Coe
ffici
ent A
lpha
= .6
6 A
vera
ge M
easu
re S
core
2.9
Due
to ro
undi
ng, t
he v
alid
per
cent
ages
may
not
tota
l 100
%; v
alid
per
cent
ages
do
not i
nclu
de m
issi
ng re
spon
ses.

Wor
ldat
Wor
k R
ewar
ds A
lignm
ent S
urve
y26
Tabl
e 17
C
ompe
nsat
ion
Prog
ram
s R
einf
orce
Org
aniz
atio
n Ef
fect
iven
ess
The
com
pens
atio
n pr
ogra
ms
rein
forc
e th
e im
port
ance
of t
he:
Stro
ngly
D
isag
ree
Nei
ther
Agr
ee
Agr
ee
Stro
ngly
M
ean
Scor
e D
isag
ree
(1)
(2)
nor D
isag
ree
(3)
(4)
Agr
ee (5
)
#Va
lid %
#Va
lid %
#Va
lid %
#Va
lid %
#Va
lid %
Org
aniz
atio
n’s
finan
cial
per
form
ance
10
2%
37
8%
40
9%
23
6 53
%
120
27%
3.
9
Cus
tom
er s
atis
fact
ion
12
3%
97
22%
97
22
%
199
45%
36
8%
3.
3
Inte
rnal
pro
cess
es
14
3%
119
27%
12
7 29
%
170
38%
12
3%
3.
1
Hum
an c
apita
l dev
elop
men
t (i.e
., em
ploy
ee d
evel
opm
ent)
20
5%
123
28%
12
0 27
%
162
37%
16
4%
3.
1
Coe
ffici
ent A
lpha
= .6
5 A
vera
ge M
easu
re S
core
3.4
Due
to ro
undi
ng, t
he v
alid
per
cent
ages
may
not
tota
l 100
%; v
alid
per
cent
ages
do
not i
nclu
de m
issi
ng re
spon
ses.
Tabl
e 18
C
ompe
nsat
ion
Prog
ram
s R
einf
orce
Org
aniz
atio
n C
ultu
re
The
com
pens
atio
n pr
ogra
ms
rein
forc
e a
cultu
re o
f:
Stro
ngly
D
isag
ree
Nei
ther
Agr
ee
Agr
ee
Stro
ngly
M
ean
Scor
e D
isag
ree
(1)
(2)
nor D
isag
ree
(3)
(4)
Agr
ee (5
)
#Va
lid %
#Va
lid %
#Va
lid %
#Va
lid %
#Va
lid %
Cre
ativ
ity a
nd in
nova
tion
16
4%
112
26%
13
6 31
%
157
36%
15
3%
3.
1
Indi
vidu
al p
erfo
rman
ce
9 2%
32
7%
44
10
%
272
61%
87
20
%
3.9
Col
labo
ratio
n an
d te
amw
ork
14
3%
60
14
%
113
26%
21
5 49
%
39
9%
3.5
Coe
ffici
ent A
lpha
= .6
8 A
vera
ge M
easu
re S
core
3.5
Due
to ro
undi
ng, t
he v
alid
per
cent
ages
may
not
tota
l 100
%; v
alid
per
cent
ages
do
not i
nclu
de m
issi
ng re
spon
ses.

Wor
ldat
Wor
k R
ewar
ds A
lignm
ent S
urve
y27
Ta
ble
19
Con
sist
ency
of S
trat
egy
Acr
oss
Bus
ines
s U
nits
Acr
oss
busi
ness
uni
ts, m
y or
gani
zatio
n’s:
Hig
hly
Inco
nsis
tent
N
eith
er C
onsi
sten
t C
onsi
sten
t H
ighl
y M
ean
Scor
e In
cons
iste
nt (1
) (2
) no
r Inc
onsi
sten
t (3)
(4
) C
onsi
sten
t (5)
# Va
lid %
#Va
lid %
#Va
lid %
#Va
lid %
#Va
lid %
Bus
ines
s st
rate
gy is
7
2%
48
11%
76
17
%
260
59%
48
11
%
3.7
HR
stra
tegy
is
9 2%
54
12
%
67
15%
27
0 61
%
41
9%
3.6
Com
pens
atio
n st
rate
gy is
8
2%
61
14%
72
16
%
256
58%
45
10
%
3.6
Coe
ffici
ent A
lpha
= .8
2 A
vera
ge M
easu
re S
core
3.6
Due
to ro
undi
ng, t
he v
alid
per
cent
ages
may
not
tota
l 100
%; v
alid
per
cent
ages
do
not i
nclu
de m
issi
ng re
spon
ses.
Tabl
e 20
A
lignm
ent B
usin
ess
Stra
tegy
My
orga
niza
tion’
s:
Hig
hly
Una
ligne
d N
eith
er A
ligne
d A
ligne
d H
ighl
y M
ean
Scor
e U
nalig
ned
(1)
(2)
nor U
nalig
ned
(3)
(4)
Alig
ned
(5)
#
Valid
%#
Valid
%#
Valid
%#
Valid
%#
Valid
%
Bus
ines
s st
rate
gy a
nd H
R s
trate
gy a
re
7 2%
39
9%
10
7 24
%
249
57%
37
8%
3.
6 B
usin
ess
stra
tegy
and
org
aniz
atio
n st
ruct
ure
are
4 1%
32
7%
99
23
%
265
61%
38
9%
3.
7
Bus
ines
s st
rate
gy a
nd c
ompe
nsat
ion
stra
tegy
are
6
1%
61
14%
13
7 31
%
210
48%
26
6%
3.
4
Coe
ffici
ent A
lpha
= .8
6 A
vera
ge M
easu
re S
core
3.6
Due
to ro
undi
ng, t
he v
alid
per
cent
ages
may
not
tota
l 100
%; v
alid
per
cent
ages
do
not i
nclu
de m
issi
ng re
spon
ses.

Wor
ldat
Wor
k R
ewar
ds A
lignm
ent S
urve
y28
Ta
ble
21
Rat
ed E
ffect
iven
ess
of B
usin
ess,
HR
and
Com
pens
atio
n St
rate
gy
Plea
se in
dica
te h
ow y
our o
rgan
izat
ion
com
pare
d to
its
com
petit
ors,
on
aver
age,
ov
er th
e pa
st T
HR
EE y
ears
.
Low
est (
1)
(1-2
0%)
Low
er (2
) (2
1-40
%)
Mid
dle
(3)
(41-
60%
) N
ext (
4)
(61-
80%
) To
p (5
) (8
0-10
0%)
Not
A
pplic
able
M
ean
Scor
e
#
Valid
%#
Valid
%#
Valid
%
# Va
lid %
#Va
lid %
#
How
wou
ld y
ou ra
te th
e ef
fect
iven
ess
of
the
busi
ness
stra
tegy
? 3
1%
32
9%
126
34%
11
9 32
%
95
25%
47
%
3.7
How
wou
ld y
ou ra
te th
e ef
fect
iven
ess
of
the
HR
stra
tegy
? 9
2%
47
12%
15
8 42
%
120
32%
43
11
%
46%
3.
4
How
wou
ld y
ou ra
te th
e ef
fect
iven
ess
of
the
com
pens
atio
n st
rate
gy?
14
4%
49
13%
16
6 44
%
111
30%
36
10
%
47%
3.
3
Coe
ffici
ent A
lpha
= .8
3 A
vera
ge M
easu
re S
core
3.5
Due
to ro
undi
ng, t
he v
alid
per
cent
ages
may
not
tota
l 100
%; v
alid
per
cent
ages
do
not i
nclu
de m
issi
ng re
spon
ses.
Ta
ble
22
Org
aniz
atio
n Ef
fect
iven
ess
Plea
se in
dica
te h
ow y
our o
rgan
izat
ion
com
pare
d to
its
com
petit
ors,
on
aver
age,
ov
er th
e pa
st T
HR
EE y
ears
.
Low
est (
1)
(1-2
0%)
Low
er (2
) (2
1-40
%)
Mid
dle
(3)
(41-
60%
) N
ext (
4)
(61-
80%
) To
p (5
) (8
0-10
0%)
Not
A
pplic
able
M
ean
Scor
e
#
Valid
%#
Valid
%#
Valid
%
# Va
lid %
#Va
lid %
#
Ove
rall
orga
niza
tion
perfo
rman
ce
4 1%
25
7%
12
2 33
%
118
32%
10
5 28
%
48
3.8

Wor
ldat
Wor
k R
ewar
ds A
lignm
ent S
urve
y29
Tabl
e 23

Wor
ldat
Wor
k R
ewar
ds A
lignm
ent S
urve
y30
Ta
ble
24
Fort
une’
s M
ost A
dmire
d C
ompa
nies
(MA
C) A
naly
sis
Com
pute
d Sc
ale
MA
C (‘
07 &
‘08)
N
on-M
AC
C
ontr
ol G
roup
C
ost R
educ
tion
3.7
3.6
Qua
lity
Def
ende
r 4.
0 4.
0 P
rosp
ecto
r 3.
8 3.
4 N
one
or In
cons
iste
nt
2.2
2.5
Org
aniz
atio
n C
entra
lizat
ion
3.6
3.3
Org
aniz
atio
n S
truct
ure
- Tea
m B
ased
3.
3 3.
3 P
erfo
rman
ce M
easu
rem
ent -
Acc
urac
y 3.
8 3.
3 P
ay V
aria
bilit
y 3.
2 2.
9 P
ay C
omm
unic
atio
n 2.
8 2.
7 N
on-C
ash
Rew
ards
3.
2 2.
9 C
omp
Pro
gram
s R
einf
orce
Org
Effe
ctiv
enes
s 3.
5 3.
3 C
omp
Pro
gram
s R
einf
orce
Org
Cul
ture
3.
7 3.
4 C
onsi
sten
cy o
f Stra
tegy
Acr
oss
BU
3.
8 3.
6 A
lignm
ent B
usin
ess
Stra
tegy
3.
8 3.
5 R
ated
Effe
ctiv
enes
s B
usin
ess,
HR
, Com
p S
trate
gy
3.6
3.4