a survey of reynolds number and wing geometry effects · pdf filenasa contractor report 4745 a...
TRANSCRIPT
NASA Contractor Report 4745
A Survey of Reynolds Number and WingGeometry Effects on Lift Characteristics in theLow Speed Stall Region
Edward C. Polhamus, Consultant ° Newport News, Virginia
National Aeronautics and Space AdministrationLangley Research Center • Hampton, Virginia 23681-0001
Prepared for Langley Research Centerunder Purchase Order L21824C
June 1996
https://ntrs.nasa.gov/search.jsp?R=19970001869 2018-04-25T07:48:04+00:00Z

Printed copies available from the following:
NASA Center for AeroSpace Information
800 Elkridge Landing Road
Linthicum Heights, MD 21090-2934
(301) 621-0390
National Technical Information Service (NTIS)
5285 Port Royal Road
Springfield, VA 22161-2171
(703) 487-4650

TABLE OF CONTENTS
SUMMARY
INTRODUCTION
1. LEADING EDGE SEPARATION ON AIRFOILS1.1 Early Research
1.2 Classification of Stall Types1.3 Experimental Results Related to Stall
1.3.1 Effects of profile on separation and stall1.3.2 Influence of Reynolds number on stall
1.4 Stall Boundaries1.5Airfoil Maximum Lift Coefficients
2. EDGE SEPARATIONS ON RECTANGULAR WINGS
2.1 Sources of Edge Separation2.2 Prediction Methods
2.2.1 Some early studies2.2.2 Development of an approximate method
2.3 Comparision of Predictions and Experiments2.3.1 Effect of aspect ratio on root stall
2.3.2 Effect of aspect ratio on overall wing stall2.3.3 Reynolds number influence on wing stall
3. SWEPTBACK WINGS
3.1 Some Early Research3.2 Some Types of Flow
3.2.1 Tip stall
3.2.2 Leading-edge separation bubble3.2.3 Leading-edge vortex lift
3.3 General Effects of Sweep and Reynolds Number3.3.1 Predictions of turbulent reseparation3.3.2 Overall lift characteristics
3.3.3 Summary of maximum lift3.4 Influence of Reynolds Number on Local Flow
3.4.1 Prediction of turbulent resparation4. SLENDER DELTA WINGS
4.1 Analysis Methods4.1.1 Induced camber distributions4.1.2 Vortex-flow theories
4.2 Sharp Leading-Edge Delta Wing Reynolds Number Studies4.2.1 Overall lift characteristics
4.2.2 Secondary - vortex flow4.2.3 Maximum lift coefficient
4.3 Round Leading-Edge Delta Wings4.3.1 Effect of profile
5. CONCLUDING REMARKS6. APPENDIX
7. SYMBOLS8. REFERENCES9. ACKNOWLEDGEMENT
2
3
55577
11121416161718182222263032323434
35353637404346464949495154
54565860
6062
64666875

SUMMARY
This paper presents a survey of the effects of Reynolds number on the low-
speed lift characteristics of wings encountering separated flows at their leading
and side edges, with emphasis on the region near the stall. The influence of
leading-edge profile and Reynolds number on the stall characteristics of two-
dimensional airfoils are reviewed first to provide a basis for evaluating three-
dimensional effects associated with various wing planforms. This is followed by
examples of the effects of Reynolds number and geometry on the lift
characteristics near the stall for a series of three-dimensional wings typical of
those suitable for high-speed aircraft and missiles. Included are examples of
the effects of wing geometry on the onset and spanwise progression of turbulent
reseparation near the leading edge and illustrations of the degree to which
simplified theoretical approaches can be useful in defining the influence of the
various geometric parameters.
Also illustrated is the manner in which the Reynolds number and wing
geometry parameters influence whether the turbulent reseparation near the
leading edge results in a sudden loss of lift, as in the two-dimensional case, or
the formation of a leading-edge vortex with
gentle stall as in the highly swept wing case.
the strong influence of "induced camber"
reseparation.
its increase in lift followed by a
Particular emphasis is placed on
on the development of turbulent
It is believed that the examples selected for this report may be useful in
evaluating viscous flow solutions by the new computational methods based on
the Navier-Stokes equations as well as defining fruitful research areas for the
high-Reynolds-number wind tunnels.
2

INTRODUCTION
While the geometric characteristics of wings for high-speed aircraft and missiles
are widely varied, they tend to have a common susceptibility to leading-edge and side-
edge separations which can play an important role with regard to their low speed lift in
the stall region. Because of their speed requirements they often utilize thin wings
having relatively sharp leading and side edges which, of course, tend to promote
Reynolds number dependent boundary-layer separations in the vicinity of these
edges. These edge separations are also influenced by planform through the
aerodynamic induction effects on the pressure gradients in the edge regions. The
planforms used for high speed applications include, for example, the low-aspect-ratio
rectangular planforms often used for missiles, the moderately sweptback moderate-
aspect-ratio wings of transonic aircraft, and the higher swept slender delta type often
applied to supersonic and hypersonic vehicles. These planform variations contribute
a variety of influences on the boundary-layer characteristics leading to separation as
well as influencing the type of overall wingflow produced by the separation. Thus, the
effects of Reynolds number, of primary interest in this paper, are greatly influenced by
these geometric parameters. For example, not only is the onset and spanwise
progression of turbulent reseparation aft of the leading-edge transitional bubble
dependent on these factors, but whether this separation results in a sudden loss of lift
or in the formation of a separation induced edge vortex with its resulting increase in lift
also depends on these factors.
Although the various types of edge separations are well documented in the
literature it is felt that a survey paper tying together the relation between two
dimensional and various three dimensional effects might be found useful. The
purpose of this paper is therefore to review examples from selected experimental
studies that provide parametric illustrations of the interacting effects of wing geometry
and Reynolds number on the lift characteristics in the low speed stall region for wings

encountering the above types of edge separations. Such a review should provide
some assistance in selecting critical viscous flow cases for use in evaluating new
design and analysis methods such as those based on the Navier-Stokes equations as
well as indicating areas needing additional research utilizing the relatively new high
Reynolds number wind tunnels. The experimental data selected and the simplified
prediction methods utilized provide a viscous flow analysis capability sometimes not
easily extracted from available experimental data or from a particular computational
code.
To accomplish the above purpose the paper is divided into sections dealing with
four classes of wing planform. First, a review of the influences of geometry and
Reynolds number on the types of separations encountered in the leading-edge region
and their influence on stalling for a parametric series of two-dimensional airfoils will be
made. This will be followed by two sections illustrating the influences of three-
dimensional effects associated with finite span and leading-edge sweep on turbulent
reseparation in the leading-edge region as well as examples of leading-edge and
side-edge vortex lift. In addition to experimental examples relatively simple theoretical
approaches are used to illustrate the influence of wing planform on induced camber
and its effect on turbulent reseparation and stall.
The final section deals primarily with slender delta planforms having vortex flow
originating at sharp leading-edges. In addition to parametric experimental results
several vortex-flow theories are utilized as a means of isolating various influences
such as the leading-edge vortex trajectory and breakdown on the stall.
It should be noted that the examples used are limited to planar wings and no
discussion of warped wings or flow control devices is included. Throughout the text,
brief mention is made of some of the early research in various areas which might be of
historical interest.
4

1. LEADING-EDGE SEPARATION ON AIRFOILS
1.1Early Research
Lanchester (1907) discussed
associated with a leading-edge
the probability of a small pocket of "dead water"
separation on thin airfoils accompanying a small
increase in angle of attack beyond the design condition and a completely separated
region at some higher angle. However, it was not until the early 1930's that research
such as that by Jacobs (1931), Millikan and Klein (1933), and Jones (1933, 1934)
began to clearly identify the role of the boundary layer and Reynolds number on airfoil
stall characteristics. As a result of his research, Jones identified a trailing-edge stall
and two types of leading-edge stall - one associated with a round leading edge and
the other associated with a sharp leading edge.
Research on leading-edge separation began to accelerate in the late 1930's (see
Jacobs and Sherman (1937) for example) due to the interest in thin wings to alleviate
compressibility effects. Probably the earliest proposal of a mechanism for the
formation of a laminar separation bubble was that of von Doenhoff (1938). Systematic
experimental studies of leading-edge separation on airfoils began following World
War II with those of Loftin and Bursnall (1948) and McCullough and Gault (1951)
providing much of the basis for stall classification and a review of this research has
been made by Tani (1964).
1.2Classification of Stall Types
The types of leading-edge separation to be described here will, in general, be
identified by their influence on the airfoil stalling characteristics as classified by
McCullough and Gault (1951) and Gault (1957), but will be limited to symmetrical
airfoils to be consistent with the subsequent review of three-dimensional wing stalling
characteristics.
The three types of leading-edge separations are those leading to (a) thin-airfoil
stall, (b) leading-edge stall, and (c) combined trailing-edge and leading-edge stall,
5

and are illustrated in figure 1.1. In the upper portion of the figure sketches of the
various boundary layer separation characteristics (not to scale) are presented for the
three stall classifications and the corresponding lift and stall characteristics are shown
in the lower part. Few details will be included here but will be discussed in connection
with subsequent detailed figures.
The thin-airfoil type of stall is illustrated in part (a) by a thin airfoil having a sharp
leading edge for which laminar separation occurs at the leading edge followed by
turbulent reattachment forming a separation bubble. The separation occurs as soon
as the angle of attack departs from zero and the reattachment point moves rearward
with increasing angle of attack. This expanding "long-type" bubble results in a rather
gentle stall as the reattachment point reaches the trailing-edge region. This type of
stall also occurs on round edge airfoils for certain combinations of leading-edge radius
and Reynolds number.
Part (b) of figure 1.1 illustrates the stall classified as a leading-edge stall which is
characterized by an abrupt loss of a large amount of lift occurring when an expanding
long bubble occurs at a relative high angle-of-attack such that its initial length is very
long. The long bubble is formed after a considerable contraction of the transitional
(short) bubble and in this paper its origin will be termed as the turbulent reseparation
point. Two mechanisms for this type of separation have been established. One is a
bursting of the transitional (short) bubble, for example, by Owen and Klanfer (1953),
Crabtree (1957), Gaster (1966), and Ingen (1975). The other is a turbulent separation
aft of the transitional (short) bubble attachment line, sometimes referred to as
"turbulent reseparation," with research by Wallis (1954), Hurley (1955), Evans and
Mort (1959), and Berg (1981) identifying this type as did studies on three-dimensional
wings by Poll (1983, 1986). Inasmuch as both of the above proposed mechanisms
involves the sudden formation of a long bubble subsequent to the turbulent attachment
6

forming the short (transitional) bubble, the term "turbulent reseparation" will be used
herein in relation to this type of long bubble.
The third classification of stall type, illustrated in part (c) of figure 1.1, is the
combined trailing-edge/leading-edge encountered as the leading-edge radius or
Reynolds number increases. This is a result of the leading-edge separation being
delayed until some angle-of-attack higher than that at which trailing-edge separation
has begun. As the trailing-edge separation moves forward with angle of attack, there
is a gradual reduction in the rate of lift growth. With further increases in angle of attack,
the pressure gradient in the leading region becomes sufficient to cause the turbulent
reseparation with its sudden stall.
It should be noted there that a fourth type of stall classified as a trailing-edge stall
which involves essentially no pronounced separation the leading-edge region will
receive no detailed analysis in this paper except to define the upper Reynolds number
limits of the other stalls. The trailing-edge stall is a gradual stall associated with the
forward movement of trailing-edge separation.
1.3 Experimental Results Related to Stall
The purpose of this section is to describe in more detail the primary flow
mechanisms contributing to the various type of airfoil stall illustrated in figure 1.1 by the
use of some selected results of two-dimensional wind tunnel studies of boundary-layer
separation and lift characteristics in the stall region. The first subsection deals with
some effects of airfoils profile while the second presents two examples of Reynolds
number effect.
1.3.1 Effects of profile on separation and stall
Summarized here are some results of an extensive and systematic series of wind
tunnel studies of the boundary-layer separation and stall characteristics for a series of
airfoils tested in the same facility at a Reynolds number of 5.8 x 10⁶ and a Mach
Number of 0.167 with free transition. This research covered a wide angle-of-attack

range and provided complete chordwise measurements of surface pressures and
boundary-layer velocity profiles in regions of the separation bubbles identified by the
liquid-film technique. The airfoils consisted of a sharp edge airfoil (double wedge)
with the data being published by Rose and Altman (1950) and three NACA 6-series
airfoils (64A006, 63-009, and 631-012) published by McCollough and Gault (1948,
1949) and by Gault (1949).
Using the data from the above studies figure 1.2 has been prepared to illustrate the
effect of angle of attack on the transitional (short) bubble turbulent reattachment
location, the angle of attack and chordwise location for turbulent reseparation, and the
variation with angle of attack of the location of the long-bubble reattachment. To
illustrate the influence of these effects on airfoil lift and stall characteristics figure, 1.3
presents the lift versus angle-of-attack data for the same airfoils obtained from the
above references. These two figures will be used together to describe the effects of
profile on separation and stall.
Turning to figure 1.2 the turbulent reattachment point, measured from leading edge
and normalized by the airfoil chord is shown in the bottom part of the figure at an
expanded scale to accurately cover the forward 2-percent of the airfoil chord and
provide details of the forward movement of transitional-bubble reattachment point with
increasing angle of attack. The vertical lines of arrows illustrate the rather sudden
transition from the contracted transitional bubble to the long bubble associated with
turbulent reseparation shown in the upper part of the figure. The upper part of the
figure covers the complete chord (note scale change) to allow total coverage of the
rearward travel of the subsequent long-bubble reattachment point with angle of attack.
Regarding the data for the double wedge (4.26-percent thick) it should be noted
that at angles of attack of 1° and 2° a separated flow region was observed, but no
accurate determination of its extent could be made. Beyond 3°, the long-bubble
reattachment point was reasonably well defined by boundary-layer profiles and
8

surface flow studies indicating a rather rapidly expanding long bubble with the
reattachment point reaching the trailing edge at about 7.5 ° angle of attack. Beyond this
angle of attack a thin-airfoil (long-bubble) type of stall occurs and a maximum lift
coefficient of about 0.83 is reached as seen in figure 1.3.
Since the upper surface velocity gradients in the leading-edge region have a
strong influence on the transitional (short) bubble development and the subsequent
turbulent reseparation the airfoil contour in that region is important. With their effects
generally occurring close to the leading-edge the leading-edge radius is often used as
a convenient and fairly successful parameter for correlating leading-edge contour
effects. Therefore, the leading-edge radius will be identified with the airfoils being
discussed and used later as a parameter for a summary correlation.
The data for the round leading-edge NACA 64A006 and 63-009 airfoils, which
have leading-edge radii of 0.26 and 0.63-percent chord respectively, provide excellent
examples of the transition from the short (transitional) bubble at low angles of attack to
the long bubble at higher angles of attack. This is followed by a sudden turbulent
reseparation and conversion to a long bubble with the reattachment point moving aft
with further increases in angle of attack at a rate somewhat similar to that observed for
the sharp-edge airfoil. The bubbles are located very near the leading edge and have
negligible effect on the airfoil characteristics.
For the 64A006 the turbulent reseparation onset occurs at a sufficiently low angle
of attack that the initial length of the resulting long-type bubble is relatively short, and
only a very slight "jog" in the lift curve occurs at an angle of attack of 5 °. As seen in
figure 1.3 this is not sufficient to cause stalling and is followed by an expanding long
bubble and a thin-airfoil type of stall similar to that for the double-wedge airfoil but
generating a slightly higher maximum lift coefficient of about 0.90. More information
on the slight "jog" that can precede the thin-airfoil type of stall and the leading-edge
type of stall can be found in the paper by McCullough (1955) dealing with a series of
9

symmetrical NACA 4-digit airfoils. The airfoils were relatively thin having thickness
ratios of 6 percent, 7 percent, 7.5 percent, and 8 percent and the angles-of-attack were
varied in small increments in the region of the jog and the stall. Briefly, the results
illustrate that as the thickness ratio and leading-edge radius increases the jog, or
discontinuity associated with turbulent reseparation, occurs at increasing lift coefficient
and becomes more pronounced until it produces a leading-edge type of stall as
illustrated by the NACA 63-009 airfoil in figure 1.3.
Retuming to figure 1.3 it is seen that for the 63-009 airfoil the larger leading-edge
radius relative to the 64A006 airfoil reduces the adverse pressure gradient and
turbulent reseparation is delayed to about 8.5 ° resulting in a higher maximum lift
coefficient of about 1.15. However, the delay in turbulent reseparation results in a
more aft turbulent reattachment with the longer bubble resulting in a sudden stall of the
leading-edge type followed by some lift recovery.
The data for the 631-012 airfoil, with its large leading-edge radius of 1.09 illustrates
a case where turbulent reseparation is delayed to about 13 ° resulting in an even
higher maximum lift coefficient of 1.5, but the resulting long bubble does not reattach
and a very large and sudden loss of lift occurs as seen in figure 1.3. Careful
inspection of the lift indicated some trailing-edge separation just prior to the sudden
leading-edge stall, thus placing the stall in the combined trailing-edge/leading-edge
category of figure 1.1.
It should be mentioned here that for this moderate Reynolds number of 5.8 x 10⁶
the transition from a combined trailing-edge/leading-edge type of stall to a pure
trailing-edge type does not occur until thickness ratios well beyond those of interest to
this paper are reached. However, as will be shown in the following sections this
situation changes at higher Reynolds numbers.
10

1.3.2. Influence of Reynolds number on stall
The above results, illustrating the transition of stall types from thin airfoil to leading
edge to the combined trailing edge/leading edge as the airfoil thickness and leading-
edge radius increases, were for a constant Reynolds of 5.8 x 10⁶. Similar transitions
can also occur with increasing Reynolds number for a given airfoil and examples are
presented in figure 1.4. Since there appears to be no data available for a single 6-
series airfoil that includes all of the types of stall two 9-percent thick 6-series airfoils
which differ only slightly in leading-edge radius will be used. These are the 66-009
having a leading-edge radius of 0.53-percent chord and the 64-009 having radius of
0.58-percent from the studies by Abbott et. al., (1945) and Loftin and Bursnall (1948)
respectively.
The data for the 66-009 airfoil is shown in part (a) and clearly illustrates the change
from a thin-airfoil type of stall at a Reynolds number of 3 x 10⁶ to a leading-edge type
of stall for the Reynolds numbers of 6 x 10⁶. Between the Reynolds number of 3 x 10⁶
and 6 x 10⁶, the transition to turbulent flow apparently moves forward sufficiently to
induce turbulent reattachment close to the leading edge resulting in a short bubble
followed, at an angle of attack of 10 °, by a turbulent reseparation. Since the
separation occurs at a relative high angle of attack, the bubble reattachment is
sufficiently far aft to cause a sudden leading-edge type of stall. Although not shown,
the resulting leading-edge stall is still evident at the highest test Reynolds number of 9
x 106 (see Abbott et. al., 1945). It should be noted that for these relatively sharp edged
airfoils any combined trailing-edge/leading-edge stall is probably confined to a rather
short range of Reynolds number if it occurs at all.
The high Reynolds number data in figure 1.4 (b) obtained with the NACA 64-009
airfoil which has a leading-edge radius, r/c, of 0.58-percent illustrates the transition
from a leading-edge to a trailing-edge type of stall. For a Reynolds number of 9 x 10⁶,
the stall is of the leading-edge type as for the NACA 66-009. At some Reynolds
!1

number between 9 x 10⁶ and 15 x 106, transition apparently occurs ahead of the
theoretical laminar separation point, thereby suppressing leading-edge separation,
and the stall becomes of the trailing-edge type.
For both of these airfoils, there is some evidence of a possible combined trailing
and leading-edge stall. However, for these relatively thin airfoils, trailing-edge
separation of sufficient chord extent to effect the lift does not occur until the angle of
attack has almost reached the condition for leading-edge stall. In this regard,
evidence will be seen in the next section that for the airfoils with larger values of
leading-edge radius the stall appears to the shift directly from the thin-airfoil type to the
combined trailing-edge/leading-edge type. This appears to be associated with the
forward movement of the transition to turbulent flow to the region ahead of the
theoretical laminar separation point, thereby delaying leading-edge separation until
trailing-edge separation has begun.
1.4Stall Boundaries
As a convenient way to summarize the influence of Reynolds number and airfoil
leading-edge contour on the type of stall experienced by a large number of
symmetrical NACA 6-series airfoils, a set of stall boundaries has been developed and
is presented in figure 1.5. This set of stall boundaries is similar to that developed
earlier by Gault (1957) for a large number of symmetrical and cambered airfoils
covering a wide range of thickness ratios. In an attempt to include thickness
distribution and camber into one velocity gradient parameter Gault selected, by trial
correlations, an upper surface ordinate (measured from the chord line) near the
leading-edge. Although the resulting correlation was fairly successful he pointed out
that the parameter has no apparent physical significance and that the correlation
seemed fortuitous. Due to this and the fact that the present study is limited to
uncambered airfoils the more physically significant, and often used, leading-edge
radius, which defines the surface curvature and therefore, is related to the upper
12

surface velocity gradients is used in the present set of stall boundaries. Since, as
shown in figure 1.2, the turbulent reseparation generally occurs ahead of the one-half
percent chord station for the types of airfoils of interest here, the leading-edge radius
appears particularly suitable.
Turning now to the stall boundaries of figure 1.5 it is seen that the data used to
establish the boundaries is limited to numerous symmetrical airfoils of the NACA 6
series tested over a wide range of Reynolds numbers in the Langley two-dimensional
Low-Turbulence Pressure Tunnel. The results are for the transition free condition and
based on data in the stall region reported by Abbott et. al. (1945), Loftin (1947), Loftin
and Bursnall (1948), and Loftin and Smith (1949). The correlation covers a chord
Reynolds number range of 7 x 10⁵ to 3 x 10⁷ and a leading edge radius, r/c, range
from 0.24-percent to 1.56-percent.
The combinations of Reynolds numbers and leading-edge radii that define the
approximate boundaries (cross hatched bands) between the various types of stall
have been established from the above data references using symbol types to identify
the type of stall for each test Reynolds number. Also shown by the dashed lines are
the vertical cut and the two horizontal cuts through the boundaries that are related to
figures 1.3 and 1.4. The boundaries appear to be reasonably well established but it
must be recognized that boundaries for other airfoil series will probably vary
somewhat, in particular the one defining the onset of trailing-edge stall due to the
influence of trailing-edge closure angle. However, for the lower thickness range of
interest in this paper it may not be too significant.
Finally, the correlation illustrates that in the high Reynolds number range the
boundaries are converging rather rapidly indicating the possibility that at some
Reynolds number above 20 x 107 there may only be two types of stall; the thin-airfoil
type and the trailing-edge type. Both, of course, produce a gradual variation of lift in
the stall region, the first produced by the gradual aft expansion of the long bubble and
13

the second associated with a gradual
separation.
1.5Airfoil Maximum Lift Coefficients
forward expansion of the trailing edge
The variation of the maximum lift coefficient of selected 6-series airfoils with
Reynolds number is summarized in figure 1.6. Again the data are limited to NACA 6-
series airfoils tested in the Langley two-dimensional Low-Turbulence Pressure Tunnel
and the maximum lift coefficients, for free transition are plotted against the chord
Reynolds number covering a range from 0.7 x 10⁶ to 3 x 10⁷ at Mach numbers no
greater than 0.15. Shown for reference are the thin-airfoil and the trailing-edge stall
regions taken from the stall boundaries of figure 1.5. For the purpose of this section
the leading-edge stall region and the trailing-edge/leading-edge stall region shown in
figure 1.5 are combined in figure 1.6 and fall, of course, between the two boundaries
shown.
As discussed earlier both the thin-airfoil type stall and the trailing-edge type stall
are similar in that the stall is rather gradual with the former associated with the gradual
downstream growth of the separation region and the latter with the gradual upstream
growth. However, there are several well-known differences in the magnitude of the
maximum lift coefficient in these two regions. In the thin-airfoil stall region where the
long separation bubble originates at a rather low angle of attack, the maximum lift
coefficients for this round-edge airfoil series are confined to a rather narrow range from
about 0.8 to about 1.0. In the trailing-edge stall region, which occurs in the high
Reynolds number range, the well known benefit of increasing leading-edge radius on
the maximum lift coefficient is observed. In this high Reynolds Number region
separation near the leading-edge is, of course, suppressed and as the leading-edge
radius increases the adverse pressure gradients decrease and reduce the turbulent
boundary-layer growth and the trailing-edge separation. The other characteristic of
interest is the lack of any appreciable increase in maximum lift with increasing
14
Reynolds number in this stall region. In this regard the reader is referred to Loftin and
Bursnall (1948) who discuss a possible regenerative process, involving the mutual
influence of trailing edge separation and leading-edge separation.
It should be pointed out that in the high Reynolds number range where the two
boundaries appear to converge it is possible that the 64-006 airfoil may have
transitioned from a thin-airfoil stall to a trailing-edge stall. However, with both types
experiencing a gradual stall and in the absence of pressure and moment data in the
high Reynolds number range, no attempt at clarification will be made.
Turning to the region between the above two stall-type boundaries it is seen that in
this region the maximum lift coefficient is a strong function of both Reynolds number
and airfoil contour with, for this series, the leading-edge radius being the dominant
contour parameter. As mentioned above, this region contains both the pure leading-
edge stall type and the combined trailing-edge/leading-edge stall type. However,
since both types encounter the sudden stall associated with turbulent reseparation (aft
of the transitioned bubble) which is of major importance in the following sections on
three-dimensional wings, the two regions are combined in figure 1.6. It is in this region
that both increasing Reynolds number and increasing leading-edge radius delay the
turbulent reseparation and the accompanying sudden stall to higher angles of attack
thereby increasing the maximum lift coefficient.
Much of the remainder of this paper deals with the manner in which various three-
dimensional induced effects associated with aspect ratio and sweep angle influence
the onset of turbulent reseparation and control the type of wing flow and stalling that
results. However, in general, these studies deal with wings which utilize airfoils other
than the NACA 6-series. Therefore, figures 1.7 and 1.8 present the maximum lift
coefficient variation with Reynolds number for the NACA 0012 and the ONERA "D"
airfoils respectively to provide the two-dimensional baseline data for use in illustrating
15

some of the three-dimensional effects involving Reynolds number variations to be
discussed later.
The NACA 0012 data in the low Reynolds number range was obtained in Langley
Two-Dimentional Low-Turbulence Tunnel and published by Loftin and Smith (1949)
while that above a Reynolds number of 2.0 x 10⁶ is from tests in the Langley Low
Turbulence Pressure Tunnel published by Ladson (1988). The Mach number effects
are shown only as an aid in extrapolating the ONERA "D" data as will be discussed
below. The NACA 0012 airfoil, which has a leading-edge radius of 1.58-percent
chord, has a trend with Reynolds number consistent with the 12-percent thick 6-series
airfoils of figure 1.6.
The ONERA "D" r/c = 10.5% airfoil data shown in figure 1.8, published by Erlich
(1969), was obtained by variations in free stream Mach number rather than tunnel
pressure and therefore encounters "shock stall" between a free stream Mach number
of 0.12 and 0.18 which is similar to the constant tunnel pressure (dashed) lines drawn
through the NACA 0012 data of figure 1.7. Based on the NACA 0012 shock free data
the ONERA "D" data is extrapolated (dashed line) to cover the shock free range of the
subsequent three-dimensional data. Although somewhat conjectural, this small
extrapolation it is believed to be sufficiently accurate for the purpose of this paper.
It should be noted here that for both of the above airfoils the type of stall was
independent of Mach number and remained of the trailing-edge/leading-edge type
since the shock occured in the leading-edge region.
2. EDGE SEPARATIONS ON RECTANGULAR WINGS
2.1 Sources of Edge Separation
Two sources of edge separation flows encountered on
influence their lift and stall characteristics are illustrated
illustrates, for the attached flow case, the type of change
rectangular wings that
in figure 2.1. Part (a)
in chordwise pressure
16
distribution that results from the chordwise variation of normal velocities induced on
the wing by the vortex wake associated with the three-dimensional flow. The resulting
changes are illustrated by comparing a typical upper surface pressure distribution at
the root section of a low aspect-ratio rectangular wing with that for a two dimensional
airfoil at the same section lift coefficient, cL. Of particular interest for this paper is the
increase in the adverse pressure gradient near the leading edge for the low aspect-
ratio wing, resulting from the fact that the downwash induced along the chord
increases in the downstream direction producing an effect analogous to "streamline
curvature" or "induced camber." This increase in the adverse pressure gradient
causes the three-dimensional wing to encounter leading-edge separation in the root
section at a lower section lift coefficient than in two dimensional flow. This effect of
induced camber increases with decreasing aspect ratio and is related to the well
known forward movement of the wing center-of-pressure which approaches the
leading-edge as the aspect ratio approaches zero.
Part (b) illustrates both the leading-edge separation bubble discussed above and
the side-edge separation which occurs for various combination of side-edge profile,
Reynolds number and lift coefficient. Associated with this side-edge separation is the
well known side-edge vortex flow and the resulting vortex-lift increment in the tip
region. The case illustrated is for the tip of revolution where the side-edge separation
origin is aft of the maximum span. The spanwise distribution of lifting pressure at an
x/c =0.8 shown in the lower sketch is representative of the vortex lift effect.
2.2 Prediction Methods
The primary purpose of this section is to develop approximate methods of including
the induced camber and vortex lift effects on the stall characteristics of rectangular
wings. In addition, comparisons with experimental results will be made for a range of
aspect ratio and Reynolds number. Because of the interest in this paper on Reynolds
number effects, only round leading-edge wings will be discussed in this section.
17

2.2.1 Some early studies
Until the mid 1930's "lifting-line theory," which ignored the influence of induced
camber, was the primary wing design method. This was satisfactory, in general, for the
moderate to high aspect ratio wings of that period and avoided the time consuming
effort required at that time to perform completely three-dimensional solutions.
Possibly the earliest detailed theoretical studies of the effect of induce camber on
the pressure distributions of low aspect-ratio rectangular wings with attached flow
were the approximate calculations of Fuchs (1939) and Wieghardt (1939). These
studies and others such as those performed by Lawrence (1951), and Lomax and
Sluder (1952), illustrated the increased pressure gradient at the leading edge,
associated with induced camber, for the attached, inviscid flow condition. The early
researchers, however, were primarily interested in the effect induced camber played in
the overall wing aerodynamic center variation with regard to aircraft stability since the
relatively thick, moderate-to-high aspect ratio, wings of the period usually encountered
trailing-edge, rather than leading-edge separation. Later, with the advent of
supersonic aircraft with thinner wings of low aspect-ratio, the effect of induced camber
on leading-edge separation began to play a more prominent role.
2.2.2 Development of an Approximate Method
One of the purposes of this paper is to develop an approximate method of
combining experimental two-dimensional airfoil data, such as that reviewed in section
1, with an induced camber method to predict the turbulent reseparation characteristics
of three-dimensional wings. The method developed in this section utilized an
approach similar to one developed by Polhamus (1955) for predicting the approximate
effect of induced camber on the overall lift-dependent profile drag for low aspect ratio
rectangular wings. Basically, this concept utilized the effect of induced camber on the
adverse upper surface pressure gradient in the leading-edge region of the three-
dimensional wings to establish an "effective" two-dimensional airfoil lift coefficient
18

having essentially this same adverse pressure gradient. The present method allows
this "effective" two-dimensional lift coefficient, Ct,cot,to be established at any spanwise
station desired, by utilizing lifting-surface theoretical solutions.
While any accurate lifting-surface solution could be used in the proposed method
by use of appropriate pressure gradient extraction techniques, the theory developed
by Multhopp (1950) uses an approach that is convenient for the present application.
The method developed herein can be described with the aid of figures 2.2 and 2.3.
Basically, the Multhopp method utilizes a series of continuous chordwise
distributions of circulation at discrete spanwise stations to satisfy the boundary
conditions. As shown in figure 2.2, these distributions include the so-called
"cotangent" loading that represents the pure angle-of-attack type (two-dimensional)
distribution and a series of "sine" Ioadings which represent various induced camber
distributions. The primary advantage of the Multhopp method lies in its use of the
"cotangent" loading term. However the same general approach could be applied to
other lifting surface methods.
As will be shown below, the pressure gradient associated with the cotangent
loading predominates in the leading-edge region where the turbulent reseparation, of
interest here, occurs. Therefore, it would be expected that the onset of turbulent
reseparation in the three-dimensional case would occur at the spanwise location
where the value of CL,cotreaches the value of the two-dimensional airfoil lift coefficient
corresponding to turbulent reseparation.
One of the simplifying assumptions in the method to be developed is that the
influence of induced camber on the upper surface adverse pressure gradient can be
approximated to sufficient accuracy by ignoring the effect of thickness. These "flat
plate" solutions for Ct,cotwill then be utilized in conjunction with the experimental data,
obtained with the appropriate airfoil section, at the desired Reynolds number, to
estimate the lift coefficient for the onset of turbulent reseparation in the three-
19
dimensional case. This use of the experimental data provides the major effect of
thickness.
The concept will be illustrated in figures 2.2 and 2.3 by use of the resulting ACp
distributions contributed by the "cotangent" and various "sine" Ioadings calculated by
the Lan and Lamar (1977) version of the Multhopp (1950) approach. For the readers
convenience, the relationships between the chord-loading series of Multhopp (1950)
and those of Lan and Lamar (1977), used herein are presented in the appendix. The
ACp distribution was selected because of its more direct relationship to lift coefficient.
For these "flat plate" solutions, a match of the ACp gradients also signifies a match of
the upper surface adverse pressure gradients. The expression for ACp is given by:
2 qo(rl) @ =o q,(rl) .ACp($,r/) = E[ c--_cot(_/_2)+ n_=l C"_-_ sln(n(P)]
where the q's are coefficients of the various chordwise Ioadings which are determined
by satisfying appropriate boundary conditions over the wing surface. The chordwise
station, x/c, is related to the angle _, as indicated in figure 2.2(a).
As an illustration of the types of chordwise Ioadings that are involved, figure 2.2(b)
presents the results obtained for a rectangular wing of aspect ratio 0.5. These results
are for the wing centerline at a section lift coefficient of 1.0. This very low aspect ratio
wing was selected because its large induced camber provides a clearer illustration of
the concept. The centerline location is chosen since that is where the turbulent
reseparation begins for rectangular wings.
For the solution shown in figure 2.2(b), four chordwise loading distributions were
utilized; the "cot _2" loading which represents the pure angle-of-attack loading, and
the first three "sine" Ioadings representing various induced camber Ioadings. It will be
noted that the cot _/2 and the sin _ Ioadings are, by far, the most prominent
contributors to the chordwise pressure distribution. The sin _ induced camber term
produces a large negative lift, due to the increasing downwash in the downstream
direction, which must be offset by an increase in the cot _/2 loading in order to
20

maintain the section lift coefficient, ct, of 1.0. For the case shown, the ct, cot term
associated with the cot _/2 loading term is equal to 1.62 which represents a 62-percent
increase over the total section lift coefficient of 1.0. Thus, for this low aspect ratio wing,
turbulent reseparation near the leading edge would be expected to occur at a much
lower section lift coefficient than for the two-dimensional case.
The above effects are illustrated further in figure 2.3(a) where, for the total section
lift coefficient of 1.0, the summation of the four chordwise loading terms of figure 2.2(b),
labeled "total," is compared with the cot _/2 term. Also shown is the distribution of the
lifting pressure term of the two-dimensional case for a section lift coefficient of 1.0, to
illustrate the greater adverse pressure gradient near the leading-edge for the low
aspect ratio wing.
The total adverse pressure gradient near the leading edge can be accurately
represented by the cot _/2 term, as illustrated in figure 2.3(b), for the forward 2-percent
of the wing chord. The accuracy appears sufficient for the purpose of this paper and is
best defined by the ratio K in the upper part of the figure. This parameter indicated
less than 1-percent difference between the two Ioadings for a typical region of
turbulent reseparation taken from figure 1.2.
The variation of Ct,cot across the span of the A = 0.5 wing is shown in figure 2.4(a).
It should be noted that both the local values of Cl,cot and ct are normalized by the
overall wing lift coefficient, CL. The results illustrate that the magnitude of cl,cot is
considerably greater than the corresponding total sectional lift coefficient, cl at all
spanwise stations; and at the mid semi-span station, Ct,cot is approximately 60-percent
to 65-percent greater than the corresponding total section lift coefficient, ct. The
reader is reminded that the actual span load distribution across the wing is
represented by the usual c,/CL distribution and that the c, cot/CL distribution
represents an equivalent section lift coefficient having the same adverse chordwise
gradient in the leading-edge region as in the real three-dimensional flow.
21

The formation of the transitional separation bubble and the subsequent turbulent
reseparation are, for a given Reynolds number, primarily dependent on the magnitude
of the adverse pressure gradient close to the leading-edge which is dominated by the
cotangent loading. As mentioned above, leading-edge stall, resulting from turbulent
reseparation, would be expected to occur when CL,cot rather than ct reaches a value
approximately equal to the two-dimensional airfoil lift coefficient corresponding to stall.
Thus, for the A = 0.5 wing example shown, leading-edge stall would begin at the root
station for a total section lift coefficient, ct, that is only about 62-percent of the two-
dimensional airfoil lift coefficient corresponding to stall in the two-dimensional case.
Since, for rectangular untwisted wings, leading-edge separation occurs first at the
root station (TI = 0) the variation of (Ct,cot/Cl), =o, with wing aspect-ratio is presented on
figure 2.4(b). The results illustrate the large increase in (Ct,cot/Ct) _ = 0, with decreasing
aspect ratio. This theoretical variation of Ct,cot/Ct TI = 0 will be used in the following
analysis of experimental data related to the leading-edge separation characteristics of
low aspect-ratio rectangular wings to illustrate the magnitude of induced camber
effects on root section stall.
2.3Comparison of Predictions and Experiments
This section will be devoted to predicted and experimental examples of the
influence of aspect ratio on root stall, on total wing stall, and some interacting effects of
aspect ratio and Reynolds number on overall wing stall.
2.3.1 Effect of aspect ratio on root stall
Inasmuch as the stall of uncambered and untwisted rectangular wings is initiated at
the wing root the induced camber effect at that station is of particular importance. To
illustrate its effect the experimental study by Brebner et. al. (1965) of five rectangular
wings having RAE 101 (10-percent) symmetrical airfoil sections and tips of revolution
will be used. The wings covered an aspect ratio range from 4.0 to 0.5 and the data to
be used here which, except for one case, reached the stall, was obtained at a chord
22
Reynolds number of 1.6 x 10⁶, and a Mach number of 0.11. The experimental two-
dimensional data for the RAE 101 (10-percent) airfoil, required for application of the
prediction method is obtained from Brebner and Bagley (1952). It was tested in the
same wind tunnel as the three dimensional wings at a Reynolds number of 1.7 x 10⁶
and a Mach number of 0.09. For the convenience of the reader the theoretical values
of the induce camber parameter (Ct,cot/Ct) _ = ofrom figure 2.4(b) are listed here for the
five wings of the experimental series
parenthesis following each aspect ratio:
0.5(1.62). Figure 2.5 presents some
summarizes the lift data.
with the induced camber parameter in
4(1.03), 2.5(1.08), 1.4(1.23), 1.0(1.36) and
selected pressure data while figure 2.6
Figure 2.5 is presented to illustrate, with experimental upper surface pressure data,
the influence of induced camber on the pressure distribution in the leading-edge
region of the wing root section. The aspect ratio 1.4 and 1.0 wings were selected
because their high level of induced camber allows for a more critical evaluation of the
prediction method. The root section of the lowest aspect ratio wing (0.5) encounters
some strong effects induced by the separation - induced tip vortex flow which will be
discussed later. The tabular pressure data for the two wings were not included in the
paper by Brebner et. al. (1965) but were obtained from those authors. Inasmuch as
turbulent reseparation probably occurs forward of the one-percent chord station (see
figure 1.2) the data is limited to the forward 2-percent of the chord to allow for an
expanded scale.
Turning first to the wing of aspect ratio 1.4 it will be noted that three conditions are
presented. One is for the three dimensional wing at the root station for a section lift
coefficient of 0.78 which is slightly below the stall. The other two conditions are from
the two-dimensional airfoil data (A = ®) of Brebner and Bagley (1952) at two lift
coefficients, one being the same as that selected for the three-dimensional wing (0.78)
and the other for a cotangent lift coefficient of 0.96 obtained by applying the induced
23

camber factor of 1.23. It should be noted here that only slight interpolations were
required to obtain the two-dimensional pressure distributions for the required lift
coefficients. Although the orifice locations for the three-dimensional wing are rather
sparce the orifice at the x/c of 0.005 is expected to be near the turbulent reseparation
point.
Regarding the results for the wing of aspect ratio 1.4 it will be noted first that the
suction pressures and adverse pressure gradients are much greater than for the two-
dimensional airfoil at the same lift coefficient (0.78) as would be expected due to the
induced camber effect. Secondly, it is seen that the two-dimensional airfoil pressures
for the lift coefficient of 0.96 that was obtained by applying the induced camber factor
are in much better agreement with the wing of aspect ratio 1.4. Despite the few
pressure orifices for the aspect ration 1.4 wing the results appear to at least
qualitatively confirm the accuracy of the prediction method.
The result for the wing of aspect ratio 1.0 which, of course, encounters an even
greater induced camber effect also appears to confirm the prediction method. The
wing of aspect ratio 0.5 has been omitted in figure 2.5 because strong effects of the
separation-induced side-edge (tip) vortex illustrated in figure 2.1(b) extend inward to
the wing root. This effect will be discussed subsequently.
Turning now to the lift and stall characteristics at the root section for the complete
aspect ratio series figure 2.6 presents the sectional lift coefficient, (cl) _1= o, obtained by
Brebner et. al. (1965) through integration of surface pressure measurements, as a
function of the wing angle of attack, a, for a chord Reynolds number of 1.6 x 10⁶. Also
shown is the two-dimensional data on the same airfoil section as obtained at a
Reynolds number of 1.7 x 10⁶ from the paper by Brebner and Bagley (1952). It should
be noted that the two-dimensional data indicates a sudden stall of the leading-edge
type resulting from turbulent reseparation and a Cl,max of 1.068. It is of interest that the
Reynolds number of 1.7 x 10⁶ and the leading-edge radius of 0.76-percent of the
24

chord places this airfoil about on the boundary between thin-airfoil and leading-edge
stall for the NACA 6-series airfoils of figure 1.5. The centerline lift data for the finite-
span wings also indicates a leading-edge type of stall and a pronounced reduction in
the centerline maximum lift coefficient with decreasing aspect ratio caused by the
influence of induced camber on the upper surface pressure gradient discussed above.
Regarding the maximum lift coefficient, it should be noted that experimental results
for inverted model test conditions is also presented in the stall region. Although the
two model conditions were used by Brebner et. al. (1965) to correct the angle-of-attack
for tunnel flow angularity, the differences in maximum lift coefficients indicate some
measurable flow curvature effects in the tunnel stream producing an effective camber.
In such a case, opposite, effects on Ct,m_ would be expected, with the true value lying
between the two results.
To illustrate the degree to which the induced camber concept predicts this
reduction in centerline maximum lift, predicted values of ct corresponding to the onset
of turbulent reseparation have been made by the method of this paper. For the
leading-edge type of stall, the prediction also corresponds to the maximum lift
coefficient. Using the theoretical ratio of cotangent lift to total lift, (Ct,cot/ct) 11= 0, from
figure 2.4(b), the value of total ct required to provide a ct,cot equal to the measured
two-dimensional Ct,m_ of 1.068 was determined for each of the aspect ratios. The
predicted values of the root-section lift coefficients for which turbulent reseparation
onset and the accompanying leading-edge stall, occurs is indicated by the horizontal
arrows for each aspect ratio except for the 0.5. The predicted values define rather
accurately the reduction of the root-section maximum lift coefficient with decreasing
aspect ratio. Since, as mentioned earlier, the stall of the complete wing is initiated at
the root section the prediction of root section stall is, of course, an important ingredient
in the complete wing stall.
25

Returning for a moment to the wing of aspect ratio 0.5 it seems apparent from the
increasing slope of the lift versus angle-of-attack that a strong influence of the
separation induced side-edge (tip) vortex extends to the root section contributing
directly to the maximum lift and modifying the pressure gradients. Thus the prediction
method developed for the root section does not apply for this very low aspect ratio
wing and the resulting calculation which provides a fairly accurate but fortuitous value
is not shown. This very low aspect ratio is of little practical importance and does not
represent a serious shortcoming of the method.
2.3.2. Effect of aspect ratio on overall wing stall
This section describes the additional consideration required to predict the overall
wing stall and makes comparisons with experimental results on rectangular wings
including both aspect ratio and Reynolds number effects.
As in the previous section on root stall this section deals with wings encountering
turbulent reseparation in the leading-edge region. The prediction of the overall stall
for the complete wing involves the prediction of the root section stall as in the previous
section except that the induced camber term must now be related to the total wing lift
coefficient, C L. The variation of this parameter, (c,, cot)_=o / CL, with aspect ratio has
been calculated by the Lan and Lamar (1977) method described earlier and is
presented in figure 2.7(a). Also shown is the variation of the total root section lift
coefficient parameter as an aid in establishing the magnitude of the induced camber
effect. The reader is reminded that the (c,, cot),=o/C, term does not imply that the
induced camber increases the root section lift coefficient. It only indicates the value of
an equivalent two-dimensional airfoil lift coefficient that has a comparable upper
surface pressure gradient in the leading-edge region, where turbulent reseparation
occurs, as does the three-dimensional wing with its induced camber.
The overall wing stall is influenced not only by the turbulent reseparation in the root
region but by the vortex lift produced by side-edge (tip) separation. This non-linear lift
26

becomes rather large in the low aspect ratio range and was observed rather early by
several researchers such as, for example, Knight and Loeser (1927), Zimmerman
(1932) and Winter (1936) and became the subject of continuing experimental research
as the interest in moderate to low aspect ratio wings increased. Chosen here to
predict this side-edge vortex lift is the side-edge suction analogy method developed by
Lamar (1974) as an extension of the leading-edge suction analogy developed earlier
for the vortex lift of slender delta wings. Lamar's method has proven to give accurate
predictions of the vortex lift for the case of sharp side edges where all of the inviscid
side-edge suction is converted to vortex normal force from which the lift can be
calculated. The resulting vortex lift represents the "upper bound" associated with
complete side-edge separation. Values of the constant of proportionality, Kv,se, in the
vortex lift equation, to be discussed subsequently, have been taken from Lamar (1974)
and are presented in figure 2.7(b) as a function of aspect ratio. Also shown is the
variation of Kp, the theoretical inviscid lift curve slope to be used later.
Turning now to some experimental data, the effect of aspect ratio on the total lift
and stall characteristics is illustrated in figure 2.8 for a series of rectangular wings
having NACA 0012 airfoil sections and no tip fairings. Also presented is the data for
the two dimensional 0012 airfoil obtained from the study by Loftin et. al. (1949). The
data for the wing of aspect ratio 6 is from Muse (1943) and that for the wings of aspect
ratio 3 and 2 from Jones (1952). All the tests were for Mach numbers less than 0.10
and a chord Reynolds number of 3.0 x 10⁶ with all but the wing of aspect ratio 6 being
tested in the Langley two-dimensional low-turbulence pressure tunnel. In addition to
the experimental data two theoretical variations are shown for the finite aspect ratio
wings; the inviscid attached flow theory given by Kp sin o_, the full side-edge vortex lift
theory given by adding the vortex lift increment Kv,se sin2oc cos e_ to the attached flow
theory. The values of Kp and Kv,se were obtained from figure 2.7(b).
27

From figure 2.8 it is seen that for these square-edge wings prior to the stall the
experimental lift (shown by the data points) is in good agreement with the solid line
which represents the sum of the theoretical inviscid lift and the theoretical side-edge
vortex-lift theory. Also the large increase in the vortex lift as aspect ratio is reduced is
clearly evident. It should be pointed out, however, that for wings with the usual tips-of-
revolution complete separation would not be expected and less side-edge vortex-lift
would be produced.
With regard to the total wing stall characteristics it is seen that while there is a 16-
percent reduction in maximum lift coefficient between the two-dimensional case and
the aspect ratio 3.0 case there is a recovery of some of that loss by the wing of aspect
ratio 2.0. This of course is due to the increase in vortex lift which counteracts a
considerable portion of the loss of maximum lift coefficient associated with the
influence of induced camber on the turbulent reseparation at the root section. To
further illustrate these influences, predictions of these effects using the two-
dimensional airfoil maximum lift coefficient corrected for induced camber and adding
the theoretical vortex lift increment are made in the following section.
The two-dimensional NACA 0012 airfoil with its rather large leading-edge radius
(1.58-percent c) experiences the combined trailing-edge/leading-edge type of stall
illustrated in figure 1.1(c) in which some trailing-edge separation occurs prior to the
sudden leading-edge stall. For the total wing lift of the three-dimensional wings the
combination of non-linear side-edge vortex-lift and delay in trailing-edge separation
on their outer portions tend to offset the influence of the trailing-edge separation in
their root regions. However, with the sudden stall of the three-dimensional wings
being initiated in the root region it is assumed that the two-dimensional data can be
used in predicting the three-dimensional total wing maximum lift-coefficient in a used
in predicting the three-dimensional wing maximum lift-coefficient in a manner similar to
that used in section 2.3.1 for the root section. The vortex lift must, of course, be
28

included and these two primary influences are combined in the following equation with
the assumption that, for the purpose of this paper, their interactions can be ignored in
the aspect ratio range considered. This results in:
The calculation preformed in the first set of brackets establishes the contributions of
the root section stall to the total wing maximum lift coefficient by dividing the
experimental two-dimensional C,,_x by the theoretical induced camber term at 11 = 0
which as noted earlier is normalized by the total wing lift coefficient, neglecting the
vortex lift, and is obtained from figure 2.7(a). This component of the total maximum lift
coefficient corresponds to the onset of turbulent reseparation and decreases with
decreasing aspect ratio similar to the decrease shown in figure 2.6 for the root section
of the RAE 101 (10 percent) wings.
The calculation performed within the second set of brackets in the above equation
predicts the magnitude of the side-edge vortex lift at the angle of attack, e(crit, for which
the predicted sudden root-stall associated with turbulent reseparation onset occurs.
The variation of Kv,se with aspect ratio, obtained by the side-edge suction analogy
method of Lamar (1974), is presented in figure 2.7(b) for rectangular wings. The
values of (Zcrit are obtained from:
OCc,t=arcsin[C,,r,_///(c''=')'7=°1C L K,
where Kp is the theoretical inviscid three-dimensional lift curve slope, obtained from
figure 2.7(b).
The results of the application of the above prediction method are indicated in figure
2.8. The three predicted parameters are defined for the wing of aspect ratio 2.0. The
29

horizontal arrow labeled "turbulent reseparation onset" defines the total wing inviscid
lift coefficient corresponding to leading-edge stall at the root as calculated by the first
bracketed term in equation (2.1) and also defines "(Xcrit" which is used in the second
bracketed term in equation (2.1) to predict the vortex-lift contribution to the total wing
maximum lift coefficient. The sum of the predicted lift coefficient corresponding to
leading-edge stall at the root and the predicted vortex-lift increment at (Xcrit represents
the predicted total wing maximum lift coefficient and is shown by the solid horizontal
arrow labeled "CL_x."
The above labeling of the predicted parameters is used for all three of the finite
span wings and it is seen that the methods used result in reasonably good agreement
with the experimental results. From these comparisons it is seen that the effect of
induced camber on the root stall contribution to the total wing maximum lift-coefficient
results in a rather large decrease with decreasing aspect ratio. This decrease
amounts to 29-percent for the aspect ratio 2.0 wing relative to the two-dimensional
airfoils and for a wing with no side-edge (tip) separation it would represent the
reduction in the total wing maximum lift coefficient. However, for these wings with
complete side-edge separation the increase in vortex-lift contribution with decreasing
aspect ratio offsets a sizable portion of the induced camber effect.
2.3.3. Reynolds number influence on wing stall
Turning now to the influence of Reynolds number, the prediction method
developed above for combining the leading-edge stall and side-edge vortex lift will be
used as a analysis aid. Although the primary effect of Reynolds number on CLmax is
expected to be similar to that encountered in two-dimensional flow, as discussed in
section 1.5, the above method indicated several three-dimensional effects that can
alter the magnitude of the Reynolds number effects encountered by low aspect-ratio
rectangular wings. For example, the increase in O_cdt with increasing Reynolds
3o

number, due to the delay in leading-edge root stall, results in an increase in the
magnitude of the side-edge vortex lift. Inasmuch as the vortex-lift effect increases with
decreasing aspect ratio, it would be expected that the influence of Reynolds number
would be dependent on the aspect ratio.
The most extensive experimental data base available for evaluating the effects of
Reynolds number over a range of aspect ratios appears to be that associated with
investigations utilizing the NACA 0012 airfoil section on rectangular wings having
square side edges used in the previous section and reported by Muse (1943) and
Jones (1952). The data was obtained in tunnels having relatively low turbulence
levels, and the models were tested in the "free transition" condition. For the data
presented here the Mach number was no greater than 0.13.
Evaluating first the aspect-ratio 6 case, figure 2.9 presents CL, max as a function of
Reynolds number as predicted by the present method and as obtained from the
experimental study by Muse (1943). Shown for comparison are the two-dimensional
results from figure 1.7. The two predicted curves were determined with the present
three-dimensional prediction methods. The dashed line represents the prediction
neglecting the side-edge vortex lift and the difference between it and the two-
dimensional results represents the influence of the three-dimensional effects on the
turbulent reseparation in the leading-edge region. The solid line represents the
predicted total CL, max resulting from the inclusion of the side-edge vortex lift. It will be
noted that the increment associated with the side-edge vortex lift increases slightly
with increasing Reynolds number. The results indicate the prediction method to be
reasonably accurate.
Figures 2.10 and 2.11 present the same type of comparisons as in figure 2.9 but
extends them to the low aspect ratio range with the aid of the experimental data for
aspect ratios of 3 and 2 from the study by Jones (1952). In both cases, there is good
agreement between the experimental results and the present prediction method.
31

There are several items of interest illustrated by figures 2.9 through 2.11. First, it is
noted that as the aspect ratio is reduced, the vortex lift contributed by the side-edge
vortex flow increases; in addition, this vortex lift increment increases as Reynolds
number is increased. This increase in the vortex lift results from the increase with
Reynolds number of the angle of attack, (_crit, at which the leading-edge stall (turbulent
reseparation) at the root occurs, thereby resulting in a stronger side-edge separation
vortex. A second item of interest is seen by comparing figures 2.10 and 2.11. This
comparison indicates that due to the compensating effects of induced camber and
side-edge vortex-lift illustrated in figure 2.8, the values of CL,max are essentially equal
for the wings of aspect ratio 3 and 2 over the Reynolds number range studied.
However for lower aspect ratios the vortex flow would be expected to dominate and an
increase in CL,max would occur. However, as mentioned earlier, it should be stated
that for the more usual practice of utilizing a tip of revolution some reduction in the
vortex lift occurs which will modify the above trade-off.
In concluding this section it should be pointed out that for wing-fuselage
combinations the additional influence of the fuselage-induced upwash over the
inboard portion of the wing must be considered with regard to root stall. Also, of
course, the use of wing warp to optimize various design requirements will modify the
above results as well as those in the following sections, but are beyond the scope this
paper.
3. SWEPTBACK WINGS
3.1 Some Early Research
By the mid-1940's a great deal of interest in sweptback wings for high speed
aircraft was developing because of their advantage in delaying the onset of adverse
compressibility effects. This interest was generated first in Germany where it can be
traced to the supersonic sweptback wing theory of Buseman (1935), and later in the
United States as a result of the independent development of the theory by Jones
32

(1945) who, in addition, extended the supersonic theory to include the important
subsonic edge case associated with highly swept wings. Both demonstrated that it
was the component of Mach number normal to the isobars that was critical.
However, with regard to the effect of sweepback on the low speed lift and stalling
characteristics, of interest in this paper, it appears that the first related work appeared
much earlier in a paper published by Munk (1923). In connection with the effect of
sweep on lateral stability, Munk stated that "in straight flight only the component of the
velocity, V cos A, is effective for the creation of the lift." Possibly the first published
work directly related to the stalling of swept wings was that of Betz (1935) who, in
discussing the stall of rectangular wings in oblique (yawed) flow stated that "the
decrease in maximum lift for varying angles of approach (yaw) might be expected to
be proportional to cos2_, but the assumption that the superposition of a transverse
velocity does not materially affect the separation phenomena is somewhat
uncertain ..... " Betz also pointed out that the meager data available at the time indicted
the decrease in maximum lift to be somewhat less than suggested by the "cosine
squared" rule. Since, in the mid-1930's, the interest in wing sweep was confined
primarily to very modest degrees of sweepback, related primarily to the stability and
controllability of tailless aircraft, little research was carried out on the effect of moderate
and high sweep angles on wing stalling until, as mentioned earlier, the benefits to the
high speed performance were recognized. With the interest turning to highly
sweptback wings to provide efficient supersonic capability and with separation
occurring at lower lift coefficients as predicted by the Betz cosine-squared rule, there
was an acceleration of research related to the take-off and landing capabilities and the
low speed stability and control characteristics.
33

3.2 Some Types of Flow
While it is beyond the scope of this paper to review in detail this early research, a
brief mention of some of the primary flow phenomena which influence the separation
and stalling of sweptback wings would be useful for the review of combined sweep
and Reynolds number effects to follow. To this end figure 3.1 presents, in simplified
form, three of the primary phenomena to be dealt with in this section.
3.2.1 Tip stall
The sketch in the upper left illustrates the type of change in the attached flow upper
surface chordwise and spanwise pressure distribution across the span that occurs on
unwarped sweptback wings. Early wind tunnel tests and "lifting line" theories
demonstrated the occurrence of tip stall due to an increasing upwash angle induced
towards the wing tip. Soon "lifting surface" theory and detailed pressure
measurements demonstrated that, near the wing root, the chordwise distribution of
induced angle (induced camber) is such as to reduce the adverse chordwise pressure
gradient near the leading-edge while the opposite effect occurs in the tip region. Thus,
only in the mid-semispan region of the wing does the simple infinite span oblique wing
theory tend to apply. This is also seen from the fact that in the regions of the tip and
root the streamlines, in plan view, cannot curve to satisfy the oblique wing theory but
are forced to remain in the free-stream direction. This so-called "kink" effect requires
that the isobars cross the plane of symmetry at a right angle as indicated in the sketch.
A similar effect occurs at the wingtip. These effects shear the chordwise pressure
distributions across the span such as to create the changes in induced camber and
pressure gradients near the leading edge in the manner described above and
illustrated in the upper left of figure 3.1 thereby creating tip stall. For a more detailed
discussion of these effects the reader is referred to Kuchemann (1978).
34
3.2.2 Leading-edge separation bubble
The sketch in the upper right of figure 3.1 illustrates in simplified form the primary
influence of the spanwise variation of the adverse chordwise pressure gradient in the
leading edge region as it applies to this paper. In contrast to the rectangular wings of
section 2, the turbulent reseparation and resulting expanding long bubble begins
outboard on the wing and its rate of inboard progression with angle-of-attack reduces
as sweepback increases.
The induced camber effects associated with sweepback, as discussed with the
above two sketches, will subsequently be analyzed using the cotangent loading
concept in a manner similar to that used for the rectangular wings of section 2.
3.2.3 Leading-edge vortex lift
Another phenomenon of interest in this section is illustrated, again in simplified
form, in the lower sketch of figure 3.1. For wings of moderate-to-high sweepback the
spanwise pressure gradients on the upper surface can induce spanwise velocities in
the leading-edge region of sufficient magnitude to convert the expanding long bubble
flow described above into the vortex flow illustrated in the sketch. This, of course, is
the well known, highly stable, leading-edge separation induced vortex flow. This
vortex flow entrains an additional mass of air and provides a downward deflection
thereby producing an increase in lift above that expected from inviscid theory and
referred to as "vortex lift." This appears to have first been demonstrated at Langley in
1946 and reported by Wilson and Lovell (1946) who demonstrated that the poor
maximum lift of a highly swept delta wing was greatly improved when the round
leading edge was made sharp thereby creating the now well-known leading-edge
vortex. A "cross flow separation" model of the vortex flow was also proposed in this
early paper. This research remained classified for 4 years but stimulated additional
35
studies in the United States. International interest in vortex lift appears to stem from its
independent discovery in France during 1951 and 1952 as reviewed by Legendre
(1981).
Also influenced by sweep is the spanwise flow of the boundary layer induced by
spanwise pressure gradients. The resulting increase in boundary layer thickness in
the aft outboard region can, for thick wings in particular, produce earlier trailing edge
separation with the accompanying adverse effects on the stall characteristics including
stability and controllability problems. However, for the thin wings with turbulent
reseparation at the leading-edge of interest in this paper, this is not a major factor and
will not discussed.
By the late 1940's and early 1950's the major influences of the above phenomena
were fairly widely recognized as demonstrated in review papers such as, for example,
those published by Furlong and McHugh (1952) and by Kuchemann (1953). Much of
the low speed, swept wing research that followed was directed towards the
development of a data base covering effects of planform, airfoil section and Reynolds
number as well as the development of warped wings and passive and adjustable
devices to provide some control of the separation. However, consistent with the
previous parts of this paper, the following discussion will deal only with the influence of
wing geometry and Reynolds number on leading-edge separation and its influence on
the stalling of unwarped wings without flow control devices.
3.3 General Effects of Sweep and Reynolds Number
This section will review some of the general effects of sweepback and Reynolds
number on the overall lift and stalling characteristics. To provide continuity with the
prior section on rectangular wings, experimental results for constant-chord-length
wings will be used as illustrations. The influence of taper will however be discussed in
later sections of the paper.
36
3.3.1 Prediction of turbulent reseparation
Many studies of the flow about sweptback wings, dating back to the late 1940's have
indicated that, for symmetrical airfoil sections in the thickness range of interest for high
speed aircraft, the most prevalent type of separation affecting the lift is that which
occurs near the leading edge. Also studies such as those by Poll (1983, 1986), for
example, demonstrated that in general the leading-edge flow on sweptback wings
often was quite similar to that on upswept wings in that a transitional bubble near the
leading edge occurs first followed by a turbulent reseparation. However depending on
the sweepback angle and Reynolds number this can result in a leading-edge vortex
flow.
In view of the above, an attempt to relate the effect of Reynolds number on the
onset of turbulent reseparation for sweptback wings to those observed on two-
dimensional airfoils in section 1.3.2 will be made by use of a simple extension of the
method developed for rectangular wings in section 2.2.1.
To extend the method developed in section 2.2.1, the following modifications are
made:
1. The effect of sweep is, of course, included in the calculation of the variation of the
inviscid values of the flat plate cotangent lift coefficients across the span, and
2. the maximum value of the section cotangent lift coefficient across the span is
equated to an appropriate value of the two-dimensional lift coefficient at the onset of
turbulent reseparation corrected to an infinite span swept wing by the Betz cosine
squared rule. It must be remembered that the section cotangent lift coefficient is an
equivalent flat plate section lift coefficient that provides the same pressure gradient at
the leading edge as occurs on the wing due to the three-dimensional induced angle of
attack and induced camber.
With regard to item (1), the major influences of sweepback on the induced camber
effects are illustrated in figure 3.2, which presents spanwise distribution of the total
37
section lift coefficient, ct, and the cotangent type section lift coefficient, C_,cot (both
normalized by the total wing lift coefficient, CL). These constant-chord wings are of
aspect ratio 3 and have sweepback angles of 0 °, 30 °, and 55 °, and the solutions used
the first three chordwise pressure modes (see section 2.2.1).
For the unswept wing, the lift loss associated with the negative induced camber
must be offset by an increase in angle of attack which causes an increase in the
adverse pressure gradient in the leading-edge region. This is indicated by the fact that
the angle-of-attack type chord load, as measured by C_,cot, is greater than the total
chord load as measured by ct. Although it causes an earlier stall, as discussed in
section 2.1, the stall originates at the root and, based on the spanwise distributions,
the induced camber would be expected to have a relatively small influence on the stall
progression towards the tip.
For the 30 ° sweptback wing, however, the induced camber is positive in the root
region, thereby reducing the adverse pressure gradient at the leading edge for the
inboard region as indicated by the reduced level of the CL,cotterm. Through its effect in
delaying the onset of turbulent reseparation for wings with airfoil sections exhibiting
"thin airfoil" or "leading edge" classes of separation (see section 1.2), the induced
camber is the primary contributor to the delayed stall of the root region. Over the
outboard region the induced camber is negative, thereby increasing the adverse
pressure gradient and causing the turbulent reseparation to begin in the mid-
semispan region rather than the root region that might be expected if only the total
section lift coefficient, _, distribution is considered. For wings in this range a leading-
edge sweepback, the turbulent reseparation combined with the spanwise flow can
cause partial span leading-edge separation-induced vortex flow depending on the
leading-edge radius and Reynolds number. An example of a flow study illustrating this
dependency is that made by Poll (1983 and 1986).
38

Turning to the 55 ° sweptback wing example, it is seen that the general effects of
induced camber on the distribution of the angle-of-attack type chordwise loading
parameter, Ct,cot/CL, are similar to those for the 30 ° sweptback wing. However, the
peak value is shifted much closer to the wing tip and the reduction in the root region is
greater. This implies, of course, that the onset of turbulent reseparation will occur
much closer to the tip than implied by the total section lift coefficient and the inboard
progression will be slower than for the 30 ° sweptback wing, thereby further delaying
the root stall.
Regarding item (2) above the following assumptions are made relative to the
2-dimensional data selection. First, the airfoil section in the plane normal to the
leading edge (plane of maximum adverse pressure gradient) will be used in
accordance with the Betz (1935) theory applicable to the inviscid pressure for an
infinite span oblique wing. The most serious problem is the selection of a Reynolds
number which in the 2-dimensional airfoil flow at the equivalent lift coefficient,
c, cos 2 A, will at least approximately correspond to the condition of the onset of
turbulent reseparation in the swept case.
For a pure laminar boundary-layer case the "independence principle" of Jones
(1947) would apply for the infinite span oblique wing and the Reynolds number normal
to the leading-edge would be appropriate. However, as suspected by Betz (1935), it
was determined in the 1950's that the development of the transitional and turbulent
boundary-layer is influenced by both the flow normal and the flow parallel to the
leading-edge. Of particular importance is the influence of crossflow (spanwise)
instability which produces attachment line transition. For two of the more recent
summaries of the various effects, the reader is referred to Kuchemann (1978) and
Amal (1987). Since the "independence principle" cannot be applied in the selection of
an equivalent Reynolds number for application of the 2-dimensional data to turbulent-
reseparation the streamwise Reynolds number for sweptback wing in question will be
39

used herein. While this is arbitrary, there appears to be no practical alternative to this
approach for the present purpose. Some related experimental justification can be
found in the studies of yawed circular cylinders, such as that by Bursnall and Loftin
(1951). The reader must keep in mind, however, that this approach is only an attempt
to relate the general trends with regard to the effects of Reynolds number on the
turbulent reseparation between the 2-dimensional and 3-dimensional flows. This
represents one of the areas where turbulent-flow Navier-Stokes theoretical studies
should be very helpful.
3.3.2 Overall lift characteristics
An illustration of some experimentally determined effects of wing sweepback angle
and Reynolds number on the overall lift characteristics is presented in figure 3.3. The
sweptback wings had ONERA "D" airfoil sections placed perpendicular to the leading
edge and two-dimensional unswept airfoil data for this section are presented on the
left for reference.
The airfoil data is from Erlich (1969) and section lift results for root chord Reynolds
numbers of 0.8 and 2.1 million are presented as a function of angle of attack. The
ONERA "D" airfoil, a symmetrical "peaky" type, has a thickness ratio of 10.5-percent
and a leading-edge radius of 1.4-percent chord. For the lower Reynolds number a
gradual stall of the "thin-airfoil" type occurs, while at the higher Reynolds number the
"trailing-edge followed by leading-edge" type of stall occurs. This trend with Reynolds
number is consistent with the stall boundaries of figure 1.5 for the NACA 6-series
airfoils. For the variation of C_,rnax with Reynolds number the reader is referred to
figure 1.8.
The two sweptback wing cases are taken from a variable-sweep study carried out
in several ONERA wind tunnels. This experimental study was selected because of its
systematic coverage of both sweepback angle and Reynolds number, and the use of
40

raked tips which tend to confine the separation-induced vortex flow to the wing leading
edge.
For the 30 ° sweep case, the Rcr = 0.9 x 10⁶ data was extracted from the data in
figure 44 of Poisson-Quinton (1978) and the Rcr = 2.2 x 10⁶ data from the data in figure
9 of Manie, et. al. (1978). For this low sweep case, the effect of Reynolds number on
the type of stall is quite similar to that observed for the two-dimensional airfoil. The
most obvious effect is, of course, the well-known influence of the cos2A rule in
reducing the maximum lift coefficient with the three-dimensional effects being rather
small for this relatively high aspect ratio of 6.86. However, it is of interest here to
examine the degree to which the simplified approach of this paper predicts the effect of
sweep and aspect ratio on the onset of turbulent reseparation.
Turning first to the high-Reynolds-number case and taking the airfoil maximum lift
coefficient of 1.53 as the onset of turbulent reseparation for the two-dimensional case,
converting to the two-dimensional oblique wing by the "cosine squared" rule and
applying the correction for induced camber by the method of this paper results in a
value of 1.02 for the three-dimensional lift coefficient corresponding to the onset of
turbulent reseparation. This is shown in figure 3.3 by the horizontal arrow and is seen
to closely predict the stall. This implies that for this relatively low sweep angle, the
level of spanwise flow is insufficient to create a leading-edge vortex flow of sufficient
strength to alter the type of stall. There may be at least a "part span" vortex influence
beyond the stall as observed, for example, by the flow studies on a similar wing by Poll
(1983, 1986).
For the low-Reynolds-number condition the predicted turbulent reseparation
appears to be reasonable and there is evidence of some influence of vortex flow in
providing a further softening of the stall relative to the two-dimensional case.
Results shown in figure 3.3 for the 50 ° sweptback wing are quite different. For this
case, the predicted overall lift coefficient corresponding to the onset of turbulent
41

reseparation is 0.54. As shown by the horizontal arrow, this prediction corresponds
closely to the measured onset of an increase in lift gradient with angle of attack rather
than the loss of lift shown for the 30 ° wing. This, of course, is associated with the well-
known vortex lift effect resulting from the combination of the turbulent reseparation and
the strong spanwise flow present on this more highly sweptback wing.
As will be discussed subsequently, the vortex flow on this wing becomes the
predominate factor in determining the high-lift characteristics with the inboard
progression of the vortex origin and the vortex breakdown development establishing
the type of stall. As can be seen, the stall associated with the vortex flow is rather
gentle and is due to the inboard progression of the vortex breakdown with increasing
angle-of-attack.
Some additional details of the effect of Reynolds number on the vortex lift
characteristics of the 50 ° sweptback wing are given in figure 3.4. Where the total lift
coefficient is presented as a function of angle of attack for chord Reynolds numbers, in
millions, of 1.2, 2.3, and 3.0. Shown by the two dashed lines are the theoretical results
for attached flow and for full vortex flow. The vortex flow theory is based on the
leading-edge suction analogy of Polhamus (1966) for a sharp leading edge and
therefore represents the probable "upper bound." Additional description of the
analogy is presented in section 4.1.2. The experimental results illustrate the increase
in the lift coefficient corresponding to the onset of vortex lift as the Reynolds number
increases. The predicted lift coefficients for the onset of turbulent reseparation are
indicated, as in the previous figure, by the horizontal arrows for the three Reynolds
numbers (identified by the symbols) based on the maximum lift coefficients for the
ONERA "D" airfoil presented in figure 1.8. The results indicate a reasonably good
prediction of the delay in the onset of vortex flow as the Reynolds number is increased.
However it should be noted that for the Reynolds number of 3.0 x 10⁶ the two-
42
dimensional data presented in figure 1.8 involved a small extrapolation to eliminate a
shock effect as discussed in section 1.5.
Some pressure data for this same wing is presented in figure 3.5 where the effect
of Reynolds number on the upper surface chordwise pressure distributions is shown,
for the four spanwise stations (A through D) shown in the sketch, at an angle of attack
of 12°. For the Reynolds number of 3.0 x 10⁶, it is seen that the flow is essentially
attached over the entire region of the wing shown while for the Reynolds number of 2.0
x 106vortex flow, resulting from turbulent reseparation, has been established over the
entire region. The rearward movement of the vortex-induced reattachment point as the
wing tip is approached is evident and illustrates the growth of the vortex.
3.3.3 Summary of maximum lift
The data for the variable-sweep wing series described in the previous section were
obtained in the ONERA S1Ca and S2Ca low-speed atmospheric wind tunnels. To
provide data over a wider range of Reynolds numbers, tests were later made in the
relatively new ONERA F1 tunnel which operates up to 4 atmospheres pressure. A
brief summary, without analysis, of the effect of Reynolds number on the maximum lift
coefficient from these tests, at sweep angles ranging from 0 ° to 50 °, has been
published by Carrara and Masson (1980). No source for the basic data was cited.
These data and that for the 60 ° wing from Manie (1978) and Brocard and Manie
(1979) for the same wing series are summarized in figure 3.6 as a function of Rcr. To
be consistent with this paper, the reference length, for Reynolds number has been
converted to the streamwise chord. Shown for reference is a portion of the two-
dimensional airfoil data for the ONERA "D" airfoil taken from figure 1.8.
While Carrara and Masson (1980) present the maximum lift coefficients, they do not
present the lift versus angle of attack needed to definitely classify the type of stall.
However, with the aid of the lift versus angle of attack data of Manie, et. al. (1978),
some observations from figure 3.6 can be made. Regarding the 30 ° sweptback wing,
43

the strong increase of CL, max with Reynolds number in figure 3.6 and the lift data of
figure 3.3 indicate that for this modest sweep angle the stall characteristics with angle
of attack and Reynolds number are similar to those observed in two-dimensional flow
for the ONERA "D" airfoil (Edich 1969). This, of course, does not preclude some part-
span vortex flow occurring beyond the stall or of insufficient vortex strength to change
the type of stall. For the 50 ° sweptback wing, the data of figure 3.6 indicate that the
strong vortex flow observed in figure 3.3 exists over the entire Reynolds number range
tested and that the maximum lift developed decreases slightly with Reynolds number
in this range transition from a trailing-edge/leading-edge stall to the vortex-flow stall.
The results for the 40 ° and 60 ° wings will be discussed subsequently.
A somewhat more informative way of illustrating the combined effects of sweep
angle and Reynolds number on the maximum lift coefficient is presented in figure 3.7
for three Reynolds numbers using the experimental data of figure 3.6. As an analysis
aid, the predicted turbulent reseparation onset is shown by the dashed curves as
obtained from the maximum lift coefficient data for the ONERA "D" airfoil presented in
figure 1.8, corrected for the two-dimensional sweep effect and the three-dimensional
induced angle of attack and camber effects according to the method presented herein.
The results of these calculations illustrate the effect of sweep and Reynolds number on
the maximum lift coefficient that would be expected due to turbulent reseparation if no
vortex lift was encountered.
The experimental data for the 30 ° sweptback wing is in reasonably good
agreement with the predicted values for all three Reynolds numbers, tending to
confirm the previous conclusion that the maximum lift for this wing is associated with a
sudden "trailing-edge/leading-edge" type stall with little vortex lift being developed
(see fig. 3.3).
Between sweep angles of 30 ° and 40 °, the vortex flow, resulting from the turbulent
reseparation and the crossflow, begins to dominate the stall characteristics as
44
discussed above. The associated vortex lift provides increases in maximum lift
coefficient above those predicted for turbulent reseparation without vortex
development, as shown by the dashed lines. The increment in CL,max associated with
the vortex flow decreases with increasing Reynolds number, resulting in a
convergence such that for the A = 50 ° condition, maximum lift coefficient is relatively
independent of Reynolds number over the range tested. Although only the 3.5 x 10⁶
Reynolds number of maximum lift coefficient data for the 60 ° wing is included in the
above cited references, earlier data by Cahill and Gottlieb (1950) for a tapered wing in
the same leading-edge sweep and leading-edge radius range indicated a relative
insensitivity to Reynolds number. This insensitivity is associated with the fact that for
the high sweep angles the flow at the higher angles of attack is dominated by the
leading-edge vortex flow and maximum lift is controlled primarily by vortex breakdown
as will be discussed in section 4.2.3.
Also shown in figure 3.7 (by the flagged symbols) are the measured values of the
inflection lift coefficient, CL,_nf, for the 50 ° sweptback wing. The inflection lift coefficient
is that at which a change in the lift and moment gradient with angle of attack occurs. It
is associated with leading-edge turbulent reseparation and initiation of vortex lift, as
was illustrated in figure 3.4. From this result, it appears that the inflection lift
coefficients correspond reasonably close to the predicted onset of turbulent
reseparation conditions. For the 30 ° sweptback wing, which exhibits a sudden
leading-edge stall, the inflection lift coefficient corresponds to the maximum lift
coefficient. Regarding the 40 ° sweptback wing, only the maximum lift coefficients were
reported by Carrara and Masson (1980), but the indication from figure 3.7 is that the
stall is influenced by vortex flow.
In summary, figure 3.7 illustrates the transition from the sudden leading-edge type
of stall that occurs for sweep angles up to about 30 ° to the gentle stall at the higher
sweep angles which, as a result of vortex flow, occurs well beyond the turbulent
45

reseparation lift coefficient and tends to be dictated by the spanwise progression of
vortex breakdown. It is of historical interest to note that these general trends had been
observed by various researchers in the late 1940's and early 1950's and the reader is
referred to the summary paper by Furlong and McHugh (1952) as an example.
3.4 Influence of Reynolds Number on Local Flow
In this section, some examples of the measured section lift characteristics at
various spanwise stations on a tapered sweptback wing will be shown to illustrate
some of the primary effects of Reynolds number and angle of attack on the local flow.
An attempt will also be made to relate the local conditions to those encountered in two-
dimensional flow as a means of illustrating various three-dimensional influences on a
local stalling which may be of value in evaluating the ability of Navier-Stokes methods
to predict local viscous effects.
The wing selected for this section is one for which Kolbe and Boltz (1951)
performed detailed pressure and force tests over a Reynolds number range. The wing
leading-edge sweep is 49 ° , the aspect ratio is 3.0, the taper ratio is 0.5, and the airfoil
is a NACA 64A010 placed normal to the quarter-chord line.
3.4.1 Prediction of turbulent reseparation
The same general approach as in section 3.2.1 will be used to predict the influence
of the three-dimensional induced flow effects on turbulent reseparation. However,
since these influences will be examined at local spanwise stations and related to two-
dimensional flow, it is necessary to relate the section cotangent lift coefficient, C_,cot, to
the total section lift coefficient, ct, as was done in the case of the rectangular
unswept wings in section 2. Figure 3.8 presents the theoretical results for the various
lift coefficient parameters as a function of spanwise location, q, for the above wing. As
in figure 3.2 for constant chord sweptback wings, the left part of figure 3.8 presents the
section lift parameters normalized by the total wing lift coefficient, CL. Since the
46

analysis in this section also requires the Ct,cotparameter normalized by the local
section lift coefficient, ct, that parameter is presented on the right of figure 3.8.
As will be shown subsequently, this airfoil, in two-dimensional flow has a trailing-
edge/leading-edge type of stall over the Reynolds number range of interest here.
Therefore, the onset of turbulent reseparation corresponds to the maximum section lift
coefficient. Thus, the predicted section lift coefficients corresponding to turbulent
reseparation, Ct,sep,on the three-dimensional wing are determined at each span
station as
(c,,,_)(cos _A)
cr'seP = //(c_,_o t / cz)
where A corresponds to the sweep angle of the wing leading-edge (since it is a
leading-edge separation condition), Ct,rnax is obtained by experimental two-
dimensional airfoil data at a Reynolds number based on the local streamwise chord
and the induced camber term, Ct,cot/Ct from figure 3.8.
3.3.2 Section normal-force characteristics
The section normal-force coefficient characteristics at the various span stations for
R _ = 4 x 10⁶ are shown in figure 3.9 adapted from figure 7 of the paper by Kolbe and
Boltz (1951). Also shown are the two-dimensional data for the NACA 64A010 airfoil
from Loftin (1948) for chord Reynolds numbers of 3 x 10⁶, 6 x 10⁶, and 9 x 10⁶. The
two-dimensional results indicate a combined trailing-edge/leading-edge type of stall
consistent with the two-dimensional stall-type boundaries of figure 1.5 for this
Reynolds number and leading-edge radius combination. The notable differences in
the region of the local stall between the two-dimensional flow and the three-
dimensional flow is readily apparent at all spanwise stations, consisting of a rapid
increase in the slope of the Cn vs o_ curves prior to the attainment of the maximum
value. This increase occurs at all spanwise stations and is, of course, associated with
leading-edge separation-induced vortex flow discussed earlier. The dashed lines are
47

extensions of the linear portion of the data to aid in illistrating the approximate vortex
lift effect.
The predicted values of Cn for the onset of turbulent reseparation are shown by the
horizontal arrows. Due to the fact that the wing is highly tapered, the local chord
Reynolds numbers across the span were included in the predictions. The prediction of
reseparation onset appears reasonably good at the wing tip where the separation
originates and in the root region where the tip separation induced vortex flow
produces little influence. However, in the mid semispan region where vortex flow
interactions occur, that are not included in this simplified method, the agreement is not
good.
It will be noted that the effect of induced camber in delaying the onset of turbulent
reseparation is quite large in the inboard region. With regard to stall progression, it is
assumed that the maximum local lift coefficient is established primarily by vortex
breakdown. At present there appears to be no adequate method of predicting the
influence of vortex breakdown on the local maximum lift of wings of this type having
moderate sweep and a round leading edge. Some success has been obtained for the
overall maximum lift for the special case of very slender delta wings having sharp
leading-edges, and this will be discussed in section 4.2.3.
Turning now to the effect of Reynolds number on the section normal-force
characteristics across the span, figure 3.10 compares the results from figure 3.9 with
those obtained at the higher Reynolds number of 8 x 10⁶. Again, the result are from
the paper by Kolbe and Boltz (1951). The results illustrate a delay in turbulent
reseparation and vortex formation in the outer region of the wing which results in
higher local maximum normal forces. The results indicate the expected delay in the
formation of vortex flow as the Reynolds number is increased and over the outboard
half of the wing higher values of maximum normal force coefficient are developed.
Over the inboard region of the wing, the maximum normal force coefficient was not
48

reached for either Reynolds number. Although these effects would lead to the
expectation of an increase in the overall maximum lift coefficient for the wing, the
results obtained by Kolbe and Boltz (1951) indicate only minor effects of Reynolds
number (consistent with the 50 ° wing data of figure 3.6). Since the overall maximum
lift coefficient occurs at an angle of attack of about 25 °, it is possible that compensating
effects over the inboard region might occur at angles of attack beyond those reached
for the data of figure 3.10.
Before leaving this section, it should be mentioned that secondary and tertiary
separations and accompanying vortex flow can be formed under the primary vortex
and may have had some influence on the data presented. Studies of their effects will
be discussed in the following section on delta wings.
4. SLENDER DELTA WINGS
The stall of highly-swept (slender) delta wings, of interest for supersonic and
hypersonic aircraft, are highly dependent on vortex lift and, as discussed in section
3.2.3, it was a 1946 study of a delta wing that uncovered and explained this
phenomenon. This section will discuss some flow details in the stall region that were
not covered in the section on swept-back wings such as, for example, the secondary
separations induced by the flow beneath the primary (leading-edge) vortex, reversals
in vortex paths, and prediction of vortex breakdown. In addition the suction analogy
and free-vortex-sheet theories of leading-edge vortex flow will be described and
applied.
4.1 Analysis Methods
4.1.1 Induced camber distributions
As in the previous sections the spanwise distributions of the cotangent chord-
loading section lift parameter has been determined and is presented in figure 4.1 to
illustrate the influence of induced camber on the leading-edge pressure gradient for
49
delta wings. All of the examples shown were obtained from calculations using the first
three chordwise pressure modes described in section 2.1. For comparison purposes,
the results from figure 3.2 for a 55 ° constant chord sweptback wing of aspect ratio 3.0
are shown on the left. Results for a 55 ° delta wing (A = 2.8) are shown in the center
section of figure 4.1. The most obvious difference between the swept wing and the
delta wing is the well-known highly-loaded tip region on the delta wing, which occurs
for both the total section lift parameter and the cotangent section lift parameter. Also
apparent is the fact that for the delta wing the influence of induced camber in reducing
the adverse pressure gradient at the leading-edge is extensive, covering essentially
the complete semispan.
On the right of figure 4.1 the variation of the cotangent loading parameter is
presented for a series of three delta wings covering the sweep range to be discussed
in this section of the paper. The results indicate a reduction of the cotangent loading
with increasing leading-edge sweep angle over the entire semispan.
For delta wings having round leading edges an indication of the influence of
induced camber on the progression of turbulent reseparation aft of the transitional
bubble can be extracted from the theoretical variation of the cotangent loading thus
providing information regarding the origin of the vortex sheet. However, a major
portion of the discussion of delta wings will deal with sharp leading-edge cases where
separation occurs all along the edge at a very low angle-of-attack and, for the sweep
angles involved, a resulting vortex sheet is attached to the sharp leading-edge. Since
this type of flow is the dominant one for these wings the cotangent lift concept is not
applicable to the prediction of the lift characteristic for the sharp edge case and vortex
flow methods will be used. These methods are also useful in providing upper bounds
of lift for the round edge cases to be discussed subsequently.
50

4.1.2 Vortex-flow theories
Considerable progress is being made in the application of Navier-Stokes solutions
to the viscous flow about slender delta wings having leading-edge vortex flow.
However, parametric solutions covering the planforms and combined laminar and
turbulent boundary-layer flows in the Reynolds number range of interest here do not
appear to be available in the literature. Since the development of the specific
solutions required to cover the Reynolds number range and wing geometries covered
here is beyond the scope of this study, two existing vortex flow theories based on
inviscid modeling will be used. These methods are often useful in establishing certain
limits for the viscous flow and provide assistance in evaluating some of the vortex
interactions. This approach is particularly applicable for the sharp leading-edge case,
since the separation is fixed at the leading edge, and two theoretical methods have
been chosen for use in this paper.
At subsonic speeds, the three-dimensional effects are significant and there is no
region, even near the apex, that the flow is conical for either attached or vortex flow.
For some discussion of this fact, the reader is referred, for example, to Thwaites
(1960), and to Luckring (1985b). Therefore, completely three-dimensional theories
will be used herein. However, conical flow solutions can be useful as a base for
evaluating the magnitude of three-dimensional effects and for qualitative studies
where their reduced computational requirements become attractive. The two non-
conical flow theories selected for use in this paper are the leading-edge suction
analogy and the free-vortex sheet method. These methods have been used
extensively, particularly for delta wings, and contribute to the hierarchy of flow
modeling that is useful in establishing the magnitude of some of the vortex flow effects.
The leading-edge suction analogy, developed by Polhamus (1966), is illustrated in
part (a) of figure 4.2. This analogy equates the attached flow leading-edge suction
force to the normal force produced by the separation-induced vortex flow, thereby
51

allowing linearized flow theory to be used for this nonlinear flow phenomenon. As a
consequence, theoretical complexity and numerical run time, as well as cost, are
greatly reduced and the limitations of slender-wing conical-flow theories are
overcome. Briefly, this analogy assumes that the normal force associated with the
vortex-induced reattachment of the flow is equal to the leading-edge suction force lost
due to the separation. For detailed descriptions and evaluations of the method, the
reader is referred to Polhamus (1969, 1986), and Lamar and Luckring (1979). This
method provides accurate values of the overall forces and moments until vortex
breakdown or strong interactions between the vortices are encountered.
The free-vortex-sheet theory (FVS) provides, in addition to overall forces and
moments, detailed pressure distributions and accurately accounts for the vortex
interactions. The wing and vortex sheets are modeled with biquadratically varying
doublet panels; thickness effects can be represented with bilinear source panels.
Salient features of this formulation are illustrated in part (b) of figure 4.2 and include:
(1) the free-vortex-sheet which is locally force free and is a stream surface, (2) the fed
sheet which approximates the physics of the vortex core region in a far field sense, (3)
a higher-order near wake which accurately satisfies the trailing-edge kutta condition
by accounting for the effects of nonplanar vorticity, and (4) a trailing wake. Neither the
shape of the three-dimensional vortex sheets nor the distribution of vorticity strength
on them is known a priori, which results in a nonlinear problem requiring iteration
schemes. The initial development work and some early applications are described by
Gloss and Johnson (1976), and a current form of the computer program is documented
by Johnson, et. al. (1980). Extensive validation and application studies have been
carried out, and some are reviewed in the paper by Luckring, et. al. (1982). Additional
improvements to the convergence properties of this method and listings of published
solutions have been presented by Luckring, et. al. (1986).
52
Figure 4.3 compares both the suction analogy and free-vortex sheet theoretical
results with the experimental lift of two highly swept delta wings having sharp leading-
edges. The wings selected have leading-edge sweep angles of 70° and 80° and the
experimental data are from Wentz and Kohlman (1971). For clarity the identification of
the various calculated results is split between the two figures. The lift calculated by
the suction analogy is believed to provide the "upper bound" of lift corresponding to an
assumed condition where the cores of the vortices remain essentially along the wing-
leading edges. In addition, the analogy does not account for vortex breakdown effects.
The shaded region between the two theoretical results represents the loss of lift
associated with the actual vortex core trajectories which are modeled in the free-
vortex-sheet theory. There are two major features of these trajectories. First, and
believed foremost, are the vortex-core trajectories in a cross flow plane which, with
increasing angle of attack are in the upward and inward directions until their mutual
interaction forces a spanwise reversal. This condition, defined as "diverging cores," is
taken as a crude measure of the onset of strong vortex interactions or "crowding,"
which hinder flow reattachment to the wing surface thereby causing incomplete
recovery of leading-edge suction as vortex-induced normal force in the context of the
suction analogy. The lift coefficient for which the free-vortex-sheet theory predicts that
the vortex cores begin to reverse their paths and move outboard with increasing angle
of attack is indicated in figure 4.3 by the solid arrows. This "diverging cores" condition
appears to reasonably predict the onset of incomplete suction recovery for both wings
as illustrated in figure 4.3 by the cross-hatched regions representing the loss of lift
relative to the suction analogy predictions.
The second trajectory feature modeled in the free-vortex-sheet theory is the upward
curvature of the vortex cores as they approach the trailing edge. It is believed that its
influence is primarily concentrated near the trailing edge and is secondary to the
"diverging cores" effect. Shown on figure 4.3 by the half-solid arrows are the
53

theoretical values of lift coefficient for which vortex instability occurs as defined by the
theory for the critical swirl condition developed by Luckring (1985). It is seen that for
both wings this prediction, which relates to the onset of vortex breakdown, is in good
agreement with the experimental maximum lift coefficient which was shown by Wentz
and Kohlman (1971) to correspond to the condition where vortex breakdown in the
wake has progressed forward to the trailing edge of the wing. With regard to the
maximum lift, the free-vortex sheet theory results shown for the 80 ° delta indicate that
little increase would be expected by eliminating vortex breakdown. However, for the
70 ° delta, which is of more practical interest for supersonic aircraft, the free-vortex
sheet solutions indicate that sizable increases in maximum lift might be attainable
by delaying vortex breakdown. A review of some effects of Reynolds number, sweep
and profile on the lift characteristics of delta wings in the stall region will be presented
in the following sections.
4.2Sharp Leading-Edge Delta Wing Reynolds Number Studies
Because of the interest in delta-type wings for supersonic cruise aircraft where
wave drag tends to dictate relatively sharp wing leading-edges, the sharp leading-
edge delta wing has been selected to be discussed first. In addition, both the
experimental and theoretical results for the sharp edge cases provide informative
"upper bounds" of vortex lift which will also be used in the analysis of the round
leading edge cases in a subsequent section.
4.2.1 Overall lift characteristics
For the sharp leading-edge case separation is, of course, fixed at the leading edge
and little Reynolds number effect on the overall lift would be expected, except for
possible effects of the secondary separation occurring in the outboard directed flow
induced under the primary vortex. It was found in early studies of the vortex flow on
slender, sharp-edge wings that the overall lift was, indeed, essentially independent of
Reynolds number despite the existence of Reynolds number effects associated with
54

secondary separation on the surface pressure distributions. This Reynolds number
independence for overall lift is illustrated in figure 4.4 for two leading-edge sweep
angles. The data for the 70° wing was obtained from Gould and Cowdrey (1958), and
for the 76° wing from Lemaire (1965). From these results, which were obtained with
free transition, it is apparent that Reynolds number plays an insignificant role with
regard to overall lift and stall, at least over the Reynolds number and wing sweep
ranges investigated. Inasmuch as transition to turbulent flow along the primary
reattachment line moves forward with both increasing angle of attack (see Hummel
and Redeker (1972) for example), a rather wide variation in transition locations would
be expected to be associated with these results. Pressure data at e_= 25° for the 76°
delta wing, to be discussed subsequently, illustrate these effects and the resulting
sizable redistribution of pressures with Reynolds number in a manner that maintains
essentially constant total lift. Additional total lift data illustrating the insensitivity of the
overall lift to Reynolds number has been published by Peckham (1961).
Also shown in figure 4.4 are the theoretical calculations using the previously
described suction analogy and free-vortex sheet methods. The comparisons of the
two theories with the experimental results in figure 4.4 indicate that they are in
excellent agreement and predict rather accurately the experimental results up to the lift
coefficient corresponding to the theoretical critical swirl discussed above. The low
values of lift predicted by attached flow theory provides a base for illustrating the well
known large increase in lift associated with the vortex flow.
As the angle-of-attack increases beyond the lift coefficient for critical swirl the vortex
breakdown point moves forward resulting in a gentle stall somewhat analogous to the
trailing-edge class of stall which occurs on round edge airfoils as trailing-edge
separation migrates forward from the trailing edge. However, the vortex breakdown
type of stall is independent of Reynolds number over the range studied for these sharp
leading-edge delta wings. As can be seen from figures 4.3 and 4.4 the leading-edge
55

vortex flow provides an increase in maximum lift relative to attached flow for these
slender wings.
4.2.2 Secondary-vortex flow
As discussed above, the overall lift of thin, sharp-edge delta wings is essentially
invariant with Reynolds number. For these wings, where the primary separation is
fixed at the sharp leading-edge, regardless of the state of the boundary layer
approaching the sharp-edge from the stagnation line, this invariance is not totally
unexpected. However, flow details associated with the state of the boundary layer on
the wing upper surface can cause rather large variations in the pressure distributions
through effects on the location and strength of secondary vortices and their
subsequent influence on the primary vortices. These vortices occur when the flow
under the primary vortex is swept toward the wing leading-edge by the action of the
primary vortex encounters the adverse pressure gradient near the leading edge, then
separates and rolls up into the so-called secondary vortex. This secondary vortex lies
under, and outboard of the primary vortex core and has vorticity of the opposite sign
relative to the primary vortex. This is illustrated in figure 4.5 by flow sketches and
measured characteristics. The sketch on the left represents, generically, the vortex
flow encountered on a slender sharp-edged delta wing. The primary and secondary
vortices are illustrated on the right hand panel of the wing but are omitted on the left
hand panel in order to facilitate the illustration of a typical transition of the secondary
separation line from a laminar condition in the forward region of the wing to a turbulent
condition (over the rear portion of the wing) which is further outboard. It should be
noted that the size of the secondary vortex is exaggerated for illustrative purposes.
The longitudinal location of this transition is, of course, a function of Reynolds number,
angle of attack, and surface condition and will move forward as the Reynolds number
or angle of attack is increased.
56

Shown on the right of figure 4.5 are the results of Lemaire (1965) illustrating the
measured spanwise pressure distributions on the sharp edge 76° delta wing of figure
4.4. The wing has a 5-percent thick biconvex airfoil in the stream direction and the
data was taken at an angle-of-attack of 25° which, as seen from figure 4.4, is well
below the angle for critical swirl which defines the onset of vortex breakdown. For
slender delta wings, spanwise distributions tend to be more informative than
chordwise Ioadings and are used here. The upper surface pressures are plotted in the
spanwise direction at the 25 percent root chord longitudinal location, as seen in the
sketch, for the same Reynolds numbers as for the force data of figure 4.4. Also shown
is the inviscid pressure distribution from the free-vortex-sheet method, described
earlier, to illustrate the general character of the adverse pressure gradient
encountered during the development of the secondary separation under the primary
vortex.
It will be noted that for all the Reynolds numbers tested the deviations from the
pressures calculated by the inviscid free-vortex-sheet theory, which includes only the
primary vortex, indicate two pressure peaks; one inboard, which is under the primary
vortex, and one outboard, under the secondary vortex.
It appears that the results for the Reynolds numbers (based on root chord) of 1.6 x
106 and 3.2 x 10⁶ represent the laminar secondary separation condition with the
suction peaks under both the primary and secondary vortices clearly evident and of
similar magnitude. This is probably due to the fact that the laminar separation occurs
in a high velocity region since it has difficulty penetrating the adverse gradient
(represented by the FVS theory). Thus the secondary vortex strength is greater than it
would be for turbulent separation.
The data for the Reynolds numbers of 4.8 x 10⁶ and 6.4 x 10⁶ illustrate that the
transition to a turbulent secondary separation results in a reduced strength of the
secondary vortex and a corresponding increased strength of the primary vortex. Thus
57

the pressure distribution approaches that of the inviscid free-vortex-sheet solution as
Reynolds number increases. It is important to notice that while Reynolds number has
a pronounced effect on the spanwise distribution of the upper surface pressures the
change in lift under the two vortices is such as to maintain a relatively constant upper
surface lift. This is consistent with the results of figure 4.4 which shows the total lift to
be essentially independent of Reynolds number. Thus there seems to be a
conservation of lift, possibly related to the suction analogy, that might be worth further
study. From the lift data it appears that this conservation extends into the stall region.
In connection with the natural transition along the secondary separation line it is of
interest that in a study on a similar delta wing Hummel (1965) concluded that transition
from laminar to turbulent secondary separation, for o_= 25 ° occurred at a constant local
Reynolds number of about 0.75 x 10⁶ based on x. Converting to the model size in
Lemaire's study a value of 3.0 x 10⁶ results which is in relatively good agreement with
figure 4.5. Lemaire (1965) provided a considerable amount of additional data, which
has been utilized by Polhamus (1986) to illustrate, at a more aft station, the non-
conical flow effects, the conservation of lift, etc. Some Reynolds number studies have
also been made by Carcaillet, et. al. (1986) on a 75 ° delta wing.
Finally, it should be mentioned that with regard to the strong effects of secondary
separation on the surface pressure distributions, some evidence that the boundary
layer displacement effects may be important has been generated in a study by Wai et.
al. (1985).
4.2.3 Maximum lift coefficient
This section presents a brief summary of the measured maximum lift coefficients of
slender sharp-edged delta wings along with some of the related information that can
be extracted from the suction analogy and the free-vortex-sheet theory. The results
are presented in figure 4.6 as a function of leading-edge sweep angle.
58
Shown by the dashed line is a variation of the maximum lift coefficient as predicted
by the suction analogy which is believed to represent the condition that would occur if
the leading-edge vortex were to remain near the wing surface. Comparison with the
free-vortex-sheet results (solid line) provides an indication of the loss in maximum lift
coefficient, associated with the actual vortex trajectory that occurs above a sweep
angle of about 65°.
The free-vortex-sheet solution for CL,max represents the case where vortex
interactions, with regard to vortex strength, size, and path, are included but where
vortex breakdown and secondary separation is neglected. In order to provide a
"bench mark" relative to vortex breakdown, the dash-dot curve represents the lift
coefficient corresponding to the occurrence of the critical value of the swirl parameter
at the trailing edge which precipitates vortex breakdown. This result was obtained by
Luckring (1985) using the free-vortex-sheet theory and a concept of a critical swirl
angle which defines the vortex instability condition. Above this critical swirl boundary,
the forward migration of vortex breakdown causes reductions in the growth of lift with
angle of attack to occur. It is of particular interest to note that above a leading-edge
sweep angle of about 75° a rather narrow "corridor" is formed between the free-vortex-
sheet solution for CL,maxand the critical swirl boundary. This implies that vortex
breakdown will have a relatively small effect on CL,maxfor these highly swept delta
wings since it occurs very near to the theoretical value of CL,maxwithout breakdown.
The significance of the above observation can been seen from the experimental
values of CL,maxobtained by Wentz (1968) for sharp edged delta wings as shown by
the circular symbols. The experimental values fall within the narrow theoretical
"corridor" in the high-sweep-angle range and the rapid loss of CL,maxwith increasing
sweep in this range can be well predicted with the combination of the two theories.
It appears that in this high sweep range, the presence of secondary separation has
little effect on the maximum lift. In the lower sweep range, the increase in CL,maxwith
59

increasing sweep reflects the similar trend in the theoretical values of the lift coefficient
corresponding to the trailing-edge location of the cdtical swirl parameter. In this region
of sweep angles, the theory indicates that large increases in CL, max are available if
design techniques for the delay in vortex breakdown can be developed.
It is important to keep in mind that while the overall lift for these sharp-edged wings
are relatively insensitive to Reynolds number, the aerodynamic load distribution
characteristics are sensitive to Reynolds number through the effects of secondary
separation. Also, it should be pointed out that the secondary separation and resulting
secondary vortex flow can have an influence when designing the planform and
camber lines to optimize a particular aspect of the vortex flow. This, of course, applies
to either fixed geometry wings or for devices such as "vortex flaps." It is important
therefore, that theoretical methods be extended to include high Reynolds number
secondary separation and that consideration be given to obtaining experimental data
at higher Reynolds numbers.
4.3 Round Leading-Edge Delta Wings
It appears that there is insufficient data in the literature to adequately illustrate the
effects of Reynolds number on the lift characteristics in the stall region for delta wings
having round leading-edge airfoil sections and the reader is referred to section 3.3.3
dealing with constant chord sweptback wings. However, data is available which
allows a brief analysis of the effect of wing profile on the stall characteristics of slender
delta wings which will be used to conclude this section on slender delta wings.
4.3.1 Effect of profile
The effects of wing profile for a 76 ° delta planform are shown in figure 4.7. This
figure is similar to one published much earlier by Weber (1955) but has been updated
for the purposes of this paper by using the sharp edge data of Lemaire (1965)
discussed earlier, and by using the suction analogy and free vortex sheet solutions for
the vortex flow upper bound. Results for three profiles (parallel to the plane of
60

symmetry) are shown; the 5-percent thick biconvex from Lemaire (1965), and two
round leading edge profiles, an FFA 104-5106 (10-percent thick) from Bemdt (1949),
and an NACA 0012 from Lange/Wacke (1948). The leading-edge radius is indicated
for each airfoil in percentage of the local streamwise chord. It should be noted that the
results shown in figure 4.7 include some relatively small differences in Reynolds
number with the biconvex data being obtained at a root-chord Reynolds number of 1.6
x 106, the FFA 104 at 2.0 x 10⁶, and the 0012 at 2.3 x 10⁶. However, since the sharp-
edge case has been shown to be essentially insensitive to Reynolds number in this
range (see figure 4.4) comparisons of the round-edge cases with the sharp-edge case
represent the profile effect for the Reynolds number associated with the particular
round-edge wing. The comparison of the two round edge wing cases, while
containing some possible Reynolds number effects, at least qualatatively illustrate the
type of effect on vortex lift associated with leading-edge radius.
The reduction in lift as the leading-edge radius is increases is due, of course, to the
reduced magnitude of the adverse pressure gradient at the leading-edge which delays
the turbulent reseparation near the leading-edge thereby delaying the formation of the
leading-edge vortex. This results in a reduction of vortex lift in accordance with the
"conservation of suction" concept discussed by Polhamus (1986).
During the early period of the development and application of the "suction analogy"
to delta wings the possibility, for the round edge case, that the portion of the theoretical
leading-edge suction lost would be recovered as vortex-induced normal force was
explored. It was found that when the experimental values of the vortex-induced
normal force and the remaining leading-edge suction were added, they were
essentially equal to the full theoretical leading-edge suction. This provided an
indication that the conservation of suction implied by the suction analogy for the sharp-
edge wings also applied to the round-edge case. This initial study was not published
at the time but was published several years later, with permission, by Kulfan (1979).
61

The first application of the concept to be published was that of Henderson (1976), who
demonstrated experimentally that it applied to a variety of wing planforms.
From the distribution of the theoretical cotangent loading shown in figure 4.1 it is
apparent that the onset of turbulent reseparation for these round edge delta wings and
the resulting vortex expands inboard rather slowly with increasing angle-of-attack.
This, of course, differs greatly from the sharp edge case, discussed earlier, where
separation and loss of leading-edge suction, occurs all along the edge at a very low
angle of attack. Any attempt to apply the various concepts noted in this section
regarding the influence of turbulent reseparation or to extend the "critical swirl" theory
of vortex breakdown to the round edge wings, etc., in order to predict the stall
characteristics is beyond the scope of this paper. However, it should be noted that in
contrast to the two-dimensional airfoil cases discussed in section 1.5 the maximum lift
coefficient for these delta wings is reduced with increasing leading-edge radius due, of
course, to the reduced magnitude of the vortex lift.
5. CONCLUDING REMARKS
This paper presented some selected examples of the effect of Reynolds number on
the low-speed lift characteristics of wings encountering separated flows at their
leading and side edges, with emphasis on the region near the stall. The influence of
leading-edge profile and Reynolds number on the stall characteristics of two-
dimensional airfoils was briefly reviewed, followed by examples of the effects of
Reynolds number and geometry on the lift characteristics near the stall for a series of
three-dimensional wings typical of those suitable for high-speed aircraft and missiles.
Included were examples of the onset and spanwise progression of turbulent
reseparation near the leading edge and illustrations of the degree to which simplified
theoretical approaches are useful in defining the influence of the various geometric
parameters.
62
The examples selected and methods of presentation are believed to provide a
convenient source of information useful in the selection of fruitful test cases for the
evaluation of the capabilities of theoretical viscous flow methods based on the Navier-
Stokes equations. Of particular interest in this regard are the Reynolds number effects
on leading-edge turbulent reseparation and the subsequent transition to vortex flow on
swept back and delta planforms. The strong role played by induced camber was
demonstrated and simplified prediction methods were developed which might be
found useful in evaluating its influence on the lift and stall characteristics predicted by
the developing Navier-Stokes type solutions. Finally it should be noted that the
influences of Reynolds number shown may be helpful in designing research programs
for the high Reynolds number wind tunnels.
63

6. APPENDIX
The functional representation of the chordwise loading used by Multhopp (1950) isgiven by
ACp(_,71)= _,,Lrq°(rl)ctrl)cot(_ / 2)+ n=l_"c--_q"(r/)sin(nO)l
with
¢ = cos-l(1 - 2_)
rl = 2y/b
This functional form was utilized for the modified Multhopp method published byLamar (1968). The nondimensional longitudinal gradient for this distribution is
d,_C,,(¢,_)_ d,_C,,(¢,_) ded(x / c) de d(x / c)
4 _ -qo(rl) _., q,,(rl) ]- zsin¢ Lc(7/)(1---C-_s¢)+ _ cff/) ncos(n@)
Near the leading edge, the dominant contribution to this gradient is due to thecotangent loading.
The chord-loading series implemented by Lan and Lamar (1977) in the methodused for the present computations is
with2 _ p,,(r/)ACp((p,r/) = _- = _(_)h n cos(n¢)
hn(_ ) = cos(n(_) + cos((n + 1)_)sin_
This representation is based upon Chebyshev polynomials as shown by
1 _[Tn(1- 2_) + T,+1(1- 2_) 1hn(_)= 2 :1-_
64

where Tn denotes the nth Chebyshev polynomial of the first kind with the argument1-23. This formulation has been utilized by others and was selected by Lan andLamar for certain advantages in resolving a logarithmic singularity correction over theconventional Multhopp series.
The cotangent loading coefficient, qo, can be extracted from the present loadingform by recognizing
cos(ne) + cos((n + 1)¢)
sine= cot(e / 2)- 2 _ sin(je)
j=l
from which follows
n=0
q,, = _., - 2pj; n > 1j=n
The inverse relations are given by
Po = qo + (1/2)q 1
Pn = (1/2)(qn+, - qn); n > 1
65

A
b
C
Cdp,i.f
Cr
c
CI
Cl,cot
Cl,max
q
CL,inf
L,max
CLvse
Cs
(C,,,U)m,°
FVS
Kp
Kv,le
Kv,se
F_cr
S
X
xle
7. SYMBOLS
wing aspect ratio, b2/s
wing span
streamwise chord
inflection in profile drag versus o_
chord at wing root (q=0)
average chord
section lift coefficient, lift/qc
section lift coefficient produced by contangent type chord loading
maximum c_
three-dimensional-wing lift coefficient, lift/qs
CL for inflection from attached flow theory
maximum CL
side-edge vortex contribution to CL
vortex-flow induced wing normal force coefficient
leading-edge suction coefficient
minimum pressure coefficient on wing upper surface
free vortex sheet
factor in attached flow lift equation
factor in leading-edge vortex lift equation
factor in side-edge vortex lift equation
leading-edge radius
Reynolds number based on root chord
wing semi-span
wing thickness
longitudinal distance from wing leading edge
leading-edge coordinate
66

Xr,I
Xr, s
Y
yc
(_
_crit
A
qo
qn
Z
Cp
distance from L.E. to long bubble reattachment
distance from L.E. to short bubble reattachment
lateral distance from wing centerline
lateral distance from vortex core
angle of attack
angle of attack for turbulent reseparation
leading-edge sweep angle
see figure 2.2(a)
cotangent chordwise loading coefficient
chord-loading coefficient
spanwise station
pressure coefficient, (P-Poo)/qoo
lifting pressure coeffient, Cp, lower - Cp, upper
67

8. REFERENCES
Abbott, Ira H., Yon Doenhoff, Albert E., and Stivers, Louis S., Jr. (1945): Summary of
Airfoil Data. NACA Rep. 824, 1945.
Amal, Daniel (1987): Three-Dimensional Boundary Layers: Laminar-TurbulentTransition. Paper No. 4 of AGARD Rept. No. 741, Feb. 1987.
Berg, B. van den (1981): Role of Laminar Separation Bubbles in Airfoil Leading-EdgeStalls. AIAA Journal, Vol. 19, No. 5, May 1981.
Berndt, S. B. (1949): Three component measurement and flow investigation of plane
delta wings at low speeds and zero yaw. Swedish KTH Aero Tech. Note No. 4,1949.
Betz, A. (1935): Applied Aerofoil Theory. Unsymmetrical and Non-Steady Types ofMotion. Vol. IV of Aerodynamic Theory, div. J, ch. IV, sec. 4, W. F. Durand, ed.,Julius Springer (Berline), 1935, pp. 97-107.
Brebner, G. G.; and Bagley, J. A. (1952): Pressure and Boundary LayerMeasurements on a Two-Dimensional Wing at Low Speed. RAE Report Aero. 2455,
Feb. 1952. (Also available as ARC R&M No. 2886, 1956)
Brebner, G. G.; Wyatt, L. A.; and Ilott, G. P. (1965): Low Speed Wind Tunnel Tests on aSeries of Rectangular Wings of Varying Aspect Ratio and Aerofoil Section. RAETechnical Report No. 65236, Oct. 1965.
Busemann, A. (1935): Aerodynamicher Auftried bei Uberschall geschwindigkeit.Luftfahrtforschung, Bd 12, No. 6, Oct. 3, 1935, pp. 210-220.
Cahill, Jones F.; and Gottlieb, Stanley M. (1950): Low-Speed AerodynamicCharacteristics of a Series of Swept Wings Having NACA 65A006 Airfoil Sections.NACA RM L50F16, 1950.
Carcaillet, R.; Manie, F.; and Pogan, D. (1986): Leading-Edge Vortex Flow over a 75 °Swept Delta Wing: Experimental and Computational Results. ICAS, London,
September 7-12, 1986.
Carrarra, Jean-Marie; and Masson Alain (1980): Three Years of Operation of theONERA Pressurized Subsonic Wind Tunnel. ICAS-80-23.1.
Crabtree, L. F. (1957): Effects of leading-edge separation on thin wings in two-dimensional incompressible flow. J. Aero. Sci. 24, 597-604 (August 1957).
Erlich, Emile (1969): Exemples de Recherches sur les Profils Dans la Soufflerie S 10DU C.E.A.T. A Toulouse. ONERA TP No. 766.
Evans, T. E.; and Mort, K. W. (1959): Analysis of Computed Flow Parameters for a Set
68

of Sudden Stalls in Low-Speed Two-Dimensional Flow, NASA TN D-85, 1959.
Fuchs, R. (1939): Neue Behandlung der Tragflugeltheorie. Ing. Arc., Vol. 10, P. 48.1939. and: Neue Berechnung des Abwinds am Flugel. FB.1035. 1939.
Furlong, G. Chester; and McHugh, James G. (1952): A Summary and Analysis of theLow-Speed Longitudinal Characteristics of Swept Wings at High Reynolds Number.NACA RM L52D16, 1952. (Also available as NASA TR 1339, 1952.)
Gaster, M. (1966): The Structure and Behavior of Laminar Separation Bubbles., NPL.Aero Rept. 1181, Aug. 1966, National Physical Lab, England.
Gault, Donald E. (1949): Boundary-Layer and Stalling Characteristics of the NACA63-009 Airfoil Section. NACA TN 1894, 1949.
Gault, D. E. (1957): A Correlation of Low-Speed Airfoil Section StallingCharacteristics with Reynolds Number and Airfoil Geometry, NACA TN 3963, 1957.
Gloss, B. B.; and Johnson, F. T. (1976): Development of an Aerodynamic TheoryCapable of Predicting Surface Loads on Slender Wings with Vortex Flow.Proceedings of the SCAR Conference. NASA CP-O01, 1976, pp. 55-67.
Gould, R. W. F.; and Cowdrey, D. F. (1958): High Reynolds Number Tests on a 70 °
L.E. Sweptback Delta Wing and Body (HP 100) in the Compressed Air Tunnel. ARCCP No. 387, 1958.
Henderson, W. P. (1976): Effects of Wing Leading-Edge Radius and ReynoldsNumber of Longitudinal Aerodynamic Characteristics of Highly Swept Wing-BodyConfigurations at Subsonic Speeds. NASA TN D-8361, Dec. 1976.
Hummel, Deitrich (1965): Experimentelle Untersuchung der Stroemung aur derSaugseite eines schlanken Deltafluegels. Zietschrift fuer Flugwissenschaften, v. 13,July 1965, pp. 247-252. (English translation available as NASA TM-75897.)
Hummel, D; and Redeker, G. (1972): Experimentelle Bestimmung der gerbundenenWirbellinien sowie des Stromungsverlaufs in der Umgebung der Hinterkante einesschlanken Deltaflugels. Braunschweigische Wissenschaftliche Gesellschaft,Abhandlunge, 1972, pp. 273-290. (English translation available as NASA 17" F-15,012.)
Hurley, D. G. (1955): The Downstream Effect of a Local Thickening of the LaminarBoundary Layer, Aerodynamic Research Laboratires, Australia, Aero Not 146, 1955.
Ingen, J. L. van (1975): On the Calculation of Laminar Separation Bubbles in Two-Dimensional Incompressible Flow. AGARD Conference Proceedings 168, 1975.
Jacobs, Eastman N. (1931): The Aerodynamic Characteristics of Eight Very Thick AAirfoils from Tests in the Variable Density Wind Tunnel. NACA Rep. 391, 1931.
69

Jacobs, Eastman N.; and Sherman, Albert (1937): Airfoil Section Characteristics asAffected by Variations of the Reynolds Number. NACA Rep. 586, 1937.
Johnson, R. T.; Lu, P.; Tinoco, E. N.; and Epton, M. A. (1980): An Improved PanelMethod for the Solution of Three-Dimensional Leading-Edge Vortex Flows. VolumeI. - Theory Document. NASA CR-3278, July 1980.
Jones, B. Melvill (1933): An Experimental Study of the Stalling of Wings. R&M No.1588, British A.R.C., 1933.
Jones, B. Melvill (1934): Stalling. Jour. Royal Aero. Soc., vol. 38, no. 285, Sept. 1934,pp. 753-770. (22d Wilbur Wright Memorial Lecture.)
Jones, George W., Jr. (1952): Investigation of the Effects of Variations inCharacteristics of Three Low-Aspect-Ratio Symmetrical Wings with RectangularPlanforms. NACA RM L52G18, September 1952.
Jones, R. T. (1946): Wing Plan Forms for High-Speed Flight. NASA TN NO. 1033,1946.
Knight, Montgomery and Loeser, Oscar, Jr.: Pressure Distribution Over a RectangularMonoplane Wing Model up to 90° Angle of Attack. NACA Report No. 288, 1927.
Kolbe, Carl D.; and Boltz, Frederick W. (1951): The Forces and Pressure Distributionat Subsonic Speeds on a Plane Wing Having 45° of Sweepback, an Aspect Rationof 3, and a Taper Ration of 0.5. NACA RM A51G31, October 1951.
Kuchemann, D. (1953): Types of Flow on Swept Wings - With Special Reference toFree Boundaries and Vortex Sheets. RAE TN Aero 2234, March 1953.
Kuchemann, D. (1978): The Aerodynamic Design of Aircraft. Pergamon Press, 1978.
Kulfan, R. M. (1979): Wing Airfoil Shape Effects on the Development of Leading EdgeVortices. AIAA Paper No. 79-1675, 1979.
Ladson, Charles L. (1988): Effects of Independent Variation of Mach and ReynoldsNumbers on the Low-Speed Aerodynamic Characteristics of the NACA 0012 AirfoilSection, NASA TM 4074, 1988.
Lamar, John E. (1968): A Modified Multhopp Approach for Predicting Lifting Pressuresand Camber Shape for Composite Planforms in Subsonic Speeds. NASA TN D-4427, 1968.
Lamar, John E. (1974): Extension of Leading-Edge-Suction Analogy to Wings withSeparated Flow Around the Side Edges at Subsonic Speeds. NASA TR R-428,October 1974.
7o

Lamar, J. E.; and Luckring, J. M. (1979): Recent Theoretical Developments andExperimental Studies Pertinent to vortex Flow Aerodynamics - With a View TowardsDesign. High Angle of Attack Aerodynamics, AGARD CP-247, Paper No. 24, Jan.1979.
Lan, Edward C.; and Lamar, John E. (1977): On the Logarithmic-SingularityCorrection in the Kernel Function Method of Subsonic Lifting-Surface Theory.NASA TN D-8513, Nov. 1977.
Lancaster, F. W. (1907): Aerodynamics: Constituting the First Volume of a CompleteWork on Aerial Flight. Constable & Co. Ltd. London, 1907.
Lange/Wacke (1948): Test Report on Three- and Six-Component Measurements ona Series of Tapered Wings of Small Aspect Ratio. (Partial Report: Triangular Wing).TM 1176, may 1948.
Lawrence, H. R. (1951): The Lift Distribution on Low Aspect Ratio Wings at SubsonicSpeeds. Jour. Aero. Sci., vol. 18, no. 10, Oct. 1951, pp. 683-695.
Legendre, R. (1981): Rolling up of Vortex Sheets From the Edges of Lifting Surfaces.Reckerke Aerospaticle, (1981-2).
Lemaire, D. A. (1965): Some Observations of the Low-Speed Flow Over a Sharp-Edged Delta Wing of Unit Aspect Ratio. ARL Aerodynamics Report 126, Melbourne,Australia, Jan. 1965.
Loftin, Laurence K. (1947): Theoretical and Experimental Data for a Number of NACA6A-Series Airfoil Sections. NACA TR 903, 1947.
Loftin, Laurence K.; and Bursnall, William J. (1948): The Effects of Variation in
Reynolds Number Between 3.0 x 10⁶ and 25.0 x 10⁶ Upon the Aerodynamic
Characteristics of a Number of NACA 6-Series Airfoil Sections. NACA TR 964,1948.
Loftin, Laurence K., Jr.; and Smith, Hamilton A. (1949): Aerodynamic Characteristics
of 15 NACA Airfoil Sections at Seven Reynolds Numbers from 0.7 x 10⁶ to 9.0 x
106. NACA TN 1945, 1949.
Lomax, Harvard; and Sluder, Loma (1952): Chordwise and CompressibilityCorrections to Slender-Wing Theory. NACA Rep. 1105, 1952. (Supersedes NACATN 2295.)
Luckring, J. M.; Schoonover, W. E., Jr.; and Frink, N. T. (1982): Recent Advances inApplying Free Vortex Sheet Theory for the Estimation of Vortex Flow Aerodynamics.AIAA Paper No. 82-0095, 1982.
Luckring, James Michael (1985a): A Method for Computing the Core Flow in Three-
71

Dimensional Leading-Edge Vortices. PhD dissertation, Department of Mechanical
and Aerospace Engineering. North Carolina State University, Raleigh, NorthCarolina, May 1985.
Luckring, James M. (1985b): A Theory for the Core of a Three-Dimensional Leading-Edge Vortex. AIAA Paper No. 85-0108, 1985.
Luckring, J. M.; Hoffler, K. D.; and Grantz, A. C. (1986): Recent Extensions to the FreeVortex Sheet Theory for Expanded Convergence Capability. NASA CP-2416, 1986.
Manie, F.; Rehbach, C.; and Schmitt, V. (1978): Etude D'une Aile a Fleche Variable enEcoulement sub ou Transsonique. ICAS, Lisbonne, 1978.
McCullough, George B.; and Gault, Donald E. (1948): An Experimental Investigationof the NACA 63-012 Airfoil Section with Leading-Edge Suction Slots. NACA TN
1683, 1948.
McCullough, George B.; and Gault, Donald E. (1949): Boundary-Layer and StallingCharacteristics of the NACA 64A006 Airfoil Section. NACA TN 1923, 1949.
McCullough, George B.; and Gault, Donald E. (1951): Examples of ThreeRepresentative Types of Airfoil-Section Stall at Low Speed. NACA TN 2502, 1951.
McCullough, George B.: The Effect of Reynolds number on the stalling characteristicsand pressure distributions of four moderately thin airfoil sections. NACA TN 3524,1955.
Millikan, C. B.; and Klein, A. L. (1933): The Effect of Turbulence. Aircraft Engineering,
vol. 5, no. 8, August 1933, pp. 169-174.
Multhopp, H. (1950): Methods for Calculating the Lift Distribution of Wings (SubsonicLifting-Surface Theory). R&M No. 2884. British A.R.C., Jan. 1950.
Munk, Max M. (1923): Note on the Relative Effect of the Dihedral and the Sweep Backof Airplane Wings. NACA TN 177, 1923.
Muse, Thomas C. (1943): Some Effects of Reynolds and Mach Numbers on the Lift ofan NACA 0012 Rectangular Wing in the NACA 19-Foot Pressure Tunnel. NACA
Wartime Report L-406 (originally published as Confidential Bulletin 3E29, May
1943).
Owen, P. R. and L. Klanfer (1953): On the laminar boundary layer separation from theleading edge of a thin aerofoil. RAE Rep. Aero. 2508 (Oct. 1953); reissued as A.R.C.
CP 220 (1955).
Peckham, D. H. (1961): Low-Speed Wind-Tunnel Tests on a Series of UncamberedSlender Pointed Wings with Sharp Edges. ARC R&M No. 3186, 1961.
72

Polhamus, Edward C. (1955): A note on the drag due to lift of rectangular wings of lowaspect ratio. NACA TN 3324, January 1955.
Polhamus, E. C. (1966): A Concept of the Vortex Lift of Sharp-Edge Delta WingsBased on a Leading-Edge-Suction Analogy. NASA TN D-3767, 1966.
Polhamus, E. C. (1969): Predictions of Vortex-Lift Characteristics by a Leading-EdgeSuction Analogy. AIAA Paper 59-1133, Oct. 1969.
Polhamus, Edward C. (1986): Vortex Lift Research: Early Contributions and SomeCurrent Challenges. NASA CP-2416, 1986.
Poll, D. I. A. (1983): On the Generation and Subsequent Development of Spiral VortexFlow Over a Swept-Back Wing. In AGARD-CP-342, July 1983.
Poll, D. I. A. (1986): Spiral Vortex Flow Over a Swept-Back Wing. AeronauticalJournal, May 1986.
Rose, Leonard M.; and Altman, John M. (1950): Low-Speed Investigation of theStalling of a Thin, Faired, Double-Wedge Airfoil with Nose Flap. NACA TN 2171,1950.
Tani, I (1964): Low-Speed Flow Involving Bubble Separations, Progress inAeronautical Science, vol. 5, Pergamon Press, New York, pp. 70-103, 1964.
Thwaites, B. (Editor) (1960): Incompressible Aerodynamics. Oxford University Press,1960.
von Doenhoff, Albert E. (1938): A Preliminary Investigation of Boundary-LayerTransition Along a Flat Plate with Adverse Pressure Gradient. NACA TN 639, 1938.
Wallis, R. A. (1954): Experiments with Air Jets to Control the Nose Stall on a 3 ft.Chord NACA 64A006 Aerofoil, Aeronautical Research Laboratoires, Australia, AeroNote 139, 1954.
Weber, J. (1955): Some Effects of Flow Separation on Slender Delta Wings. RAETech Note AERO 2425, 1955.
Wentz, W. H., Jr. (1968): Wind Tunnel Investigations of Vortex Breakdown on SlenderSharp-Edge Wings. NASA CR-98737, 1968.
Wieghardt, K. (1939): Uber die Auftriebsverteilung des einfachen Rechtecksflugelsuber die Tiefe. Zeitschr. f. angew. Math. U. Mach. vol. 19, p. 257, 1939 (English ttranslation available as NACA TM 963).
Wilson, H. A.; and Lovell, J. C. (1946): Full-Scale Investigation of the Maximum Lift
Flow Characteristics of an Airplane Having Approximately Triangular Planform.NACA RM L6K20, Nov. 1946.
73

Winter, H. (1936): Flow Phenomena on Plates and Airfoils of Short Span. NACA TM-798, 1936.
Zimmerman, C. H. (1932): Characteristics of Clark Y Airfoils of Small Aspect Ratios.NACA Report 431, 1932.
74

9. ACKNOWLEDGEMENT
The author gratefully acknowledges the many helpful suggestions ofJames M. Luckring, Head of Langley's Transonic Supersonic Aerodynamics Branch,who also provided the appendix and performed the final technical review.
75

Expanding
long bubble
/- Contracting Trailing-edge
separation \
B
B
(/
(a) Thin-airfoil stall
B
///_ Turbulent
eseparation
(3(
(b) Leading-edge stall
Leading-edgestall
B
Cl
/Ct
(c) Trailing edge/Leading-edge stall
Figure I. 1 Types of stall associated with leading-edge separation as classified by Gault (1957).
Xr, IC
1.0
.8
.6
.4
.2
0
.02
Xr, s.01
C
0
_ [] Long-bubble -_
- Double -_. t / reat_c-h?ent \
i wedgef S t _ /r,t___
L /i /7- <_ reseparation
I O_. '_. _ TurbulentI I = I I . l I J reattachment 7
T Transitional _ /--_/
...... _ _ short-bubble _ [/
t64AI O6U_ i_1 __ I_ 631 012 ---__//_- --
2 4 6 8 10 12 14or, deg
Figure 1.2 Effect of angle-of-attack on turbulent reattachment location. See text for data sources.Rc = 5.8 x 10⁶
76

[] Turbulent reseparation onset T.E/L.E. stall
1.6 [ • Non-reattached long bubbleL.E,stall 631-012,
1.2 l-- Thin airfoil stall 63-009 J I
64A006
c! .8
.4
I0 0 0 0 4 8 12 16
_., deg
Figure 1.3 Lift characteristics for airfoils of figure 1.2. Data from McCullough and Gault (1951).R c = 5.8 x 10 6
LE. stall T.E. stall
Thin-airfoil stall L.E. stall 9 x 10⁶ 15 x 1061.2 6 x 10⁶
.8.
cI
I--- _ _ Turbulent.4 | _ / ID reseparation
I/ / oo,etV I I V I I I I
0 0 4 8 12 0 0 4 8 12 16
c_, deg o_, deg
(a) NACA 66-009 (b) NACA 64-009
Figure 1.4 Effect of Rc on stall. See text for data sources.
77

1.6
1.2
r/c, % .8
.4
, llllllllllllllll//h.
@ _,,,o........... 7,), _ Trailing-edge/.I-./L.I-. sTanu{I)} ',__1_ stall (O)
% • _ i • ooo• ",,,@ @ I_ I]
'% ""-.,,. I '_.% o
j. ',% ,..,L.E.(0)_",,,,,,,,.,% . -, aa
Thin-aidoil _'_/;,7/_/_-_, 0 '/////Ill]l/M/ istall (5) ' ////////////////H/////
I
-5 _ 5 55
0 I I I I II l I6 106 2 3 6 9107 2 3
Rc
63-015
65-015
63-01264-01265-012
63-010
63-00964-00965-009
5 64-006
Figure 1.5 Stall boundaries as a function of leading-edge radius and R cbased on NACA 6-seriessymmetrical airfoils. See text for data sources.
1.6 --
c l, max
1.4
1.2
1.0
.8
.66
-- _g-edge
/ _ "///,. stall
-- / <__ ---Airfoil
/ _"" ,_F'_ "_/. O 631-012_ / v ,.'_ -- [] 641-012
,/C_///_m//////#//////' _ 0 651-012
[2// _////////_""" y-- /X 63-009_ • _ V 64-009
Thin-airfoil /1 65-009
stall r,,, 66-009
I t _ I j D 64-006
106 3 6 107 3
r/c, %
1.09
1.04
1.000.63
0.58
0.55
0.530.26
ac
Figure 1.6 Some examples of the effects of Rc and leading-edge radius on ctmx. See text for data
sources.
78

1.8
1.6
1.4
C/, max
1.2
1.0
M_
© 0.15
[]0 0.25 ./_ v ,
A 0.30 _//EE "v ',
..... Constant Pt
.8 -I I I I I I I3 6 106 3 6 107 3
Rc
Figure 1.7 Effect of Mach number and Reynolds number on q for NACA 0012 airfoil.
1.8
1.6
1.4
CI, max
1.2
.8 -I l3 6
1.0
M_
© <0.12[] 0.12 ,,"" _"
0.180.24 / _z_
0.30_ '_
..... Constant Moo = O. 12
J extrapolationI I I I I
106 3 6 107 3
Rc
Figure 1.8 Effect of Mach number and Reynolds number on ct,,_ x for ONERA "D" airfoil.
79

-Cp
A=10',_ _- A= _ J
0 1.0x/c
(a) Attached flow.
Ct= 1.0q=O
xJc
-Cp .... ......2
0 1.0
q
(b) Leading-and side-edge separation.
Figure 2.1 Some types of flow to be discussed in relation to the stall of rectangular wings.
2Iqo(q)ACp(¢, q) : _ Lc--_--_-cot(_/2)
qn(q) sin(n_) 1+n:l c--_- )
- 2ACp
0 .2 .4 .6 .8 1.0
x/c
(a) ACp formulation.
4
3
2
l
--_rl
A=0.5
q__2sinC
0
-1
-2I
0
q3 sin 30C
q_lsineC
I I I I I.2 .4 .6 .8 1.0
x/c
(b) Chordwise loading coefficients, c, = 1.0.
Figure 2.2 The chordwise loading functions used in determining ACp.
8O

4
P
3
2
1.05
t '!ll KT 1', /--Total "[ A_05
--'_L / _-%._,-_ f ol- i.o
1.00
30
20
10-
0 .2 .4 .6 .8 1.0 0
/- Region of turbulent/ reseparation onset
/ (fig. 1.3)
Zt_
x/c
• K__T_
i I i I.010 .020x/c
(a) ACp comparisons Co) Accuracy of cot _- term near leading-edge
Figure 2.3 Calculated influence of induced camber on the ACp distribution at the root of an aspectratio 0.5 rectangular wing.
,5 - ,
m°
2.0
1.5-
1.0
.5 --
_ cl__._z,cot 2.0
, C Lcot
_'-_._ C[ /.._.__
\ 1.6
x\ 1.4\
__ \cl _ -.. \
CL "",)_ 1.2
, , 't
1.8
I I 1.00 .2 .4 .6 .8 1.0 0
q
(a) Spanwise variations, A=0.5
Lc;-/,_ _-o
I 42 4 6 8
A
(b) Effect of A; r/= 0
Figure 2.4 Some calculated variations of C,,cot parameters.
81

(-Cp,u)q
5(
=0
4
- i
4 _ _ _,
2' I0 .01
A= 1.4
Ii
IA c!
O 1.4 0.78
[] oo 0.78co 0.96
I I
A= 1.0
O 1.0 0.76I- ',\ ID _o076| ",_ I<>_ _0_
I !3_-_..0
I I I0.02 .03 .01 .02 .03
x/c x/c
|
c l, cot
I1.03
Figure 2.5 Effect of induced camber on pressure distribution near leading edge at root section forrectangular wings.
c i
1.2
.8
.4
A= oo
I
Rc = 1.7 x 10⁶
A = 4.0I
[ ' I A=2.5I
Predicted turbulentreseparation onset c!
r Rc 1.6 x 10⁶ [_= A= 1.0
-'_ _ A =,0.5
I, I0 10 0 0 0 0 10 20 30
ct, deg ct, deg
Figure 2.6 Effect of aspect ratio on lift coefficient at root section. Square symbols representinverted model results.
82

2.2 --
2.0 / (cl, c°t)q =0
1.8 ---(SL
1.6
1.4
1.2-
1.0 ICL I I I0 2 6 8
6.0
5.0
4.0
3.0
2.0
I¢ I I I !4 0 2 4 6 8
A A
(a) Root section lift terms (b) Attached flow and vortex lift terms
Figure 2.7 variation with aspect ratio of various theoretical lift terms for rectangular wings.
A=Qo A=6 A=3 A=2
/ / Predicted
CL
1.6
1.2
c2 .8
/
,,_-_ j_- CLmax_"_ /_.IJ_- c_ [_- Turb.
& .,_./(_ /_."1_ resep.
/ -/../ .y_ c_-/ _ _-A_ached l
// c/C3 7 _ +VOFIexIThe°ry
.4 __/ / /"' ' "- Attached J
0 Y If I I I0 10 20 0 0 0 10 20
or, deg et,deg
30
Figure 2.8 Effect of aspect ratio on the total lift of rectangular wings Rc = 3 x 10⁶, NACA 0012airfoil sections.
83

1.8i_
CL, max
1.6
1.4
1.2
1.0
CL, max (exp.) A =,_
, re/ ......CC,_v / //..-"" _'-- Turbulent d_cted
/ _,/ reseparation
/J- //'"''"_CL max (exp.)A _ 6
onset
.4-- t J I I l I
3 6 10 6 3 6 10 7
Rc
Figure 2.9 Comparison of predicted and measured CL.max
I I
3 6
as a function of R,
rectangular wing of NACA 0012 section. Data from Muse (1943).
1.8-
1.6
1.4
1.2
p
B
1.0--
.8--
.6 --
I
10 8
for an aspect ration 6
CL, max
CL, max(exp.) A =_eCL ,max I_
.4 , , I j , I J i I
3 6 10 6 3 6 10 7 3 6 108
a C
Figure 2.10 Comparison of predicted and measured CL._, as a function of R_
rectangular wing of NACA 0012 section. Data from Jones (1952).
for an aspect ratio 3
84

1.8 --
CL ,max
1.6 --
1.4-
1.2-
1.0-
.8 --
.6 --
.4 --L
3
CL, max (exp.) A = oo
/_ OO ........ .._. CLv'se 1 Pred2cted
/ _- ... ..... _ Turbulent//_ ..'" resepa ation
.,/Q/_ onse,..."_- CL ,max (exp.) A = 2
.-
....-o°°
I J I J [ J J
6 10 6 3 6 10 7 3 6 10 8
Rc
Figure 2. I 1 Comparison of predicted and measured CL,max as a function of Rc for an aspect of ratio
2 rectangular wing of NACA 0012 section. Data from Jones (1952).
85

Attatched flowpressure distribution
Typical isobar
Turbulent reseparation bubble
Turbulent /- Expanding
reseparation -_ /long bubble
Leading-edge vortex flow
\ Leading-edge
vo ex
Figure 3.1 Some sweptback wing flow phenomena to be discussed.
[ li] _3°°
1.5
1.0
.5
C[, cot
.......... CL
- c l
.. °-
cl
0 .5 10 0 .5 10 0 .5 10
q 11 q
Figure 3.2 Theoretical effect of sweep on the spanwise variation of the section cotangent loadingparameter.
86

cI
1.5
1.0
.5
0
_.ONERA "D"
I,FRcr x 10°6
--2.1
3
I I10 20
c_, deg
C L
Rcr x 10-6 Rcr = 2.3 x 10⁶
_ O ---_ ,.
_- ,_ _-_ _ 0 Pred. turb.
l/ J reseoonse,V I _ I I i0 10 0 10 20 30
co, deg
Figure 3.3 Effect of sweep and Reynolds number on the onset of turbulent reseparation andstalling. See text for experimental data sources.
1.0
CL .5
0
Exp.Vortex flow ---. , "-" " 6
upper boundary"'_,' _/"_// Rcr x 10",' /.4_ x.. 0 1.2
,,'_/'// _Attached [] 2.3
,,,'//"J. / flow theory O 3.0
_
')"_Predicted turbulent o
_,// reseparation onset 1_50°,,,/ JCL
/Y l I I I I*-Cr-*15 10 15 20
a, deg
Figure 3.4 Some effects of Reynolds number on the vortex flow of the 50 ° wing of figure 3.3.
87

d
-Cp 2'
0
? t, RcrxlO6
J_ _ _ F_.O, p ,.____ I "'°e-o__-"_,_ D /_", x
_ A I,/ ",/".5 1.0
x'/c' LCrJ
Figure 3.5 Effect of Reynolds number on the chordwise pressure distributions for the wing offigure 3.4
1.4
1.2
CL, max 1.0
.8
.6
_A = 30 °A = 0°_ ? .t
t l II I J t I J I I II106 2 4 6 8 107
Rcr
Figure 3.6 Effect of sweep and Reynolds number on CL._,_, Data from Carrara and Masson
(1980).
88

CL
2.0
1.6
1.2
.8
.4
T.E./L.E.
- stall ._
Rcr x 10 -6
- 3.5
2.0
1.3
Vortex flow
stall
\
\
,, ,q,,
Exp. CL, inf -J ","
Exp. CL, max
Rcr x 10 -6
O 3.5[] 2.0
1.3
Pred. turbresp. onset
0- I I I I I0 20 40 60 80
A, deg
Figure 3.7 An illustration of the transition from leading-edge stall to vortex-flow stall.Experimental data from Carrara and Masson (1980).
1.5
c l
1.0o/°
/
/
/
L
0 .5 I.( 0 .5
rl q
I
I
/
/
.f
i"'_" c'/,cot
c/
I I1.0
Figure 3.8 Spanwise variation of the theoretical section cotangent loading parameters for theplanform to be studied in figures 3.9 and 3.10.
89

64A010 :]
,:4x o °_q
Pred. turb.resep, onset
1.2
Cn .6
Rc x 10-6 .20
- 9 [- q =.09 ,,,E3/
oo o'S° o
I I6 12 0 0 0 0 0
.38£>
0 0 6 12 18
ct, deg o_, deg
Figure 3.9 Spanwise variation of section normal force coefficient for the wing of Kalbe and Boltz(1951).
1.2
cn .6
- _ .20 ,/" .56
q ,09 ,'" ,, ,;' 71 .83"92
R_; x 1(_68.04.0
I I I0 0 0 0 0 0 0 6 12 18
ct, deg
Figure 3.10 Effect of Reynolds number on the section normal force characteristics for the wing ofKalbe and Boltz (1951).
90

2.0
1.5
1.0
0.5
cl
__ C[,COt _( CL \
oo
f
yT'""_ c! ,cot
/-
O0
I I I I 10 0.5 1.0 0 0.5 1.0 0 0.5 1.0
Figure 4.1 Calculated spanwise variation of the cotangent loading parameter for delta wingsincluding a sweptback untapered wing for comparison.
Fed sheet --_
entlines
(a) Leading-edge-suction analogy (b) Free-vortex sheet theory (FVS)
Figure 4.2 Two theoretical methods used for vortex flow calculations.
91

1.8
1.2
CL
.6
0
70 °
S. anal. -_- theory _._
A -/'_ Attached
,_ flow theory
I I t20 4O 60
oq deg
Pred. CL _-- Incomplete
@ critical .4,._/ C s recovery
.zOj -f @ divergingA_-" cores
t ] 10 20 40 60
rz, deg
Figure 4.3 Lift characteristics of two delta wings. Experimental data from Wentz and Kohlman(1971). Sharp leading-edges.
1.6
1.2
CL .8
.4
70° S. anal. //_ 6°
_ _ theory _ z--I--_ "FVS .I"
theory --x/ .-..__0Crit. /,__,¢__ _ _3
_ swirl--',,_'_ O
-- -_i i0 .? y acr X 10"6
• O16,w.... o 0._9 y o." I-I lO9
__ .- - . .... A 4.8__..-" _ ,,pO:g _ o.f .... _ _) ii4
C_" .,_,_ ,- L__Attached -_'" flow theory
_'- I I I,."" I I I 1 I10 20 0 10 20 30 40 50
o_,deg c_, deg
Figure 4.4 Effect of Reynolds number on the lift characteristics of two sharp-edge delta wings.Experimental data from Gould and Cowdrey (1958) and Lemaire (1965).
92

Secondary _separation \. /- Pnmary
line: |k%, / vortex_i_\_ / sheet
Laminar----_ _i_k_-_\\_,"_. r Secondary
Natural _ :, \\[k, _ / vortextransition I '\ \ \_ _ / sheet
Turbulent J _', \, _\','_
;a_oPrim ndary
reattachment separation
-2.5
-2.0
-1.5
Cp,u
-1.0
".5
X/Cr = 0.25
Inviscid
- x theoryRcr 10-6 , ,f(FVS)
6"4 "_, "5_'k'<, r-1.6
" _"- 3.2
I I.5 1.0
q
Figure 4.5 Vortex flow phenomena and upper surface pressure distribution for a slender, sharp-edge delta wing.
CLmax
&
CL
O----O Wentz & Kohlman (1968)
2.0 - ....,_,xN _,_.....
1.8- " }_- SA /..
1.6- xN_,_, FVS ['L'Lmax)Theory
(CLmax) Exp.-_ ,_,1.4 _.._0--_. \ .
_..o"° _-_'o\ ""--o'v .f-_7-.,k,1.2- o-"" /
/
/< "%1.0 - Critical swirl " '
/ @ T.E. "__/ Luckring (1985) \.'_
.8 -I I 1 I I I I I55 60 65 70 75 80 85 90
ALE, deg
Figure 4.6 Comparison of ct_ variation with leading-edge sweep with various theoreticalsolutions. Shmp-edge delta wings. Experimental data from Wentz and Kohlman (1968).
93

1.2 --
CL .8 -
.4 --
I I I I I0 10 20 30 4O 5O
o_, deg
Vortex SA_" Airfoil (r, %c)
6° __ Biconvex (0)
FAA 104-5106 (0.63)I
NACA 0012 (1.58)
__Q";'"'" _- Attached flow theory
Figure 4.7 Effect of leading-edge radius on the lift of 76 ° delta wings. See text for data sources.
94

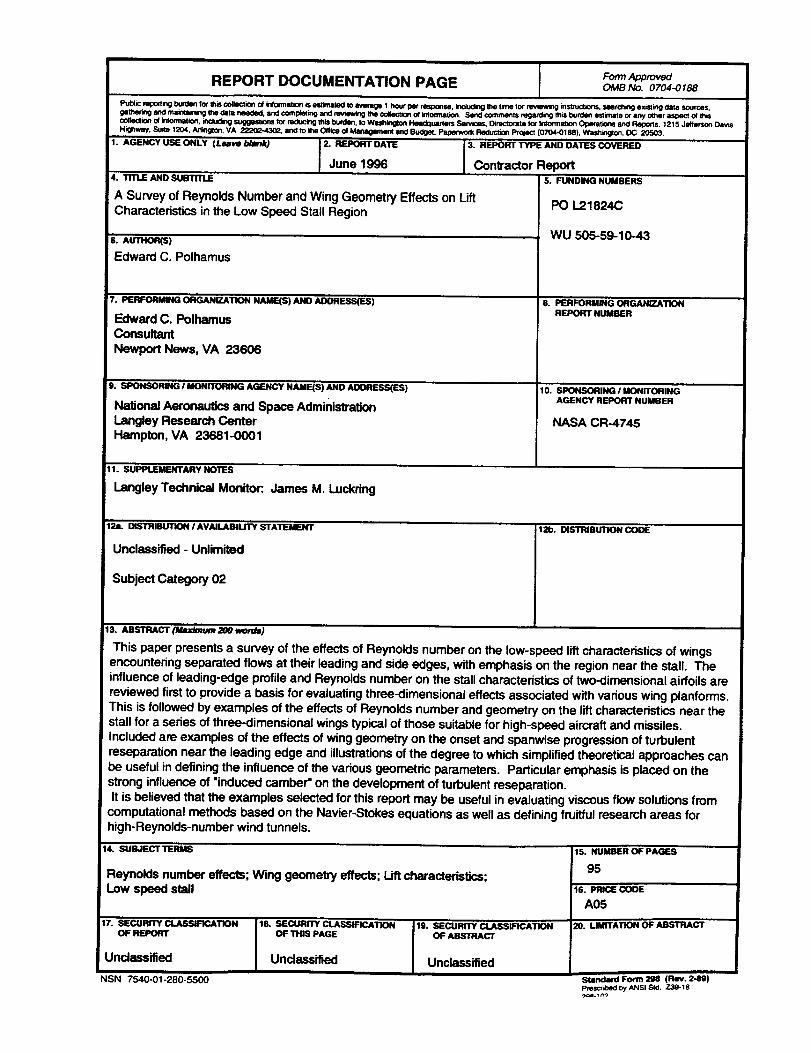
REPORT DOCUMENTATION PAGE FormApprovedOMB No. 0704-0188
Pubic r_ bu_len for mis collectk_ of _ormation is est_ to ave_ 1 hour per mspor_e, _.dmg 1he time for m_ewmg insmx_ors, _ng ex_ 0ata SOUrces.ga_'_ orKI m_g Ule cisla needed, and CCml_ and mvie'av_g ttm ¢olectJon of intonnalion. Send comments regar01ingmis burclen estu'nate or any other aspect ol Ibis¢oaeclion o_inlormation, irclud_ suggeslaons for reducing II_isbun:lien,to Wl_',k_ I-I_ua_ws Se4vioa¢ O_mctomte for Intonnation Op_'atJons and Reports, 1215 Jefferson DaysH_wuy. Sure 1204./_V_ton. VA 2220_-430_. and to the Offt=e ot _ and Budget. _ Reduc_on Project (07040188). Wastmgton, OC 205O3.
1. AGENCY USE ONLY (Leave b/ank) 2. _ i DATE 3. REPORT TYPE AND DATES COVERED
June 1996 Contractor Report4. TITLE AND SUu I I I LE 5. FUNDING NUMBERS
A Survey of Reynolds Number and Wing Geometry Effects on LiftCharacteristics in the Low Speed Stall Region
6. AUTHOR(S)
Edward C. Polhamus
7. r-_nrOR',.,T,,i_ _GANIZAT'B_N NAME(S) AND AC_t_ESS(IES)
Edward C. PolhamusConsultant
Newport News, VA 23606
9. SPONgiNG I MONITORING AGENCY NAME(S) AND Ab{J_E_t:_)
National Aeronautics and Space AdministTa_onLangley Research CenterHampton, VA 23681-0001
11. SUPPL_;;F.NTARY NO-i-_S
Langley Technical Monitor: James M. Luckdng
PO L21824C
WU 505-59-10-43
8. PERFORMING OFIGANIZATX)N
REPORT NUMBER
10. SPONSORING I MONITORINGAGENCY REPORT NUMBER
NASA CR-4745
12a. Ui_i[dLIrTlON I AVAJLABIMTY STATEMENT
Unclassified - Unlimited
Subject Category 02
121b. DISTRIBUTION COOE
13. ABSTRACT ('.;w.,rJ_T_u,m200 word_)
This paper presents a survey of the effects of Reynolds number on the low-speed lift characteristics of wingsencountering separated flows at their leading and side edges, with emphasis on the region near the stall. Theinfluence of leading-edge profile and Reynolds number on the stall characteristics of two-dimensional airfoils are
reviewed first to provide a basis for evaluating three-dimensional effects associated with various wing planforms.This is followed by examples of the effects of Reynolds number and geometry on the lift characteristics near thestall for a series of three-dimensional wings typical of those suitable for high-speed aircraft and missiles.
Included are examples of the effects of wing geometry on the onset and spanwise progression of turbulentreseparation near the leading edge and illustrations of the degree to which simplified theoretical approaches canbe useful in defining the influence of the various geometric parameters. Particular emphasis is placed on the
strong influence of "induced camber" on the development of turbulent reseparation.It is believed that the examples selected for this report may be useful in evaluating viscous flow solutions from
computational methods based on the Navler-Stokes equations as well as defining fruitful research areas forhigh-Reynolds-number wind tunnels.
14. SUBJECT _F#,IS
Reynolds number effects; Wing geomelzy effects; Lift charactedstics;Low speed stall
17. ,_=-t,;uml • CLASSIRCATION
OF REPORT18. SECURITY CLASSIFICATION
OF THIS PAGE19. SECURITY CLASSIFICATION
OF ABSTRACT
Unclassified Unclassified Unclassified
NSN 7540-01-280-5500
15. NUMBER OF PAGF.S
95
16. PRICE CODE
A05
20. I.JMITATION OF ABSTRACT
Standard Form 298 (Rev. 2-89)pmscr_Ded Oy ANSI SId. Z39-18