a survey of stress tests and current practice at major ... · and current practice at major...
TRANSCRIPT
Committee on the GlobalFinancial System
A survey of stress testsand current practice atmajor financial institutionsReport by a Task Force established by theCommittee on the Global Financial System of thecentral banks of the Group of Ten countries
April 2001

Copies of publications are available from:
Bank for International SettlementsInformation, Press & Library ServicesCH-4002 Basel, Switzerland
E-mail: [email protected]
Fax: (+41 61) 280 9100 and (+41 61) 280 8100
This publication is available on the BIS website (www.bis.org).
© Bank for International Settlements 2001. All rights reserved. Brief excerpts may be reproducedor translated provided the source is cited.
ISBN 92-9131-620-2

1
Table of contents
Preface ............................................................................................................................................... 3
Executive summary ........................................................................................................................... 5
1. Goals and organisation of the census ..................................................................................... 7
1.1 Goals, reporting banks, and reporting format ............................................................... 7
1.2 Definition of the term “stress test” ................................................................................. 7
1.3 Limitations in using the census results .......................................................................... 8
1.4 Analytical approach ....................................................................................................... 8
2. Stress test scenarios ............................................................................................................... 12
2.1 Summary of stress test scenarios ................................................................................. 12
2.2 Analysis of stress test scenarios ................................................................................... 12
2.3 Comparing stress test scenarios ................................................................................... 14
3. Sensitivity stress tests ............................................................................................................. 16
3.1 Summary of sensitivity stress tests ............................................................................... 16
3.2 Analysis of sensitivity stress tests ................................................................................. 16
4. Comparing the two types of stress tests ................................................................................. 16
5. The role of stress testing in risk management ........................................................................ 17
6. Summary and implications ...................................................................................................... 19
6.1 Summary of findings ...................................................................................................... 19
6.2 Implications of findings .................................................................................................. 20
6.3 Discussion on a potential follow-up ............................................................................... 21
Annex 1: Terms of reference of the Task Force ................................................................................ 51
Annex 2: List of financial institutions participating in the census ....................................................... 51
Annex 3: Census reporting forms ...................................................................................................... 52
Annex 4: Additional tables ................................................................................................................. 59
Members of the Task Force on a Census of Stress Tests ................................................................ 61

2

3
Preface
The Committee on the Global Financial System (CGFS), known until 1999 as the Euro-CurrencyStanding Committee, serves as a discussion forum for the central bank community on financialstability questions. The CGFS has frequently been asked to examine the potential implications ofinnovations in global financial market practices.
Recent projects by CGFS subgroups have concerned the functioning of international interbankmarkets, financial derivatives and the systemic consequences of standard risk management practices.
As a follow-up to previous efforts relating to issues of risk measurement and management, the CGFSdecided, in March 2000, to set up a Task Force to organise a global census of stress tests in use atmajor financial institutions. The findings of the Task Force, as detailed in this report, were discussed atthe March 2001 meeting of the CGFS. The publication of the report is intended to contribute to thegeneral understanding of the use of stress tests as a market risk management tool.
For individual financial institutions, the survey data are expected to provide a useful benchmark forassessing their own stress test programmes against those of all surveyed firms, a sampling of financialfirms including internationally active and global financial institutions. In addition, the Committeerecognised the potential usefulness of survey information collected over time for the market-monitoringprogramme that it conducts at the request of the Governors of the G10 central banks. In thisconnection, it was noted that survey results could provide useful insights into market participants'views on the sources and nature of potential future stress for global financial markets. In the future,having such information could assist the development of profiles of risk taking in financial markets.
The Task Force was chaired by Alain Duchateau of the Banque de France/Commission Bancaire. Hejoins with the Committee in expressing appreciation for the co-operation of the surveyed banks withthe Task Force. The Committee believes that the census is an excellent example of a co-operativeeffort between central banks and market participants. The survey responses can provide informationthat is valuable for the firms' own risk management purposes. They also can be used to usefullysupplement standard sources of market information.
The CGFS continues to be interested in this topic. Consequently, I would like to invite comments bothon the findings of the report, as well as on the likely costs and benefits of possible follow-up surveyefforts.
Yutaka YamaguchiChairman, Committee on the Global Financial SystemDeputy Governor, Bank of Japan

4

5
Executive summary
Goals and organisation of the Census of Stress TestsThe Committee on the Global Financial System (CGFS) initiated a census of stress test scenarios inearly 2000. “Stress tests” are tools used by financial firms to gauge their potential vulnerability toexceptional but plausible events. In recent years stress testing has grown in importance, alongsidevalue-at-risk (VaR) and other risk measurement tools. The CGFS, which monitors the stability of globalfinancial markets for the G10 governors, sponsored this Task Force to learn more about the role ofstress testing in risk management, to identify which exceptional events were considered by marketparticipants to be significant risks, and to develop information on the heterogeneity of risk-taking at apoint in time.
Forty-three banks (commercial and investment banks) from ten countries participated in the census.The banks were asked to report their firm-wide stress tests that captured material risks, as of31 May 2000. Also, the banks were asked seven questions about how they perform and use stresstests in risk management. Follow-up interviews were conducted with some of the reporting banks toallow the banks to clarify and augment their responses.
Stress test scenariosThe 43 banks reporting on the census submitted 293 stress test scenarios (stress tests based on apotential market event, such as a stock market crash) and 131 sensitivity stress tests (stress testsbased on standardised moves in closely-linked market risk factors, such as a parallel yield curve shift).Figure 1 and Table 2 set out information on the 293 stress test scenarios, the main part of theanalysis. The four most common areas stress-tested were equity prices, interest rates, emergingmarkets, and credit/liquidity spreads. The next most common areas were those focused on regionalstress events in Europe, Japan, or North America (including stress to foreign exchange rates). A fewstress tests focused on commodities and related risk factors or on stress in options markets (shocks tovolatilities).
Based on a detailed examination of these stress test scenarios, three observations can be made. First,there is a perceived asymmetry in risks. Crashes were much more likely to be stress-tested thanbooms for equity prices and emerging markets. Increases in interest rates and credit/liquidity spreadswere more commonly stress-tested than decreases. Foreign exchange rate-related stress tests weremore balanced, though “weak dollar” scenarios outnumbered “strong dollar” scenarios. Interviewedrisk managers attributed this asymmetry to asymmetric exposures (eg banks are exposed to the risk ofrising interest rates, declining equity prices, and widening credit spreads), asymmetric probabilities (eghigh risk of a stock market crash because of historically high equity market valuations), and thehistorical experience of stressful events, which is perceived to be asymmetric.
Second, banks rely heavily on stress tests for markets or products whose risks may be inadequatelycaptured by statistical risk measures like VaR. Interviewed risk managers gave several reasons whyVaR may mismeasure risk for some markets or products, leading them to rely on stress tests: a lack ofgood historical price data, a tendency of markets to gap, illiquidity, or difficulties in estimating thehighly non-linear exposures from options dealing.
Third, more stress test scenarios were focused on emerging markets than on any other area.Emerging markets was cited as a leading example of the above conclusion that some markets areparticularly well-suited for stress testing.
The Task Force compared similarly-titled stress test scenarios to see how similar or dissimilar theyreally are and found that stress tests run by different banks are quite different, even when based onidentical historical events. For example, among the 20 scenarios titled “1987 stock market crash”, themagnitude of the assumed decline in the S&P 500 index ranges from 4% to 36%; 10 scenarios containknock-on effects to interest rates, while 10 do not; in the 10 scenarios with knock-on effects, 6 haveinterest rates falling while 4 have rates rising. According to the interviewed risk managers, thesedifferences can reflect differences in banks’ portfolios, different time horizons in measuring shocks,and different assumptions on how fast positions could be liquidated.

6
The role of stress testing in risk managementThe census represents, to the Task Force’s knowledge, the first global survey on stress testingpractices. It not only provides information on how banks view stress tests, but also serves as anoverview of current practice.
According to the census responses, stress testing has become a standard risk management techniquefor the reporting banks. All the banks use stress tests to understand the firm’s risk profile andcommunicate with senior management. Just over half use stress tests to set limits. One-fifth use stresstests for capital allocation. Two-thirds of banks said that stress test results had directly led them tohedge or unwind a position, while follow-up interviews indicated that such a response is by no meansautomatic as decisions tend to be made on a case-by-case basis. Most banks run at least some oftheir stress tests at a high frequency (daily or weekly), although in interviews, some banks said thatthe more complicated scenarios were costly to run and could only be run at a low frequency (monthlyor quarterly). At one-quarter of banks, stress tests allow for limited interaction of market andcounterparty (default) credit risk.
ImplicationsThe following implications of the census can be highlighted. First, it appears that stress testing hasbecome an integral part of banks’ risk management. Second, in interpreting the results of stress tests,firms appear to take into account their position in the market, their particular approach to stress testimplementation and the strategic aspects of risk management. There is thus no unique response bythe reporting banks to the information gained through stress testing. In this regard, the Task Forcenotes a contrast between VaR, where some have suggested that the use of similar risk measures bymany banks may create a link between market shocks and banks’ responses, and stress testing in thesense that stress testing practices are so heterogeneous that a potential for feedback trading is notevident from the census.

7
1. Goals and organisation of the census
1.1 Goals, reporting banks, and reporting formatThe Census of Stress Tests was conducted by a Task Force established by the Committee on theGlobal Financial System (CGFS) of the G10 central banks.1 The census was undertaken
• to enhance our understanding of the role that stress testing plays in risk management;
• to identify the exceptional events considered by banks to be significant risks; and
• to develop information on the heterogeneity of risk-taking at a point in time.
Forty-three banks from ten countries participated in the census.2 These census reporters, which arelisted in Annex 2 of this report, were selected by their national central banks, using the reporting panelfor the Regular OTC Derivatives Market Statistics (the Yoshikuni Statistics) as a starting point.3 Banksparticipating in the census reported to their national central bank. The data were then submitted on ano-name basis to the BIS-based secretariat to be merged into a common database.
The Task Force designed a set of reporting forms with the assistance of a group of private-sector riskmanagers assembled for that purpose.4 The first reporting form asked banks to list the firm-wide stresstest scenarios that captured risks material to the bank. For each stress test scenario reported in thefirst census form, banks were requested in the second reporting form to report the scenario’s mostimportant risk factor shocks. The third reporting form presented supplemental questions about how thebanks perform and use stress tests. Banks were asked to use an as-of date of 31 May 2000.
Task Force members also conducted interviews with senior representatives of a subset of thereporting banks, to allow the banks to clarify, amplify, and augment their responses. Each nationalcentral bank decided whether interviews were necessary to interpret the banks’ responses to thecensus.
1.2 Definition of the term “stress test”“Stress testing” has been adopted as a generic term describing various techniques used by financialfirms to gauge their potential vulnerability to exceptional but plausible events. As the term is used inthis report, a “stress test” can be either a stress test scenario or a sensitivity stress test.
A stress test scenario contains simultaneous moves in a number of risk factors (for example, equityprices, foreign exchange rates, interest rates), reflecting an event that the firm’s risk managers believemay occur in the foreseeable future. A stress test scenario can be based on a significant market eventexperienced in the past (a historical scenario) or on a plausible market event that has not yethappened (a hypothetical scenario). The most common stress test scenario reported on the censuswas the 1987 stock market crash, a historical scenario.
A sensitivity stress test isolates the impact on a portfolio’s value of one or more predefined moves in aparticular market risk factor or a small number of closely linked market risk factors. Often it containssymmetric shocks (up and down), unlike a stress test scenario which typically shocks a given marketrisk factor in only one direction (up or down). The most common sensitivity stress test reported on thecensus was a parallel yield curve shift.
1 The CGFS approved the Task Force’s terms of reference at its 12 March 2000 meeting. The terms of reference are
reproduced as Annex 1 of this report. For previous CGFS-sponsored work on stress testing, see Committee on the GlobalFinancial System (2000), Stress Testing by Large Financial Institutions: Current Practice and Aggregation Issues, Basel(April) (can be downloaded from http://www.bis.org).
.2 Throughout the report, the term “banks” includes both commercial banks and investment banks/securities firms.3 See Bank for International Settlements (1996), Proposals for Improving Global Derivatives Market Statistics (Yoshikuni
Report), Basel (July) (can be downloaded from http://www.bis.org).4 The reporting forms with instructions are reproduced as Annex 3 of this report.

8
Banks were asked to report both stress test scenarios and sensitivity stress tests.5 The 43 banksreporting on the census submitted 293 stress test scenarios and 131 sensitivity stress tests run at thefirm-wide level, an average of about 10 firm-wide stress tests per bank.
1.3 Limitations in using the census resultsIn the process of collecting census responses and conducting follow-up interviews, the Task Forcebecame aware of several limitations of the census. Before presenting the results of the census, itseems useful to highlight four such limitations.
First, the Task Force began its work with the assumption that banks stress test what they consider tobe important risks. The interviews with representatives of some of the reporting banks supported thisassumption. However, importance is a subjective notion, and there are many reasons why a bankcould consider a stress test to be important. A stress test could monitor a large exposure, monitor ahedge, or ensure that a bank is not exposed to a particular event. Thus, while a bank’s stress tests arecertainly related to its exposures, it should not be assumed that stress tests are a perfect mirror imageof exposures. Nor should it be assumed that stress tests reflect a bank’s perception of the likelihood ofa given event.
Second, banks were asked to rank their firm-wide stress tests according to importance. The TaskForce had hoped to aggregate the rankings to identify the “key risks” in the global financial market. Butmany banks did not provide a ranking of their stress tests. These banks typically said that all stresstests were equally important or that it was impossible for them to rank stress tests. Again, importanceis a subjective criterion, which may have made it difficult for banks to rank their stress tests byimportance. Because any aggregation of these importance rankings would be incomplete andtherefore potentially misleading, no information on the relative importance of stress tests is presentedin this report.
Third, the results present a portrait of stress tests in use at a point in time - 31 May 2000. As marketconditions and banks’ exposures have changed since then, the stress tests in use at the reportingbanks have undoubtedly continued to evolve. Still, banks suggested that, while firm-wide stress testsare reviewed frequently, they are only changed infrequently. The main reason is a desire to employstress tests as a workable means to monitor exposures over time.6 A number of banks interviewed feltthat the results produced by a given stress test over time were particularly informative about changesin the firm’s overall risk profile over time.
Fourth, some banks seem to have interpreted the term “firm-wide stress test” in unintended ways. Inthe course of analysing the results, the Task Force tried to adjust for obvious differences in reporting.Consequently, any response that is not a firm-wide stress test, as the term is defined throughout thereport, was dropped from the analysis. The dropped responses include business-level stress tests,worst-case-scenario stress tests7 that add up each business unit’s exposure to its own worst-casescenario (rather than a common firm-wide scenario), and modified Value-at-Risk (VaR) setups (egVaR at the 99.9% confidence level).8 Of course, despite these efforts at making the resultscomparable across banks, some problems undoubtedly remain.
1.4 Analytical approachThe Task Force began analysing the census responses by classifying each stress test scenario twoways: by dominant asset class and by geographical region. At this stage, sensitivity tests were
5 Banks were also asked to classify each stress test they reported as either a stress test scenario or a sensitivity stress test.
However, there appeared to be some inconsistencies across banks in how these terms were understood. The results aspresented are based on our reclassification of the responses into stress test scenarios and sensitivity stress tests.
6 Interviews with representatives of some of the banks confirmed that business-level stress tests are more responsive to newproducts or changes in market conditions.
7 Some banks appeared to find worst-case-scenario stress tests useful as an “upper bound” on potential losses.8 A total of 69 reported stress tests were dropped from the analysis.

9
excluded and their analysis is thus confined to a separate part of this report (see Section 3 below).The asset classes used to classify the scenarios are:
• commodities;• credit (including liquidity);• equities;• interest rates;• foreign exchange (FX) rates.
Scenarios with more than one dominant asset class were classified into a “multiple asset class” group.The regions used are:
• Europe;• Japan;• North America;• emerging markets.
Scenarios that focus on more than one region were classified as “global”. The scenarios were groupedmainly on the basis of the stress test’s title, but also by looking at the scenario’s most important riskfactor shocks. For example, a 1987 stock market crash scenario would be put in the “equity” assetclass and the “global” region. This preliminary classification is summarised in Table 1.
For further analysis, the Task Force chose to group the scenarios into nine “themes”. Four of thesethemes are based on an asset class (commodity, credit, equity, interest rate), with each containing the“global” scenarios for that asset class. Because most of the foreign exchange rate scenarios areregional, FX scenarios are grouped with their region. Four other themes are regional (Europe, Japan,North America, emerging markets), with each containing FX rate scenarios and scenarios coveringmultiple asset classes for that region. An “other” theme contains the global scenarios focusing on FXrates and multiple asset classes.9 Following this plan, the Task Force classified 238 of the 293scenarios.
The 55 remaining scenarios were harder to classify. These are regional scenarios with a singledominant asset class. Should they be allocated to the regional theme or the asset class theme? TheTask Force looked at each of these scenarios and judged whether it was a better match to the regionaltheme or the asset class theme. For the sake of brevity, only the results of these classifications arepresented here. First, all remaining scenarios in the “emerging markets” column were assigned to the“emerging markets” theme. Next, all remaining scenarios in the “commodities”, “credit”, and “equities”rows were assigned to the corresponding asset class theme. Finally, scenarios that focus on interestrates in a particular region were individually assigned to either the regional theme or the interest ratetheme.
The nine “themes” are high-level groupings of stress test scenarios that deal with a common type ofmarket event. To give more granularity to the analysis, it was decided to group together similar stresstests within each of the nine themes. These groupings are listed in Box 1, along with shortdescriptions.
When a tabulation of the reported stress tests is presented, two numbers are reported: the number ofbanks and the number of stress tests. The former counts a bank once, regardless of how many stresstests of a similar nature the bank runs. The latter simply counts each stress test once. Counting thenumber of banks gives a more accurate idea of how widely a scenario is used in the market. Basingthe analysis only on a count of the number of stress tests would be misleading in those cases whereone bank runs many similar stress tests. For example, one bank runs nine New Economy equityscenarios.
9 Stress tests that focus on volatility shocks make up the largest component of “other” stress tests. In some of the figures,
volatility stress tests are reported separately from the rest of the “other” theme.

10
Box 1Description of the groupings of similar scenarios
Equities“Black Monday 1987”: Scenarios capturing market events on and after 19 October 1987. The mainfocus is on shocks to equity indices. Some of the scenarios include related events in other markets.
“Hypothetical stock market crash”: Similar to Black Monday in terms of risk factors addressed, butthe shocks used are not directly based on historical experience.
“New Economy scenarios”: The stress tests in this group almost exclusively concentrate on equityprices. The main focus is on market corrections in New Economy equities and on the relativeperformance of New and Old Economy stocks.
Interest rates“Other historical interest rate increases/declines”: These groups combine a number of historicalepisodes focusing on specific interest rate changes. The focus is almost exclusively on interest ratechanges as such, typically in only one or two countries (often the home country of the reportingbank).
“Bond market crash 1994”: Scenarios capturing events in international bond markets in the firstquarter of 1994. However, the focus of all of the stress tests in this group is not exclusively on bondmarkets but rather on all relating market events including shocks to equity prices, FX and swap ratesas well as other risk factors.
“Global tightening”: Focus on increasing short and long-term interest rates and, in some cases,interest rate volatilities across several developed markets. The underlying scenario is similar to theone of the 1994 bond market crash, however other risk factors (FX rates, equities) are only of minorimportance.
“US tightening”: Hypothetical events that could follow a US interest rate increase across severaldeveloped markets. The risk factors shocked are similar to those in the “global tightening” group,including interest rate increases in several developed markets. However, the number of countriesand currencies involved is smaller.
Emerging markets“Asia”: Eight historical scenarios simulating the events of the Asian financial crisis in 1997-98, andseven hypothetical scenarios inspired by the Asian financial crisis. The focus is usually on equities,FX and interest rates in Asian countries as well as in G7 countries.
“Latin America”: Six scenarios are historical based on the devaluation of the Mexican Peso on 14December 1994. Four scenarios focus on stress in Brazil (two historical, based on 1998-99, and twohypothetical). The remaining six scenarios are hypothetical regional crises. In all scenarios in thisgroup, stress moves are applied in more than one Latin American country, but not on risk factors inother regions.
“Country risk” stress tests focus on particular (sets of) countries and tend to stress interest and FXrates as well as equities. In many cases the different countries are stress-tested one after another,with the results of the stress test not necessarily being aggregated.
“Russia”: Seven scenarios are based on the Russian devaluation on 21 August 1998 and theassociated market events. The focus of both the hypothetical and historical scenarios is on theregion as such and in some cases on rates in G7 countries, but not on risk factors in other regions.
“Eastern Europe”: This group combines a number of hypothetical scenarios focusing on EasternEuropean FX and interest rates. Some of these set-ups also shock interest rates in developedcountries.
“Global emerging market crises”: Scenarios which are hypothetical and simulate a crisis across allemerging markets, including spillovers into the developed economies, without a clear focus on aparticular region or set of risk factors.

11
Credit“Spread widening”: A widening of various credit and/or swap spreads over a wide range ofcountries, less frequently including shocks to equity prices and interest rates in the major currencies.
“Fall 1998”: Scenarios focusing on the historical crisis episode following the Russian devaluation anddefault in August 1998. The main risk factors are similar to the spread widenings described above.
Europe“European stress 1992”: These scenarios refer to the crisis of the European Exchange RateMechanism (ERM) in 1992. The focus is thus on the interest and FX rates of European countries, butalso in a few cases on the US dollar and the yen.
“European stress/weak euro”: Hypothetical scenarios dealing with the impact of a stressful shock inEuropean stock, bond and/or currency markets on markets in Europe, Japan, and the US.
“European divergence”: These scenarios concentrate on divergent interest and FX ratedevelopments between the Euro-zone and other European countries. Contrary to the weak eurostress tests, non-European currencies are typically not among those being shocked.
“European boom/strong euro”: The focus is on the impact of FX and interest rate movementsdriven by rising euro interest and/or exchange rates.
Japan“Interest rate increase scenarios”: These scenarios stress banks’ portfolios with historical andhypothetical increases of Japanese interest rates. Some of the scenarios also include shocks toJapanese equity prices and interest rates in the major currencies. Some explicitly consider an end tothe zero-interest-rate policy.
“Japan market-wide stress”: Historical and hypothetical events with a stressful impact on allJapanese markets. In terms of risk factors the focus is thus on Japanese equity prices, interest rates,and the yen exchange rate, while repercussions in the other main markets are also considered.
“December 1998”: Scenarios focusing on the termination of the Japanese MOF-Bond PurchaseOperation on 20 December 1998 and its subsequent impact on the JGB bond market. The main riskfactors shocked are thus Japanese short and long-term interest rates.
“Strong yen” scenarios apply various historical appreciations of the Japanese yen. Shocks arelimited to FX rates and volatilities.
Commodities“Middle East crisis”: Scenarios focusing on the financial spillovers to equities, FX and interest ratesin industrialised countries from an oil shock. Four of the scenarios are historical, based on events ofAugust 1990. Only three of the scenarios actually contain a shock to oil prices.
“Commodity stress”: These scenarios focus on shocks to commodity prices and volatilities.
North America“Weak dollar”: Scenarios focusing on historical and hypothetical depreciations of the US dollar. Themain risk factors are thus FX rates and volatilities, but in some cases also interest and swap rates.Three historical scenarios based on the 1985 Plaza Accord are included.
“Strong dollar”: Like the weak dollar scenarios, these scenarios focus on movements of the USdollar. However, this time the dollar appreciates. These scenarios almost exclusively concentrate onFX rate and volatility movements.
“US market-wide stress” scenarios feature declines in the US dollar of 5-15%, declines in the S&P500 index of 15-30%, increases in the US long bond yield of 75-125 basis points, and knock-oneffects on other G7 markets.
Other“Volatility disruptions” stress portfolios against shocks to interest rate, equity and FX volatilities aswell as, in some cases, a number of additional risk factors.

12
To facilitate peer group comparisons, the reporting banks were divided into two groups. “Global dealerbanks” are active worldwide across all market segments including derivatives markets. “Otherinternationally active banks” are active outside their home country but generally focus their businesson a limited set of markets. Each reporting bank was classified by its national central bank.10
2. Stress test scenarios
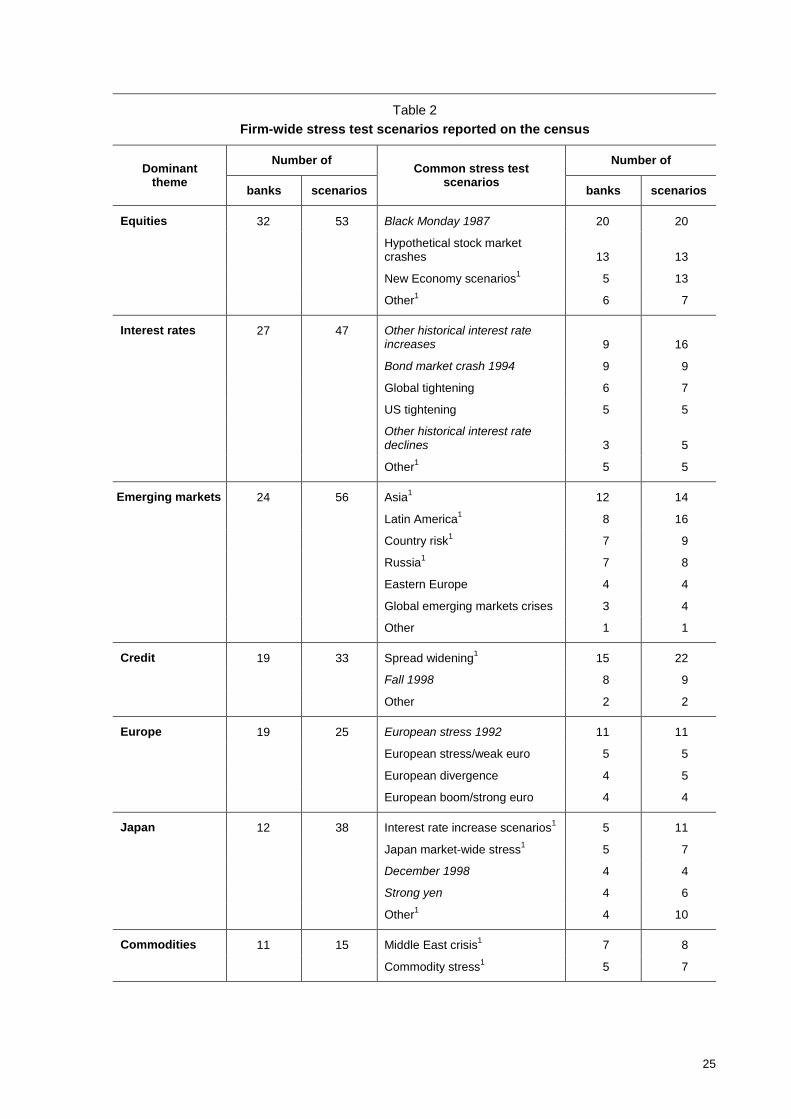
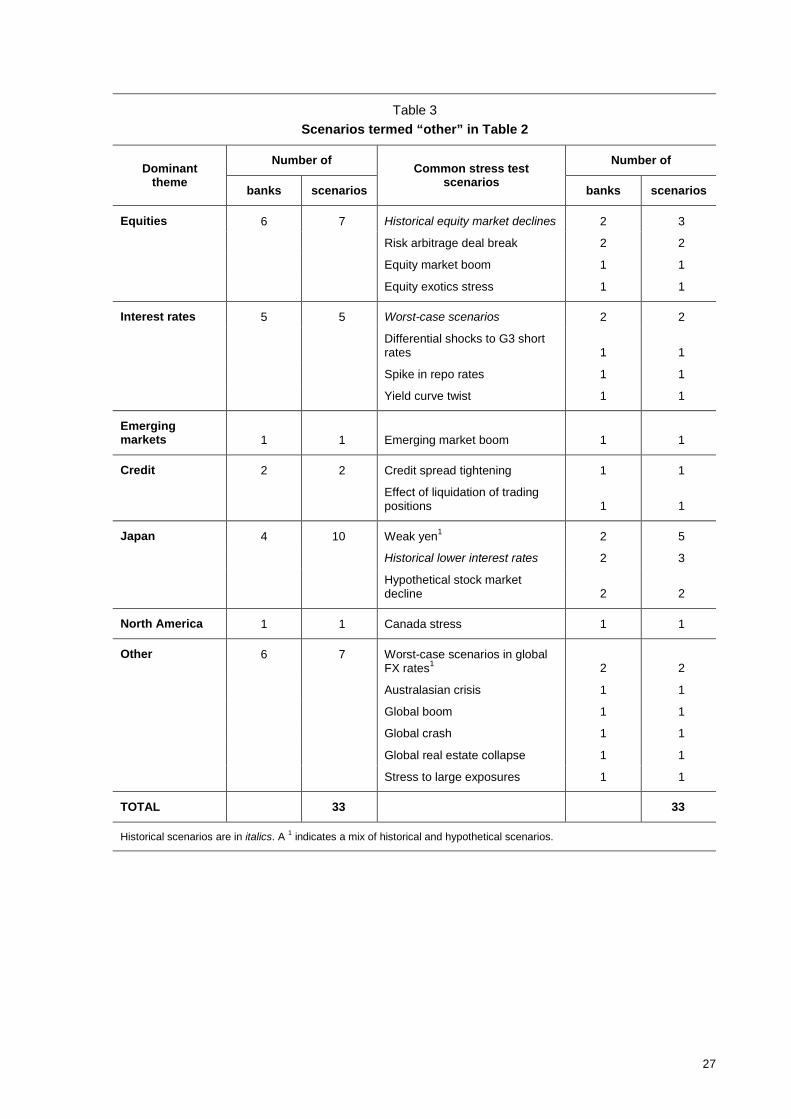
2.1 Summary of stress test scenariosTable 2 summarises the stress test scenarios run by the 43 reporting banks. The table shows thenumber of banks and the number of stress test scenarios for each theme and group of similarscenarios listed. The most common themes were equities (stress tested by 32 banks), interest rates(27 banks), and emerging markets (24 banks). For each theme, the table lists the most commongroups of similar scenarios. Historical scenarios are listed in italics; groupings of similar historical andhypothetical scenarios are marked with an asterisk. Overall, the most common scenarios were BlackMonday 1987 (stress tested by 20 banks), a widening of spreads in credit markets (15 banks), and ahypothetical stock market crash (13 banks). Figure 1 summarises the results from Table 2. The lesscommon scenarios, which were included in the “other” lines of Table 2, are listed in Table 3. For thesake of completeness, scenarios that focus on foreign exchange rates, which are grouped with theregional themes in Table 2, are broken out in Table 4.
2.2 Analysis of stress test scenariosTable 2 is the main output of the Task Force’s work. It presents a snapshot, as of 31 May 2000, ofrisks that the reporting banks felt were important enough to stress test. An exhaustive analysis ofTable 2 is beyond the scope this report. However, three obvious conclusions can be drawn from thetable.
First, and perhaps most obviously, there is a perceived asymmetry in risks among reporting banks. Forseveral themes, the most common scenarios feature shocks in a single direction. For equities, the riskof a crash appears to outweigh the risk of a boom. There appears to be a greater risk associated withhigher interest rates than with lower interest rates. The risk of credit spread widening apparentlyoutweighs the risk of credit spread tightening. The risk of a weak dollar outweighs the risk of a strongdollar.
Risk managers at reporting banks were asked why they treat these risks as though they areasymmetric. They gave three reasons. First, in some cases, such as the interest rate and creditthemes, banks have asymmetric exposures due to the nature of their business. Banks are naturally“long” interest rate risk and credit risk.11 Second, a scenario may reflect current views of what marketstress is likely in the near future. For example, some risk managers said that their bank chose to runan equity crash scenario because equity market valuations were at historically high levels (on31 May 2000). Third, a scenario may reflect senior managers’ interest in ensuring that the bank is notexposed to particular stress events they have personally experienced, which happen to beasymmetric.
A second point to be made from Table 2 concerns the character of risks that are captured in thereported scenarios and what that reveals concerning banks’ goals in using stress tests for risk
10 To help them classify banks, Task Force members used the following broad definition. A “global dealer bank” has: (i) direct
exposures to a large number of market risk factor categories (such as various interest rate curves, foreign exchange ratesand equity market categories) arising from a broad array of global financial services provided such as commercial lending,financial asset trading, insurance, and asset management; (ii) The variety of the services provided is, in turn, reflected in thevariety of risks the firm is willing to take; (iii) such exposures are assumed through on-balance sheet positions andtransactions in financial derivatives; (iv) an important share of these exposures arises out of the dealing activities of suchfirms. Any bank not meeting these criteria was classified in the “other internationally active banks” peer group.
11 Although, as some risk managers noted, this is becoming less true over time with the growth of derivatives markets.

13
management. A number of the interviews with reporting banks confirmed that stress tests are oftenused to capture risks that would escape detection by a VaR model. (Box 2 summarises the commonrationale for using stress tests).
Box 2Common rationale for using stress tests
“Stress tests supplement value-at-risk (VaR). VaR is used to provide a probability-based boundaryon likely losses for a specified holding period and confidence level (for example, the maximum lossthat is likely to be experienced over one day with a 99% level of confidence). Firms employ VaRprospectively, to assess the risk of potential portfolio allocations, and retrospectively, to assess therisk-adjusted performance of individual business units.”
“Firms recognise the limited ability of statistical models such as VaR to accurately capture whathappens in exceptional circumstances. In part, this is due to modelling assumptions that make iteasier to compute VaR. However, there is a more fundamental problem with using statistical modelslike VaR for assessing risks in exceptional circumstances. By definition, exceptional circumstancesoccur rarely, and statistical inference is imprecise without a sufficient number of observations.Stress tests partially fill this gap, and thus complement VaR, by offering a quantitative picture of theexposure associated with a possible extreme event. In the absence of a reliable statistical measureof the probability of such an event, stress testing calls on the informed judgement of risk managersand senior executives to assess whether, and to what degree, the firm should move to limit ormodify such an exposure. Even if a statistical model could be built that accurately captured risk inextreme circumstances, risk managers and senior management appear likely to prefer to continueusing stress tests, because the assumptions underlying such a statistical model would not betransparent.”
From: Committee on the Global Financial System (2000), Stress Testing by Large FinancialInstitutions: Current Practice and Aggregation Issues, Basel (April), pp. 7-8.
Interviewed risk managers mentioned the following deficiencies in VaR models: these models assumeliquid markets, require good historical price data, have difficulty handling markets where price jumpsare common, and have difficulty handling highly non-linear exposures, such as those arising from out-of-the-money options.
To give a specific example of how stress tests are used to complement VaR, consider that VaRmodels use correlations based on normal market movements.12 If stress tests are used to measure theimpact of changing correlations in stressful times, the comovement of risk factors in stress testscenarios should be different from their historical comovement.13 A close look at the stress testscenarios listed in Table 2 shows that this is indeed the case. For example, the single most commontype of stress test scenario is a global equity crash. Typically, this involves a sharp coincident drop instock markets in the United States, Europe and Japan, suggesting strong comovements in equityprices in these markets in stressful times. However, in normal times, these markets are only weaklylinked; the average correlation among G3 stock markets is 0.40.14 Interest rate scenarios are a secondexample. A common historical interest rate scenario is the Bond Market Crash of 1994, when yields onG3 government bonds moved sharply upward in the first quarter of 1994. In normal times, G3
12 For a discussion of issues related to changing correlations in times of market stress, see Loretan and English (2000),
“Evaluating changes in correlations during periods of high market volatility”, BIS Quarterly Review, Basel (June), pp 29-36(can be downloaded from http://www.bis.org).
13 Two banks reported scenarios measuring firm-wide exposure to risk arbitrage deal breaks, another risk that would escape arisk measurement technique based on historical comovements. Risk arbitrage deal breaks seemed to be a commonbusiness-level stress test, according to the interviews held with risk managers.
14 This correlation is computed using weekly returns on major market indices in Germany, Japan, and the United States over1996-2000.

14
government bond yields do not move together that strongly; they have an average correlation of only0.18.15
A final point to be made from Table 2 is the popularity and diversity of scenarios run with the theme ofemerging markets. Emerging markets is the most common theme when measured by the number ofscenarios. The large difference between the number of banks running emerging markets scenariosand the total number of emerging markets scenarios indicates that some banks are running multiplescenarios on emerging markets. As suggested by the groupings listed in the table, it is common for abank to run emerging markets scenarios for several different regions (Asia, Latin America, Russia,Eastern Europe).
The popularity of stress tests for emerging markets may be linked to the point mentioned above aboutthe character of risks captured by stress testing. In the interviews, risk managers cited the recentfinancial crises in emerging markets as events where markets that became illiquid as a result of thecrisis moved together in ways quite different from their historical comovements. One risk managercommented that VaR was not relevant for assessing the riskiness of a bank’s exposure to emergingmarkets, citing some of the reasons mentioned above (lack of good data, illiquidity, tendency ofemerging markets to gap). Instead, this risk manager said, stress tests should be relied on. Thecensus results and the interviews taken together support the conclusion that stress testing may be anattractive way to measure emerging market risk exposures.16
The group of scenarios labelled “Country risk” under the emerging markets theme requires furtherexplanation. These scenarios track a bank’s exposure to a stress event in a single emerging market(country or region) and contain shocks across multiple asset classes (a sovereign bond spread, anexchange rate, and, less frequently, an equity index).17 Each bank that reported a country riskscenario runs it for multiple emerging markets. In the interviews, some risk managers commented thattheir banks base country risk limits on the results of country risk stress tests. Although the tablereports seven banks running nine scenarios, in fact the total number of scenarios would be muchhigher if all the individual emerging markets that each bank runs its country risk scenarios for werecounted separately.
2.3 Comparing stress test scenariosGrouping similar scenarios together gives a high-level view of the risks that are of concern to thereporting banks. So far the question of how similar or dissimilar the actual stress test scenarios run bydifferent banks are has not been addressed. Figures 2-10 provide a visual sense of the commonalityor divergence among scenarios. All nine figures have the same structure. Each column represents aclass of risk factor shocks. Each row represents a single scenario reported on the census. Thescenarios are grouped as in Table 2. In each row, a column is shaded if that scenario contained ashock to that column’s risk factor. An arrow indicates the direction of the shock. Scenarios that havesimilar underlying shocks will have similar shading patterns. Dissimilar scenarios will have differentshading patterns. When looking at these figures, one has to keep in mind that reporting banks wereasked to list only the most important risk factor shocks in each scenario. A close reading of the banks’responses shows that different banks provided different levels of detail. This will make the scenariosappear to be more dissimilar than they really are.18
Figures 2-10 illustrate one of the important findings of the census: stress tests run by different banksare quite different. This can be seen by the diverse shading patterns among similar scenarios. Thediversity within groupings is especially striking, as these stress tests have similar titles, are intending to
15 This correlation is computed using weekly changes in benchmark (10 year) bond yields in Germany, Japan, and the United
States over 1996-2000.16 The same might be true of other markets where low liquidity in stressful times makes historical comovements of prices less
useful for assessing potential losses under stress.17 The other emerging market scenarios, both historical and hypothetical, often had the same structure, with a simultaneous
shock to a sovereign bond spread, exchange rate, and, in some cases, a stock market index.18 This caveat applies equally to the entire analysis, as the number of scenarios reported by each bank depends on its
definition of what it regards as an “important” scenario.

15
capture similar risks, or are based on the same historical stress event. The large amount of diversity isover and above what can be attributed to differences in the amount of detail reported by differentbanks, as mentioned above.
Figures 2-10 allow one to compare the breadth of risk factors covered in a scenario, but they do notshow the magnitude of shocks. One of the striking results of the census is that the magnitude ofshocks varies substantially among scenarios that, on the surface, look quite similar. This was trueeven for historical scenarios, where banks base their scenario on an historical event whose shocks arecommon knowledge. One source of differences is that banks use different time horizons to measurehistorical shocks. One bank may use a one-day shock, another may use a two-week shock, a thirdmay use the peak-to-trough shock.19 Different time horizons will give different shock sizes in mosthistorical episodes. In addition, the magnitude of risk factor shocks may vary because of differences inbanks’ portfolios.
Table 5 illustrates this point. It displays the magnitude of the shocks to stock market indices in theUnited States, Europe, and Japan that banks use in their “Black Monday 1987” and “HypotheticalStock Market Crash” scenarios. The table is sorted by the average size of the US stock market crashassumed in the scenario. It is obvious that banks use quite different size shocks to capture an equitycrash. Whether a crash scenario is historical or hypothetical does not seem to be a good predictor forthe magnitude of the equity shocks assumed in the scenario, as hypothetical crash scenarios containsome of the largest and smallest crashes reported.20
To give more insight into the cross-market effects assumed for the equity crash scenarios, the lastcolumn in Table 5 shows what, if any, interest rate shocks are assumed as part of the equity crashscenarios run by reporting banks. It can be seen that sixteen equity crash scenarios shock interestrates in addition to equity price indices. Of these sixteen scenarios, nine assume interest rates todecline, while five assume increasing rates. Two scenarios assume a mixture of rising and falling ratesacross countries. The disparate treatment of cross-market effects is another factor contributing to thedissimilarity of stress tests across reporting banks.
In addition, Figures 2-10 allow one to see what, if any, cross-market effects are assumed within allreported stress test scenarios. For example, Figure 2 presents the 53 equity scenarios submitted bythe census reporters. The block of risk factors representing equity markets is quite dark, indicating thatmost equity scenarios contain shocks across several global equity markets. The block for equityvolatility is filled in for 8 of the 20 Black Monday scenarios and 6 of the 13 hypothetical equity crashscenarios. In these cases, banks have chosen to shock equity volatilities as part of their equity crashstress test. The block for foreign exchange risk factors is almost completely unshaded, indicating thatmost banks do not consider shocks to foreign exchange rates as part of their equity crash scenarios.
Risk managers were asked about the large amount of diversity across banks in what cross-marketeffects are assumed within similar stress test scenarios. One reason they gave was that differentbanks have different underlying portfolios and would thus assume different cross-market effects.Another reason cited was that while some risk managers may have decided to run multiple stress testsbased on a single asset class each, others have taken a decision to run scenarios based on multiplerisk factors and hence to include cross-market effects.
Volatility shocks play only a minor role in firm-wide stress testing, as Figures 2-10 show. Only 92 of the293 firm-wide stress test scenarios (31%) stress a volatility risk factor. Interviewed risk managerssuggested the scarcity of volatility shocks reflects the concentrated nature of options markets, sincethe only way to be exposed to shocks to volatility is by trading in options.
Figure 11 breaks down the number of scenarios reported for each theme by peer group.21 Overall,global dealer banks accounted for just over half of the scenarios reported on the census. Global dealerbanks seem to place particular emphasis on equities, emerging markets, and credit spreads. For threethemes - interest rates, Europe, and Japan - internationally active banks were over-represented. This
19 These different time horizons may reflect different assumptions on the availability of market liquidity in stress.20 A similar presentation of the diversity in the magnitude of assumed shocks could also be made for other themes such as
emerging markets or interest rates.21 Annex 4 presents the underlying data on the peer group breakdown.

16
may reflect the different nature of risk-taking at the internationally active banks, compared with theglobal dealer banks: their risk exposures are more closely linked to traditional banking businesses(leading to a greater concern with interest rate risk) and to their home market (leading to a greaterconcern with regional stress).
3. Sensitivity stress tests
3.1 Summary of sensitivity stress testsTo classify sensitivity stress tests, the Task Force made use of the same nine themes used above,plus an “exchange rate” theme. Table 6 summarises the firm-wide sensitivity stress tests run by the 43reporting banks. As in Table 2, the numbers in the table show the number of banks and the number ofsensitivity stress tests for each theme and grouping of similar stress tests listed. The most commonthemes addressed by sensitivity stress tests were interest rates (by 23 banks), equities (16 banks),and exchange rates (11 banks). A parallel yield curve shift was the most common type of sensitivitystress test (run by 14 banks). Figure 12 summarises the results from Table 6.
3.2 Analysis of sensitivity stress testsInterest rates are the most common theme among the sensitivity stress tests reported on the census.Comparing Tables 2 and 6, 65 of 131 sensitivity stress tests (50%) concern shocks to interest rates,compared with only 47 of 293 stress test scenarios (16%). It thus appears that banks are comfortablecontrolling their interest rate risk with sensitivity tests rather than scenario analysis. This may be due tothe fact that sensitivity stress tests for interest rates, such as shifting a yield curve up 100 basis pointsand down 100 basis points, are a simple and transparent way to measure interest rate risk. Parallelyield curve shifts are closely related to duration, the oldest and most basic measure of interest raterisk.22 Among the 19 parallel yield curve shift sensitivity stress tests reported on the census, 100 basispoints is the most common magnitude by far (with 50 basis points a distant second).
Figure 13 presents the number of sensitivity stress tests reported for each theme by peer group.23
Internationally active banks account for 59% of the reported sensitivity stress tests, with the remaining41% run by global dealer banks. The distribution across themes is similar for the two peer groups. Forboth peer groups, interest rate sensitivity stress tests are the most common by far. Equity-relatedsensitivity stress tests are more heavily used by global dealer banks, while all other themes seem tobe dominated by internationally active banks.
4. Comparing the two types of stress tests
Sensitivity stress tests are different from stress test scenarios in many ways but, essentially, they aresimpler. They typically only stress a single risk factor or a set of closely related risk factors (such as ayield curve). Their simplicity means they may be less able to satisfy the goal of capturing risks thatcannot be detected by other risk measurement methodologies, like VaR. So it is perhaps notsurprising that banks reported running fewer sensitivity stress tests than stress test scenarios. Also,some banks may do firm-wide sensitivity stress tests but may not have reported them because theyconsider them to be less important than stress test scenarios.
The different way banks use sensitivity stress tests and stress test scenarios is clear from Figure 14,which compares the number of stress test scenarios and sensitivity stress tests run for each theme.
22 Modified duration approximates the percentage change in an asset or portfolio’s value in response to a 1 percentage point
change in interest rates.23 Annex 4 presents the underlying data on the peer group breakdown.

17
For interest rates, exchange rates, and volatility, sensitivity stress tests are more common. For theother themes, stress test scenarios are more common.
Figure 15 compares the relative use of stress test scenarios versus sensitivity stress tests across thetwo peer groups of reporting banks.24 Each shaded bar in the figure represents the fraction of stresstests that are stress test scenarios or sensitivity stress tests at a single reporting bank. The mixbetween scenarios and sensitivity tests does appear to be different across the two groups. For globaldealer banks, on average 74% of the stress tests are scenarios. For internationally active banks, thecomparable figure is 64%.
This difference may reflect the different character of risk-taking across the two groups of banks as wellas different degrees of sophistication in terms of the general approaches to risk management taken bythe two peer groups. As discussed in Section 2.2 above, stress test scenarios may be most useful forbusiness lines where other risk measurement techniques, such as VaR, do not perform well. By theway the reporting banks are split into peer groups, global dealer banks should be relatively moreinvolved in business lines that require stress testing for good risk measurement (ie acting as a dealerin derivatives markets). For much the same reason, internationally active banks may focus more ontraditional banking business (ie managing interest rate risk), which tends to focus on liquid marketswith ample historical price data. Risk measurement methods other than scenario analysis wouldtherefore perform reasonably well, limiting the immediate need for extensive use of stress testscenarios.
5. The role of stress testing in risk management
In the third census reporting form, banks were asked to answer some supplementary questions ontheir use of stress testing in risk management. Their answers, broken down into the two peer groups,are summarised in Table 7.25 The Task Force believes that this is the first global survey on stresstesting practices. As such, it might serve as a useful point of reference.26 Furthermore, it is meant toadd to the small but growing literature on the role of stress testing in risk management.27
Question 1 asked banks how they use stress test results. Nearly all banks responded that stress testsare used as a tool for risk managers to understand the firm’s risk profile and communicate thatinformation to senior management. According to the interviews, senior management generallyexamines the results of stress testing through a high-level “Risk Committee” meeting on a regularbasis (eg monthly). Nearly 80% of global dealer banks, but only 45% of internationally active banks,reported using stress tests to set limits. This difference is statistically significant. About half of thebanks used stress tests to conduct contingency planning for times of market stress. One-quarter orfewer used stress tests to allocate capital or to monitor liquidity risk.
Banks use stress test limits in combination with other limits, on notional position size, positionsensitivity (ie delta), or VaR. In the discussions with risk managers, it became clear that there is arange of responses that a bank could take following a breach of a stress test limit. Possible responsesrange from mild (a discussion between the risk manager and the business unit about why the stresstest limit was breached) to severe (mandatory unwinding of positions), with a great deal of room in-between. Whether a bank chooses a response at the mild or the severe end of the range depends onthe bank’s general attitude toward stress test limits, the level within the firm of the limit breach, andmarket conditions. The strongest response, to require a position to be unwound, is rarely automatic; itis almost always done on a case-by-case basis.
24 The two peer groups do roughly equal numbers of firm-wide stress tests. The mean number of stress tests per bank is 11
for global dealer banks and 9 for other internationally active banks. Annex 4 presents the underlying data on the relative useof stress test scenarios and sensitivity stress tests across peer groups.
25 Nearly all the differences across the peer groups are not statistically significant. Differences that are statistically significant(using a 10% confidence level and a one-tailed test) are noted in the text.
26 The Task Force does not intend Table 7 to be interpreted as “best practice” in using stress testing in risk management,since each institution must choose the risk management techniques that best meet its own needs.
27 Previous work sponsored by the CGFS in this area was cited in footnote 1.
18
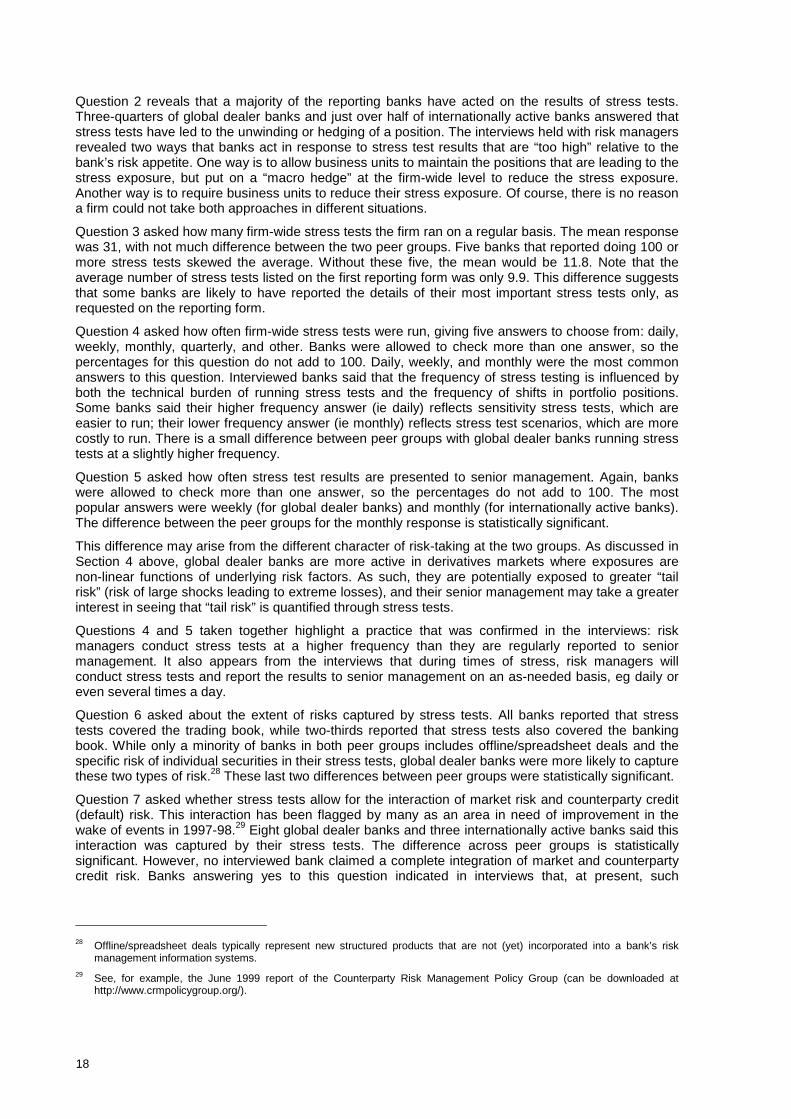
Question 2 reveals that a majority of the reporting banks have acted on the results of stress tests.Three-quarters of global dealer banks and just over half of internationally active banks answered thatstress tests have led to the unwinding or hedging of a position. The interviews held with risk managersrevealed two ways that banks act in response to stress test results that are “too high” relative to thebank’s risk appetite. One way is to allow business units to maintain the positions that are leading to thestress exposure, but put on a “macro hedge” at the firm-wide level to reduce the stress exposure.Another way is to require business units to reduce their stress exposure. Of course, there is no reasona firm could not take both approaches in different situations.
Question 3 asked how many firm-wide stress tests the firm ran on a regular basis. The mean responsewas 31, with not much difference between the two peer groups. Five banks that reported doing 100 ormore stress tests skewed the average. Without these five, the mean would be 11.8. Note that theaverage number of stress tests listed on the first reporting form was only 9.9. This difference suggeststhat some banks are likely to have reported the details of their most important stress tests only, asrequested on the reporting form.
Question 4 asked how often firm-wide stress tests were run, giving five answers to choose from: daily,weekly, monthly, quarterly, and other. Banks were allowed to check more than one answer, so thepercentages for this question do not add to 100. Daily, weekly, and monthly were the most commonanswers to this question. Interviewed banks said that the frequency of stress testing is influenced byboth the technical burden of running stress tests and the frequency of shifts in portfolio positions.Some banks said their higher frequency answer (ie daily) reflects sensitivity stress tests, which areeasier to run; their lower frequency answer (ie monthly) reflects stress test scenarios, which are morecostly to run. There is a small difference between peer groups with global dealer banks running stresstests at a slightly higher frequency.
Question 5 asked how often stress test results are presented to senior management. Again, bankswere allowed to check more than one answer, so the percentages do not add to 100. The mostpopular answers were weekly (for global dealer banks) and monthly (for internationally active banks).The difference between the peer groups for the monthly response is statistically significant.
This difference may arise from the different character of risk-taking at the two groups. As discussed inSection 4 above, global dealer banks are more active in derivatives markets where exposures arenon-linear functions of underlying risk factors. As such, they are potentially exposed to greater “tailrisk” (risk of large shocks leading to extreme losses), and their senior management may take a greaterinterest in seeing that “tail risk” is quantified through stress tests.
Questions 4 and 5 taken together highlight a practice that was confirmed in the interviews: riskmanagers conduct stress tests at a higher frequency than they are regularly reported to seniormanagement. It also appears from the interviews that during times of stress, risk managers willconduct stress tests and report the results to senior management on an as-needed basis, eg daily oreven several times a day.
Question 6 asked about the extent of risks captured by stress tests. All banks reported that stresstests covered the trading book, while two-thirds reported that stress tests also covered the bankingbook. While only a minority of banks in both peer groups includes offline/spreadsheet deals and thespecific risk of individual securities in their stress tests, global dealer banks were more likely to capturethese two types of risk.28 These last two differences between peer groups were statistically significant.
Question 7 asked whether stress tests allow for the interaction of market risk and counterparty credit(default) risk. This interaction has been flagged by many as an area in need of improvement in thewake of events in 1997-98.29 Eight global dealer banks and three internationally active banks said thisinteraction was captured by their stress tests. The difference across peer groups is statisticallysignificant. However, no interviewed bank claimed a complete integration of market and counterpartycredit risk. Banks answering yes to this question indicated in interviews that, at present, such
28 Offline/spreadsheet deals typically represent new structured products that are not (yet) incorporated into a bank’s risk
management information systems.29 See, for example, the June 1999 report of the Counterparty Risk Management Policy Group (can be downloaded at
http://www.crmpolicygroup.org/).

19
interactions are limited to business lines or products where they are thought to have a material impacton exposure.30
6. Summary and implications
6.1 Summary of findingsThe terms of reference of the Task Force on a Census of Stress Tests, which were approved by theCGFS at its March 2000 meeting, list three objectives that were to be met by the Task Force.According to these goals, the census was undertaken
• to enhance our understanding of the role that stress testing plays in risk management;• to identify those exposures to exceptional events which have been identified as significant
risks; and• to develop information on the heterogeneity of risk taking at a point in time.
On the first objective, the census provides the first comprehensive international survey on stresstesting. The responses provide a unique perspective into the incorporation of stress testing into riskmanagement programmes. Among the more important insights generated by the report are thefollowing:
• Stress testing has become a standard risk management technique for the firms reporting onthe census. Risk managers tend to view stress tests as a supplementary source ofinformation on the market risk exposures being run by their firms.
• Reliance on stress test data to provide measures of risk information has become particularlywell established for markets most prone to discrete price jumps, such as emerging marketdebt or equity markets, but also for products with non-linear risk profiles, such as out-of-the-money options. That is, as suggested by the very definition of stress testing, marketparticipants seem to view stress testing as particularly useful to measure risk exposures tomarkets that tend to be illiquid in times of stress or even under normal market conditions.This is evident, for example, from the survey’s findings concerning the popularity of reportedscenarios being run under the emerging market theme.
• Stress tests have been employed, by some banks, to determine “hard” trading limits, ie themaximum losses banks are willing to accept under a particular scenario, given their currentexposures. That is, stress tests determine trading limits at which remedial actions take place.Before undertaking large one-off deals, stress tests are also used to evaluate the maximumloss limits associated with these deals. However, interviews with banks’ risk managers implythat this practice applies to the business unit and is not generally applied at firm level.
• Hard trading limits can prompt immediate unwinding of positions, unwinding of positions overtime or entry into offset “hedge” positions. Banks consistently respond when positionsexceed stress test limits but vary responses according to their individual circumstances, aswell as to those of the market as a whole. Those banks not employing “hard” trading limitsemphasised the role of stress tests as a trigger for further inquiry by risk managers. There isthus no automatic response to stress test results across banks or even through time for agiven bank.
On the second objective, banks’ exposure to exceptional events, the census revealed that banks placeparticular emphasis on stress testing equity and emerging market exposures. Banks indicatedthat their focus on these two areas is likely to be mainly influenced by either their underlyingexposures or large shocks that these markets have experienced in the past. More specifically, theTask Force finds the following:
30 The Task Force did not ask banks about stress tests for operational risk. One interviewed risk manager volunteered that
such stress tests may soon be feasible given the priority currently given to improving the measurement of operational risk.

20
• The design of stress tests draws heavily on historical events, even for hypotheticalscenarios. In case of the scenarios devoted to emerging markets, the Asian and Russiancrises in 1997 and 1998 are obvious examples of recent crisis periods that are widely usedto stress test bank portfolios. For equity markets, the high valuation of most markets and thefirst signs of weakness, in March 2000, of the “new economy” sector could explain why the1987 equity crash is the most popular stress test.
• Scenarios with identical themes tend to reflect a perceived asymmetry in risks amongreporting banks. Survey responses highlighted downside risks in equity, fixed income andemerging markets. On the currency side, the scenarios were more balanced, although therisk of dollar weakness vis-à-vis the euro seems to outweigh the risk of a strong dollar.These asymmetries seem to be dictated by the fact that banks, by the very nature of theirbusiness, tend to be long product, implying asymmetric exposures to equity, fixed income,and emerging markets. Interviewed risk managers also attributed the asymmetry toasymmetric probabilities (for example, high risk of a stock market crash because ofhistorically high equity market valuations), differences in the speed of price movements inboom as opposed to bust periods and the historical experience of stressful events, which isperceived to be asymmetric.
• In terms of inferring banks’ exposures to exceptional events from the stress tests reported,the results of the census should be interpreted with due caution. It appears that thescenarios run depend on past as much as on current exposures. On the one hand, bankstend to run scenarios that are specific to current exposure. On the other hand, however, theytend to stick to scenarios through time as a way to monitor risks even if they are no longerheavily exposed to these risks. Furthermore, with the census being a single snapshot ofmarket practice at end-May 2000, it cannot be concluded whether stress tests are more areflection of past shocks or of banks’ actual exposures at the time. Such an assessmentwould rely on comparisons of banks’ stress testing programmes at various points in time.Finally, banks may also run scenarios for reasons unrelated to past as well as currentexposures.
On the third objective, namely to develop information on the heterogeneity of risk taking, the censusdepicted a wide array of risks covered by the surveyed stress tests, both geographically and bytype of the risk factors involved. Although, as pointed out earlier, the ability to infer banks’ exposuresfrom the design of their stress tests is generally limited, there is a degree of diversity across scenariosthat might be highlighted:
• Strikingly, even when several banks referred to the same historical scenario, for example the1987 equity market crash, the magnitude of the shocks run and the range of risk factorstested varied significantly. This reflects the considerable degree of discretion by riskmanagers when devising stress test scenarios, including the choice of the time horizonemployed, and the subjective nature of this risk management tool.
• One interpretation of the diversity of risks covered by stress tests is that the census does notprovide any evidence of undue concentrations of exposures to specific market risks.However, in making this assertion, one needs to keep in mind a number of limitations, asstated in the report. Furthermore, as no reference to country-specific data has been made inthe analysis of the census, the above conclusion does not necessarily hold at the country orregion level. Regional reporting (US, EU and Japan) of survey results should be considered,even if country reporting is not feasible because of confidentiality concerns.
6.2 Implications of findingsHaving summarised the main findings of the report, the Task Force would like to highlight twoimplications of the census. First, it appears that stress testing has become an integral part of banks’risk management. In devising their stress tests, risk managers seem to recognise the character offirms’ exposures as well as the relative merits of scenario analysis and other techniques, such as VaRand sensitivity analysis, in dealing with specific exposures and different markets.
Second, in interpreting the results, firms appear to take into account their position in the market andthe strategic aspects of risk management. There is thus no mechanistic response by the reportingbanks to the information gained through stress testing. In particular, there is no indication that banks
21
reporting on the census apply strict policies to unwind positions if the corresponding stress test limitsare being breached. Interviewed risk managers suggested that the appropriate reaction to a stress testwill depend on the relationship between their bank’s positions, other banks’ positions, and the size ofthe market. In this regard, the Task Force notes a contrast between VaR, where some have suggestedthat a mechanical link between market shocks and banks’ responses has led to an increase in positivefeedback trading and higher volatility, and stress testing, where practices and uses of stress testingare so heterogeneous that a potential for feedback trading is not evident from the census.
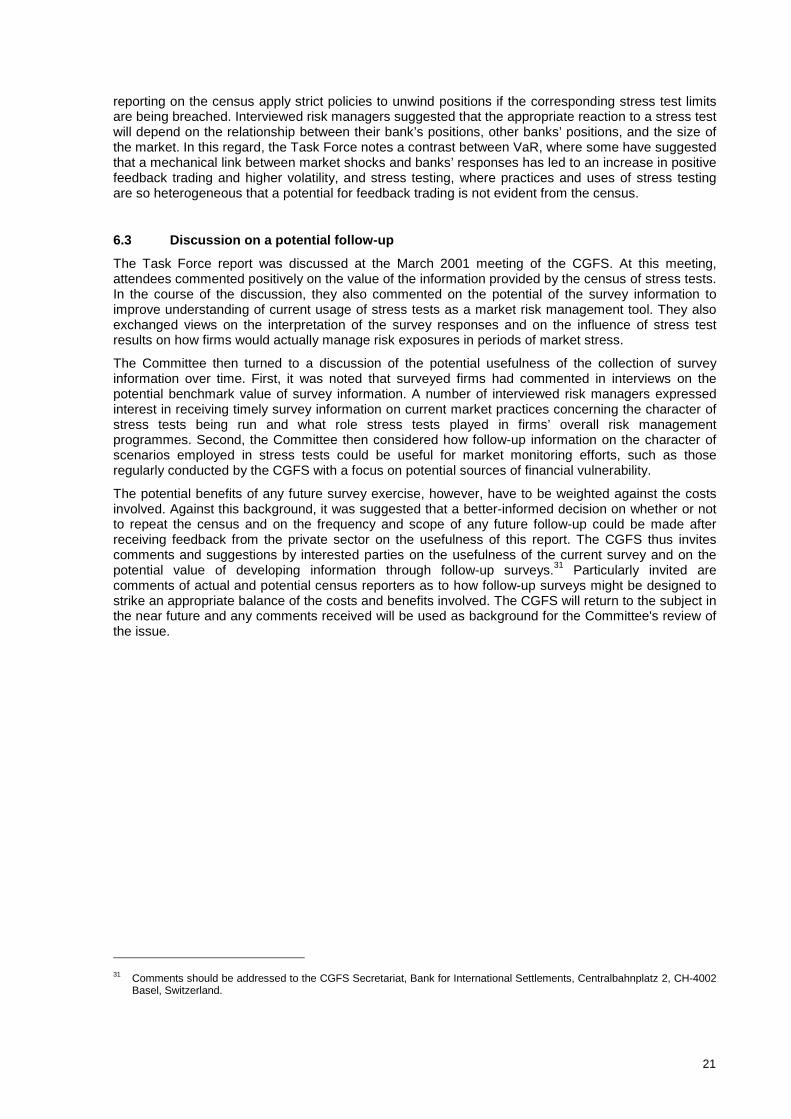
6.3 Discussion on a potential follow-upThe Task Force report was discussed at the March 2001 meeting of the CGFS. At this meeting,attendees commented positively on the value of the information provided by the census of stress tests.In the course of the discussion, they also commented on the potential of the survey information toimprove understanding of current usage of stress tests as a market risk management tool. They alsoexchanged views on the interpretation of the survey responses and on the influence of stress testresults on how firms would actually manage risk exposures in periods of market stress.
The Committee then turned to a discussion of the potential usefulness of the collection of surveyinformation over time. First, it was noted that surveyed firms had commented in interviews on thepotential benchmark value of survey information. A number of interviewed risk managers expressedinterest in receiving timely survey information on current market practices concerning the character ofstress tests being run and what role stress tests played in firms’ overall risk managementprogrammes. Second, the Committee then considered how follow-up information on the character ofscenarios employed in stress tests could be useful for market monitoring efforts, such as thoseregularly conducted by the CGFS with a focus on potential sources of financial vulnerability.
The potential benefits of any future survey exercise, however, have to be weighted against the costsinvolved. Against this background, it was suggested that a better-informed decision on whether or notto repeat the census and on the frequency and scope of any future follow-up could be made afterreceiving feedback from the private sector on the usefulness of this report. The CGFS thus invitescomments and suggestions by interested parties on the usefulness of the current survey and on thepotential value of developing information through follow-up surveys.31 Particularly invited arecomments of actual and potential census reporters as to how follow-up surveys might be designed tostrike an appropriate balance of the costs and benefits involved. The CGFS will return to the subject inthe near future and any comments received will be used as background for the Committee's review ofthe issue.
31 Comments should be addressed to the CGFS Secretariat, Bank for International Settlements, Centralbahnplatz 2, CH-4002
Basel, Switzerland.

22

23
Tables and figures
Table 1 Preliminary classification of firm-wide stress test scenarios reported on the censusTable 2 Firm-wide stress test scenarios reported on the censusTable 3 Scenarios termed “other” in Table 2Table 4 FX-focused scenarios reported on the censusTable 5 Comparing stock market crash scenarios across banksTable 6 Firm-wide sensitivity stress tests reported on the censusTable 7 Answers to census questions on the uses of stress testingFigure 1 Stress test scenarios: By themeFigure 2 Stress test scenarios: EquityFigure 3 Stress test scenarios: Interest ratesFigure 4 Stress test scenarios: Emerging marketsFigure 5 Stress test scenarios: CreditFigure 6 Stress test scenarios: EuropeFigure 7 Stress test scenarios: JapanFigure 8 Stress test scenarios: CommoditiesFigure 9 Stress test scenarios: North AmericaFigure 10 Stress test scenarios: OtherFigure 11 Stress test scenarios: By peer group and themeFigure 12 Sensitivity stress tests: By themeFigure 13 Sensitivity stress tests: By peer group and themeFigure 14 Stress tests: By theme and typeFigure 15 Relative use of stress test scenarios and sensitivity stress tests by peer group

24
Table 1Preliminary classification of firm-wide stress test scenarios reported on the census
(number of scenarios)
Geographical regionDominant asset
class Global Europe Japan NorthAmerica
Emergingmarkets Total
Commodities 14 1 0 0 0 15
Credit 32 0 1 0 2 35
Equities 47 1 1 4 4 57
Interest rates 30 19 13 7 2 71
FX rates 2 3 11 11 3 30
Multiple 9 13 14 4 45 85
TOTAL 134 37 40 26 56 293
Notes: Multiple asset scenarios have two or more dominant asset classes; global scenarios cover two or more regions.
25
Table 2Firm-wide stress test scenarios reported on the census
Number of Number ofDominanttheme banks scenarios
Common stress testscenarios banks scenarios
Equities 32 53 Black Monday 1987 20 20
Hypothetical stock marketcrashes 13 13
New Economy scenarios1 5 13
Other1 6 7
Interest rates 27 47 Other historical interest rateincreases 9 16
Bond market crash 1994 9 9
Global tightening 6 7
US tightening 5 5
Other historical interest ratedeclines 3 5
Other1 5 5
Emerging markets 24 56 Asia1 12 14
Latin America1 8 16
Country risk1 7 9
Russia1 7 8
Eastern Europe 4 4
Global emerging markets crises 3 4
Other 1 1
Credit 19 33 Spread widening1 15 22
Fall 1998 8 9
Other 2 2
Europe 19 25 European stress 1992 11 11
European stress/weak euro 5 5
European divergence 4 5
European boom/strong euro 4 4
Japan 12 38 Interest rate increase scenarios1 5 11
Japan market-wide stress1 5 7
December 1998 4 4
Strong yen 4 6
Other1 4 10
Commodities 11 15 Middle East crisis1 7 8
Commodity stress1 5 7

26
Table 2 (contd)
Number of Number ofDominanttheme banks scenarios
Common stress testscenarios banks scenarios
North America 10 15 Weak dollar1 7 8
Strong dollar1 3 3
US market-wide stress 3 3
Other 1 1
Other 9 11 Volatility disruption 3 4
Other 6 7
TOTAL 293 293
Historical scenarios are in italics. A 1 indicates a mix of historical and hypothetical scenarios. “Other” scenarios are listed inTable 3.
27
Table 3Scenarios termed “other” in Table 2
Number of Number ofDominanttheme banks scenarios
Common stress testscenarios banks scenarios
Equities 6 7 Historical equity market declines 2 3
Risk arbitrage deal break 2 2
Equity market boom 1 1
Equity exotics stress 1 1
Interest rates 5 5 Worst-case scenarios 2 2
Differential shocks to G3 shortrates 1 1
Spike in repo rates 1 1
Yield curve twist 1 1
Emergingmarkets 1 1 Emerging market boom 1 1
Credit 2 2 Credit spread tightening 1 1
Effect of liquidation of tradingpositions 1 1
Japan 4 10 Weak yen1 2 5
Historical lower interest rates 2 3
Hypothetical stock marketdecline 2 2
North America 1 1 Canada stress 1 1
Other 6 7 Worst-case scenarios in globalFX rates1 2 2
Australasian crisis 1 1
Global boom 1 1
Global crash 1 1
Global real estate collapse 1 1
Stress to large exposures 1 1
TOTAL 33 33
Historical scenarios are in italics. A 1 indicates a mix of historical and hypothetical scenarios.

28
Table 4FX-focused scenarios reported on the census
Number of Number ofDominanttheme banks scenarios
Common stress testscenarios banks scenarios
Emerging markets 3 3 Country risk 1 1
Eastern Europe 1 1
Latin America 1 1
Europe 2 3 Weak euro 2 2
Strong euro 1 1
Japan 5 11 Strong yen 4 6
Weak yen1 2 5
North America 7 11 Weak dollar1 7 8
Strong dollar1 3 3
Other 2 2 Worst-case scenarios in globalFX rates1 2 2
TOTAL 30 30
Historical scenarios are in italics. A 1 indicates a mix of historical and hypothetical scenarios.
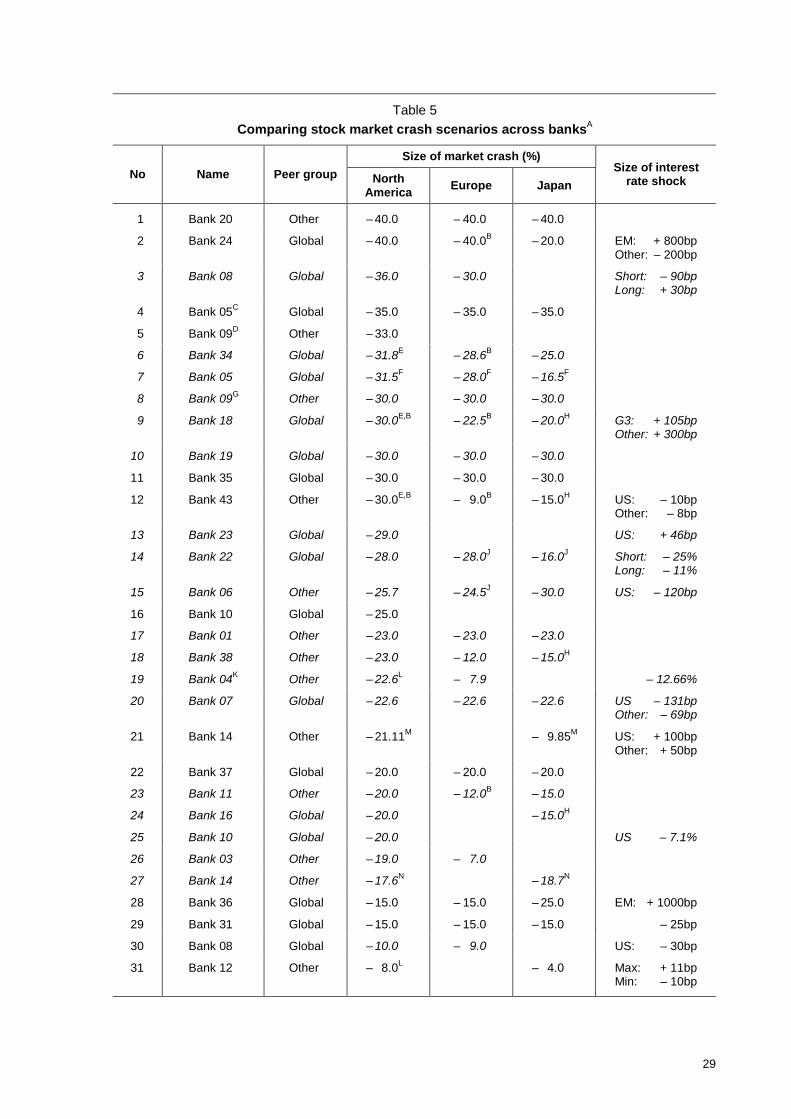
29
Table 5Comparing stock market crash scenarios across banksA
Size of market crash (%)No Name Peer group North
America Europe JapanSize of interest
rate shock
1 Bank 20 Other – 40.0 – 40.0 – 40.0
2 Bank 24 Global – 40.0 – 40.0B – 20.0 EM: + 800bpOther: – 200bp
3 Bank 08 Global – 36.0 – 30.0 Short: – 90bpLong: + 30bp
4 Bank 05C Global – 35.0 – 35.0 – 35.0
5 Bank 09D Other – 33.0
6 Bank 34 Global – 31.8E – 28.6B – 25.0
7 Bank 05 Global – 31.5F – 28.0F – 16.5F
8 Bank 09G Other – 30.0 – 30.0 – 30.0
9 Bank 18 Global – 30.0E,B – 22.5B – 20.0H G3: + 105bpOther: + 300bp
10 Bank 19 Global – 30.0 – 30.0 – 30.0
11 Bank 35 Global – 30.0 – 30.0 – 30.0
12 Bank 43 Other – 30.0E,B – 9.0B – 15.0H US: – 10bpOther: – 8bp
13 Bank 23 Global – 29.0 US: + 46bp
14 Bank 22 Global – 28.0 – 28.0J – 16.0J Short: – 25%Long: – 11%
15 Bank 06 Other – 25.7 – 24.5J – 30.0 US: – 120bp
16 Bank 10 Global – 25.0
17 Bank 01 Other – 23.0 – 23.0 – 23.0
18 Bank 38 Other – 23.0 – 12.0 – 15.0H
19 Bank 04K Other – 22.6L – 7.9 – 12.66%
20 Bank 07 Global – 22.6 – 22.6 – 22.6 US – 131bpOther: – 69bp
21 Bank 14 Other – 21.11M – 9.85M US: + 100bpOther: + 50bp
22 Bank 37 Global – 20.0 – 20.0 – 20.0
23 Bank 11 Other – 20.0 – 12.0B – 15.0
24 Bank 16 Global – 20.0 – 15.0H
25 Bank 10 Global – 20.0 US – 7.1%
26 Bank 03 Other – 19.0 – 7.0
27 Bank 14 Other – 17.6N – 18.7N
28 Bank 36 Global – 15.0 – 15.0 – 25.0 EM: + 1000bp
29 Bank 31 Global – 15.0 – 15.0 – 15.0 – 25bp
30 Bank 08 Global – 10.0 – 9.0 US: – 30bp
31 Bank 12 Other – 8.0L – 4.0 Max: + 11bpMin: – 10bp

30
Table 5 (contd)
Size of market crash (%)No Name Peer group North
America Europe JapanSize of interest
rate shock
32 Bank 25 Global – 7.0 – 7.0 – 7.0
33 Bank 17 Other – 4.0 – 9.4 – 14.9 US: – 58bpOther: – 37.5bp
34 Bank 30C Other – 30.0
35 Bank 32 Other Volatilitiestimes 4
Volatilitiestimes 4
Volatilitiestimes 4
Historical equity crash scenarios are listed in italics. A US equity shocks refer, unless otherwise stated, to the S&P 500,Japanese shocks to the TOPIX, and equity shocks in other countries to the broadest index. The interest rate shocks shownrepresent the most extreme shocks applied per scenario. B Bank applies shocks of different size to differentindices/countries; most extreme shock is shown on the table. C Bank runs scenario on business unit level only. D Bank runs(smaller) shocks on other (sub-)indices as well. E US equity shock refers to NASDAQ rather than S&P500. F Bank appliesworst 10-day shocks to various indices. The worst 10-day S&P500 price shock observed during October 1987 (between5 and 19 October) was –31.468%, the corresponding worst price shock to other indices were –24.387% for the DAX(15-29 October), –27.984% for the FTSE (12-26 October), and –16.485% for the TOPIX (15-29 October). G Bank runs twoOctober 1987 scenarios. The one concentrates on equity changes, the other on interest rates. The latter one is thus includedin the interest rate theme group. H Japanese equity shock refers to NIKKEI rather than TOPIX. J Bank provided a range ofshocks; low end of range is shown on the table. K Bank provided a range of shocks stretching over several days; the firstday’s shocks are shown. L US equity shock refers to DOW JONES rather than S&P500. M Bank reports shock sizes inpoints rather than percentages. On 31 May 2000 the S&P 500 index stood at 1420.6 points. A decline by 300 points thustranslates into a negative change of 21.11%, while a 150 points TOPIX decline was roughly equal to a change of –9.85% onthe same day. N Bank reports shock sizes in points rather than percentages. On 31 May 2000 the S&P 500 index stood at1420.6 points. A decline by 250 points thus translates into a negative change of 17.59%, while a 285 points TOPIX declinewas roughly equal to a change of –18.71% on the same day.
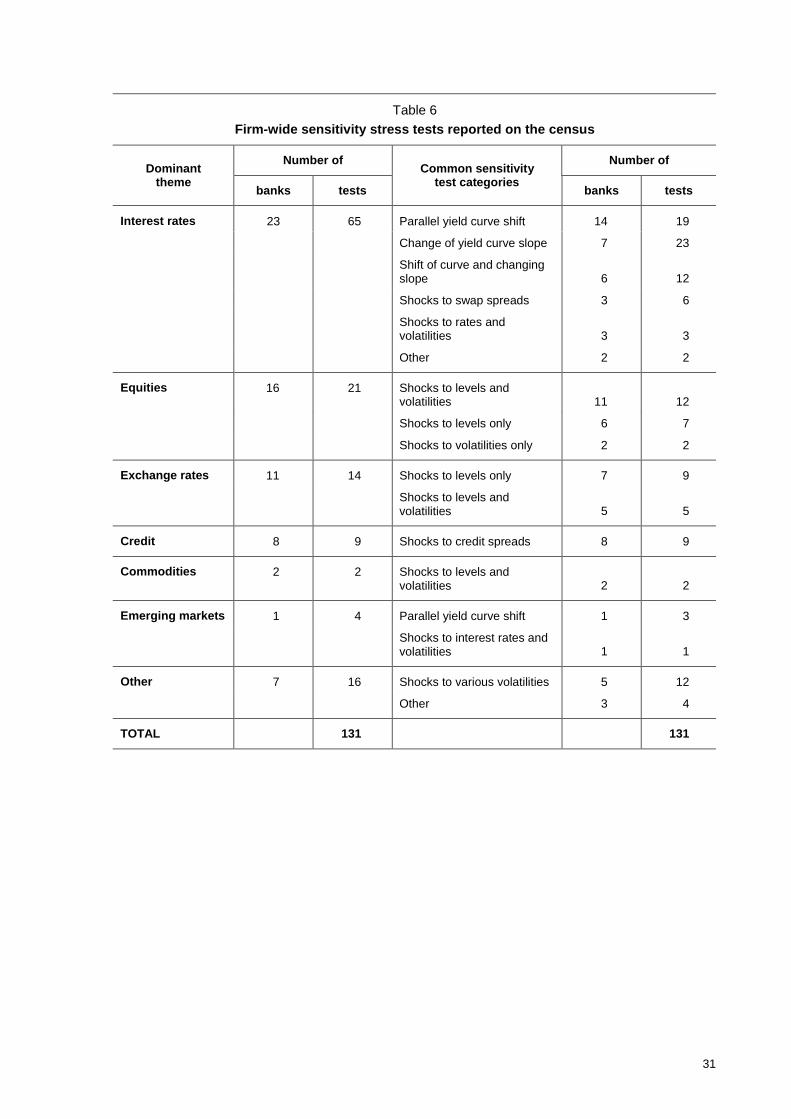
31
Table 6Firm-wide sensitivity stress tests reported on the census
Number of Number ofDominanttheme banks tests
Common sensitivitytest categories banks tests
Interest rates 23 65 Parallel yield curve shift 14 19
Change of yield curve slope 7 23
Shift of curve and changingslope 6 12
Shocks to swap spreads 3 6
Shocks to rates andvolatilities 3 3
Other 2 2
Equities 16 21 Shocks to levels andvolatilities 11 12
Shocks to levels only 6 7
Shocks to volatilities only 2 2
Exchange rates 11 14 Shocks to levels only 7 9
Shocks to levels andvolatilities 5 5
Credit 8 9 Shocks to credit spreads 8 9
Commodities 2 2 Shocks to levels andvolatilities 2 2
Emerging markets 1 4 Parallel yield curve shift 1 3
Shocks to interest rates andvolatilities 1 1
Other 7 16 Shocks to various volatilities 5 12
Other 3 4
TOTAL 131 131

32
Table 7Answers to census questions on the uses of stress testing
All reporters Global peer group Int’l peer groupQuestion andanswers Banks Pct Banks Pct Banks Pct
1. How are stress testresults used?(Check all that apply)
To help risk managerscommunicate the natureof the firm’s risk profile tosenior management 43 100.0 19 100.0 24 100.0
To help risk managersbetter understand thenature of the firm’s riskprofile 41 95.3 18 94.7 23 95.8
To set limits 26 60.5 15 78.9 11 45.3
To conductcontingency/emergencyplanning for times ofmarket stress 21 48.8 8 42.1 13 54.2
To monitor liquidity risk 11 25.6 6 31.6 5 20.8
To allocate capital 8 18.6 4 21.1 4 16.7
2. Have the results ofstress tests ever ledyour firm to hedge orunwind a position?
Yes 28 65.1 14 73.7 14 58.3
No 15 34.9 5 26.3 10 41.7
3. How many firm-widestress tests does yourfirm do regularly? Mean: 31.0 Mean: 28.3 Mean: 33.3
4. How often are firm-wide stress tests run?(Check all that apply)
Daily 18 41.9 9 47.4 9 37.5
Weekly 20 46.5 8 42.1 12 50.0
Monthly 22 51.2 8 42.1 14 58.3
Quarterly 9 20.9 3 15.8 6 25.0
5. How often are firm-wide stress test resultspresented to seniormanagement?(Check all that apply)
Daily 10 23.3 6 31.6 4 16.7
Weekly 17 39.5 9 47.4 8 33.3
Monthly 23 53.5 6 31.6 17 70.8
Quarterly 10 23.3 5 26.3 5 20.8

33
Table 7 (contd)
All reporters Global peer group Int’l peer groupQuestion andanswers Banks Pct Banks Pct Banks Pct
6. Which business linerisks are captured byyour stress tests?(Check all that apply)
Trading book 43 100.0 19 100.0 24 100.0
Banking book 29 67.4 13 68.4 16 66.7
Offline/spreadsheet deals 14 32.6 9 47.4 5 20.8
Specific risk of individualsecurities 12 27.9 8 42.1 4 16.7
7. Do any of your stresstests allow for theinteraction of marketrisk and counterparty(default) credit risk?
Yes 11 25.6 8 42.1 3 12.5
No 32 74.4 11 57.9 21 87.5

34
Figure 1Stress test scenarios: by theme
0
10
20
30
40
50
60
Equi
ty
Inte
rest
rate
s
Emer
g.m
kts
Cre
dit
Euro
pe
Japa
n
Com
mod
ity
Nor
thAm
eric
a
Oth
e r
Num
ber
Banks Scenarios

35
35
Figure 2Stress test scenarios: equity
Equity prices Interest rates Foreign exchange rates Swap rates VolatlitiesCategory Bank
US EURO JP GB Other US EURO JP GB Other US EURO JP GB Other US EURO JP Other Equity IR FXOther
1 ↓ ↓ ↓ ↓ ↓3 ↓ ↓ ↑ ↑4 ↑ ↓ ↓ ↓ ↓ ↓ ↓5 ↓ ↓ ↓ ↓ ↓ ↑6 ↓ ↓ ↓ ↓ ↓ ↓ ↑7 ↓ ↓ ↓ ↓ ↓ ↓ ↓ ↓ ↓ ↑8 ↓ ↓ ↓ ↓ ↑ ↑ ↓ ↑ ↑ ↑9 ↓ ↓ ↓ ↓ ↓ ↑
10 ↓ ↓ ↓11 ↓ ↓ ↓ ↓ ↓14 ↓ ↓16 ↓ ↓17 ↓ ↓ ↓ ↓ ↓ ↓ ↓ ↓ ↓ ↓ ↓ ↓ ↓ ↓18 ↓ ↓ ↓ ↓ ↓ ↑ ↑ ↑ ↑ ↑ ↑ ↑ ↑ ↑ ↑ ↑ ↑19 ↓ ↓ ↓ ↓ ↓ ↑22 ↓ ↓ ↓ ↓ ↓ ↓ ↓ ↑ ↑23 ↓ ↑ ↑ ↑32 ↑34 ↓ ↓ ↓ ↓ ↓
Black Monday
38 ↓ ↓ ↓ ↓8 ↓ ↓ ↓ ↓ ↓ ↓ ↑ ↑9 ↓ ↓
10 ↓12 ↓ ↓ ↑ ↑ ↑ ↓ ↑ ↓ ↑14 ↓ ↓ ↑ ↑20 ↓ ↓ ↓ ↓ ↓24 ↓ ↓ ↓ ↓ ↓ ↓ ↓ ↓ ↓ ↑ ↑25 ↓ ↓ ↓ ↓ ↓ ↑31 ↓ ↓ ↓ ↓ ↓ ↓ ↓ ↓ ↓ ↓ ↑ ↑35 ↓ ↓ ↓ ↓ ↓36 ↓ ↓ ↓ ↓ ↓ ↑ ↑ ↑37 ↓ ↓ ↓ ↓ ↓ ↑
Hypotheticalstock marketcrashes
43 ↓ ↓ ↓ ↓ ↓ ↓ ↓ ↓ ↓ ↑ ↑

36 Figure 2 (cont)
Equity prices Interest rates Foreign exchange rates Swap rates VolatlitiesCategory Bank
US EURO JP GB Other US EURO JP GB Other US EURO JP GB Other US EURO JP Other Equity IR FXOther
18 ↓ ↓ ↓ ↓ ↓18 ↑ ↑ ↑ ↑ ↑181818 ↓ ↓ ↓ ↓ ↓18 ↑ ↑ ↑ ↑ ↑18 ↓ ↓ ↓ ↓ ↓1818 ↑ ↑ ↑ ↑ ↑23 ↓ ↓ ↓ ↓ ↓ ↑26 ↓ ↑ ↑27 ↓ ↓ ↓ ↓ ↓ ↑ ↑ ↑ ↑ ↑ ↑ ↓ ↓ ↓ ↓ ↑ ↓ ↓ ↑ ↑ ↑
Neweconomy
43 ↓ ↓ ↓ ↓ ↓ ↑ ↓ ↑ ↓ ↑ ↑ ↑1 ↓
14 ↓ ↑14 ↓191921
Other
25 ↑ ↑ ↑ ↑ ↑ ↑
Note: Legend appears following Figure 10.

37
37
Figure 3Stress test scenarios: interest rates
Short-term (<=1yr)interest rates Long-term interest rates Equity prices Foreign exchange rates Swap rates
Category BankUS EURO JP GB Other US EURO JP GB Other
VolsUS EURO JP GB Other US EURO JP GB Other US EURO JP Other
Other
1 ↑ ↑3 ↑ ↓ ↑ ↑3 ↑ ↓ ↑ ↑3 ↑ ↓ ↑ ↑3 ↑ ↓ ↑
10 ↑ ↑ ↑ ↓11 ↑ ↑12 ↑ ↑ ↑ ↑ ↑13 ↑ ↑13 ↑ ↑13 ↑ ↑15 ↑ ↑ ↑ ↑15 ↑ ↑ ↑ ↑15 ↑ ↑ ↑ ↑ ↑ ↑ ↓16 ↑ ↑ ↑ ↑ ↓
Otherhistorical IRincreases
23 ↑ ↑57 ↑ ↑ ↑ ↑ ↑ ↑ ↑ ↓ ↓ ↓ ↓ ↓8 ↑ ↑ ↑ ↑ ↑ ↑ ↓ ↓ ↓ ↑ ↓ ↑ ↑
17 ↑ ↑ ↓ ↑ ↑ ↓ ↓ ↓ ↓ ↑ ↑ ↑ ↑18 ↑ ↑ ↑ ↑ ↑ ↓ ↓ ↓ ↓ ↓ ↑ ↑ ↑ ↑22 ↑ ↑ ↑ ↑ ↑ ↑ ↑ ↑ ↑ ↓ ↓ ↓ ↓ ↑23 ↑ ↑ ↓31
1994 bondmarket
38 ↑ ↑ ↓6 ↑ ↑ ↑ ↑ ↑ ↑ ↑ ↑ ↑ ↑ ↓ ↓ ↓ ↓ ↓ ↑
12 ↑ ↑ ↑ ↑ ↑ ↑12 ↑ ↑ ↑ ↓ ↑ ↓ ↑25 ↑ ↑ ↑ ↑ ↑ ↑ ↑ ↑ ↑ ↑ ↑37 ↑ ↑ ↑ ↑ ↑ ↑ ↑ ↑ ↑ ↑ ↑38 ↑ ↑ ↑ ↑ ↓ ↑ ↓ ↓
Globaltightening
39 ↑ ↑ ↑ ↑ ↑ ↑ ↑ ↑ ↑ ↑ ↑

38 Figure 3 (cont)
Short-term (<=1yr)interest rates Long-term interest rates Equity prices Foreign exchange rates Swap rates
Category BankUS EURO JP GB Other US EURO JP GB Other
VolsUS EURO JP GB Other US EURO JP GB Other US EURO JP Other
Other
6 ↑ ↑ ↑ ↑ ↑ ↑ ↑ ↑ ↑ ↑ ↓ ↓ ↓ ↓ ↓ ↑8 ↑ ↑ ↑ ↑ ↑ ↑ ↑ ↑ ↑ ↑ ↑ ↓ ↓ ↓ ↓ ↓ ↑
12 ↑ ↑ ↑ ↑ ↑14 ↑ ↑ ↑
UStightening
27 ↑ ↑ ↑ ↑ ↑ ↑ ↑ ↑ ↑ ↑ ↑ ↓ ↓ ↓ ↓ ↓ ↓ ↑ ↑ ↑ ↑ ↑ ↑ ↑ ↑9 ↓ ↓ ↓ ↓ ↑ ↑ ↑ ↑ ↑ ↓ ↓ ↓
10 ↓13 ↓ ↓13 ↓ ↓
Otherhistorical IRdecreases
13 ↓ ↓15 ↓ ↑ ↑ ↑ ↑ ↓ ↓ ↑20 ↑ ↑ ↑ ↑3031 ↑ ↓ ↑34
Otherscenarios
46
Note: Legend appears following Figure 10.

39
39
Figure 4Stress test scenarios: emerging markets
Asia Eastern Europe Latin America G7 and other industrialisedcountries Volatilities
Category BankIR Equity FX Swap
spreadCreditspread Other IR Equity FX Swap
spreadCreditspread Other IR Equity FX Swap
spreadCreditspread Other IR Equity FX Swap
spreadCreditspread Other IR Equity FX
Other
7 ↓ ↓ ↓ ↑8 ↓ ↓ ↑ ↓ ↑9 ↓ ↑
14 ↓18 ↑ ↓ ↓ ↑ ↑ ↑ ↓ ↓ ↑ ↑ ↑ ↓ ↓ ↑ ↑ ↑ ↓ ↑ ↓ ↑ ↑ ↑ ↑20 ↑ ↓ ↑ ↑22 ↑ ↓ ↓ ↑ ↑ ↓ ↑ ↓ ↑ ↓ ↑ ↑ ↑ ↑23 ↓ ↓ ↑24 ↑ ↓ ↑ ↓ ↓ ↓ ↑ ↑ ↑ ↑29292931
Asia
43 ↓19 ↑ ↓ ↑ ↑ ↓ ↑ ↑ ↓ ↑2526262932 ↑32 ↑34 ↑ ↓ ↓ ↑ ↑ ↓ ↓ ↑ ↑ ↓ ↓ ↑
Countryrisk
37

40 Figure 4 (cont)
Asia Eastern Europe Latin America G7 and other industrialisedcountries Volatilities
Category BankIR Equity FX Swap
spreadCreditspread Other IR Equity FX Swap
spreadCreditspread Other IR Equity FX Swap
spreadCreditspread Other IR Equity FX Swap
spreadCreditspread Other IR Equity FX
Other
6 ↑ ↓ ↓ ↑6 ↑ ↓ ↓ ↑
14 ↑ ↓14 ↓20 ↑ ↑ ↑ ↑ ↑ ↑ ↑ ↑20 ↑ ↑ ↑ ↑21 ↓ ↑21 ↑23 ↑ ↑ ↑ ↑ ↑ ↓ ↓ ↑ ↑23 ↓ ↑24 ↑ ↓ ↓ ↑ ↑24 ↑ ↓ ↓ ↑ ↑24 ↓ ↑ ↓ ↓ ↓ ↑ ↑ ↑2929 ↓ ↓ ↑ ↓ ↓
LatinAmerica
313 ↓ ↑6 ↑ ↓ ↓
14 ↑ ↓14 ↓22 ↓ ↑ ↓ ↓ ↑ ↓ ↓ ↓ ↓ ↑23 ↓ ↑ ↓ ↑ ↑24 ↓ ↑ ↑ ↓ ↑ ↓ ↑ ↑
Russia
38 ↑ ↓ ↓2 ↓7 ↑
20 ↑ ↓ ↑
EasternEurope
29 ↑ ↓ ↓ ↑2936 ↑ ↓ ↓ ↑ ↑ ↓ ↓ ↑ ↑ ↓ ↓ ↑ ↑ ↓ ↑ ↑ ↑ ↑36 ↑ ↓ ↓ ↑ ↑ ↓ ↓ ↑ ↑ ↓ ↓ ↑ ↑ ↓ ↑ ↑ ↑ ↑
GlobalEM crisis
43 ↑ ↓Other 18 ↓ ↑ ↓ ↓ ↑ ↓ ↑ ↓ ↓ ↑ ↓ ↑ ↓ ↓ ↑ ↓ ↑ ↓ ↓ ↓ ↓ ↓ ↓
Note: Legend appears following Figure 10.
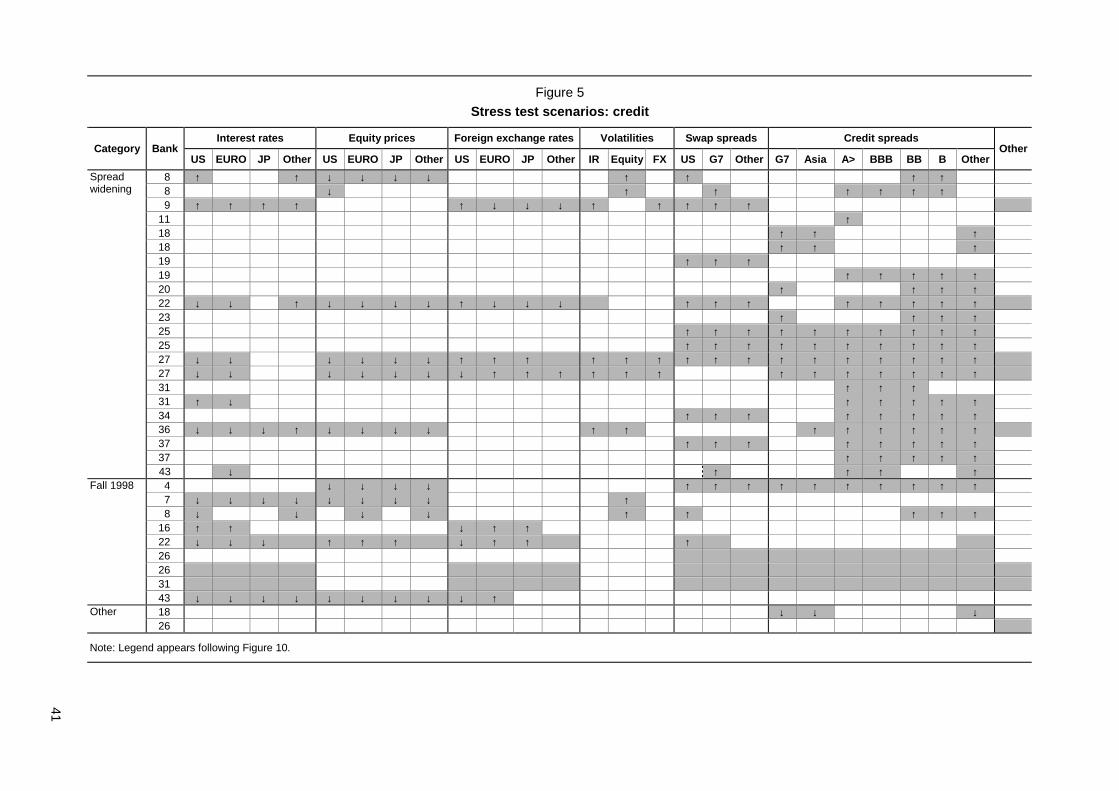
41
41
Figure 5Stress test scenarios: credit
Interest rates Equity prices Foreign exchange rates Volatilities Swap spreads Credit spreadsCategory Bank
US EURO JP Other US EURO JP Other US EURO JP Other IR Equity FX US G7 Other G7 Asia A> BBB BB B OtherOther
8 ↑ ↑ ↓ ↓ ↓ ↓ ↑ ↑ ↑ ↑8 ↓ ↑ ↑ ↑ ↑ ↑ ↑9 ↑ ↑ ↑ ↑ ↑ ↓ ↓ ↓ ↑ ↑ ↑ ↑ ↑
11 ↑18 ↑ ↑ ↑18 ↑ ↑ ↑19 ↑ ↑ ↑19 ↑ ↑ ↑ ↑ ↑20 ↑ ↑ ↑ ↑22 ↓ ↓ ↑ ↓ ↓ ↓ ↓ ↑ ↓ ↓ ↓ ↑ ↑ ↑ ↑ ↑ ↑ ↑ ↑23 ↑ ↑ ↑ ↑25 ↑ ↑ ↑ ↑ ↑ ↑ ↑ ↑ ↑ ↑25 ↑ ↑ ↑ ↑ ↑ ↑ ↑ ↑ ↑ ↑27 ↓ ↓ ↓ ↓ ↓ ↓ ↑ ↑ ↑ ↑ ↑ ↑ ↑ ↑ ↑ ↑ ↑ ↑ ↑ ↑ ↑ ↑27 ↓ ↓ ↓ ↓ ↓ ↓ ↓ ↑ ↑ ↑ ↑ ↑ ↑ ↑ ↑ ↑ ↑ ↑ ↑ ↑31 ↑ ↑ ↑31 ↑ ↓ ↑ ↑ ↑ ↑ ↑34 ↑ ↑ ↑ ↑ ↑ ↑ ↑ ↑36 ↓ ↓ ↓ ↑ ↓ ↓ ↓ ↓ ↑ ↑ ↑ ↑ ↑ ↑ ↑ ↑37 ↑ ↑ ↑ ↑ ↑ ↑ ↑ ↑37 ↑ ↑ ↑ ↑ ↑
Spreadwidening
43 ↓ ↑ ↑ ↑ ↑4 ↓ ↓ ↓ ↓ ↑ ↑ ↑ ↑ ↑ ↑ ↑ ↑ ↑ ↑7 ↓ ↓ ↓ ↓ ↓ ↓ ↓ ↓ ↑8 ↓ ↓ ↓ ↓ ↑ ↑ ↑ ↑ ↑
16 ↑ ↑ ↓ ↑ ↑22 ↓ ↓ ↓ ↑ ↑ ↑ ↓ ↑ ↑ ↑262631
Fall 1998
43 ↓ ↓ ↓ ↓ ↓ ↓ ↓ ↓ ↓ ↑18 ↓ ↓ ↓Other26
Note: Legend appears following Figure 10.
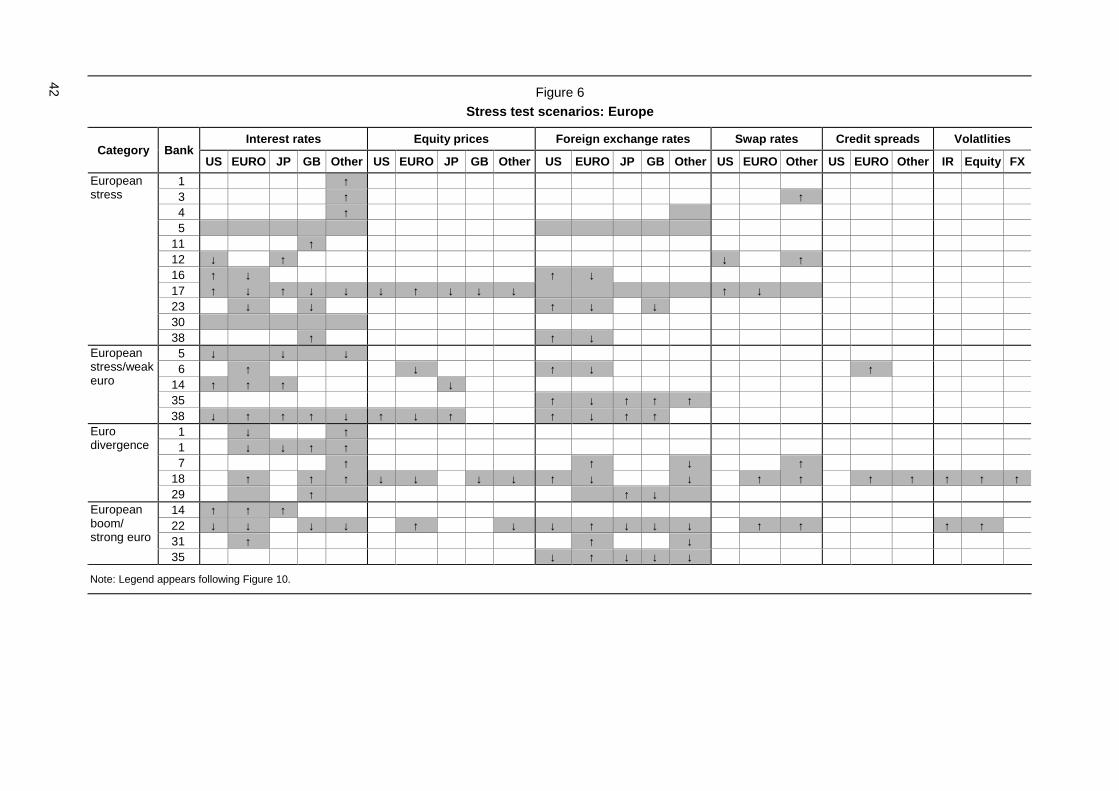
42 Figure 6Stress test scenarios: Europe
Interest rates Equity prices Foreign exchange rates Swap rates Credit spreads VolatlitiesCategory Bank
US EURO JP GB Other US EURO JP GB Other US EURO JP GB Other US EURO Other US EURO Other IR Equity FX1 ↑3 ↑ ↑4 ↑5
11 ↑12 ↓ ↑ ↓ ↑16 ↑ ↓ ↑ ↓17 ↑ ↓ ↑ ↓ ↓ ↓ ↑ ↓ ↓ ↓ ↑ ↓23 ↓ ↓ ↑ ↓ ↓30
Europeanstress
38 ↑ ↑ ↓5 ↓ ↓ ↓6 ↑ ↓ ↑ ↓ ↑
14 ↑ ↑ ↑ ↓35 ↑ ↓ ↑ ↑ ↑
Europeanstress/weakeuro
38 ↓ ↑ ↑ ↑ ↓ ↑ ↓ ↑ ↑ ↓ ↑ ↑1 ↓ ↑1 ↓ ↓ ↑ ↑7 ↑ ↑ ↓ ↑
18 ↑ ↑ ↑ ↓ ↓ ↓ ↓ ↑ ↓ ↓ ↑ ↑ ↑ ↑ ↑ ↑ ↑
Eurodivergence
29 ↑ ↑ ↓14 ↑ ↑ ↑22 ↓ ↓ ↓ ↓ ↑ ↓ ↓ ↑ ↓ ↓ ↓ ↑ ↑ ↑ ↑31 ↑ ↑ ↓
Europeanboom/strong euro
35 ↓ ↑ ↓ ↓ ↓
Note: Legend appears following Figure 10.

43
43
Figure 7Stress test scenarios: Japan
Japan US Other developed Other countries VolatilitiesCategory Bank
IR Yields Equity FX Swaps Other IR Yields Equity FX Swaps Other IR Yields Equity FX Swaps Other IR Yields Equity FX Other IR Equity FXOther
11 ↑ ↑12 ↑ ↑ ↑ ↑12 ↑ ↑ ↑ ↑ ↑12 ↑ ↑ ↑ ↑12 ↑ ↓ ↑ ↑ ↑ ↑13 ↑ ↑14 ↑ ↓ ↑14 ↑14 ↑ ↑ ↓14 ↑ ↑ ↑ ↑
IR increases
16 ↑ ↑8 ↓ ↓ ↓ ↓ ↑ ↓ ↓ ↓ ↑ ↓ ↓ ↓ ↑ ↑8 ↓ ↓ ↑ ↓ ↑ ↓ ↑
14 ↑ ↑ ↓ ↑ ↑14 ↑ ↑ ↓ ↑ ↑16 ↑ ↑ ↓ ↓22 ↓ ↓ ↓ ↑ ↓ ↓ ↑ ↑ ↓ ↓ ↑ ↑ ↓ ↑ ↑ ↑
Marketwidestress
29 ↓ ↓ ↑ ↑ ↑12 ↑ ↑ ↑ ↑ ↑ ↑ ↑13 ↑ ↑14 ↑ ↓
December1998
15 ↑ ↑10 ↑ ↑13 ↑ ↓13 ↑ ↓13 ↑ ↓16 ↓ ↑ ↓
Strong yen
20 ↑ ↑ ↑ ↑ ↑

44 Figure 7 (cont)
Japan US Other developed Other countries VolatilitiesCategory Bank
IR Yields Equity FX Swaps Other IR Yields Equity FX Swaps Other IR Yields Equity FX Swaps Other IR Yields Equity FX Other IR Equity FXOther
12 ↓ ↓ ↑ ↑ ↑ ↓ ↑ ↓12 ↓ ↑ ↓ ↑ ↓ ↑ ↓ ↑ ↓12 ↓ ↓ ↓ ↑ ↓ ↑ ↑ ↑ ↑ ↑ ↓ ↑13 ↓ ↑13 ↓ ↑13 ↓ ↑13 ↓ ↓13 ↓ ↓15 ↓ ↓
Otherscenarios
23 ↓ ↓ ↑ ↑
Note: Legend appears following Figure 10.

45
45
Figure 8Stress test scenarios: commodities
Interest rates Equity prices Foreign exchange rates Commodities VolatilitiesCategory Bank
US EURO JP GB Other US EURO JP GB Other US EURO JP GB OtherSwaps
Oil Gas Gold Other Oil Gold Equity IR FX OtherOther
3 ↑ ↓ ↑8 ↑ ↑ ↑ ↑ ↓ ↓ ↓ ↓ ↑ ↓ ↑ ↑ ↑8 ↑ ↓ ↓ ↓ ↓ ↓ ↑ ↑ ↑ ↑ ↑ ↑
14 ↑ ↑ ↓23 ↑ ↓ ↓ ↓ ↑ ↑ ↑ ↑29 ↑ ↑ ↓ ↑31 ↑ ↑ ↑ ↑ ↑ ↓ ↓ ↓ ↓ ↓ ↓ ↓ ↓ ↑ ↓
Middle Eastcrisis
43 ↑ ↑ ↑ ↑ ↓ ↓ ↓ ↓ ↑ ↑ ↓ ↓ ↓9 ↑ ↑ ↑ ↑ ↑9 ↑ ↑
19 ↑ ↑25 ↑ ↑ ↑ ↑ ↑ ↑ ↑25 ↓ ↓ ↓ ↓ ↑ ↑ ↑29
Commoditystress
34
Note: Legend appears following Figure 10.

46 Figure 9Stress test scenarios: North America
Interest rates Equity prices Foreign exchange rates Volatilities Swap ratesCategory Bank
US EURO JP GB Other US EURO JP GB Other US EURO JP GB Asia Gold Silver Other IR Equity FX US OtherOther
9 ↑ ↑ ↑ ↑ ↑ ↓ ↑ ↑ ↑ ↑ ↑ ↑ ↑ ↑10 ↓ ↑ ↑ ↑ ↑11 ↓ ↑ ↑ ↑ ↑ ↑18 ↓ ↑ ↑ ↑ ↑ ↑ ↓ ↑18 ↓ ↓ ↑ ↑ ↑ ↑ ↓ ↑20 ↑25 ↓ ↑ ↑ ↑ ↑ ↑ ↑
Weak dollar
29 ↑ ↑ ↑ ↑ ↓ ↑ ↑ ↑ ↑ ↑9 ↑ ↑ ↑ ↑ ↑ ↑ ↓ ↓ ↓ ↓ ↓ ↓ ↑ ↑ ↑
18 ↑ ↓ ↓ ↓ ↓ ↑ ↑ ↑Strong dollar
25 ↑ ↓ ↓ ↓ ↓ ↓ ↑6 ↑ ↓ ↓
18 ↑ ↑ ↑ ↑ ↑ ↓ ↓ ↓ ↓ ↓ ↑ ↓ ↓ ↓ ↓ ↑ ↑ ↑ ↑ ↑ ↑Market-widestress
22 ↑ ↓ ↓ ↓ ↓ ↓ ↓ ↓ ↑ ↑ ↑ ↑ ↑ ↑ ↑ ↑ ↑Other 8 ↑ ↓ ↓ ↑ ↑ ↑
Note: Legend appears following Figure 10.

47
47
Figure 10Stress test scenarios: other
Interest rates Equity prices Foreign exchange rates Commodities Volatilities SpreadsCategory Bank
US EURO JP GB Other US EURO JP GB Other US EURO JP GB Other Gold Gas Other IR Equity FX Swap CreditOther
1925 ↓ ↓ ↓ ↓ ↓ ↑25 ↓ ↓ ↓
Volatilitydisruption
27 ↓ ↓ ↓ ↓ ↓ ↓ ↓ ↓ ↓ ↓9 ↑ ↓ ↓ ↓ ↓ ↑
29293436 ↑ ↑ ↑ ↑ ↑ ↑ ↑ ↑ ↑ ↓37 ↓
Other
38 ↑ ↑ ↑ ↓ ↓ ↓ ↑ ↓ ↑
Legend to figures 2-10:Shaded with up arrow = upward shock/steepeningShaded with down arrow = downward shock/flatteningShaded without arrow = shock of unspecified or changing directionUnshaded = not shocked

48
Figure 11Stress test scenarios: by peer group and theme
0
5
10
15
20
25
30
35
40
Equi
ty
Inte
rest
rate
s
Emer
ging
mar
kets
Cre
dit
Euro
pe
Japa
n
Com
mod
ities
N. A
mer
ica
Vola
tility
Oth
er th
emes
Num
ber o
f sce
nario
s
Global dealer banks Other internationally active banks
Figure 12Sensitivity stress tests: by theme
0
10
20
30
40
50
60
70
Inte
rest
rate
s
Equi
ties
Exch
ange
rate
s
Cre
dit
Com
mod
ities
Emer
ging
mar
kets
Vola
tiliti
es
Oth
er
Num
ber
Banks Stress tests

4949
Figure 13Sensitivity stress tests: by peer group and theme
0
5
10
15
20
25
30
35
40
Inte
rest
rate
s
Equi
ty
Exch
ange
rate
s
Cre
dit
Com
mod
ities
Emer
ging
mar
kets
Vola
tility
Oth
er
Num
ber o
f stre
ss te
sts
Global dealer banks Other internationally active banks
Figure 14Stress tests: by theme and type
0
10
20
30
40
50
60
70
Equi
ty
Inte
rest
rate
s
Emer
ging
mar
kets
Cre
dit
Euro
pe
Japa
n
Com
mod
ities
Nor
thAm
eric
a
Vola
tility
Exch
ange
rate
s
Oth
e r
Num
ber
Scenarios Sensitivity

50
Figure 15Relative use of stress test scenarios and
sensitivity stress tests by peer group
0% 20% 40% 60% 80% 100%
Global
Int'l
Scenarios Sensitivity

5151
Annex 1: Terms of reference of the Task Force
The following terms of reference were approved by the Committee on the Global Financial System ofthe central banks of the Group of Ten countries at its 12 March 2000 meeting.
“The Task Force has been formed to set out, organise and conduct a survey of banks and securitiesfirms that are core intermediaries in global financial markets. It is understood that banks and securitiesfirms now routinely incorporate scenario analysis in risk management processes. The Task Force willreport to the Committee the results of a census of scenarios employed by surveyed firms. It isexpected that the Task Force will consult on the design of the census with a group of risk managersfrom financial firms. The survey is being undertaken (i) to enhance central understanding of the rolethat stress testing plays in risk management; (ii) to identify those exposures to exceptional eventswhich have been identified as significant risks; and (iii) to develop information on the heterogeneity ofrisk taking at a point in time. The results of a census are to be discussed with the surveyed firms.Finally, it is anticipated that the Task Force will prepare a public version of its report.”
Annex 2: List of financial institutions participating in the census
The following 43 financial institutions from 10 countries agreed to participate in the CGFS census ofstress tests organised by the Task Force (in alphabetical order):32
ABN AMRO Gruppo Bancario SANPAOLO IMIBanca Commerciale Italiana Gruppo BancaromaBanca Nazionale del Lavoro Gruppo Unicredito ItalianoBank of America, N.A. HSBC Investment Bank plcBank of Montreal HypoVereinsbank AGThe Bank of Tokyo-Mitsubishi, Ltd The Industrial Bank of Japan, LimitedBarclays plc ING GROUPBNP Paribas SA J. P. Morgan and Co.CIBC Canadian Imperial Bank of Commerce Lloyds TSB Group PlcThe Chase Manhattan Corporation MeritaNordbanken ABCitigroup Merrill Lynch & Co., Inc.Commerzbank AG Rabobank InternationalCredit Suisse Group Royal Bank of CanadaDeutsche Bank AG The Royal Bank of Scotland Group PlcThe Dai-Ichi Kangyo Bank, Limited The Sakura Bank, LimitedCredit Commercial de France SA Skandinaviska Enskilda Banken ABCredit Lyonnais SA Societe Generale SADresdner Bank AG The Sumitomo Bank, LimitedFöreningsSparbanken AB Svenska Handelsbanken ABThe Fuji Bank, Limited The Tokai Bank, LtdThe Goldman Sachs Group, Inc. UBS AGGruppo Banca Intesa
32 The alphabetical ordering does not reflect the numbering of the different banks throughout the report.

52
Annex 3: Census reporting forms
Page 1 of 7
Census of stress test scenarios May 2000
Background
The G10 central banks are conducting a census of stress test scenarios. As a core intermediary infinancial markets, your firm has been selected to participate. The census is conducted under theauspices of the Committee on the Global Financial System (CGFS).
The CGFS understands that financial institutions use stress testing and scenario analysis to monitortheir vulnerability to exceptional market events. In particular, dealer financial firms run stress testsusing scenarios which they believe would have a material effect on their firms. A census of stress testscenarios will identify extreme but plausible market events that are regularly monitored by coreintermediaries. The results of the census will help the CGFS fulfill its mandate to understand the risksfaced by the global financial system.
The results of the census will be aggregated to preserve confidentiality and published.
Note: The Committee on the Global Financial System is a central bank forum established by theGovernors of the G10 central banks to monitor and examine broad issues relating to financial marketsand systems with a view to elaborating appropriate policy recommendations to support the centralbanks in the fulfilment of their responsibilities with regard to monetary and financial stability. In carryingout these tasks, the Committee places particular emphasis on assisting the Governors in recognising,analysing and responding to threats to the stability of financial markets and the global financial system.
Version 1.3 (19 May 2000)

5353
Census reporting forms
Page 2 of 7
Census of stress test scenarios
Instructions
The census consists of three tables. We would like you to base your answers on an “as of date” on orclose to May 31, 2000.
Table 1 asks you to list the titles of the firm-wide stress test scenarios that capture material risks toyour firm at present. If a scenario does not have a formal title, please provide a short description.Please list between five and twenty scenarios in order of importance, starting with the most important.Your ranking of “importance” can be based on an objective criterion, such as financial impact, or asubjective opinion. Note that we are not asking for your firm’s actual exposure under each scenario,merely a ranking of their importance to your firm at present. Please check off the scenario’s type(historical, hypothetical, or simple sensitivity test) in the spaces provided.
Table 2 asks you to list the risk factor shocks that are the driving force behind each scenario listed inTable 1. Please list the key risk factor shocks for each scenario in order of importance, starting withthe most important. This detail will help us see whether scenarios at different firms with the same titleare similar enough to be grouped together when we tabulate the census responses. Please provideenough detail so it is clear what the main shocks underlying the scenario are. This is especiallyimportant for hypothetical scenarios.
The description of each risk factor shock can include the name of the risk factor, the direction of themove, and the magnitude. For example, a 1987 equity market crash scenario might include thefollowing risk factor shock: “20% decline in the S&P 500 index”.
Table 3 asks a few supplemental questions about how stress testing is done and how it is used withinyour firm.
If you have any questions, please refer to the accompanying cover letter for the contact person at yournational central bank.

54
Census reporting forms
Page 3 of 7
Census of stress test scenarios
Table 1
Name of reporting institution:
List between five and 20 stress test scenarios in order of their importance to your firm at present,starting with the most important. See the “Instructions” page for further details.
Check one
Importance Scenario title
His
toric
al
Hyp
othe
tical
Sim
ple
sens
-iti
vity
test
Example 1987 stock market crash X

5555
Census reporting forms
Page 4 of 7
Census of stress test scenarios
Table 2
For each scenario listed in Table 1, describe the most important risk factor shocks in the scenario inorder of importance, starting with the most important. See the “Instructions” page for further details.
Scenario number: ExampleScenario title: 1987 equity market crash
Risk factor shock number Description of risk factor shock
1 20% decline in the S&P 500 index
2 15% decline in the Nikkei 225 index
3 11% decline in the FTSE 100 index
4 and so on
5
6

56
Census reporting forms
page 5 of 7
(one page to be filled out for each scenario)
Census of stress test scenarios
Table 2 (cont)
Name of reporting institution:
Scenario number 1Scenario title:
Risk factor shocknumber Description of risk factor shock
1
2
3
4
5
6
7
8
9
10
11
12
13
14
15
16
17
18
19
20
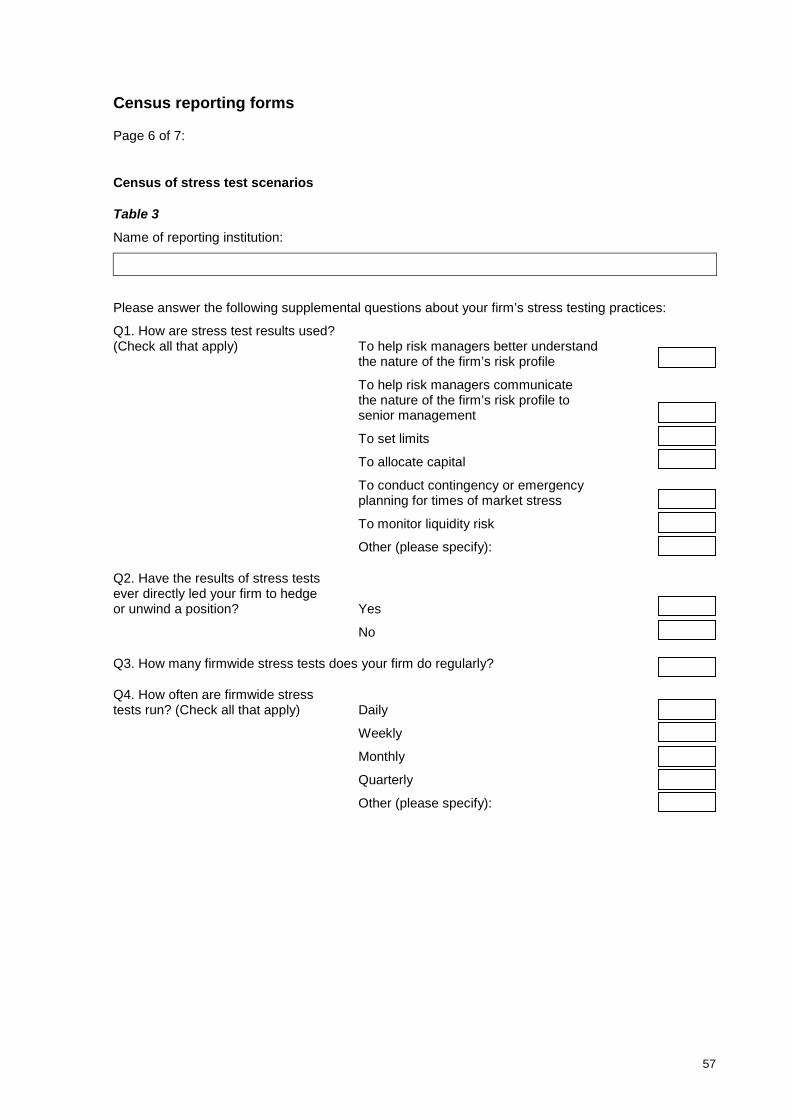
5757
Census reporting forms
Page 6 of 7:
Census of stress test scenarios
Table 3
Name of reporting institution:
Please answer the following supplemental questions about your firm’s stress testing practices:
Q1. How are stress test results used?(Check all that apply) To help risk managers better understand
the nature of the firm’s risk profile
To help risk managers communicatethe nature of the firm’s risk profile tosenior management
To set limits
To allocate capital
To conduct contingency or emergencyplanning for times of market stress
To monitor liquidity risk
Other (please specify):
Q2. Have the results of stress testsever directly led your firm to hedgeor unwind a position? Yes
No
Q3. How many firmwide stress tests does your firm do regularly?
Q4. How often are firmwide stresstests run? (Check all that apply) Daily
Weekly
Monthly
Quarterly
Other (please specify):

58
Census reporting forms
Page 7 of 7:
Table 3 (cont)Q5. How often are firmwide stress testresults presented to seniormanagement? (Check all that apply) Daily
Weekly
Monthly
Quarterly
Other (please specify):
Q6. Which business line risks arecaptured by your stress tests?(Check all that apply) Trading book
Banking book
Offline/spreadsheet deals
Specific risk of individual securities
Q7. Do any of your stress testscenarios allow for the interaction ofmarket risk and counterparty (default)credit risk? Yes
No

5959
Annex 4: Additional tables
Classification of firm-wide stress tests by theme, type, and peer group(number of stress tests)
Dominant theme Global peer group Int’l peer group Total
EquitiesScenarios 32 21 53Sensitivity tests 12 9 21
Interest ratesScenarios 16 31 47Sensitivity tests 27 38 65
Emerging marketsScenarios 34 22 56Sensitivity tests 0 4 4
CreditScenarios 25 8 33Sensitivity tests 3 6 9
EuropeScenarios 11 14 25Sensitivity tests 0 0 0
JapanScenarios 9 29 38Sensitivity tests 0 0 0
CommoditiesScenarios 10 5 15Sensitivity tests 2 0 2
North AmericaScenarios 10 5 15Sensitivity tests na na na
Exchange ratesScenarios na na naSensitivity tests 5 9 14
OtherScenarios 8 3 11Sensitivity tests 5 11 16
TOTAL 209 215 424Scenarios 155 138 293Sensitivity tests 54 77 131

60
Firm-wide stress test types used per bank (by peer group)(number of stress tests)
Global dealer banks Other internationally active banks
Name Total Scenarios Sensitivity Name Total Scenarios Sensitivity
bank 05 6 4 2 bank 01 11 6 5
bank 07 9 6 3 bank 02 5 1 4
bank 08 14 13 1 bank 03 9 8 1
bank 10 6 6 0 bank 04 4 3 1
bank 16 7 7 0 bank 06 8 8 0
bank 18 26 21 5 bank 09 11 10 1
bank 19 11 8 3 bank 11 6 6 0
bank 22 9 9 0 bank 12 14 14 0
bank 23 17 12 5 bank 13 30 16 14
bank 24 7 6 1 bank 14 20 20 0
bank 25 12 12 0 bank 15 6 6 0
bank 26 9 6 3 bank 17 3 3 0
bank 28 13 0 13 bank 20 10 9 1
bank 29 15 15 0 bank 21 12 3 9
bank 31 11 10 1 bank 27 5 5 0
bank 34 12 6 6 bank 30 2 2 0
bank 35 14 3 11 bank 32 22 3 19
bank 36 5 5 0 bank 33 4 0 4
bank 37 6 6 0 bank 38 10 7 3
bank 39 5 1 4
bank 40 6 0 6
bank 41 1 0 1
bank 42 4 0 4
bank 43 7 7 0
SUM 209 155 54 SUM 215 138 77

6161
Members of the Task Force on a Census of Stress Tests
ChairpersonBanque de France/Commission Bancaire Mr Alain Duchateau
Bank of Canada Mr Younes Bensalah
Banque de France Ms Florence Zeitoun-Verhille
Deutsche Bundesbank Mr Bernd Strueber
Banca d’Italia Ms Antonella Foglia
Bank of Japan Ms Tokiko Shimizu
De Nederlandsche Bank Ms Monique Hemerijck
Sveriges Riksbank Mr Tor Jacobson
Swiss National Bank Mr Robert Bichsel
Bank of England Mr Paul Sanderson
Federal Reserve Bank of New York Ms Patricia Mosser
Board of Governors of the Federal Reserve System Mr Michael Gibson
European Central Bank Mr Jukka Vesala
Basel Committee on Banking Supervision Mr Jean-Philippe Svoronos
Bank for International Settlements Mr Allen Frankel (Secretary)
Mr Ingo Fender