a survey of technology readiness level...
TRANSCRIPT
26th Annual INCOSE International Symposium (IS 2016) Edinburgh, Scotland, UK, July 18-21, 2016
A Survey of Technology Readiness Level Users
Katharina Tomaschek Swiss Federal Institute of Technology (ETH)
Zurich, Switzerland [email protected]
Alison Olechowski
Massachusetts Institute of Technology Cambridge, MA, USA
Steven Eppinger
Massachusetts Institute of Technology Cambridge, MA, USA
Nitin Joglekar Boston University Boston, MA, USA
Copyright © 2015 by Tomaschek et al. Published and used by INCOSE with permission.
Abstract. The Technology Readiness Level (TRL) method, used to assess the maturity of a technology, has been applied in different industries for over 40 years. TRLs assist engineers in managing risks, communicating development progress and specifying deliverables. As TRLs have been adopted in more industries, the original scope of TRL application has expanded and challenges in use have emerged. Little is known about the TRL user community and its opinions of the method, or of the method’s practical challenges. A global industry survey, conducted with professional TRL users, investigated the relative importance of 15 previously identified challenges of TRL use. We find that the top four most critical TRL challenges as identified by our respondents are system-related; they include the topics of integration, interfaces, system modifications, and overall system maturity. The results reveal a need for an extension of the TRL method from a component-readiness-context to a system-readiness-context.
Introduction Technology is a daily companion of today’s population. Living standards have improved tremendously with technology advancements. Intellectual challenge, recognition, increased knowledge base, the world’s growing population, rising economies and monetary gain are a few of the drivers for technological advances. Technology meets people’s needs, making tasks easier, faster and better. It not only enhances individuals’ lives, but also boosts industries and raises business opportunities. Firms rely on technological progress; it affects a firm’s competitive advantage and industry structures in today’s fast changing industries (Porter 1985). Humans are steered “to explore the unknown, push the boundaries of our scientific and technical limits, and then push further” (NASA 2015). Thus for both people and organizations, it might be worth posing these questions: “When is a technology ready for its user? At which point is a new technology mature enough to be applied to its full strengths by its users?” Answers to these questions shape the success of an organization’s endeavor since they may destroy or enhance a firm’s core competence (Abernathy et al. 1985; Tushman and Anderson 1986).
TRL development. Being aware of technological maturity as a critical factor of success and failure, in the 1970s NASA developed a metric to more effectively assess and communicate the maturity of a technology (Mankins 2002). This metric is called Technology Readiness Levels (TRLs). The levels distinguish the progress of a technology from the state of basic research to fully functioning operation on a 9-point scale. First developed and implemented in NASA’s space mission programs, Technology Readiness Levels spread across industries and evolved to a discipline–independent metric over the years. Their original purpose was to make technology assessments more effective and better facilitate communication regarding the maturity of a technology. In the academic literature TRLs first appeared in an article about NASA’s future space mission strategy and new technology program structures in 1989 (Sadin, Povinelli, and Rosen 1989). Initially formulated on a 7-point scale, the authors stated that TRLs were introduced based on a learning experience from previous projects, in which performance was strongly dependent on the technology readiness. Besides the aim to improve mutual understanding between stakeholders of a project (e.g. researchers, managers, mission flight managers, government), TRLs serve as a basic guideline for development efforts and technology handoff agreements between stakeholders.
After some years in use, the metric was extended to a 9-point scale. In 1995, Mankins published a detailed description of each TRL along with additional information, including cost to achieve a certain TRL and examples from NASA’s research projects (Mankins 1995). Table 1 presents NASA’s 9-point TRL scale. Many organizations have since adopted the scale and changed it slightly according to their industry-specific needs, keeping the overall format and aim of the metric largely unchanged (Det Norske Veritas 2011; US Department of Defense 2011; Engel et al. 2012).
TRLs alone are not sufficient for successful technology management and risk assessment. Many other complementary methodologies have been introduced in order to better identify uncertainties during research and development, to take action upon these uncertainties and to develop long-term technology opportunities based on needs (Mankins 2002). Still, practitioners face challenges in combining TRLs with additional technology management approaches. A reason for these challenges might be that Technology Readiness Levels are pushed beyond their original scope of pure maturity assessment.
Table 1: NASA’s current Technology Readiness Level Definitions (NASA 2013)
TRL Definition
9 Actual system flight proven through successful mission operations
8 Actual system completed and “flight qualified” through test and demonstration
7 System prototype demonstration in an operational environment
6 System/subsystem model or prototype demonstration in a relevant environment
5 Component and/or breadboard validation in relevant environment
4 Component and/or breadboard validation in laboratory environment
3 Analytical and experimental critical function and/or characteristic proof-of-concept
2 Technology concept and/or application formulated
1 Basic principles observed and reported
TRL challenges. The TRLs have been investigated by a variety of researchers who have identified shortcomings of the method. Some of these shortcomings include:
• the need for a system view of readiness which captures integration readiness (Mankins 2002; Valerdi and Kohl 2004; Bilbro 2007; Azizian et al. 2011; Holt and Beasley 2011; Jimenez and Mavris 2014)
• the lack of guidance on the likelihood of further maturation through the TRL scale (Smith 2004; Cornford and Sarsfield 2004; Mankins 2002)
• the subjective interpretation of the readiness of a technology (Mahafza 2005; Cornford and Sarsfield 2004)
• the strong focus on hardware applications (Smith 2004) • the lack of integration into cost and risk models (Mankins 2009; Valerdi and Kohl
2004) • the room for interpretation of the individual TRL descriptions (Cornford and Sarsfield
2004) • the lack of a guideline explaining how to implement the TRL assessment (Azizian,
Sarkani, and Mazzuchi 2009)
In our previous work, we identified 15 distinct TRL implementation challenges faced by TRL practitioners (Olechowski, Eppinger, and Joglekar 2015). These challenges were identified based on previous literature and a small-scale qualitative study with 19 employees of 7 different organizations. Table 2 summarizes the TRL challenges identified in that study. These 15 challenges were clustered into three distinct groups for ease of exposition. The first 7 challenges deal with the product and system complexity, whereas challenges 8 to 13 are related to a process and organizational view and the last two challenges are associated with the assessment validity of the TRL approach.

Table 2: Challenges of TRL usage and implementation (Olechowski, Eppinger, and Joglekar 2015)
1. Integration The TRL scale assesses each component technology independently, however in reality components are integrated to work as a complete system. A change in one component may require changes in connected components. The TRL does not include specific integration guidance. 2. Interface maturity Complex systems consist of connected components, where each pair of connected components is joined via an interface. TRLs assess the components themselves but do not explicitly evaluate the maturity of the interface. 3. Assessment scope Two major scoping approaches prevail in TRL assessment in industry (The Product Breakdown Structure and The Critical Technology Element). There is no clear guidance for choosing a scoping approach for TRL assessment. 4. Environment change Most TRL guidance is written in the context of a new system development project. In the case of incremental improvements, where one new component technology replaces an old component, or where a proven system is implemented in a new environment, TRL assessment may lack in appropriateness and procedures. 5. Action taking Today’s TRL assessments result in an evaluation of the maturity of dozens, or even hundreds of technologies. A way to interpret, prioritize and act on TRL information is not yet fully established. 6. Overall maturity There is a need for an overall system measure of technology maturity for the system. Ideally this system measure would indicate to the managers how the project as a whole is progressing from a technology development perspective. 7. Visual representation TRL assessments take a great deal of effort and attention, however there is no consensus on an informative visual representation of the system’s TRL information. 8. Development process alignment It is not clear how to design a mapping of TRLs to an organization’s standard system development process, and how to determine appropriate minimum required TRLs. Further, once this mapping is established, there is still a lack of understanding of the trade-offs and consequence of failure to achieve the goal TRL. 9. Waivers In the situation at a decision gate where a technology has not reached the minimum required TRL, one option is to waive the TRL requirement and proceed with development. The risk taken and trade-offs to consider in deciding whether to assign a waiver are not clear. 10. Back-up plans Another option when failing to meet a technology’s TRL requirement is to switch to an alternative technology for the function in question. There is no standard vocabulary with which to discuss back-up plans with respect to technology development and risk, and the concept is not reflected in technology readiness assessment guidelines. 11. Effort to progress A measure giving information on the resources and costs required to forward progress in the TRL scale is currently only based on gut instinct, and lacks a methodology. 12. Likelihood to progress Closely related to the previous challenge of effort to progress is the need for a measure of likelihood of forward progress in the TRL scale. Such confidence measures are also generally based on gut instinct, and lack a methodical assessment technique. 13. Technology roadmaps Technology or product roadmaps are used as a planning tool to chart future paths of development, product versions, and product lines. Given that the TRLs span in description from R&D to launch, they would appear to naturally be integrated in roadmapping exercises, however, no method or guideline exists for combining these two tools. 14. Subjectivity The TRL scale consists of only brief description for each level, which could be vulnerable to biased interpretation, and therefore the inherent subjectivity of human assessment. 15. Imprecision of scale There is no perfect mapping of a complex technology maturing process to the 9-point scale. The distinction between levels can be blurry or not appropriately specific.
This empirical study intends to shed light on the state of TRL application in 2015. This paper summarizes sections of a more detailed thesis (Tomaschek 2015). Through use of an

international survey, we first characterize the users of the TRL method. Secondly, our study provides a prioritization of perceived importance of the 15 previously identified TRL implementation challenges.
Survey Method Survey sample. The sample for this survey was drawn from the International Council on Systems Engineering (INCOSE), a worldwide organization dedicated to the advancement of systems engineering with approximately 9800 members. All regional INCOSE chapter presidents were approached individually by email and phone. In total, 34 chapter presidents supported this TRL study and agreed to share an invitation email including a link to the survey with their chapter members. The survey was distributed to approximately 5370 INCOSE members worldwide. To ensure that no TRL user was excluded from the sample on purpose, a survey link was also posted in TRL related discussions groups on the professional online platforms (e.g. LinkedIn) and snowball sampling was allowed by giving subjects the chance to forward the survey to other users with experience with TRLs.
190 responses were received during the two-month data collection period (July to September 2015). Responses from non-TRL-experienced subjects, multiples having the same IP address, and those completed in unreasonably short time were excluded from the analysis. Overall 167 responses could be used in the analysis.
Survey design. The survey design was structured in three parts. Part 1 revealed background information of the respondent in order to characterize the TRL user community. Part 2 was the core of the survey and asked about the relative prioritization of the challenges using the Best Worst Scaling (BWS) method. Part 3 asked open-ended questions about additional TRL challenges. The design of the survey was such that detailed data (in parts 2 and 3) would be obtained only from experienced TRL users. For respondents who have not used TRLs regularly in their work environment, the survey would end after the demographic background questions in part 1. The time needed to complete the whole survey was usually 15 to 20 minutes.
Best-worst scaling. The core of the survey was a best worst choice experiment (Finn and Louviere 1992), which would provide a prioritization of the challenges. Best Worst Scaling, also called Best Worst Choice or Maximum Difference (MaxDiff), is an extension of the method of paired comparison (Thurstone 1927) and underlies the concept of discrete choice modeling.
Thurstone’s concept of discrete choice modeling builds on the random utility theory, which “requires individuals to make stochastic choices and assumes that an individual’s relative preference for object A over object B is a function of the relative frequency with which A is chosen as better than, or preferred to, B” (Louviere, Lings, Islam, Gudergan, & Flynn, 2013). Thus, several items can be presented to the respondents simultaneously and based on the choices made, a simple counting model computes, or a more advanced hierarchical Bayesian model estimates, the utility parameters and choice probabilities (Finn & Louviere, 1992; Louviere, Hensher, & Swait, 2000). As respondents are asked to choose the best and the worst item in a set, or in this case the most and least critical challenges in a set, they are required to make trade-offs between the items presented (Cohen, 2003). BWS overcomes several shortcomings of scale-based surveys, such as ranking, rating, constant sum or allocation tasks. Hence, the BWS approach eliminates scale use bias (Auger, Devinney, and Louviere 2007) revealed by idiosyncrasies in responses due to cultural differences or verbal

ambiguities (Lee, Soutar, and Louviere 2008), and minimizes a lack of discriminatory power between respondents (Cohen & Neira, 2003).
BWS requires multiple comparison sets (Chrzan and Patterson 2006; Orme 2005). The generation of the choice sets was realized with balanced incomplete block designs (BIDS), which requires that each choice option or item - in our case challenge – appears equally often and also co-appears with another choice item equally often (Lipovetsky and Conklin 2014; Lee, Soutar, and Louviere 2008). To implement the survey under these requirements, we utilized Sawtooth Software. The software supported the design, implementation, execution and analysis of the best worst scaling survey (http://www.sawtoothsoftware.com). To obtain the relative prioritization of the 15 challenges, we used 15 different choice sets, each with five challenges. Thus, each respondent was asked 15 times to identify the most and least critical TRL challenge out of a set of five challenges.
Analysis The identification of the TRL user community characteristics was done with descriptive statistics. Correlations were performed between several background variables to further explain the properties of the user community. A two-tailed significance level α=5% was used for all statistical tests.
The prioritization of the 15 challenges was extracted from the Best-Worst scores. A simple counting analysis calculates the Best-Worst score of challenge i (BWi) by subtracting the frequency of times challenge i has been selected as least critical (worst) from the frequency of times challenge i has been selected as most critical (best) (Goodman et al., 2006; Louviere & Woodworth, 1983; Mueller, Francis, & Lockshin, 2009). Since every challenge appeared five times within the BWS question set, it could have been chosen at maximum five times the most or five times the least critical. The mean Best-Worst score indicates the probability that a challenge is selected as most critical. Other studies (Auger et al., 2007; Cohen, 2009; Mueller & Rungie, 2009) have shown that this result is equal to reporting the relative importance – in our study the relative criticality – compared to the other challenges.
Results Respondents’ Organizations. In order to perform more powerful statistical analyses, categorical variables were recoded into broader categories (Tomaschek 2015). The responses came from subjects working in five major Industries (Figure 1a). Respondents were primarily based in North America and Europe (Figure 1b). A majority of the responses (61%) came from either aerospace or defense industries. While the respondents’ organizations vary in Size, a majority (~ 62%) of the respondents work in those with more than 5,000 employees, as seen in Figure 3c. Such organizations include NASA, Boeing, Airbus, Rolls Royce, SpaceX,
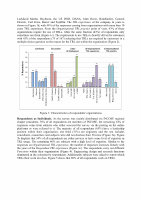
Lockheed Martin, Raytheon, the US DOD, DANA, John Deere, Bombardier, General Electric, Carl Zeiss, Baxter and Fujifilm. The TRL experience of the company in years is shown in Figure 1d, with 44% of the responses coming from organizations with more than 10 years TRL experience. From the Organizational TRL practice point of view, 43% of these organizations require the use of TRLs, while the same fraction (43%) of respondents only sometimes use them (Figure 1e). The requirement to use TRLs is heavily driven by customers, with 45% of the respondents (75 of 167) selecting that TRLs are required by customers in a multiple choice question on the reason for the TRL use within the organization (Figure 2).
0
10
20
30
40
50
60
70
%Rep
onde
nts
a)Industry b)Loca0on c)Size(#Employees)
d)Organiza0onalTRLexperience
e)Organiza0onalTRLprac0ce
30 31
10 11
17
Aerospace
Defense
Governmen
tManufacturin
gProfessio
nalServices
66
31
1 2
NorthAmerica
Europe
SouthAm
erica
AsiaPacific
811
20
62
1to50
51to
500
501to5000
>5000
4
9 8
20
44
15
Non
e0to2years
2to5years
5to10years
10orm
oreyears
Notkno
wn
6
43 43
9
NotUsed
Some/
mesUsed
Requ
iredtoUse
Other
Figure 1: Characteristics of respondents' organizations
Respondents as Individuals. As the survey was mainly distributed via INCOSE regional chapter presidents, 76% of all respondents are members of INCOSE, the remaining 24% of responses come from subjects who either accessed the survey via the posting on the online platforms or were referred to it. The majority of all respondents (65%) have a leadership position within their organization, one third (31%) are engineers and the rest includes consultants, researchers and subjects who did not disclose their Position (Figure 3a). Figure 3b displays that 54% of all respondents are either novices or have some level of expertise in TRL usage. The remaining 46% are subjects with a high level of expertise. Similar to the responses on Organizational TRL experience, the number of responses increases linearly with the years of the Respondent TRL experience (Figure 3c). The respondents carry out different Functions within their organization (Figure 4). Engineering design and research functions dominated in the selection by respondents. Additionally subjects were asked to report which TRLs their work involves. Figure 5 shows that 80% of all respondents work on TRL6.

34
47
67
52
75
12
0 10 20 30 40 50 60 70 80
Other
SuggestedasCompanyBestPrac?ce
SuggestedasIndustryBestPrac?ce
RequiredbyInternalStandard
RequiredbyCustomer
RequiredbyIndustryRegula?on
NumberofResponses
Figure 2: Reason for TRL use, corresponding to response in Figure 1e (multiple selections allowed)
0
10
20
30
40
50
60
70
%Rep
onde
nts
14
22
28
37
0to2years
2to5years
5to10years
10orm
oreyears
65
31
4
Managem
ent
Engine
ering
Other
10
44
35
11
Novice
SomeExpe
rience
Aloto
fExperience
Expe
rt
a)Posi(on b)TRLexper(se c)TRLexperience
Figure 3: Characteristics of individual respondents
Correlations across Background Variables. Chi - square test and Spearman’s Rank Order Correlation were used to explore potential relationships between background variables. Chi - square was applied if the variables were categorical. Spearman’s Rank Order Correlation served as the non - parametric statistic if assumptions for the parametric test were violated but an underlying continuous interval level of measurement could be argued.
First the Respondent TRL Experience and the Respondent TRL Expertise were examined. Although both variables include categorical data, they can be treated as continuous variables based on the underlying increasing nature of the categories (categories of years, from novice to expert). Their relationship was investigated using Spearman’s Rank Order Correlation. A strong positive relationship between the two variables Respondent TRL Experience and Respondent TRL Expertise is established (rs = .57, N = 167, p = 0.001). Thus, unsurprisingly, higher years of experience with the TRL method are associated with a higher degree of expertise.

128
56
32
19
19
15
8
4
4
2
1
0 20 40 60 80 100 120 140
Engineering/DesignResearch
Consul<ngGeneralManagement
OtherTraining
QualityAssuranceBusinessAdministra<on
Marke<ngSales&CustomerService
Purchasing
NumberofResponses
Figure 4: Respondent functions within the organization (multiple selections allowed)
70
88
109 112120
134
122
105
84
0
20
40
60
80
100
120
140
160
1 2 3 4 5 6 7 8 9
Num
bero
fRespo
nses
TRLResponsibility
Figure 5: Respondent scope of TRL responsibility (multiple selections allowed)
At the organization level, a possible relationship between Organizational Size and Organizational TRL Experience was tested. Both variables were treated as continuous variables, because of the underlying continuously increasing scale of the categories (categories of number of employees, categories of years). Organizational Size and Organizational TRL Experience are slightly positively correlated (rs = .25, N = 167, p = .001).
Further, responses from subjects on implementation practice (i.e. respondents who answered that TRLs use is either required or only sometimes used) were also examined. A significant relationship between the Organizational TRL Practice and Organizational Size is evident (Χ2
(3, N = 142) = 9.55, p = .023). Large organizations are more likely to be required to use TRLs.
When comparing Respondent TRL Expertise with Industry sectors, responses from aerospace, defense and government sectors include a higher fraction of respondents with a high level of expertise than those from Manufacturing and Professional Services (Χ2 (4, N = 167) = 23.71, p = .001). Thus a significant relationship between Respondent TRL Expertise and Industry exists.

A similar significant relationship holds true between Respondent TRL Experience and Industry (Χ2 (12, N = 167) = 29.201, p = .004). There are more respondents in aerospace, defense and government, who have worked with TRLs for a larger amount of time, than in manufacturing and professional services.
A possible relationship between Industry and Organizational Reason for TRL Use has also been examined. A significantly higher fraction of respondents from companies which require TRLs can be observed in aerospace, defense and government than in manufacturing and professional services, where most of the subjects’ organizations only suggest them as a best practice (Χ2 (4, N = 167) = 21.11, p = .001). This significant relationship is confirmed by a significant correlation between Respondent TRL Expertise and Organizational Reason for TRL Use (Χ2 (1, N = 167) = 4.838, p = .023).
Prioritization of the TRL Challenges The criticality of the TRL challenges for the respondents was analyzed with the core set of 15 BWS experiment questions. Only complete questionnaires, which included responses to all background questions and all fifteen BWS questions, could be used for this analysis. The requirement of full coverage for the fifteen BWS questions reduced the number of respondents to N=113. The results provide prioritization information, and indicate the level of prevalence of the previously identified TRL challenges (Olechowski, Eppinger, and Joglekar 2015) from a broader user population point of view.
The individual responses to the Best-Worst trade off tasks were used to derive the aggregate Best-Worst scores of each challenge. Table 3 shows the details of the results, with variable Bcounts, Wcounts, BWscore, mean of BWcounts, standard deviation of BWcounts. The results from the counting analysis were confirmed with the more accurate hierarchical Bayesian estimation, the details of which can be found in the thesis (Tomaschek 2015).
Table 3: Relative importance of the challenges ordered from most to least critical Aggregated Individual
Challenges N Bcounts Wcounts BWcounts M
BWcounts SD
BWcounts
C1 Integration 113 237 30 207 1.83 2.00 C2 Interface maturity 113 193 27 166 1.47 1.86 C4 Environment change 113 188 41 147 1.30 1.80 C6 Overall maturity 113 135 35 100 0.88 1.59 C12 Likelihood to progress 113 120 80 40 0.35 1.84 C15 Imprecision of scale 113 116 76 40 0.35 2.00 C11 Effort to progress 113 130 101 29 0.26 2.35 C3 Assessment scope 113 97 70 27 0.24 1.57 C14 Subjectivity 113 123 106 17 0.15 2.31 C8 Development process 113 105 131 -26 -0.23 2.38 C9 Waiver 113 60 151 -91 -0.81 1.98 C5 Action taking 113 62 155 -93 -0.82 1.88 C10 Back-up plan 113 59 154 -95 -0.84 1.95 C13 Technology roadmaps 113 38 204 -166 -1.47 2.11 C7 Visual representation 113 32 334 -302 -2.67 2.40

Figure 6 shows the prioritization of the challenges by ranking according to the size of the mean criticality score, M BWcounts. Blue colored bars represent challenges associate with the system/product view, while green ones are related to a process or organization view. The purple colored bars are affiliated with the assessment validity.
-3
-2.5
-2
-1.5
-1
-0.5
0
0.5
1
1.5
2
2.5
3
1.Integra0
on
2.Interfacematurity
4.Enviro
nmen
tchange
6.Overallmaturity
12.Likelihoo
dtoprogress
15.Imprecision
ofscale
11.Effo
rtto
progress
3.Assessm
entscope
14.Sub
jec0vity
8.Develop
men
tprocess
9.W
aiver
5.Ac0on
taking
10.B
ack-up
plan
13.Techn
ologyroadmaps
7.Visu
alre
presen
ta0o
n
MeanCri)calityScore
Product&System
Process&Organiza0onal
AssessmentValidity
Figure 6: Mean criticality scores of the 15 TRL challenges
Discussion This empirical work aimed to develop an understanding of the usage demographics and the challenges associated with Technology Readiness Levels implementation. Being aware of both its users and its challenges opens up the opportunity to develop improvements to the TRL method, which meet the users’ need and thus have a positive impact on their work. TRLs were initially developed by NASA for aerospace applications and later adopted by the US Department of Defense and other US governmental agencies. Thus we are not surprised to see the majority of responses to the survey coming from practitioners in these fields. More than 70% of the respondents work in aerospace, defense and government related areas. These are high-risk industries where customers tend to require the use of TRLs when awarding and overseeing development contracts. These industries also host the most experienced users in our respondent set. The rest of responses come from areas like machinery manufacturing, automotive, oil & gas, transportation and health care sectors. It can be argued that all these industry sectors are technology driven and their respective business models are highly dependent on the uniqueness of the technology in their products. The chi-square test on Organizational Reason and Industry showed that in these new-to-TRL industries, TRLs are suggested as a best practice. Additionally respondents from machinery manufacturing, automotive, oil & gas, transportation and health care sectors are less familiar with the TRLs. This study indicates that TRLs are increasingly used beyond the aerospace industry, the parent sector where they were developed.

Data analysis shows that TRLs are predominately used in engineering and research functions within organizations, which develop or acquire complex technological systems. Additionally, the results have shown that larger organizations are more likely to require the use of TRLs than smaller ones, which suggest the use of the TRL method but do not make them mandatory. This finding follows the direction of previous literature on the relationship between organizational size and complexity and the degree of formalization (Child 1973).
The BWS experiment provides empirical evidence that some of the identified challenges by Olechowski et al. (2015) are regarded as very critical amongst the sampled TRL user population. The four most critical TRL challenges relate to themes of systems engineering. Challenge 1 brings up the issue that TRLs do not consider the integration of components. Challenge 2 criticizes the TRL method for not assessing the maturity of the interfaces. Challenge 4, ranked third, describes a lack of TRL procedure for assessing the maturity of an existing system when components have been modified or the operating environment has changed. Challenge 6, ranked fourth, is about the lack of an assessment of the overall system’s maturity. What these challenges have in common serves to highlight a gap in the TRL usage from a system engineering perspective. TRLs were designed to assess the maturity of an individual technology and include the transition from component-level to system-level at TRL 6 (Mankins 1995; Sadin, Povinelli, and Rosen 1989). However, their definitions do not provide any support for dealing with the increased complex nature of a system. The survey results show the high importance for a useful way to assess the maturity of complex systems. The fact that the top four challenges have one common underlying dimension indicates that TRLs in their original form are not sufficient for assessing the maturity of technologies in complex system engineering.
On the contrary, the BWS experiment also points out which challenges are not very critical for practitioners compared to the other challenges. Challenge 7, which is about a way to visually display technology readiness information, and Challenge 13, which raises that TRLs cannot be easily included in technology roadmaps, were ranked last. Perhaps, two reasons for this outcome may be that practitioners have already developed solutions for these challenges or their work is not negatively affected by these two challenges. Olechowski et al (2015) report on examples of such visualizations based on their field study.
There is agreement on the prioritization of challenges for the top four and bottom two in the sample regardless of the way the input data are segmented by respondent’s data. Details on some of these segmentations are excluded here for brevity but can be accessed from (Tomaschek 2015). The top four challenges may be solved by a single approach, in order to create the desirable impact on the usefulness of TRL analysis. The utility of such an approach will depend on how well the individual component technology view is amplified to the system context and how easily it can be adapted to a user’s specific problem. It certainly will need to be tightly tied to the system architecture and complex system engineering literature. Some approaches to improve the TRLs on the system architecture dimension have been already made (Olechowski et al, 2015; Kujawski, 2013; Mankins, 2009a; Sauser et al., 2008).
The mean BWcounts values of the challenges in the middle of the rank order are rather close to each other on the scale with high standard deviations relative to the means’ values. Hence no relative interpretation of the importance of these middle-ranked challenged can be made. For further insights, we suggest that the implementation teams examine these individually in their own usage context. This could help the users in understanding the reasons for the high standard deviations or disagreement on prioritization across the sample.

Conclusion This empirical research closes a gap in the Technology Readiness Levels and Systems Engineering literature. Through use of an international survey, we first characterize the users of the TRL method. Secondly, our study provides a prioritization of perceived importance of 15 previously identified TRL implementation challenges. To our knowledge, this is the first study of its kind that broadly examines TRL implementation practices. The results establish a common ground for future academic work and may guide researchers in this field with the selection of investigation areas. TRL users themselves may benefit from the findings of this empirical study. Awareness of the user groups and shortcomings of the TRLs may help practitioners focus on the core strengths of the TRLs, compensate the shortcomings with complementary measures, and seek out best–practices (Olechowski et al, 2015). This study also facilitates benchmarking of TRL capabilities at the organization, which may uncover areas of weakness and lead to follow-on improvement actions.
This study creates insights into the characteristics of individual users at organizations where TRLs are used for technology management. The use of TRLs is dominating in industries with highly unique and complex technology applications, e.g. aerospace, defense and governmental agencies. Complementing the existing literature, we find that manufacturing and professional service industries are relatively new to Technology Readiness Levels. Complex technology development and innovations increasingly serving as drivers for competition and the lack of an appropriate risk management tool may raise the interest of more industries in methods like TRLs. Findings, like the positive correlation between organization size and the required practice of TRLs, also offer opportunities for further academic work in innovation and organization management. It may be of interest for managers of large-sized, established organization to know whether TRLs drive or hinder creative thinking, system decomposition and integration, and incorporation of disruptive component innovations in organizations.
Being aware of the users’ characteristics and their assessment of the challenges of the TRL method is a crucial step in improving existing TRL knowhow. Some challenges were identified as very important or unimportant uniformly amongst all the respondents. Almost all respondents raised the criticality of the challenges related to systems engineering. Hence, this study confirms the findings of existing TRL and systems engineering literature and hints on the great need for an overall system readiness level measure. We conclude by suggesting that the exploration of the TRL user community and the assessment of the TRL challenges from the user perspective that this research was aimed at facilitates the benchmarking of TRL capabilities in firms and offers opportunities to researchers and organizations to improve the Technology Readiness Levels to better manage risk, communicate development progress and specify deliverables.
Acknowledgement This research has been greatly supported by Pat Hale, Executive Director of the System Design and Management Program at MIT, who connected the authors with the INCOSE chapters. Additionally the authors would like to thank INCOSE chapter presidents for their interest and support with the survey distribution. Finally, the authors are very grateful to all the professionals from industry who took the time to fill out the survey.
References

Abernathy, William J., Kim B Clark, George White, Alan Kantrow, and Robert Hayes. 1985. “Innovation : Mapping the Winds of Creative Destruction *.” doi:10.1016/0048-7333(93)90040-O.
Auger, Pat, Timothy M. Devinney, and Jordan J. Louviere. 2007. “Using Best-Worst Scaling Methodology to Investigate Consumer Ethical Beliefs across Countries.” Journal of Business Ethics 70 (3): 299–326. doi:10.1007/s10551-006-9112-7.
Azizian, Nazanin, Thomas Mazzuchi, Shahram Sarkani, and David Rico. 2011. “A Framework for Evaluating Technology Readiness, System Quality, and Program Performance of US DoD Acquisitions.” Systems Engineering 14 (4): 410–427. doi:10.1002/sys.
Azizian, Nazanin, Shahram Sarkani, and Thomas Mazzuchi. 2009. “A Comprehensive Review and Analysis of Maturity Assessment Approaches for Improved Decision Support to Achieve Efficient Defense Acquisition.” In Proceedings of the World Congress on Engineering and Computer Science. Vol. II. San Francisco.
Bilbro, J.W. 2007. “A Suite of Tools for Technology Assessment, Technology Maturity Conference: Multi-Dimensional Assessment of Technology Maturity.” In Virginia Beach, VA: Air Force Research Laboratory.
Child, J. 1973. “Predicting and Understanding Organisational Structure.” Adminstrative Science Quarterly 18: 168–185.
Chrzan, Keith, and Michael Patterson. 2006. “Testing for the Optimal Number of Attributes in MaxDiff Questions.” Proceedings of the Sawtooth Software Conference 98382 (360).
Cohen, Eli. 2009. “Applying Best-Worst Scaling to Wine Marketing.” International Journal of Wine Business Research 21 (1): 8–23. doi:10.1108/17511060910948008.
Cohen, S., and L. Neira. 2003. “Measuring Preference for Product Benefits across Countries.” In Sawtooth Software Conference 2003.
Cohen, Steve, and Bryan Orme. 2004. “What’s Your Preference?” Marketing Research. doi:10.2307/30000270.
Cohen, Steven H. 2003. “Maximum Difference Scaling: Improved Measures of Importance and Preference for Segmentation.” Vol. 98382.
Cornford, S.L., and L. Sarsfield. 2004. “Quantitative Methods for Maturing and Infusing Advanced Spacecraft Technology.” 2004 IEEE Aerospace Conference Proceedings: 663–681. doi:10.1109/AERO.2004.1367652.
Det Norske Veritas. 2011. “Recommended Practice DNV-RP-A203 Qualification of New Technology.”
Engel, DW, AC Dalton, K Anderson, C Sivaramakrishnan, and C Lansing. 2012. “Development of Technology Readiness Level (TRL) Metrics and Risk Measures.”
Finn, Adam, and Jordan J. Louviere. 1992. “Determining the Appropriate Response to Evidence of Public Concern: The Case of Food Safety.” Journal of Public Policy & Marketing 11 (2): 12–25.

Goodman, Steven Paul, Larry Lockshin, and Eli Cohen. 2006. “Using the Best-Worst Method to Examine Market Segments and Identify Different Influences of Consumer Choice.” International Wine Business & Marketing Conference (3rd: 2006: Montpellier, France) (972 8): 1–15.
Holt, Jonathan E, and Richard Beasley. 2011. “‘That Wasn’t Meant to Happen!’ Managing the Hidden Risks of System Novelty.” In INCOSE.
Jimenez, Hernando, and Dimitri N. Mavris. 2014. “Characterization of Technology Integration Based on Technology Readiness Levels.” Journal of Aircraft 51 (1) (January): 291–302. doi:10.2514/1.C032349.
Kujawski, Edouard. 2013. “Analysis and Critique of the System Readiness Level.” IEEE Transactions on Systems, Man, and Cybernetics: Systems 43 (4) (July): 979–987. doi:10.1109/TSMCA.2012.2209868.
Lee, Julie Anne, Geoffrey Soutar, and Jordan Louviere. 2008. “The Best-Worst Scaling Approach: An Alternative to Schwartz’s Values Survey.” Journal of Personality Assessment 90 (4): 335–347. doi:10.1080/00223890802107925.
Lipovetsky, Stan, and Michael Conklin. 2014. “Best-Worst Scaling in Analytical Closed-Form Solution.” The Journal of Choice Modelling 10: 60–68.
Louviere, JJ, DA Hensher, and JD Swait. 2000. No Stated Choice Methods: Analysis and applicationsTitle.
Louviere, Jordan J., and George Woodworth. 1983. “Design and Analysis of Simulated Consumer Choice or Allocation Experiments: An Approach Based on Aggregate Data.” Journal of Marketing Research 20 (4): 350–367. doi:10.2307/3151440.
Louviere, Jordan, Ian Lings, Towhidul Islam, Siegfried Gudergan, and Terry Flynn. 2013. “An Introduction to the Application of (case 1) Best-Worst Scaling in Marketing Research.” International Journal of Research in Marketing 30 (3): 292–303. doi:10.1016/j.ijresmar.2012.10.002.
Mahafza, S. R. 2005. “A Performance-Based Methodology to Assess Department of Defense Technologies.” The University of Alabama.
Mankins, John C. 1995. “Technology Readiness Levels.” White Paper, Http://www.hq.nasa.gov/office/codeq/trl/trl.pdf 6 (2): 5.
Mankins, John C. 2002. “Approaches to Strategic Research and Technology (R&T) Analysis and Road Mapping.” Acta Astronautica 51 (1-9): 3–21.
———. 2009. “Technology Readiness and Risk Assessments: A New Approach.” Acta Astronautica 65 (9-10) (November): 1208–1215. doi:10.1016/j.actaastro.2009.03.059.
Mueller, S., I. L. Francis, and L. Lockshin. 2009. “Comparison of Best-Worst and Hedonic Scaling for the Measurement of Consumer Wine Preferences.” Australian Journal of Grape and Wine Research 15 (3): 205–215. doi:10.1111/j.1755-0238.2009.00049.x.
Mueller, Simone, and Cam Rungie. 2009. “Is There More Information in Best-Worst Choice Data?: Using the Attitude Heterogeneity Structure to Identify Consumer Segments.”

International Journal of Wine Business Research 21 (1): 24–40. doi:10.1108/17511060910948017.
NASA. 2013. “NASA 7123.1B Systems Engineering Processes and Requirements.”
———. 2015. “Why We Explore.” http://www.nasa.gov/exploration/whyweexplore/why_we_explore_main.html.
Olechowski, Alison, Steven D Eppinger, and Nitin Joglekar. 2015. “Technology Readiness Levels at 40: A Study of State-of-the-Art Use, Challenges, and Opportunities.” In PICMET ’15, 2084–2094. Portland, Oregon.
Orme, Bryan K. 2005. “Accuracy of HB Estimation in MaxDiff Experiments.” Sequim, WA: Sawtooth Software. 98382 (360).
Porter, Michael E. 1985. “Technology and Competitive Advantage.” Journal of Business Strategy 5 (3): 60–78. doi:10.1108/eb039075.
Sadin, Stanley, Frederick Povinelli, and Robert Rosen. 1989. “The NASA Technology Push Towards Future Space Mission Systems.” Acta Astronautica 20: 73–77.
Sauser, Brian J., Jose Emmanuel Ramirez-Marquez, Devanandham Henry, and Donald DiMarzio. 2008. “A System Maturity Index for the Systems Engineering Life Cycle.” International Journal of Industrial and Systems Engineering 3 (6): 673–691.
Smith, Jim. 2004. “An Alternative to Technology Readiness Levels for Non-Developmental Item (NDI) Software.”
Thurstone, L. L. 1927. “A Law of Comparative Judgment.” Psychological Review 34 (4): 273–286. doi:10.1037/h0070288.
Tomaschek, Katharina. 2015. “An Empirical Investigation of the Challenges of Technology Readiness Levels Application.” Swiss Federal Institute of Technology (ETH).
Tushman, Michael L, and Philip Anderson. 1986. “Technological Discontinuities and Organizational Environments.” Administrative Science Quarterly 31 (3): 439–465.
US Department of Defense. 2011. “Technology Readiness Assessment (TRA) Guidance.” http://www.acq.osd.mil/chieftechnologist/publications/docs/TRA2011.pdf.
Valerdi, Ricardo, and Ron J. Kohl. 2004. “An Approach to Risk Management.” In Engineering Systems Divison Symposium.
Biography Katharina Tomaschek is a master’s candidate in Management, Technology and Economics at the Swiss Federal Institute of Technology (ETH) in Zurich, Switzerland. She received her bachelor’s degree in mechanical engineering and management at Vienna University of Technology, Austria. Her research interests are in product development, technology and innovation management.
Alison Olechowski is a PhD candidate in the Department of Mechanical Engineering at the Massachusetts Institute of Technology. She earned her master’s degree from MIT studying risk management in product development, and a bachelor’s degree from Queen’s University

in Kingston, Ontario. She is currently studying technology maturity and innovation in complex system development.
Steven D. Eppinger holds the General Motors LGO Professorship at the MIT Sloan School of Management, where he teaches product development and technology management in graduate and executive programs. He received bachelor, master, and doctoral degrees in mechanical engineering from MIT. His research interests span management of complex engineering processes, technical project management, and product design methods.
Nitin Joglekar is on the faculty at the Boston University’s School of Management. He studied engineering at IIT Kharagpur, India, Memorial University, Canada, and at MIT. He received a doctoral degree from the MIT Sloan School. His work experience includes stints in the energy and IT industries. Dr. Joglekar’s research interests include technology readiness and commercialization, entrepreneurial operations, design for user experience, and allied public policy issues.