a suspended sediment budget for pool 13 and la grange pool ... · u.s. geological survey upper...
TRANSCRIPT

Long Term Resource Monitoring Program
Technical Report 2004-T004
September 2004
A Suspended Sediment Budget for Pool 13 and La Grange Pool of the Upper Mississippi River System

Long Term Resource Monitoring Program Technical Reports provide Long Term Resource Monitoring Program
partners with scientific and technical support.
All reports in this series receive anonymous peer review.
Mention of trade names or commercial products does not constitute endorsementor recommendation for use by the U.S. Department of the Interior, U.S. Geological Survey.
A Suspended Sediment Budget for Pool 13 and La Grange Pool of the Upper Mississippi River System
by
Robert F. GaugushU.S. Geological Survey
Upper Midwest Environmental Sciences Center 2360 Fanta Reed Road
La Crosse, Wisconsin 54603
Final Report toU.S. Army Corps of Engineers
Rock Island, Illinois
forLong Term Resource Monitoring Program
Scope of Work 3.4(Suspended Sediment Budgets for Pool 13 and La Grange Pool)
September 2004

Suggested citation:
Gaugush, R. F. 2004. A suspended sediment budget for Pool 13 and La Grange Pool of the Upper Mississippi River System. Final report to U.S. Army Corps of Engineers. U.S. Geological Survey, Upper Midwest Environmental Sciences Center, La Crosse, Wisconsin. September 2004. LTRMP 2004-T004. 13 pp. + Appendixes A–D.
Additional copies of this report may be obtained from the National Technical Information Service, 5285 Port Royal Road, Springfield, VA 22161 (1-800-553-6847 or 703-487-4650). Also available to registered users from the Defense Technical Information Center, Attn: Help Desk, 8725 Kingman Road, Suite 0944, Fort Belvoir, VA 22060-6218 (1-800-225-3842 or 703-767-9050).
iii
ContentsPage
Preface ................................................................................................................................................v
Abstract ................................................................................................................ ................................1
Introduction .......................................................................................... ................................................2
Study area .............................................................................................................................................2 Pool 13 ...........................................................................................................................................2 La Grange Pool ..............................................................................................................................3
Methods ................................................................................................................................................3
Results and discussion .........................................................................................................................5 Pool 13 ...........................................................................................................................................5 La Grange Pool ..............................................................................................................................8 Comparison of Pool 13 and La Grange Pool ...............................................................................10
Conclusion .........................................................................................................................................11
Acknowledgments ..............................................................................................................................12
References ............ ..............................................................................................................................12
Appendix A ......................................................................................................................................A-1
Appendix B ...................................................................................................................................... B-1
Appendix C ...................................................................................................................................... C-1
Appendix D ...................................................................................................................................... D-1
iv
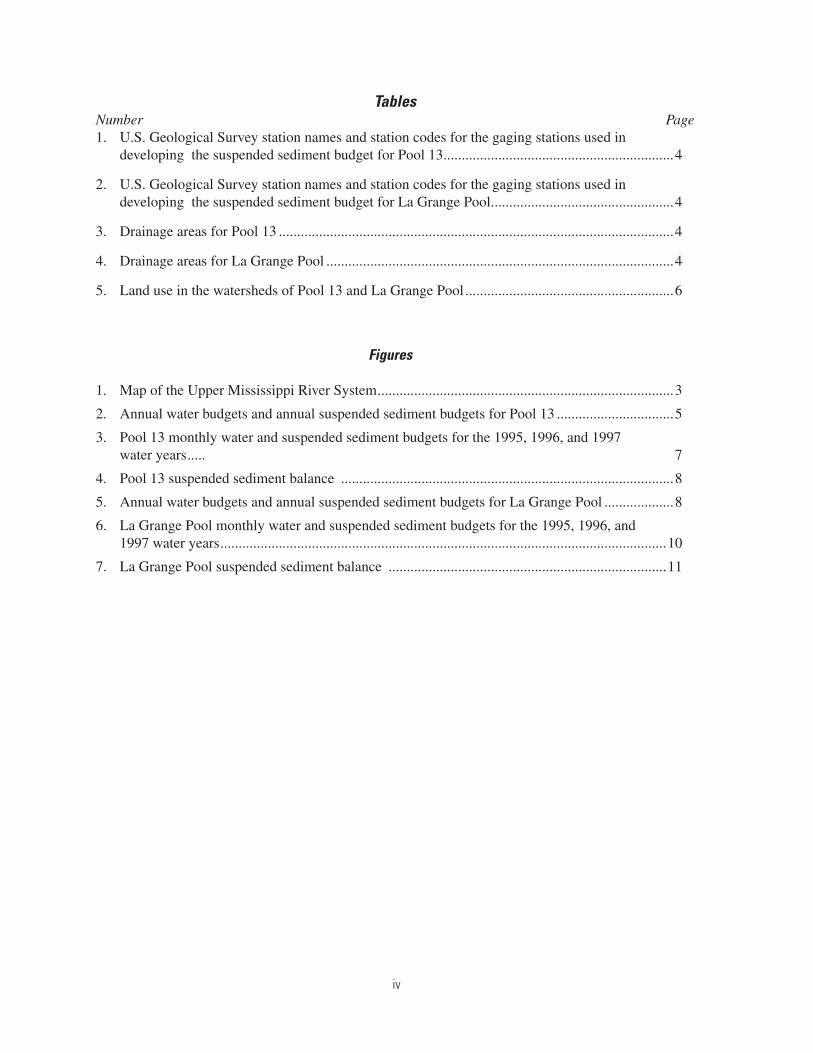
TablesNumber Page1. U.S. Geological Survey station names and station codes for the gaging stations used in
developing the suspended sediment budget for Pool 13 ...............................................................4
2. U.S. Geological Survey station names and station codes for the gaging stations used in developing the suspended sediment budget for La Grange Pool ..................................................4
3. Drainage areas for Pool 13 ............................................................................................................4
4. Drainage areas for La Grange Pool ...............................................................................................4
5. Land use in the watersheds of Pool 13 and La Grange Pool .........................................................6
Figures
1. Map of the Upper Mississippi River System .................................................................................3
2. Annual water budgets and annual suspended sediment budgets for Pool 13 ................................5
3. Pool 13 monthly water and suspended sediment budgets for the 1995, 1996, and 1997 water years ..... 7
4. Pool 13 suspended sediment balance ...........................................................................................8
5. Annual water budgets and annual suspended sediment budgets for La Grange Pool ...................8
6. La Grange Pool monthly water and suspended sediment budgets for the 1995, 1996, and 1997 water years ..........................................................................................................................10
7. La Grange Pool suspended sediment balance ............................................................................11

v
Preface
The Long Term Resource Monitoring Program (LTRMP) was authorized under the Water Resources Development Act of 1986 (Public Law 99-662) as an element of the U.S. Army Corps of Engineers’ Environmental Management Program. The LTRMP is being implemented by the Upper Midwest Environmental Sciences Center, a U.S. Geological Survey science center, in cooperation with the five Upper Mississippi River System (UMRS) States of Illinois, Iowa, Minnesota, Missouri, and Wisconsin. The U.S. Army Corps of Engineers provides guidance and has overall Program responsibility. The mode of operation and respective roles of the agencies are outlined in a 1988 Memorandum of Agreement.
The UMRS encompasses the commercially navigable reaches of the Upper Mississippi River, as well as the Illinois River and navigable portions of the Kaskaskia, Black, St. Croix, and Minnesota Rivers. Congress has declared the UMRS to be both a nationally significant ecosystem and a nationally significant commercial navigation system. The mission of the LTRMP is to provide decision makers with information for maintaining the UMRS as a sustainable large river ecosystem given its multiple-use character. The long-term goals of the Program are to understand the system, determine resource trends and effects, develop management alternatives, manage information, and develop useful products.
This report supports LTRMP Operating Plan (U.S. Fish and Wildlife Service 1993) Task 1.2.1.2 Select Processes for Research, and Tasks 1.2.1.3, Establish Experimental Design, under Strategy 1.2.1, Determine Effects of Sedimentation and Sediment Transport Processes on the Upper Mississippi River System Ecosystem. This report was developed with funding provided by the Long Term Resource Monitoring Program.

A Suspended Sediment Budget for Pool 13 and La Grange Pool of the Upper Mississippi River System
Final Report toU.S. Army Corps of Engineers
Rock Island, Illinois
forLong Term Resource Monitoring Program
Scope of Work 3.4(Suspended Sediment Budgets for Pool 13 and La Grange)
by
Robert F. GaugushU.S. Geological Survey
Upper Midwest Environmental Sciences Center 2360 Fanta Reed Road
La Crosse, Wisconsin 54603
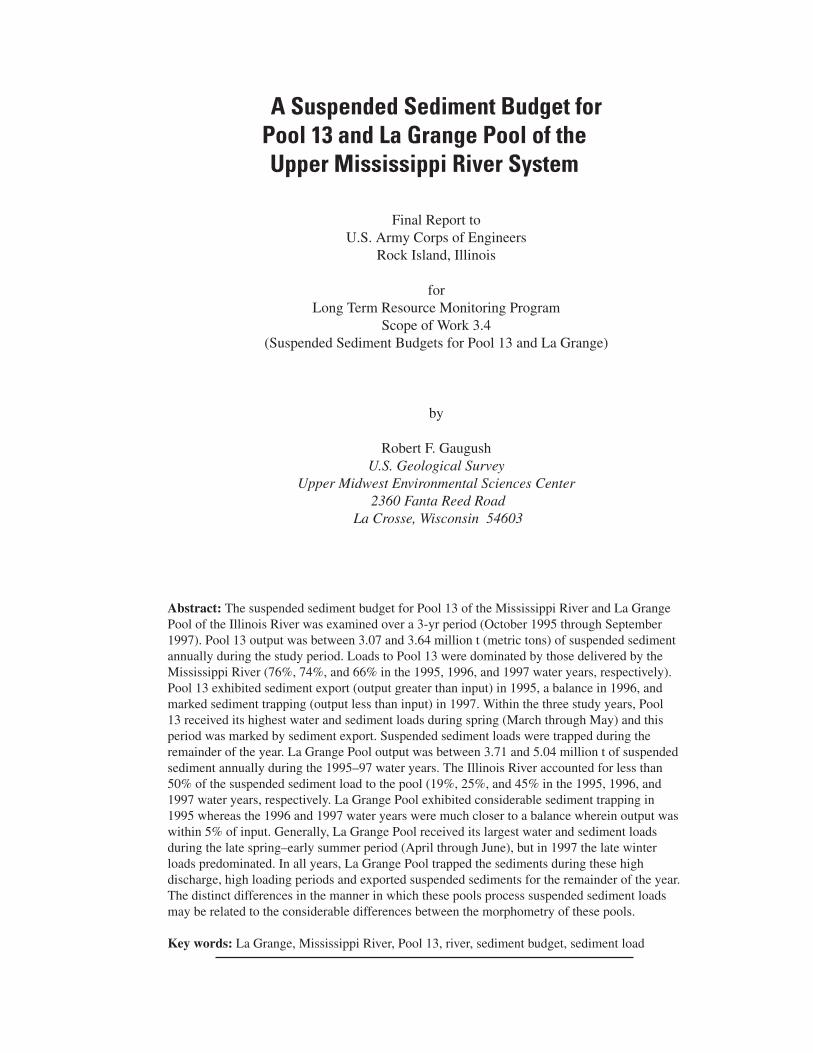
Abstract: The suspended sediment budget for Pool 13 of the Mississippi River and La Grange Pool of the Illinois River was examined over a 3-yr period (October 1995 through September 1997). Pool 13 output was between 3.07 and 3.64 million t (metric tons) of suspended sediment annually during the study period. Loads to Pool 13 were dominated by those delivered by the Mississippi River (76%, 74%, and 66% in the 1995, 1996, and 1997 water years, respectively). Pool 13 exhibited sediment export (output greater than input) in 1995, a balance in 1996, and marked sediment trapping (output less than input) in 1997. Within the three study years, Pool 13 received its highest water and sediment loads during spring (March through May) and this period was marked by sediment export. Suspended sediment loads were trapped during the remainder of the year. La Grange Pool output was between 3.71 and 5.04 million t of suspended sediment annually during the 1995–97 water years. The Illinois River accounted for less than 50% of the suspended sediment load to the pool (19%, 25%, and 45% in the 1995, 1996, and 1997 water years, respectively. La Grange Pool exhibited considerable sediment trapping in 1995 whereas the 1996 and 1997 water years were much closer to a balance wherein output was within 5% of input. Generally, La Grange Pool received its largest water and sediment loads during the late spring–early summer period (April through June), but in 1997 the late winter loads predominated. In all years, La Grange Pool trapped the sediments during these high discharge, high loading periods and exported suspended sediments for the remainder of the year. The distinct differences in the manner in which these pools process suspended sediment loads may be related to the considerable differences between the morphometry of these pools.
Key words: La Grange, Mississippi River, Pool 13, river, sediment budget, sediment load

2
Introduction
The Upper Mississippi River System (UMRS), defined as the navigable portions of the Mississippi and Illinois Rivers, has been directly affected by human activities (activities in the river channel itself, rather than in the watershed) such as the construction of wing dams and side channel closing structures for at least 120 yrs, but the most severe alteration occurred with the construction of a series of locks and dams in the late 1930s. Initially, impoundment of these rivers created a very diverse mosaic of physical features such as islands, braided channels, and backwater lakes. On the Mississippi River, the construction of the navigation system created a series of shallow impoundments occupying most of the floodplain. Whereas the initial filling of these areas was seen as a boon to the overall physical heterogeneity, it was soon apparent that the hydrological changes brought about by impoundment were having considerable effects on sedimentation processes (Fremling and Claflin 1984). A general pattern was observed involving island loss and excessive backwater sedimentation. This erosion of high points and filling in of low points led to a considerable loss of physical heterogeneity. Essentially the same process (impoundment) that led to their creation would also be responsible for the demise of the islands, braided channels, and backwater lakes. Similar changes have been observed in the Illinois River (Sparks 1984). Increased sedimentation, primarily in off-channel areas, has for some time been recognized as a major concern and has been identified as one of the primary threats to the ecological resources of the Upper Mississippi River (Great River Environmental Action Team 1980).
Most previous sediment budget studies on the Mississippi and Illinois Rivers have focused on large-scale (a long reach or the entire river) and have been based on relatively few data. Nakato (2000) assembled the available data and developed a sediment budget, which included estimates of bedload, for Pools 11–26 on the Mississippi River for two long periods: post-impoundment to the mid-1950s and mid-1950s to the present. A major finding of Nakato’s study (2000) was
that sediment loading is lower in the more recent period. Demissie et al. (2003) produced a sediment budget for the Illinois River for 1981–94. Data from the Illinois River indicated that, on the average, 12.4 million t (metric tons; 1 metric ton = 1,000 kg) of sediment are delivered to the system every year and the system exports an average of 5.3 million t. Approximately 7.2 million t are stored in the system.
A workshop held in 1994 identified the serious need to develop pool-scale sediment budgets for the navigation pools of the UMRS (Gaugush and Wilcox 1994). Pool-scale budgets wherein the in-pool processes were viewed as a “black box” were seen, collectively, as a necessary first step in developing an understanding of sediment processing in the UMRS. Pool 13 on the Mississippi River and La Grange Pool on the Illinois River were chosen as the first sites for this type of study. The objectives of this study were to
1. determine the suspended sediment budget in two distinctly different navigation pools of the UMRS;
2. determine if the budgets were dominated by sediment storage (input greater than output), a quasi-equilibrium (input ≈ output), or export (output greater than input); and
3. examine the relation between sediment mass flux and the annual dynamics of water discharge.
Study Area
Pool 13
Pool 13 is between river miles 522.5 and 556.8 (measured from the confluence with the Ohio River) on the Mississippi River (Figure 1). Pool 13 is 1 of 26 pools formed by a series of locks and dams constructed in the late 1930s to maintain a 9-foot channel as an aid to commercial navigation. Construction of Lock and Dam 13 was completed in 1938 and placed in operation in 1939 (U.S. Army Corps of Engineers 1980). Four small rivers discharge into Pool 13: the Maquoketa and Elk Rivers on the Iowa (western) side of the pool and the Apple and Plum Rivers on the Illinois (eastern) side. Eight additional minor streams also discharge into Pool 13. Mean discharge

3
from Pool 13 is 1379 m3 s-1 for the period of record (1873–1997) and time of travel for water is approximately 10 h during normal operation. Pool 13 is in an extended valley segment, the walls of which are erosion resistant limestone and dolomite formations (Knox 2000). A narrow bedrock gorge ends in the upper reach of Pool 13. The generally flat floodplain is 2.4 km wide at the upper end of Pool 13 and widens to almost 6.4 km at the lock and dam.
La Grange Pool
La Grange Pool is between Illinois River miles 80.2 and 157.7 (measured from the confluence with the Mississippi River; Figure 1). La Grange Pool is one of six pools on the Illinois River formed by impoundment with locks and dams to support commercial navigation. As with the system on the Mississippi River, these structures were constructed to aid in the maintenance of a 9-foot navigation channel. The Illinois Waterway serves to provide a commercial navigation connection between the Mississippi
River and Lake Michigan. The lock and dam that forms La Grange Pool is the most downstream of the nine locks and dams forming the Illinois Waterway. La Grange Lock and Dam were constructed and put into operation in 1939 (U.S. Army Corps of Engineers 1986). Four significant rivers enter La Grange Pool: the Spoon and La Moine Rivers on the northern side and the Mackinaw and Sangamon Rivers on the southern side. Mean discharge for the period of record (1939–97) is 645 m3 s-1 and the mean travel time for water is 24–36 hours. La Grange Pool occupies the ancient course of the Mississippi River, which accounts for its low gradient and large valley width (Knox 2000). The main channel is relatively narrow and uniform with only a slight widening at the lock and dam. An extensive
A
B C
Figure 1. Map of the Upper Mississippi River System: (A) location of the two pools in the upper Midwest of the United States; (B) Pool 13; and (C) La Grange Pool.
series of levees separate most of the floodplain from the Illinois River.
Methods
Pool 13 was allocated six gaging sites, one upstream of the pool on the Mississippi River, one downstream of the pool, and one each for the four major tributaries to the pool (Figure 1). Gaging stations (Table 1) were established on the Mississippi River at the next upstream lock and dam, the Apple and Plum Rivers on the Illinois (eastern) side, the Maquoketa and Elk Rivers on the Iowa (western) side, and the Mississippi River below Lock and Dam 13. Drainage area is 221,695 km2 at the most downstream station, 96.3% of which is contributed by the Mississippi River and less than 2.5% by the four gaged tributaries (Table 2). Only 1.3% of the drainage area was not gaged.
La Grange Pool was allocated six gaging sites, one upstream of the pool on the Illinois River, one downstream of the pool, and one each

4
for the four major tributaries to the pool (Figure 1). Gaging stations (Table 3) were established on the Illinois River below the next upstream lock and dam, the Spoon and La Moine Rivers on the northern side of the pool, the Sangamon and Mackinaw Rivers on the southern side of the pool, and the Illinois River below the La Grange Lock and Dam. Drainage area is 69,262 km2 at the most downstream station, of which 54.5% is contributed by the Illinois River above La Grange Pool and 34% by the four gaged tributaries (Table 4). Approximately 11.5% of the drainage was not gaged and represents the area between the tributary gaging stations and the pool, ungaged tributaries, and direct drainage into the pool.
At both pools, discharge gaging and suspended sediment sampling were conducted by the U.S. Geological Survey according to established U.S. Geological Survey/Water Resources Division (USGS/WRD) methods (Buchanon and Somers 1969; Guy and Norman 1982). Suspended sediment sampling at each gaging site consisted of approximately
250 samples per year with the samples taken weekly during base flow conditions and more frequent sampling during storm events. Discharge measurements were recorded continuously by automated equipment. This study was initiated in 1994 with site preparation and gage installation. Actual data collection began in October 1995. Sampling was terminated at the end of September 1997 after 3 yrs of data collection.
The USGS/WRD uses the continuous discharge data and the instantaneous suspended sediment concentration data to compute mean daily water discharge and daily suspended sediment loads for each gaging station. These mean daily data were used in this study to develop the water and suspended sediment budgets for Pool 13 and La Grange Pool. These data have been published in annual water data reports for Illinois and Iowa (May et al. 1996, 1997, 1998; Wicker et al. 1996, 1997, 1998).
Table 1. U.S. Geological Survey station names and station codes for the gaging stations used in developing the suspended sediment budget for Pool 13.
Station name Station code
Mississippi River at Lock & Dam 12 at Bellvue, Iowa 05416100
Apple River near Hanover, Illinois 05419000
Plum River at Savanna, Illinois 05420100
Maquoketa River near Maquoketa, Iowa 05418500
Elk River near Altmont, Iowa 05420300
Mississippi River at Clinton, Iowa 05420500
Table 2. U.S. Geological Survey station names and station codes for the gaging stations used in developing the suspended sediment budget for La Grange Pool.
Station name Station code
Illinois River at Pekin, Illinois 05563800
Mackinaw River near Green Valley, Illinois 05568500
Spoon River at Seville, Illinois 05570000
Sangamon River near Oakford, Illinois 05583000
La Moine River at Ripley, Illinois 05585000
Illinois River at Valley City, Illinois 05586100
Table 3. Drainage areas for Pool 13.
SourceDrainage
area (km2)Proportion of total (%)
Mississippi River above Pool 13 213,408 96.3
Apple River 640 0.3
Plum River 707 0.3
Maquoketa River 4,022 1.8
Elk River 145 0.1
Total gaged input 218,920 98.8
Ungaged 2,772 1.3
Output for Pool 13 221,695
Table 4. Drainage areas for La Grange Pool.
SourceDrainage
area (km2)Proportion of total (%)
Illinois River above La Grange Pool 37,775 54.5
La Moine River 3,349 4.8
Mackinaw River 2,779 4.0
Sangamon River 13,190 19.0
Spoon River 4,237 6.1
Total gaged input 61,330 88.5
Ungaged 7,932 11.5
Output for La Grange Pool 69,262

5
Results and Discussion
Pool 13
The drainage area of Pool 13 is dominated by that area drained by the Mississippi River that contributes just over 96% of the total area. Of the remaining 3.7%, 2.5% is contributed by the four gaged tributaries of this study and 1.2% is ungaged. The predominance of the Mississippi River in terms of its contribution to the overall drainage area would suggest that the water and sediment budgets for Pool 13 will be influenced primarily by events or conditions above the pool and conditions directly surrounding the pool will have a lesser effect.
The water years of 1995, 1996, and 1997 were generally wetter than the long-term (1873–1997) average (Figure 2, upper), but still considerably drier than the major flood year of 1993. Discharges from the pool were greater than 125% of the mean daily discharge for the period of record. Input of water to Pool 13 is provided predominantly (generally about 95% of the amount discharged from the pool) by the Mississippi River. The gaged tributaries provide only about 3%.
As with most water budgets, there are some unknown (i.e., unmeasured) sources and losses of water from the pool. A typical assumption in the absence of data is that precipitation and evaporation are in balance (the amount input by precipitation equals the amount lost to evaporation). Another unknown source is the sum of all inputs from ungaged tributaries and direct runoff from the land adjacent to the pool and not drained by a stream. To estimate this source, one might assume that the ungaged contribution is directly proportional to the ungaged drainage area. This requires one further assumption, that the nature of the ungaged area (its land use, soil types, slopes, etc.) is similar to the features of the gaged tributaries. Given these assumptions, an export coefficient (amount of material exported divided by the drainage area) for the gaged tributaries can be calculated. This export coefficient multiplied by the ungaged drainage area provides an estimate of the ungaged contribution to the budget.
Generating ungaged estimates in the above manner results in a water budget in balance (inputs = outputs) for all water years. There is less than a 1% difference between water input and water output for the 3 yrs studied (Figure 2, upper). Developing a water budget that is in balance (given the assumptions made) suggests that the sampling design and sample allocation should also provide adequate estimates for the suspended sediment budget.
Pool 13 exported between 8,500 and 10,000 t of suspended sediment on a daily basis during the 1995–97 water years (Figure 2, lower). The majority (76% in 1995, 74% in 1996, and 66% in 1997) of the sediment input to Pool 13 is
Input Output Input Input
Input Input Input
Output Output
Output Output Output1995 1996 1997
1995 1996 1997Water year
Water year
POR
1993
Susp
ende
d se
dim
ent l
oad,
met
ric to
ns/d
ayM
ean
daily
dis
char
ge, m
3 /se
c
0
500
1000
1500
2000
2500
3000
0
1000
2000
3000
4000
5000
6000
7000
8000
9000
10000
11000
Source Mainstem Tributary Ungaged
Source Mainstem Tributary Ungaged
Figure 2. Annual water budgets (upper) and annual suspended sediment budgets (lower) for Pool 13. Horizontal reference lines indicate mean daily discharge at the downstream end of the Pool 13 study area for the period of record (POR, 1873–1997) and for the 1993 flood (1993).

6
supplied by the Mississippi River. Whereas the gaged tributaries only accounted for about 3% of the drainage area and discharge, they provided a greater portion (16% in 1995, 17% in 1996, and 22% in 1997) of the suspended sediment load. These loads are more than five times greater than would be expected based solely on these tributaries’ contribution to the overall drainage area or water input.
The observation that the gaged tributaries contributed more to the sediment budget than would be expected based on either their drainage area or their water discharge suggests a difference in the relation between drainage area and sediment delivery. In other words, the local drainage area has a greater sediment delivery per unit area than the drainage area above the pool. This is not an unexpected result because, though the local drainage area (that area drained by tributaries that enter Pool 13) has a predominantly agricultural land use, the area above Pool 13 drained by the Mississippi River is more forested with lesser agricultural use (Table 5).
at that level. Differences greater than 5% are usually indicative of real differences in the budget (i.e., input greater than output or input less than output).
Given the relative similarity in the water budget for the 3 yrs studied, there are considerable differences between years in the suspended sediment budgets. The data suggest sediment export (output greater than input) in 1995, a balance in 1996, and marked sediment trapping (output less than input) in 1997. Two processes in water year 1997 result in a positive sediment budget (material is stored in the pool). First, tributary loads (and, as a result, the ungaged contribution) are somewhat greater than the previous 2 yrs. Second, the pool output is considerably lower than the previous 2 yrs. This observation suggests that Pool 13 may process tributary loads in a manner different from mainstem loads.
The nature of the observed change in the 1997 suspended sediment loading cannot be derived from a simple examination of the annual estimates. Determining why Pool 13 apparently trapped sediments in 1997 will require a closer examination of the dynamics and timing of events within the year. The pattern of changing conditions during the year most likely will affect the annual estimate. For example, the timing of large loading events (when they occur within the year, such as in spring instead of summer or fall) may have a large effect on whether the suspended load is trapped by the system or passed through it.
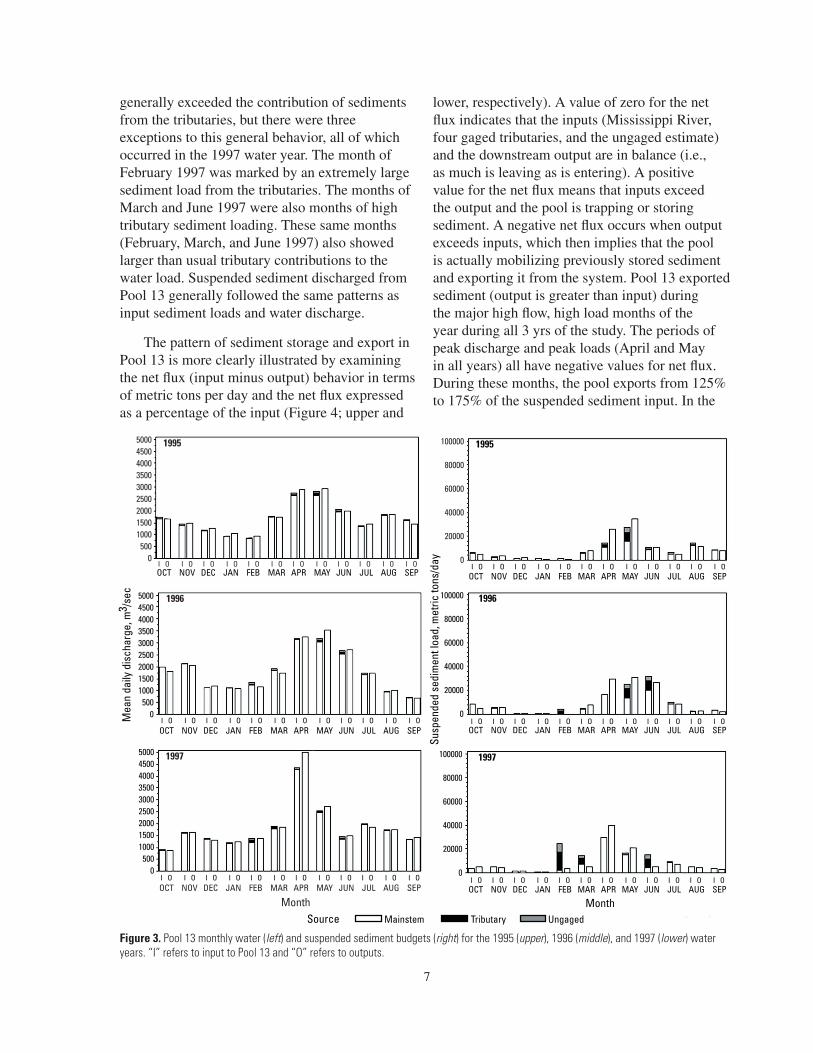
The Mississippi River and gaged tributaries to Pool 13 exhibited the expected annual patterns of water discharge and suspended sediment loads. Discharges were at their lowest in the winter (December through February), rose to their peak in the spring (April and May), fell through the summer (June through September), and generally rose to a smaller peak in the fall (October and November) before dropping back to the winter minimum (Figure 3; upper, middle, and lower left). Suspended sediment loads, not surprisingly, followed the same general pattern through the year (Figure 3; upper, middle, and lower right). Sediment loads from the Mississippi River
The same assumptions used to estimate the contribution of water from the ungaged areas were used to estimate the contribution of those areas to the suspended sediment load. Ungaged estimates were half (8% in 1995, 8% in 1996, and 11% in 1997) the sediment contribution from the gaged tributaries because the ungaged drainage area was approximately 50% of the gaged tributary drainage area.
Typically when budgets show a difference of about 5% or less they are said to be in balance. Errors associated with the data and the estimation of ungaged sources cannot distinguish differences
Table 5. Land use (expressed as percent of the total drainage area) in the watersheds of Pool 13 and La Grange Pool.
Land Cover/Use Pool 13 La Grange Pool
Agriculture 57.9 83.6
Deciduous forest 13.1 5.8
Evergreen forest 2.2 0.1
Forested wetland 5.5 0.5
Mixed forest 13.4 0.1
Other 7.9 9.9
7
generally exceeded the contribution of sediments from the tributaries, but there were three exceptions to this general behavior, all of which occurred in the 1997 water year. The month of February 1997 was marked by an extremely large sediment load from the tributaries. The months of March and June 1997 were also months of high tributary sediment loading. These same months (February, March, and June 1997) also showed larger than usual tributary contributions to the water load. Suspended sediment discharged from Pool 13 generally followed the same patterns as input sediment loads and water discharge.
The pattern of sediment storage and export in Pool 13 is more clearly illustrated by examining the net flux (input minus output) behavior in terms of metric tons per day and the net flux expressed as a percentage of the input (Figure 4; upper and
lower, respectively). A value of zero for the net flux indicates that the inputs (Mississippi River, four gaged tributaries, and the ungaged estimate) and the downstream output are in balance (i.e., as much is leaving as is entering). A positive value for the net flux means that inputs exceed the output and the pool is trapping or storing sediment. A negative net flux occurs when output exceeds inputs, which then implies that the pool is actually mobilizing previously stored sediment and exporting it from the system. Pool 13 exported sediment (output is greater than input) during the major high flow, high load months of the year during all 3 yrs of the study. The periods of peak discharge and peak loads (April and May in all years) all have negative values for net flux. During these months, the pool exports from 125% to 175% of the suspended sediment input. In the
Figure 3. Pool 13 monthly water (left) and suspended sediment budgets (right) for the 1995 (upper), 1996 (middle), and 1997 (lower) water years. “I” refers to input to Pool 13 and “O” refers to outputs.
1995
1996
1997
1995
1996
1997
I O I O I O I O I O I O I O I O I O I O I O I O
I O I O I O I O I O I O I O I O I O I O I O I O
I O I O I O I O I O I O I O I O I O I O I O I O
I O I O I O I O I O I O I O I O I O I O I O I O
I O I O I O I O I O I O I O I O I O I O I O I O
I O I O I O I O I O I O I O I O I O I O I O I O
500045004000350030002500200015001000
5000
500045004000350030002500200015001000
5000
500045004000350030002500200015001000
5000
100000
80000
60000
40000
20000
0
100000
80000
60000
40000
20000
0
100000
80000
60000
40000
20000
0
OCT NOV DEC JAN FEB MAR APR MAY JUN JUL AUG SEP
OCT NOV DEC JAN FEB MAR APR MAY JUN JUL AUG SEP
OCT NOV DEC JAN FEB MAR APR MAY JUN JUL AUG SEP OCT NOV DEC JAN FEB MAR APR MAY JUN JUL AUG SEP
OCT NOV DEC JAN FEB MAR APR MAY JUN JUL AUG SEP
OCT NOV DEC JAN FEB MAR APR MAY JUN JUL AUG SEP
Month Month
Mea
n da
ily d
isch
arge
, m3 /s
ec
Susp
ende
d se
dim
ent l
oad,
met
ric to
ns/d
ay
Source Mainstem Tributary Ungaged

8
remaining months of the year, Pool 13 traps from a few to as much as 90% of the input sediment load.
La Grange Pool
The drainage area of La Grange Pool is almost evenly split between the area drained by the Illinois River and the “local” drainage (area between the upstream and downstream ends of the pool). The Illinois River drains 55% of the pool’s total drainage area and the remaining 45% (34% gaged tributaries and 11% ungaged) is local or direct. This implies that the water and sediment budgets for La Grange Pool will be much more influenced by local conditions (storms, land use patterns, etc.) than a pool where the mainstem might account for most (> 90%) of the input of water and sediment.
The 1995 water year was considerably wetter than the long-term (1939–97) average (Figure 5, upper) but the 1996 and 1997 water years were
Figure 4. Pool 13 suspended sediment balance (sum of inputs minus output) expressed as (A) the metric tons per day of sediment storage (positive values, inputs exceed output) and export (negative values, outputs exceed inputs) and (B) the percentage of the input sediment load that is stored or exported.
A
B
O D F A J A O D F A J A O D F A J A C E E P U U C E E P U U C E E P U UT C B R N G T C B R N G T C B R N G 9 9 9 9 9 9 9 9 9 9 9 9 9 9 9 9 9 94 4 5 5 5 5 5 5 6 6 6 6 6 6 7 7 7 7
Month and year
O D F A J A O D F A J A O D F A J A C E E P U U C E E P U U C E E P U UT C B R N G T C B R N G T C B R N G 9 9 9 9 9 9 9 9 9 9 9 9 9 9 9 9 9 94 4 5 5 5 5 5 5 6 6 6 6 6 6 7 7 7 7
Month and year
75000
60000
45000
30000
15000
0
-15000
100
50
0
-50
-100
-150
-200
-250
-300
Susp
ende
d se
dim
ents
, met
ric to
ns/d
ayPe
rcen
t of I
nput
1993
POR
1,400
1,200
1,000
800
600
400
200
0
17,00016,00015,00014,00013,00012,00011,00010,000
9,0008,0007,0006,0005,0004,0003,0002,0001,000
0
Input Output Input Output Input Output
Input Output Input Output Input Output
1995 1996 1997Water year
1995 1996 1997Water year
Susp
ende
d se
dim
ent l
oad,
met
ric to
ns/d
ayM
ean
daily
dis
char
ge, m
3 /sec
Source Mainstem Tributary Ungaged
very close to normal. Discharge in 1995 was almost 130% of the mean daily discharge for the period of record. The Illinois River contributes the majority of the water input (58% in 1995, 66% in 1996, and 72% in 1997) to La Grange Pool.
Ungaged contributions to the La Grange Pool water budget were estimated in the same manner described above for Pool 13. Generating ungaged estimates in the above manner results in a water budget that is in balance (input equals output) for all water years. There is less than a 1% difference between water input and water output for the 3 yrs studied. Again, these results for the water budget suggest that the sampling design and sample
Figure 5. Annual water budgets (upper) and annual suspended sediment budgets (lower) for La Grange Pool. Horizontal reference lines indicate mean daily discharge at the downstream end of the La Grange Pool study area for the period of record (POR 1938–1997) and for the 1993 flood (1993).

9
allocation should also provide adequate estimates for the suspended sediment budget.
La Grange Pool annually exported between 10,000 and 14,000 t of suspended sediment on a daily basis during the 1995–97 water years (Figure 5, lower). In all years, the Illinois River above La Grange Pool accounted for less than 50% of the suspended sediment load to the pool (19% in 1995, 25% in 1996, and 45% in 1997). The gaged tributaries accounted for only 34% of the total drainage area, but they account for a much greater portion of the sediment load (61% in 1995, 56% in 1996, and 41% in 1997). These loads are from 1.2 to 2 times higher than would be expected based solely on these tributaries’ contribution to the overall drainage area or water input. This greater than expected contribution from the gaged tributaries implies that the local watershed has a greater sediment delivery per unit area than the drainage area above the pool.
The same assumptions used to estimate the contribution of water from the ungaged areas were used to estimate the contribution of these areas to the suspended sediment load. Ungaged loads were estimated to be 34% of the sediment contribution from the gaged tributaries because the ungaged drainage area was approximately 34% of the gaged tributary drainage area.
The wet year of 1995 is associated with considerable sediment trapping (input greater than output) whereas the water years of 1996 and 1997 seem to be in balance (less than a 5% difference between input and output; Figure 5, lower). These data suggest that La Grange Pool traps sediment during flood years but is nearly in balance in more hydrologically normal years.
The Illinois River and the gaged tributaries to La Grange Pool exhibited annual patterns of water discharge and suspended sediment loads that were different from those observed in Pool 13. In the 1995 and 1996 water years, discharges were at their lowest in the late summer–early fall (September and October), slowly rose to their peak in the late spring–early summer (May and June), and then slowly fell to the fall minimum (Figure 6, upper and middle left). The 1997 water
year exhibited a late winter–early spring (February and March) peak discharge with only a slight increase in flows in June (Figure 6, lower left). During all periods of peak discharge, the tributary and the estimated ungaged contributions make up a large proportion of the total water load to La Grange Pool. In May of 1995 and 1996, these contributions exceed those of the Illinois River. Suspended sediment loads followed the same general pattern through the year (Figure 6; upper, middle, and lower right) as water discharge. Sediment loads from the tributaries and the estimated ungaged loads generally exceeded the contribution of sediments from the Illinois River. Illinois River loads were greater than these other sources during those periods when both discharges and loads were relatively small (late summer through early winter). Suspended sediment discharged from La Grange Pool generally followed the same patterns as input sediment loads and water discharge, but during the periods of high tributary loading (May in 1995 and 1996; February in 1997) the sediment export peaks were much smaller in magnitude than the input peaks.
The pattern of sediment storage and export in La Grange Pool is clarified by examining the net flux (input - output) behavior in terms of metric tons per day and the net flux expressed as a percentage of the input (Figure 7; upper and lower, respectively). La Grange Pool stored sediment (inputs greater than output) during the major high flow, high load months of the year during all 3 yrs of the study. The periods of peak discharge and peak loads (May in 1995 and 1996; February in 1997) all have positive values for net flux. During these months, the pool stores from 25% to 75% of the suspended sediment input. The height, or relative magnitude of the storage events exceeds the sum of all the negative events, which implies that La Grange Pool is, on the whole, trapping sediments over the course of a year. On the other hand, on a temporal basis, the pool is most often mobilizing and exporting sediments (negative net flux periods) and it is only during the few large loading periods that tip the scale toward net sediment storage.

10
Comparison of Pool 13 and La Grange Pool
Pool 13 and La Grange Pool sit on vastly different rivers, have different hydrological settings with respect to those rivers, and have very different watersheds. The relative influence of the mainstem river (the Mississippi or Illinois River) is the first distinction between these two pools. In Pool 13, the Mississippi River dominates both the hydrology of the pool and the sediment loading. In La Grange Pool, however, the Illinois River is a major contributor of both water and sediment but it does not dominate the budget. The Mississippi River at Pool 13 is a much larger river in terms of land area drained and average flow than the Illinois River at La Grange Pool. The Mississippi River at Pool 13 drains over three times the land area than does the Illinois River
at La Grange Pool. For the period of record, the mean daily flow in the Mississippi River is twice that in the Illinois River. The second distinction lies in the differences in sediment delivery by these rivers. Whereas the Mississippi River drains more land and has greater flows, its sediment supply to Pool 13 is considerably less than what the Illinois River supplies to La Grange Pool. The sediment export rate (calculated on an areal basis) for the watershed above Pool 13 is less than one-fourth the rate observed for the La Grange Pool watershed. The difference in sediment export rates are understandable given that the La Grange Pool watershed sits in one of the most fertile agricultural basins in the world; in contrast, much of the Pool 13 watershed is dominated by second-growth hardwood and coniferous forest (Table 5).
Figure 6. La Grange Pool monthly water (left) and suspended sediment budgets (right) for the 1995 (upper), 1996 (middle), and 1997 (lower) water years. “I” refers to input to La Grange Pool and “O” refers to outputs.
500045004000350030002500200015001000
5000
500045004000350030002500200015001000
5000
500045004000350030002500200015001000
5000
1995
1996
1997
1995
1996
1997
100000
80000
60000
40000
20000
0
100000
80000
60000
40000
20000
0
100000
80000
60000
40000
20000
0
I O I O I O I O I O I O I O I O I O I O I O I O
I O I O I O I O I O I O I O I O I O I O I O I O
I O I O I O I O I O I O I O I O I O I O I O I O
I O I O I O I O I O I O I O I O I O I O I O I O
I O I O I O I O I O I O I O I O I O I O I O I O
I O I O I O I O I O I O I O I O I O I O I O I O
Mea
n da
ily d
isch
arge
, m3 /s
ec
Susp
ende
d se
dim
ent l
oad,
met
ric to
ns/d
ay
Month Month
Source Mainstem Tributary Ungaged
OCT NOV DEC JAN FEB MAR APR MAY JUN JUL AUG SEP
OCT NOV DEC JAN FEB MAR APR MAY JUN JUL AUG SEP
OCT NOV DEC JAN FEB MAR APR MAY JUN JUL AUG SEP OCT NOV DEC JAN FEB MAR APR MAY JUN JUL AUG SEP
OCT NOV DEC JAN FEB MAR APR MAY JUN JUL AUG SEP
OCT NOV DEC JAN FEB MAR APR MAY JUN JUL AUG SEP

11
The most striking difference between these pools is the manner in which they store and export suspended sediments. Pool 13 exported sediments during high flow-high load periods and stored them during the remainder of the year while La Grange Pool exhibited the opposite. In La Grange Pool, sediments are trapped during high flow-high load periods of the year and exported the rest of the time. The explanation for this striking difference in behavior may lie in the considerable difference between the morphometries of these two pools. Pool 13 can be characterized as having a very riverine section for approximately 24 km; a transition zone, which is a more braided channel area, for the next 21 km; and a wide, open, and relatively shallow (1.0–1.5 m, other than the main channel) impounded area for the remaining 10.5 km. In contrast, La Grange Pool is essentially riverine for its entire length (124.7 km) and has an extensive levee system.
In Pool 13, the open area, sufficiently shallow to allow wind-generated waves to resuspend sediment and be subject to advective currents, may allow for the net export of suspended sediments during high flow-high load periods of the year. Periods of high flow will be associated with relatively higher current velocities both in the main channel and across the impounded area (Hendrickson, personal communication). The spring high-flow period is also associated with the passage of relatively frequent weather fronts that lead to the higher water inputs and may generate wind conditions that act to resuspend previously deposited sediments in the impounded area. The combination of resuspension and higher advective current velocities may be acting to allow the net export of suspended sediments. During the remainder of the year, when flows are lower, current velocities are reduced across the impounded area. Lower current velocities should result in less sediment being transported out of the system and could result in the net trapping of sediments.
In La Grange Pool, during high flow-high load periods of the year, the river may spread out onto what floodplain is still accessible (inside the levees) and allow material to settle out of suspension, thereby trapping sediments during these periods. During the remainder of the year when flows are lower in magnitude, the river may act as a more efficient conduit (flow and suspended sediment remain in the channel) for water and suspended material and result in a net export of suspended sediment.
Conclusion
The present study of the suspended sediment budgets of two navigation pools indicates that even more than 60 yrs after the construction of locks and dams to regulate these two rivers, these pools are still strikingly dynamic in the manner in which they process suspended sediments. Rather than being simple sediment sinks, net sediment exporters, or in some sort of equilibrium with their sediment loads, these pools exhibit all of these conditions over the course of a given year.
O D F A J A O D F A J A O D F A J A C E E P U U C E E P U U C E E P U UT C B R N G T C B R N G T C B R N G 9 9 9 9 9 9 9 9 9 9 9 9 9 9 9 9 9 94 4 5 5 5 5 5 5 6 6 6 6 6 6 7 7 7 7
Month and year
75000
60000
45000
30000
15000
0
-15000Susp
ende
d se
dim
ents
, met
ric to
ns/d
ay
O D F A J A O D F A J A O D F A J A C E E P U U C E E P U U C E E P U UT C B R N G T C B R N G T C B R N G 9 9 9 9 9 9 9 9 9 9 9 9 9 9 9 9 9 94 4 5 5 5 5 5 5 6 6 6 6 6 6 7 7 7 7
Month and year
100
50
0
-50
-100
-150
-200
-250
-300
Perc
ent o
f Inp
ut
A
B
Figure 7. La Grange Pool suspended sediment balance (sum of inputs minus output) expressed as: (A) the metric tons per day of sediment storage (positive values, inputs exceed output) and export (negative values, outputs exceed inputs); (B) the percentage of the input sediment load that is stored or exported.

12
Not only does the mode of processing suspended sediments change in response to changes in hydrology, but the processes are completely different between the two pools.
Acknowledgments
This study was a cooperative effort between the U.S. Geological Survey Biological Division’s Upper Midwest Environmental Sciences Center, the U. S. Geological Survey Water Resources Division’s Water Districts of Wisconsin, Illinois, and Iowa, and the States of Wisconsin, Illinois, and Iowa.
References
Buchanon, T. J. and W. P. Somers. 1969. Discharge measurements at gaging stations. USGS Techniques of Water Resources Investigations Book 3, Chapter A8. 65 pp.
Demissie, M., R. Xia, L. Keefer, and N. G. Bhowmik. 2003. Sediment budget of the Illinois River. International Journal of Sediment Research 18(2):305–313.
Fremling, C. R. and T. O. Claflin. 1984. Ecological history of the Upper Mississippi River. In J. G. Wiener, R. A. Anderson, and D. R. McConville, editors. Contaminants in the Upper Mississippi River, Proceedings of the 15th Annual Meeting of the Mississippi River Research Consortium.
Gaugush, R. F. and D. B. Wilcox. 1994. Planning document: Investigate sediment transport/deposition and predict future configuration of UMRS channels and floodplain. National Biological Survey, Environmental Management Technical Center, Onalaska, Wisconsin, December 1994. LTRMP 94-P004. 9 pp. + Appendixes A–E.
Great River Environmental Action Team. 1980. GREAT I Study of the Upper Mississippi River, Volume 4, Technical Appendix F: Water Quality, Technical Appendix F: Sediment and Erosion. Great River Environmental Action Team, St. Paul, Minnesota.
Guy, H. P. and V. W. Norman. 1982. Field methods for measurement of fluvial sediment. USGS Techniques of Water Resources Investigations Book 3, Chapter C2. 59 pp.
Knox, J. C. 2000. Chapter 5. Geomorphic analysis. Pages 42–150 in J. B. Bradley, editor. Final report: Upper Mississippi River and Illinois Waterway Cumulative Effects Study, Volume 1: Geomorphic Assessment.
May, J. E., J. G. Gorman, R. D. Goodrich, M. W. Bobber, and V. E. Miller. 1996. Water resources data, Iowa, water year 1995. U.S. Geological Survey, Water Resources Division, Iowa City, Iowa. USGS-WRD-IA-95-1.
May, J. E., J. G. Gorman, R. D. Goodrich, M. W. Bobber, and V. E. Miller. 1997. Water resources data, Iowa, water year 1996. U.S. Geological Survey, Water Resources Division, Iowa City, Iowa. USGS-WRD-IA-96-1.
May, J. E., J. G. Gorman, R. D. Goodrich, M. W. Bobber, and V. E. Miller. 1998. Water resources data, Iowa, water year 1998. U.S. Geological Survey, Water Resources Division, Iowa City, Iowa. USGS-WRD-IA-97-1.
Nakato, T. 2000. Chapter 6. Sediment budget. Pages 151–172 in J. B. Bradley, editor. Final report: Upper Mississippi River and Illinois Waterway Cumulative Effects Study, Volume 1: Geomorphic Assessment.
Sparks, R. E. 1984. The role of contaminants in the decline of the Illinois River: Implications for the Upper Mississippi. Pages 25–66 in J. G. Wiener, R. A. Anderson, and D. R. McConville, editors. Contaminants in the Upper Mississippi River, Proceedings of the 15th Annual Meeting of the Mississippi River Research Consortium.
U.S. Army Corps of Engineers, Rock Island District. 1980. Upper Mississippi River Basin, Mississippi River Basin, Nine Foot Channel Navigation Project, Reservoir Regulation Manual, Appendix 13, Lock and Dam 13.
U.S. Army Corps of Engineers, Rock Island District. 1986. Upper Mississippi River Basin,

13
Illinois Waterway, Nine Foot Channel Navigation Project, Reservoir Regulation Manual, Appendix 7, La Grange Lock and Dam.
U.S. Fish and Wildlife Service. 1992. Operating plan for the Upper Mississippi River System Long Term Resource Monitoring Program. Environmental Management Technical Center, Onalaska, Wisconsin. Revised September 1993. EMTC 91-P002. 179 pp. (NTIS PB94-160199).
Wicker, T. L., J. K. LaTour, and J. C. Miller. 1996. Water resources data—Illinois, water year 1995. Volume 2. Illinois River Basin. U.S. Geological Survey, Water Resource Division, Urbana, Illinois. USGS-WRD-IL-95-2.
Wicker, T. L., J. K. LaTour, and J. C. Miller. 1997. Water resources data—Illinois, water year 1996. Volume 2. Illinois River Basin. U.S. Geological Survey, Water Resource Division, Urbana, Illinois. USGS-WRD-IL-96-2.
Wicker, T. L., J. K. LaTour, and J. C. Maurer. 1998. Water resources data—Illinois, water year 1997. Volume 2. Illinois River Basin. U.S. Geological Survey, Water Resource Division, Urbana, Illinois. USGS-WRD-IL-97-2.
A-1
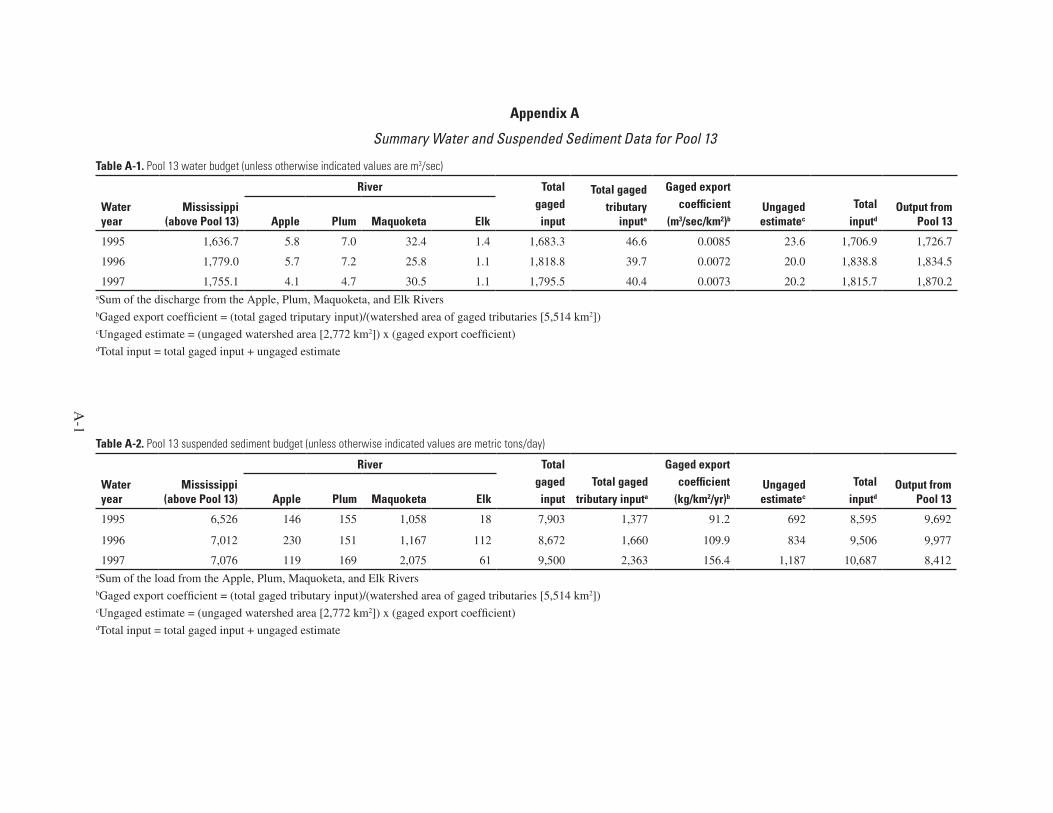
Appendix A
Summary Water and Suspended Sediment Data for Pool 13
Table A-1. Pool 13 water budget (unless otherwise indicated values are m3/sec)
Water year
Mississippi (above Pool 13)
River Total gaged
input
Total gagedtributary
inputa
Gaged exportcoefficient
(m3/sec/km2)bUngaged estimatec
Total inputd
Output from Pool 13Apple Plum Maquoketa Elk
1995 1,636.7 5.8 7.0 32.4 1.4 1,683.3 46.6 0.0085 23.6 1,706.9 1,726.7
1996 1,779.0 5.7 7.2 25.8 1.1 1,818.8 39.7 0.0072 20.0 1,838.8 1,834.5
1997 1,755.1 4.1 4.7 30.5 1.1 1,795.5 40.4 0.0073 20.2 1,815.7 1,870.2aSum of the discharge from the Apple, Plum, Maquoketa, and Elk Rivers bGaged export coefficient = (total gaged triputary input)/(watershed area of gaged tributaries [5,514 km2])cUngaged estimate = (ungaged watershed area [2,772 km2]) x (gaged export coefficient)dTotal input = total gaged input + ungaged estimate
Table A-2. Pool 13 suspended sediment budget (unless otherwise indicated values are metric tons/day)
Water year
Mississippi (above Pool 13)
River Total gaged
inputTotal gaged
tributary inputa
Gaged exportcoefficient
(kg/km2/yr)bUngaged estimatec
Total inputd
Output from Pool 13Apple Plum Maquoketa Elk
1995 6,526 146 155 1,058 18 7,903 1,377 91.2 692 8,595 9,692
1996 7,012 230 151 1,167 112 8,672 1,660 109.9 834 9,506 9,977
1997 7,076 119 169 2,075 61 9,500 2,363 156.4 1,187 10,687 8,412aSum of the load from the Apple, Plum, Maquoketa, and Elk RiversbGaged export coefficient = (total gaged tributary input)/(watershed area of gaged tributaries [5,514 km2])cUngaged estimate = (ungaged watershed area [2,772 km2]) x (gaged export coefficient)dTotal input = total gaged input + ungaged estimate

B-1
Appendix B
Summary Water and Suspended Sediment Data for La Grange Pool
Table B-2. La Grange Pool suspended sediment budget (unless otherwise indicated values are metric tons/day)
Water year
Illinois (above La Grange Pool)
River Total gaged input
Total gagedtributary
inputa
Gaged exportcoefficient
(kg/km2/yr)bUngaged estimatec
Total inputd
Output from La Grange PoolLamoine Mackinaw Sangamon Spoon
1995 3,017 1,761 1,536 3,061 3,438 12,813 9,796 151.8 3,299 16,112 13,819
1996 3,522 1,982 752 2,625 2,551 11,432 7,910 122.6 2,664 14,096 13,390
1997 4,685 901 364 1,266 1,792 9,008 4,323 67.0 1,456 10,464 10,178
aSum of the load from the Lamoine, Mackinaw, Sangamon, and Spoon Rivers bGaged export coefficient = (total gaged triputary input)/(watershed area of gaged tributaries [23,555 km2])cUngaged estimate = (ungaged watershed area [7,932 km2]) x (gaged export coefficient)dTotal input = total gaged input + ungaged estimate
Table B-1. La Grange Pool water budget (unless otherwise indicated values are m3/sec)
Water year
Illinois (above La Grange Pool)
River Total gaged input
Total gagedtributary
inputa
Gaged exportcoefficient
(m3/sec/km2)bUngaged estimatec
Total inputd
Output from La Grange PoolLamoine Mackinaw Sangamon Spoon
1995 482.4 43.8 30.5 132.6 49.7 739.0 256.5 0.0109 86.5 825.5 832.9
1996 409.2 30.6 11.8 87.9 28.8 568.3 159.1 0.0068 53.9 622.2 623.3
1997 439.7 20.4 12.0 61.6 29.3 563.0 123.3 0.0052 41.2 604.2 610.4
aSum of the discharge from the Lamoine, Mackinaw, Sangamon, and Spoon Rivers bGaged export coefficient = (total gaged triputary input)/(watershed area of gaged tributaries [23,555 km2])cUngaged estimate = (ungaged watershed area [7,932 km2]) x (gaged export coefficient)dTotal input = total gaged input + ungaged estimate
C-1
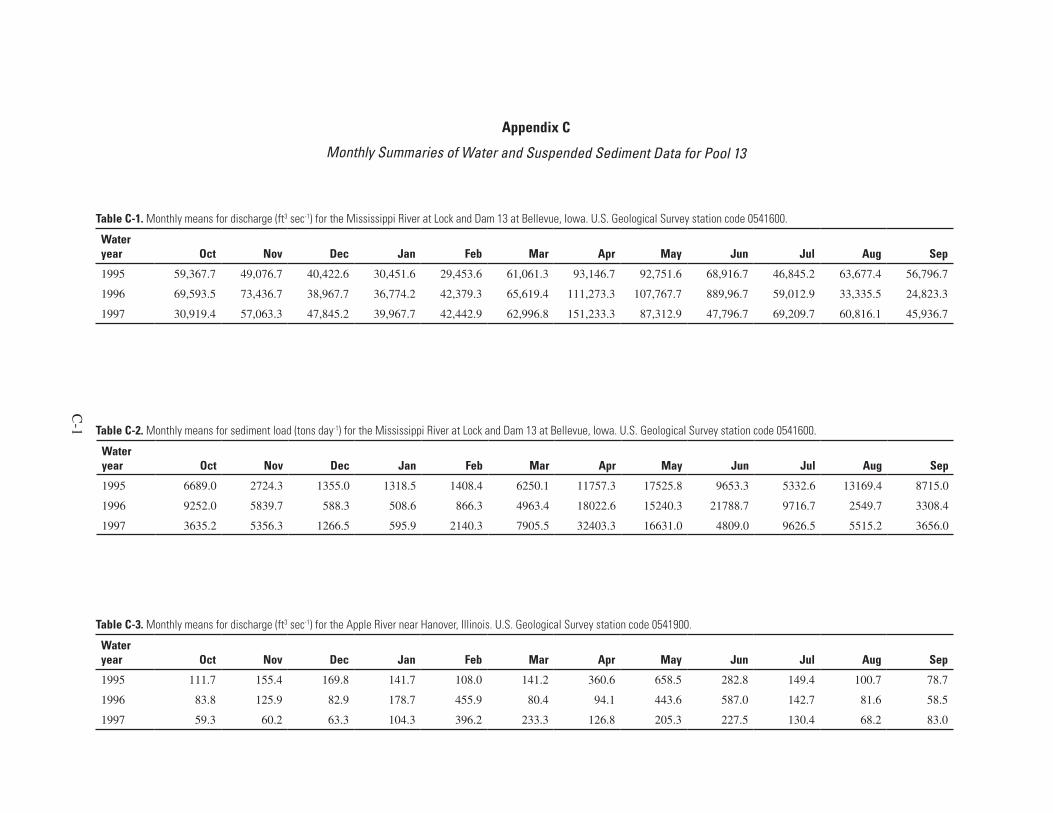
Appendix C
Monthly Summaries of Water and Suspended Sediment Data for Pool 13
Table C-1. Monthly means for discharge (ft3 sec-1) for the Mississippi River at Lock and Dam 13 at Bellevue, Iowa. U.S. Geological Survey station code 0541600.
Water year Oct Nov Dec Jan Feb Mar Apr May Jun Jul Aug Sep
1995 59,367.7 49,076.7 40,422.6 30,451.6 29,453.6 61,061.3 93,146.7 92,751.6 68,916.7 46,845.2 63,677.4 56,796.7
1996 69,593.5 73,436.7 38,967.7 36,774.2 42,379.3 65,619.4 111,273.3 107,767.7 889,96.7 59,012.9 33,335.5 24,823.3
1997 30,919.4 57,063.3 47,845.2 39,967.7 42,442.9 62,996.8 151,233.3 87,312.9 47,796.7 69,209.7 60,816.1 45,936.7
Table C-2. Monthly means for sediment load (tons day-1) for the Mississippi River at Lock and Dam 13 at Bellevue, Iowa. U.S. Geological Survey station code 0541600.
Water year Oct Nov Dec Jan Feb Mar Apr May Jun Jul Aug Sep
1995 6689.0 2724.3 1355.0 1318.5 1408.4 6250.1 11757.3 17525.8 9653.3 5332.6 13169.4 8715.0
1996 9252.0 5839.7 588.3 508.6 866.3 4963.4 18022.6 15240.3 21788.7 9716.7 2549.7 3308.4
1997 3635.2 5356.3 1266.5 595.9 2140.3 7905.5 32403.3 16631.0 4809.0 9626.5 5515.2 3656.0
Table C-3. Monthly means for discharge (ft3 sec-1) for the Apple River near Hanover, Illinois. U.S. Geological Survey station code 0541900.
Water year Oct Nov Dec Jan Feb Mar Apr May Jun Jul Aug Sep
1995 111.7 155.4 169.8 141.7 108.0 141.2 360.6 658.5 282.8 149.4 100.7 78.7
1996 83.8 125.9 82.9 178.7 455.9 80.4 94.1 443.6 587.0 142.7 81.6 58.5
1997 59.3 60.2 63.3 104.3 396.2 233.3 126.8 205.3 227.5 130.4 68.2 83.0

C-2
Table C-4. Monthly means for sediment load (tons day-1) for the Apple River near Hanover, Illinois. U.S. Geological Survey station code 0541900.
Water year Oct Nov Dec Jan Feb Mar Apr May Jun Jul Aug Sep
1995 15.7 28.6 11.8 11.9 4.8 10.6 103.5 1596.4 72.8 22.4 11.5 10.4
1996 14.3 10.2 2.4 27.5 756.7 8.2 13.2 1393.1 782.9 31.4 13.1 5.6
1997 5.5 5.3 2.9 6.0 837.6 385.8 14.9 28.1 298.8 42.6 4.6 3.7
Table C-5. Monthly means for discharge (ft3 sec-1) for the Elk River near Altmont, Iowa. U.S. Geological Survey station code 05420300.
Water year Oct Nov Dec Jan Feb Mar Apr May Jun Jul Aug Sep
1995 20.2 35.9 34.8 27.6 34.5 40.0 84.4 121.6 53.7 55.3 41.3 22.7
1996 20.1 26.2 16.6 16.8 24.3 14.5 17.6 143.7 94.1 36.1 28.0 18.7
1997 29.7 21.2 24.3 23.8 178. 8 42.5 31.9 39.8 31.2 23.9 16.3 13.3
Table C-6. Monthly means for sediment load (tons day-1) for the Elk River near Altmont, Iowa. U.S. Geological Survey station code 05420300.
Water year Oct Nov Dec Jan Feb Mar Apr May Jun Jul Aug Sep
1995 0.6 20.3 1.3 1.3 2.9 1.8 68.5 102.2 6.1 5.1 23.7 3.4
1996 1.2 3.0 1.0 3.4 26.3 0.5 0.5 1093. 5 327.4 5.5 1.9 0.5
1997 44.5 1.2 1.0 15.7 694.3 58.6 2.6 10.0 18.3 11.1 6.6 0.5

C-3
Table C-7. Monthly means for discharge (ft3 sec-1) for the Maquoketa River near Maquoketa, Iowa. U.S. Geological Survey station code 05418500.
Water year Oct Nov Dec Jan Feb Mar Apr May Jun Jul Aug Sep
1995 913.4 795.2 892.3 637.8 747.1 929.5 2046.5 2698.7 1699.0 969.8 874.0 517.3
1996 514.4 647.3 451.4 431.8 981.4 808.9 576.4 1826.6 2522.0 1080.2 607.1 466.9
1997 499.2 587.0 558.0 538.7 2721.1 1837.7 1020.3 1529.3 1808.7 891.6 542.7 529.8
Table C-8. Monthly means for sediment load (tons day-1) for the Maquoketa River near Maquoketa, Iowa. U.S. Geological Survey station code 05418500.
Water year Oct Nov Dec Jan Feb Mar Apr May Jun Jul Aug Sep
1995 255.5 288.4 258.4 102.0 174.7 520.3 2361.8 5494.9 1308.1 978.2 1897.2 245.1
1996 141.8 179.9 41.8 37.7 1519.1 467.3 142.4 4408.1 7552.3 625.3 265.7 121.9
1997 153.7 94.6 60.2 47.6 13985.4 4389.9 196.6 1183.6 7489.5 648.9 164.3 125.2
Table C-9. Monthly means for discharge (ft3 sec-1) for the Plum River at Savanna, Illinois. U.S. Geological Survey station code 05420100.
Water year Oct Nov Dec Jan Feb Mar Apr May Jun Jul Aug Sep
1995 92.1 192.5 179.7 197.3 151.0 151.6 422.8 863.8 343.4 169.1 122.0 81.6
1996 91.6 179.9 130.5 176.5 317.4 113.5 145.0 731.5 750.4 209.9 110.0 75.5
1997 81.2 82.6 71.1 88.5 658.3 332.5 133.4 189.9 166.5 90.2 61.7 74.1

C-4
Table C-12. Monthly means for sediment load (tons day-1) for the Mississippi River at Clinton, Iowa. U.S. Geological Survey station code 05420500.
Water year Oct Nov Dec Jan Feb Mar Apr May Jun Jul Aug Sep
1995 5847.7 3788.3 2506.1 877.0 663.5 8631.9 28520.0 38171.0 11847.7 5705.2 12478.7 8517.0
1996 5602.9 6552.8 316.5 379.4 239.7 8239.0 32808.0 34187.1 29060.0 9503.5 2706.1 2183.0
1997 5808.1 4543.3 1330.1 1097.1 3805.7 5955.5 43623.3 23251.0 5271.7 8224.2 5053.9 3420.0
Table C-11. Monthly means for discharge (ft3 sec-1) for the Mississippi River at Clinton, Iowa. U.S. Geological Survey station code 05420500.
Water year Oct Nov Dec Jan Feb Mar Apr May Jun Jul Aug Sep
1995 59464.5 52313.3 44693.5 36187.1 33210.7 61774.2 101706.7 103551.6 70260.0 51045.2 65061.3 50693.3
1996 73333.3 42051.6 36935.5 39817.2 61574.2 114783.3 125377.4 95753.3 61438.7 35951.6 24343.3 73333.3
1997 57226.7 46667.7 41774.2 49382.1 65722.6 175856.7 96429.0 52006.7 65951.6 60974.2 50206.7 57226.7
Table C-10. Monthly means for sediment load (tons day-1) for the Plum River at Savanna, Illinois. U.S. Geological Survey station code 05420100.
Water year Oct Nov Dec Jan Feb Mar Apr May Jun Jul Aug Sep
1995 11.0 64.7 51.4 49.6 23.7 20.0 437.4 1054.1 154.8 89.8 46.2 29.5
1996 23.5 45.2 21.2 65.4 103.4 34.0 30.1 1252.7 201.2 149.4 35.0 13.0
1997 28.2 25.9 8.8 15.6 1223.7 560.3 23.4 104.3 270.8 36.5 13.1 15.9
D-1
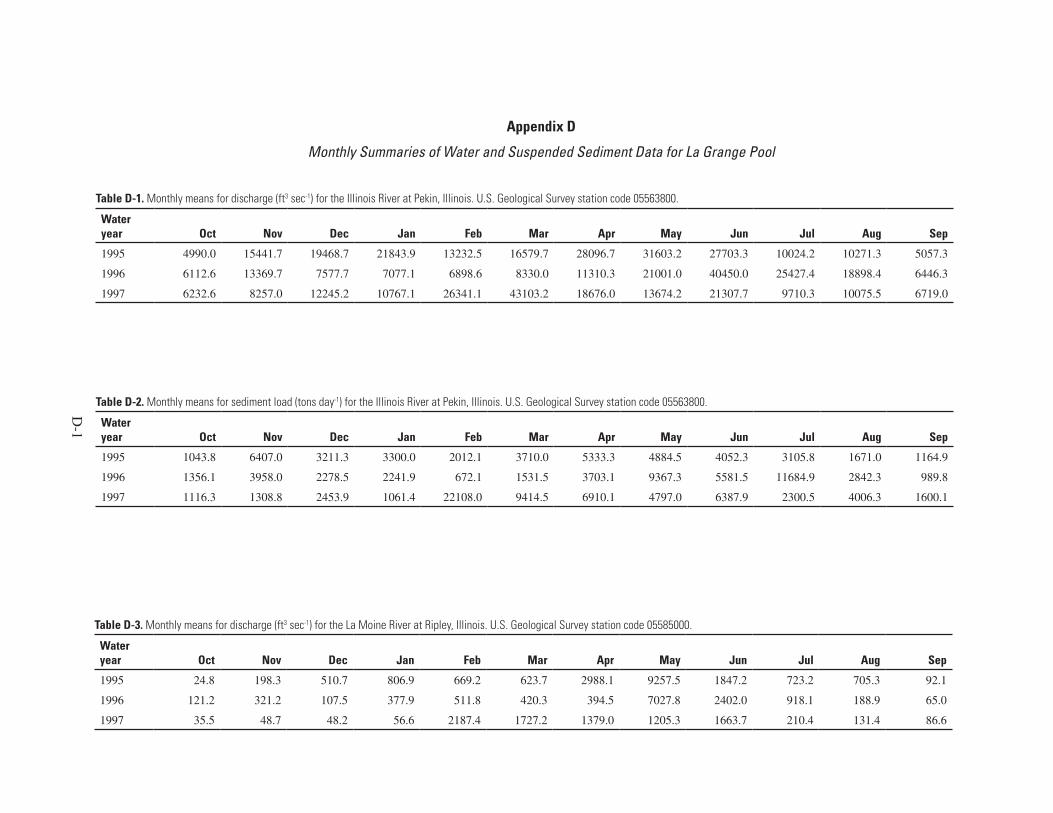
Appendix D
Monthly Summaries of Water and Suspended Sediment Data for La Grange Pool
Table D-1. Monthly means for discharge (ft3 sec-1) for the Illinois River at Pekin, Illinois. U.S. Geological Survey station code 05563800.
Water year Oct Nov Dec Jan Feb Mar Apr May Jun Jul Aug Sep
1995 4990.0 15441.7 19468.7 21843.9 13232.5 16579.7 28096.7 31603.2 27703.3 10024.2 10271.3 5057.3
1996 6112.6 13369.7 7577.7 7077.1 6898.6 8330.0 11310.3 21001.0 40450.0 25427.4 18898.4 6446.3
1997 6232.6 8257.0 12245.2 10767.1 26341.1 43103.2 18676.0 13674.2 21307.7 9710.3 10075.5 6719.0
Table D-2. Monthly means for sediment load (tons day-1) for the Illinois River at Pekin, Illinois. U.S. Geological Survey station code 05563800.
Water year Oct Nov Dec Jan Feb Mar Apr May Jun Jul Aug Sep
1995 1043.8 6407.0 3211.3 3300.0 2012.1 3710.0 5333.3 4884.5 4052.3 3105.8 1671.0 1164.9
1996 1356.1 3958.0 2278.5 2241.9 672.1 1531.5 3703.1 9367.3 5581.5 11684.9 2842.3 989.8
1997 1116.3 1308.8 2453.9 1061.4 22108.0 9414.5 6910.1 4797.0 6387.9 2300.5 4006.3 1600.1
Table D-3. Monthly means for discharge (ft3 sec-1) for the La Moine River at Ripley, Illinois. U.S. Geological Survey station code 05585000.
Water year Oct Nov Dec Jan Feb Mar Apr May Jun Jul Aug Sep
1995 24.8 198.3 510.7 806.9 669.2 623.7 2988.1 9257.5 1847.2 723.2 705.3 92.1
1996 121.2 321.2 107.5 377.9 511.8 420.3 394.5 7027.8 2402.0 918.1 188.9 65.0
1997 35.5 48.7 48.2 56.6 2187.4 1727.2 1379.0 1205.3 1663.7 210.4 131.4 86.6

D-2
Table D-4. Monthly means for sediment load (tons day-1) for the La Moine River at Ripley, Illinois. U.S. Geological Survey station code 05585000.
Water year Oct Nov Dec Jan Feb Mar Apr May Jun Jul Aug Sep
1995 4.1 65.7 740.0 1091.7 769.2 280.0 4843.8 11518.0 2300.1 495.0 1013.2 38.8
1996 66.2 157.7 14.3 179.0 443.5 137.5 211.0 20613.4 3110.4 875.1 44.0 14.7
1997 3.6 3.7 2.5 8.3 4112.5 1704.9 1287.1 1621.7 3256.4 99.3 105.3 28.6
Table D-5. Monthly means for discharge (ft3 sec-1) for the Mackinaw River near Green Valley, Illinois. U.S. Geological Survey station code 05568500.
Water year Oct Nov Dec Jan Feb Mar Apr May Jun Jul Aug Sep
1995 50.2 119.4 446.1 1208.9 359.9 909.3 2379.8 5494.7 1169.0 405.2 203.0 82.6
1996 73.6 201.1 102.4 150.0 108.2 185.5 254.9 2084.4 1350.9 262.9 126.7 58.1
1997 49.0 60.4 88.4 148.9 1390.3 1413.9 755.1 370.5 468.5 152.5 172.9 101.4
Table D-6. Monthly means for sediment load (tons day-1) for the Mackinaw River near Green Valley, Illinois. U.S. Geological Survey station code 05568500.
Water year Oct Nov Dec Jan Feb Mar Apr May Jun Jul Aug Sep
1995 4.0 11.2 152.9 1228.4 30.5 595.3 5249.1 11722.0 873.5 211.2 47.3 16.3
1996 18.2 32.1 13.3 27.1 14.8 24.7 51.1 8362.5 1131.1 81.8 30.3 10.4
1997 4.1 7.9 8.0 19.9 3388.7 1108.7 191.8 51.7 207.5 38.6 28.4 16.0

D-3
Table D-7. Monthly means for discharge (ft3 sec-1) for the Sangamon River near Oakford, Illinois. U.S. Geological Survey station code 05583000.
Water year Oct Nov Dec Jan Feb Mar Apr May Jun Jul Aug Sep
1995 389.3 974.9 1937.6 5913.9 2711.1 5951.0 4799.3 20541.6 8033.3 2290.3 1814.0 511.1
1996 437.9 700.8 606.0 1036.9 843.9 1575.8 2272.3 17811.3 9188.3 1475.8 677.3 384.1
1997 323.6 406.8 438.3 931.1 3883.9 8208.1 2383.7 2444.8 4300.7 1515.6 688.5 702.3
Table D-8. Monthly means for sediment load (tons day-1) for the Sangamon River near Oakford, Illinois. U.S. Geological Survey station code 05583000.
Water year Oct Nov Dec Jan Feb Mar Apr May Jun Jul Aug Sep
1995 40.4 98.4 510.4 4709.3 448.9 4291.4 2627.2 21172.2 3896.2 1391.2 716.4 81.0
1996 67.8 145.6 28.7 244.6 113.6 451.0 1385.9 25246.6 5933.6 510.7 135.6 51.8
1997 16.3 9.4 5.8 97.8 4727.7 5879.7 589.4 1265.5 3172.6 806.9 227.9 224.0
Table D-9. Monthly means for discharge (ft3 sec-1) for the Spoon River at Seville, Illinois. U.S. Geological Survey station code 05570000.
Water year Oct Nov Dec Jan Feb Mar Apr May Jun Jul Aug Sep
1995 56.4 725.1 1138.5 978.5 1072.5 1097.9 3136.8 8015.5 2548.3 1477.5 591.1 148.9
1996 161.6 457.9 246.7 373.6 520.5 405.7 371.1 4214.3 3936.7 1058.3 303.1 100.5
1997 92.4 144.9 131.0 170.4 4231.6 2554.0 1548.4 908.7 1117.7 348.4 802.6 668.2

D-4
Table D-10. Monthly means for sediment load (tons day-1) for the Spoon River at Seville, Illinois. U.S. Geological Survey station code 05570000.
Water year Oct Nov Dec Jan Feb Mar Apr May Jun Jul Aug Sep
1995 8.8 622.8 1254.8 751.6 719.0 572.8 8192.9 24984.4 3357.3 3958.6 638.5 26.7
1996 66.4 195.4 97.1 103.6 202.3 180.7 164.9 18705.2 9545.0 4006.3 144.9 29.3
1997 12.2 23.0 10.1 30.8 14240.7 4326.4 1285.9 401.4 1828.3 237.3 1572.5 797.5
Table D-11. Monthly means for discharge (ft3 sec-1) for the Illinois River at Valley City, Illinois. U.S. Geological Survey station code 05586100.
Water year Oct Nov Dec Jan Feb Mar Apr May Jun Jul Aug Sep
1995 5743.2 17847.3 25925.8 29041.9 25167.9 28283.9 39610.0 69683.9 68616.7 19912.9 15992.9 7209.7
1996 7301.3 15500.0 8478.4 9311.0 9459.0 11991.0 14570.3 50274.2 69130.0 31719.4 26783.5 8698.0
1997 8632.6 10684.7 13184.5 12241.9 27975.0 67580.6 29200.0 19545.2 29403.3 17090.3 14063.9 9403.0
Table D-12. Monthly means for sediment load (tons day-1) for the Illinois River at Valley City, Illinois. U.S. Geological Survey station code 05586100.
Water year Oct Nov Dec Jan Feb Mar Apr May Jun Jul Aug Sep
1995 982.8 14240.7 16855.2 19617.7 6972.9 15143.9 28579.0 26898.7 23544.3 17379.7 10550.3 1448.7
1996 1464.3 11247.3 3167.8 3620.2 2342.9 5758.4 11751.9 73178.1 21651.7 27817.4 11772.5 1649.4
1997 1274.2 2138.9 4632.4 3379.5 40895.7 24109.2 15329.3 8282.2 23738.6 5828.0 6036.5 1794.1

REPORT DOCUMENTATION PAGE Form Approved
OMB No. 0704-0188Public reporting burden for this collection of information is estimated to average 1 hour per response, including the time for reviewing instructions, searching existing data sources, gathering and maintaining the data needed, and completing and reviewing the collection of information. Send comments regarding this burden estimate or any other aspect of this collection of information, including suggestions for reducing this burden, to Washington Headquarters Services, Directorate for Information Operations and Reports, 1215 Jefferson Davis Highway, Suite 1204, Arlington, VA 22202-4302, and to the Office of Management and Budget, Paperwork Reduction Project (0704-0188), Washington, D.C. 20503
1. AGENCY USE ONLY (Leave blank) 2. REPORT DATE
September 2004
3. REPORT TYPE AND DATES COVERED
4. TITLE AND SUBTITLE A suspended sediment budget for Pool 13 and La Grange Pool of the Upper Mississippi River
System
5. FUNDING NUMBERS
6. AUTHOR(S) Robert F. Gaugush
7. PERFORMING ORGANIZATION NAME AND ADDRESS
Upper Midwest Environmental Science Center, 2360 Fanta Reed Road, La Crosse, Wisconsin 54603
8. PERFORMING ORGANIZATION REPORT NUMBER
9. SPONSORING/MONITORING AGENCY NAME(S) AND ADDRESS(ES) U.S. Geological Survey Upper Midwest Environmental Sciences Center 2630 Fanta Reed Road La Crosse, Wisconsin, 54603
10. SPONSORING/MONITORING AGENCY REPORT NUMBER
2004-T00411. SUPPLEMENTARY NOTES
12a. DISTRIBUTION/AVAILABILITY STATEMENTRelease unlimited. Available from National Technical Information Service, 5285 Port Royal Road, Springfield, VA 22161 (1-800-553-6847 or 703-487-4650). Also available to registered users from the Defense Technical Information Center, Attn: Help Desk, 8725 Kingman Road, Suite 0944, Fort Belvoir, VA 22060-6218 (1-800-225-3842 or 703-767-9050).
12b. DISTRIBUTION CODE
13. ABSTRACT (Maximum 200 words) The suspended sediment budget for Pool 13 of the Mississippi River and La Grange Pool of the Illinois River was examined over a 3-yr period (October 1995 through September 1997). Pool 13 output was betwee by those delivered by the Mississippi River (76%, 74%, and 66% in the 1995, 1996, and 1997 water years, respectively). Pool 13 exhibited sediment export (output greater than input) in 1995, a balance in 1996, and marked sediment trapping (output less than input) in 1997. Within the three study years, Pool 13 received its highest water and sediment loads during spring (March through May) and this period was marked by sediment export. Suspended sediment loads were trapped during the remainder of the year. La Grange Pool output was between 3.71 and 5.04 million t of suspended sediment annually during the 1995–97 water years. The Illinois River accounted for less than 50% of the suspended sediment load to the pool (19%, 25%, and 45% in the 1995, 1996, and 1997 water years, respectively. La Grange Pool exhibited considerable sediment trapping in 1995 whereas the 1996 and 1997 water years were much closer to a balance wherein output was within 5% of input. Generally, La Grange Pool received its largest water and sediment loads during the late spring–early summer period (April through June), but in 1997 the late winter loads predominated.
14. SUBJECT TERMS
La Grange, Mississippi River, Pool 13, river, sediment budget, sediment load
15. NUMBER OF PAGES
13 pp. + Appendixes A–D
16. PRICE CODE
17. SECURITY CLASSIFICATION OF REPORT
Unclassified
18. SECURITY CLASSIFICATION OF THIS PAGE
Unclassified
19. SECURITY CLASSIFICATION OF ABSTRACT
Unclassified
20. LIMITATION OF ABSTRACT

The Long Term Resource Monitoring Program (LTRMP) for the Upper Mississippi River System was authorized under the Water Resources Development Act of 1986 as an element of the Environmental Management Program. The mission of the LTRMP is to provide river managers with information for maintaining the Upper Mississippi River System as a sustainable large river ecosystem given its multiple-use character. The LTRMP is a cooperative effort by the U.S. Geological Survey, the U.S. Army Corps of Engineers, and the States of Illinois, Iowa, Minnesota, Missouri, and Wisconsin.