a systematic approach for preferential … · 7.2.3 mass balance equation 165 ... for the...
TRANSCRIPT
A SYSTEMATIC APPROACH FOR PREFERENTIAL CRYSTALLIZATION- THERMODYNAMICS, KINETICS,
OPTIMAL OPERATION AND IN-SITU MONITORING
WANG XIUJUAN
NATIONAL UNIVERSITY OF SINGAPORE
2006

A SYSTEMATIC APPROACH FOR PREFERENTIAL CRYSTALLIZATION- THERMODYNAMICS, KINETICS,
OPTIMAL OPERATION AND IN-SITU MONITORING
WANG XIUJUAN (B.Eng., M. Eng., Tianjin University)
A THESIS SUBMITTED FOR THE DEGREE OF DOCTOR OF PHILOSOPHY
DEPARTMENT OF CHEMICAL & BIOMOLECULAR ENGINEERING
NATIONAL UNIVERSITY OF SINGAPORE
2006

I
ACKNOWLEDGEMENT
I am full of gratitude to my supervisor, Prof Ching Chi Bun, for his invaluable
guidance, encouragement and continuous supervision during my graduate study. His
endless patience and understanding has allowed me to carry out this work to the best of
my ability.
I would like to thank my co-supervisor Prof Hidajat Kus, for his help and kindness.
Many thanks go to Prof Ng Siu Choon for his kind assistance.
Special thanks must go to my husband, Dr Li Chuanzhao, for his continuous
support, encouragement and willingness to share my anxieties and joy of my success.
Many thanks go to Ms Ang Shiou Ching who supported me whenever she could.
I wish to thank my colleagues in Prof Ching’s group, especially Dr Lu Jie and Mr
Wiehler Harald for their help.
I am greatly indebted to Chemical and Process Engineering Centre (CPEC, NUS)
and Division of Chemical and Biomolecular Engineering, NTU, for providing research
facilities.
Finally, this thesis is dedicated to my daughter Li Chen.
Probably there are some people who would also have deserved to be mentioned
here, but are not. I am also grateful to them.

II
TABLE OF CONTENTS
ACKNOWLEDGEMENT I
TABLE OF CONTENTS II
SUMMARY IX
NOMENCLATURE XI
LIST OF FIGURES XVI
LIST OF TABLES XXIII
CHAPTER 1 INTRODUCTION 1
CHAPTER 2 LITERATURE REVIEW 9
2.1 Overview of chirality 9
2.2 Methods to obtain pure enantiomers 12
2.3 Characterization of racemic species 16
2.4 Solubility and metastable zone 19
2.4.1 Solubility of enantiomers 19
2.4.2 Metastable zone width 20
2.5 Enantiomeric resolution by direct crystallization 22
2.5.1 Simultaneous crystallization 22
2.5.2 Preferential crystallization 23
2.5.3 Mechanism of preferential crystallization 26
2.5.4 Preferential crystallization process 28
2.6 Chiral nucleation 30
2.7 Crystallization kinetics 33

III
2.8 Optimal operation of batch crystallization 33
2.9 Summary 34
CHAPTER 3 EXPERIMENTAL SET-UP AND METHODOLOGY 36
3.1 The studied chiral systems 36
3.2 Characterization and analysis methods 41
3.2.1 Differential scanning calorimetry (DSC) 41
3.2.1.1 Analysing the thermogram 42
3.2.2 Powder X-ray Diffraction (PXRD) 43
3.2.3 Fourier transform infrared spectroscopy (FT-IR) 44
3.2.4 Raman spectroscopy 44
3.2.5 Nuclear magnetic resonance (NMR) 44
3.3 Solubility and metastable zone width measurement 45
3.4 Direct crystallization experimental set-up 48
3.5 Crystal analysis and monitoring 49
3.5.1 Principle of optical rotation and polarimetry 49
3.5.2 Particle size analysis 50
3.5.3 Field emission scanning electron microscope (FESEM) 52
CHAPTER 4 CHARACTERIZATION OF RACEMIC SPECIES 53
4.1 Introduction 53
4.2 Methods for characterization of racemic species 54
4.2.1 Characterization by the binary phase diagram 54
4.2.2 Characterization of racemic species by analytical
spectroscopic techniques 56
4.3 Results and discussion 56
IV
4.3.1 Characterization by the binary phase diagram 56
4.3.1.1 Melting point phase diagram of 4-hydroxy-2-
pyrrolidone 57
4.3.1.2 Melting point phase diagram
of N-methylephedrine 65
4.3.1.3 Melting point phase diagram of propranolol
hydrochloride 71
4.3.1.4 Melting point phase diagram of atenolol 76
4.3.2 Characterization by powder X-ray Diffraction spectra
(PXRD) 80
4.3.2.1 Powder X-ray Diffraction spectra of 4-hydroxy-2-
pyrrolidone 80
4.3.2.2 Powder X-ray Diffraction spectra of N-
methylephedrine 81
4.3.2.3 Powder X-ray Diffraction spectra of propranolol
hydrochloride 82
4.3.3 Characterization by solid state fourier transform infrared
spectra (FT-IR) 83
4.3.3.1 FT-IR spectra of 4-hydroxy-2-pyrrolidone 83
4.3.3.2 FT-IR spectra of N-methylephedrine 85
4.3.3.3 FT-IR spectra of propranolol hydrochloride 86
4.3.4 Characterization by solid state Raman spectra 87
4.3.4.1 Raman spectra of 4-hydroxy-2-pyrrolidone 87
4.3.4.2 Raman spectra of N-methylephedrine 88
V
4.3.4.3 Raman spectra of propranolol hydrochloride 88
4.3.5 Characterization by solid state nuclear magnetic resonance
(NMR) 90
4.4 Summary 91
CHAPTER 5 CRYSTALLIZATION THERMODYNAMICS: SOLUBILITY AND
METASTABLE ZONE 93
5.1 Introduction 93
5.2 Experimental 95
5.2.1 Solvent selection 95
5.2.2 Characterizing the metastable zone width and solubility curve
using Lasentec FBRM and PVM 96
5.3 Results and discussion 98
5.3.1 Solubility and metastable zone width of 4-hydroxy-2-
pyrrolidone in isopropanol 98
5.3.1.1 Solubility 99
5.3.1.2 Metastable zone width (MSZW) 109
5.3.2 Solubility and metastable zone width of N-methylephedrine
in the mixture of isopropanol and water (Vol 1:3) 120
5.3.2.1 Solubility 120
5.3.2.2 Metastable zone 124
5.3.3 Solubility and metastable zone width of propranolol
hydrochloride in the mixture of methanol and isopropanol
(Vol 1:5) 126
5.3.3.1 Solubility 126
VI
5.3.3.2 Metastable zone 130
5.3.4 Solubility and metastable zone width of
atenolol in acetone 132
5.4 Summary 134
CHAPTER 6 CRYSTALLIZATION KINETICS OF 4-HYDROXY-2
PYRROLIDONE IN ISOPROPANOL 136
6.1 Introduction 136
6.2 Characterization of crystallization kinetics 136
6.2.1 Steady state method 136
6.2.2 Dynamic method 137
6.3 s-plane analysis 139
6.4 Size-dependent growth 142
6.5 Experimental 143
6.6 Results: Crystal nucleation and growth kinetics 144
6.6.1 Crystal suspension density and supersaturation 144
6.6.2 Crystal size distribution (CSD) 149
6.6.3 s-Plane analysis on the measured data 151
6.6.4 Crystallization kinetics of S-4-hydroxy-2-pyrrolidone in
Isopropanol 158
6.7 Summary 160
CHAPTER 7 OPTIMAL OPERATION OF PREFERENTIAL
CRYSTALLIZATION OF 4-HYDROXY-2-PYRROLIDONE IN ISOPROPANOL
7.1 Introduction 161
7.2 Mathematic model in batch crystallization 164
VII
7.2.1 Population balance equation 164
7.2.2 Crystallization kinetics 165
7.2.3 Mass balance equation 165
7.2.4 Energy balance 167
7.3 Model solution 167
7.3.1 Moment method 167
7.3.2 Orthogonal collocation method 171
7.4 Optimal operation profile of 4-hydroxy-2-pyrrolidone preferential
crystallization in isopropanol 173
7.4.1 Methodology 174
7.4.2 Thermodynamics considerations 175
7.4.3 Optimal cooling profile 176
7.5 Preferential crystallization operation 182
7.6 Results and discussion 184
7.6.1 Operation and in-situ monitoring 184
7.6.2 Progression of preferential crystallization 186
7.6.3 Optical purity of final products 187
7.6.4 Crystal size distribution 192
7.6.5 Critical supersaturation range 203
7.7 Summary 206
CHAPTER 8 APPLICATION OF DIRECT CRYSTALLIZATION FOR
RACEMIC COMPOUND PROPRANOLOL HYDROCHLORIDE 207
8.1 Introduction 207
8.2 Experimental setup and procedure 210
VIII
8.3 Results and discussion 212
8.3.1 Semi-preparative HPLC separation of propranolol
hydrochloride using Chiralcel OD-H column 212
8.3.2 Solubility and metastable zone width 216
8.3.3 Progression of direct crystallization 218
8.3.4 Optical purity of final products 219
8.3.5 Crystal morphology and size distribution 227
8.4 Summary 230
CHAPTER 9 CONCLUSIONS AND FUTURE WORK 231
9.1 Conclusions 231
9.2 Suggestions for future work 234
REFERENCES 236
LIST OF PUBLICATIONS 280

IX
SUMMARY
The application of preferential crystallization as an effective and cheap technology
for the production of pure enantiomers has become increasingly important. Synthetic
organic chemists have put much attention on the chemistry aspects and thermodynamic
behaviours, but the understanding of the factors that govern the chiral crystallization
process itself is very limited. Particularly, the existence of unstable metastable zone in
chiral nucleation has been documented in several cases. It indicates that supersaturation
degree should play a crucial role in the optical purity during preferential crystallization.
Furthermore, the importance of supersaturation control has been widely recognized in the
aspects of crystal habits and purity. Therefore, it is necessary to systematically investigate
the preferential crystallization process from thermodynamics and kinetics, and apply them
in supersaturation control. Such efforts have been rather rare until now.
In this dissertation, a systematic approach has been developed and applied to the
preferential crystallization of 4-hydroxy-2-pyrrolidone in isopropanol by integration of
system thermodynamics, crystallization kinetics, optimal operation and in-situ monitoring.
Three types of racemate crystals, namely racemic conglomerates (4-hydroxy-2-
pyrrolidone and N-methylephedrine), racemic compounds (propranolol hydrochloride)
and pseudoracemates (atenolol) were characterized using thermal analysis and structural
characterizations. The two conglomerates and the racemic compound showed similar
solubility characteristics. The metastable zone widths (MSZWs) of both conglomerates
were independent of enantiomeric excess, while the MSZWs of the racemic compound
were different with racemate and pure enantiomer. Their crystal lattice properties were
attributed to this difference and three MSZW possibilities were discussed for racemic
X
compound. Furthermore, for the conglomerate 4-hydroxy-2-pyrrolidone, different orders
of primary nucleation rate at different enantiomeric excess were observed, which suggests
a critical supersaturation beyond which the nucleation of opposite isomer could occur.
This appears to be the first detailed experimental investigation of metastable zone widths
of different types of racemates in solution.
S-plane analysis was developed and applied to the crystallization kinetics
estimation of (R)- and (S)-4-hydroxy-2-pyrrolidone in isopropanol and similar kinetics
were obtained. With combination of thermodynamics properties and crystallization
kinetics, a process modelling for batch crystallization was developed to predict the cooling
profiles for the preferential crystallization of 4-hydroxy-2-pyrrolidone in isopropanol. The
in-situ monitoring showed that relatively high supersaturation of the target enantiomer
induced spontaneous nucleation of the undesired enantiomer, which accordingly resulted
in low optical purity and poor crystal size distribution. The proposed optimal temperature
trajectory to control the critical supersaturation successfully inhibited the induced
nucleation of the undesired enantiomer, and hence produced almost pure crystals with
good habits. Further investigations under various supersaturations indicated that there
could be an optimal supersaturation which would not sacrifice optical purity. The
supersaturation control was extended to the application of direct crystallization to racemic
compound propranolol hydrochloride coupling with chromatography.
The metastable zone analysis and the optimal operation and monitoring results
strongly suggest that it is important to control supersaturation degree in preferential
crystallization and it is essential and helpful to integrate thermodynamics, crystallization
kinetics and population balance modelling to establish the control strategy.
XI
NOMENCLATURE
Abbreviations AT
CMPA
Atenolol
Chiral mobile phase additive
CSD Crystal size distribution
CSP Chiral stationary phase
DSC Differential scanning calorimetry
FBRM Focused beam reflectance measurement
FDA US Food and Drug Administration
FESEM Field emission scanning electron microscopy
FT-IR Fourier transform infrared
4-HP
IPA
4-hydroxy-2-pyrrolidone
Isopropanol
LALLS Low angle laser light scattering
ME N-methylephedrine
MSMPR
MSZW
NMR
PNCl
Mixed-suspension, mixed-product removal
Metastable zone width
Nuclear magnetic resonance
Propranolol hydrochloride
PVM
P-XRD
Particle vision measurement
Powder X-ray diffraction
SMB Simulated Moving Bed (chromatography)
XII
Symbols
B
c
c
C*
∆cmax
[#/litre min]
[g/100ml]
[kg/kg solvent]
[kg/kg solvent]
[kg/kg solvent]
Nucleation rate
Concentration (mass per volume), used in polarimetry
Concentration (crystallization kinetics)
Solubility
The maximum allowable supersaturation
d
d
[mm]
[nm]
Length of measurement cell (polarimeter)
Interplanar spacing between the atoms in the crystal
D
DL
Eb
Eg
[kJ]
[kJ]
Dextrorotatory (right, according to Fischer convention)
Racemic mixture
Nucleation energy
Crystal growth energy
ee Enantiomeric Excess
H
J
kb
kg
kn
kv
[J/mol]
[#/m3 s]
Molar enthalpy
Primary nucleation rate
Nucleation rate constant
Crystal growth rate constant
Nucleation rate constant
Shape factor
L
L
mj
MT
[µm]
[kg/litre]
Levorotary (left, according to Fischer convention)
Particle size
jth moment of crystal size distribution
Suspension density
XIII
n
n
n0
N
q
[#/m4]
[#/m4]
[#/m3]
Nucleation constant (MSZW)
Population density
Nuclei population density
Total number of particles
Cooling rate
R Rectus (right, acc. to Cahn-Ingold-Prelog convention)
R Racemic Compound (Racemate)
R
s
[J/mol K] Gas constant
Laplace transform variable
s [J/mol K] Molar entropy
S
t
τ
[s] or [min]
[s]
Sinister (left, acc. to Cahn-Ingold-Prelog convention)
Time
Residence time
T
∆Tmax
uk
V
[°C] or [K]
[°C] or [K]
[m3]
Temperature
The maximum allowable supercooling
kth moment of the population density
Volume
wt% [g/g]% Weight percentage
x [mol/mol] Mole fraction (in liquid or solid phase)
Greek Letters
α
α
[°]
Angle of rotation of plane polarized light
Solubility ratio of racemate to enantiomer

XIV
[α]λT [°] Specific rotation at wavelength λ and temperature T
β [°] Correcting angle for DSC-thermograms
θ [°] Bragg angle in P-XRD patterns
λ [nm] Wavelength
ν [Hz] Frequency (of radiation according to wave theory)
ν% [cm-1] Wavenumber
ρ [kg/m³] Density
Subscripts
A Referring to one pure enantiomer (D or L)
D
s
l
“D-Line” of sodium vapour lamp λ=589.3 nm
Solid state
Liquid state
i Component i
Op Operating (operating temperature)
R Racemic
S Surface
V Volume
Superscripts
b
f
Order of nucleation
Fusion

XV
g
i
j
Order of growth
Relative kinetic order
Magma density dependence of nucleation rate
L
Cal
Liquid phase
Calculated data
LS Phase transition from liquid to solid state
(crystallization)
S Solid phase
SL Phase transition from solid to liquid state (melting)

XVI
LIST OF FIGURES
Figure Title Page
Figure 2.1 An overview of methods to obtain pure enantiomers 13
Figure 2.2 Preferential crystallization in the ternary phase diagram 24
Figure 3.1 Chemical structure of (R)- and (S)-4-hydroxy-2-pyrrolidone 36
Figure 3.2 Chemical structure of (+)- and (-)- N-methylephedrine 38
Figure 3.3 Chemical structure of (R)- and (S)-propranolol hydrochloride 39
Figure 3.4 Chemical structure of (R)- and (S)- atenolol 40
Figure 3.5 FBRM probe 47
Figure 3.6 FBRM chord length measurement 47
Figure 3.7 Experimental set-up 49
Figure 3.8 Principle of LALLS instruments 51
Figure 4.1 Crystal lattices of the three fundamental types of racemates 53
Figure 4.2 Typical binary phase diagrams of various racemic species 55
Figure 4.3 Determination of temperatures of fusion (Tf) for 4-hydroxy-2-pyrrolidone
58
Figure 4.4 Binary phase diagram (melting point diagram) of 4-hydroxy-2-pyrrolidone
61
Figure 4.5 Thermodynamic cycle for calculation of enthalpies for a racemic 62
Figure 4.6 Thermodynamic cycle for calculation of entropies for a racemic conglomerate system
63
Figure 4.7 Determination of temperatures of fusion (Tf) for N-methylephedrine
65
Figure 4.8 Binary phase diagram (melting point diagram) of N-methylephedrine
70
Figure 4.9 Determination of temperatures of fusion (Tf) for propranolol 72

XVII
hydrochloride
Figure 4.10 Binary phase diagram (melting point diagram) of propranolol Hydrochloride
64
Figure 4.11 DSC thermograms of atenolol with different enantiomeric compositions
76
Figure 4.12 Determination of temperatures of fusion (Tf) for atenolol
77
Figure 4.13 Binary phase diagram (melting point diagram) of atenolol
79
Figure 4.14 Powder X-ray Diffraction patterns of (R) and (RS)-4-hydroxy-2-pyrrolidone
81
Figure 4.15 Powder X-ray Diffraction patterns of (+) and (±)-N-methylephedrine
82
Figure 4.16 Powder X-ray Diffraction patterns of (S) and (RS)-propranolol hydrochloride
83
Figure 4.17 FT-IR spectra of (R)- and (RS)-4-hydroxy-2-pyrrolidone
84
Figure 4.18 FT-IR spectra of (+) and (±)-N-methylephedrine
85
Figure 4.19 FT-IR spectra of (S) and (RS)-propranolol hydrochloride
86
Figure 4.20 Raman spectra of (R) and (RS)-4-hydroxy-2-pyrrolidone
87
Figure 4.21 Raman spectra of (+) and (±)-N-methylephedrine
88
Figure 4.22 Raman spectra of (S) and (RS)-propranolol hydrochloride
89
Figure 4.23 13C Solid State NMR spectra of (S)- and (RS)-propranolol hydrochloride
90
Figure 5.1 FBRM data and temperature profile for a typical batch
97
Figure 5.2 A typical PVM imagine when nucleation occurred
97
Figure 5.3 Solubility of 4-hydroxy-2-pyrrolidone with different enantiomeric excess in isopropanol
101
Figure 5.4 Ternary phase diagram of 4-hydroxy-2-pyrrolidone in isoropanol
108
Figure 5.5 Experimental metastable zone widths of pure R-4-hydroxy-2-pyrrolidone in IPA for different cooling rates
109
XVIII
Figure 5.6 Experimental metastable zone widths of RS-4-hydroxy-2-pyrrolidone in IPA for different cooling rates
110
Figure 5.7 Experimental metastable zone widths of R-20%ee-4-hydroxy-2-pyrrolidone in IPA for different cooling rates
111
Figure 5.8 Experimental metastable zone widths of R-25%ee-4-hydroxy-2-pyrrolidone in IPA for different cooling rates
112
Figure 5.9 Experimental metastable zone widths of R-40%ee-4-hydroxy-2-pyrrolidone in IPA for different cooling rates
113
Figure 5.10 Experimental metastable zone widths of R-50%ee-4-hydroxy-2-pyrrolidone in IPA for different cooling rates
114
Figure 5.11 Experimental metastable zone widths of R-75%ee-4-hydroxy-2-pyrrolidone in IPA for different cooling rates
115
Figure 5.12 Relationship of log MSZW (log ∆Tmax) with cooling rate (log q) for RS-4-hydroxy-2-pyrrolidone
119
Figure 5.13 Relationship of log MSZW (log ∆Tmax) with cooling rate (log q) for 20% ee-R-4-hydroxy-2-pyrrolidone
120
Figure 5.14 Solubility of N-methylephedrine with different enantiomeric excess in the mixture of isopropanol and water (Vol 1:3)
122
Figure 5.15 Ternary phase diagram of N-methylephedrine in the mixture of isopropanol and water (Vol 1:3)
124
Figure 5.16 Experimental metastable zone widths of N-methylephedrine in the mixture of IPA and water (Vol = 1:3) for different enantiomeric excess
125
Figure 5.17 Solubility of propranolol hydrochloride with different enantiomeric excess in the mixture of methanol and isopropanol (Vol 1:5)
127
Figure 5.18 The ternary phase diagram of propranolol hydrochloride in the mixture of methanol and isopropanol (Vol = 1:5)
129
Figure 5.19 Experimental metastable zone widths of R- and RS-propranolol hydrochloride in the mixture of methanol and isopropanol (Vol = 1:5)
130
Figure 5.20 The ternary phase diagram of atenolol in acetone
133
Figure 6.1 Concentration profiles of crystal suspension density MT, solute 145
XIX
concentration c and supersaturation ∆c in Run1
Figure 6.2 Concentration profiles of crystal suspension density MT, solute concentration c and supersaturation ∆c in Run2
146
Figure 6.3 Concentration profiles of crystal suspension density MT, solute concentration c and supersaturation ∆c in Run3
147
Figure 6.4 Concentration profiles of crystal suspension density MT, solute concentration c and supersaturation ∆c in Run4
148
Figure 6.5 Typical crystal size distribution in kinetic measurement
149
Figure 6.6 Typical crystal population density distribution
151
Figure 6.7 s-Plane analysis of data in Fig 6.6, sL=0.1, G=0.37 µm/min, B=8.1×10⁴ #/min·liter solvent
153
Figure 6.8 s-Plane analysis of data in Fig 6.6, sL=1, G=0.41 µm/min, B=8.2×10⁴ #/min·liter solvent
154
Figure 6.9 Typical s plane analysis to estimate crystal nucleation and growth rate in Run3. sfL2=0.1, G=0.27 µm/min, B=2.5×10⁴ #/min·liter solvent
155
Figure 6.10 s-Plane analysis to estimate crystal nucleation and growth rate in Run3. sfL2=1, G=0.32 µm/min, B=2.5×10⁴ #/min·liter solvent
156
Figure 7.1 Typical convex cooling curves from Equation 7.22
171
Figure 7.2 Population density discretization
172
Figure 7.3 The simulated optimal cooling profile for ∆c= 0.0015 kg/kg solvent
177
Figure 7.4 Simulated crystal population density distribution, ∆c= 0.0015 kg/kg solvent
178
Figure 7.5 Simulated final crystal size distribution, ∆c= 0.0015 kg/kg solvent
179
Figure 7.6 Concentration with time, ∆c= 0.0015 kg/kg solvent
180
Figure 7.7 Crystal slurry suspension density with time
181
Figure 7.8 The calculated optimal cooling profile from Equation 7.22
182
Figure 7.9 A typical seed CSD 183

XX
Figure 7.10 The recorded cooling profile. 1-optimal cooling, 2-forced cooling
185
Figure 7.11 FBRM data of the number of fine counts with two different temperature profiles (1µm <chord<5µm)
186
Figure 7.12 Calibration curve of melting temperature with enantiomeric excess
188
Figure 7.13 DSC thermograms for final crystallization products and pure R-enantiomer
189
Figure 7.14 Calibration curve (linear) of optical rotation with concentration for pure R-enantiomer
190
Figure 7.15 Crystal size distribution of pure R-enantiomer seeds and crystal products from different cooling profiles
194
Figure 7.16 SEM images of final crystal products from different cooling profiles
195
Figure 7.17 Cooling profile, ∆c=0.0018 kg/kg
197
Figure 7.18 Cooling profile, ∆c=0.0020 kg/kg
198
Figure 7.19 Cooling profile, ∆c=0.0022 kg/kg
199
Figure 7.20 FBRM record of the number of fine counts, ∆c=0.0018 kg/kg
200
Figure 7.21 FBRM record of the number of fine counts, ∆c=0.0020 kg/kg
200
Figure 7.22 FBRM record of the number of fine counts, ∆c=0.0022 kg/kg
201
Figure 7.23 Product purities with different operating supersaturations
202
Figure 7.24 Crystal size distributions from optimal operation at different supersaturations
204
Figure 7.25 SEM images of final crystal products from different cooling profiles. From top to bottom: ∆c=0.0018; kg/kg; ∆c=0.0020 kg/kg; ∆c=0.0022 kg/kg
205
Figure 8.1 Ternary phase diagrams for a racemic compound: (a) unfavorable; (b) more favorable; (c) most favorable
208
Figure 8.2 Chemical structure of (R)- and (S)-propranolol hydrochloride
209
Figure 8.3 Partial separation of propranolol on Chiralcel OD-H semi-preparative HPLC column (dimension 250mm L x 10mm I.D) at
213

XXI
different loadings (8.95mg and 14.56mg per injection) using 100% IPA as mobile phase, at 25°C column temperature, flow rate of 1ml/min and UV-Vis detection at 254nm.
Figure 8.4 Fraction collection under semi-preparative HPLC separation of propranolol on Chiralcel OD-H column (dimension 250mm L x 10.00 mm I.D.) under separation conditions: IPA (100%) at 25°C column temperature, flow rate of 1.0ml/min and UV-Vis detection at 254nm. Fraction (a) collected at retention time 15-25 minutes and fraction (b) is collected at 25-30 minutes
214
Figure 8.5 Chromatogram of two fractions (a) and (b) obtained through semi-preparative HPLC separation of propranolol on Chiralcel OD-H analytical column (dimension 250mm L x 4.6 mm I.D.) under separation conditions: Hexane/IPA (80/20 v/v) at 25°C column temperature, flow rate of 1.0ml/min and UV-Vis detection at 254nm
215
Figure 8.6 Solubility and supersolubility of (R)- and (RS)-propranolol hydrochloride
217
Figure 8.7 Progression of direct crystallization
219
Figure 8.8 Chromatogram of final crystal product obtained from exp01 on Chiralcel OD-H analytical column (dimension 250mm L x 4.6 mm I.D.) under separation conditions: Hexane/IPA (80/20 v/v) at 25°C column temperature, flow rate of 1.0ml/min and UV-Vis detection at 254nm
220
Figure 8.9 Chromatogram of final crystal product obtained from exp02 on Chiralcel OD-H analytical column (dimension 250mm L x 4.6 mm I.D.) under separation conditions: Hexane/IPA (80/20 v/v) at 25°C column temperature, flow rate of 1.0ml/min and UV-Vis detection at 254nm
221
Figure 8.10 Chromatogram of final crystal product obtained from exp03 on Chiralcel OD-H analytical column (dimension 250mm L x 4.6 mm I.D.) under separation conditions: Hexane/IPA (80/20 v/v) at 25°C column temperature, flow rate of 1.0ml/min and UV-Vis detection at 254nm
222
Figure 8.11 Chromatogram of final crystal product obtained from exp04 on Chiralcel OD-H analytical column (dimension 250mm L x 4.6 mm I.D.) under separation conditions: Hexane/IPA (80/20 v/v) at 25°C column temperature, flow rate of 1.0ml/min and UV-Vis detection at 254nm
223
XXII
Figure 8.12 Calibration curve of melting temperature with enantiomeric excess
224
Figure 8.13 DSC thermograms for final crystallization products and pure R- and RS-propranolol hydrochloride
225
Figure 8.14 Crystal size distribution of crystal products from different experiments
228
Figure 8.15 SEM images of crystals produced from different conditions: (a) exp_01_with seeds; (b) exp_02_with seeds; (c) exp_03_with seeds; (d) exp_04_without seeds
229
XXIII
LIST OF TABLES
Table Title Page
Table 3.1 Properties and specifications of 4-hydroxy-2-pyrrolidone
37
Table 3.2 Properties and specifications of N-methylephedrine
39
Table 3.3 Properties and specifications of propranolol hydrochloride
40
Table 3.4 Properties and specifications of atenolol
41
Table 4.1 Temperature of fusion of 4-hydroxy-2-pyrrolidone determined with differential scanning calorimetry (DSC)
60
Table 4.2 Melting points and enthalpies of fusion of (R)-4-hydroxy-2-pyrrolidone and (RS)-4-hydroxy-2-pyrrolidone; entropy of mixing of (R)- and (S)-4-hydroxy-2-pyrrolidone in the liquid state
64
Table 4.3 Temperature of fusion of N-methylephedrine determined with differential scanning calorimetry (DSC)
69
Table 4.4 Melting points and enthalpies of fusion of (+)-N-methylephedrine and (±) N-methylephedrine; entropy of mixing of (+)- and (-)-N-methylephedrine in the liquid state
70
Table 4.5 Temperature of fusion of propranolol hydrochloride determined with differential scanning calorimetry (DSC)
73
Table 4.6 Melting points and enthalpies of fusion of (S)-propranolol hydrochloride and (RS)-propranolol hydrochloride; entropy of mixing of (S)- and (R)-propranolol hydrochloride in the liquid state
75
Table 4.7 Temperature of fusion of atenolol determined with differential scanning calorimetry (DSC)
78
Table 4.8 Melting points and enthalpies of fusion of (R)-atenolol and (RS)-atenolol; entropy of mixing of (S)- and (R)-atenolol in the liquid state
80
Table 5.1 Solubility of 4-hydroxy-2-pyrrolidone in isopropanol
99
Table 5.2 Solubility of 4-hydroxy-2-pyrrolidone in isopropanol at 40 oC
104
Table 5.3 Solubility of 4-hydroxy-2-pyrrolidone in isopropanol at 35 oC 104
XXIV
Table 5.4 Solubility of 4-hydroxy-2-pyrrolidone in isopropanol at 30 oC
105
Table 5.5 Solubility of 4-hydroxy-2-pyrrolidone in isopropanol at 25 oC
105
Table 5.6 Solubility of 4-hydroxy-2-pyrrolidone in isopropanol at 20 oC
106
Table 5.7 Solubility of 4-hydroxy-2-pyrrolidone in isopropanol at 15 oC
106
Table 5.8 Solubility of 4-hydroxy-2-pyrrolidone in isopropanol at 10 oC
107
Table 5.9 Solubility of 4-hydroxy-2-pyrrolidone in isopropanol at 5 oC
107
Table 5.10 Solubility of N-methylephedrine in the mixture of isopropanol and water (Vol = 1:3)
121
Table 5.11 Solubility of propranolol hydrochloride in the mixture of methanol and isopropanol (Vol = 1:5)
126
Table 5.12 Experimental metastable zone widths (MSZW) of R- and RS-atenolol in acetone
134
Table 6.1 Crystallization kinetics measurement (Run1)
145
Table 6.2 Crystallization kinetics measurement (Run2)
146
Table 6.3 Crystallization kinetics measurement (Run3)
147
Table 6.4 Crystallization kinetics measurement (Run4)
148
Table 6.5 Estimated crystal nucleation rate B and growth rate G with s plane analysis from the four kinetic experiments.
157
Table 6.6 Estimated crystal nucleation rate B and growth rate G for S- 4-hydroxy-2-pyrrolidone
159
Table 7.1 Final crystal products properties
191
Table 7.2 Final crystal products properties with different operating Supersaturations
203
Table 8.1 Final crystal products properties 226
1
CHAPTER 1 INTRODUCTION
With the increasing demand of enantiomerically pure compounds, particularly in
the industries of pharmaceuticals and fine chemicals, efficient strategies for preparation of
enantiomers are required (Sheldon, 1993; Collins et al., 1997; Collet, 1999; Wibowo and
Ng, 2000; Schroer, et al. 2001; Coquerel, 2003). There are different ways proposed to
obtain pure enantiomers, such as biological resolution, asymmetric synthesis,
chromatography, classical diastereomer crystallization, and immobilization and membrane
technologies. From the low cost and advantages of solid product standpoints, preferential
crystallization, which is also called resolution by entrainment, is very attractive and
promising. It consists of alternate selective nucleation/ crystallizations (O’Dell et al., 1978)
of each antipode from a supersaturated mother liquor containing a slight excess of one
enantiomer, by seeding with crystals of the enantiomer that is in excess (Collet et al, 1980;
Jacques et al., 1994; Lim et al., 1995; Ndzié et al., 1997; Schroer et al., 2001, 2003;
Coquerel, 2003; Elsner et al., 2005).
Considerable academic efforts have been put to study the potential of preferential
crystallization as an effective and cheap technology for the production of pure
enantiomers in past years. Most of these emphases are often given to the chemistry aspects,
conglomerate screening, and the knowledge of equilibrium phase diagrams with the
purpose of identifying the concentration and temperature regions of thermodynamic
stability of solid phases (Collet et al., 1980; Coquerel and Petit, 1993; Jacques et al, 1994;
Miyazaki et al., 1994; Shiraiwa et al., 1994, 1997, 2003, 2005 ; Collet, 1999; Myerson,
1999; Beilles et al., 2001; Dufour et al, 2001; Gervais et al., 2002; Pallavicini et al., 2004).

2
From the process engineering viewpoint, the application of preferential
crystallization requires the mastery of the factors that control the rate difference of
crystallization between the two enantiomers (Collet et al., 1980; Jacques et al., 1994). It is
therefore important to obtain the information on preferential crystallization process itself
by combining studies of thermodynamic properties with kinetic measurements and
therefore apply them in the control of preferential crystallization process. What is
surprising, however, very few attempts have been directed towards this effort. Indeed,
only several other experimental studies have been conducted on the process itself of
preferential crystallization. Most of the studied preferential crystallization was conducted
under isothermal conditions - cooling the solution to a certain temperature, seeding and
crystallization induced with the seeds (Collet et al., 1980). Coquerel et al. found that the
classical Seeded Isothermal Preferential Crystallization (SIPC) programme was not
suitable for the systems where the solubility ratio of racemate to enantiomer was bigger
than 2 (Collect et al., 1980; Coquerel et al., 1990). Accordingly, an Auto Seeded
Programmed Polythermic Preferential Crystallization (AS3PC) was proposed and applied
to the preferential crystallization (Coquerel et al., 1995; Ndzie et al., 1997; Beilles et al.,
2001; Courvoisier et al., 2001, 2002; Dufour et al. 2001). AS3PC method did not require
inoculation of solid to initiate the crystallization and the temperature could be
programmed, but the considerations of metastable zone and crystallization kinetics were
not emphasized. Other efforts include simplified mathematical description and optimal
initial conditions for isothermal preferential crystallization (Elsner et al. 2005; Angelov et
al., 2006). Some preliminarily satisfying agreement was shown but further model
improvement and more detailed experimental works are necessary. Ng and co-workers
(Berry and Ng., 1997; Berry et al., 1997; Wibowo and Ng, 2000; Schroer,et al. 2001) had

3
studied the synthesis of chiral crystallization processes by considering the separation steps
in the flowsheet as movements on phase diagrams.
In view of thermodynamic aspects, supersaturation control is very important in
preferential crystallization. It is crucial to keep the freedom of supersaturation of the
undesired enantiomer in its metastable zone. On the other hand, the supersaturation of the
target enantiomer should be also kept within its metastable zone. Otherwise, the
spontaneous nucleation of the target enantiomer will happen, which will easily initiate the
spontaneous nucleation of its isomer. Indeed, in most of the preferential crystallization
processes, there is only a slight excess of the target enantiomer and the concentrations of
the two enantiomers are quite close. Under this circumstance and considering the identical
physical properties of the two isomers in solutions, the spontaneous nucleation is expected
to occur simultaneously for both enantiomers. This is the most important issue that should
be avoided in the chiral resolution by direct crystallization (Jacques et al., 1994; Collet,
1999). Although metastable zone width is very useful in understanding the crystallization
process in chiral resolution, it has been rarely reported on its measurement and
interpretation in enantiomeric systems.
Furthermore, it appears that the supersaturation of the target enantiomer should be
controlled even lower than its spontaneous nucleation metastable zone. The effect of
supersaturation degree on the optical purity was reported as early as 1950 in the system of
β-phenylglyceric acid (Furberg and Hassel, 1950). In the synthesis of the agrochemical
paclobutrazol where resolution of a racemic chiral ketone was involved, a similar
phenomenon was observed (Black et al., 1989; Collins et al., 1997). Very low
supersaturation (1 oC undercooling) was required to give the product with a high optical
purity. It was suggested that if high supersaturations which are still within the metastable

4
zone are used, some conglomerates will form crystals that contain domains of both lattices
in a single crystal, which means that the enantiomerically pure seed could nucleate the
other enantiomer at its surface. In studies of the stability of the supersaturation state of
DL-serine m-xylene-4-sulfonate dehydrate (Hongo et al., 1981), two metastable regions
were identified. The first region was the one where the supersaturation degree was lower
than a constant value and no spontaneous crystallization of the unseeded isomer was
observed, while the supersaturation was stable for only a certain time in the second
metastable region and spontaneous crystallization was ready to take place.
Investigations of chiral nucleation also support the existence of a critical
supersaturation within the metastable zone during the preferential crystallization process.
In studies of nuclei breeding from a chiral crystal seed of NaClO3 (Denk and Botsaris,
1972; Kondepudi et al., 1990, 1993, 1995; McBride and Carter, 1991;Yokota and
Toyokura, 1992; Qian and Botsaris, 1997, 1998), it was found that at low supersaturation
all nuclei were of the same chirality. At relatively high supercooling, but still lower than
the critical value for spontaneous nucleation, many nuclei with opposite chirality to that of
seed were formed. Similar findings were presented in triazolylketone chiral crystallization
(Davey et al.,1990). The Embryos Coagulation Secondary Nucleation (ECSN) mechanism
was applied to the explanation of this phenomenon (Qian and Botsaris, 1998).
In addition, crystal size distribution (CSD) is an important factor in the production
of high-quality solid products and determines the efficiency of downstream operations,
such as filtration and washing. Many works have been reported to show the benefits of
controlling the supersaturation in batch crystallization (Mullin and Nyvlt, 1971; Jones and
Mullin 1974; Rousseau, 1987; Rohani and Bourne, 1990). These advantages include larger
crystals and narrower crystal size distribution. This means product purity could be

5
improved in the filtration and washing process (Mersmann, 1995; Matthews and Rawlings,
1998), which is especially important for chiral purification (Courvoisier et al, 2003).
All of these perspectives, i.e. metastable zone, critical supersaturation and crystal
size distribution, clearly underline the importance of controlling the supersaturation of the
target enantiomer to a certain extent to inhibit the nucleation of its isomer and get high
quality crystal products during preferential crystallization process. In order to get effective
supersaturation control, system characterization, thermodynamic data and crystallization
kinetics are required to predict the operating concentration profiles with population
balance modelling (Randolph and Larson, 1988). The newly developed on-line monitoring
and controlling techniques provide good tools to facilitate this kind of investigation
(Barrett and Glennon, 2002; Elsner et al., 2005). For preferential crystallization, such a
systematic procedure to consider all of the above issues to optimize process operation has
been rarely reported in literature.
The main objective of this project is to present a systematic approach to integrate
thermodynamics, crystal nucleation and growth kinetics, optimal control and in-situ
monitoring to study preferential crystallization. In addition to system characterizations as
solids and in solutions, the special metastable zone width characteristics of different
racemates were experimentally investigated and the crystallization kinetics was measured.
Accordingly, the critical supersaturation control concept and the systematic approach were
illustrated by the preferential crystallization of 4-hydroxy-2-pyrrolidone to get optically
pure products with good crystal habit. This application was also attempted to the direct
crystallization of a racemic compound.
Chapter 2 is literature review.
6
In Chapter 3, all the chemicals and experimental and theoretical methods
implemented in the thesis have been detailed including the principle of the technique,
experimental set-up and procedures.
Chapter 4 characterizes four racemates, namely 4-hydroxy-2-pyrrolidone, N-
methylephedrine, propranolol hydrochloride, and atenolol by their binary melting point
phase diagrams and various spectroscopic techniques. Based on a thermodynamic cycle
involving the solid and liquid phases of the enantiomers and racemic species, the melting
point, enthalpy, entropy and Gibbs free energy of the racemic species were derived from
the thermodynamic data. 4-hydroxy-2pyrrolidone and N-methylephedrine can be
classified as racemic conglomerate forming systems. The characteristic of melting point
phase diagram of propranolol hydrochloride is similar to the one of a conglomerate
forming system, but the evidently negative value of the difference in the enthalpies of
fusion of (R)- and (RS)- indicates it is a racemic compound favoring system. Atenolol is
an ideal pseudoracemate forming system.
In Chapter 5, the solubilities, metastable zone widths and ternary phase diagrams
at different enantiomeric excess (ee) for the above four racemates in the chosen solvents
were measured using Lasentec FBRM and PVM. All the chosen solvents were found
suitable for cooling crystallization in the studied temperature ranges.
The solubilities of the two conglomerates increase with decreased ee. The
metastable zone widths of both studied conglomerates were found independent of
enantiomeric excess at different cooling rates, which is consistent with classical nucleation
theory and indicates the characteristic of two enantiomers forming separate crystals for a
racemic conglomerate. The solubility characterization and ternary phase diagram of
racemic compound propranolol hydrochloride were found similar to that of conglomerate,
7
but its metastable zone width was dependent on the enantiomeric excess. A solubility ratio
2 of racemate to pure enantiomer was found closely correlated with the different MSZW
situations for racemic compound. This indicates that metastable zone width can be used
as an additional characteristic to identify these two kinds of racemates. More importantly,
the regressed primary nucleation rates of 4-hydroxy-2-pyrrolidone suggest the existence of
critical supersaturation beyond which the nucleation of opposite isomer could occur. This
appears to be the first experimental and theoretical investigation of metastable zone in the
chiral system. The solubility, metastable zone will be the thermodynamic basis for the
critical supersaturation control in the preferential crystallization process.
Chapter 6 is on the crystal nucleation and growth kinetics, which is essential for
the crystallization modeling and control. Laplace transform method was successfully
developed and applied to the estimation of crystallization kinetics of (R)-4-hydroxy-2-
pyrrolidone and (S)-4-hydroxy-2-pyrrolidone in isopropanol. A more suitable Laplace
transform variable s range was employed for current crystallization system. The size
dependence of crystal growth was found negligible using modified s-plane approach. The
crystal nucleation rate seems independent on the experimental temperature range. The two
enantiomers show similar characteristics in crystal nucleation and growth.
In Chapter 7, based on the measured thermodynamics and crystallization kinetics,
the concept of critical supersaturation control in preferential crystallization was proposed
and applied to the preferential crystallization of 4-hydroxy-2-pyrrolidone in isopropanol.
The orthogonal collocation method and the second momentum were combined to solve the
mathematical model of batch preferential crystallization. The in-situ monitoring, product
purity and crystal morphology showed that relatively high supersaturation of the target
enantiomer induced spontaneous nucleation of the undesired enantiomer. This kind of

8
unwanted nucleation was successfully inhibited by the proposed optimal temperature
trajectory to control the critical supersaturation and therefore produced almost pure
crystals with good habits. Furthermore, a series of batch operations were experimentally
studied under various supersaturations to seek the optimal operating strategy without loss
of product optical purity. It was proven essential and useful to integrate thermodynamics,
crystallization kinetics and population balance simulation in the critical supersaturation
control for preferential crystallization.
Chapter 8 tried to extend the above investigations to the direct crystallization of a
racemic compound coupling with semi-preparative HPLC. Direct crystallization of
propranolol hydrochloride was conducted with the same initial composition as that
partially resolved from HPLC. Based on the solubilities and MSZWs of (R)- and (RS)-
propranolol hydrochloride, the direct crystallization progression was clearly illustrated
under seeding and non-seeding processes. With the relative solubility and supersaturation
control, optically pure crystal product could be obtained from the partially resolved
sample within certain safe supersaturation limit.
In Chapter 9, the conclusions were drawn and some suggestions were provided for
the future work.
9
CHAPTER 2 LITERATURE REVIEW
2.1 Overview of chirality
An object is chiral when it lacks reflectional symmetry. Molecules that are
nonsuperimposable on their mirror images are called enantiomers. Most chiral molecules
contain a tetrahedral carbon atom, a carbon atom attached to four different functional
groups (Rosanoff, 1906). The carbon atom is then an asymmetric centre of the molecule.
A racemate will consist of 1:1 mixture of enantiomers, if the compound has one chiral
center (1:1:1:1, if it has two chiral centers). Unlike diastereomers and geometric isomers,
which are chemically distinct and physically different entities, enantiomers have exactly
the same physical and chemical properties (except for optical rotation of polarized light) in
an achiral (symmetrical) environment. However, they will differ when they are exposed to
a chiral environment (e.g. in the human body, because most enzymes are chiral as well.).
Most pharmaceuticals, agrochemicals (herbicides, insecticides and fungicides) but
also flavours, fragrances and food stuffs are chiral molecules (Sheldon, 1993; Collins et
al., 1997). Some of them even contain more than one asymmetric centre. A molecule
containing two or three asymmetric centres has four or eight different stereoisomers
respectively. For molecules with two asymmetric centres the term diastereomers is used.
Since only two forms can be mirror images, enantiomers occur always in pairs. The
importance of separating a racemic mixture (a mixture containing an equal amount of a
pair of enantiomers) has been emphasised by many authors (e.g. Sheldon, 1993; Agranat
and Caner, 1999; Caldwell, 2001; Caldwell and Leonard, 2001; Maier et al, 2001). Often
only one enantiomer (the eutomer) shows the desired effect, the other (the distomer) is
10
either less effective, shows no effect at all or even worse has undesired side-effects.
Probably the most well-known example is the sedative thalidomide (trade name:
Contergan®) which was distributed in the 1960s as a racemate (Botting, 2002). It was not
known that although the (R)-enantiomer is an effective sedative, the (S)-enantiomer is
highly teratogenic (causes fetal abnormalities). Another recent example is the
development of single isomer β-agonist, which plays a significant role in the treatment of
asthma albuterol, a bronchodilator used to treat acute asthma, is a racemic drug that is
improved without one enantiomer, as shown from recent studies (Nelson et al., 1998). The
(R)-albuterol (a.k.a. levalbuterol, because it rotates polarize light to the left) is found to be
the effective enantiomer of the racemic albuterol, whereby its counterpart (S)-albuterol
lacks any therapeutic benefit. In fact, (S)-albuterol has been found to have an adverse
effect of airway hyperactivity and potentially pro-inflammatory action with long-term
usage. Studies have shown that by administering the pure (R)-albuterol to the asthmatic
patients, the duration of the therapeutic efficacy was found to be longer than that of the
racemic albuterol, with almost 8 times less dosage of the pure enantiomer than the
racemate.
Besides these tragic cases there are many other examples for (toxic) side-effects,
different therapeutic effects or different flavours or scents of two enantiomers. Some
agents with their specific properties were described by Sheldon (1993).
Furthermore the US Food and Drug Administration (FDA) published a Policy
Statement for the development of new stereoisomeric drugs (Anon, 1992). According to
this Policy Statement the admission of a new drug is only given if adequate information on
pharmacologic and toxicologic assessment, proper characterization of metabolism and
distribution, clinical studies etc. are done for the pure enantiomers.
11
Separating a chiral drug which is distributed as a racemate at present into
enantiomers may extend the patent for it, because a stereochemically pure compound
derived from the available racemate will be treated as a new drug. This strategy is referred
to as the “chiral switch” (sometimes also referred to as “racemic switch”) (Agranat and
Caner,1999). Companies now begin to separate the racemic mixtures of their drugs which
patents are about to expire into its enantiomers and distribute only the eutomer. Several
examples of companies specialized in chirotechnology applying for the approval of single
enantiomers, either to distribute them on their own or to profit from licensing the patents
back to the innovator firms or third parties are reported (Anon, 1993; van Annum, 1999;
Stinson, 2001). An elaborate description with case histories is presented by
(Agranat and Caner, 1999).
For agrochemicals the advantage of using pure enantiomers is that the desired
effect can be achieved with a lower environmental burden (Buser et al., 2000). When the
distomer is less effective, only half of the agent must be brought on the field.
According to Anon, Stinson and Rouhi (Anon, 1993; Stinson, 2001; Rouhi, 2002),
the market of single enantiomers in chiral drugs and intermediates and agrochemicals as
well as other sectors is expected to grow greatly in the near future.
Due to the advantages of single enantiomers and the big chiral market, production
of enantiomerically pure materials using asymmetric methods, both in synthesis and
separation, has become important. As the more common techniques of separation used
elsewhere in chemical industry cannot be employed to racemic mixtures (due to the
identical properties for the two enantiomers), research in the field of alternative resolution
methods and research for a better understanding of the known resolution techniques
become more and more important. Over decades, engineers and scientists have been

12
putting much effort to develop cost- and time-efficient techniques to produce pure
enantiomers (Sheldon, et al., 1993; Collins et al., 1997).
2.2 Methods to obtain pure enantiomers
There are many different ways to obtain pure enantiomers (Crosby, 1991; Sheldon,
1993; Collins et al, 1997; McCague, 1998; Challener, 2001; Maier et al, 2001; Rekoske,
2001). Figure 2.1 gives an overview of the methods available.

13
Figure 2.1 An overview of methods to obtain pure enantiomers
14
Basically they are divided into three classes, which are chirality pool, asymmetric
synthesis and separation of racemates.
For most natural chiral substances, probably the easiest and cheapest way to obtain
them as pure enantiomers is a classical extraction, because in nature often only one single
enantiomer exists. Other methods using microorganisms or synthesis of pure enantiomers
from chiral starting material are also frequently used. All chiral molecules which are
available from nature or are obtained by classical synthesis of chiral or prochiral starting
materials are referred to as the “chirality pool” (Sheldon,1993, 1996). Therefore all chiral
molecules belonging to the chirality pool are readily available in large amounts. Using the
chirality pool whenever possible is the first choice to obtain pure enantiomers because
technical effort and process costs are low.
The invention of asymmetric synthesis dates back Monsanto’s original work on the
synthesis of l-dopa (Reinhold et al, 1968), and it has gained much progress and scope in
the development of pure enantiomers during the last decade. Various methods of
asymmetric synthesis have been developed and used to obtain high enantiomeric excess
materials. Most of known asymmetric reactions are substrate-controlled, auxiliary-
controlled, reagent-controlled and catalyst-controlled (Lin et al, 2001). However, in most
cases, they are quite complicated and the product is highly diluted and its recovery is
expensive. Even by asymmetric synthesis, a totally pure enantiomer cannot be yielded. A
product of 90% enantiomeric excess is normally considered to be a satisfying result.
Although extensive research has been conducted on the laboratory-scale, against the
totality of examples of the manufacture of optically active materials, at the industrial level,
asymmetric syntheses are still relatively scarce. Hence, alternatives have to be sought to
solve this problem.
15
The third main branch is the separation of a racemic mixture. A racemic mixture
can be separated with chromatography using either a chiral mobile phase additive
(CMPA) or a chiral stationary phase (CSP). For large-scale application, only the latter has
been approved. The simulated moving bed (SMB) chromatography developed in the late
1960s is the most widely used technique. There is much literature about employing SMB
for separation of chiral systems (Routhven and Ching, 1989; Juza et al., 2000; Wang and
Ching, 2005). This technique, however, employs a substantial amount of solvent and
requires significant capital investment in the form of expensive chiral stationary phase and
high-pressure equipment. In addition, the product stream is obtained from the process in
extremely dilute form, and thus a further expensive concentration step is required to
recover the desired compound.
Another approach for separating chiral molecules is a method called kinetic
resolution (Noyori et al., 1995). One of the enantiomers of a racemate is more readily
converted to product than the other. As it is easy to see, this method cannot be employed if
both enantiomers are valuable products.
Diastereoisomer crystallization, which uses a resolving agent to form a pair of
diastereomeric salts, is also widely used. The resulting salts can be separated easier,
because they have distinct properties. Wilen et al.(1977) have provided guidelines which
permit a rational approach with a high probability of success. The methodology, principles
of the technique and criteria for good resolving agents have been well described in many
literatures (Jacques et al., 1994). Advancements in the use of computer aided molecular
modelling have provided some assistance to researchers in the rational design and
selection of resolving agents. Many types of pharmaceuticals have been prepared utilizing
crystallization of diastereoisomeric salts as a means of obtaining optically pure

16
intermediates, for example, Ampicillin, Ethambutol, Choramphenicol, Fosfomycin,
Thiampenicol, Naproxen, and Diltiazem etc (Sheldon, 1993; Collins et al., 1997; Collet,
1998).
Despite the effectiveness and wide applicability of this method, a limitation of this
procedure is that only enantiomers with appropriate functionality can form diastereomeric
salts of acids or bases. Thus simple hydrocarbons and other unfunctionalized compounds
cannot be derivatized and then separated in this manner. Other difficulties such as
recovery of the resolving agent and racemization of the unwanted isomer are also
troublesome.
One of the most attractive methods of resolution is separation of enantiomers by
preferential crystallization (Secor, 1963; Collet et al, 1980; Coquerel et al, 1988, 1990;
Sheldon, 1993; Jacques et al., 1994; Coquerel, 2003). In this method, no derivatization or
reaction of the starting material is required. It is regarded as an effective and cheap
technology to produce pure enantiomers at different scales. The progress of preferential
crystallization will be reviewed in detail in Section 2.5.
2.3 Characterization of racemic species
A racemic species can exist as racemic conglomerates, racemic compounds or
pseudoracemates. In order to choose the suitable resolution method, it is essential to
determine the type to which the crystalline racemate belongs (Collet et al., 1980; Jacques
et al., 1994; Li et al, 1999). There are mainly two different kinds of techniques used to
identify the racemic species, namely thermal analysis and structural studies by
spectroscopy.
17
The binary melting point phase diagram or ternary phase diagram with solvent is
widely used to determine the characteristic of racemic species. The first to characterize
racemic species by their phase diagrams was Roozeboom (1899). Roozeboom identified
the three fundamental types of the binary melting point phase diagrams: a racemic
conglomerate, a racemic compound and a pseudoracemate. Subsequently, various thermal
analysis techniques have been applied to construct binary melting point phase diagram,
but Differential Scanning Calorimetry (DSC) and Differential Thermal Analysis (DTA)
are the most popular instruments used today (Collet et al., 1980; Jacques et al., 1994; Li et
al., 1999; Lorenze et al., 2002). Coquerel (2000) had a comprehensive review on binary
phase diagrams of chiral systems considering also reversible transitions which may occur
between condensed phases such as polymorphism, reversible decomposition of racemate.
Based on the Schroder-Van Laar or Prigogine-Defay equations (Prigogine and
Defay, 1954), all the required features of binary phase diagrams of conglomerates and of
true racemates, or even of diastereomer mixtures exhibiting eutectics, can be calculated
out. This has been known for long time but not much applied because of the difficulty of
measuring heats of fusion, especially on small samples (Wilen et al., 1977). The
introduction of DSC has changed this situation. To calculate the differences in the
thermodynamic quantities between a racemic compound and its corresponding racemic
conglomerate, Jacques et al. (Collet et al, 1980; Jacques et al., 1994) developed a
thermodynamic approach by using thermodynamic cycles. Li et al. (1999) modified this
approach and applied to circa 25 chiral pharmaceuticals. These differences were even
considered as ways to reveal the driving force for the formation of racemic compound
versus a racemic conglomerate or a pseudoracemate.

18
On the other hand, it is not unusual that the racemic species exist as a metastable
racemic compound or as a racemic conglomerate (Collet et al., 1980; Brock et al., 1991;
Li and Grant, 1997; Houllemare-Druot and Coquerel, 1998). Sometimes the reversible
transitions may occur between condensed phases such as polymorphism, reversible
decomposition of racemate (Coquerel, 2000; Dufour et al., 2004). In this case,
examination of binary phase diagram alone is not adequate to identify them. Comparison
of solid state spectra of pure enantiomer and its racemate is necessary to identify or prove
the solid nature of racemic species. These structural differences usually come from X-ray
diffraction patterns or from spectroscopic techniques such as infrared (IR), Raman and
solid-state NMR (Collet et al., 1980; Jacques et al., 1994; Li et al., 1999). All properties of
conglomerate crystals are independent of chirality, which means that their densities,
specific heats, refractive index etc. are identical for the enantiomers and the racemic
mixture; while this identity does not exist with racemic compounds and pseudoracemates.
Therefore, the comparison of IR/Raman or XRD spectra of enantiomers and of the
corresponding racemate in the solid state will provide an excellent test to identify the
nature of the racemic species (Jacques et al., 1994). The spectra of enantiomers are
identical to that of a racemic conglomerate but different from that of a racemic compound.
The X-ray diffraction of a powdered sample is analyzed to determine the long
range order of the crystal lattice (the distance between two adjacent planes within a crystal
lattice can be determined). A spectroscopic technique such as solid-state infrared or
Raman spectroscopy is used to determine differences in the short range order of the
samples (due to different relative arrangement of the molecules within the lattice different
vibration modes are caused). Solid-state 13C nuclear magnetic resonance spectroscopy is

19
also used to diagnose the difference in the arrangement of pure enantiomer molecules in
the crystal lattice for different racemic species (Jacques et al, 1994; Li et al., 1999).
The above mentioned techniques have been extensively used to characterize
racemic species (Collet et al., 1980; Bettinetti et al, 1990; Dwivedi et al, 1992; Coquerel
and Petit, 1993; Neau et al, 1993; Jacques et al., 1994; Miyazaki et al., 1994; Prankerd and
Elsabee, 1995; Kommuru et al, 1998; Pena et al, 1998; Gervais and Coquerel, 2002;
Lorenz and Seidel-Morgenstern, 2002; Shiraiwa et al., 1992, 1994, 1996, 1997, 1998,
2002, 2003, 2005). Coquerel’s group also has shown that the family of 5-alkyl-5-
arylhydantonins exhibits a very high frequency of conglomerates (Coquerel and Petit,
1993; Gervais and Coquerel, 2002).
Another approach for studying enantiomeric interactions in the solid state is
molecular modelling. A molecular modelling study with lattice energy calculation was
explored to look for the factors of chiral discrimination in the crystalline state (Li et al.,
2001). The results might explain that why salt forms favour the formation of racemic
conglomerate (Collet et al., 1980, Jacques et al., 1994). Leusen et al. (1993; 2003) and
Gervais (Gervais and Coquerel, 2002) also tried crystal structure prediction of
diastereomeric salts which could be a step toward rationalization of racemate resolution.
2.4 Solubility and metastable zone
2.4.1 Solubility of enantiomers
Solubility data (solid-liquid equilibrium) is the prerequisite for crystallization from
solution. The knowledge and use of solubility properties of enantiomer mixtures is not
only a matter of theoretical interest, but also allows one to carry out resolutions in a more
rational manner than usually obtainable (Jacques et al., 1994).

20
For a conglomerate, Meyerhoffer (1904) first rationalized the “double solubility”
rule which means that a conglomerate has a solubility equal to the sum of the solubilities
of the corresponding enantiomers. The non-ideal (dissociation/association) effects were
analyzed and a good agreement was obtained between the experimental data and the
foregoing theoretical considerations (Collet et al., 1980). They also derived the favourable
conditions for preferential crystallization from ternary phase diagram (Collet et al.,1980;
Jacques et al., 1994). If the solubility ratio α of racemic mixture to enantiomer is less than
2, the resolution process is more favourable. A similar conclusion was drawn by Watanabe
and Noyori (1969) with the industrial-scale resolution of glutamic acid. The ternary phase
diagram was also used widely to describe preferential crystallization process (Collet et al.,
1980; Elsner et al., 2005). Unlike conglomerate, no matter whether solvation is present or
not, the solubility of the racemic compound is not related to that of the enantiomers. The
solubility can be either higher or lower (Jacques et al., 1994). There have been only few
literatures reported on the influence of solvent and the interactions in solution between
enantiomers (Druot et al., 1996; Profir and Rasmuson, 2004).
2.4.2 Metastable zone width
The metastable zone width (MSZW) is a critical parameter in the crystallisation
process as it allows an insight into the nucleation behaviour of the system (Mullin, 2001;
Teja and Rousseau, 2004). It was Ostwald that first proposed the terms “labile” (unstable)
and “metastable” supersaturation, referring to supersaturated solutions in which
spontaneous deposition of solid phase, in the absence of solid nuclei, will or will not
occur, respectively (Ostwald, 1897). The metastable zone was later divided into the first
and the second areas (Ting and McCabe, 1934).

21
A number of factors influence the value of MSZW including the rate of cooling,
agitation, the presence of foreign particles and impurities (Young and Van Sicklen, 1913;
Nyvlt et al, 1985). Many efforts have been reported to express the metastable zone width
with certain parameters as semiempirical relationships (Nyvlt et al., 1970; Sohnel and
Nyvlt, 1975; Kim and Ryu,1997, Ulrich and Strege,2002). Polythermal method is widely
used to measure MSZW (Nyvlt, 1968; Nyvlt et al., 1970; Sohnel and Nyvlt, 1975; Mullin
and Jancic,1979; Kim and Ryu, 1997, Mullin, 2001). Experimental values of the
metastable zone width for a given system depend very strongly on the method of
determination. The onset of nucleation can be detected visually or instrumentally. Various
instrumental techniques have been employed to detect the onset of nucleation, e.g.
electrozone sensing, optical turbidity, laser diffraction or scattering etc (Mullin and Jancic,
1979; Gerson et al, 1991; Barrett and Glennon, 2002; Barrett et al, 2005). Among these
methods, Focused Beam Reflectance Measurement (FBRM) is a recently available
technique. The advantage of FBRM method is that it does not depend on the presence of a
threshold nuclei concentration before a nucleation event is detected (Sparks and Dobbs,
1993; Tadayyon and Rohani, 1998; Barrett and Glennon, 1999, 2002; Barrett et al, 2005).
A simplified model based on integral growing of nucleus in nucleation was introduced to
predict the metastable zone width (Mersmann and Bartosch, 1997; Kim and Mersmann,
2001).
Although metastable zone width is very useful in understanding the crystallization
process in chiral resolution, not much attention has been paid on the measurement and
interpretation of MSZW in the enantiomeric systems. Hongo et al. (1981) identified the
metastable region into two areas where the second one was more unstable. The
dependence of MSZW on the enantiomeric excess was reported in the compounds of
22
mandelic acid (Perlberg A et al., 2002, 2003). Metastable zone widths were measured for
establishing a basis for growth kinetics investigations via isothermal seeded batch
experiments in the chiral system mandelic acid/water (Perlberg et al., 2005). Ching’s
group recently started a series of characterization of MSZW of both conglomerate and
racemic compound systems (Wang et al., 2002, 2003, 2004, 2006; Lu and Ching, 2006).
2.5 Enantiomeric resolution by direct crystallization
As introduced before, the classical resolution via diastereoisomer crystallization is
making use of the solubility difference of the diastereoisomers. If the racemate is a
conglomerate, although the solubilities are almost the same for the two isomers, it is still
possible to separate the two enantiomers by direct crystallization from their mixtures.
Separation of enantiomers via direct crystallization is the more attractive option as no
derivatization or reaction of the starting material is required. There are basically two kinds
of resolution methods, namely simultaneous crystallization and preferential crystallization.
Collet et. al (1980,1994 ) had a great review on this subject.
2.5.1 Simultaneous crystallization
This method makes use of the advantages of the spontaneous resolution of the two
enantiomers for a racemic conglomerate. Louis Pasteur (1848) was apparently the first
person to pioneer this area in 1848. He successfully separated the dextrorotatory and
levorotatory crystals constituting the racemic double salt sodium ammonium tartrate by
manual sorting (Pasteur, 1848; Kauffman and Myers, 1975). This laborious technique is
now only occasionally used to collect the first crystals of enantiomer required to apply the
technique of resolution by entrainment. Other variants of this technique include
23
localization of crystallization of individual enantiomers on suitably disposed seeds in a
supersaturated racemic solution (Zaugg, 1955), fluidized bed system (Sato, et al., 1969;
Brugidou et al., 1974; Dolling et al.,1978). Dowling (1959) reported an ingenious
resolution procedure through seeding of a racemic supersaturated solution with relatively
large seeds of one enantiomer in the purification of glutamic acid salts and this procedure
was later applied to acetylglutamic acid (Watanabe and Noyori, 1969). This method has
been used in the preparation of α-methyl-L-dopa and for the C3-synthon glycidyl-3-
nitrobenzenesulfonate etc (Merck, 1965; Challener, 2001).
2.5.2 Preferential crystallization
Preferential crystallization is also called resolution by entrainment. It is mainly
dependent on the differences in the rates of crystallization of the enantiomers in a solution
supersaturated with respect to the racemate.
The first example to show the way of resolution by entrainment was reported by
Gernez (Collet et al., 1980) who got only dextrorotatory crystals when he seeded the
supersaturated solution of the double salt sodium ammonium racemate with a particle of
dextrorotatory salt. Jungfleisch (Collet et al., 1980) confirmed the similar observations,
but this method was ignored for a long time until 1914 that Werner (1914) rediscovered
the same phenomenon in the cobalt bromide system. Surprisingly, this discovery was
again forgotten for almost two decades until 1934 that Duschinsky showed the efficiency
of resolution by preferential crystallization of histidine monohydrochloride (Duschinsky,
1934). From then onwards, this technique began to get attention of chemists and
especially those in industry.
The process of enantiomer separation by preferential crystallization is visualized

24
best in the ternary phase diagram of the two enantiomers (D and L) and solvent (S).
Figure 2.2 Preferential crystallization in the ternary phase diagram (Jacques et al., 1994)
As shown in Figure 2.2, the solubility of the enantiomer mixture in the solvent is
given by the line A’EA. For starting the process a racemic solution is enriched artificially
by adding a pure enantiomer or a partially resolved solution obtained by a different
method. The solution is cooled until it is slightly supersaturated (1). Subsequently pure
seed crystals of the more abundant enantiomer (L in this case) are added, as a result the L-
enantiomer starts to crystallize. Crystallization of the other enantiomer does not take place
if the seed crystals show a selective effect (no suitable nuclei inducing crystallization of
the opposite enantiomer is present in the solution and the degree of supersaturation is not
sufficient for nucleation to take place). The concentration of the more abundant

25
enantiomer (L) in solution decreases (1→2). Crystals are collected from the solution when
the enrichment by the opposite enantiomer (D in this case) has reached the same value as
in the initial solution (2). The same amount of crystalline racemate as collected as crystals
is added to the solution. Subsequently the temperature is increased to dissolve the
additional racemate (not shown in Figure 2.2). After cooling to the operation temperature
seed crystals (pure D-enantiomer) are added to the (slightly supersaturated) solution (3).
Crystallization (3→4) yields pure D-enantiomer and a solution enriched by the L-
enantiomer (4). Dissolving of racemate and cooling to the operation temperature the initial
solution (1) is attained and the process can be repeated.
The first preferential crystallization process was commercialized by Merck (1965)
to produce α-methyldopa. It has been used in the synthesis of chloramphenicol and
intermediates for benzothiazepines (Collins et al., 1997; Challener, 2001). In some cases,
direct crystallization occurs simultaneously with spontaneous in-situ racemization of the
enantiomer that remains in excess in the solution, for example, the preferential
crystallization of 1,4-benzodiazepene derivatives. This crystallization occurs with
spontaneous racemization in solution at room temperature and one enantiomer crystallizes
in 75% yield (Hongo et al., 1983; Murakami et al, 1992, 1993; Sheldon, 1993). In spite of
the limitations of this method, the preferential crystallization process still has great
potential and real economic importance in both the pharmaceutical and chemical
industries. It is not only applied to resolution of racemic conglomerates but also possible
to purification of partially resolved racemic compounds which are prepared by other
methods (Lim et al, 1995; Lorenz et al., 2001; Wibowo and O’Young, 2005).
By 1980s, circa 250 conglomerates had been identified (Jacques et al., 1994). So
far about 5-10% of chiral compounds have been reported as conglomerates (Jacques et al.,

26
1994; Collet, 1999). To date, a lot of efforts are still being put in the inventory of
enantiomer mixtures that exist as conglomerates and the preferential crystallization are
applied in the resolution. Among these, Shiraiwa’s group has extensively screened for
racemic amino acids and other compounds (Shiraiwa et al., 1992, 1994, 1996, 1997, 1998,
2002, 2003, 2005;Miyazaki et al., 1994). Coquerel’s group also has shown that the family
of 5-alkyl-5-arylhydantonins exhibits a very high frequency of conglomerates (Coquerel
and Petit, 1993; Gervais et al., 2002).
2.5.3 Mechanism of preferential crystallization
As mentioned by Jacques et al. (1980, 1994), the application of preferential
crystallization requires the mastery of the factors that control the rate of crystallization.
These factors include the properties of the ternary phase diagram itself and the
experimental character such as stirring and seeding etc. Duschinsky (1934) first
investigated the resolution mechanism using histidine monohydrochloride. A more
systematic search was later conducted by Amiard’s group (Velluz and Amiard,
1953;Velluz et al., 1953; Amiard, 1956; Amiard, 1959) on the resolution of threonine and
thero-p-nitrophenyl-2-amino-1,3-propanediaol and accordingly the concept of residual
supersaturation and the definition of entrainment of crystallization was introduced.
As mentioned before, the solubility ratio α of racemate to enantiomer in solutions
is crucial for the preferential crystallization process (Watanae and Noyori,1969; Collet et
al.,1980). A smaller solubility ratio α of racemate to enantiomer will result in a more
favourable preferential crystallization operation. This has led to systematic search of
dissociable derivatives by combining substrates to be resolved with a variety of achiral
reagents (Yamada et al., 1973, 1975) as it is more possible to find a ratio α that is less than
27
2 in salts than organic compounds. In the optical resolution of (±)-N-acylnorfenfluramine
derivatives, the preferential crystallization under isothermal conditions failed primarily
due to unfavourable solubility ratio α (Coquerel et al., 1990). A molecular modelling study
based on lattice energy calculations was explored later to explain this phenomenon (Li et
al., 2001). Leusen et al (1993, 2003) also tried crystal structure prediction of
diastereomeric salts which could be a step toward rationalization of racemate resolution.
Factors such as metastable supersaturation, seeding and stirring etc. were also
discussed by Collet et al.(1980). A good example is the industrial-scale resolution of
glutamic acid hydrochloride with ultrasonic irradiation to produce large number of
optically pure microcrystalline seeds (Merck, 1965).
From the processes and phenomenon of purity decrease during the optical
resolution of DL-threonine by preferential crystallization, it was found that onset of the
purity decrease was strongly related to the consumption of the supersaturation of the
crystallizing enantiomer (L-threonine) and to the surface morphology changes of the seed
crystals (Matsuoka et al., 1990,1997; Profir and Matsuoka, 2000).
Perez-Garcia and Amabilino (2002) had a detailed review on the spontaneous
resolution under supramolecular control. The non-covalent interactions were discussed in
explaining the transfer of chirality from molecule to bulk and in particular the spontaneous
resolution of enantiomers. The mechanism of an unusual enantiomeric resolution
phenomenon caused by polymorphic transition during crystallization of mixed crystals
composed of two enantiomers were studied and a mechanism of preferential enrichment
was proposed based on the unique polymorphism of the compounds , their metastable and
stable crystal structures, the association mode and the aspects of polymorphic transition
etc. (Tamura et al., 2002).
28
The effect of unstable racemic compound on the performance of preferential
crystallization of α-methylbenzylamine chloroacetate was investigated and various routine
tests were recommended to avoid derivatives which may possibly give the unstable
racemic compound (Houllemare-Druot and Coquerel, 1998). A later study by the same
group showed the similar impact on the resolution of chiral acids and bases (Dufour et al.,
2001). The limited entrainment effect observed with Pasteur salt was found consistent
with the presence of a metastable racemic compound (Petit and Coquerel, 2003). In the
preferential crystallization of (±)-ephedrine and (±)-mandelic acid, not only this kind of
unstable compound was found, a new polymorphic form was also reported to contribute to
the limited entrainment effect (Dufour et al., 2004). A rare temperature-dependent racemic
compound-conglomerate crystallization of 2,3:6,7-dibenzobicyclo[3.3.1]nona-2,6-diene-
4,8-dione was studied in detail and it was found that higher temperature induced the
formation of conglomerate (Levkin et al.,2003).
The combined effect of polymorphism and process on preferential crystallization
with (+/-)-5(4’-methylphenyl)-5-methylhydantoin was investigated and the genuine
impact of polymorphism was highlighted (Courvoisier et al., 2003). The AS3PC
programme, stable polymorph and pre-treatment of the solid particles were recommended
to achieve the best results in terms of robustness, yield and scale-up. Effect of the
polymorphic form of the seeds on the preferential crystallization was also discussed with
5(4'-methylphenyl)-5-methyl-hydantoin (Courvoisier et al., 2001).
2.5.4 Preferential crystallization process
In the application of preferential crystallization process, the conventional method
is conducted under isothermal condition (Jacques et al., 1994). The saturated solution is
29
cooled to the target temperature, seed is added in the supersaturated solution, keep the
solution for a time period and finally the crystals are filtrated out. This approach is called
as Classical Seeded Isothermal Preferential Crystallization (SIPC) programme by
Coquerel’s group (Coquerel et al., 1995). As mentioned before, it was found that such
isothermal method was not suitable for the preferential crystallization where solubility
ratio α is bigger than 2 (Coquerel et al., 1990). Subsequently, an Auto Seeded
Programmed Polythermic Preferential Crystallization (AS3PC) was proposed and applied
to the preferential crystallization (Coquerel et al., 1995; Ndzie et al., 1997; Beilles et al.,
2001; Courvoisier et al., 2001, 2002; Dufour et al. 2001; Wermester et al., 2005). The
influence of the process on the mechanisms and the performances of the preferential
crystallization were investigated with (+/-)-5-(4-bromophenyl)-5-methylhydantoin
(Courvoisier L et al., 2001). More than 25 different molecules have been tested by using
this programme. AS3PC process was found more efficient than SIPC process for purity,
yield, scale-up and filtration.
More recently, Elsner et al. (2005) presented an interesting investigation of
preferential crystallization with focus on aspects of quantification and application using
simplified mathematical description. The optimal initial conditions for isothermal
preferential crystallization were also tried in this group (Angelov, et al., 2006). The amino
acid threonine was used as model system to analyze the isothermal single step
crystallization experiments. Some preliminarily satisfying agreement was shown but
further model improvement and more detailed experimental works are necessary. An
optical resolution technique by natural cooling crystallization combined with pulse heating
was proposed, in which a "tailor-made" additive was used as a separation agent in the
purification of asparagine to improve the optical purity (Doki et al., 2004). On-line
30
polarimetry (Rodrigo et al., 2004) in combination with measurements of an on-line density
meter was attempted to monitor the resolution process.
From the system engineering perspective, Ng et al. (Berry and Ng., 1997; Wibowo
and Ng, 2000; Schroer, et al. 2001) had studied the synthesis of chiral crystallization
processes by considering the separation steps in the flowsheet as movements on phase
diagrams. Ching’s group (Lim et al., 1995) attempted the recovery of praziquantel from
racemic mixture by continuous chromatography and crystallization. A systematic
procedure has been recently presented for the synthesis of chromatography-crystallization
hybrid separation processes (Fung et al., 2005). An approach that couples equilibrium
phase behavior and kinetics was proposed for the design of chiral crystallization
processes. A generic model that accounts for reaction, as well as crystal nucleation,
growth, and dissolution kinetics was developed (Schroer and Ng, 2003).
2.6 Chiral nucleation
Preferential crystallization is normally conducted with seeding. In the seeded
crystallizer, secondary nucleation plays an important role and the mechanism has been
well studied by experiments with single crystal seeds (Clontz and McCabe, 1971; Denk
and Botsaris, 1972; Rousseau et al., 1975, 1976) and in suspension crystallizers (Evans et
al., 1974; Qian et al., 1987, 1989; Randolph and Larson, 1988). An embryo-coagulation
secondary nucleation (ECSN) mechanism was also proposed to explain some unusual
observations and phenomenon (Qian and Botsaris, 1996, 1997). In the nucleation
experiments conducted with chiral NaClO3, at low supercoolings, almost all the nucleated
crystals had the same chirality as the seed. Above a certain supercooling, however,
crystals of both chiralities were obtained (Denk and Botsaris, 1972; Kondepudi et al.,

31
1990, 1993, 1995, 1998; McBride and Carte, 1991; Yokota and Toyokura, 1992; Qian and
Botsaris, 1997, 1998). Davey et al. (1990) also showed the similar findings in
triazolylketone chiral crystallization. This transition was thought consistent with the
ECSN mechanism (Qian and Botsaris, 1998). It was argued that the origin of the nuclei
was the solution layer next to the crystal and the van der Waals forces, which brought the
embryos close to the seed were non-discriminating. Therefore, embryos of both chiralities
were thought attracted by and concentrated around the seed and their coagulation could
produce nuclei of either chirality.
In a later study, it was also found that this phenomenon could be related with the
way that the seed crystals were prepared (Qian and Botsaris, 2004). The primary
nucleation was also investigated by the same group with the same system (Botsaris et al.,
1999). Their experiments with spontaneous crystallization by air bubbling supported the
idea of a single progenitor in cases of spontaneous nucleation by cooling. It was also
pointed out that in many processes that are perceived as cases of primary nucleation, only
one crystal is actually generated primarily and all the others are bred from it by secondary
nucleation.
Kondepudi et al. (1990, 1993, 1995, 1998) have outlined an explanation for the
production of one-chirality crystals based on the physical nucleation model. They
introduced the idea that a parent crystal can breed secondary nuclei only when it reaches a
minimum size. The stirring effects on this phenomenon were also discussed (Mcbride and
Carter, 1991).
The effect of supersaturation degree on the optical purity was reported as early as
1950 in the system of β-phenylglyceric acid (Furberg and Hassel, 1950). Very low
supersaturation was required to get high purity. Another typical example is in the

32
synthesis of agrochemical paclobutrazol where resolution of a racemic chiral ketone is
involved (Black et al., 1989; Collins et al., 1997). Only when very low supersaturation (1
oC undercooling) was used, did the effects of nucleating the unwanted isomer disappear to
give the product with a high optical purity. It was suggested that if high supersaturations
within the metastable zone are used, some conglomerates will form crystals that contain
domains of both lattices in a single crystal, which means that the enantiomerically pure
seed could nucleate the other enantiomer at its surface.
The stability of supersaturation in the preferential crystallization process was first
quantitatively described in the optical resolution of DL-serine-4-sulfonate dehydrate in the
early 1980s (Hongo et al., 1981). The metastable region was divided into the first and the
second metastable regions. The first region was the one where the supersaturation degree
was lower than a constant value and no spontaneous crystallization of the unseeded isomer
was observed. The second metastable region was the one where the supersaturation was
stable for only a certain time and spontaneous crystallization was ready to take place.
Consequently, the waiting time for the spontaneous crystallization of the unseeded isomer
was predicted by a conventional calculation method (Hongo et al., 1981).
For the effects of additives in the chiral nucleation, Weissbuch et al. (2003) had a
good review. The delicate interplay between stereochemical control, monitoring at the
subnanometer level, and an understanding of crystal nucleation were probed. The effects
of chiral additive and wetting agent in the preferential crystallization of (+/-)-5-ethyl-5-
methylhydantoin were experimentally studied in Conquerel’s group (Ndzie et al., 1999;
Beilles et al., 2001). Some salts have been used to stabilize the supersaturated solution in
the optical resolution (Soichiro, 1983; Harada et al., 1986).

33
2.7 Crystallization kinetics
Crystal growth and nucleation kinetics are the basis of modelling, design and
operation of a crystallizer. There are two basic categories of techniques to evaluate
crystallization kinetics, namely, steady state method and dynamic method. For the former
one, the most famous is the classical continuous method proposed by Randolph and
Larson (1988) with mixed-suspension, mixed-product-removal (MSMPR) crystallizer.
Dynamic method is an alternative approach for the estimation of kinetics using
unsteady-state data from batch experiments. Various dynamic techniques have been
reported with batch crystallizations. These include thermal response technique (Omran
and King, 1974) and mass balance approach (Garside et al., 1982; Halfon and Kaliaguine,
1976). But most of the proposed methods using batch crystallization process are based on
crystal size distribution (CSD) analysis (Garside and Jancic, 1976; Way, 1985; Tavare and
Garside, 1986; Nyvlt, 1989; Witkowski et al., 1990; Qiu and Rasmuson, 1991, 1994;
Farrell and Tsai, 1994; Yokota et al., 2000; Garside et al., 2002; Zhang and Rohani, 2003;
Hu et al., 2004). These include moment method (Tavare and Garside, 1986), nonlinear
optimization algorithm (Nyvlt, 1989; Witkowski et al., 1990; Qiu and Rasmuson, 1991,
1994; Farrell and Tsai, 1994; Yokota et al., 2000; Zhang and Rohani, 2003; Hu et al.,
2004) and s-plane analysis (Tavare and Garside, 1986). The details will be discussed in
Chapter 6.
For chiral crystallization, only Elsner et al. (2005) recently attempted to use
moment method to determine crystallization kinetics of L-/D-threonine in water with
difficulty in nucleation rate prediction.
2.8 Optimal operation of batch crystallization

34
Many works have been reported to show the benefits of controlling the
supersaturation in batch crystallization (Mullin and Nyvlt, 1971; Jones and Mullin 1974;
Rohani and Bourne, 1990). These benefits include larger crystals and narrower crystal size
distribution. This means product purity could be improved in the filtration and washing
process (Mersmann, 1995; Matthews and Rawlings, 1998), which is especially important
for chiral purification (Courvoisier et al, 2003).
Numerous efforts have been put on optimal operation of batch crystallizer. Mullin
and Nyvlt (1971), Jones (1974), and Jones and Mullin (1974) did the pioneer work both
theoretically and experimentally. Mayrhofer and Nyvlt (1988) dealt with a general
derivation of a theoretical cooling curve of a batch crystallizer. Rohani and Bourne (1990)
derived a simplified optimal cooling curve by assuming constant nucleation and
supersaturation. Various objectives have been chosen to optimize batch crystallization,
such as mean crystal size and coefficient of variation (Chianese et al., 1984; Choong and
Smith, 2004; Costa and Maciel Filho, 2005), seed ratio (Bohlin and Rasmuson, 1992;
Mathews and Rawlings, 1998; Chung et al., 1999) and even shape (Ma et al., 2002). The
newly developed on-line monitoring and controlling techniques greatly facilitate these
investigations (Barrett and Glennon, 2002; Elsner et al., 2005).
2.9 Summary
The application of direct crystallization, particularly preferential crystallization, in
the enantiomeric separation of pharmaceuticals and fine chemicals has become
increasingly important from both practical (clinical/environmental etc.) as well as
economic (cost/efficiency etc.) viewpoint. However, most of the past studies are focused
on the chemistry aspects and the thermodynamic behaviours of solid phases. Little
35
attention has been given to the crystallization process itself from the system engineering
perspective. Both the previous studies on chiral nucleation and unstable metastable zone
and the implications of crystal habits control suggest that supersaturation plays a crucial
role in preferential crystallization process. The philosophy of the present work was to
develop a systematic engineering approach to study preferential crystallization, especially
on the metastable zone measurement and interpretation, and application of critical
supersaturation control in the optical resolution. Accordingly, the preferential
crystallization was investigated from system characterization and thermodynamics, to
metastable zone and chiral nucleation analysis and crystallization kinetics determination,
and finally to the process modelling, optimal operation and in-situ monitoring.
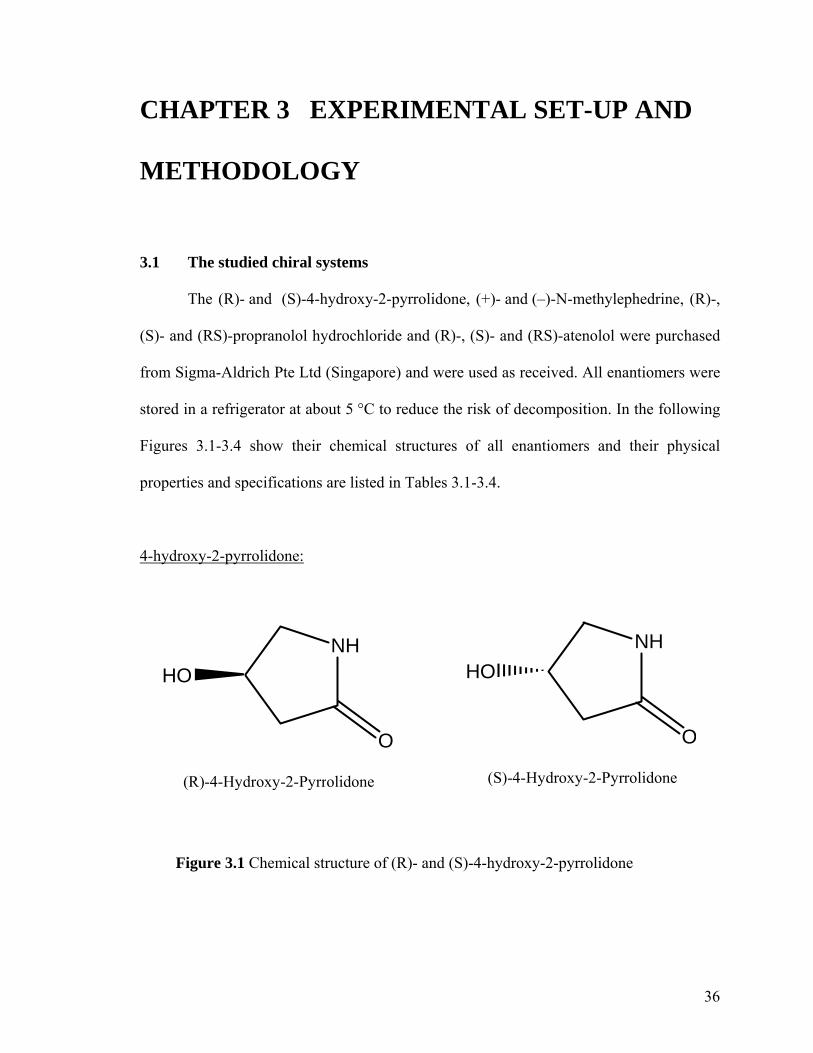
36
CHAPTER 3 EXPERIMENTAL SET-UP AND
METHODOLOGY
3.1 The studied chiral systems
The (R)- and (S)-4-hydroxy-2-pyrrolidone, (+)- and (–)-N-methylephedrine, (R)-,
(S)- and (RS)-propranolol hydrochloride and (R)-, (S)- and (RS)-atenolol were purchased
from Sigma-Aldrich Pte Ltd (Singapore) and were used as received. All enantiomers were
stored in a refrigerator at about 5 °C to reduce the risk of decomposition. In the following
Figures 3.1-3.4 show their chemical structures of all enantiomers and their physical
properties and specifications are listed in Tables 3.1-3.4.
4-hydroxy-2-pyrrolidone:
NH
O
HO
(R)-4-Hydroxy-2-Pyrrolidone
NH
O
HO
(S)-4-Hydroxy-2-Pyrrolidone
Figure 3.1 Chemical structure of (R)- and (S)-4-hydroxy-2-pyrrolidone

37
Table 3.1 Properties and specifications of 4-hydroxy-2-pyrrolidone
Name (R)-4-Hydroxy-2-Pyrrolidone (S)-4-Hydroxy-2-Pyrrolidone
Synonyms (R)-β-Hydroxy-γ-butyrolactam (S)-β-Hydroxy-γ-butyrolactam
Molecular Formula C4H7NO2 C4H7NO2
Molecular Weight 101.1 g/mol 101.1 g/mol
Melting Point 156-160 °C 156-160 °C
Purity Puriss. ≥ 99.0% (GC, sum of
enantiomers)
Puriss. ≥ 99.0% (GC, sum of
enantiomers)
Optical rotation [α]D20=+41±3° (c=1 in EtOH) [α]D
20=-41±3° (c=1 in EtOH)
Optical rotation [α]54620=+50±3° (c=1 in EtOH) [α]546
20=-50±3° (c=1 in EtOH)
4-hydroxy-2-pyrrolidone is a versatile chiral intermediate for the synthesis of
many biological active compounds. Examples are the drugs (R)-γ-amino-β-hydroxybutyric
acid (GABOB), which is an antiepileptic agent (Aubé et al., 1991), (R)-carnitine
(vitamin BT) and 4-hydroxy-2-pyrrolidone acetamide (oxiracetam), which is a nootropic
(acting selectively on the cerebral cortex) agent used in the treatment of amnesic condition
(Di Silvestro et al., 1993; Huang et al., 1999). One of the enantiomers could be isolated
from the European fly agaric (Amanita muscaria (L. ex. Fr.)), but the amount contained in
the mushroom is very low (Matsumoto et al., 1969).
N-methylephedrine:
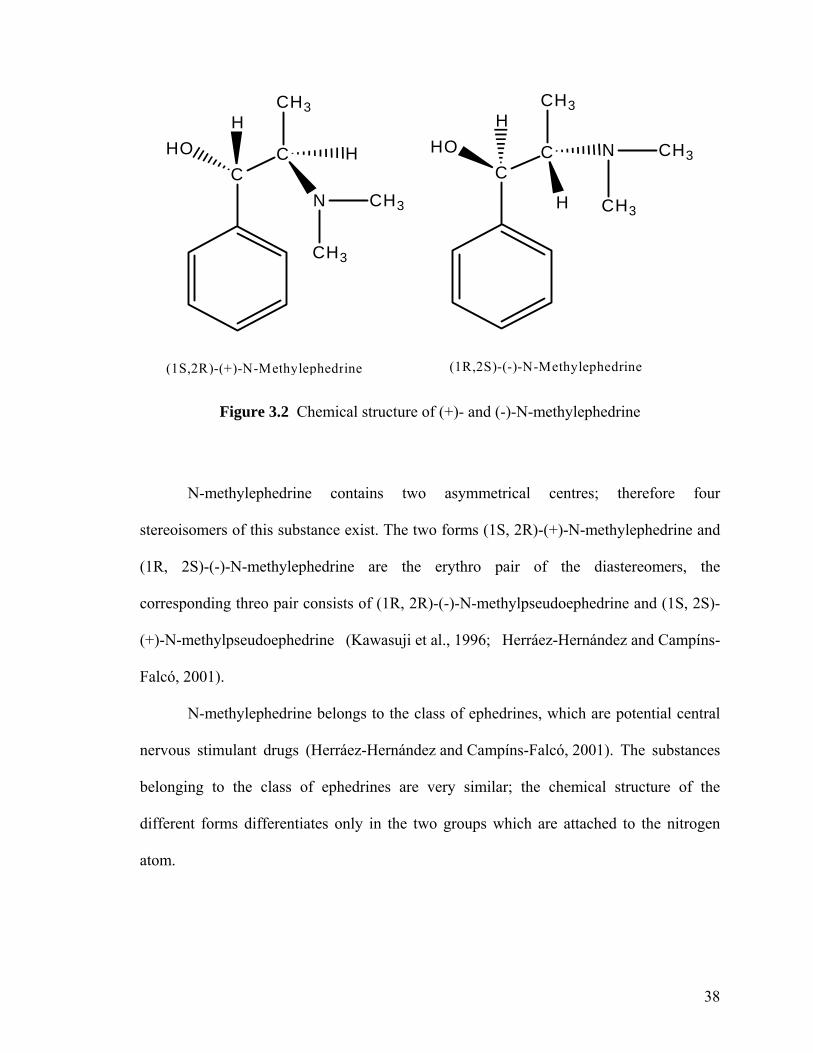
38
CHO
H
C
CH3
H
N
CH3
CHO
H
C
CH3
H
N
CH3
(1S,2R)-(+)-N-Methylephedrine (1R,2S)-(-)-N-Methylephedrine
CH3
CH3
Figure 3.2 Chemical structure of (+)- and (-)-N-methylephedrine
N-methylephedrine contains two asymmetrical centres; therefore four
stereoisomers of this substance exist. The two forms (1S, 2R)-(+)-N-methylephedrine and
(1R, 2S)-(-)-N-methylephedrine are the erythro pair of the diastereomers, the
corresponding threo pair consists of (1R, 2R)-(-)-N-methylpseudoephedrine and (1S, 2S)-
(+)-N-methylpseudoephedrine (Kawasuji et al., 1996; Herráez-Hernández and Campíns-
Falcó, 2001).
N-methylephedrine belongs to the class of ephedrines, which are potential central
nervous stimulant drugs (Herráez-Hernández and Campíns-Falcó, 2001). The substances
belonging to the class of ephedrines are very similar; the chemical structure of the
different forms differentiates only in the two groups which are attached to the nitrogen
atom.
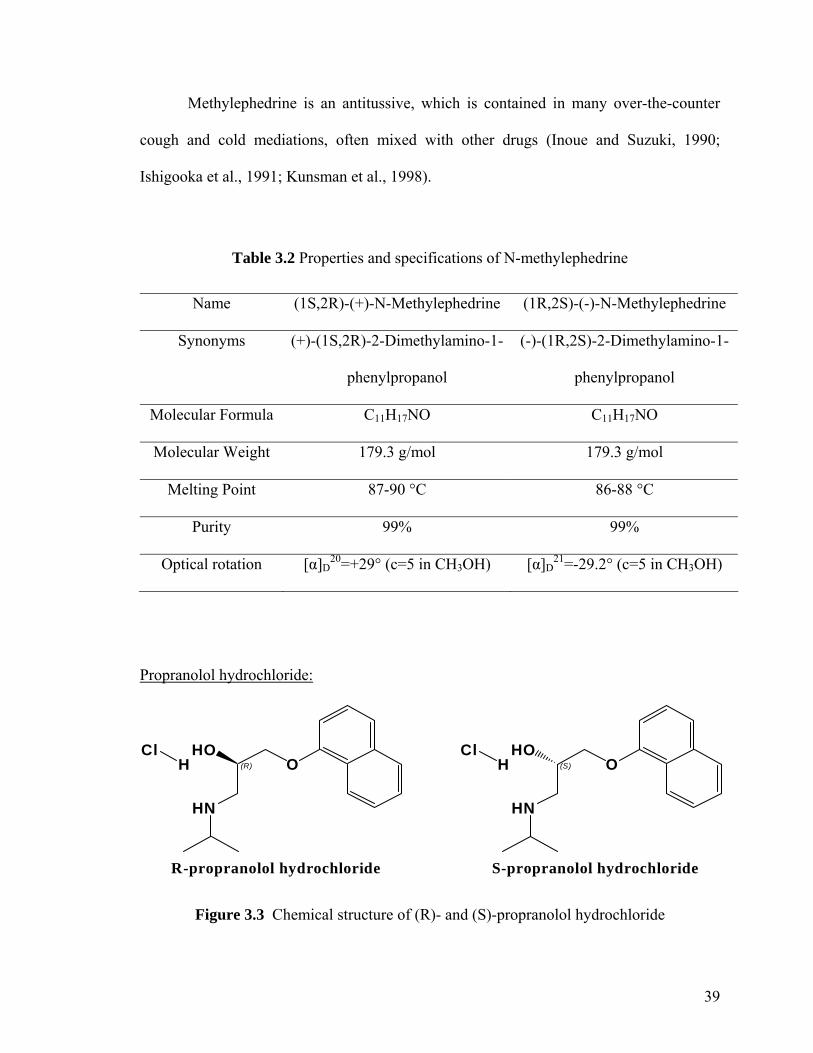
39
Methylephedrine is an antitussive, which is contained in many over-the-counter
cough and cold mediations, often mixed with other drugs (Inoue and Suzuki, 1990;
Ishigooka et al., 1991; Kunsman et al., 1998).
Table 3.2 Properties and specifications of N-methylephedrine
Name (1S,2R)-(+)-N-Methylephedrine (1R,2S)-(-)-N-Methylephedrine
Synonyms (+)-(1S,2R)-2-Dimethylamino-1-
phenylpropanol
(-)-(1R,2S)-2-Dimethylamino-1-
phenylpropanol
Molecular Formula C11H17NO C11H17NO
Molecular Weight 179.3 g/mol 179.3 g/mol
Melting Point 87-90 °C 86-88 °C
Purity 99% 99%
Optical rotation [α]D20=+29° (c=5 in CH3OH) [α]D
21=-29.2° (c=5 in CH3OH)
Propranolol hydrochloride:
HO
(R)
HN
OHCl
R-propranolol hydrochloride
HO(S)
HN
OHCl
S-propranolol hydrochloride
Figure 3.3 Chemical structure of (R)- and (S)-propranolol hydrochloride

40
Table 3.3 Properties and specifications of propranolol hydrochloride
Name (R)-Propranolol Hydrochloride (S)-Propranolol Hydrochloride
Molecular Formula C16H21NO2·HCl C16H21NO2·HCl
Molecular Weight 295.81 g/mol 295.81 g/mol
Melting Point 193-195 °C 193-195 °C
Purity Puriss. ≥ 99.0% (HPLC, sum
of enantiomers)
Puriss. ≥ 99.0% (HPLC, sum
of enantiomers)
Optical rotation [α]D20=+26±1° (c=1 in EtOH) [α]D
20=-26±1° (c=1 in EtOH)
Propranolol hydrochloride is a synthetic beta-adrenergic receptor blocking agent
widely used in the treatment of hypertension and cardiac arrhythmias (Neau et al., 1993).
Atenolol:
(R)-Atenolol (S)-Atenolol
Figure 3.4 Chemical structure of (R)- and (S)-atenolol

41
Table 3.4 Properties and specifications of atenolol
Name (R)-Atenolol (S)-Atenolol
Molecular Formula C14H22N2O3 C14H22N2O3
Molecular Weight 266.34 g/mol 266.34 g/mol
Melting Point 148-152 °C 148-152 °C
Purity Puriss. ≥ 99.0% Puriss. ≥ 99.0%
Optical rotation [α]25=+16° (c=1 in 1N HCl) [α]25=-16° (c=1 in 1N HCl)
Atenolol is a drug belonging to the group of beta blockers, a class of drugs used
primarily in cardiovascular diseases. Introduced in 1976, atenolol was developed as a
replacement for propanolol in the treatment of hypertension.
Other chemicals:
Analytical and HPLC grade isopropanol, methanol, acetone and hexane were
purchased from Aik Moh Paints & Chemicals Pte Ltd (Singapore) and were used as
received. The ultra pure deionized water was obtained through a Millipore ultrapure water
system (Milli-Q Gradient A10 System).
3.2 Characterization and analysis methods
3.2.1 Differential scanning calorimetry (DSC)
In this work, all differential scanning calorimetry measurements were performed
using a Mettler Toledo DSC822e Module (heat flux DSC), together with the STARe–
software. Samples of 2-7 mg are prepared in standard 40 µl aluminium crucibles using a

42
Mettler Toledo XS205 microbalance. The crucibles were sealed with a perforated cover.
The flow rate of purging gas nitrogen was 40 mL/min. Preceding investigation of samples,
the DSC apparatus was calibrated using a pure indium sample.
3.2.1.1 Analysing the thermogram
Two routines are available for converting the set of DSC experiments (the
experiments for different compositions of the binary mixture) to the binary melting point
diagram. They are the enthalpy/liquid fraction routine (DIN 51004, 1994;
Di Silvestro et al., 1993) and the more commonly used routine where beginning and end
of fusion are determined from the thermogram by means of some characteristic points
(Jacques et al., 1994; Lorenz and Seidel-Morgenstern, 2002).
In this work, determination by characteristic points of the thermogram was used to
evaluate the melting points. A pure substance (e.g. a single enantiomer) was examined
first. Due to the fact that a pure substance melts at a definite temperature, the peak is
narrow and the melting point is determined as the point of intersection of the tangent on
the leading edge of the fusion peak with the baseline. The angle between the leading edge
and the straight line passing through the maximum peak point was recorded as the
correcting angle. If the phase diagram shows a eutectic, two peaks appear in the
thermogram. The first peak marks the beginning of fusion (and therefore the solidus line),
where the first liquid-phase (of eutectic composition) is formed. This peak is followed by
a second one, which is most often diffuse. The same correcting angle as determined for the
pure enantiomer was employed to the peaks of the thermograms for the other
compositions. Therefore, the beginning and end of fusion, which represents the solidus
and liquidus line, respectively, are obtained directly from the thermogram.
43
3.2.2 Powder X-ray diffraction (PXRD)
The wavelength of X-ray lies between 10-12 and 10-8 m, which is the same
magnitude as the distance of two adjacent planes within a crystal lattice. The phenomenon
of diffraction occurs whenever the wavelength of electromagnetic radiation and a
characteristic dimension of interfering matter are of the same magnitude. From the
diffraction pattern the distance of two adjacent planes within the crystal can be determined
if the frequency of the X-ray radiation is known using Bragg’s law
(Atkins and dePaula, 2002). Even if a large crystal without inclusions or other
imperfections is available, measurement of all different crystal faces is difficult, that is
why most often a powder is examined (Powder X-ray diffraction, PXRD). In a powder the
number of particles is big enough, that even with small samples all different orientations
are exposed to the X-ray beam simultaneously. Due to the small size of particles no
orientation will be preferred when the powder is attached to an inert carrier such as paper.
The distances between adjacent planes of different orientation are unique for each
substance and even for different polymorphs of the same substance. That is why a racemic
conglomerate should have the same diffraction pattern as a pure enantiomer, but a
different diffraction pattern than a racemic compound. The depiction of Ewing (1985)
provides information on the instrumentation.
d = λ / (2sinθ) (3.1)
where θ is the diffraction angle.
In this work, the PXRD patterns of both the racemates and pure enantiomers were
determined at room temperature using a Bruker D8 Advance diffractometer with Cu-Kα

44
radiation at 40 mA, 40kV. The samples were packed into an aluminum holder and scanned
with the diffraction angle 2θ increasing from 5-70o, with a step size of 0.02o for 1 sec.
3.2.3 Fourier transform infrared spectroscopy (FT-IR)
In this work, the FT-IR spectra of both the racemates and pure enantiomers were
obtained in the range of 400-4000 cm-1 with a Bio-Rad FTS 135 FTIR spectrometer using
the KBr disk method. The scans were performed with a resolution of 4 cm-1 and the
number of scans was 40. All spectra were collected at ambient temperature.
3.2.4 Raman spectroscopy
Infrared (IR) and Raman spectroscopy both measure the vibrational energies of
molecules. Raman spectroscopy is based on the Raman effect, which is the inelastic
scattering of photons by molecules. Raman spectroscopy complements IR spectroscopy.
For a vibrational motion to be IR active, the dipole moment of the molecule must change.
But for a vibration to be Raman active, the polarizability of the molecule must change
with the vibrational motion. The spectra are plotted with intensity vs. Raman shift in cm-1.
In this work, a Renishaw’s inVia Raman microscope was used. It is with
Renishaw’s WiRE™ 2.0 software and RenCam CCD detector. A 785 nm laser was used
to measure the Raman spectra in the range of 0-2000 cm-1.
3.2.5 Nuclear magnetic resonance (NMR)
Solid state NMR has many potential applications in the characterization of solids
that are largely intractable by other means. 13C spectra show chemical shifts that are more
sensitive to the details of structure than are proton shifts. Differences between structural

45
and stereoisomers can easily be seen. In a powdered crystalline material, all orientations
are present, and the signal observed is a distribution of resonances, hence a relatively wide
peak is seen, whereas the fluidity of a liquid solution ensures that only a single peak is
observable.
In this work, 13C SS-NMR spectra were acquired at 100.613 MHz, using a
CAMPAS DRX 400 spectrometer. Spinning speeds were 8-10 kHz.
3.3 Solubility and metastable zone width measurement
The limit of the metastable zone is also referred to as supersolubility. The
difference in concentration (for constant temperature) or the difference in temperature (for
constant concentration) between a saturated solution and a solution on the limit of the
metastable zone is called metastable zone width or maximal allowed temperature of
supercooling.
Polythermal method was used to measure the solubility and metastable zone width,
using 25 - 500 ml jacketed crystallizers equipped with a magnetic stirrer bar (for small
volume) or an overhead stirrer (for large volume) and a Julabo programmable circulator
FP25-ME (for small volume) or FP88-HL (for large volume). A Lasentec S400A FBRM
(Focused Beam Reflectance Measurement) was used to detect the onset of nucleation and
dissolution. A Lasentec 700 PVM (Particle Vision and Measurement) system was also
integrated into the experiments. The image has a field of view of 860 x 645 um, with
resolution down to approximately 5 um and capturing speed up to 10 images per second.
FBRM and PVM have recently emerged as a widely used technique for the in situ
characterization of particulate slurries.
46
FBRM instrumentation is composed of three parts: a probe which can be installed
directly in the crystallizer without the need for sample dilution or manipulation, the
electronic measurement unit and a computer for data acquisition and analysis (as shown in
Figures 3.5 and 3.6).
FBRM measures a chord length distribution (CLD), which is a function of the
number, size, and shape of particles under investigation. FBRM uses a focused beam of
laser light, which scans in a circular path. As this light scans across a particle or particle
structure passing in front of the probe window, light is scattered in all directions. The light
scattered back towards the probe is used to measure a chord length of the given particle.
Typically, many thousands of chords are measured per second, providing a robust
measurement that is sensitive to the change in the size or number of particles under
investigation. Unlike, for example, optical turbidity or laser diffraction, FBRM does not
depend on the presence of a threshold nuclei concentration before a nucleation event is
detected. This is especially for the current studied chiral system, where the suspension
density is normally very low. A more detailed description of the operation of the FBRM
probe is provided in the literature (Barrett and Glennon, 1999, 2002; Worlitschek and
Mazzotti, 2003; Barret et al., 2005).
FBRM is a useful tool for detecting crystal behaviour during crystallization
processes. It can accurately detect a nucleation event and characterize the metastable zone
width. However, there are a variety of parameters that affect the particle chord length and
count measurements. Some researchers have tried to interpret the FBRM chord length
distribution with respect to an actual particle size distribution (Ruf et al, 2000; Heath et
al., 2002; Worlitschek et al., 2005; Kougoulos et al., 2005; Barthe and Rousseau, 2006;
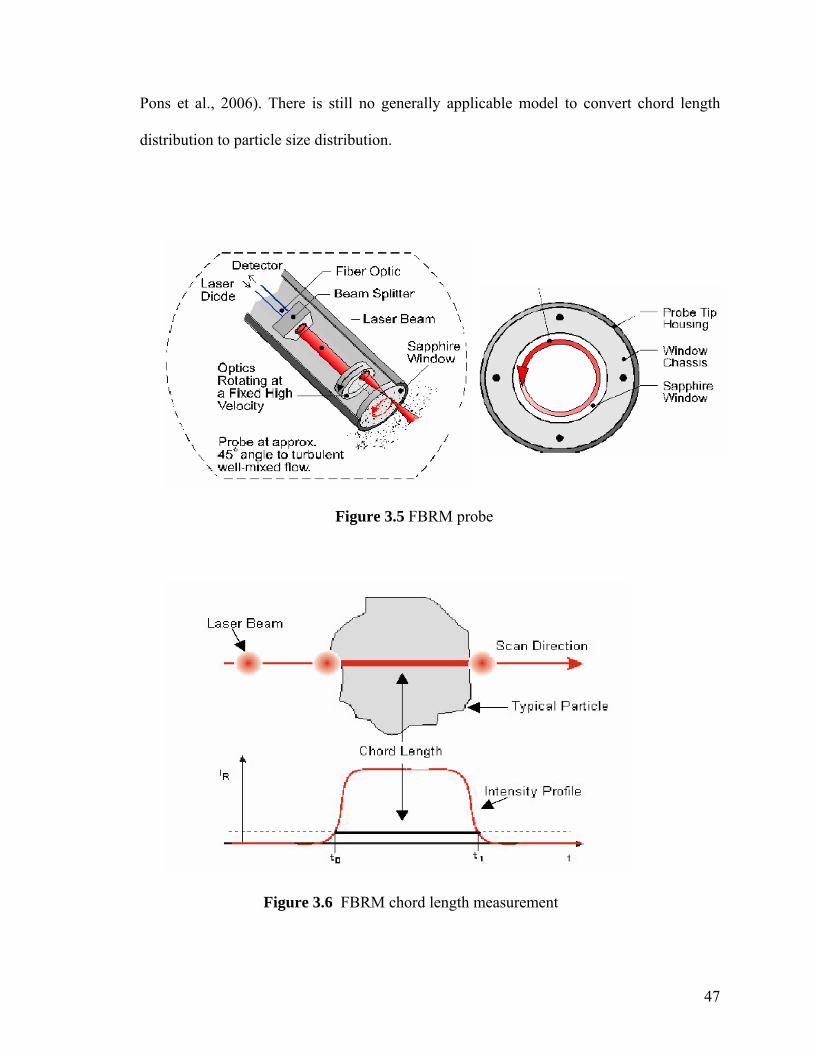
47
Pons et al., 2006). There is still no generally applicable model to convert chord length
distribution to particle size distribution.
Figure 3.5 FBRM probe
Figure 3.6 FBRM chord length measurement

48
3.4 Direct crystallization experimental set-up
Direct cooling crystallizations were carried out in an automated apparatus. A
Mettler Toledo LabMax Automatic Laboratory Reactor system was used to control and
monitor crystallizer operation. As shown in Figure 3.7, it was equipped with a 1-litre
jacketed curved-bottom glass crystallizer, a downward glass propeller stirrer driven by a
heavy duty motor, a temperature sensor, a solenoid diaphragm dosing pump and a balance.
It performed temperature control and monitoring, solvent addition and stirring speed in an
automated and highly accurate mode. The temperature of the crystallizer was measured at
2 s intervals throughout a crystallization run. A Lasentec S400A FBRM and a Lasentec
700 PVM were used for in-situ crystal monitoring.

49
Figure 3.7 Experimental set-up: 1– Computer; 2- LabMax; 3- Julabo cooling/heating refrigerator; 4- Heavy duty stirrer; 5- Condenser; 6- Temperature sensor; 7- 600ml double-
wall crystallizer; 8- FBRM; 9- PVM; 10- Solvent bottle; 11- Dosing pump;12-Balance
3.5 Crystal analysis and monitoring
3.5.1 Principle of optical rotation and polarimetry
Many molecules with a lack of symmetry (e.g. chiral molecules) rotate the plane of
plane-polarized radiation. The extent of optical rotation caused by optical active molecules
in a solution depends on the concentration of the solution, the solvent used, the path length
of the measurement cell, the temperature and the wavelength of radiation used. The optical

50
rotation caused by the two enantiomeric forms of a racemic specie is of the same
magnitude but of contrary direction, therefore a racemic mixture is optical inactive and the
optical rotation of any enriched solution is in addition to the factors described above
dependent on the enantiomeric excess (ee) of the solution (Ewing, 1985).
For specified solvent, temperature and wavelength, it is common to report not the
actual measured optical rotation α, but the specific rotation [α]λT. The specific rotation is
defined as
10000][dc
T αα λ = (3.2)
where d is the path length of the measurement cell and c is the concentration of optical
active solute in solution.
In this work, the optical rotations were measured at 589.3 nm using a JASCO P-
1030 digital polarimeter equipped with a quartz cell of 50 mm path length at ambient
temperature in a solution of isopropanol.
3.5.2 Particle size analysis
Several methods based on different measurement principles exist to determine a
particle size distribution. An elaborate description of the different techniques with their
advantages and disadvantages is presented in the monograph of Allen (1997). A shorter
overview is given by Rawle (2006). The most important methods are: image analysis
(e.g. with an optical microscope or electron microscope), sieving, sedimentation,
electrozone sensing (Coulter Counter) and laser diffraction.

51
The method of laser diffraction or more precisely Low Angle Laser Light
Scattering (LALLS) is widely used for determining particle size distributions with many
applications in quality control and research. Advantages are the fast obtained results and
the coverage of a wide range of particle sizes ranging from 0.1 to 2000 µm. The method,
applicable for most particles of interest (dry powders, suspensions, emulsions, aerosols,
sprays, etc.) is volume-based, which means a volume or weight distribution is obtained
directly. The principle of a low angle laser light scattering instrument is shown in
Figure 3.8. To obtain a representative size distribution measurement time should not be
too short (typically measurements last 10-20 seconds) and data sampling should be as fast
as possible. This ensures that the measured population is large enough to be representative
for the investigated sample. The stirring speed should be high enough to ensure a good
dispersion of the particles present in the sample; additionally the bath should be
ultrasonically agitated if the particles tend to agglomerate.
Figure 3.8 Principle of LALLS instruments (Allen, 1997)

52
In this work, a Malvern Mastersizer 2000 (laser diffraction) was used to measure
crystal size distribution. In the meantime, a Lasentec S400A FBRM and a Lasentec
Particle Vision and Measurement (PVM) 700 were also used to in-situ monitor the
crystallization process.
3.5.3 Field emission scanning electron microscope (FESEM)
There are two classes of emission source: thermionic emitter and field emitter.
Emitter type is the main difference between the SEM and FESEM. FESEM produces a
cleaner and higher resolution topographical image.
In this work, the crystal morphology was investigated using a Jeol JSM-6700F
Field Emission SEM. A small amount of samples were scattered on double-sided adhesive
carbon tabs mounted on SEM stubs, and were coated with Au/Pd in a Cressington 208
sputter coater.

53
CHAPTER 4 CHARACTERIZATION OF
RACEMIC SPECIES
4.1 Introduction
The basis for any enantiomer separation, but especially for a separation approach
via crystallization, is the knowledge about the solid-state characteristic of the racemate.
Racemate crystals can be divided into three types: racemic conglomerates, racemic
compounds or pseudoracemates (Roozeboom, 1899; Collet et al., 1980; Jacques et al,
1994; Li and Grant, 1997; Li et al, 1999; Lorenz and Seidel-Morgenstern, 2002). The
three fundamental types of racemic species are shown in Figure 4.1.
Figure 4.1 Crystal lattices of the three fundamental types of racemates: a) a conglomerate; b) a racemic compound; c) a pseudoracemate
The crystal lattice of a conglomerate is built up by the same enantiomer molecules
as shown in Figure 4.1a. A racemate is a mechanical mixture of crystals containing the
corresponding enantiomers. In a racemic compound, the two corresponding enantiomers

54
are present in equal quantities in a well-defined arrangement within the crystal lattice as
shown in Figure 4.1b. For a pseudoracemate, two enantiomer molecules coexist in the
crystal lattice in a random manner as shown in Figure 4.1c.
The aim of this chapter is to identify and characterize the solid-state nature of
different racemic mixture with various techniques. First the characterization of racemic
species by their binary melting point phase diagram was discussed. Based on a
thermodynamic cycle involving the solid and liquid phases of the enantiomers and
racemic species, the melting point, enthalpy, entropy and Gibbs free energy of the racemic
species were derived from the thermodynamic data. Furthermore, racemic species are
possible to exist as a metastable racemic compound or as a racemic conglomerate (Collet
et al., 1980; Li and Grant, 1997; Houllemare-Druot and Coquerel, 1998). Sometimes the
reversible transitions may occur between condensed phases such as polymorphism,
reversible decomposition of racemate (Coquerel, 2000; Dufour et al., 2004). As such,
examination of binary phase diagram alone is not adequate to identify them. Additional
spectroscopic techniques were employed to compare the solid state spectra of pure
enantiomer and its racemate to identify or prove the solid nature of racemic species.
4.2 Methods for characterization of racemic species
4.2.1 Characterization by the binary phase diagram
The binary phase diagram (melting point diagram) is considered to be the most
important tool for determining the solid-state characteristic. The first to characterize
racemic species by their phase diagram was Roozeboom (Roozeboom, 1899). The three
types of racemates are readily distinguished by reference to their melting point diagrams
as shown in Figure 4.2. A racemic conglomerate is shown in Figure 4.2 a), a racemic

55
compound in Figure 4.2 b) and the case of pseudoracemate in Figure 4.2 c).
Pseudoracemates are further differentiated in ideal pseudoracemates as shown in Figure
4.2 c1) and pseudoracemates showing a maximum Figure 4.2 c2) or minimum Figure 4.2
c3), respectively.
Figure 4.2 Typical binary phase diagrams of various racemic species; a) racemic conglomerate, b) racemic compound, c) pseudoracemate : 1, ideal; 2, with a maximum; or
3, with a minimum. R, D and L indicate the racemic compound, pure dextrorotatory enantiomer and pure levorotatory enantiomer, respectively. E indicates the eutectic point.
There are a number of reasons why a binary phase diagram should be determined
first. The sample mass required to determine the binary phase diagram is small,
measurements require short time and additional information such as the enthalpy of fusion
can be determined by employing thermal analysis (DTA, DSC) to predict the phase
diagram.
In this work, a heat flux DSC apparatus (Mettler Toledo DSC822e) was employed
to measure the binary melting point phase diagram and enthalpy of fusion.
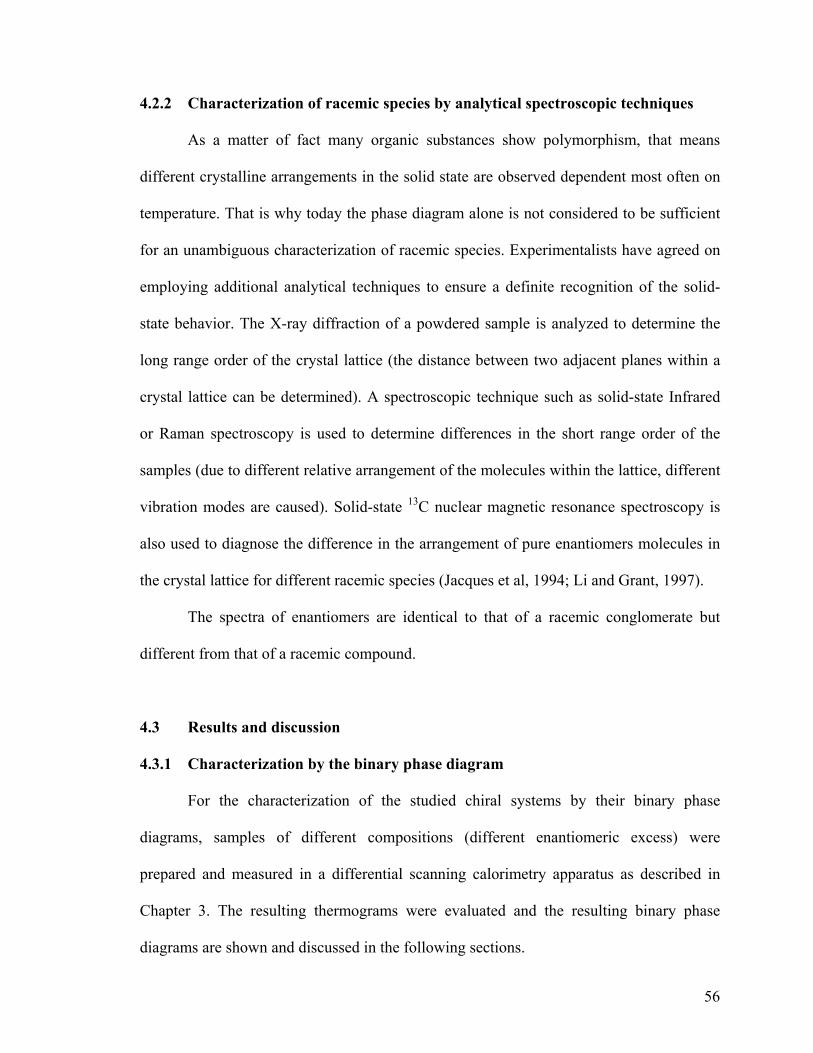
56
4.2.2 Characterization of racemic species by analytical spectroscopic techniques
As a matter of fact many organic substances show polymorphism, that means
different crystalline arrangements in the solid state are observed dependent most often on
temperature. That is why today the phase diagram alone is not considered to be sufficient
for an unambiguous characterization of racemic species. Experimentalists have agreed on
employing additional analytical techniques to ensure a definite recognition of the solid-
state behavior. The X-ray diffraction of a powdered sample is analyzed to determine the
long range order of the crystal lattice (the distance between two adjacent planes within a
crystal lattice can be determined). A spectroscopic technique such as solid-state Infrared
or Raman spectroscopy is used to determine differences in the short range order of the
samples (due to different relative arrangement of the molecules within the lattice, different
vibration modes are caused). Solid-state 13C nuclear magnetic resonance spectroscopy is
also used to diagnose the difference in the arrangement of pure enantiomers molecules in
the crystal lattice for different racemic species (Jacques et al, 1994; Li and Grant, 1997).
The spectra of enantiomers are identical to that of a racemic conglomerate but
different from that of a racemic compound.
4.3 Results and discussion
4.3.1 Characterization by the binary phase diagram
For the characterization of the studied chiral systems by their binary phase
diagrams, samples of different compositions (different enantiomeric excess) were
prepared and measured in a differential scanning calorimetry apparatus as described in
Chapter 3. The resulting thermograms were evaluated and the resulting binary phase
diagrams are shown and discussed in the following sections.

57
4.3.1.1 Melting point phase diagram of 4-hydroxy-2-pyrrolidone
The theoretical background about evaluating the thermograms has been explained
in Chapter 3 already. Because formation of a solvate (with different melting point) was
reported by Di Silvestro et al (1993), DSC runs of samples prepared by different methods
were investigated for the binary phase diagram. DSC runs of samples prepared by mixing
the two enantiomers directly in the crucible were evaluated. Samples prepared with
crystals recovered from solvent (isopropanol) were also checked on different melting
points.
No differences in the thermograms were observed for the different methods of
preparing the samples. The determined temperature of fusion was only dependent on the
composition. The unfavourable formation of a stable solvate of 4-hydroxy-2-pyrrolidone
recovered from a solution containing isopropanol (Di Silvestro et al, 1993) could not be
confirmed. For dried crystals (dried for four hours at 60 °C under vacuum) recovered from
a solution in isopropanol, neither a different melting point compared to the untreated
crystals in DSC measurements nor different FT-IR spectra were obtained. It can be
concluded that, even if a solvate with different melting point was formed by crystallization
from isopropanol, it was transformed to unsolvated crystals during drying.
For 4-hydroxy-2-pyrrolidone, the graphic procedure of determining the
temperatures of fusion is shown in the following figure (Figure 4.3) for the pure R-
enantiomer and for one exemplary mixture (composition R:S = 82%:18%).
For thermograms of 4-hydroxy-2-pyrrolidone measured with a heating rate of 2, 5,
and 10 oC/min, the corresponding angle which was employed to every peak was β = 5.2o,
6.7o and 7.2o, respectively.
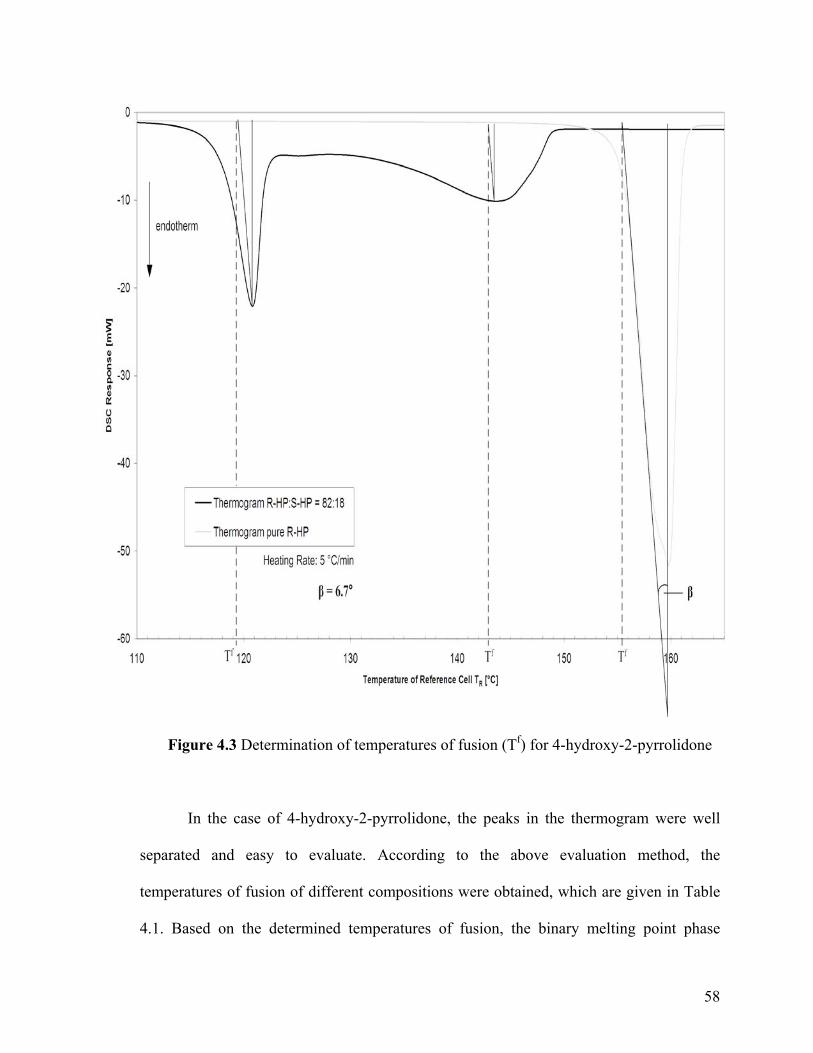
58
Figure 4.3 Determination of temperatures of fusion (Tf) for 4-hydroxy-2-pyrrolidone
In the case of 4-hydroxy-2-pyrrolidone, the peaks in the thermogram were well
separated and easy to evaluate. According to the above evaluation method, the
temperatures of fusion of different compositions were obtained, which are given in Table
4.1. Based on the determined temperatures of fusion, the binary melting point phase
59
diagram of (R)- and (S)-4-hydroxy-2-pyrrolidone is given in Figure 4.5. For consecutive
runs and for heating rates of 2 and 5 oC/min, the data are consistent. For heating rate of 10
oC/min, the data are also close to the above values. Therefore, in Figure 4.4, only the data
for the heating rate of 5 oC/min are shown.
From the binary phase diagram of 4-hydroxy-2-pyrrolidone, we can find its
eutectic composition is the racemic composition (R:S = 50%:50%). This indicates that
(RS)-4-hydroxy-2-pyrrolidone possesses the important characteristic of a racemic
conglomerate forming system.

60
Table 4.1. Temperature of fusion of 4-hydroxy-2-pyrrolidone determined with differential scanning calorimetry (DSC)
X Tf [oC] X Tf [oC] X Tf [oC] X TCal [K] TCal [oC]
100.0 155.3 100.0 155.3 100.0 155.4 100.0 428.48 155.33
95.0 153.0 95.0 153.0 95.0 153.6 95.0 425.46 152.31
92.8 151.5 92.8 151.5 92.8 151.8 92.8 424.10 150.95
90.0 150.0 90.0 150.0 90.0 150.1 90.0 422.33 149.18
87.0 148.2 87.0 148.2 87.0 149.2 87.0 420.38 147.23
85.0 145.4 85.0 145.4 85.0 145.7 85.0 419.06 145.91
82.0 142.8 82.0 142.8 82.0 143.3 82.0 417.03 143.88
80.0 142.0 80.0 142.0 80.0 142.4 80.0 415.65 142.50
75.9 139.5 75.9 139.5 75.9 140.1 75.9 412.74 139.59
75.0 138.0 75.0 138.0 75.0 138.7 75.0 412.08 138.93
70.0 134.6 70.0 134.6 70.0 134.8 70.0 408.34 135.19
68.5 134.0 68.5 134.0 68.5 133.8 68.5 407.17 134.02
65.0 130.0 65.0 130.0 65.0 130.5 65.0 404.39 131.24
60.0 126.3 60.0 126.3 60.0 126.9 60.0 400.20 127.05
59.2 125.0 59.2 125.0 59.2 126.2 59.2 399.51 126.36
55.0 120.0 55.0 120.0 55.0 121.8 55.0 395.76 122.61
50.0 117.0 50.0 117.0 50.0 118.8 50.0 390.10 117.84
Heating Rate =
2 oC/min
Heating Rate =
5 oC/min
Heating Rate =
10 oC/min
Simplified Schröder-
Van Laar Eq

61
110
115
120
125
130
135
140
145
150
155
160
0 20 40 60 80 100Composition X%
Tem
pera
ture
[o C]
Experimental melting point_heating rate 5 K/min
Eutectic point
Data from Simplified Schroder_Van Laar Eq
Calculated from Simplified Schroder_Van LaarEq
Figure 4.4 Binary phase diagram (melting point diagram) of 4-hydroxy-2-pyrrolidone: ■, Experimental data: heating rate 5 oC/min; ▲, Eutectic temperature; ∆, Calculated data
from Simplified Schröder-Van Laar Equation; , Curve from Simplified Schröder-Van Laar Equation.
The enthalpies of fusion of the pure (R)- and (RS)-4-hydroxy-2pyrrolidone were
determined by integrating the melting peaks with the DSC software. The enthalpies of
fusion and the temperatures of fusion of the pure (R)- and (RS)-4-hydroxy-2-pyrrolidone
are listed in Table 4.2.

62
Based on the above data, the corresponding temperatures of fusion for the different
compositions were also calculated using the simplified Schröder-Van Laar Equation (Eq.
4.1).
)145.428
1(314.8
25217ln fTx −= (4.1)
As indicated in Table 4.1 and Figure 4.4, the experimental results are in substantial
agreement with the theoretically calculated values.
Besides construction and prediction of the binary phase diagram from the DSC
measurements, the changes in the thermodynamic quantities (such as enthalpies and
entropies) were also calculated using the thermodynamic approach. The thermodynamic
cycle was applied to a recemic conglomerate system as follows (Jacques et al., 1994):
lH
llH
ss DLLDLDml
fA ⎯⎯ →⎯+⎯⎯→⎯+ ∆∆ (at f
AT )
)( fR
fA
s TTC − ↑ ↓ )( fA
fR
l TTC −
lHsHss DLDLLD fR
ms
⎯⎯ ⎯←⎯⎯ ⎯←+∆−∆−
(at fRT )
Figure 4.5 Thermodynamic cycle for calculation of enthalpies for a racemic conglomerate system
In this cycle, D and L represent the pure enantiomers, and DL represents the
racemic mixture. sC and lC represent the heat capacities of the solids and liquids,
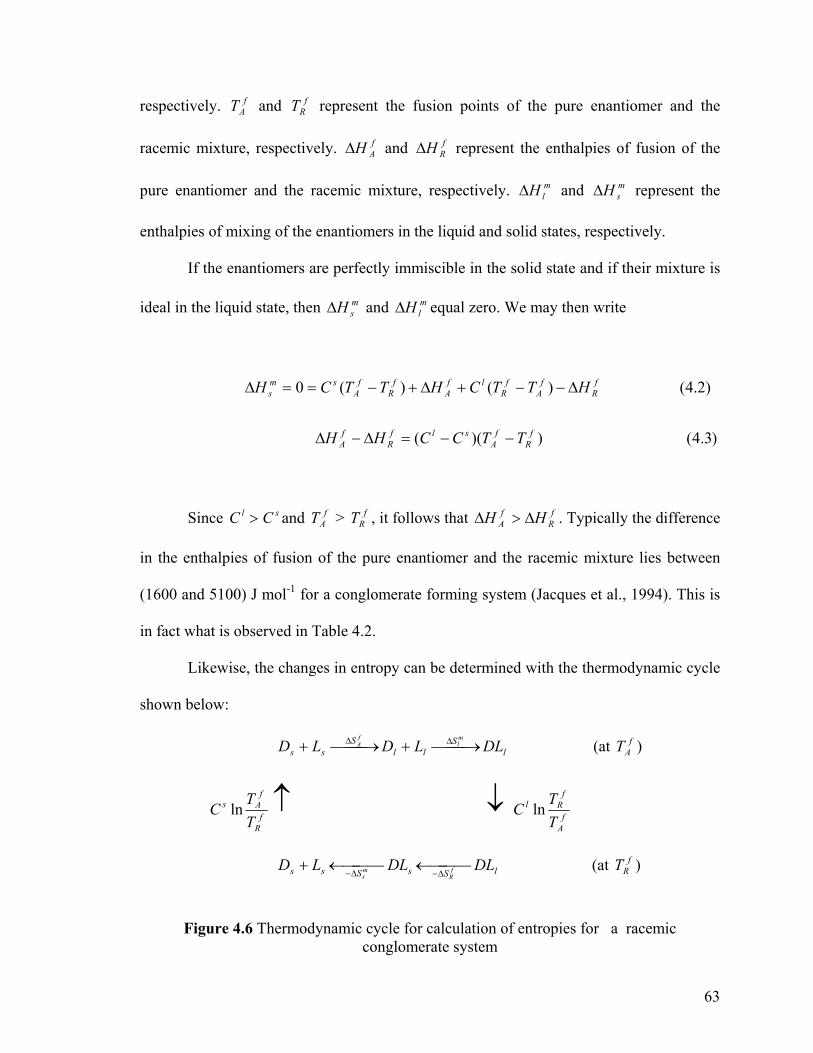
63
respectively. fAT and f
RT represent the fusion points of the pure enantiomer and the
racemic mixture, respectively. fAH∆ and f
RH∆ represent the enthalpies of fusion of the
pure enantiomer and the racemic mixture, respectively. mlH∆ and m
sH∆ represent the
enthalpies of mixing of the enantiomers in the liquid and solid states, respectively.
If the enantiomers are perfectly immiscible in the solid state and if their mixture is
ideal in the liquid state, then msH∆ and m
lH∆ equal zero. We may then write
)3.4())((
)2.4( )()(0
fR
fA
slfR
fA
fR
fA
fR
lfA
fR
fA
sms
TTCCHH
HTTCHTTCH
−−=∆−∆
∆−−+∆+−==∆
Since lC > sC and fAT > f
RT , it follows that fR
fA HH ∆>∆ . Typically the difference
in the enthalpies of fusion of the pure enantiomer and the racemic mixture lies between
(1600 and 5100) J mol-1 for a conglomerate forming system (Jacques et al., 1994). This is
in fact what is observed in Table 4.2.
Likewise, the changes in entropy can be determined with the thermodynamic cycle
shown below:
lS
llS
ss DLLDLDml
fA ⎯⎯→⎯+⎯⎯→⎯+ ∆∆ (at f
AT )
fR
fAs
TTC ln ↑ ↓ f
A
fRl
TTC ln
lSsSss DLDLLD fR
ms
⎯⎯ ⎯←⎯⎯ ⎯←+∆−∆−
(at fRT )
Figure 4.6 Thermodynamic cycle for calculation of entropies for a racemic
conglomerate system

64
In this cycle, fAS∆ and f
RS∆ represent the entropies of fusion of the pure
enantiomer and the racemic mixture, respectively. mlS∆ and m
sS∆ represent the entropies
of mixing of the enantiomers in the liquid and solid states, respectively. For a
conglomerate, sDL exists in the form of two separate phases, sD and sL , which are
present as a mechanical mixture. Consequently, msS∆ =0 and
1177.52ln −−==∆ KmolJRS ml if the system behaves ideally. We may then write
)5.4(ln
)4.4(lnln0
fR
fA
fR
fA
fR
fA
fR
fR
fA
fAm
l
fRf
A
fRlm
lf
AfR
fAsm
s
TT
TTHH
TH
TH
S
STT
CSSTT
CS
−∆−∆
−∆
−∆
=∆−
∆−+∆+∆+==∆
The value of mlS∆ calculated with Equation (4.5) is shown in Table 4.2. It is close
to the value expected from theory, which indicates that (RS)-4-hydroxy-2-pyrrolidone is a
conglomerate. The agreement with the data published by Li et al. (1999) is satisfying.
Table 4.2. Melting points and enthalpies of fusion of (R)-4-hydroxy-2-pyrrolidone and (RS)-4-hydroxy-2-pyrrolidone; entropy of mixing of (R)- and (S)-4-hydroxy-2-
pyrrolidone in the liquid state
fRT
[K]
fAT
[K] )( f
Rf
A TT − [K]
fRH∆
[J mol-1]
fAH∆
(J mol-1) )( f
Rf
A HH ∆−∆ [J mol-1]
mlS∆
[J mol-1 K-1]
391.95 428.45 36.5 23413 25217 1804 5.28
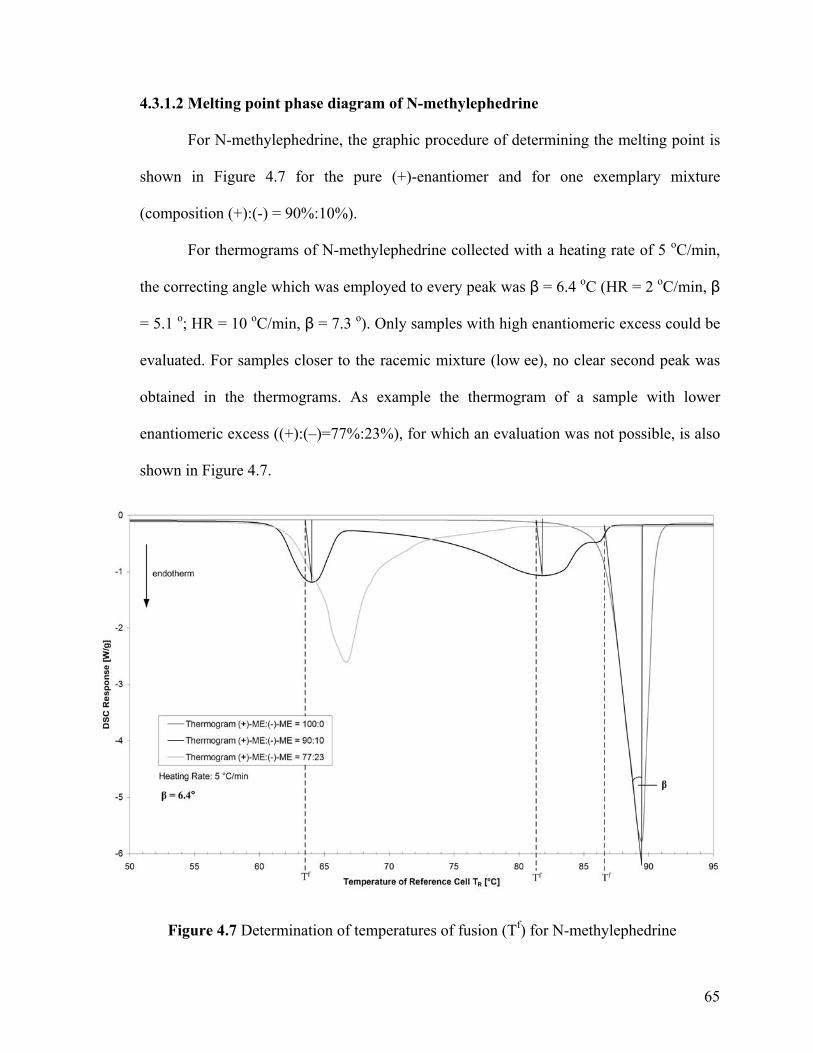
65
4.3.1.2 Melting point phase diagram of N-methylephedrine
For N-methylephedrine, the graphic procedure of determining the melting point is
shown in Figure 4.7 for the pure (+)-enantiomer and for one exemplary mixture
(composition (+):(-) = 90%:10%).
For thermograms of N-methylephedrine collected with a heating rate of 5 oC/min,
the correcting angle which was employed to every peak was β = 6.4 oC (HR = 2 oC/min, β
= 5.1 o; HR = 10 oC/min, β = 7.3 o). Only samples with high enantiomeric excess could be
evaluated. For samples closer to the racemic mixture (low ee), no clear second peak was
obtained in the thermograms. As example the thermogram of a sample with lower
enantiomeric excess ((+):(–)=77%:23%), for which an evaluation was not possible, is also
shown in Figure 4.7.
Figure 4.7 Determination of temperatures of fusion (Tf) for N-methylephedrine

66
It should be noted that some difficulties were encountered in preparing samples of
N-methylephedrine for the DSC measurements. For N-methylephedrine, samples can be
molten only once, because heating for the second or third time, peaks representing melting
of the racemic mixture were observed at temperatures approximately 5 °C lower than
those upon the first melting. The endothermic peaks were accompanied by preceding
exothermic peaks. This behaviour was only observed for the mixtures of two enantiomers.
For both pure enantiomers, the reproducible peaks were obtained for repeatedly melting.
Therefore decomposition due to thermal stress can be excluded for this behaviour, but no
unambiguous explanation can be given. A possible explanation is the formation of a
different polymorphic phase. For example a different polymorph (e.g. a racemic
compound) can be obtained upon recrystallization if the crystallization is very slow for the
stable phase. Then a different polymorph even when thermodynamically not stable can be
formed if the rate of crystallization is faster. This phenomenon is frequently observed in
crystallization and known as “law of successive reactions” or “Ostwald’s rule of stages”
(Jacques et al, 1994; Mullin, 2001). Sometimes the metastable polymorph can be
transformed into the stable form by heating to a transition temperature. In some cases the
solid-solid transformation is extremely slow and therefore the metastable form is virtually
stable. The appearance of the thermograms for N-methylephedrine was akin to the cases
of polymorphism in binary systems discussed by Jacques et al (1994), but no definite
explanation can be given from the thermograms alone. As stated in the same monograph,
it is difficult to determine polymorphism in a binary system. However, also a comparison
of the IR-spectra of the once molten and recrystallized sample revealed no differences to
the pure enantiomers or the racemic mixture before being molten.
Preparing samples of crystals recovered from solvent was also not applicable. The

67
melting point of the racemic mixture was about 63 °C. Therefore drying at ambient
pressure was ineffective due to the limited temperature. Attempts to dry the crystals under
vacuum resulted in partially sublimation of the sample. Due to the fact that the vapour is
always racemic as long as both enantiomers are present in the sample
(Jacques et al, 1994), the actual sample composition is no longer known.
The mixture attained by preparing the samples with the mortar method was
sufficient to evaluate the peaks obtained during the first run of the DSC program (peaks
obtained from poorly mixed samples were not smooth and broader than those where good
mixing was achieved). For samples with low enantiomeric excess the liquidus temperature
can not be determined, because the two peaks representing melting of the racemic mixture
and subsequently melting of the enantiomer in excess were overlapping too much. That is
why additional to the heating rate of 5 °C/min, heating rates of 2 and 10 °C/min were
applied with the aim of better separated peaks for the lower heating rate and larger peaks
in the case of the higher heating rate. The desired effects were observed, but due to the
drawbacks of very small peaks (lower heating rate) or even more overlapping of peaks
(higher heating rate), those runs were not advantageous for evaluating the temperatures of
fusion.
The second peak for N-methylephedrine was not as distinct as that for 4-hydroxy-
2-pyrrolidone. The reason might be the lower heat of fusion ( 164.5SLMEh J g∆ = ,
249.4SLHPh J g∆ = ), resulting in overall smaller peaks. Furthermore a slow dissolution was
observed in the solubility experiments. If this is also true for dissolution in the melt, the
peaks would be more diffusive and therefore more overlapping. Probably a combination of
both effects caused the poorly separated peaks in the thermogram.
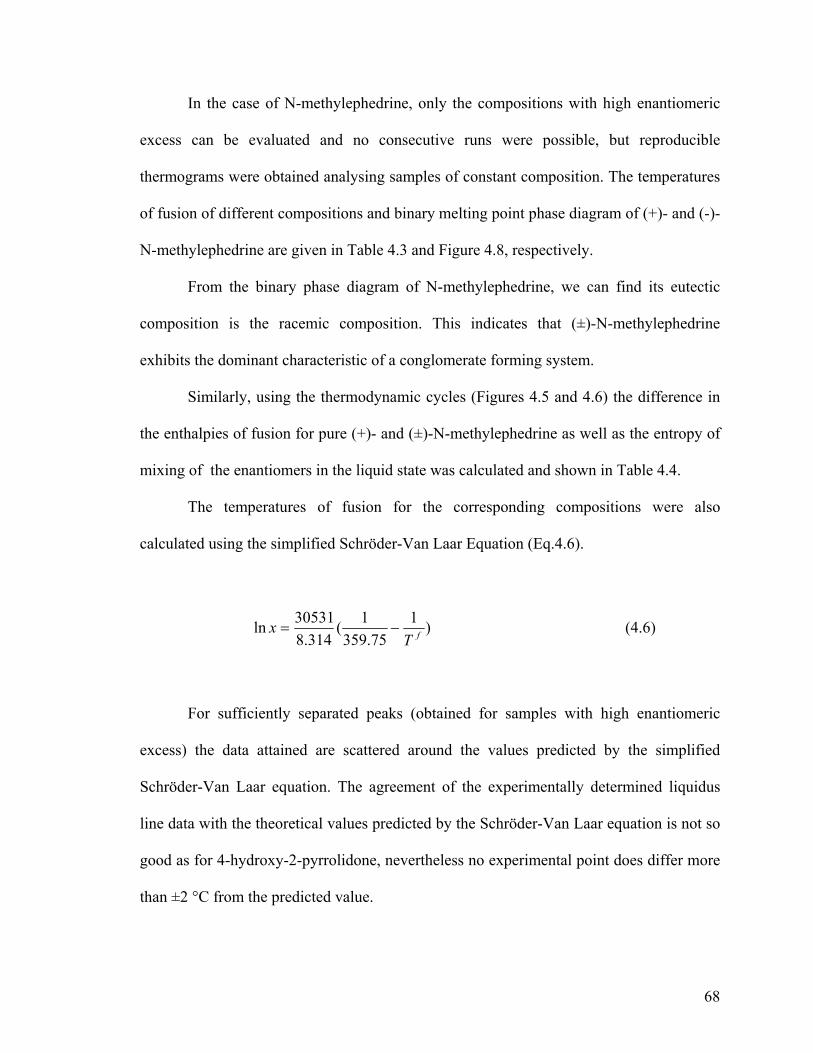
68
In the case of N-methylephedrine, only the compositions with high enantiomeric
excess can be evaluated and no consecutive runs were possible, but reproducible
thermograms were obtained analysing samples of constant composition. The temperatures
of fusion of different compositions and binary melting point phase diagram of (+)- and (-)-
N-methylephedrine are given in Table 4.3 and Figure 4.8, respectively.
From the binary phase diagram of N-methylephedrine, we can find its eutectic
composition is the racemic composition. This indicates that (±)-N-methylephedrine
exhibits the dominant characteristic of a conglomerate forming system.
Similarly, using the thermodynamic cycles (Figures 4.5 and 4.6) the difference in
the enthalpies of fusion for pure (+)- and (±)-N-methylephedrine as well as the entropy of
mixing of the enantiomers in the liquid state was calculated and shown in Table 4.4.
The temperatures of fusion for the corresponding compositions were also
calculated using the simplified Schröder-Van Laar Equation (Eq.4.6).
)175.359
1(314.8
30531ln fTx −= (4.6)
For sufficiently separated peaks (obtained for samples with high enantiomeric
excess) the data attained are scattered around the values predicted by the simplified
Schröder-Van Laar equation. The agreement of the experimentally determined liquidus
line data with the theoretical values predicted by the Schröder-Van Laar equation is not so
good as for 4-hydroxy-2-pyrrolidone, nevertheless no experimental point does differ more
than ±2 °C from the predicted value.

69
Table 4.3. Temperature of fusion of N-methylephedrine determined with differential scanning calorimetry (DSC)
X% Tf [oC] X% Tf [oC] X% Tf [oC] X% TCal [K] TCal [oC]
100 86.8 100 86.6 100 87 100 357.22 84.07
87.5 82.3 91.0 81.1 84.8 78.5 90 356.07 82.92
78.6 79.4 84.2 80.7 74.4 77.4 80 352.05 78.90
50 63 83.4 78.4 70 347.60 74.45
50 63.5 50 336.87 63.72
Heating Rate =
2 oC/min
Heating Rate =
5 oC/min
Heating Rate =
10 oC/min
Simplified Schröder-Van Laar Eq
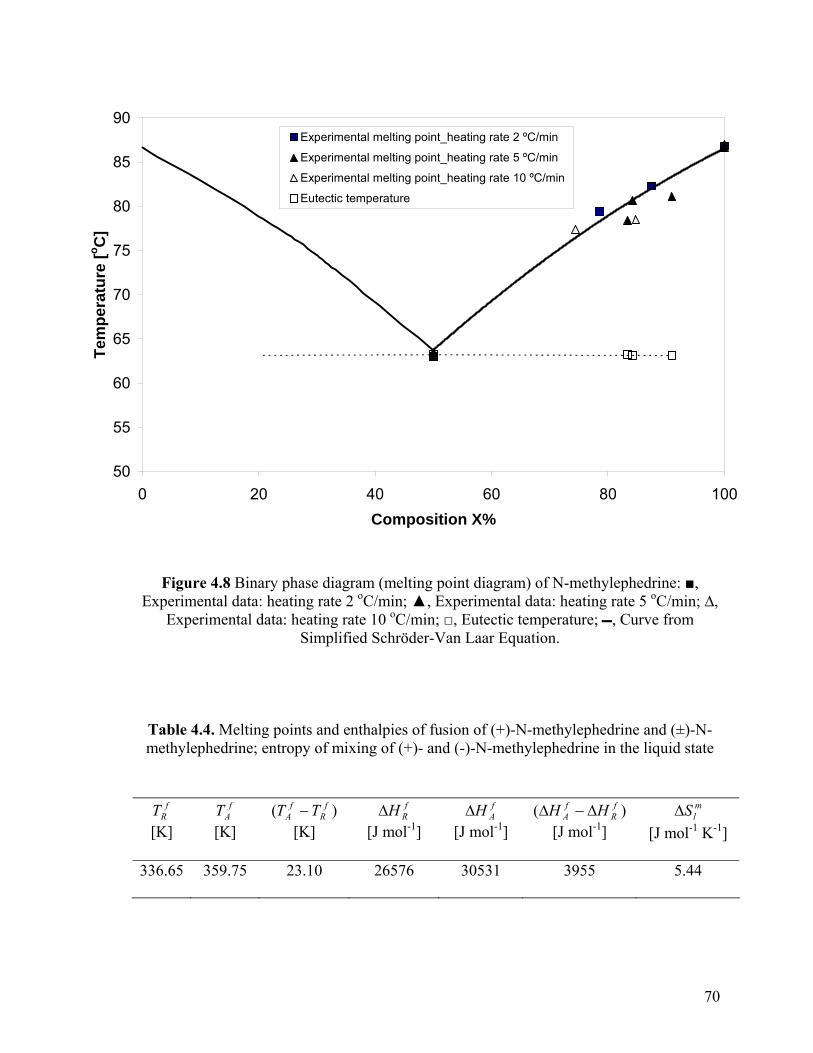
70
50
55
60
65
70
75
80
85
90
0 20 40 60 80 100Composition X%
Tem
pera
ture
[o C]
Experimental melting point_heating rate 2 ºC/min
Experimental melting point_heating rate 5 ºC/min
Experimental melting point_heating rate 10 ºC/min
Eutectic temperature
Figure 4.8 Binary phase diagram (melting point diagram) of N-methylephedrine: ■,
Experimental data: heating rate 2 oC/min; ▲, Experimental data: heating rate 5 oC/min; ∆, Experimental data: heating rate 10 oC/min; □, Eutectic temperature; , Curve from
Simplified Schröder-Van Laar Equation.
Table 4.4. Melting points and enthalpies of fusion of (+)-N-methylephedrine and (±)-N-methylephedrine; entropy of mixing of (+)- and (-)-N-methylephedrine in the liquid state
fRT
[K]
fAT
[K] )( f
Rf
A TT − [K]
fRH∆
[J mol-1]
fAH∆
[J mol-1] )( f
Rf
A HH ∆−∆ [J mol-1]
mlS∆
[J mol-1 K-1]
336.65 359.75 23.10 26576 30531 3955 5.44

71
The values of (∆HAf – ∆HR
f ) and ∆Slm are closed to the values expected from
theory, which indicates that (±)-N-methylephedrine is a conglomerate (Li et al., 1999).
The binary phase diagram is considered to be the most important evidence for
classification of racemic species. Both 4-hydroxy-2-pyrrolidone and N-methylephedrine
show the typical binary phase diagram of a conglomerate forming system. In the case of
N-methylephedrine, the liquidus line data for intermediate compositions can not be
determined and therefore also a classification as a racemic compound came into
consideration. Though, due to the distinct melting peak observed for the racemic
composition, which occurs at the lowest temperature in the system, the typical binary
phase diagram of a racemic compound (Figure 4.2b) may not be possible, to ensure the
classification of both racemic species as racemic conglomerates, the results of three
additional techniques (IR, Raman-spectroscopy and powder X-ray diffraction) would be
presented in the later sections (4.3.2 – 4.3.4).
4.3.1.3 Melting point phase diagram of propranolol hydrochloride
For propranolol hydrochloride, the graphic procedure of determining the melting
point is shown in Figure 4.9 for the pure (S)-enantiomer and for one exemplary mixture
(composition R:S = 90%:10%).

72
-60
-50
-40
-30
-20
-10
0
100 120 140 160 180 200 220Temperature of Reference Cell TR [oC]
DSC
Res
pons
e [m
W]
Thermogram pure PN-ClThermogram R-PN-Cl:S-PN-Cl = 90:10
Figure 4.9 Determination of temperatures of fusion (Tf) for propranolol hydrochloride
For thermograms of propranolol hydrochloride collected with a heating rate of 5
oC/min, the correcting angle which was employed to every peak was β = 5.3 o (HR = 2
oC/min, β = 5.3 o; HR = 10 oC/min, β = 6.1 o).
The temperatures of fusion of different compositions and binary melting point
phase diagram of (R)- and (S)-propranolol hydrochloride are given in Table 4.5 and
Figure 4.10, respectively.
Tf Tf Tf
β
β = 5.3 o Heating Rate: 5 oC/min
endotherm

73
Table 4.5. Temperature of fusion of propranolol hydrochloride determined with
differential scanning calorimetry (DSC)
X% Tf [oC] X% Tf [oC] X% Tf [oC]
100 197.9 100 197.9 100 197.9
95 195.1 95 195.1 95 195.1
90 192.6 90 192.6 90 192.6
85 190.7 85 190.7 85 190.7
80 188.9 80 188.9 80 188.9
75 187.1 75 187.1 75 187.1
70 184.8 70 184.8 70 184.8
65 181.7 65 181.7 65 181.7
60 177.3 60 177.3 60 177.3
55 173.4 55 173.4 55 173.4
50 167.2 50 167.2 50 167.2
Heating Rate = 2 oC/min Heating Rate = 5 oC/min Heating Rate = 10 oC/min
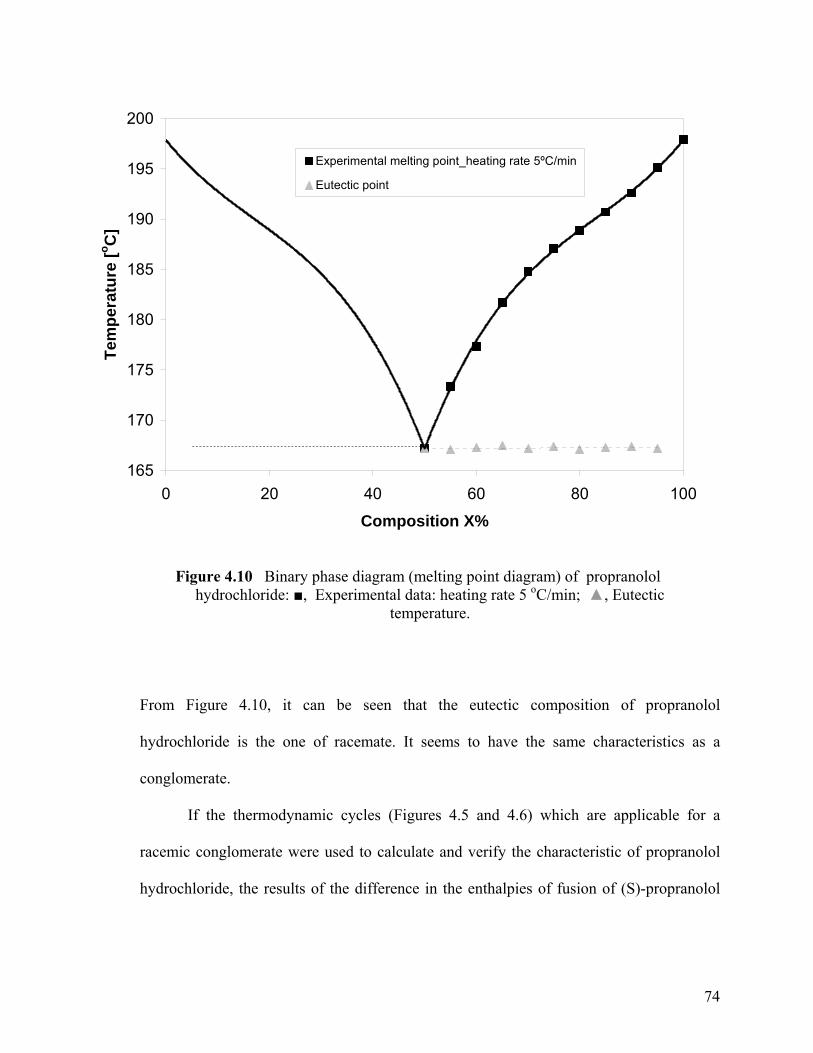
74
165
170
175
180
185
190
195
200
0 20 40 60 80 100
Composition X%
Tem
pera
ture
[o C]
Experimental melting point_heating rate 5ºC/min
Eutectic point
Figure 4.10 Binary phase diagram (melting point diagram) of propranolol hydrochloride: ■, Experimental data: heating rate 5 oC/min; ▲, Eutectic
temperature.
From Figure 4.10, it can be seen that the eutectic composition of propranolol
hydrochloride is the one of racemate. It seems to have the same characteristics as a
conglomerate.
If the thermodynamic cycles (Figures 4.5 and 4.6) which are applicable for a
racemic conglomerate were used to calculate and verify the characteristic of propranolol
hydrochloride, the results of the difference in the enthalpies of fusion of (S)-propranolol

75
hydrochloride and (RS)-propranolol hydrochloride as well as the entropy of mixing of
(R)- and (S)-propranolol hydrochloride in the liquid state are given in Table 4.6.
Table 4.6. Melting points and enthalpies of fusion of (S)-propranolol hydrochloride and (RS)-propranolol hydrochloride; entropy of mixing of (S)- and (R)-propranolol
hydrochloride in the liquid state
It is noticed that the value of (∆HAf – ∆HR
f) is negative. A negative value of (∆HAf –
∆HRf) may reveal the probability of formation of a racemic compound, which is
enthalpically favorable. This is consistent with the conclusion that the racemic compound
has greater stabilization energy than the individual enantiomers. There were some
arguments on the solid nature of propranolol hydrochloride as a racemic conglomerate or a
racemic compound (Barrans and Cotrait, 1973; Ammon et al, 1977; Roberts and Rowe,
1994; Shankland and Knight, 1996; Li et al, 1999; Wang et al, 2002; Bredikhin et al,
2003, 2004). In order to get the unambiguous chiral discrimination of propranolol
hydrochloride, the solid-state IR spectra, Raman spectra, Powder XRD spectra and solid-
state NMR spectra of (R)- and (RS)-propranolol hydrochloride were further examined to
identify the characteristic of propranolol hydrochloride in the later sections (4.3.2 - 4.3.5).
Chapter 5 will also show that the metastable zone width measurements could be
used as an additional characteristic to identify racemic compound from conglomerate.
fRT
[K]
fAT
[K] )( f
Rf
A TT − [K]
fRH∆
[J mol-1]
fAH∆
[J mol-1) )( f
Rf
A HH ∆−∆ [J mol-1]
mlS∆
[J mol-1 K-1]
440.35 471.05 30.7 35271 32725 -2546 5.04
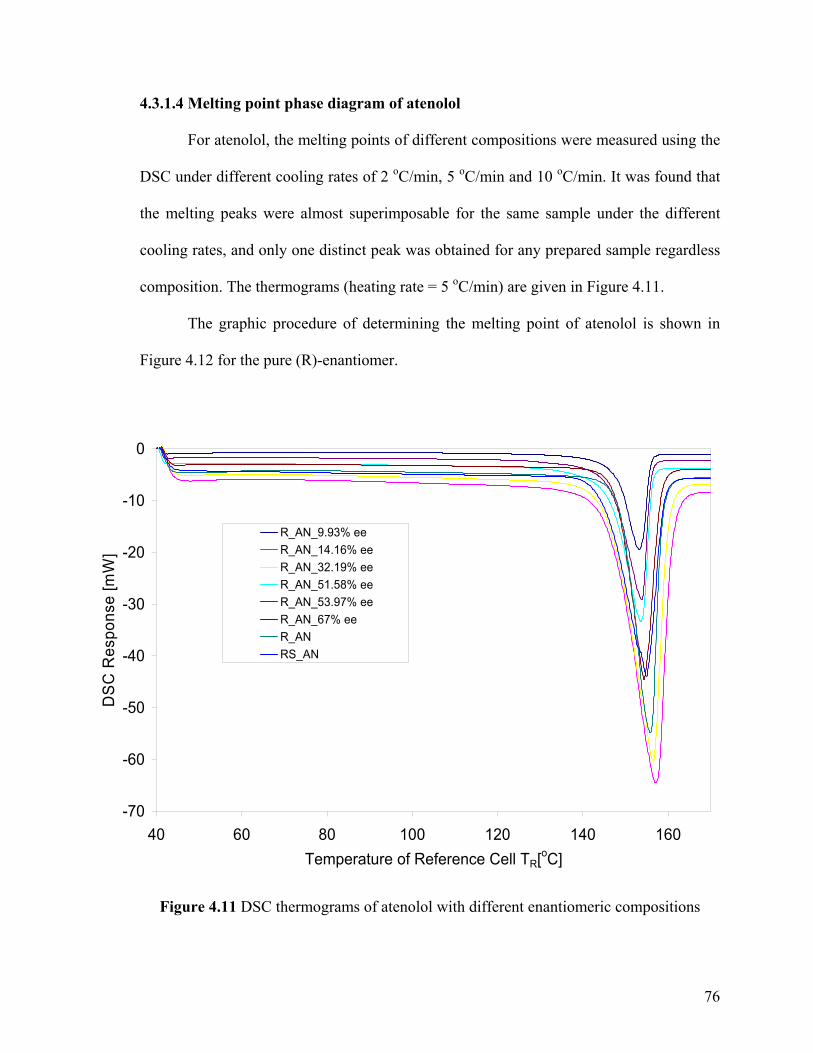
76
4.3.1.4 Melting point phase diagram of atenolol
For atenolol, the melting points of different compositions were measured using the
DSC under different cooling rates of 2 oC/min, 5 oC/min and 10 oC/min. It was found that
the melting peaks were almost superimposable for the same sample under the different
cooling rates, and only one distinct peak was obtained for any prepared sample regardless
composition. The thermograms (heating rate = 5 oC/min) are given in Figure 4.11.
The graphic procedure of determining the melting point of atenolol is shown in
Figure 4.12 for the pure (R)-enantiomer.
-70
-60
-50
-40
-30
-20
-10
0
40 60 80 100 120 140 160Temperature of Reference Cell TR[oC]
DS
C R
espo
nse
[mW
]
R_AN_9.93% eeR_AN_14.16% eeR_AN_32.19% eeR_AN_51.58% eeR_AN_53.97% eeR_AN_67% eeR_ANRS_AN
Figure 4.11 DSC thermograms of atenolol with different enantiomeric compositions

77
From the DSC thermograms, we can find the temperatures of the melting peaks of
different compositions are approximately identical (Table 4.7 and Figure 4.13). This
indicates that atenolol is an ideal pseudoracemate. This was also observed in Burger et al’s
work (Burger et al, 1999),while a very small difference (3 oC) was reported elsewhere (Li
et al., 1999).
-50
-45
-40
-35
-30
-25
-20
-15
-10
-5
0
40 60 80 100 120 140 160
Temperature of Reference Cell TR [oC]
DS
C R
espo
nse
[mW
]
Figure 4.12 Determination of temperatures of fusion (Tf) for atenolol
Tf
endotherm
β
Heating Rate: 5 oC/min β = 6.4 o

78
Table 4.7. Temperature of fusion of atenolol determined with differential scanning calorimetry (DSC)
X% Tf [oC] X% Tf [oC] X% Tf [oC]
100 148.0 100 148.0 100 148.0
83.50 148.0 83.50 148.0 83.50 148.0
76.99 148.0 76.99 148.0 76.99 148.0
75.79 147.8 75.79 147.8 75.79 147.8
66.10 148.2 66.10 148.2 66.10 148.2
57.08 148.3 57.08 148.3 57.08 148.3
54.97 148.0 54.97 148.0 54.97 148.0
50 148.0 50 148.0 50 148.0
Heating Rate = 2 oC/min Heating Rate = 5 oC/min Heating Rate = 10 oC/min

79
130
135
140
145
150
155
160
0 20 40 60 80 100Composition X%
Tem
pera
ture
[o C]
Experimental melting point_heating rate 5 K/min
Figure 4.13 Binary phase diagram (melting point diagram) of atenolol: ■, Experimental data: heating rate 5 oC/min.
The results of difference in the enthalpies of fusion of (R)- and (RS)-atenolol as
well as the entropy of mixing of (R)- and (S)-atenolol in the liquid state are given in Table
4.8. The negative value of mlS∆ also indicates the evident difference from a racemic
conglomerate or racemic compound.
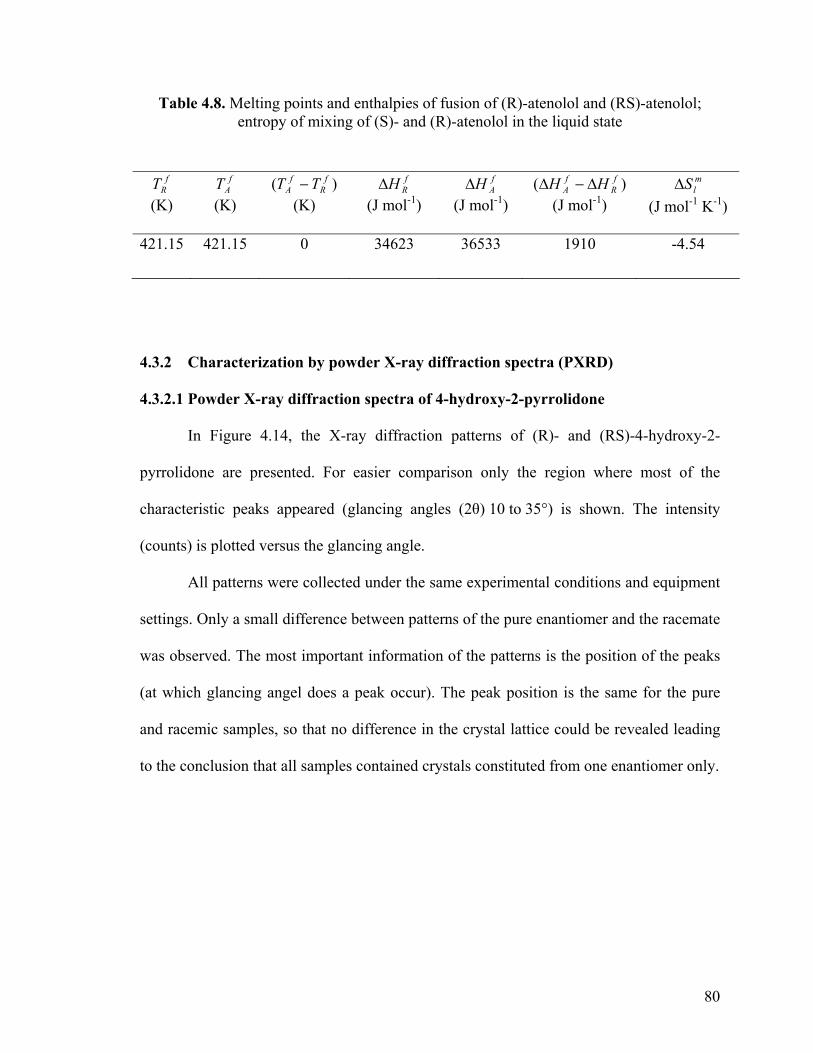
80
Table 4.8. Melting points and enthalpies of fusion of (R)-atenolol and (RS)-atenolol; entropy of mixing of (S)- and (R)-atenolol in the liquid state
4.3.2 Characterization by powder X-ray diffraction spectra (PXRD)
4.3.2.1 Powder X-ray diffraction spectra of 4-hydroxy-2-pyrrolidone
In Figure 4.14, the X-ray diffraction patterns of (R)- and (RS)-4-hydroxy-2-
pyrrolidone are presented. For easier comparison only the region where most of the
characteristic peaks appeared (glancing angles (2θ) 10 to 35°) is shown. The intensity
(counts) is plotted versus the glancing angle.
All patterns were collected under the same experimental conditions and equipment
settings. Only a small difference between patterns of the pure enantiomer and the racemate
was observed. The most important information of the patterns is the position of the peaks
(at which glancing angel does a peak occur). The peak position is the same for the pure
and racemic samples, so that no difference in the crystal lattice could be revealed leading
to the conclusion that all samples contained crystals constituted from one enantiomer only.
fRT
(K)
fAT
(K) )( f
Rf
A TT − (K)
fRH∆
(J mol-1)
fAH∆
(J mol-1) )( f
Rf
A HH ∆−∆ (J mol-1)
mlS∆
(J mol-1 K-1)
421.15 421.15 0 34623 36533 1910 -4.54

81
10 15 20 25 30 35
pure R-HP
racemic HP
Figure 4.14 Powder X-ray diffraction patterns of (R) and (RS)-4-hydroxy-2-pyrrolidone (glancing angles 2θ = 10 – 35o)
4.3.2.2 Powder X-ray diffraction spectra of N-methylephedrine
The PXRD patterns of pure enantiomer and racemic mixture of N-methylephedrine
are shown in Figure 4.15. The peak positions in the recorded PXRD patterns are
almost the same for the racemic mixture and the pure enantiomer. The difference in
peak intensity may be from the preferred orientation (Li et al., 1999).
This would be the case if the two separate enantiomers are present as a mechanical
mixture, which confirms that (±)-N-methylephedrine is a racemic conglomerate.
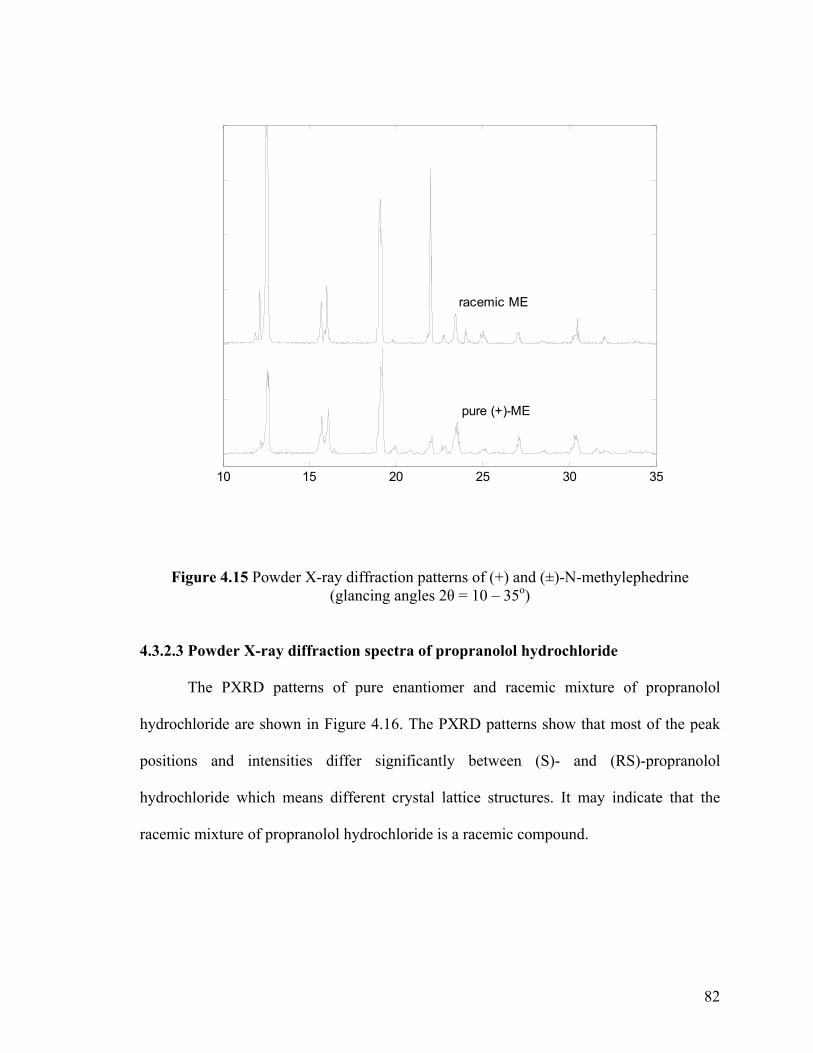
82
10 15 20 25 30 35
racemic ME
pure (+)-ME
Figure 4.15 Powder X-ray diffraction patterns of (+) and (±)-N-methylephedrine (glancing angles 2θ = 10 – 35o)
4.3.2.3 Powder X-ray diffraction spectra of propranolol hydrochloride
The PXRD patterns of pure enantiomer and racemic mixture of propranolol
hydrochloride are shown in Figure 4.16. The PXRD patterns show that most of the peak
positions and intensities differ significantly between (S)- and (RS)-propranolol
hydrochloride which means different crystal lattice structures. It may indicate that the
racemic mixture of propranolol hydrochloride is a racemic compound.

83
0 10 20 30 40 50 60 70
racemic PNCl
pure S- PNCl
Figure 4.16 Powder X-ray diffraction patterns of (S) and (RS)-propranolol hydrochloride (glancing angles 2θ = 5 – 70o)
4.3.3 Characterization by solid state fourier transform infrared spectra (FT-IR)
4.3.3.1 FT-IR spectra of 4-hydroxy-2-pyrrolidone
The solid state FT-IR spectra of (R)- and (RS)-4-hydroxy-2-pyrrolidone are shown
in Figure 4.17. As common practice in FT-IR spectroscopy, the spectra are plotted as
transmittance versus wavenumber.
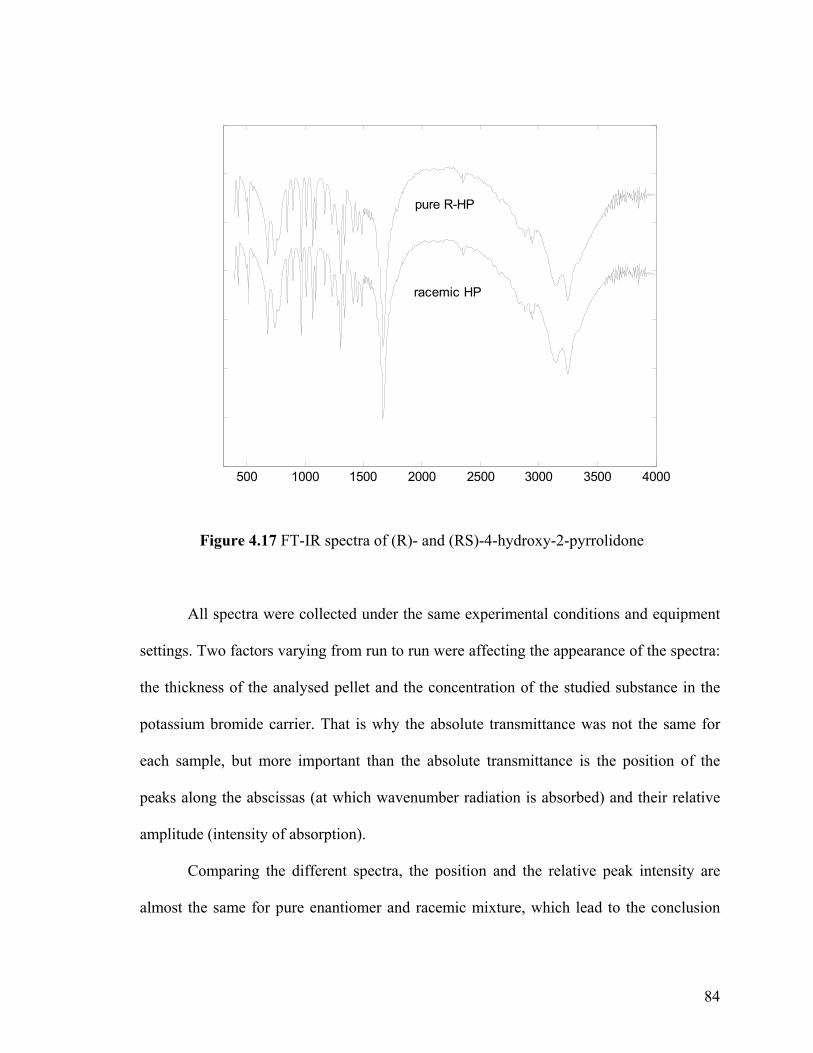
84
500 1000 1500 2000 2500 3000 3500 4000
racemic HP
pure R-HP
Figure 4.17 FT-IR spectra of (R)- and (RS)-4-hydroxy-2-pyrrolidone
All spectra were collected under the same experimental conditions and equipment
settings. Two factors varying from run to run were affecting the appearance of the spectra:
the thickness of the analysed pellet and the concentration of the studied substance in the
potassium bromide carrier. That is why the absolute transmittance was not the same for
each sample, but more important than the absolute transmittance is the position of the
peaks along the abscissas (at which wavenumber radiation is absorbed) and their relative
amplitude (intensity of absorption).
Comparing the different spectra, the position and the relative peak intensity are
almost the same for pure enantiomer and racemic mixture, which lead to the conclusion
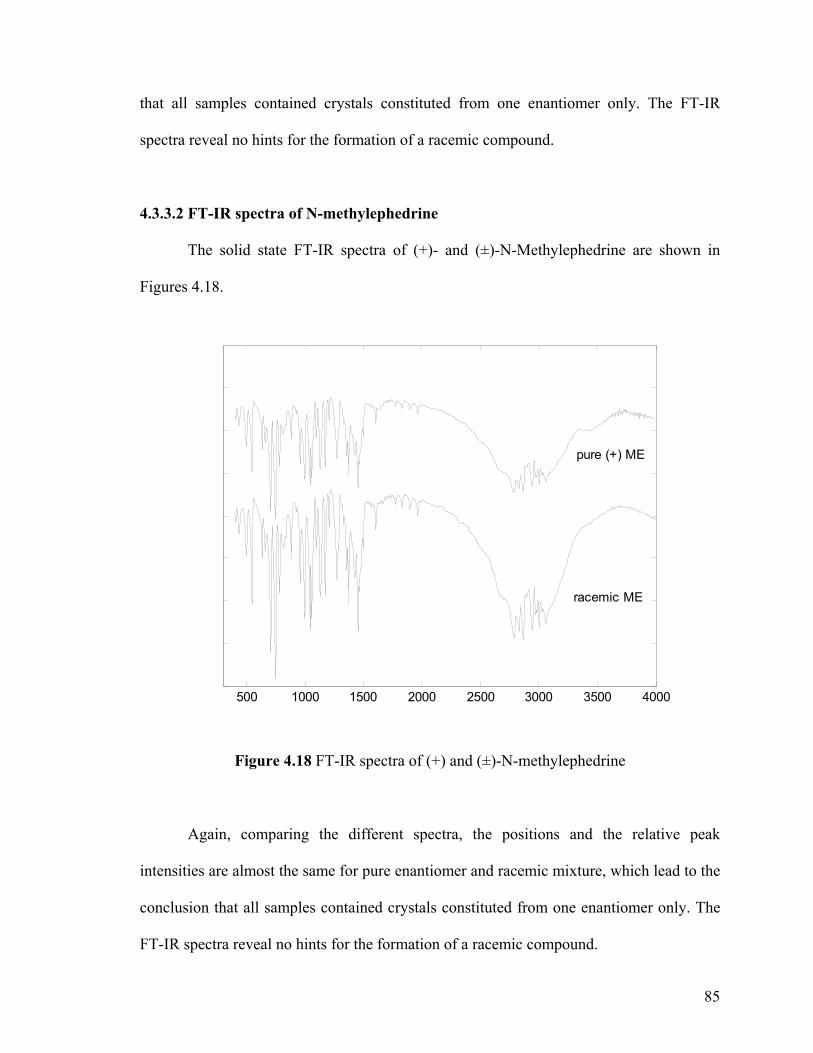
85
that all samples contained crystals constituted from one enantiomer only. The FT-IR
spectra reveal no hints for the formation of a racemic compound.
4.3.3.2 FT-IR spectra of N-methylephedrine
The solid state FT-IR spectra of (+)- and (±)-N-Methylephedrine are shown in
Figures 4.18.
500 1000 1500 2000 2500 3000 3500 4000
pure (+) ME
racemic ME
Figure 4.18 FT-IR spectra of (+) and (±)-N-methylephedrine
Again, comparing the different spectra, the positions and the relative peak
intensities are almost the same for pure enantiomer and racemic mixture, which lead to the
conclusion that all samples contained crystals constituted from one enantiomer only. The
FT-IR spectra reveal no hints for the formation of a racemic compound.
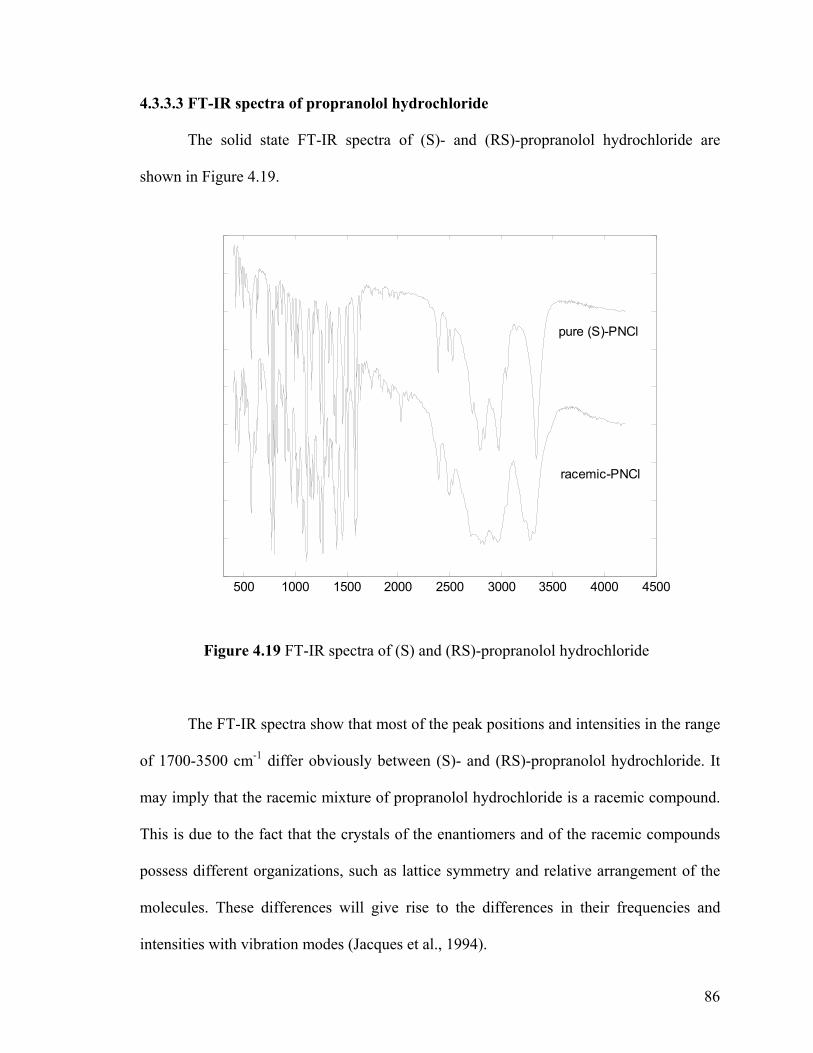
86
4.3.3.3 FT-IR spectra of propranolol hydrochloride
The solid state FT-IR spectra of (S)- and (RS)-propranolol hydrochloride are
shown in Figure 4.19.
500 1000 1500 2000 2500 3000 3500 4000 4500
pure (S)-PNCl
racemic-PNCl
Figure 4.19 FT-IR spectra of (S) and (RS)-propranolol hydrochloride
The FT-IR spectra show that most of the peak positions and intensities in the range
of 1700-3500 cm-1 differ obviously between (S)- and (RS)-propranolol hydrochloride. It
may imply that the racemic mixture of propranolol hydrochloride is a racemic compound.
This is due to the fact that the crystals of the enantiomers and of the racemic compounds
possess different organizations, such as lattice symmetry and relative arrangement of the
molecules. These differences will give rise to the differences in their frequencies and
intensities with vibration modes (Jacques et al., 1994).
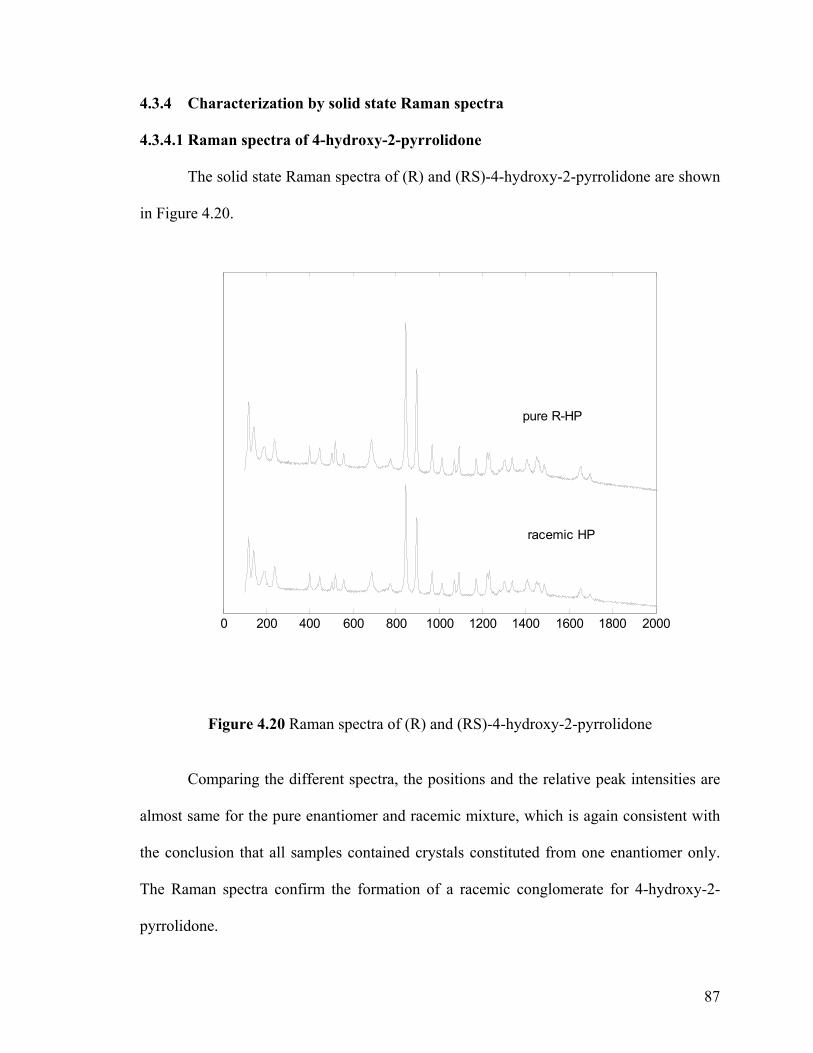
87
4.3.4 Characterization by solid state Raman spectra
4.3.4.1 Raman spectra of 4-hydroxy-2-pyrrolidone
The solid state Raman spectra of (R) and (RS)-4-hydroxy-2-pyrrolidone are shown
in Figure 4.20.
0 200 400 600 800 1000 1200 1400 1600 1800 2000
pure R-HP
racemic HP
Figure 4.20 Raman spectra of (R) and (RS)-4-hydroxy-2-pyrrolidone
Comparing the different spectra, the positions and the relative peak intensities are
almost same for the pure enantiomer and racemic mixture, which is again consistent with
the conclusion that all samples contained crystals constituted from one enantiomer only.
The Raman spectra confirm the formation of a racemic conglomerate for 4-hydroxy-2-
pyrrolidone.

88
4.3.4.2 Raman spectra of N-methylephedrine
The solid state Raman spectra of (+) and (±)-N-methylephedrine are shown in
Figure 4.21.
0 200 400 600 800 1000 1200 1400 1600 1800 2000
racemic ME
pure (+)-ME
Figure 4.21 Raman spectra of (+) and (±)-N-methylephedrine
From the Raman spectra, it can be seen the positions and the relative peak
intensities are almost same for the pure enantiomer and racemic mixture. It also indicates
that all samples contained crystals constituted from one enantiomer only. The Raman
spectra confirm the formation of a racemic conglomerate for N-methylephedrine.
4.3.4.3 Raman spectra of propranolol hydrochloride
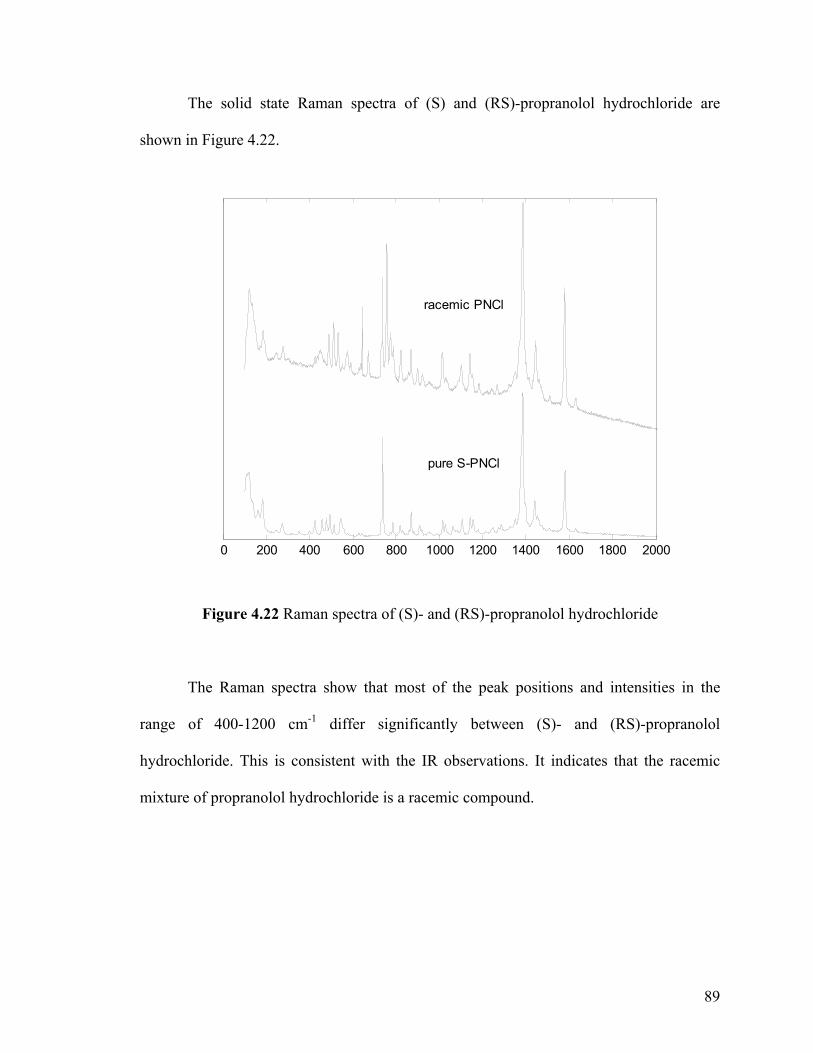
89
The solid state Raman spectra of (S) and (RS)-propranolol hydrochloride are
shown in Figure 4.22.
0 200 400 600 800 1000 1200 1400 1600 1800 2000
pure S-PNCl
racemic PNCl
Figure 4.22 Raman spectra of (S)- and (RS)-propranolol hydrochloride
The Raman spectra show that most of the peak positions and intensities in the
range of 400-1200 cm-1 differ significantly between (S)- and (RS)-propranolol
hydrochloride. This is consistent with the IR observations. It indicates that the racemic
mixture of propranolol hydrochloride is a racemic compound.

90
4.3.5 Characterization by solid state nuclear magnetic resonance (NMR)
In order to obtain an unambiguous characterization of racemic species for
propranolol hydrochloride, which is a more complex case, the solid state NMR spectra of
(S)- and (RS)-propranolol hydrochloride were also examined, as shown in Figure 4.23.
Figure 4.23 13C Solid state NMR spectra of (S)- and (RS)-propranolol hydrochloride
The solid state NMR spectra also differ significantly between (S)- and (RS)-
propranolol hydrochloride. Like the PXRD, the 13C chemical shifts for the pure
enantiomer and the racemic mixture are quite different, which means the asymmetric unit
contains two molecules with different molecule conformations which are
crystallographically nonequivalent (Maciel et al., 1988). This again confirms that the
racemic mixture of propranolol hydrochloride is a racemic compound.
170 160 150 140 130 120 110 100 90 80 70 60 50 40 30 20 ppm
91
4.4 Summary
Four racemic species, namely 4-hydroxy-2pyrrolidone, N-methylephedrine,
propranolol hydrochloride and atenolol were characterized with thermal analysis,
thermodynamic calculation and various spectroscopic techniques.
From the melting point phase diagrams, 4-hydroxy-2pyrrolidone and N-
methylephedrine can be classified as racemic conglomerate forming systems with a
eutectic composition of a racemic mixture (R:S =50%:50%). Based on the thermodynamic
quantities calculated from thermodynamic cycles, the positive values of the difference in
the enthalpies of fusion of pure-enantiomer and racemic mixture lie between 1600 and
5100 J mol-1; the values of entropies of mixing of the enantiomers in the liquid states are
close to Rln2. This is consistent with a typical conglomerate forming system. The close
match of the FTIR, Raman spectra and the PXRD patterns of pure-enantiomer and of its
corresponding racemic mixture further confirms that 4-hydroxy-2-pyrrolidone and N-
methylephedrine are racemic conglomerates.
In the case of propranolol hydrochloride, although the characteristic of the melting
point phase diagram is similar to the one of a conglomerate forming system, the evidently
negative value of the difference in the enthalpies of fusion of (S)- and (RS)-propranolol
hydrochloride indicates propranolol hydrochloride is a racemic compound favoring
system. The significant difference of the FT-IR, Raman spectra, PXRD patterns and NMR
spectra of pure-enantiomer and of its corresponding racemate again confirms that
propranolol hydrochloride is a racemic compound.
The obviously identical melting temperatures for atenolol with different
compositions undoubtedly indicate that atenolol is an ideal pseudoracemate forming
system.

92
The corresponding properties in solutions would be investigated in the following
Chapters.
Part of the results in this Chapter have been reported on Journal of Chemical and
Engineering Data, 48, pp.1092-1098. 2003, Chirality, 14, pp. 318-324, 2002 and
Chirality, 16, pp.220-227. 2004.

93
CHAPTER 5 CRYSTALLIZATION
THERMODYNAMICS: SOLUBILITY AND
METASTABLE ZONE
5.1 Introduction
In Chapter 4, four racemates, namely 4-hydroxy-2-pyrrolidone, N-
methylephedrine, propranolol hydrochloride, and atenolol were characterized into three
different types of racemic species using various techniques. It was shown that the binary
phase diagram allowed a first characterization of the racemic species of interest. For
solution crystallization, solvent is normally needed. Hence, it is the ternary phase diagram
that is essential for design and optimization of a reasonable separation process. The
prerequisite for direct crystallization from solution is the knowledge of the solid-liquid
equilibrium of the two enantiomers in a solvent. The introduction of a new third substance
(the solvent) increases the degree of the system. Therefore the measurement and
presentation of data are more complicated than those in the case of the binary phase
diagram.
Crystallization process can only take place in the supersaturated phase. The rates
of crystal nucleation and growth, as well as the crystal size distribution, are affected by the
degree of supersaturation (Mullin, 2001). Therefore, it is required to determine the
solubility (saturation limit) and supersolubility (supersaturation limit) diagram. The
difference in concentration (for constant temperature) or the difference in temperature (for
constant concentration) between solubility and supersolubility is called metastable zone

94
width (Ostwald, 1897; Ting et al., 1934; Nyvlt, 1968; Nyvlt et al., 1970; Sohnel and
Nyvlt, 1975; Mullin and Jancic, 1979; Kim and Ryu, 1997).
For preferential crystallization process, it is essential to keep the freedom of
supersaturation of the undesired enantiomer within its metastable zone to avoid its
spontaneous nucleation (Jacques et al., 1994; Collet, 1999). More importantly, the
metastable zone of the target enantiomer could be also closely related with the nucleation
of the unwanted isomer (Hongo et al., 1976, 1981; Black et al., 1989; Collins et al., 1997).
Therefore, to measure and interpret the metastable zone of both enantiomers in solution
should be very useful in understanding the preferential crystallization process, which has
been rarely reported.
The saturation curve (solubility) can be well-defined. For a given system (solute –
solvent) the saturation concentration is only dependent on temperature and pressure (of
which the latter can be neglected, unless very high pressure is considered). However, the
limit of the metastable zone (metastable zone width) is affected considerably by a variety
of process parameters including saturation temperature, rate of supersaturation generation,
impurity level, mixing, and solution history etc. It is therefore important to characterize
the metastable zone width under a specific set of operating conditions, which relate
closely to the conditions of the final scale crystallization. There are many methods
available to measure the metastable zone width. The polythermal technique is perhaps the
most widely used technique for determining the metastable zone width (Nyvlt, 1968;
Nyvlt et al., 1970; Sohnel and Nyvlt, 1975; Mullin and Jancic, 1979; Kim and Ryu, 1997).
This methodology involves cooling a saturated solution at a fixed rate until nucleation
occurs.
95
In practice, the value of metastable zone width strongly depends on the method of
detecting the onset of nucleation and dissolution. A wide variety of measurement
techniques can be applied to the detecting, such as visualization, electrozone sensing, laser
scattering and optical turbidity etc. In this work, the newly developed Lasentec Focused
Beam Reflectance Measurement (FBRM) (as described in Chapter 3) was used to
determine the nucleation and dissolution properties of the materials. The four
characterized racemates, namely 4-hydroxy-2-pyrrolidone, N-methylephedrine,
propranolol hydrochloride, and atenolol, were measured to obtain their solubility and
metastable zone data.
5.2 Experimental
5.2.1 Solvent selection
The selection of the suitable solvent for an effective crystallization operation is
crucial. Many factors must be considered. The solute to be crystallized should be readily
soluble in the solvent. It should also be easily deposited from the solution in the desired
crystalline form after cooling, evaporation or salting-out with an additive. Furthermore a
favorable dependency of solubility on temperature is desired if a cooling crystallization
process is considered. For easy controllability of the crystallization process and low loss
of solvent due to evaporation, a solvent with low vapor pressure is desired. In addition to
this, the solvent should be relatively cheap and easily available, not hazardous, stable
under all process conditions, and show a low viscosity etc. A mixture of two or more
solvents is sometimes found to possess the best properties for a particular crystallization
purpose (Nass, 1994; Mullin, 2001). This is especially important for the expensive pure
96
enantiomers of chiral systems. Therefore, some initial experiments were first conducted in
a 25 ml jacketed glass crystallizer with magnetic stirrer to screen the potential solvents.
5.2.2 Characterizing the metastable zone width and solubility curve using Lasentec
FBRM and PVM
The experimental set up (Figure 3.7) has been described in Chapter 3. Recently,
crystallization practitioners have become increasingly interested in the Focused Beam
Reflectance Method (FBRM), which allows on-line and in-situ measurements even in
systems with high solids concentrations. The principle of the FBRM measurement is
illustrated in Figure 3.6 (Barrett and Glennon, 1999; Worlitschek, 2003). The FBRM is
implemented using a cylindrical probe which can easily be located within the suspension
to be characterized. An infrared laser beam rotates at high velocity, propagating into the
suspension through a sapphire window on the probe tip. When the beam hits a particle, it
is reflected and propagated back through the probe window. This optical signal is then
processed by the device electronics and the corresponding chord length s is calculated as
the product of the measured crossing time ∆t and the beam velocity vb. Chord length
counts are summed up in a finite number of chord length intervals (channels in the
Lasentec jargon), thus yielding the chord length distribution (CLD). Several research
groups have used the FBRM method and proven its reliability to determine the MSZW
and monitor crystal size distributions on-line (Tadayyon and Rohani, 1998; Barrett and
Glennon, 1999, 2002; Ruf et al, 2000; Heath et al, 2002; Worlitschek and Mazzotti, 2003;
Barthe and Rousseau, 2006).
In this work, the metastable zone width, i.e. the difference between the properties
of onset of nucleation and dissolution was determined based on the measurements

97
sensitive to the changes in the solid phase with FBRM. These measurements were also
validated by the crystal images following nucleation and during dissolution by PVM
probe.
0
100
200
300
400
500
600
700
800
900
0 2000 4000 6000 8000 10000 12000
Time (Seconds)
Cou
nts
(#/s
)
Figure 5.1 FBRM data and temperature profile for a typical batch
Figure 5.2 A typical PVM imagine when nucleation occurred
Fine Counts
Coarse CountsNucleation
Dissolution
Temperature
T
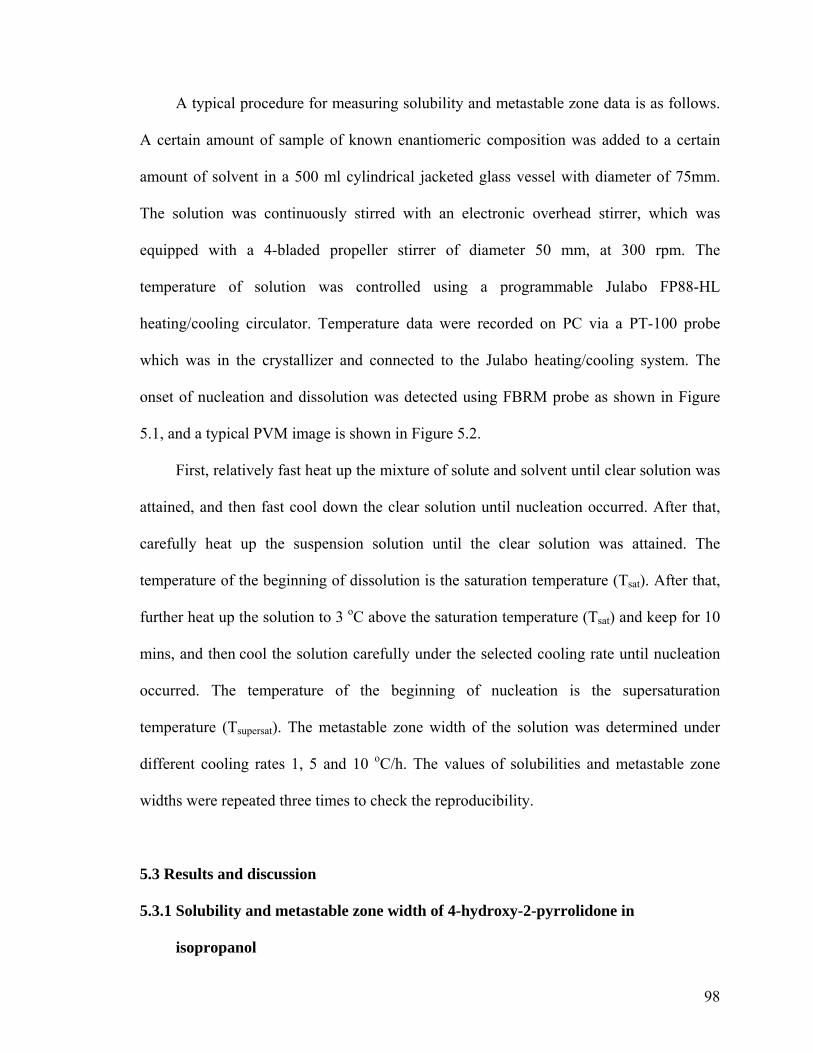
98
A typical procedure for measuring solubility and metastable zone data is as follows.
A certain amount of sample of known enantiomeric composition was added to a certain
amount of solvent in a 500 ml cylindrical jacketed glass vessel with diameter of 75mm.
The solution was continuously stirred with an electronic overhead stirrer, which was
equipped with a 4-bladed propeller stirrer of diameter 50 mm, at 300 rpm. The
temperature of solution was controlled using a programmable Julabo FP88-HL
heating/cooling circulator. Temperature data were recorded on PC via a PT-100 probe
which was in the crystallizer and connected to the Julabo heating/cooling system. The
onset of nucleation and dissolution was detected using FBRM probe as shown in Figure
5.1, and a typical PVM image is shown in Figure 5.2.
First, relatively fast heat up the mixture of solute and solvent until clear solution was
attained, and then fast cool down the clear solution until nucleation occurred. After that,
carefully heat up the suspension solution until the clear solution was attained. The
temperature of the beginning of dissolution is the saturation temperature (Tsat). After that,
further heat up the solution to 3 oC above the saturation temperature (Tsat) and keep for 10
mins, and then cool the solution carefully under the selected cooling rate until nucleation
occurred. The temperature of the beginning of nucleation is the supersaturation
temperature (Tsupersat). The metastable zone width of the solution was determined under
different cooling rates 1, 5 and 10 oC/h. The values of solubilities and metastable zone
widths were repeated three times to check the reproducibility.
5.3 Results and discussion
5.3.1 Solubility and metastable zone width of 4-hydroxy-2-pyrrolidone in
isopropanol
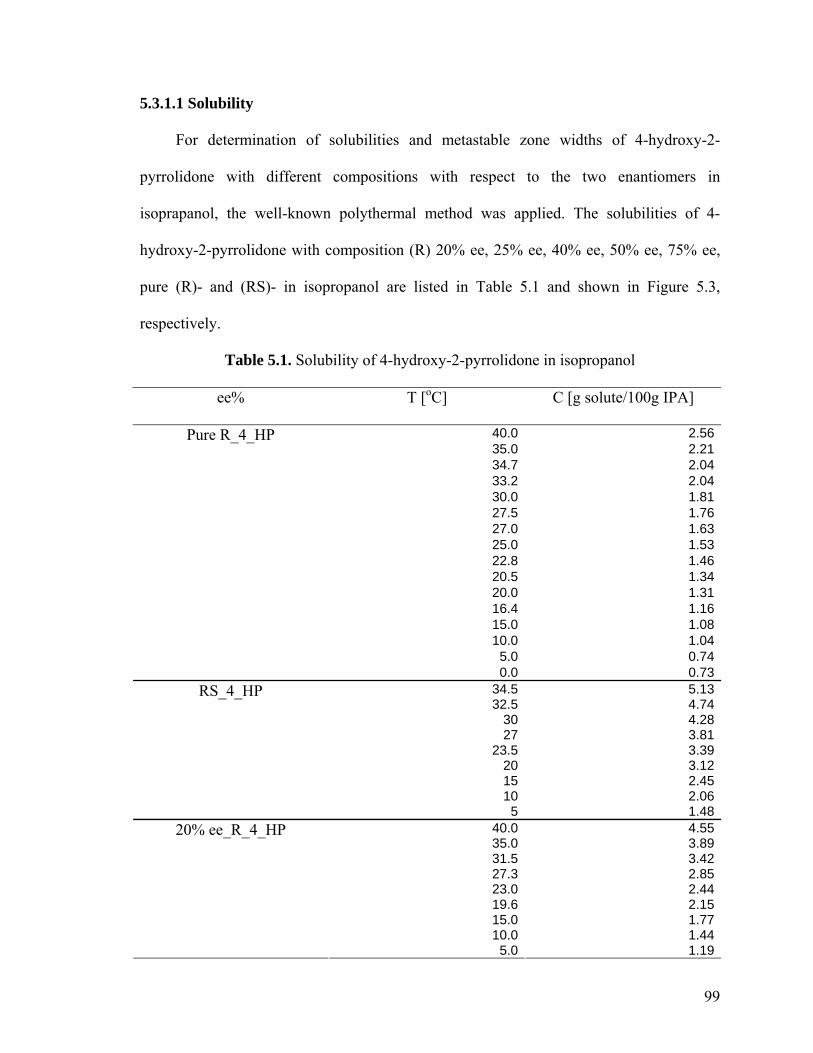
99
5.3.1.1 Solubility
For determination of solubilities and metastable zone widths of 4-hydroxy-2-
pyrrolidone with different compositions with respect to the two enantiomers in
isoprapanol, the well-known polythermal method was applied. The solubilities of 4-
hydroxy-2-pyrrolidone with composition (R) 20% ee, 25% ee, 40% ee, 50% ee, 75% ee,
pure (R)- and (RS)- in isopropanol are listed in Table 5.1 and shown in Figure 5.3,
respectively.
Table 5.1. Solubility of 4-hydroxy-2-pyrrolidone in isopropanol
ee% T [oC] C [g solute/100g IPA]
40.0 2.5635.0 2.2134.7 2.0433.2 2.0430.0 1.8127.5 1.7627.0 1.6325.0 1.5322.8 1.4620.5 1.3420.0 1.3116.4 1.1615.0 1.0810.0 1.04
5.0 0.74
Pure R_4_HP
0.0 0.7334.5 5.1332.5 4.74
30 4.2827 3.81
23.5 3.3920 3.1215 2.4510 2.06
RS_4_HP
5 1.4840.0 4.5535.0 3.8931.5 3.4227.3 2.8523.0 2.4419.6 2.1515.0 1.7710.0 1.44
20% ee_R_4_HP
5.0 1.19

100
35.0 3.7825.0 2.5720.0 2.1415.0 1.8510.0 1.68
25% ee_R_4_HP
5.0 1.6340.0 3.8035.0 3.2230.0 2.7125.0 2.2920.0 1.9315.0 1.6510.0 1.45
40% ee_R_4_HP
5.0 1.1835.0 3.1825.0 2.2320.0 1.8915.0 1.6810.0 1.56
50% ee_R_4_HP
5.0 1.5435.0 2.5925.0 1.9120.0 1.6815.0 1.4510.0 1.30
75% ee_R_4_HP
5.0 1.19
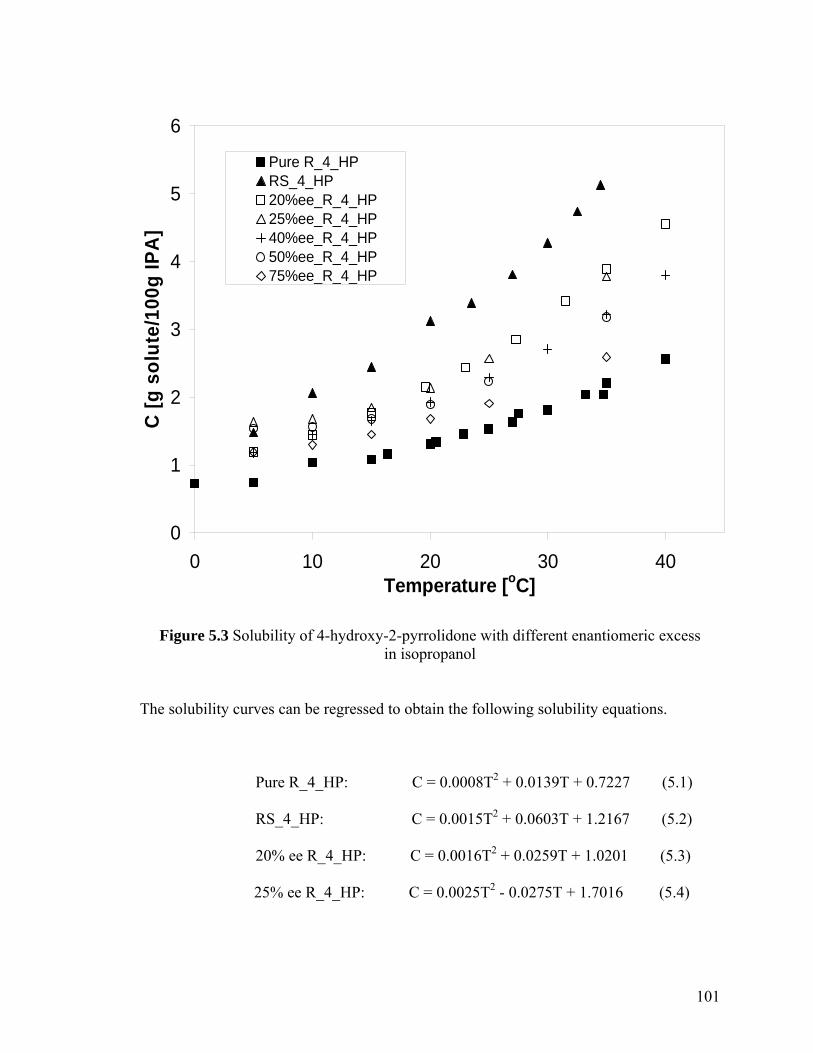
101
0
1
2
3
4
5
6
0 10 20 30 40Temperature [oC]
C [g
sol
ute/
100g
IPA
]Pure R_4_HPRS_4_HP20%ee_R_4_HP25%ee_R_4_HP40%ee_R_4_HP50%ee_R_4_HP75%ee_R_4_HP
Figure 5.3 Solubility of 4-hydroxy-2-pyrrolidone with different enantiomeric excess in isopropanol
The solubility curves can be regressed to obtain the following solubility equations.
Pure R_4_HP: C = 0.0008T2 + 0.0139T + 0.7227 (5.1)
RS_4_HP: C = 0.0015T2 + 0.0603T + 1.2167 (5.2)
20% ee R_4_HP: C = 0.0016T2 + 0.0259T + 1.0201 (5.3)
25% ee R_4_HP: C = 0.0025T2 - 0.0275T + 1.7016 (5.4)

102
40% ee R_4_HP: C = 0.0015T2 + 0.0025T + 1.2751 (5.5)
50% ee R_4_HP: C = 0.0021T2 - 0.0275T + 1.6271 (5.6)
75% ee R_4_HP: C = 0.0010T2 + 0.0066T+ 1.1320 (5.7)
As shown in Figure 5.3, the solubilities of (R)-, (RS)-, 20% ee, 25% ee, 40% ee,
50% ee, and 75% ee (R)-4-hydroxy-2-pyrrolidone in isopropanol all properly increase
with temperature over the range of 0 – 40 oC. The chosen solvent isopropanol is suitable
for cooling crystallization operation.
Figure 5.3 also shows that the solubilities decrease with increased ee. This is in
agreement with the general findings in conglomerate system that the racemate is more
soluble than the constituent enantiomers (Jacques et al., 1994). Actually, the solubility
ratio α of RS to R is circa 2.0-2.5 in the temperature range of 0 – 40 oC. This is quite close
to the old empirical “double solubility” rule proposed by Meyerhofer (1904). The current
system of 4-hydroxy-2-pyrrolidone in isopropanol appears to be close to ideal solution.
But the dissociation/association among the dissolved molecules of the enantiomers in
solution can be still observed as indicated by the ratio α of 2.5.
The range of the solubility ratio α of RS to R is more than 2, which suggests the
resolution of this system is not easy to carry out by direct crystallization. It was suggested
that the classical isothermal preferential crystallization process was not suitable for such
kind of case (Coquerel et al., 1990). In the case of α less than 2, the degree of
supersaturation of the undesired enantiomer will decrease during the crystallization and
therefore it is easy to obtain pure crystals with large extent of resolution. On the contrary,
when α is bigger than 2, the degree of supersaturation of the undesired enantiomer will
increase during the crystallization of its isomer and spontaneous nucleation could happen.

103
This is the major case for most of organic compounds (Collet et al., 1980; Jacques et al.,
1994).
It is also interesting to note that the solubility ratio of RS to R decreases from circa
2.5 at 35 oC to circa 2.0 at 5 oC. This suggests that the preferential crystallization of 4-
hydroxy-2-pyrrolidone in the chosen solvent is more favorable as temperature decreases.
As illustrated by Jacques et al. (1994), the decreased solubility ratio of RS- to R-4-
hydroxy-2-pyrrolidone means that the solution tends to decreasingly destabilize during the
course of the resolution process, with the consequence that the risk of spontaneous
nucleation of the undesired enantiomer is slowly increased. Therefore, special attention
should be paid to the supersaturation control for this case during the preferential
crystallization of this conglomerate. This will be elaborated in Chapter 7.
For studies on preferential crystallization, the ternary phase diagram of the two
enantiomers and solvent is helpful. The purpose of the ternary diagram is the visualization
of the whole preferential crystallization process as shown in Chapter 2 (Figure 2.2).
Furthermore it is especially helpful for layout of the crystallization step. More
importantly, it also assists to identify the racemic species besides the binary phase
diagram. Tables 5.2 – 5.9 are the solubilities of 4-hydroxy-2-pyrrolidone in isopropanol
with different ee at different temperatures.
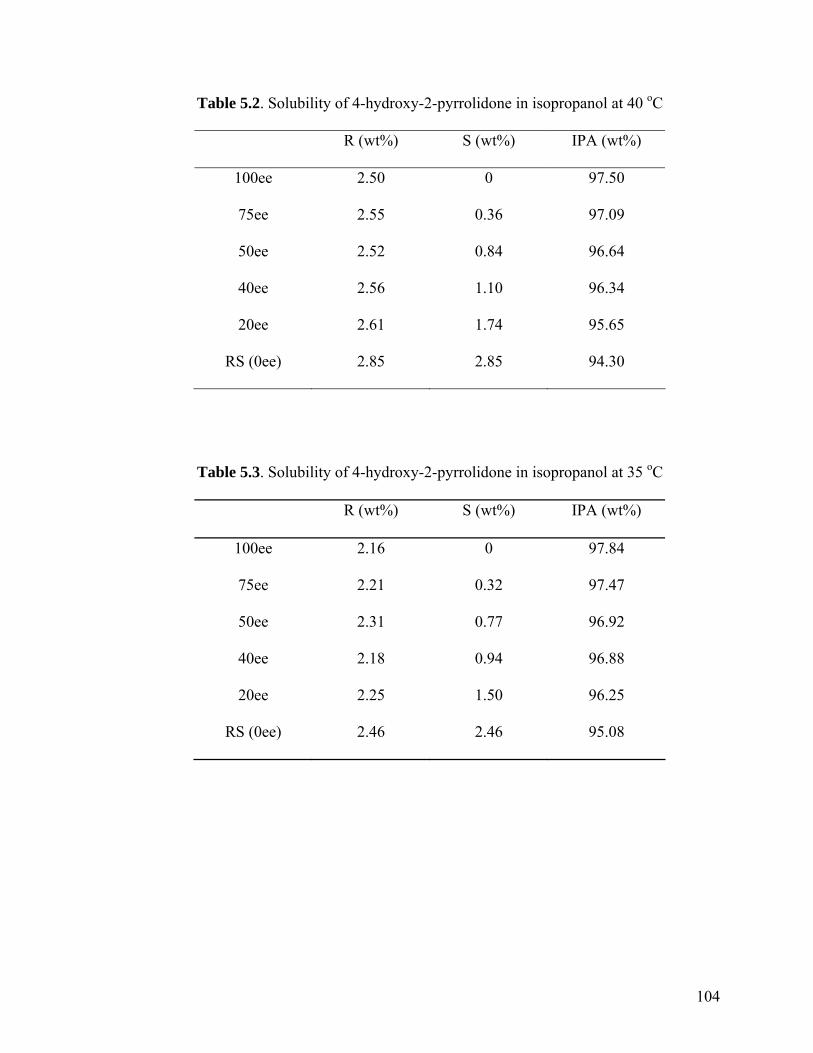
104
Table 5.2. Solubility of 4-hydroxy-2-pyrrolidone in isopropanol at 40 oC
R (wt%) S (wt%) IPA (wt%)
100ee 2.50 0 97.50
75ee 2.55 0.36 97.09
50ee 2.52 0.84 96.64
40ee 2.56 1.10 96.34
20ee 2.61 1.74 95.65
RS (0ee) 2.85 2.85 94.30
Table 5.3. Solubility of 4-hydroxy-2-pyrrolidone in isopropanol at 35 oC
R (wt%) S (wt%) IPA (wt%)
100ee 2.16 0 97.84
75ee 2.21 0.32 97.47
50ee 2.31 0.77 96.92
40ee 2.18 0.94 96.88
20ee 2.25 1.50 96.25
RS (0ee) 2.46 2.46 95.08

105
Table 5.4. Solubility of 4-hydroxy-2-pyrrolidone in isopropanol at 30 oC
R (wt%) S (wt%) IPA (wt%)
100ee 1.78 0 98.22
75ee 1.95 0.27 97.78
50ee 1.96 0.65 97.39
40ee 1.85 0.79 97.36
20ee 1.88 1.26 96.86
RS (0ee) 2.05 2.05 95.90
Table 5.5. Solubility of 4-hydroxy-2-pyrrolidone in isopropanol at 25 oC
R (wt%) S (wt%) IPA (wt%)
100ee 1.51 0 98.49
75ee 1.64 0.23 98.13
50ee 1.64 0.55 97.81
40ee 1.57 0.67 97.76
20ee 1.56 1.04 97.40
RS (0ee) 1.77 1.77 96.46

106
Table 5.6. Solubility of 4-hydroxy-2-pyrrolidone in isopropanol at 20 oC
R (wt%) S (wt%) IPA (wt%)
100ee 1.29 0 98.71
75ee 1.45 0.21 98.34
50ee 1.40 0.46 98.14
40ee 1.33 0.57 98.10
20ee 1.28 0.85 97.87
RS (0ee) 1.52 1.52 96.96
Table 5.7. Solubility of 4-hydroxy-2-pyrrolidone in isopropanol at 15 oC
R (wt%) S (wt%) IPA (wt%)
100ee 1.07 0 98.93
75ee 1.25 0.18 98.57
50ee 1.24 0.41 98.35
40ee 1.14 0.49 98.37
20ee 1.04 0.70 98.26
RS (0ee) 1.20 1.20 97.60
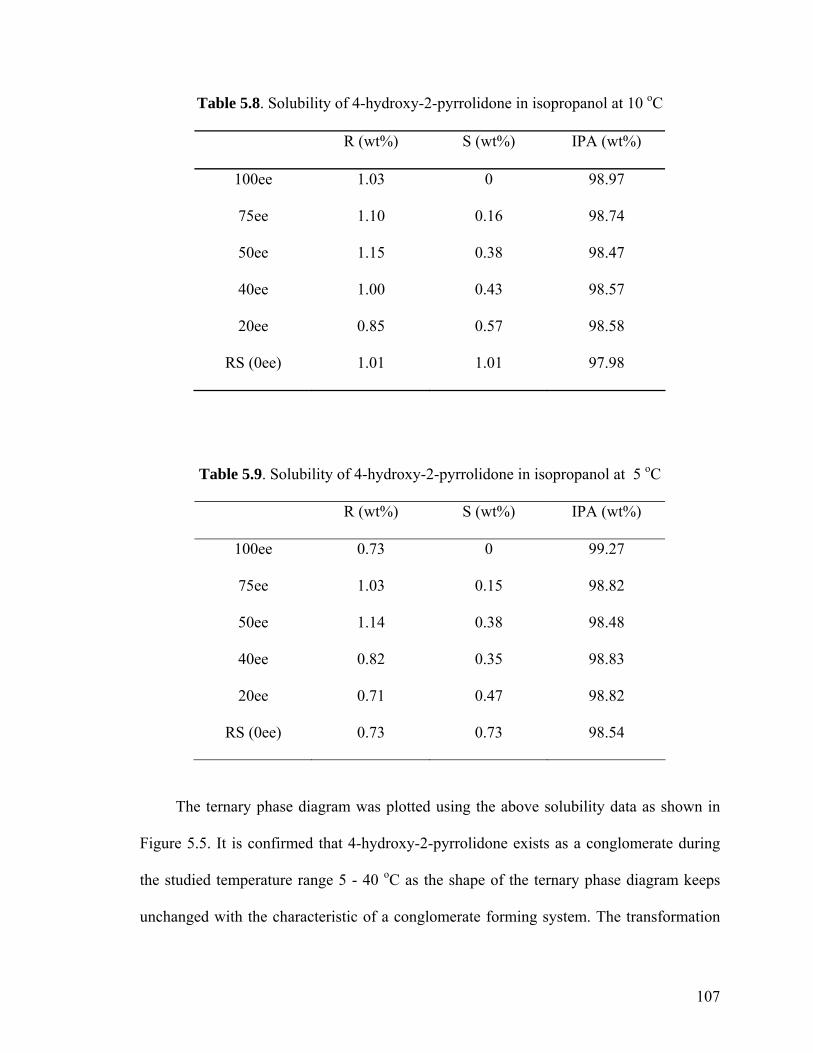
107
Table 5.8. Solubility of 4-hydroxy-2-pyrrolidone in isopropanol at 10 oC
R (wt%) S (wt%) IPA (wt%)
100ee 1.03 0 98.97
75ee 1.10 0.16 98.74
50ee 1.15 0.38 98.47
40ee 1.00 0.43 98.57
20ee 0.85 0.57 98.58
RS (0ee) 1.01 1.01 97.98
Table 5.9. Solubility of 4-hydroxy-2-pyrrolidone in isopropanol at 5 oC
R (wt%) S (wt%) IPA (wt%)
100ee 0.73 0 99.27
75ee 1.03 0.15 98.82
50ee 1.14 0.38 98.48
40ee 0.82 0.35 98.83
20ee 0.71 0.47 98.82
RS (0ee) 0.73 0.73 98.54
The ternary phase diagram was plotted using the above solubility data as shown in
Figure 5.5. It is confirmed that 4-hydroxy-2-pyrrolidone exists as a conglomerate during
the studied temperature range 5 - 40 oC as the shape of the ternary phase diagram keeps
unchanged with the characteristic of a conglomerate forming system. The transformation

108
of conglomerate to racemic compound is not uncommon (Collet et al., 1980; Houllemare-
Druot and Coquerel, 1998).
Figure 5.4 Ternary phase diagram of 4-hydroxy-2-pyrrolidone in isopropanol
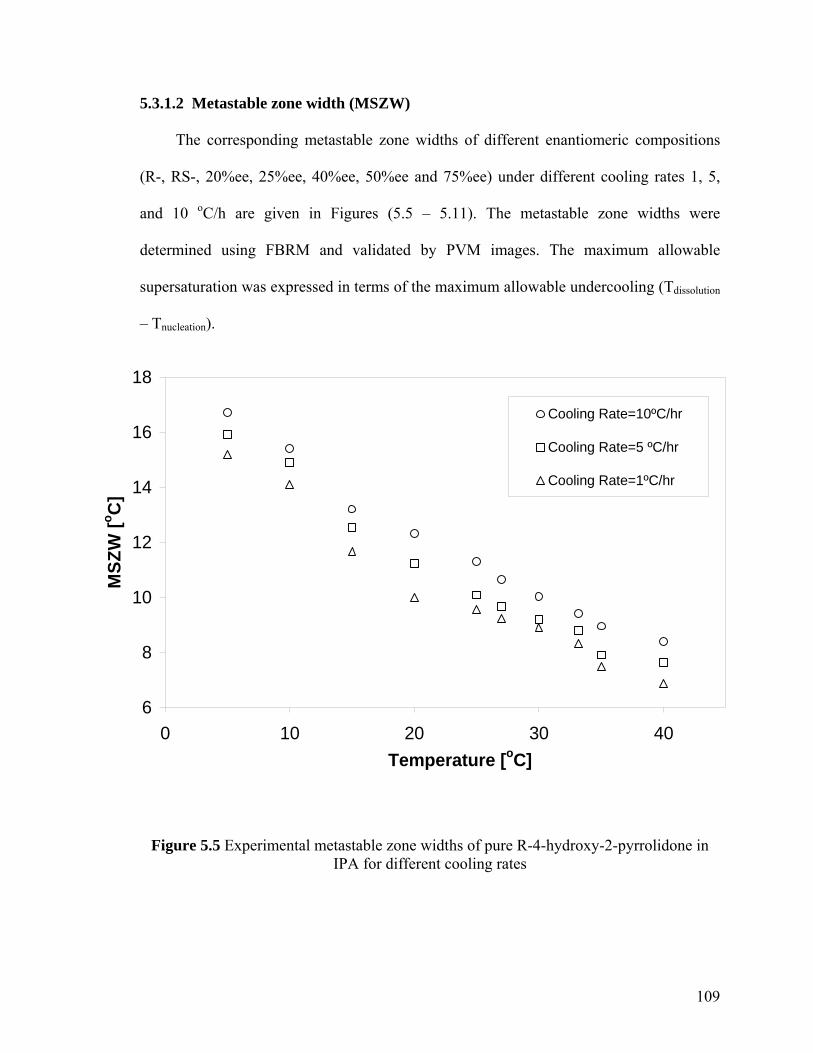
109
5.3.1.2 Metastable zone width (MSZW)
The corresponding metastable zone widths of different enantiomeric compositions
(R-, RS-, 20%ee, 25%ee, 40%ee, 50%ee and 75%ee) under different cooling rates 1, 5,
and 10 oC/h are given in Figures (5.5 – 5.11). The metastable zone widths were
determined using FBRM and validated by PVM images. The maximum allowable
supersaturation was expressed in terms of the maximum allowable undercooling (Tdissolution
– Tnucleation).
6
8
10
12
14
16
18
0 10 20 30 40Temperature [oC]
MSZ
W [o C
]
Cooling Rate=10ºC/hr
Cooling Rate=5 ºC/hr
Cooling Rate=1ºC/hr
Figure 5.5 Experimental metastable zone widths of pure R-4-hydroxy-2-pyrrolidone in IPA for different cooling rates

110
6
8
10
12
14
16
18
20
0 10 20 30 40Temperature [oC]
MSZ
W [o C
]Cooling Rate=10 ºC /hrCooling Rate=5 ºC/hrCooling Rate=1 ºC/hr
Figure 5.6 Experimental metastable zone widths of RS-4-hydroxy-2-pyrrolidone in IPA for different cooling rates

111
6
8
10
12
14
16
18
0 10 20 30 40Temperature [oC]
MSZ
W [o C
]
Cooling Rate=10 ºC/hr
Cooling Rate=5 ºC/hr
Cooling Rate=1 ºC/hr
Figure 5.7 Experimental metastable zone widths of R-20%ee-4-hydroxy-2-pyrrolidone in IPA for different cooling rates
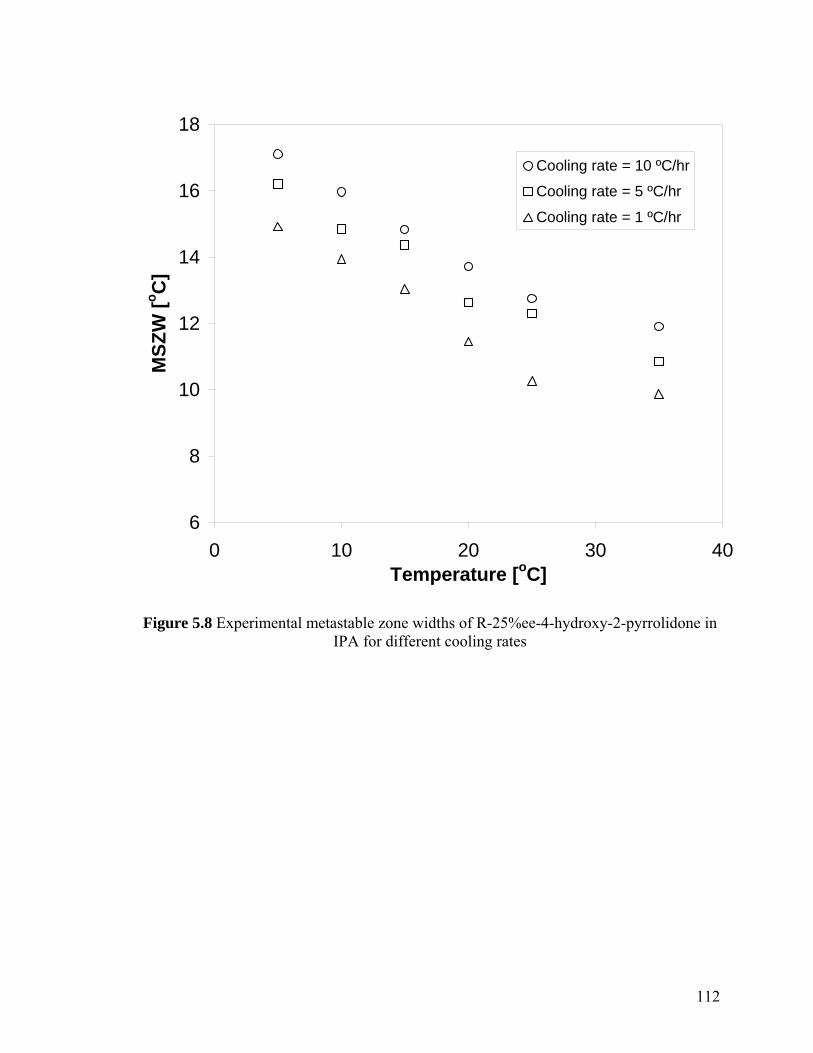
112
6
8
10
12
14
16
18
0 10 20 30 40Temperature [oC]
MSZ
W [o C
]Cooling rate = 10 ºC/hr
Cooling rate = 5 ºC/hr
Cooling rate = 1 ºC/hr
Figure 5.8 Experimental metastable zone widths of R-25%ee-4-hydroxy-2-pyrrolidone in IPA for different cooling rates

113
6
8
10
12
14
16
18
20
0 10 20 30 40Temperature [oC]
MSZ
W [o C
]Cooling rate = 10 ºC/hrCooling rate = 5 ºC/hrCooling rate = 1 ºC/hr
Figure 5.9 Experimental metastable zone widths of R-40%ee-4-hydroxy-2-pyrrolidone in IPA for different cooling rates
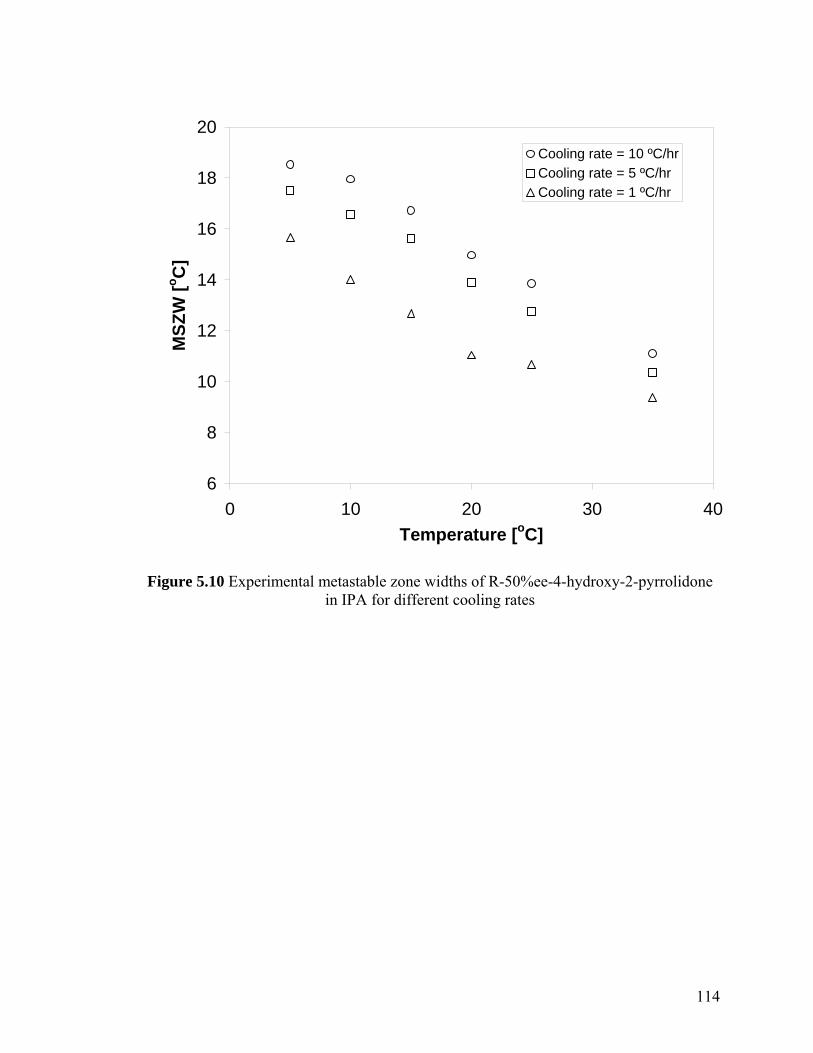
114
6
8
10
12
14
16
18
20
0 10 20 30 40Temperature [oC]
MSZ
W [o C
]Cooling rate = 10 ºC/hrCooling rate = 5 ºC/hrCooling rate = 1 ºC/hr
Figure 5.10 Experimental metastable zone widths of R-50%ee-4-hydroxy-2-pyrrolidone in IPA for different cooling rates
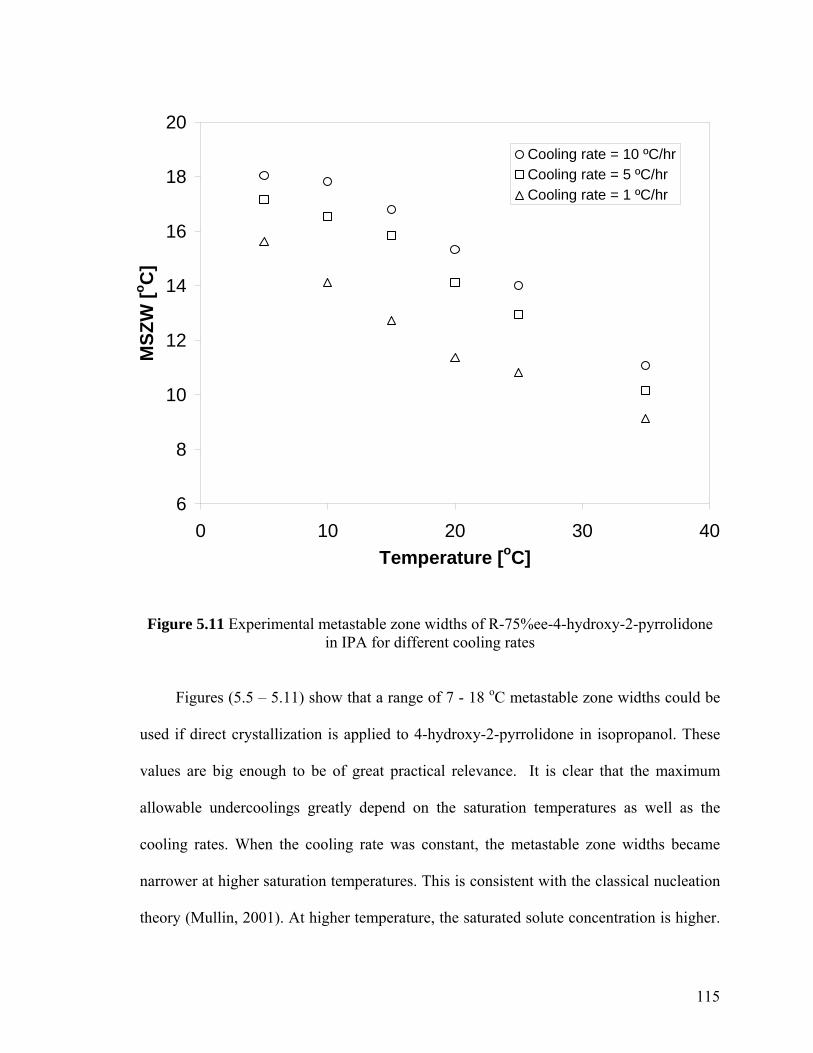
115
6
8
10
12
14
16
18
20
0 10 20 30 40Temperature [oC]
MSZ
W [o C
]Cooling rate = 10 ºC/hrCooling rate = 5 ºC/hrCooling rate = 1 ºC/hr
Figure 5.11 Experimental metastable zone widths of R-75%ee-4-hydroxy-2-pyrrolidone
in IPA for different cooling rates
Figures (5.5 – 5.11) show that a range of 7 - 18 oC metastable zone widths could be
used if direct crystallization is applied to 4-hydroxy-2-pyrrolidone in isopropanol. These
values are big enough to be of great practical relevance. It is clear that the maximum
allowable undercoolings greatly depend on the saturation temperatures as well as the
cooling rates. When the cooling rate was constant, the metastable zone widths became
narrower at higher saturation temperatures. This is consistent with the classical nucleation
theory (Mullin, 2001). At higher temperature, the saturated solute concentration is higher.

116
Therefore, there would be more molecules and more chances for molecule additions to the
critical cluster which would result in faster nucleation and subsequent growth of the
observable nucleus.
However, it is most interesting to notice that there was no significant difference of
MSZWs under the similar operating conditions when the enantiomeric excess changed
from 0 (RS) to 100% (pure R) and the corresponding solubility decreased almost 50%.
This could be one of the characteristics of a conglomerate forming system. In solution,
although the physical properties of both R and S are the same, the two enantiomers
respond separately to form crystal nucleus, which means that the MSZW will be
dependent on only concentration of isolated enantiomer. The following relationship of
MSZWs with cooling rates will give some further quantitative analysis.
As discussed by Mullin (2001), the empirical power law is widely used to describe
the primary nucleation in industrial crystallizer.
nn ckJ max∆= (5.8)
where J is the primary nucleation rate, kn is the nucleation rate constant and ∆cmax is the
maximum allowable supersaturation (MSZW).
In the mean time, the nucleation rate can be derived from classical nucleation
relationship ( Nyvlt, 1968) in terms of cooling rate q.
dTdCqJ *
= (5.9)
The relationship of ∆cmax and ∆Tmax can be expressed as

117
dTdCTc *
maxmax ∆=∆ (5.10)
The above Equations (5.8 – 5.10) can be combined to get
nkdT
dCnTnq log*log)1(loglog max +−+∆= (5.11)
This equation indicates that log q is linearly dependent on log ∆Tmax with a straight
line of slope n.
Figures 5.12 and 5.13 present the relationship of log ∆Tmax with log q for RS and
20ee% respectively. Good linearity can be observed for most of the data points. Indeed,
the regressed n for RS is in the range of 5.3 - 7.4. A slope of circa 7-19 could cover most
of the other data sets, namely for pure R (n=11-19), 20%ee(R) (n=10-19), 25%ee(R)
(n=10-18), 40%ee(R) (n=7-14), 50%ee(R) (n=7-14) and 75%ee(R) (8-16). This is again
consistent with the previous observations that MSZW is independent of enantiomeric
excess.
It is obvious that the apparent primary nucleation order of RS is generally smaller
than those of other cases, especially pure R, 20%ee and 25%ee. As discussed in Chapter 4,
for conglomerate system, the two isomers respond separately to form crystal nucleus.
Therefore, for solutions of pure R or with certain R enantiomeric excess, it is expected
only R form nucleus at least during the very initial period and ∆Tmax is only related with
supersaturation of R. But for RS, two isomers should form nucleus at the same time and
the contribution to the apparent nucleation rate is the addition of both R and S isomers. If
the observable nucleation rate is assumed to be constant, Equation 5.8 can be rewritten as

118
maxlog/logc
kJn n
∆= (5.12)
The nucleation rate constant kn can be considered the same for both R and S
enantiomers. Therefore, the above equation indicates the apparent primary nucleation
order n for pure R or with certain ee% should be smaller than that of RS solution, which is
what was exactly observed.
It is also very interesting to note that small apparent primary nucleation order n
(circa 7-8) was also observed in several cases for (R) 40 ee% -75ee%. This could be due
to some extent of nucleation of S, which could initiate itself or could be induced by
spontaneous nucleation of R when the supersaturation surpasses a critical level.
Actually, when high supersaturations within the metastable zone are used, some
conglomerates will form crystals that contain domains of both lattices in a single crystal,
which means that the enantiomerically pure seed could nucleate the other enantiomer at its
surface. One typical example is in the synthesis of agrochemical paclobutrazol where
resolution of a racemic chiral ketone is involved (Black et al., 1989; Collins et al., 1997).
Only when very low supersaturation (1 oC undercooling) was used, did the effects of
nucleating the unwanted isomer disappear to give the product with a high optical purity.
This phenomenon at higher supersaturation was also observed on β-phenylglyceric acid
(Furberg and Hassel, 1950).
Hongo et.al. (1981) showed the stability of supersaturated DL-serine m-xylene-4-
sulfonate dehydrate and identified two metastable regions where the supersaturation was
relatively unstable in the second region. In the studies of nuclei breeding from a chiral
crystal seed of NaClO3 (Denk and Botsaris, 1972; Kondepudi et al., 1990, 1993, 1995;
McBride and Carte, 1991; Yokota and Toyokura, 1992; Qian and Botsaris, 1997, 1998), it
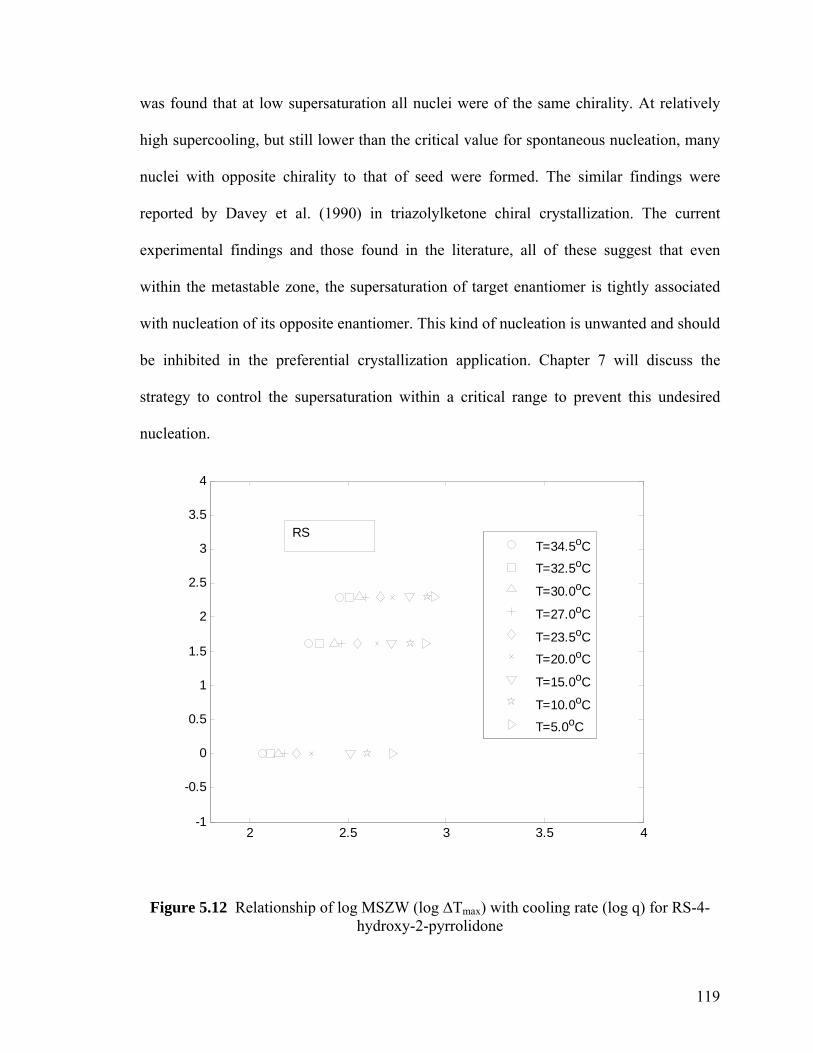
119
was found that at low supersaturation all nuclei were of the same chirality. At relatively
high supercooling, but still lower than the critical value for spontaneous nucleation, many
nuclei with opposite chirality to that of seed were formed. The similar findings were
reported by Davey et al. (1990) in triazolylketone chiral crystallization. The current
experimental findings and those found in the literature, all of these suggest that even
within the metastable zone, the supersaturation of target enantiomer is tightly associated
with nucleation of its opposite enantiomer. This kind of nucleation is unwanted and should
be inhibited in the preferential crystallization application. Chapter 7 will discuss the
strategy to control the supersaturation within a critical range to prevent this undesired
nucleation.
2 2.5 3 3.5 4-1
-0.5
0
0.5
1
1.5
2
2.5
3
3.5
4
T=34.5oC
T=32.5oC
T=30.0oC
T=27.0oC
T=23.5oC
T=20.0oC
T=15.0oC
T=10.0oC
T=5.0oC
RS
Figure 5.12 Relationship of log MSZW (log ∆Tmax) with cooling rate (log q) for RS-4-hydroxy-2-pyrrolidone
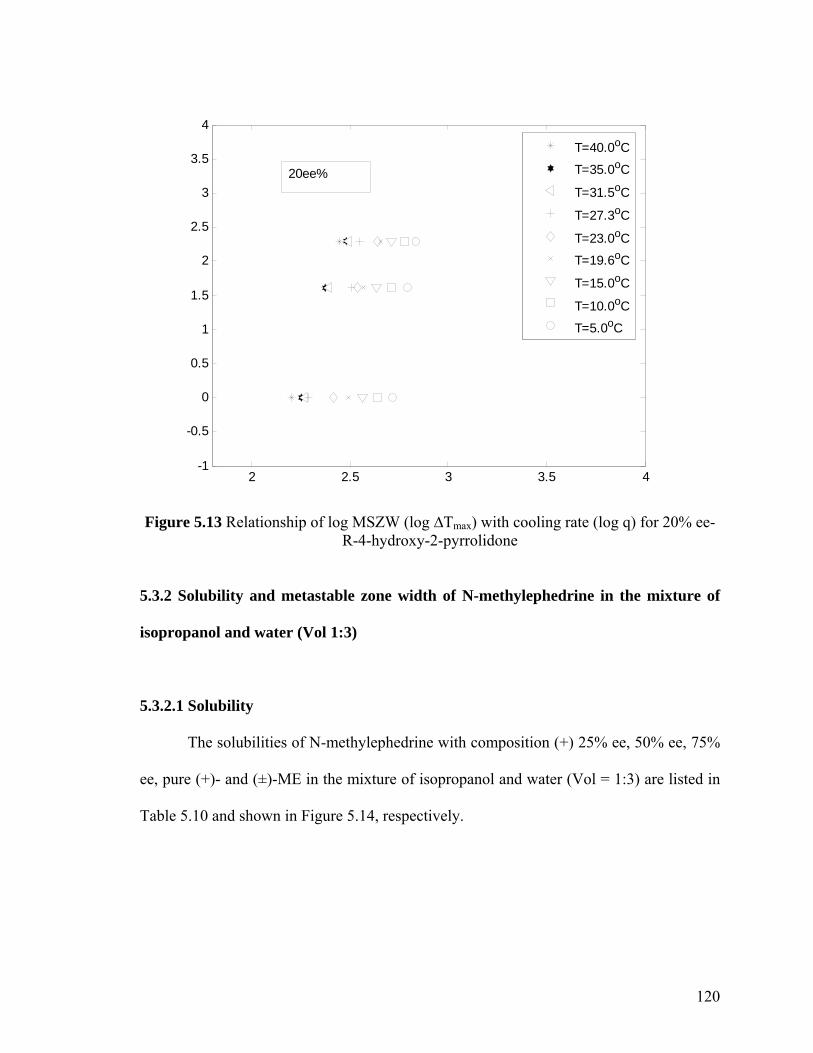
120
2 2.5 3 3.5 4-1
-0.5
0
0.5
1
1.5
2
2.5
3
3.5
4
T=40.0oC
T=35.0oC
T=31.5oC
T=27.3oC
T=23.0oC
T=19.6oC
T=15.0oC
T=10.0oC
T=5.0oC
20ee%
Figure 5.13 Relationship of log MSZW (log ∆Tmax) with cooling rate (log q) for 20% ee-
R-4-hydroxy-2-pyrrolidone
5.3.2 Solubility and metastable zone width of N-methylephedrine in the mixture of
isopropanol and water (Vol 1:3)
5.3.2.1 Solubility
The solubilities of N-methylephedrine with composition (+) 25% ee, 50% ee, 75%
ee, pure (+)- and (±)-ME in the mixture of isopropanol and water (Vol = 1:3) are listed in
Table 5.10 and shown in Figure 5.14, respectively.

121
Table 5.10. Solubility of N-methylephedrine in the mixture of isopropanol and water (Vol = 1:3)
ee% T [oC] C [g solute/100g solvent]
30 2.2625 1.7620 1.39
Pure (+)_ME
15 1.1430 6.9625 5.2820 3.75
(±)_ME
15 2.8830 4.4525 3.2520 2.42
25% ee_(+)_ME
15 1.9730 3.3725 2.5520 2.00
50% ee_(+)_ME
15 1.6330 2.6825 2.0320 1.63
75% ee_(+)_ME
15 1.34

122
0
1
2
3
4
5
6
7
8
0 5 10 15 20 25 30 35Temperature [oC]
C [g
sol
ute/
100g
sol
vent
]Pure (+)_N_ME(±)_N_ME25%ee_(+)_N_ME50%ee_(+)_N_ME75%ee_(+)_N_ME
Figure 5.14 Solubility of N-methylephedrine with different enantiomeric excess in the mixture of isopropanol and water (Vol 1:3)
The solubility curves can be regressed to obtain the following solubility equations.
Pure_(+)_N_ME: C = 0.0025T2 - 0.0379T + 1.1465 (5.13)
(±)_N_ME: C = 0.0081T2 - 0.0891T + 2.3685 (5.14)
25%ee_(+)_N_ME: C = 0.0075T2 - 0.1721T + 2.8635 (5.15)
50%ee_(+)_N_ME: C = 0.0045T2 - 0.0871T + 1.9285 (5.16)
75%ee_(+)_N_ME: C = 0.0036T2 - 0.0736T + 1.641 (5.17)
123
The solubilities of (+)-, (±)-, 25% ee, 50% ee, and 75% ee (+)- N-methylephedrine in
isopropanol and water properly increase with temperature over the range of 15 – 30 oC.
The solubility ratio of (±)- to (+)-ME is between 2.5 and 3.1 in the current temperature
range. It is bigger than that of 4-hydroxy-2-pyrrolidone. Although the solubility ratio of
(±)- to (+)-ME also decreases from high temperature to low one, this system appears more
difficult to purify using preferential crystallization technique than 4-hydroxy-2-
pyrrolidone system as the solubility ratio of (±)- to (+)-ME is higher (Jacques et al., 1994).
Figure 5.15 shows the ternary phase diagram. Like 4-hydroxy-2-pyrrolidone in
isopropanol, N-methylephedrine exists as a conglomerate in the chosen solvent during the
studied temperature range 15-30 oC because the shape of its ternary phase diagram
possesses the characteristic of a conglomerate system.

124
Figure 5.15 Ternary phase diagram of N-methylephedrine in the mixture of isopropanol and water (Vol 1:3)
5.3.2.2 Metastable zone width (MSZW)
The corresponding metastable zone widths measurements are given in Figure 5.16.
The metastable zone widths were determined using FBRM and PVM. The maximum
allowable supersaturation was expressed in terms of the maximum allowable undercooling
(Tdissolution – Tnucleation). When the cooling rate was constant, the metastable zone widths
became narrower at higher saturation temperatures.

125
Similar to that of 4-hydroxy-2-pyrrolidone system, the MSZW of N-
methylephedrine in water and isopropanol is also independent of enantiomer excess. This
is again one of the characteristics for a conglomerate.
0
2
4
6
8
10
12
14
10 15 20 25 30 35Temperature [oC]
MSZ
W [o C
]
Pure (+)_N_ME(±)_N_ME25%ee_(+)_N_ME50%ee_(+)_N_ME75%ee_(+)_N_ME
Figure 5.16 Experimental metastable zone widths of N-methylephedrine in the mixture of
IPA and water (Vol = 1:3) for different enantiomeric excess
Cooling rate = 2 oC/hr

126
5.3.3 Solubility and metastable zone width of propranolol hydrochloride in the
mixture of methanol and isopropanol (Vol 1:5)
5.3.3.1 Solubility
The solubilities of propranolol hydrochloride with composition (R) 30% ee, 50%ee,
70% ee, pure R- and RS- in the mixture of methanol and isopropanol (Vol=1:5) are listed
in Table 5.11 and shown in Figure 5.17, respectively.
Table 5.11. Solubility of propranolol hydrochloride in the mixture of methanol and isopropanol (Vol = 1:5)
ee% T [oC] C [g solute/100g solvent]
35 1.2130.6 1.1028.6 1.00
23 0.8619 0.7516 0.69
Pure (R)_PN_Cl
12 0.6435 1.81
30.6 1.6728.6 1.48
23 1.2119 1.0316 0.95
(RS)_PN_Cl
12 0.8635 1.56
30.6 1.4523 1.0719 0.93
30% ee_(R)_PN_Cl
16 0.8635 1.45
30.6 1.3423 1.0119 0.88
50% ee_(R)_PN_Cl
16 0.8135 1.34
30.6 1.2223 0.9419 0.82
70% ee_(R)_PN_Cl
16 0.76

127
0
0.2
0.4
0.6
0.8
1
1.2
1.4
1.6
1.8
2
0 10 20 30 40Temperature [oC]
C [g
Sol
ute/
100g
Sol
vent
]Pure_R_PN_ClRS_PN_Cl30%ee_R_PN_Cl50%ee_R_PN_Cl70%ee_R_PN_Cl
Figure 5.17 Solubility of propranolol hydrochloride with different enantiomeric excess in the mixture of methanol and isopropanol (Vol 1:5)
The solubility curves can be regressed to obtain the following solubility equations.
Pure_R_PN_Cl: C = 0.0004T2 + 0.0047T + 0.5092 (5.18)
RS_PN_Cl: C = 0.0008T2 + 0.0077T + 0.636 (5.19)
30%ee_R_PN_Cl: C = 0.0002T2 + 0.0296T + 0.3166 (5.20)
50%ee_R_PN_Cl: C = 0.0001T2 + 0.0281T + 0.3078 (5.21)
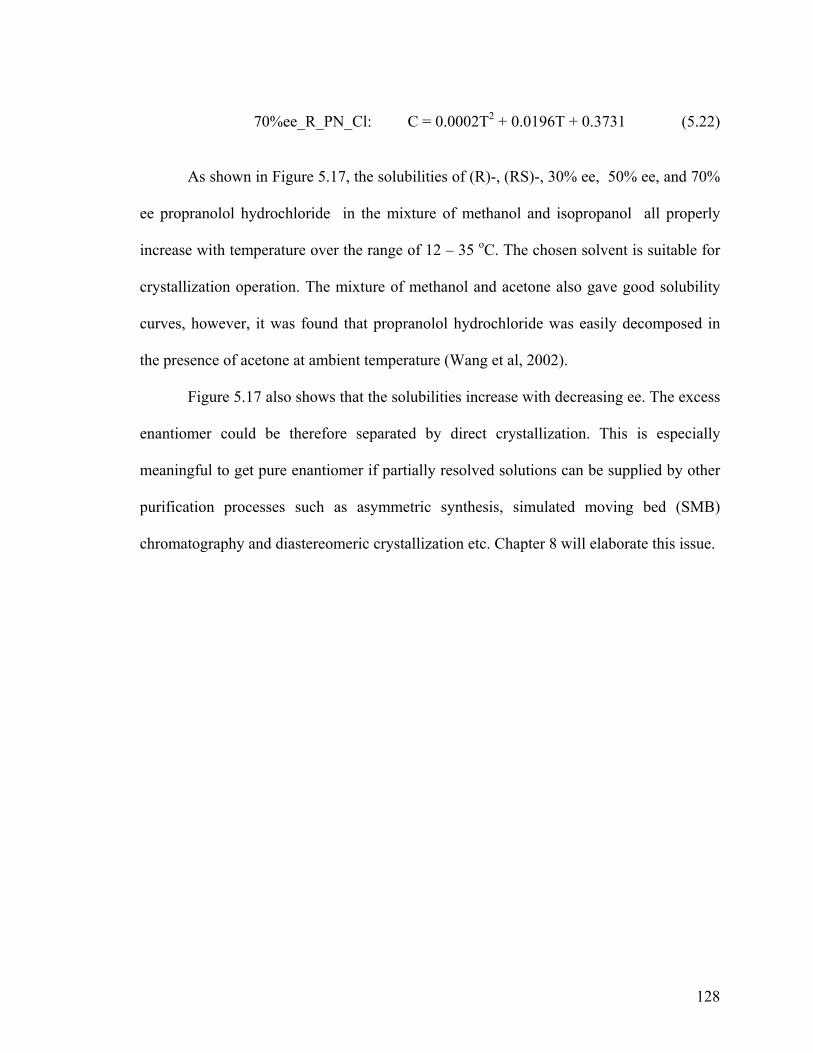
128
70%ee_R_PN_Cl: C = 0.0002T2 + 0.0196T + 0.3731 (5.22)
As shown in Figure 5.17, the solubilities of (R)-, (RS)-, 30% ee, 50% ee, and 70%
ee propranolol hydrochloride in the mixture of methanol and isopropanol all properly
increase with temperature over the range of 12 – 35 oC. The chosen solvent is suitable for
crystallization operation. The mixture of methanol and acetone also gave good solubility
curves, however, it was found that propranolol hydrochloride was easily decomposed in
the presence of acetone at ambient temperature (Wang et al, 2002).
Figure 5.17 also shows that the solubilities increase with decreasing ee. The excess
enantiomer could be therefore separated by direct crystallization. This is especially
meaningful to get pure enantiomer if partially resolved solutions can be supplied by other
purification processes such as asymmetric synthesis, simulated moving bed (SMB)
chromatography and diastereomeric crystallization etc. Chapter 8 will elaborate this issue.

129
Figure 5.18 The ternary phase diagram of propranolol hydrochloride in the mixture of methanol and isopropanol (Vol = 1:5)
The ternary phase diagram is shown in Figure 5.18. It keeps as a simple eutectic
system consisting of two single saturation curves in the studied temperature range. This is
consistent with the binary melting phase diagram in Chapter 4 as well as that reported by
Neau et al. (1993). Compared to normal racemic compound systems, it is a special case,
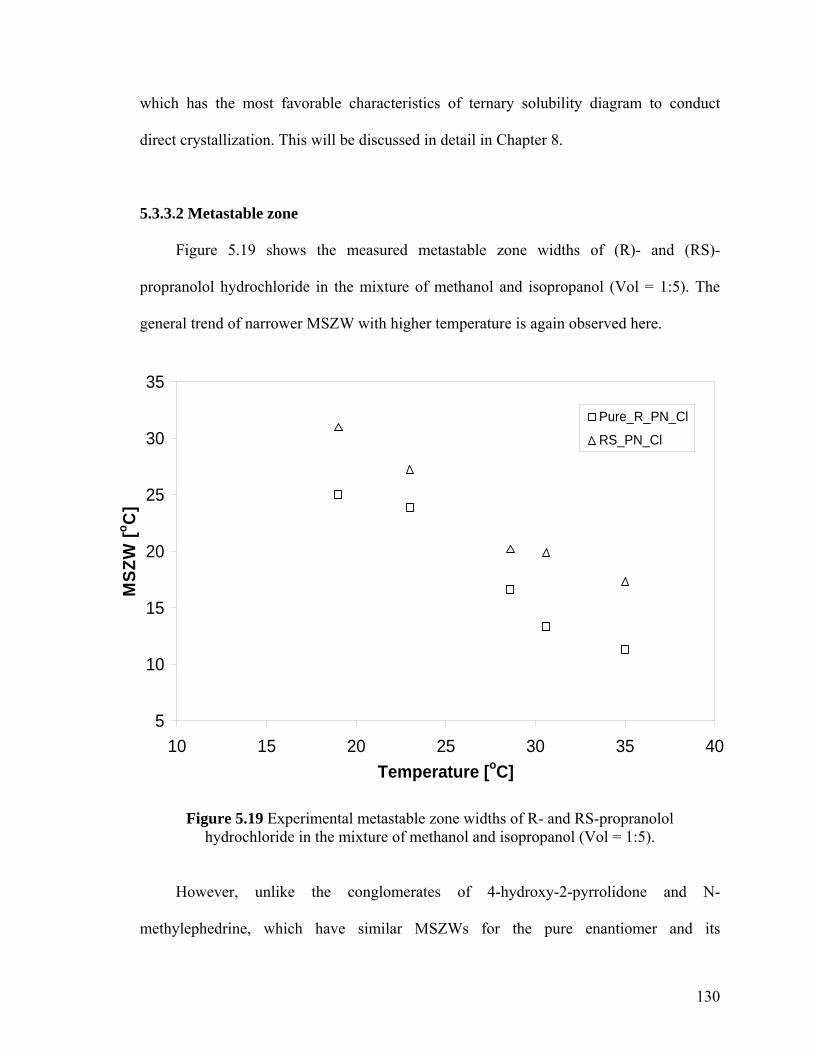
130
which has the most favorable characteristics of ternary solubility diagram to conduct
direct crystallization. This will be discussed in detail in Chapter 8.
5.3.3.2 Metastable zone
Figure 5.19 shows the measured metastable zone widths of (R)- and (RS)-
propranolol hydrochloride in the mixture of methanol and isopropanol (Vol = 1:5). The
general trend of narrower MSZW with higher temperature is again observed here.
5
10
15
20
25
30
35
10 15 20 25 30 35 40Temperature [oC]
MSZ
W [o C
]
Pure_R_PN_Cl
RS_PN_Cl
Figure 5.19 Experimental metastable zone widths of R- and RS-propranolol hydrochloride in the mixture of methanol and isopropanol (Vol = 1:5).
However, unlike the conglomerates of 4-hydroxy-2-pyrrolidone and N-
methylephedrine, which have similar MSZWs for the pure enantiomer and its

131
corresponding racemic mixture, the metastable zone widths of pure (R)- and (RS)-
propranolol hydrochloride are quite different. Under the same saturated temperature, (RS)-
gave a wider MSZW than that of pure (R)-enantiomer, although the solubilities of RS
were larger than R. This interesting phenomenon could be explained from the arrangement
of two enantiomer molecules in the crystal lattice for a racemic compound and classical
nucleation theory.
As for a racemic compound, the two enantiomers co-crystallize to form a mixed
crystal containing both enantiomers in a well-defined arrangement within the crystal
lattice in equal proportions (Figure 4.1b). According to the classical nucleation theory, the
MSZW of RS will be dependent on the concentrations of both enantiomers. Since the
solubility of RS is not definitely related to that of pure enantiomers and it can be either
greater or smaller than that of pure-enantiomer (Jacques et al., 1994), three cases could
arise.
(i) The solubility ratio α of racemate to pure enantiomer is smaller than 1 (α < 1).
Because the solubility of racemate is smaller than that of pure enantiomer, it is readily to
expect that the MSZW of racemate is wider than that of pure enantiomer as less solute
molecules are in the solution to undergo collision to form embryos and develop into
nuclei. This case is widely observed in many racemic compound systems such as
ketoprofen (Lu and Ching, 2006).
(ii) The solubility of racemate is bigger than that of pure enantiomer, but the ratio
is smaller than 2 (1 < α < 2). In this case, although more molecules are in the solution, the
R-molecules and S-molecules are required to arrange in equal quantities to form RS
racemate. Therefore, the effective concentration to form nuclei is actually only half the
total concentration. Since α < 2, the effective R concentration (R:S = 0.5:0.5) is smaller

132
than that of pure enantiomer. Therefore, the MSZW of racemate should be bigger than that
of pure enantiomer. This is true for current studied racemic compound propranolol
hydrochloride, where the solubility ratio of RS to R is bigger than 1 but less than 2 (Table
5.11 and Figure 5.17). The similar phenomenon was also observed in the mandelic acid
system ((Perlberg et al., 2002, 2003). The solubility of (DL)-mandelic acid is smaller than
twice that of the (D)-mandelic acid approximately at certain temperature ranges of (0-25
and 37-60 oC). The corresponding MSZW of (DL)-mandelic acid is bigger than that of
(D)-mandelic acid. This is unlike the above conglomerate systems where two enantiomers
are not associated in solution and the MSZW is independent of enantiomeric excess.
(iii) The solubility of racemate is bigger than twice that of pure enantiomer (α >
2). As mentioned above, the effective R concentration is bigger than that of pure
enantiomer. In this case, the MSZW of racemate should be smaller than that of pure
enantiomer. This was also observed in the mandelic acid system (Perlberg et al., 2002,
2003). The solubilities of (DL)-mandelic acid are bigger than twice that of the (D)-
mandelic acid approximately at certain temperature range of 23-36 oC. The corresponding
MSZW of (DL)-mandelic acid is smaller than that of (D)-mandelic acid.
The above analysis indicates a cut value of 2 of α is apparently related to the
MSZW in racemic compound systems. This could be used as a new additional criterion to
determine whether a racemate crystallizes as a racemic compound or conglomerate
crystal. It might be particularly helpful when such a special racemic compound is met
which shows quite similar other properties (for example, binary/ternary phase diagram of
propranolol hydrochloride is similar to that of a conglomerate).
5.3.4 Solubility and metastable zone width of atenolol in acetone
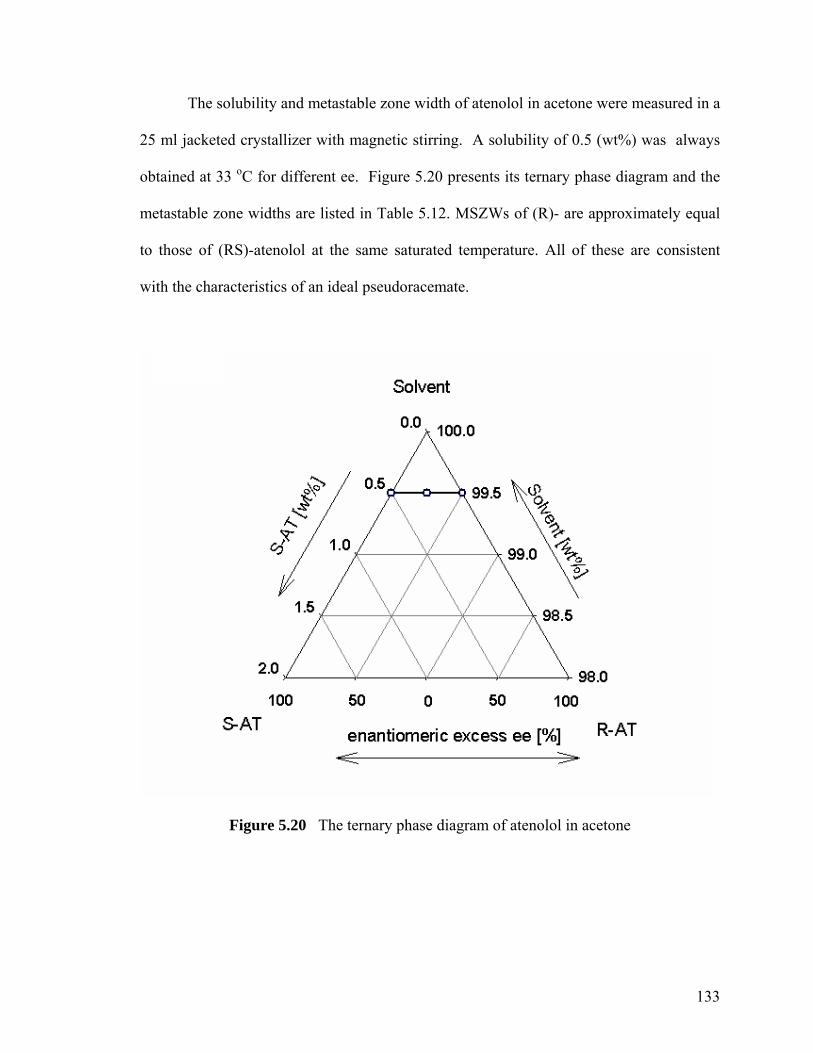
133
The solubility and metastable zone width of atenolol in acetone were measured in a
25 ml jacketed crystallizer with magnetic stirring. A solubility of 0.5 (wt%) was always
obtained at 33 oC for different ee. Figure 5.20 presents its ternary phase diagram and the
metastable zone widths are listed in Table 5.12. MSZWs of (R)- are approximately equal
to those of (RS)-atenolol at the same saturated temperature. All of these are consistent
with the characteristics of an ideal pseudoracemate.
Figure 5.20 The ternary phase diagram of atenolol in acetone

134
Table 5.12 Experimental metastable zone widths (MSZW) of R- and RS-atenolol in acetone
Saturated Temperature,
T [oC]
R_MSZW,
∆T [oC]
RS_MSZW,
∆T [oC]
33 27.4 27.6
30 28.3 28.3
27 30.8 30.7
5.4 Summary
The solubilities, metastable zone widths and ternary phase diagrams at different
enantiomer excess (ee) for four racemates, namely 4-hydroxy-2-pyrrolidone in
isopropanol , N-methylephedrine in the mixture of isopropanol and water (Vol 1:3),
propranolol hydrochloride in the mixture of methanol and isopropanol (Vol = 1:5), and
atenolol in acetone were measured by integrating Lasentec FBRM and PVM. All the
chosen solvents were found good for cooling crystallization in the studied temperature
ranges.
4-hydroxy-2-pyrrolidone and N-methylephedrine show the similar characteristics
of solubility as conglomerate systems, i.e., the solubilities decrease with increased ee. But
the solubility ratio α of (RS)- to (R)-4-hydroxy-2-pyrrolidone is closer than that of N-
methylephedrine to the theoretical value 2 for an ideal conglomerate solution. The
metastable zone widths of both studied conglomerates were found independent of
enantiomer excess and the data at different cooling rates were in good agreement with
135
classical nucleation theory. That is consistent with the characteristic of two enantiomers
forming separate crystals for a racemic conglomerate. The different orders of primary
nucleation rate at different enantiomeric excess indicate there may exist critical
supersaturation beyond which the nucleation of opposite isomer could occur. This appears
to be the first detailed experimental investigation of metastable zone in conglomerate
system and its implications of supersaturation control of preferential crystallization
process.
For the racemic compound propranolol hydrochloride, its solubility characteristics
and ternary phase diagram are quite similar to that of a conglomerate, but its metastable
zone width was obviously dependent on the enantiomer excess. A cut value 2 of solubility
ratio α was found to be correlated with the MSZW differences between racemate and pure
enantiomers. This reflects the properties of the evenly distributed molecules in the crystal
lattice of a racemic compound. It suggests that metastable zone width can be used as an
additional characteristic to identify these two kinds of racemates.
The solubility curve, ternary phase diagram and metastable zone of atenolol show
the unique properties of an ideal pseudoracemate.
Part of the results in this Chapter have been reported on Journal of Chemical and
Engineering Data, 48, pp.1092-1098. 2003, Chirality, 14, pp.318-324, 2002 and Chirality,
16, pp.220-227. 2004.
136
CHAPTER 6 CRYSTALLIZATION KINETICS
OF 4-HYDROXY-2-PYRROLIDONE IN
ISOPROPANOL
6.1 Introduction
As discussed in Chapter 1, the supersaturation of the target enantiomer should be
carefully controlled to inhibit the spontaneous nucleation of the undesired isomer. In
designing operation conditions for the preferential crystallization, the kinetic data such as
crystal growth rate G, and nucleation rate B, are necessary. In this Chapter, the batch
dynamic method was employed and developed to measure the crystallization kinetics of 4-
hydroxy-2-pyrrolidone in isopropanol.
6.2 Characterization of crystallization kinetics
6.2.1 Steady state method
There are two basic categories of techniques to evaluate crystallization kinetics,
namely, steady state method and dynamic method. For the former one, the most famous is
the classical continuous method proposed by Randolph and Larson (1962, 1988) with
mixed-suspension, mixed-product-removal (MSMPR) crystallizer.
In a MSMPR crystallizer,
)/exp( τGLnn o −= (6.1)
137
τGLnn o /lnln −= (6.2)
GnB o= (6.3)
In a semilog plot, the crystal population density ln n can be plotted with L to obtain
the intercept no and slope –1/Gτ (τ is the residence time). Therefore, the crystal growth
rate G and nucleation rate B are readily to get. However, this steady state methodology is
laborious and time consuming. For expensive pharmaceuticals and fine chemicals, it is not
practical to use a large amount of chemicals required for this continuous scale
experimental set up. Moreover, there is experimental evidence to show that the steady-
state kinetic parameters do not correctly describe unsteady-state operations partly due to
the underlying assumptions such as the size-independent growth rates (Tadayyon et al.,
2002).
6.2.2 Dynamic method
Dynamic method is an alternative approach for the estimation of kinetics using
unsteady-state data from batch experiments. Batch crystallizer is easier to operate and less
time-consuming. More importantly, it is obvious that many variables such as temperature,
CSD, concentration, and crystal suspension density are all changing with time in one batch
crystallization operation. A single batch run will provide rich information over a wide
range of operating conditions. However, as all the variables in the batch crystallizers are
changing with time and crystal size, leading to hyperbolic partial differential equations
(PDEs), these significantly increase the computational complexity of dynamic methods.
These equations either need to be solved by transformation to an ordinary differential
equations ODE or by use of an appropriate numerical technique.
138
Various dynamic techniques have been reported with batch crystallizations. These
include thermal response technique (Omran and King, 1974) and mass balance approach
(Halfon and Kaliaguine, 1976; Garside et al., 1982). But most of the proposed methods
using batch crystallization process are based on crystal size distribution (CSD) analysis
(Garside and Jancic, 1976; Way, 1985; Tavare and Garside, 1986; Nyvlt, 1989;
Witkowski et al., 1990; Qiu and Rasmuson, 1991, 1994; Farrell and Tsai,1994; Yokota et
al., 2000; Garside et al., 2002; Zhang and Rohani, 2003; Hu et al., 2004).
The moment method converts the population balance to a set of ODEs. The kth
moment of the population density distribution is
∫∞
=0
dLnLu kk (6.4)
The kinetic parameters can be expressed in terms of moments with respect to size
at an average time interval,
tu
B∆∆
= 0 (6.5)
tuuG
o∆∆
= 1 (6.6)
or
tuu
G∆
∆=
1
2
2 (6.7)
It was shown (Tavare and Garside, 1986) that a large scatter of the parameter
estimates resulting from moment analysis, compared to actual values, was identified with
139
tail effects. The errors in the measurement of experimental responses toward the tail ends
have significant influence on the moment evaluations and hence the parameter estimates.
In principle, the most accurate approach for the estimation of kinetic parameters is
accomplished by using a nonlinear optimization algorithm, a full mathematical description
of a batch crystallizer, and reliable experimental data. A lot of efforts have been put in this
area (Nyvlt, 1989; Witkowski et al., 1990; Qiu and Rasmuson, 1991, 1994; Farrell and
Tsai, 1994; Yokota et al., 2000; Zhang and Rohani, 2003; Hu et al., 2004). A major
advantage of this method is that the estimation of growth and nucleation rates and their
kinetic parameters in the mathematical method is performed simultaneously. The kinetic
constants in the mathematical model are adjusted by the optimization algorithm to
minimize an objective function.
Another method available is the so called s-plane analysis (Tavare and Garside,
1986). This method is based on population balances for discrete parts of the crystal size
distribution. The change in number of crystals in discrete parts of the particle size
distribution for consecutive samples can give an estimate of the growth rate of the crystals
in this size range.
The crystallization kinetics measurements in preferential crystallization process are
rarely reported. Elsner et al (2003, 2005) recently attempted to use moment method to
determine crystallization kinetics of L-/D-threonine in water but found it was difficult to
predict nucleation rate.
6.3 s-Plane analysis
The s-plane analysis proposed by Tavare and Garside is a simple and yet reliable
method of extracting both crystal nucleation and growth kinetics from the population

140
curves obtained during batch crystallization (Tavare and Garside, 1986; Tavare, 1995;
Jacobsen et al., 1998; Myerson and Ginde, 2002). This method is based on population
balances for discrete parts of the crystal size distribution. We used this technique to
estimate crystal nucleation and growth kinetics. For batch crystallization, assuming the
crystal growth is size independent, and since the crystal suspension density used is less
than 5% and the solution is well mixed, it is acceptable to assume that no crystal breakage
or agglomeration occurs, therefore the population balance equation is
0)(=
∂∂
+∂∂
LnG
tn (6.8)
The boundary conditions for the nuclei population density can be represented by
the relation
B = noG (6.9)
The experimentally measured population density n(t,L) can be converted into
Laplace transformed response with respect to size L as
∫∞
−=0
)exp(),(),( dLsLLtnstn (6.10)
Taking the Laplace transforms of the population balance equation with respect to
size gives
0)]0,(),([),(=−+ tnstnsG
dtstnd (6.11)

141
2/)],(),([),( 12 stnstnstn +=
In the above equation 6.11, the crystal growth rate G and the initial population
density n(0) are functions of time. However, in a small time interval ∆t, they can be
assumed to be constant and therefore the resulting parameters will have an average value
over this interval. In this case, using initial boundary conditions, the population balance
equation can be transformed to
0),(),(=−+ BstnsG
dtstnd (6.12)
This equation can be transformed into a differential format as
BstnsGt
tsn+−=
∆∆ ),(),( (6.13)
where
12 ttt −=∆ (6.14)
),(),(),( 12 stnstntsn −=∆ (6.15)
(6.16)
Over an optimal range of the Laplace transform variable, a plot of ttsn ∆∆ /),(
versus ),( stns should give a straight line with slope equal to - G and an intercept B .
Therefore, the above equation can be used to determine the crystal nucleation and growth
rates from a pair of population density curves at two times ∆t interval.

142
The estimated nucleation B and growth rate G can then be correlated with the
degree of supersaturation ∆c and slurry density MT using the widely used power law
expressions in conventional crystallization (Randolph and Larson, 1988; Tavare, 1995;
Mullin, 2001).
ggg cRTEkG ∆−= )/exp( (6.17)
jT
ibb MGRTEkB )/exp(−= (6.18)
6.4 Size-dependent growth
In the previous deduction procedure, it was assumed that all crystals grow at the
same rate. However, there is some evidence that crystals of different sizes may grow at
different rates even though they are under the same driving force (supersaturation). This is
called size-dependent crystal growth (Zumstein and Rousseau, 1987, 1989; Randolph and
Larson, 1988). This phenomenon of growth dispersion could be due to various reasons.
The growth rate of large crystals could be increased because of an increase in their fluid
settling velocity, but this can not explain some observed large differences of growth rate
among crystals of different sizes in the same suspension. Berglund and Larson (1982)
showed that larger crystals had an inherent higher growth rate. Garside et al. (2002)
suggested that growth rate appears to depend on the origin of nuclei. In particular, it is not
unusual that many organic crystals growth rates are size dependent (Kougoulos et al.,
2005).
Abegg et al.(1968) had shown that the following form can be used to fit most data
for the case of size-dependent crystal growth, where G0 is size- independent crystal
growth rate and α is experimentally determined constants (O’Dell and Rousseau,1978).
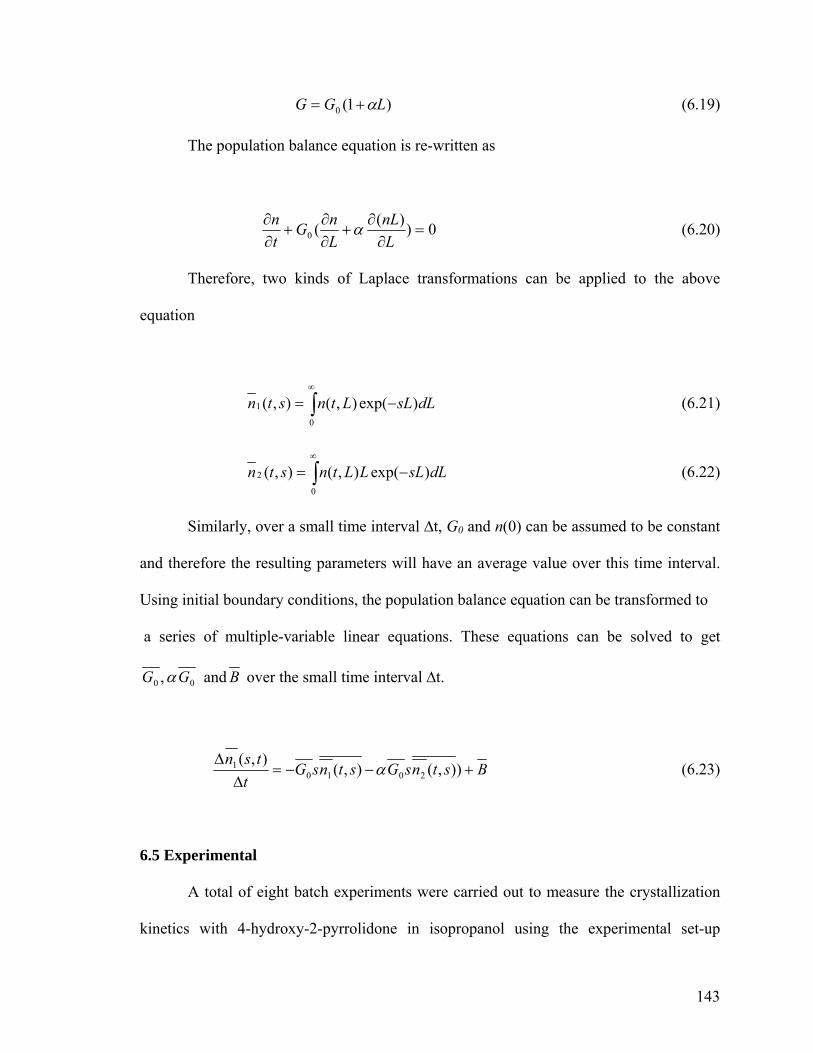
143
)1(0 LGG α+= (6.19)
The population balance equation is re-written as
0))((0 =∂
∂+
∂∂
+∂∂
LnL
LnG
tn α (6.20)
Therefore, two kinds of Laplace transformations can be applied to the above
equation
∫∞
−=0
1 )exp(),(),( dLsLLtnstn (6.21)
∫∞
−=0
2 )exp(),(),( dLsLLLtnstn (6.22)
Similarly, over a small time interval ∆t, G0 and n(0) can be assumed to be constant
and therefore the resulting parameters will have an average value over this time interval.
Using initial boundary conditions, the population balance equation can be transformed to
a series of multiple-variable linear equations. These equations can be solved to get
00 , GG α and B over the small time interval ∆t.
BstnsGstnsGt
tsn+−−=
∆∆
)),(),(),(
20101 α (6.23)
6.5 Experimental
A total of eight batch experiments were carried out to measure the crystallization
kinetics with 4-hydroxy-2-pyrrolidone in isopropanol using the experimental set-up

144
described in Chapter 3 (Figure 3.9). Four batch experiments were for R-4-hydroxy-2-
pyrrolidone and another four batch experiments were for S-4-hydroxy-2-pyrrolidone.
Typical loads of crystallizer were 13.89 g R-4-hydroxy-2-pyrrolidone and 800 ml
isopropanol. The operation temperature range was 5-36 oC. Circa 8-15 ml samples were
taken every 15-83 minutes for crystal size distribution, crystal slurry concentration, and
solute concentration analyses. The solution concentrations were calculated using mass
balance. The crystal size distribution was measured using a Malvern Mastersizer 2000
with a Hydro 2000µP dispersion cell unit. Analytical n-hexane, in which 4-hydroxy-2-
pyrrolidone is almost insoluble, was used as the liquid dispersion medium.
6.6 Results: Crystal nucleation and growth kinetics
6.6.1 Crystal suspension density and supersaturation
Four batches of experiment were performed to measure the crystal nucleation and
growth kinetics of R-4-hydroxy-2-pyrrolidone. As mentioned in the experimental section,
in each run, a series of samples were taken from the crystallizer to analyze the crystal
suspension density MT, the solute concentration c and the crystal size distribution. The
obtained MT and c are listed in Table 6.1 to Table 6.4. The solubility data c* of 4-
hydroxy-2-pyrrolidone at each temperature have been measured in Chapter 5.
Accordingly, the supersaturation ∆c were calculated and listed in the tables. The
corresponding concentration profiles of crystal suspension density MT, solute
concentration c and supersaturation ∆c are shown in Figure 6.1 to Figure 6.4. In all of the
four batch runs, the solute concentration c decreased smoothly and the crystal suspension
density MT increased accordingly. The change of supersaturation ∆c was moderate and
this supports the constant assumption over a small time interval ∆t. Moreover, the
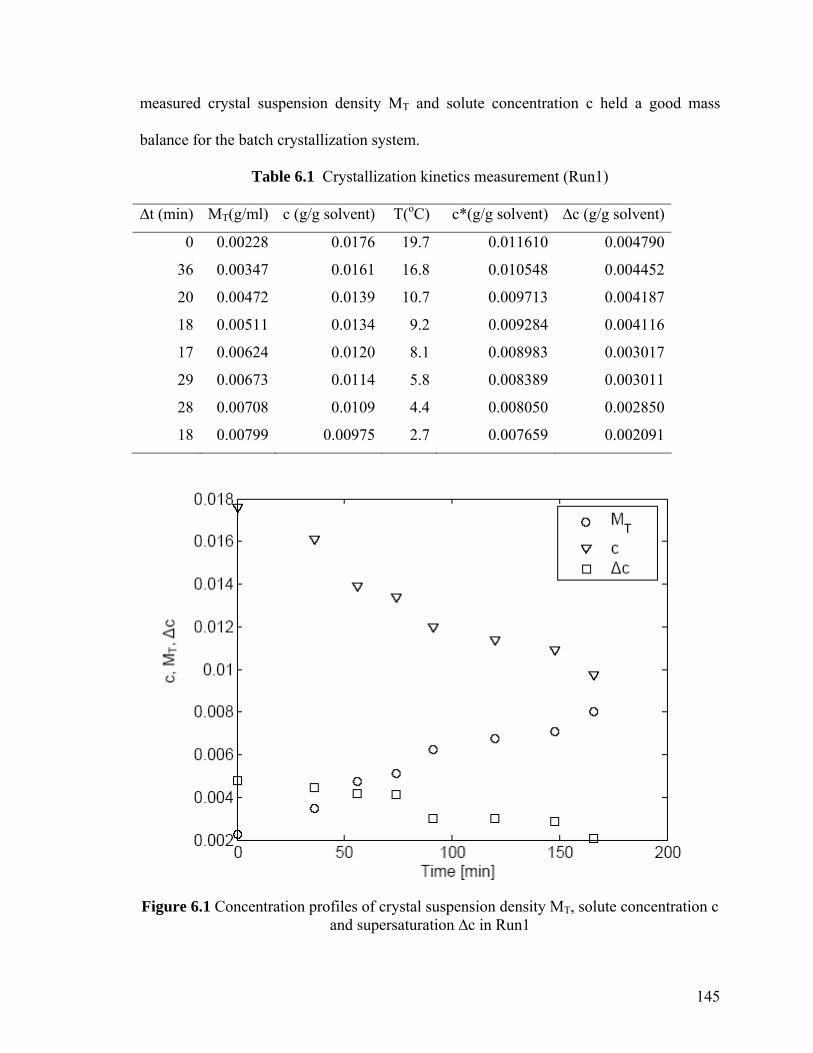
145
measured crystal suspension density MT and solute concentration c held a good mass
balance for the batch crystallization system.
Table 6.1 Crystallization kinetics measurement (Run1)
Figure 6.1 Concentration profiles of crystal suspension density MT, solute concentration c
and supersaturation ∆c in Run1
∆t (min) MT(g/ml) c (g/g solvent) T(oC) c*(g/g solvent) ∆c (g/g solvent)
0 0.00228 0.0176 19.7 0.011610 0.004790
36 0.00347 0.0161 16.8 0.010548 0.004452
20 0.00472 0.0139 10.7 0.009713 0.004187
18 0.00511 0.0134 9.2 0.009284 0.004116
17 0.00624 0.0120 8.1 0.008983 0.003017
29 0.00673 0.0114 5.8 0.008389 0.003011
28 0.00708 0.0109 4.4 0.008050 0.002850
18 0.00799 0.00975 2.7 0.007659 0.002091

146
Table 6.2 Crystallization kinetics measurement (Run2)
Figure 6.2 Concentration profiles of crystal suspension density MT, solute concentration c and supersaturation ∆c in Run2
∆t(min) MT(g/ml) C (g/g solvent) T(oC) C*(g/g solvent)
∆C (g/g solvent)
0 0.00177 0.0183 22.5 0.014031 0.004269
21 0.00223 0.0177 20.8 0.013293 0.004407
33 0.00392 0.0156 18.2 0.012245 0.003355
33 0.00502 0.0142 15.5 0.011254 0.002946
46 0.00737 0.0112 11.8 0.010044 0.001156

147
Table 6.3 Crystallization kinetics measurement (Run3)
Figure 6.3 Concentration profiles of crystal suspension density MT, solute concentration c
and supersaturation ∆c in Run3
∆t(min) MT(g/ml) C (g/g solvent) T(oC) C*(g/g solvent)
∆C (g/g solvent)
0 0.00230 0.017 20.1 0.013001 0.003999
55 0.00320 0.0158 18.2 0.012245 0.003555
39 0.0041 0.0147 16.9 0.011756 0.002944
42 0.00534 0.0131 15.5 0.011254 0.001846
83 0.00612 0.0121 12.8 0.010355 0.001745

148
Table 6.4 Crystallization kinetics measurement (Run4)
Figure 6. 4 Concentration profiles of crystal suspension density MT, solute concentration c and supersaturation ∆c in Run4
∆t(min) MT(g/ml) C (g/g solvent) T(oC) C*(g/g solvent)
∆C (g/g solvent)
0 0.00234 0.0169 22.1 0.013853 0.003047
54 0.00319 0.0159 20.1 0.013001 0.002899
61 0.00384 0.0150 13.4 0.010548 0.004452
67 0.00472 0.0139 10.7 0.009713 0.004187

149
0 50 100 150 200 250 300 350 4000
2
4
6
8
10
12time 2time 3 (33 mins later)
6.6.2 Crystal size distribution (CSD)
The crystal size distribution was measured using a Malvern Mastersizer 2000 with
a Hydro 2000µP dispersion cell unit. Fig 6.5 shows typical crystal distribution of two
samples collected at two different time in Run 2. The crystal growth can be observed as
the volume percentage distribution shifts to the right side of larger size.
Figure 6.5 Typical crystal size distribution in kinetic measurement
Using the definition of population density n (Eq 6.24), Eq 6.26 can be obtained to
calculate the population density n with volume percentage data.

150
dLdNn = (6.24)
The number of crystals in the size range is calculated from the mass and shape
factor kV.
33iV
Ti
iV
ii Lk
MVLk
MN
ρρ∆
=∆
=∆ (6.25)
Thus the population density is calculated as
iiV
Ti
i
i
LLkMV
LN
n∆
∆=
∆∆
= 3ρ (6.26)
where iL is the average crystal size in the given range.
Figure 6.6 shows the typical population density functions versus particle size
calculated from crystal size distribution data shown in Figure 6.5. This figure illustrates
the characteristic appearance of CSD from a batch crystallizer (Tarvare, 1995). They are
quite different from those shown in continuous MSMPR crystallizer, which are normally
straight lines on semi-log plot.

151
0 50 100 150 200 250 30010
-2
100
102
104
106
time 2time 3 (33 mins later)
Figure 6.6 Typical crystal population density distribution
6.6.3 s-Plane analysis on the measured data
The Laplace s-plane method described in section 6.3 was used here to estimate the
crystal nucleation rate B and growth rate G. The advantage of Laplace method is to
estimate model parameters in the Laplace transform domain rather than in the time
domain. From Eq 6.10, it is clear that a suitable value of the Laplace transform variable s
must be chosen to reduce the sensitivity to experimental errors. As indicated by Tarvare
(1995), if s is too small, the tail of the response will be heavily weighted. On the other
hand, if s is too big, too much emphasis will be given to the front portion of the response.
In either case, a poor estimate of the weighted moments will result. There should be an
optimum value of s, which lies between these two limits. The s-plane analysis described
152
by Tavare and Garside (1986) and Tavare (1995) showed that the limits on the Laplace
transform parameter s used should be considered by sfL2 ≈ 1-2, where L2 is the population
average size at time t2.
Once s is decided, a fix number of points are chosen over this range s at regular
intervals. Here 50 points were used. No further improvement can be obtained with more
data points. For each value of s, the Laplace transformed population densities can be
calculated as
∑∫ ∆−=−=∞
LsLLtndLsLLtnstn )exp(),()exp(),(),( 10
11 (6.26)
∑∫ ∆−=−=∞
LsLLtndLsLLtnstn )exp(),()exp(),(),( 20
22 (6.27)
The s-plane analysis was performed for 50 equally spaced s-values. The results of
analysis of two typical sets of data from Run2 and Run3 are shown in Figure 6.7 to Figure
6.10.
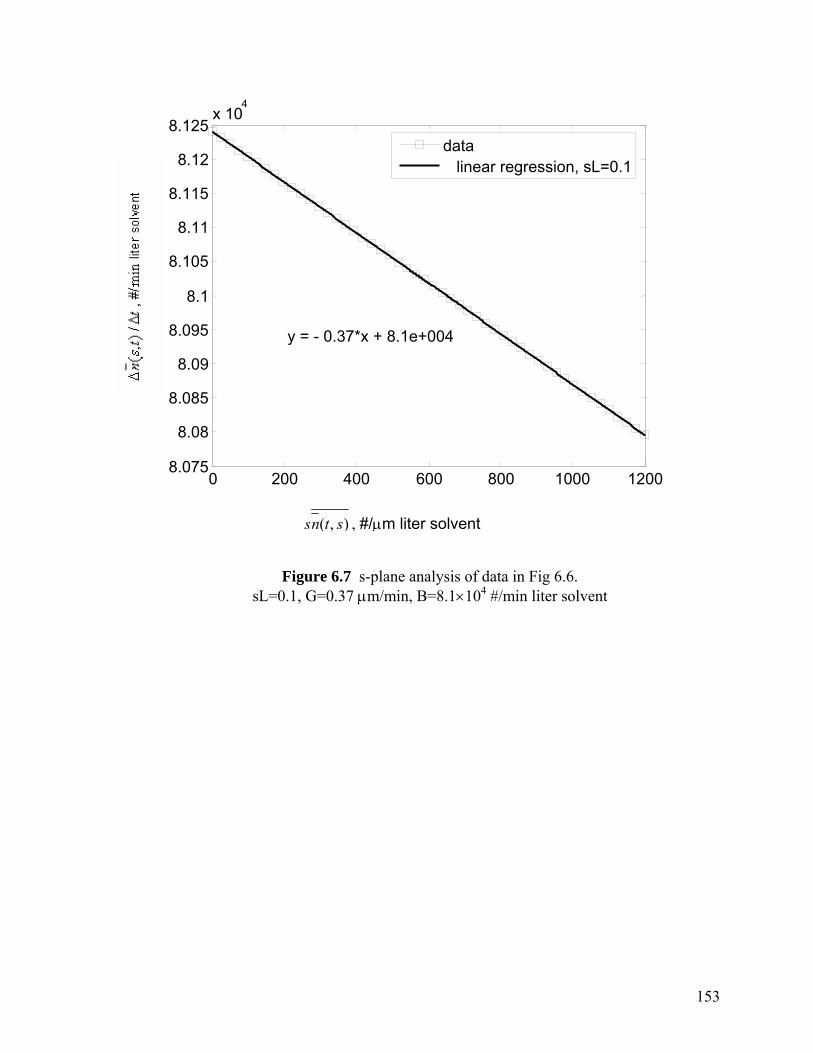
153
Figure 6.7 s-plane analysis of data in Fig 6.6. sL=0.1, G=0.37 µm/min, B=8.1×10⁴ #/min liter solvent
0 200 400 600 800 1000 12008.075
8.08
8.085
8.09
8.095
8.1
8.105
8.11
8.115
8.12
8.125 x 10
4
y = - 0.37*x + 8.1e+004
data linear regression, sL=0.1
),( stns , #/µm liter solvent
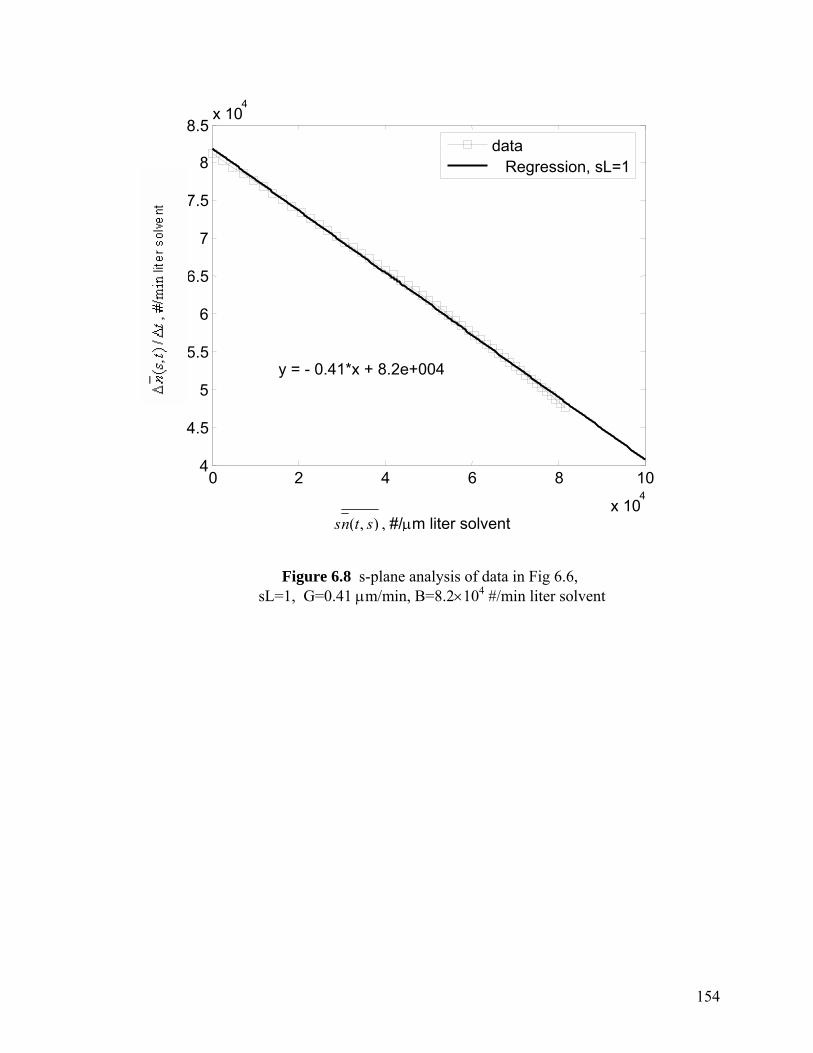
154
Figure 6.8 s-plane analysis of data in Fig 6.6, sL=1, G=0.41 µm/min, B=8.2×10⁴ #/min liter solvent
0 2 4 6 8 10
x 10 4
4
4.5
5
5.5
6
6.5
7
7.5
8
8.5 x 10
4
y = - 0.41*x + 8.2e+004
data Regression, sL=1
),( stns , #/µm liter solvent

155
),( stns , #/µm liter solvent
Figure 6.9 Typical s plane analysis to estimate crystal nucleation and growth rates in Run3. sL=0.1, G=0.27 µm/min, B=2.5×10⁴ #/min liter solvent
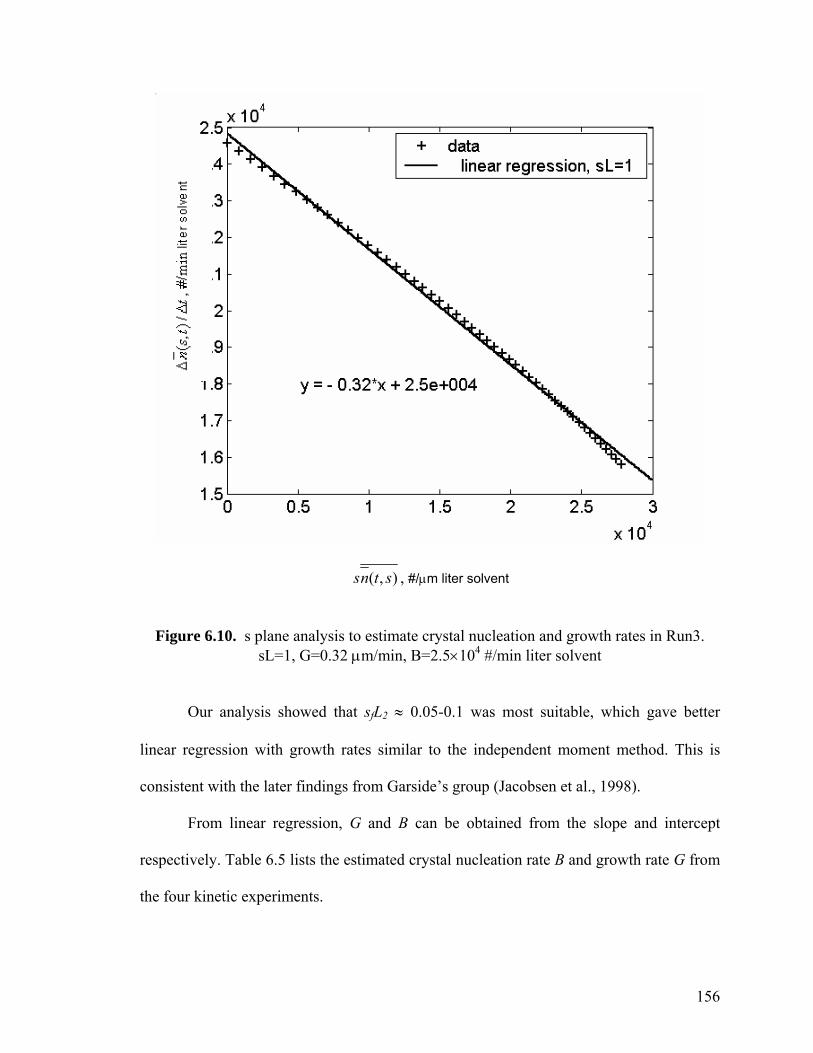
156
),( stns , #/µm liter solvent
Figure 6.10. s plane analysis to estimate crystal nucleation and growth rates in Run3.
sL=1, G=0.32 µm/min, B=2.5×10⁴ #/min liter solvent
Our analysis showed that sfL2 ≈ 0.05-0.1 was most suitable, which gave better
linear regression with growth rates similar to the independent moment method. This is
consistent with the later findings from Garside’s group (Jacobsen et al., 1998).
From linear regression, G and B can be obtained from the slope and intercept
respectively. Table 6.5 lists the estimated crystal nucleation rate B and growth rate G from
the four kinetic experiments.

157
Table 6.5 Estimated crystal nucleation rate B and growth rate G with s plane analysis from the four kinetic experiments.
G,
µm/min
B ,
#/min·liter
solvent
∆c,
kg/kg solvent
MT,
kg/liter
T
K
Run1 0.18 1.20E+04 0.004572 0.00288 291.3
0.47 7.70E+04 0.004152 0.00492 282.9
0.45 6.50E+04 0.003014 0.00649 279.9
0.11 1.60E+04 0.002471 0.00754 276.6
Run2 0.40 5.70E+04 0.004338 0.00200 294.6
0.37 8.10E+04 0.003881 0.00308 292.5
0.16 1.70E+03 0.002051 0.00620 286.6
Run3 0.51 3.70E+04 0.003777 0.00275 292.2
0.27 2.50E+04 0.003250 0.00365 290.6
0.10 1.40E+04 0.002045 0.00573 287.2
Run 4 0.26 9.90E+03 0.002108 0.00406 292.2
0.26 3.00E+05 0.004320 0.00428 285.0
Regression of the data in Table 6.5 with linear least squares provided the following
kinetic expressions for the crystal growth and nucleation of R- 4-hydroxy-2-pyrrolidone.
47.09.16104.3 TMGB ×××= (6.28)
35.15 )/15000exp(104.4 cRTG ∆×−××= (6.29)
The observed nucleation power dependency 0.47 on the suspended crystal density
is lower than those found in industrial inorganic crystallization process. This could be due
to the relatively low crystal mass concentration used here. Another possibility is that the
primary nucleation occurred especially in the case that the supersaturation was under
158
somewhat arbitrary control in the kinetic measurement experiments. The power
dependency 1.9 on crystal growth rate is comparable to those found in literature (Tavare,
1995; Garside et al., 2002). It appears that the nucleation rate dependency on the
temperature could be ignored under present experimental conditions.
The order of the growth rate with respect to supersaturation 1.35 is consistent to
those reported. However, the relatively low activation energy 15 kJ/mol indicates that the
crystal growth could be more likely to be diffusion controlled (Garside et al, 2002).
The method proposed in Section 6.4 for size-dependent growth considerations
(Equation 6.23) was applied to the experimental data. The obtained values α were very
small (circa 0.00036) or even negative. The crystal growth size dependency could be
therefore negligible here.
6.6.4. Crystallization kinetics of S-4-hydroxy-2-pyrrolidone in isopropanol
The same methodology has been used to estimate the crystal nucleation and
growth kinetics of S-4-hydroxy-2-pyrrolidone in isopropanol. Table 6.6 lists the measured
crystal growth rates and nucleation rates at different operation conditions.
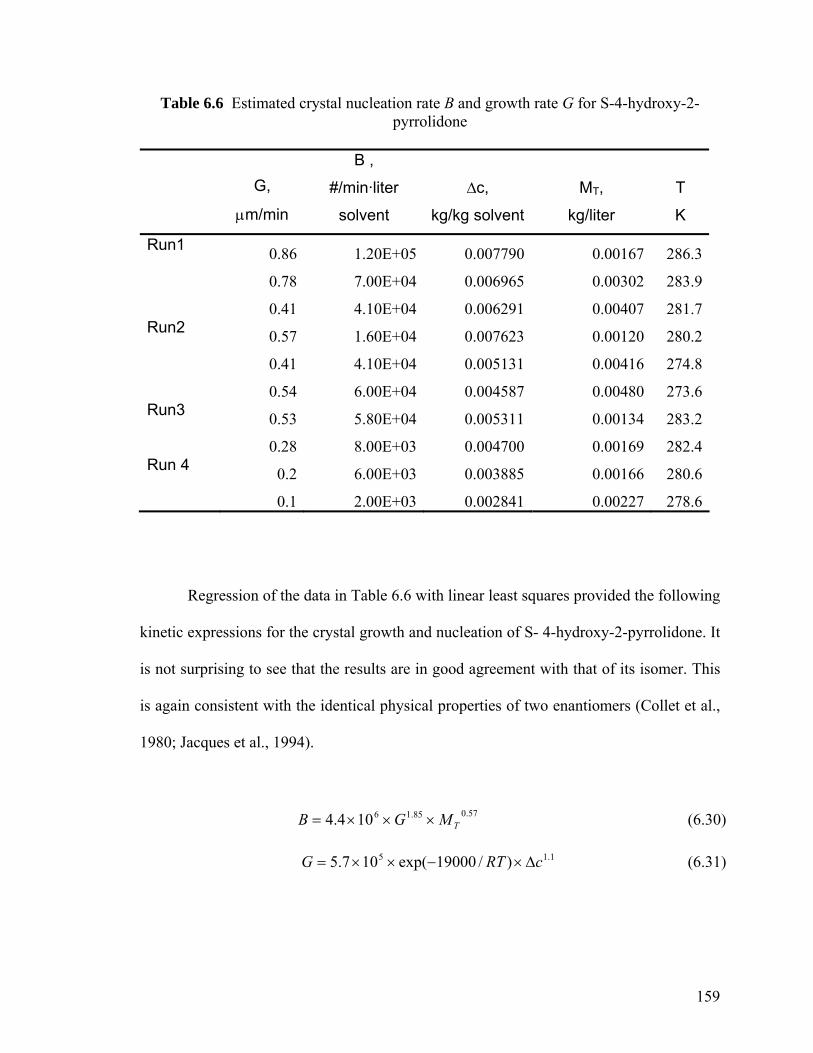
159
Table 6.6 Estimated crystal nucleation rate B and growth rate G for S-4-hydroxy-2-pyrrolidone
G,
µm/min
B ,
#/min·liter
solvent
∆c,
kg/kg solvent
MT,
kg/liter
T
K
Run1 0.86 1.20E+05 0.007790 0.00167 286.3 0.78 7.00E+04 0.006965 0.00302 283.9 0.41 4.10E+04 0.006291 0.00407 281.7Run2 0.57 1.60E+04 0.007623 0.00120 280.2 0.41 4.10E+04 0.005131 0.00416 274.8 0.54 6.00E+04 0.004587 0.00480 273.6Run3 0.53 5.80E+04 0.005311 0.00134 283.2 0.28 8.00E+03 0.004700 0.00169 282.4Run 4 0.2 6.00E+03 0.003885 0.00166 280.6
0.1 2.00E+03 0.002841 0.00227 278.6
Regression of the data in Table 6.6 with linear least squares provided the following
kinetic expressions for the crystal growth and nucleation of S- 4-hydroxy-2-pyrrolidone. It
is not surprising to see that the results are in good agreement with that of its isomer. This
is again consistent with the identical physical properties of two enantiomers (Collet et al.,
1980; Jacques et al., 1994).
57.085.16104.4 TMGB ×××= (6.30)
1.15 )/19000exp(107.5 cRTG ∆×−××= (6.31)
160
6.7 Summary
Eight batches of crystallization kinetics measurements have been performed to
determine the crystal nucleation and growth kinetics of R- 4-hydroxy-2-pyrrolidone and S-
4-hydroxy-2-pyrrolidone in isopropanol. The two enantiomers show similar characteristics
in crystal nucleation and growth. The Laplace transform method was successfully
developed and applied to the estimation of crystallization kinetics. A more suitable
Laplace transform variable s range was employed for current crystallization system. The
size dependence of crystal growth was found negligible with using modified s-plane
approach. The crystal nucleation rate seems independent on the experimental temperature
range. These crystallization kinetics data will be used to guide the supersaturation control
in the preferential crystallization of 4-hydroxy-2-pyrrolidone in isopropanol.
Part of results in this chapter has been reported on Chemical Engineering Science (Vol
61, pp.2406-2417. 2006)
161
CHAPTER 7 OPTIMAL OPERATION OF
PREFERENTIAL CRYSTALLIZATION OF 4-
HYDROXY-2-PYRROLIDONE IN
ISOPROPANOL
7.1 Introduction
In Chapter 4 and Chapter 5, the thermodynamics properties of 4-hydroxy-2-
pyrrolidone in isopropanol have been studied. The crystal nucleation and growth kinetics
have been measured in Chapter 6. With the mastery of these factors that control the rate
difference of crystallization between the two enantiomers, this chapter combined and
applied them in the optimal control and in-situ monitoring of preferential crystallization.
From the thermodynamics issue, in order to avoid spontaneous nucleation of the
undesired enantiomer, its upper limit of supersaturation is within its metastable zone. In
this aspect, the solubility diagrams and supersaturation data are the thermodynamic basis
for preferential crystallization for the racemic conglomerates (Jacques et al., 1994; Collet,
1999).
As mentioned in Chapter 1, it is also important to control the supersaturation of the
target enantiomer. This can be elaborated in the following three aspects. (i) Firstly, this
supersaturation should be kept at least within its metastable zone to prevent spontaneous
nucleation of the target enantiomer. Most of the preferential crystallization processes are
run with only a slight excess of the target enantiomer and the concentrations of the two

162
enantiomers are quite close. Considering the identical physical properties of the two
isomers in solutions, the spontaneous nucleation is expected to occur simultaneously for
both enantiomers, which implies that the spontaneous nucleation of the target enantiomer
could initiate the nucleation of the unwanted isomer. This is the most important issue that
should be avoided in the chiral resolution by direct crystallization (Jacques et al., 1994;
Collet, 1999).
(ii) Secondly, the supersaturation of the target product should be kept further
lower than its spontaneous nucleation metastable zone. In Chapter 5, the metastable zone
width measurement and nucleation analysis indicate that there exists a critical
supersaturation level beyond which the nucleation of unwanted isomer could occur. In fact,
if high supersaturations within the metastable zone are used, some conglomerates will
form crystals that contain domains of both lattices in a single crystal, which means that the
enantiomerically pure seed could nucleate the other enantiomer at its surface. One typical
example is in the resolution of a racemic chiral ketone (Black et al., 1989; Collins et al.,
1997), where the nucleation of the unwanted isomer disappeared only under very low
supersaturation (1 oC undercooling). This phenomenon at higher supersaturation was also
observed on β-phenylglyceric acid (Furberg and Hassel, 1950). In the studies of the
stability of the supersaturation state of DL-serine m-xylene-4-sulfonate dehydrate (Hongo
et al., 1981), two metastable regions were identified where the supersaturation was
relatively unstable in the second region. In the studies of nuclei breeding from a chiral
crystal seed of NaClO3 (Denk and Botsaris, 1972; Kondepudi et al., 1990, 1993, 1995;
Yokota and Toyokura, 1992; Qian and Botsaris, 1997, 1998; McBride and Carter, 1991),
it was found that at low supersaturation all nuclei were of the same chirality. At relatively
high supercooling, but still lower than the critical value for spontaneous nucleation, many
163
nuclei with opposite chirality to that of seed were formed. Davey et al. (1990) also showed
the similar findings in triazolylketone chiral crystallization. The Embryos Coagulation
Secondary Nucleation (ECSN) mechanism was applied to explanation of the phenomenon
(Qian and Botsaris, 1998). Both the second metastable zone and critical supersaturation
indicate the importance of controlling the supersaturation to a critical extent to inhibit the
nucleation of the undesired enantiomer during preferential crystallization.
(iii) Finally, the crystal size distribution (CSD) is an important factor not only for
the production of high-quality products, but also for determining the efficiency of
downstream operations, such as filtration and washing. The advantages of controlling the
supersaturation in batch crystallization have been extensively shown (Mullin and Nyvlt,
1971; Jones and Mullin 1974; Rohani and Bourne, 1990). With good control of the
supersaturation, larger crystals with narrower crystal size distribution can be obtained,
which means product purity could be improved in the downstream filtration and washing
process (Mersmann, 1995; Matthews and Rawlings, 1998; Rodriguez-Hornedo and
Murphy, 1999). This is especially important for chiral purification (Courvoisier et al.,
2002, 2003). Reflecting upon the above considerations, it is important to control the
supersaturation of the target enantiomer in preferential crystallization process.
Numerous efforts have been reported on optimal operation of batch crystallizer.
Mullin and Nyvlt (1971), Jones(1974), and Jones and Mullin (1974) did the pioneer work
both theoretically and experimentally. Mayrhofer and Nyvlt (1988) dealt with a general
derivation of a theoretical cooling curve of a batch crystallizer. Rohani and Bourne (1990)
derived a simplified optimal cooling curve by assuming constant nucleation and
supersaturation. Various objectives have been chosen to optimize batch crystallization,
such as mean crystal size and coefficient of variation (Chianese et al., 1984; Choong and

164
Smith, 2004; Costa and Maciel Filho, 2005), seed ratio (Bohlin and Rasmuson, 1992;
Matthews and Rawlings, 1998; Chung et al., 1999), and even shape (Ma et al., 2002).
In order to control the supersaturation, with the thermodynamics data, crystal
nucleation and growth kinetics, the population balance model is needed to predict the
concentration profiles (Randolph and Larson, 1988). The newly developed on-line
monitoring techniques such as FBRM greatly facilitate these investigations (Barrett and
Glennon, 2002; Elsner et al., 2005).
7.2 Mathematic model in batch crystallization
7.2.1 Population balance equation
The classical population balance equation (Randolph and Larson, 1988) is normally
employed to describe the complex crystallization process. For a batch crystallizer, some
general assumptions are made in order to simplify the mathematical model.
i. The crystallization process proceeds in a batch crystallizer without input or
output.
ii. Crystal agglomeration and breakage are negligible.
iii. The crystals in the crystallizer are well suspended without accumulation of
crystals.
iv. Crystal nuclei have negligible size.
With the above assumptions, the population balance is
0)],(),([),(=
∂∂
+∂
∂L
tLntLGt
tLn (7.1)
where n is the population density of crystals and G is the crystal growth rate .
165
The boundary condition for this partial differential equation is
00 ),0(
=
==L
o
GBtLn (7.2)
where Bo is the rate of formation of new crystals (nucleation rate) at size of L0=0.
7.2.2 Crystallization kinetics
From the population balance equation, it is known that crystal nucleation and
growth kinetics appear as the boundary condition. As mentioned in Chapter 6, empirical
correlations of crystallization kinetics are often expressed using power laws.
jT
ibb MtLGtRTGktB ),()](/exp[)( −= (7.3)
ggg tctRTGktLG )()](/exp[),( ∆−= (7.4)
where MT is the crystal suspension density and the supersateration ∆c is the difference of
the real concentration c(t) and the solubility c* at temperature T(t)
))((*)()( tTctctc −=∆ (7.5)
7.2.3 Mass balance equation
Since the crystal growth and nucleation rate are dependent on solute concentration
and temperature, mass and energy balances are required to complete the description of
crystallization process.

166
For a batch crystallizer, the mass balance can be made based on the solute.
00)()()()( VctVtMtVtc T =+ (7.6)
where c is the solute concentration and V is the volume of slurry.
Under the assumption that the slurry volume remains constant during
crystallization, the mass balance is re-written as
dttdM
dttdc T )()(
−= (7.7)
If m3 is defined as the 3rd moment of crystal size distribution,
dLnLm 3
03 ∫∞
= (7.8)
then the crystal suspension density MT can be replaced as
3mkM VT ρ= (7.9)
where ρ is the crystal density and kV is its shape factor.
Therefore, the mass balance equation can be re-written as
dttdm
kdt
tdcV
)()( 3ρ−= (7.10)
The necessary initial conditions are

167
0)0( cc = (7.11)
03 )0( mm = (7.12)
7.2.4 Energy balance
If the shaft work is assumed negligible, the rate of change of the enthalpy of the
crystallizer magma h(t) is given by
dttdm
HWkqdt
tdhV
)()()( 3∆−+−= (7.13)
The first term on the right-hand side is the rate of cooling, while the second term is
the enthalpy rate change due to the heat of crystallization. The second term is often
negligible compared to the rate of cooling.
All the equations given above form a set of nonlinear integro-differential equations
for a batch crystallizer. Analytical solutions do not exist. Numerical methods are required
to solve the problems.
7.3 Model solution
7.3.1 Moment method
The moment transformation approach is the most common method used to replace
the partial differential equations by a set of ordinary differential equations, which
simplifies the simulation and optimization of the batch crystallizer. Multiplying Equation
7.1 by Lj, integrating over L, and placing on a per-mass-of-solvent basis (Hulburt and
Katz, 1964), the moment equations can be derived as
168
Bdt
dm=0 (7.14)
If the crystal growth is size independent,
jj
j BLjGmdt
dm01 += − (7.15)
If the crystal growth rate is dependent on crystal size and the expression proposed
by Randolph and Larson (1988) is used as
)1(0 LGG α+= (7.16)
where α is a model parameter. Then the moment equations are given in following format
jjj
j BLmmjGdt
dm01 )( ++= − α (7.17)
Various numerical methods have been proposed to solve specific models on a
case-by-case basis. Rawlings et al. (1993) had a good review on this aspect. It was also
indicated that the recovery of the crystal size distribution (CSD) from the quantities
resulting from this transformation was difficult and accordingly the use of second moment
of the distribution for mass and energy balances were suggested.
In a special case for moment transformations, Mayrhofer and Nylt (1988)
presented a good analysis of the programmed cooling batch crystallizers, starting with the
solution of the momentum equations of the population balance.
In a batch crystallizer, it is assumed (i) crystal growth rate G is constant and (ii)
crystal nucleation rate B is constant. The assumption (i) is useful for mathematical
simplification, which results in a moderate supsersaturation rise with the temperature

169
falling. Crystal growth rate generally diminishes with falling temperature but this drop
could be compensated by the supersaturation rise. A similar consideration also holds for
nucleation rate.
Under these considerations, the moment transformation equations can be rewritten
as
Bdt
dNc = (7.18)
GNdt
dLc
c = (7.19)
GLdt
dAc
c β2= (7.20)
βρ /3 GAkdt
dMcV
c = (7.21)
where Nc is the crystal numbers, Ac is the surface area of the crystals, and β is the surface
factor.
The momentum equations 7.18 –7.21 can be solved and combined with mass
balance equation to get the temperature profile at constant supersaturation for the time 0 ≤
t ≤ tc, where N0 is the initial seed numbers and the solubility is linearly dependent on
temperature.
)]/1(1[)/()/()( 300 ccf ttKttTTTT −−=−− (7.22)
10 )]/(41[ −+= cBtNK (7.23)

170
If the nucleation is negligible compared to seeding, which means K→0, then the
above Equation 7.22 simplifies to a similar equation reported by Nyvlt and Vaclavu
(1964).
300 )/()/()( cf ttTTTT =−− (7.24)
On the other hand, if nucleation is prevailing (no seeding) in the process, which
means K→1, the following equation is readily obtained.
400 )/()/()( cf ttTTTT =−− (7.25)
This relationship has been discussed earlier (Nyvlt, et al., 1973; Nyvlt, 1983).This
model determines the optimum cooling curve for a batch crystallizer with an arbitrary
seeding and nucleation ratio. Indeed, as shown in Figure 7.1, for different K values, there
is no significant difference in the cooling trend. Choong and Smith (2004) showed that the
optional cooling profiles were normally convex curves in batch crystallizers.

171
0 0.1 0.2 0.3 0.4 0.5 0.6 0.7 0.8 0.9 1275
280
285
290
295
300
305
310
315K=0K=1K=0.5
Figure 7.1 Typical convex cooling curves from Equation 7.22
7.3.2 Orthogonal collocation method
The orthogonal collocation method is very efficient for solving differential
equations (Villadsen and Michelsen,1978). Miller (1993) discussed the application of
orthogonal collocation with Lagrange polynomials in solving population balance
equations. Hu et al. (2004) used the orthogonal collocation method to discrete the
population density along the size for batch crystallization and successfully applied it in
nonlinear kinetic parameter estimation from batch cooling seeded crystallization.

172
Figure 7.2 Population density discretization
As shown in Fig 7.2, the batch time period is divided into k time steps, each with
length of ∆t. At the time t=j ∆t, m+1 points are chosen to calculate the population density
for the time t= (j+1)∆t, with the size Lj,0, Lj,1, …, Lj,m and population densities nj,0, nj,1, …,
nj,m. The first index (j=0,1,…,k) denotes the time interval number and the second index
indicates the series number of points of the crystal size distribution.
In the case that crystal breakage and agglomeration are neglected, for seeded
crystals, it was shown by Hu et al.(2004) that
tL
tLGn
ntjtLL
ijij
ij∆
∂∂
+=
∆==
+
,
,,1
,
),(1
~~ (7.26)
It was thus proved that the solution of the above finite-difference analog converges
to the solution of the population balance equation if ∆t approaches to zero.
∆Lj,i
nj,i
nj,i nj,
1
Lj,0 Lj,1 Lj,i Lj,m L

173
Crystal size L can be expressed as
ijijij LtjLGL ,,,1 ),( +∆≈+ (7.27)
Since the seed size distribution is known, n0,i and L0,i are available. Therefore, nj+1,i
and Lj+1,i for j=0,1,…,k-1 and i=0,1,…,m-1, can be solved iteratively by the above
equations 7.26 and 7.27.
For the newly formed crystals, it is assumed that the secondary nuclei have the
same growth behavior as that of seed crystals. The similar approach can be applied to
obtain
tL
tLGn
ntjtLL
ijij
ij∆
∂∂
+=
∆==
−+
− ,
1,,1
1,
),(1 (7.28)
for j=0,1,…,k-1 and i=0,1,…,j+1, with the boundary conditions of Equation 7.2 and Lj,0=0.
7.4 Optimal operation profile of 4-hydroxy-2-pyrrolidone preferential crystallization
in isopropanol
As highlighted in the introduction, it is paramount to control supersaturation within
a critical value in preferential crystallization process to avoid spontaneous nucleation of
both enantiomers, to inhibit possible secondary initiated nucleation of undesired isomer
when the supersaturation surpasses a critical range, and to obtain good crystal size
distribution. Several works have mentioned supersaturation effects in preferential
crystallization process (Hongo et al., 1981; Ndzié et al., 1997; Collins et al., 1997; Beilles

174
et al., 2001; Courvoisier et al., 2003), but no effort has been reported to control the critical
supersaturation in preferential crystallization.
7.4.1 Methodology
As discussed in Section 7.3, the orthogonal collocation method is very efficient for
solving differential equations. It was developed and used here to predict the cooling
profile to control the supersaturation in preferential crystallization of 4-hydroxy-2-
pyrrolidone in isopropanol.
For seed crystals,
tL
tLGn
ntjtLL
ijij
ij∆
∂∂
+=
∆==
+
,
,,1
,
),(1
~~ (7.29)
For newly formed crystals,
tL
tLGn
ntjtLL
ijij
ij∆
∂∂
+=
∆==
−+
− ,
1,,1
1,
),(1 (7.30)
Crystal size L can be expressed as
ijijij LtjLGL ,,,1 ),( +∆≈+ (7.31)
The boundary condition is

175
0),0( 0 ===
LGBtLn
o
(7.32)
Crystallization kinetics
47.09.16104.3 TMGB ×××= (7.33)
35.15 )/15000exp(104.4 cRTG ∆×−××= (7.34)
))((*)()( tTctctc −=∆ (7.35)
It was known that the recovery of the crystal size distribution (CSD) from the
quantities resulting from this transformation was difficult (Rawlings et al., 1993).
Therefore, here the second moment of the distribution was used for mass balances, where
h is a conversion factor equal to the volume of slurry per mass of solvent.
23)( hGmkdt
tdcVρ−= (7.36)
Solubility equation was obtained in Chapter 5,
26 )273(108)273(000139.0007227.0)(* −×+−+= − TTTc (7.37)
The above equations are combined together to obtain temperature profile for a
given supersaturation ∆c.
7.4.2 Thermodynamics considerations
A saturated solution of 20%ee R-enantiomer was used as the starting point to
illustrate how to apply the above equations to control the supersaturation during the
preferential crystallization by using the thermodynamics data and crystallization kinetics.
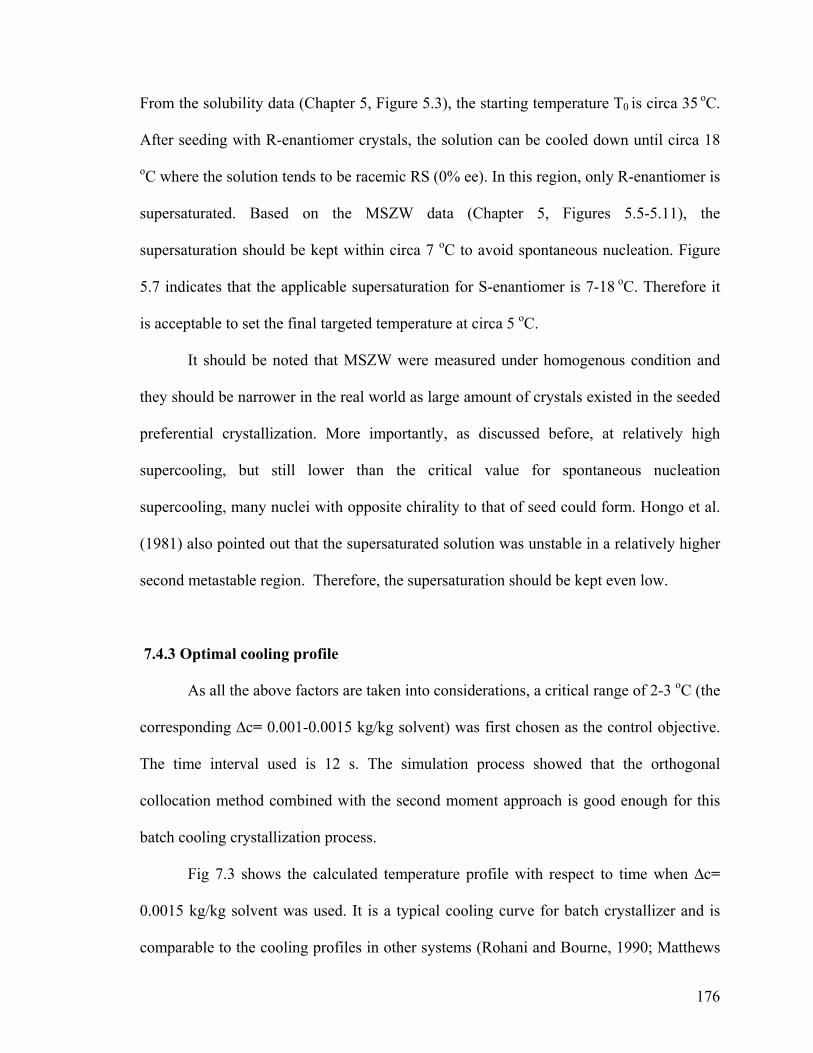
176
From the solubility data (Chapter 5, Figure 5.3), the starting temperature T0 is circa 35 oC.
After seeding with R-enantiomer crystals, the solution can be cooled down until circa 18
oC where the solution tends to be racemic RS (0% ee). In this region, only R-enantiomer is
supersaturated. Based on the MSZW data (Chapter 5, Figures 5.5-5.11), the
supersaturation should be kept within circa 7 oC to avoid spontaneous nucleation. Figure
5.7 indicates that the applicable supersaturation for S-enantiomer is 7-18 oC. Therefore it
is acceptable to set the final targeted temperature at circa 5 oC.
It should be noted that MSZW were measured under homogenous condition and
they should be narrower in the real world as large amount of crystals existed in the seeded
preferential crystallization. More importantly, as discussed before, at relatively high
supercooling, but still lower than the critical value for spontaneous nucleation
supercooling, many nuclei with opposite chirality to that of seed could form. Hongo et al.
(1981) also pointed out that the supersaturated solution was unstable in a relatively higher
second metastable region. Therefore, the supersaturation should be kept even low.
7.4.3 Optimal cooling profile
As all the above factors are taken into considerations, a critical range of 2-3 oC (the
corresponding ∆c= 0.001-0.0015 kg/kg solvent) was first chosen as the control objective.
The time interval used is 12 s. The simulation process showed that the orthogonal
collocation method combined with the second moment approach is good enough for this
batch cooling crystallization process.
Fig 7.3 shows the calculated temperature profile with respect to time when ∆c=
0.0015 kg/kg solvent was used. It is a typical cooling curve for batch crystallizer and is
comparable to the cooling profiles in other systems (Rohani and Bourne, 1990; Matthews
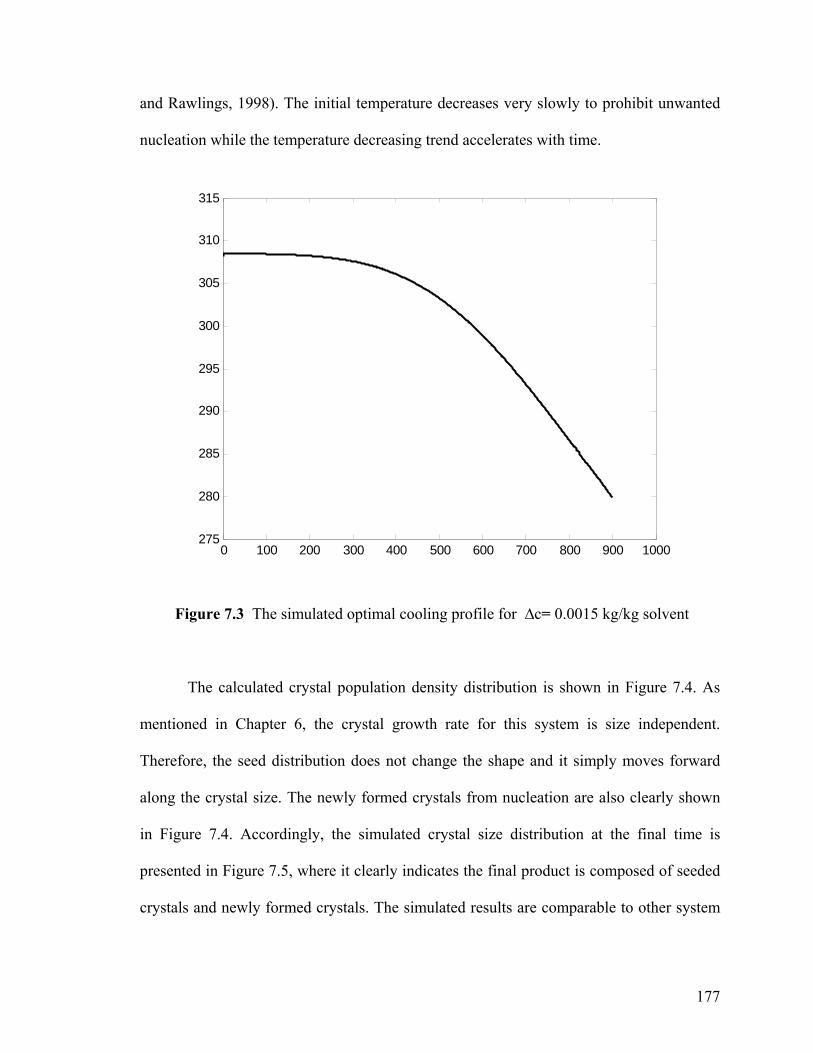
177
and Rawlings, 1998). The initial temperature decreases very slowly to prohibit unwanted
nucleation while the temperature decreasing trend accelerates with time.
0 100 200 300 400 500 600 700 800 900 1000275
280
285
290
295
300
305
310
315
Figure 7.3 The simulated optimal cooling profile for ∆c= 0.0015 kg/kg solvent
The calculated crystal population density distribution is shown in Figure 7.4. As
mentioned in Chapter 6, the crystal growth rate for this system is size independent.
Therefore, the seed distribution does not change the shape and it simply moves forward
along the crystal size. The newly formed crystals from nucleation are also clearly shown
in Figure 7.4. Accordingly, the simulated crystal size distribution at the final time is
presented in Figure 7.5, where it clearly indicates the final product is composed of seeded
crystals and newly formed crystals. The simulated results are comparable to other system
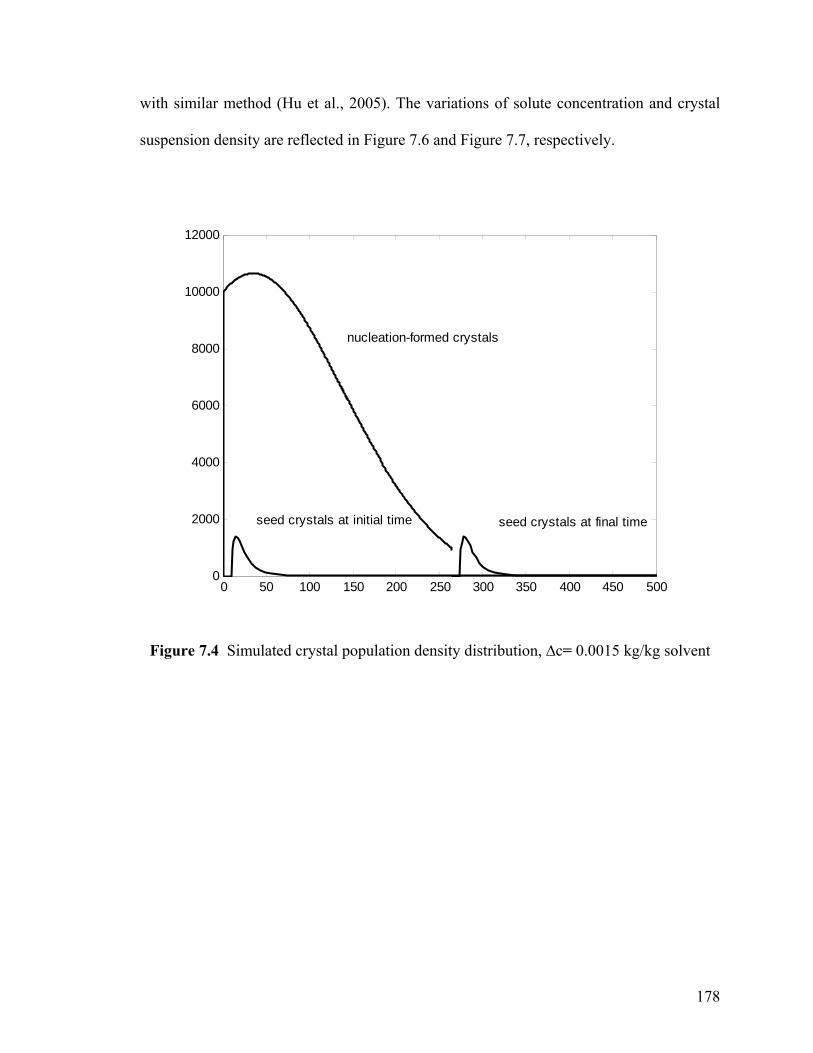
178
with similar method (Hu et al., 2005). The variations of solute concentration and crystal
suspension density are reflected in Figure 7.6 and Figure 7.7, respectively.
0 50 100 150 200 250 300 350 400 450 5000
2000
4000
6000
8000
10000
12000
nucleation-formed crystals
seed crystals at initial time seed crystals at final time
Figure 7.4 Simulated crystal population density distribution, ∆c= 0.0015 kg/kg solvent

179
Figure 7.5 Simulated final crystal size distribution, ∆c= 0.0015 kg/kg solvent
100
101
102
103
1040
1
2
3
4
5
6
7
8
9
Crystal Size [um]
Vol
ume
Per
cent
age
[%]

180
Figure 7.6 Concentration with time, ∆c= 0.0015 kg/kg solvent
0 100 200 300 400 500 600 700 800 900 10000.008
0.01
0.012
0.014
0.016
0.018
0.02
0.022
0.024
Time [min]
Con
cent
ratio
n [k
g/kg
]

181
0 100 200 300 400 500 600 700 800 900 10000
0.002
0.004
0.006
0.008
0.01
0.012
0.014
Figure 7.7 Crystal slurry suspension density with time
For the supersaturation control in preferential crystallization of 4-hydroxy-2-
pyrrolidone, the simplified approach proposed by Mayrhofer and Nyvlt (1988) is also of
particular interest. It determines the optimal cooling curve for a batch crystallizer with an
arbitrary seeding and nucleation ratio. This is very meaningful and useful for preferential
crystallization as seeding is always needed.
According to the crystal growth kinetics (Equation 7.22), if ∆c=0.001 kg/kg
solvent at 35 oC, G=0.11 µm/min, while G=0.10 µm/min at 5 oC with ∆c=0.0015 kg/kg
solvent. This suggests that it is quite acceptable to assume constant G during the operation
while the supersaturation is still well controlled within a safe region 2-3 oC. The crystal
nucleation rate expression (Equation 7.33) indicates a low dependency on the crystal
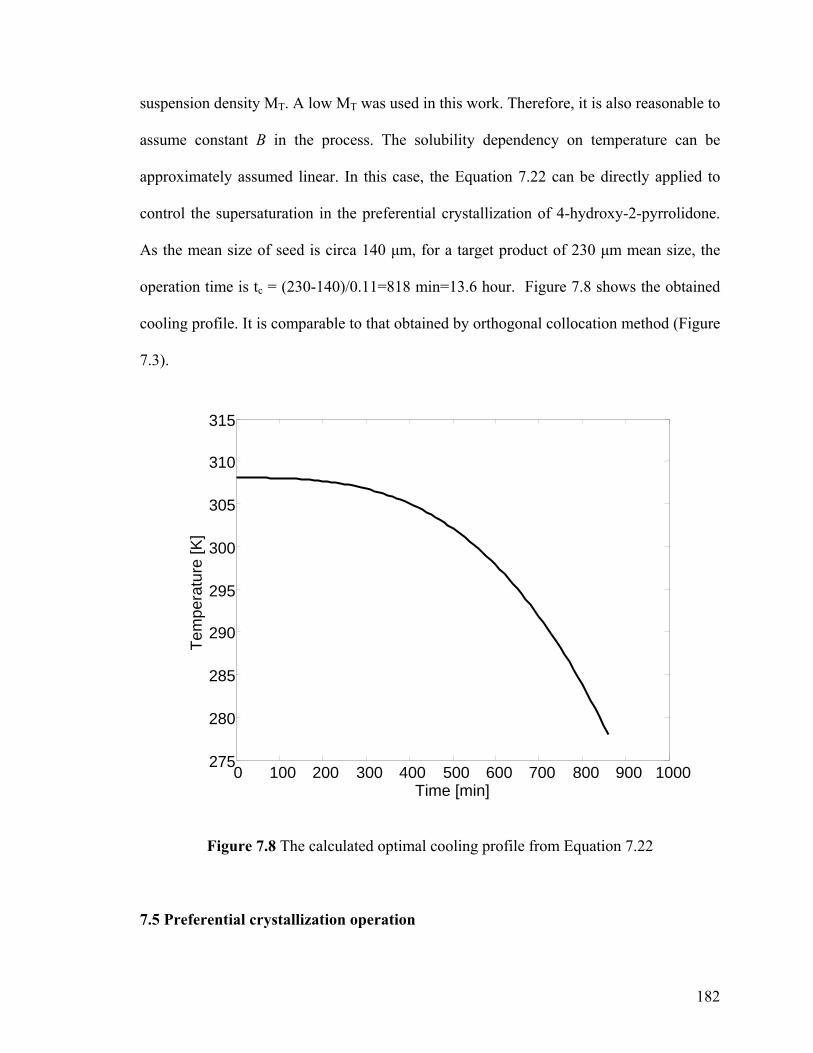
182
suspension density MT. A low MT was used in this work. Therefore, it is also reasonable to
assume constant B in the process. The solubility dependency on temperature can be
approximately assumed linear. In this case, the Equation 7.22 can be directly applied to
control the supersaturation in the preferential crystallization of 4-hydroxy-2-pyrrolidone.
As the mean size of seed is circa 140 µm, for a target product of 230 µm mean size, the
operation time is tc = (230-140)/0.11=818 min=13.6 hour. Figure 7.8 shows the obtained
cooling profile. It is comparable to that obtained by orthogonal collocation method (Figure
7.3).
Figure 7.8 The calculated optimal cooling profile from Equation 7.22
7.5 Preferential crystallization operation
0 100 200 300 400 500 600 700 800 900 1000275
280
285
290
295
300
305
310
315
Time [min]
Tem
pera
ture
[K]
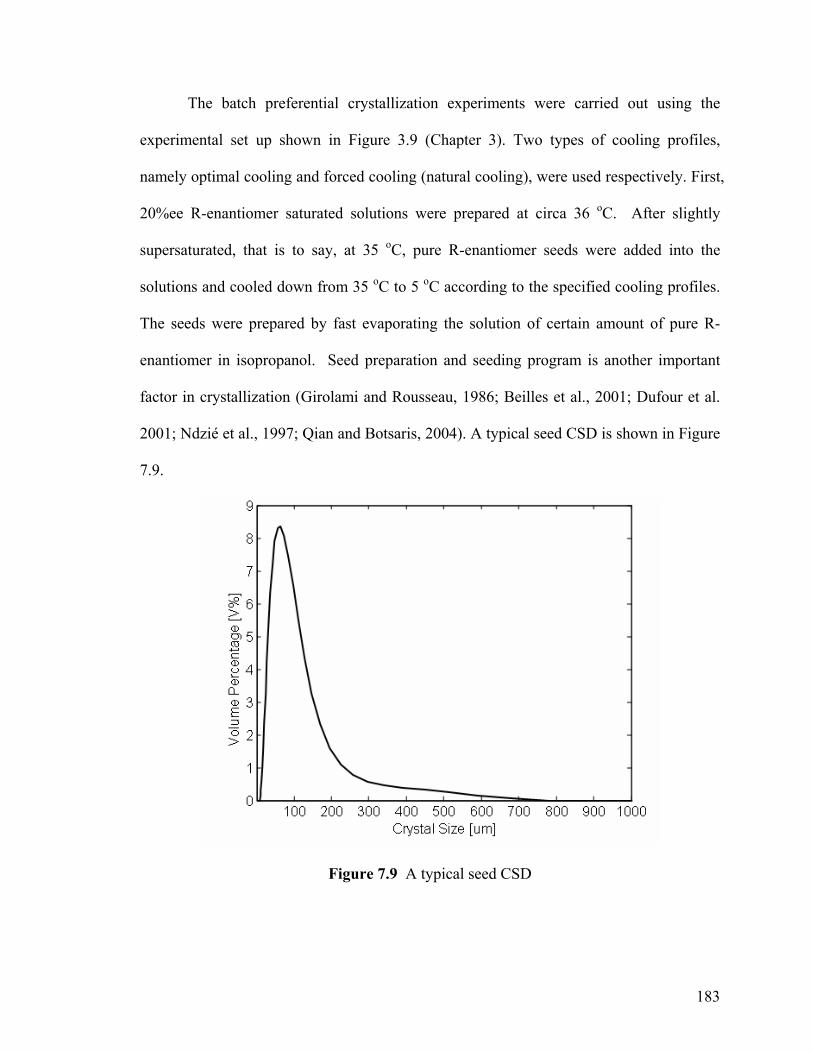
183
The batch preferential crystallization experiments were carried out using the
experimental set up shown in Figure 3.9 (Chapter 3). Two types of cooling profiles,
namely optimal cooling and forced cooling (natural cooling), were used respectively. First,
20%ee R-enantiomer saturated solutions were prepared at circa 36 oC. After slightly
supersaturated, that is to say, at 35 oC, pure R-enantiomer seeds were added into the
solutions and cooled down from 35 oC to 5 oC according to the specified cooling profiles.
The seeds were prepared by fast evaporating the solution of certain amount of pure R-
enantiomer in isopropanol. Seed preparation and seeding program is another important
factor in crystallization (Girolami and Rousseau, 1986; Beilles et al., 2001; Dufour et al.
2001; Ndzié et al., 1997; Qian and Botsaris, 2004). A typical seed CSD is shown in Figure
7.9.
Figure 7.9 A typical seed CSD

184
The optical purity of crystal products were measured using a Mettler Toledo DSC
822e Module (heat flux DSC), together with the STARe software. Samples of 6-10 mg
were prepared in standard 40 µl aluminum crucibles. The crucibles were sealed with a
perforated cover. The optical purity was also verified using a JASCO P-1020 digital
polarimeter, which was equipped with a sodium vapor lamp emitting light with a
wavelength of λ = 589.3 nm and a quartz cell of 50 mm path length. The crystal size
distribution was also measured using a Malvern Mastersizer 2000 with a Hydro 2000µP
dispersion cell unit with n-hexane as the liquid dispersion medium.
The crystal morphology was investigated using a Jeol JSM-6700F Field Emission
SEM. A small amount of samples were scattered on double-sided adhesive carbon taps
mounted on SEM stubs, and were coated with Au/Pd in a Cressington 208 sputter coater.
7.6 Results and discussion
7.6.1 Operation and in-situ monitoring
The temperature of the solutions inside the crystallizer was controlled by the
LabMax system and the corresponding real temperature was recorded. It is shown in
Figure 7.10. For comparison, a forced cooling profile was applied. The LabMax system
can precisely track and control the proposed temperature profile very well. Indeed, the
proposed temperature curves and the controlled curves are almost the same. The chord
length distribution over the whole crystallization process was recorded using FBRM as
shown in Figure 7.11. The number of fine counts in the range of 1 – 5 µm was used as the
indication of nucleation.

185
Figure 7.10 The recorded cooling profile. 1-optimal cooling, 2-forced cooling
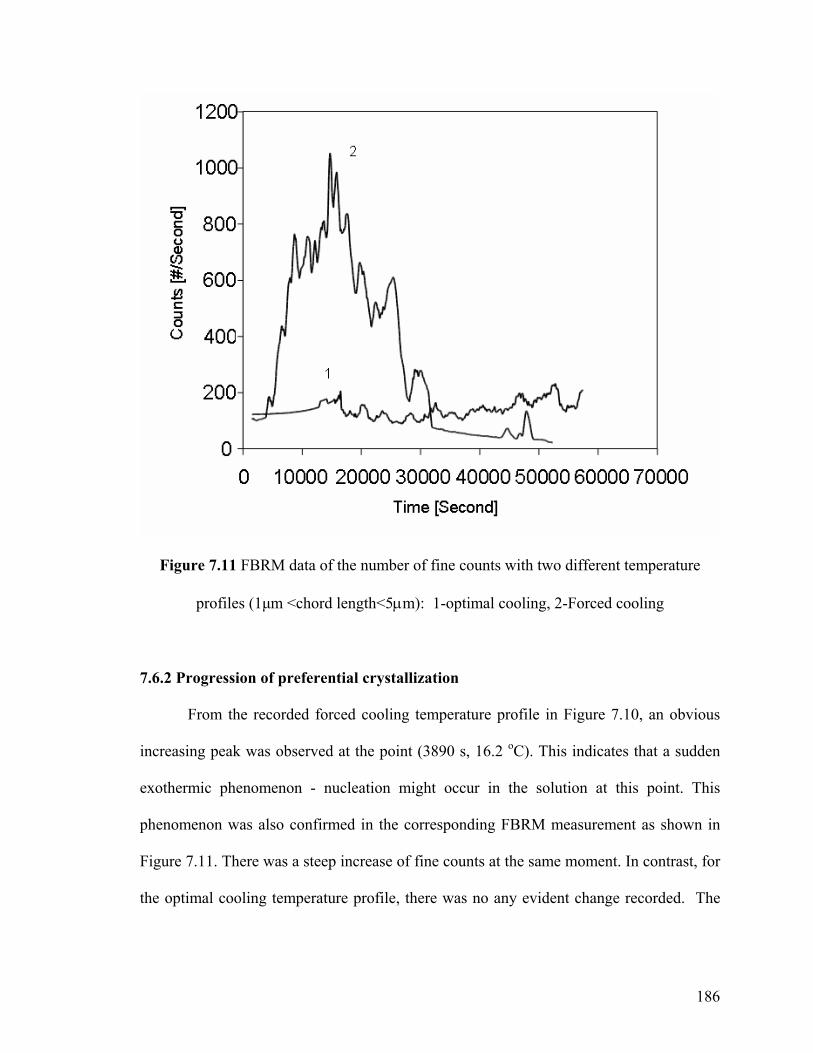
186
Figure 7.11 FBRM data of the number of fine counts with two different temperature
profiles (1µm <chord length<5µm): 1-optimal cooling, 2-Forced cooling
7.6.2 Progression of preferential crystallization
From the recorded forced cooling temperature profile in Figure 7.10, an obvious
increasing peak was observed at the point (3890 s, 16.2 oC). This indicates that a sudden
exothermic phenomenon - nucleation might occur in the solution at this point. This
phenomenon was also confirmed in the corresponding FBRM measurement as shown in
Figure 7.11. There was a steep increase of fine counts at the same moment. In contrast, for
the optimal cooling temperature profile, there was no any evident change recorded. The

187
subsequent effects of different cooling profiles were reflected in the following product
properties.
7.6.3 Optical purity of final products
Prior to determining the optical purity of crystallization products by means of DSC,
a calibration curve of melting temperature with enantiomeric excess (ee%) was
constructed in Figure 7.12. The examination for each sample was conducted under three
different heating rates - 2, 5, and 10 oC/min. The reproducible results indicate the melting
temperature is independent of the heating rates within 2 – 10 oC/min. The DSC
thermograms of final crystal products obtained from the experiments under optimal
cooling and forced cooling profiles as well as the pure R-enantiomer were shown in
Figure 7.13.
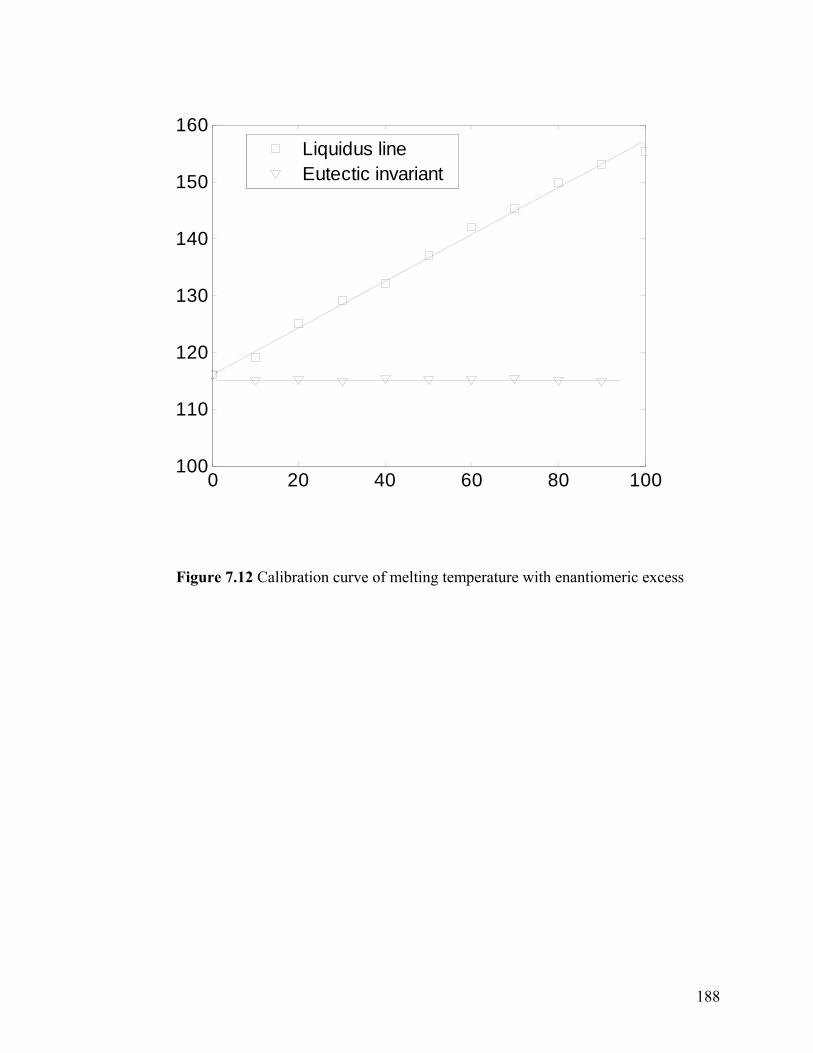
188
0 20 40 60 80 100100
110
120
130
140
150
160Liquidus lineEutectic invariant
Figure 7.12 Calibration curve of melting temperature with enantiomeric excess

189
50 100 150 200
1
2
3
1-Pure R-4HP 2-Optimal cooling 3-Forced cooling
Figure 7.13 DSC thermograms for final crystallization products and pure R-
enantiomer
The optical purity of the final crystal products were also verified by means of
polarimetry methods. Similarly, a calibration curve of optical rotation with concentration
for pure R-enantiomer was constructed in Figure 7.14. The relationship of concentration
of pure R-enantiomer C with optical rotation α is expressed as Equation 7.38.
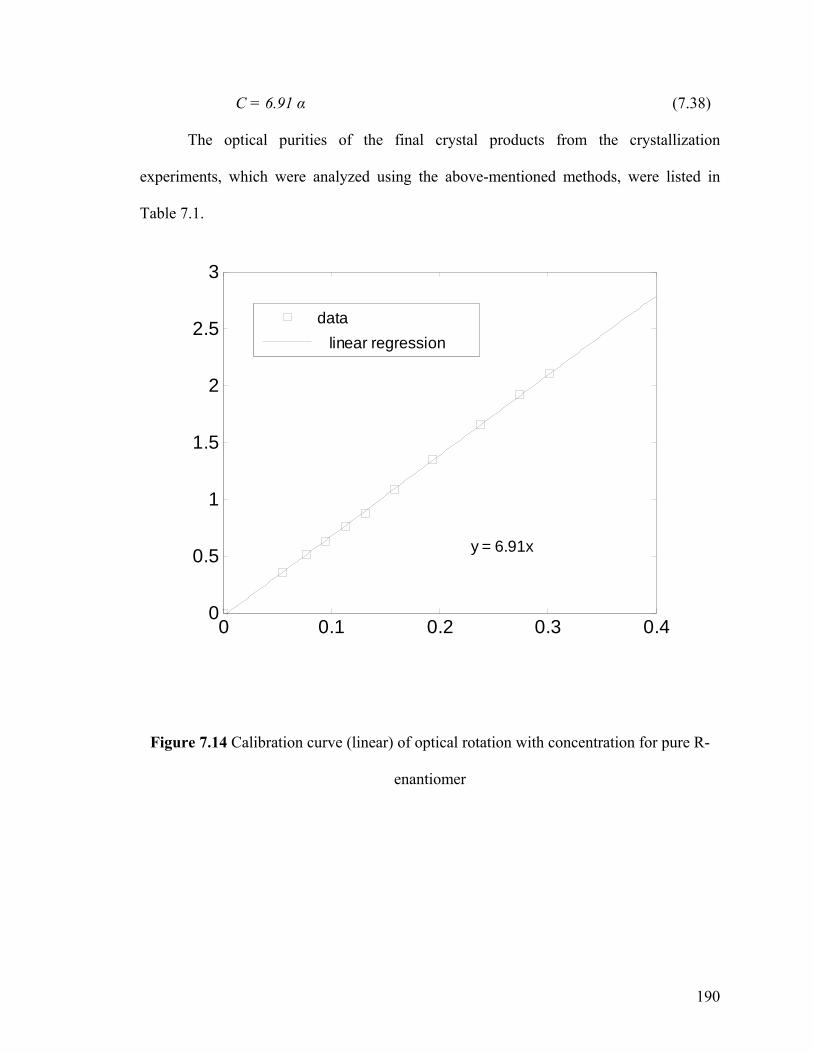
190
C = 6.91 α (7.38)
The optical purities of the final crystal products from the crystallization
experiments, which were analyzed using the above-mentioned methods, were listed in
Table 7.1.
0 0.1 0.2 0.3 0.40
0.5
1
1.5
2
2.5
3
y = 6.91x
data linear regression
Figure 7.14 Calibration curve (linear) of optical rotation with concentration for pure R-
enantiomer
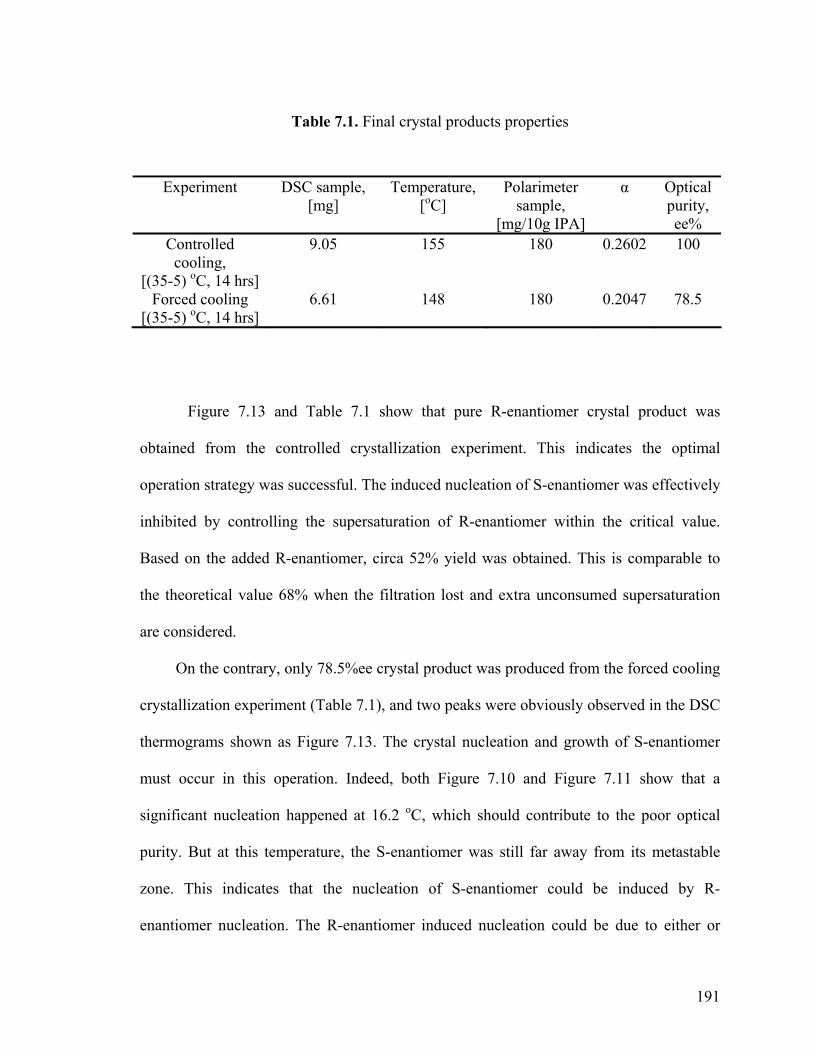
191
Table 7.1. Final crystal products properties
Figure 7.13 and Table 7.1 show that pure R-enantiomer crystal product was
obtained from the controlled crystallization experiment. This indicates the optimal
operation strategy was successful. The induced nucleation of S-enantiomer was effectively
inhibited by controlling the supersaturation of R-enantiomer within the critical value.
Based on the added R-enantiomer, circa 52% yield was obtained. This is comparable to
the theoretical value 68% when the filtration lost and extra unconsumed supersaturation
are considered.
On the contrary, only 78.5%ee crystal product was produced from the forced cooling
crystallization experiment (Table 7.1), and two peaks were obviously observed in the DSC
thermograms shown as Figure 7.13. The crystal nucleation and growth of S-enantiomer
must occur in this operation. Indeed, both Figure 7.10 and Figure 7.11 show that a
significant nucleation happened at 16.2 oC, which should contribute to the poor optical
purity. But at this temperature, the S-enantiomer was still far away from its metastable
zone. This indicates that the nucleation of S-enantiomer could be induced by R-
enantiomer nucleation. The R-enantiomer induced nucleation could be due to either or
Experiment DSC sample, [mg]
Temperature, [oC]
Polarimeter sample,
[mg/10g IPA]
α Optical purity, ee%
Controlled cooling,
[(35-5) oC, 14 hrs]
9.05 155 180 0.2602 100
Forced cooling [(35-5) oC, 14 hrs]
6.61 148 180 0.2047 78.5

192
both, (i) the spontaneous nucleation of both R and S enantiomers when the supersaturation
of R-enantiomer surpassed its metastable zone; (ii) the supersaturation of R-enantiomer
was still within its metastable zone, but surpassed a critical limit that its secondary
nucleation would breed the nucleation of S-enantiomer (Qian and Botsaris, 1998). It was
also argued that if high supersaturations within the metastable zone are used, some
conglomerates will form crystals that contain domains of both lattices in a single crystal,
which means that the enantiomerically pure seed could nucleate the other enantiomer at its
surface (Black et al., 1989; Collins et al., 1997).
The present results support the findings in the metastable zone measurements
(Chapter 5) where some extent of nucleation of S could initiate itself or could be induced
by spontaneous nucleation of R when the supersaturation surpassed a critical level. This is
also consistent with the observations of, (i) very low supersaturation required for high
optical purity (Furberg and Hassel, 1950; Black et al., 1989; Collins et al., 1997), (ii) a
relatively lower second metastable region (Hongo et al., 1981), (iii) and the importance of
controlled cooling program highlighted by Coquerel’s group (Ndzié et al., 1997; Beilles et
al., 2001; Dufour et al. 2001; Courvoisier et al., 2003).
7.6.4 Crystal size distribution
The crystal size distribution (CSD, volume basis) and the population density of the
prepared seeds as well as the product crystals obtained from the crystallization
experiments under controlled cooling profile and forced cooling profile are shown in
Figure 7.15. It should be noted that the measured CSD and population density do not
match the simulated results (Figure 7.5) so well although the main shapes and the newly
formed crystals are consistent with each other. This difficulty in recovering CSD and n
193
from moment transformations has been well discussed by Rawlings et al. (1993). Other
factors such as crystallization kinetics could also contribute to the deviation. Figure 7.15
shows that the optimal cooling profile produced larger particles with narrower distribution
and much less fine crystals compared to forced cooling. The crystal weighted mean size of
optimal operation is 247 µm (this is comparable to the targeted 230 µm) with 59%
coefficient of variation (CV), while the forced cooling gave crystals with 193 µm
weighted mean size and 78% coefficient of variation. Figure 7.16shows typical SEM
images of final product crystals obtained from the experiments under optimal cooling and
forced cooling profiles. It is apparent that the crystals from controlled cooling profile are
of bigger size and smoother surface than those obtained from forced cooling profile. A
good crystal habit would be very helpful to the downstream filtration/washing operation to
improve the product purity (Courvoisier et al., 2003; Matthews and Rawlings, 1998).

194
100 101 102 103 1040
2
4
6
8
10
12
Crystal Size [um]
Vol
ume
Per
cent
age
[%]
Optimal cooling
Seed
Forced cooling
100 101 102 103 1040
1
2
3
4
5x 10⁴
Crystal Size [um]
n [#
/Kg
solv
ent/u
m]
seedforced coolingOptimal cooling
Figure 7.15 Crystal size distribution of pure R-enantiomer seeds and crystal products
from different cooling profiles (a) volume basis (b) population density
(a)
(b)

195
Figure 7.16 SEM images of final crystal products from different cooling profiles:
(a) Controlled cooling, (b) Forced cooling
The above in-situ monitoring observations, final product purity and crystal habit
all indicate that it is essential to control the supersaturation of R-enantiomer within a
(a)
(b)

196
critical range to prevent the nucleation of S-enantiomer in preferential crystallization. The
proposed optimal cooling profile was successful in 4-hydroxy-2-pyrrolidone resolution.
7.6.5 Critical supersaturation range
In Section 7.6.1-7.6.5, the used critical supersaturation was safely chosen as 2-3 oC
(corresponding ∆c= 0.001-0.0015 kg/kg solvent) as various factors were considered.
According to the metastable zone data, the applicable supersaturation is more than 7 oC.
Therefore, it is interesting to investigate that if the operation supersaturation can be further
increased. This is especially important when operation time is key factor in the industrial
application.
The mathematical model and the methodology developed in Section 7.4.1 were
again employed here to predict the cooling profiles at different supersaturations. As the
critical supersaturation can not be predicted with current theory development ((Mersmann
and Bartosch, 1997; Kim and Mersmann, 2001), three supersaturations, namely ∆c=
0.0018; 0.0020 and 0.0022 kg/kg solvent, were used to simulate the batch crystallization
process. The calculated temperature via time curves are shown in Figures 7.17-7.19
respectively. The three cooling curves are pretty similar to that of ∆c= 0.0015 kg/kg
solvent, but the operation periods are shorter with higher supersatuartion. The
corresponding operation time is circa 630, 500 and 400 minutes, respectively.

197
0 100 200 300 400 500 600 700275
280
285
290
295
300
305
310
315
delta c=0.0018 kg/kg
Figure 7.17 Cooling profile, ∆c= 0018 kg/kg solvent

198
0 50 100 150 200 250 300 350 400 450 500275
280
285
290
295
300
305
310
315
delta c=0.0020 kg/kg
Figure 7.18 Cooling profile, ∆c=0020 kg/kg solvent
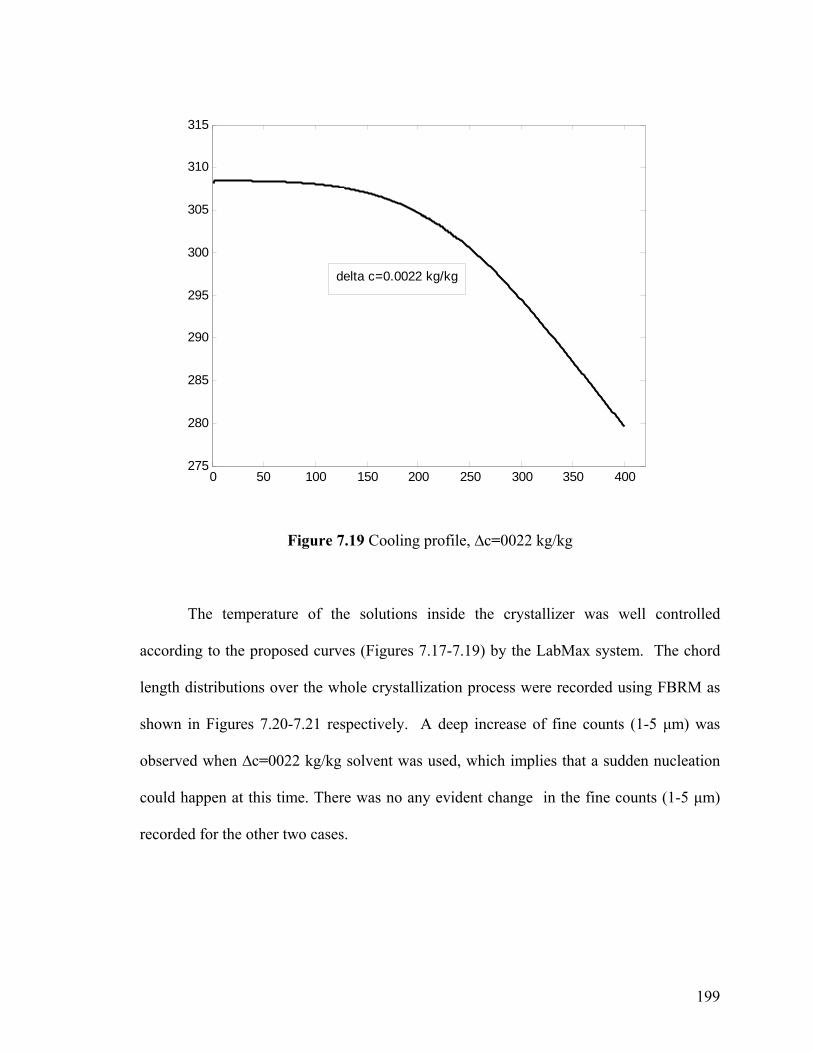
199
0 50 100 150 200 250 300 350 400275
280
285
290
295
300
305
310
315
delta c=0.0022 kg/kg
Figure 7.19 Cooling profile, ∆c=0022 kg/kg
The temperature of the solutions inside the crystallizer was well controlled
according to the proposed curves (Figures 7.17-7.19) by the LabMax system. The chord
length distributions over the whole crystallization process were recorded using FBRM as
shown in Figures 7.20-7.21 respectively. A deep increase of fine counts (1-5 µm) was
observed when ∆c=0022 kg/kg solvent was used, which implies that a sudden nucleation
could happen at this time. There was no any evident change in the fine counts (1-5 µm)
recorded for the other two cases.
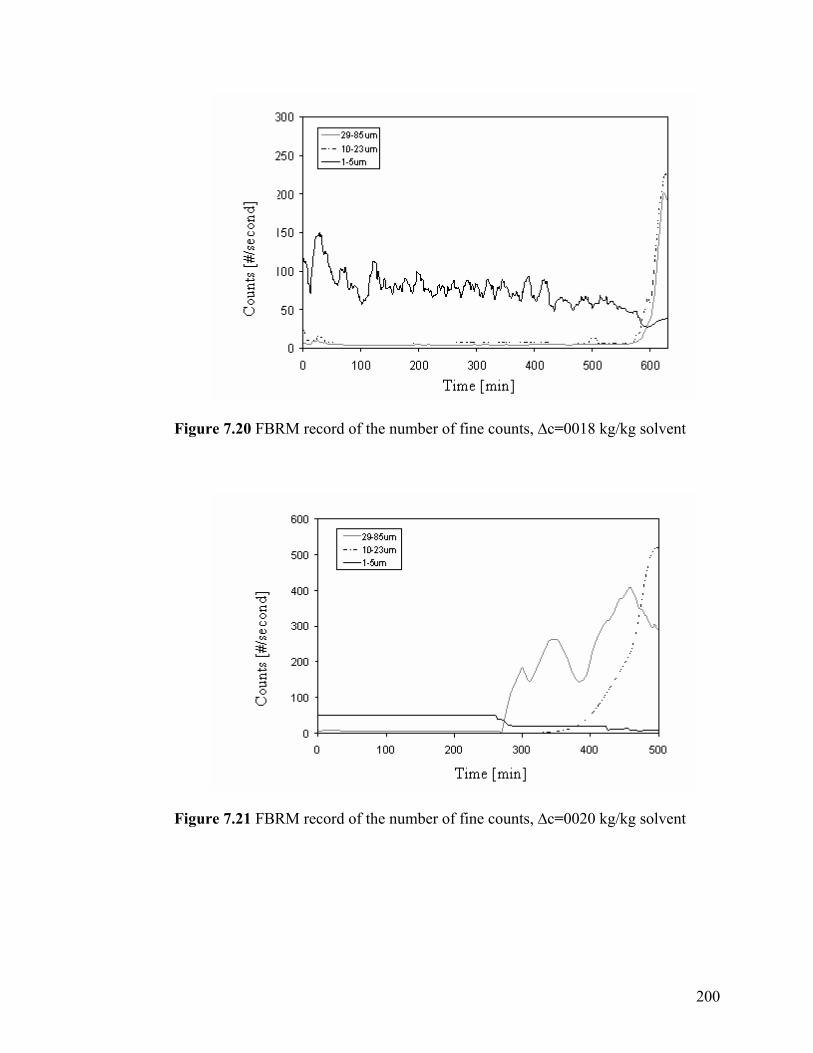
200
Figure 7.20 FBRM record of the number of fine counts, ∆c=0018 kg/kg solvent
Figure 7.21 FBRM record of the number of fine counts, ∆c=0020 kg/kg solvent
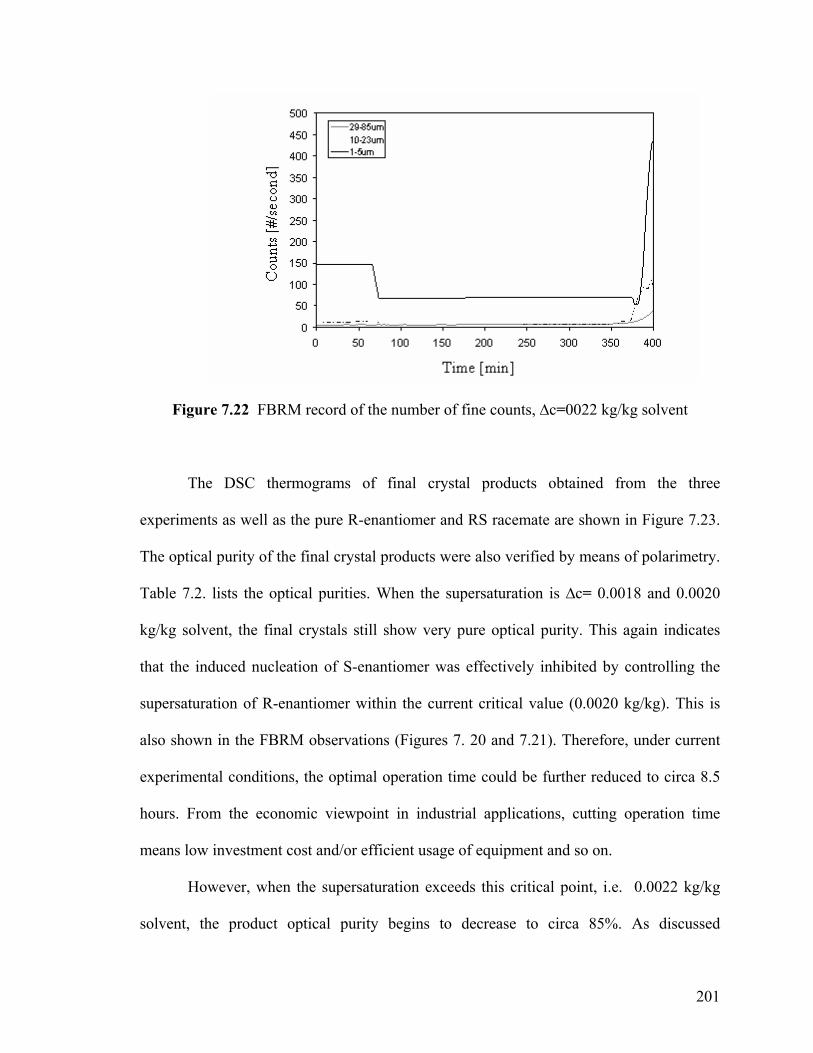
201
Figure 7.22 FBRM record of the number of fine counts, ∆c=0022 kg/kg solvent
The DSC thermograms of final crystal products obtained from the three
experiments as well as the pure R-enantiomer and RS racemate are shown in Figure 7.23.
The optical purity of the final crystal products were also verified by means of polarimetry.
Table 7.2. lists the optical purities. When the supersaturation is ∆c= 0.0018 and 0.0020
kg/kg solvent, the final crystals still show very pure optical purity. This again indicates
that the induced nucleation of S-enantiomer was effectively inhibited by controlling the
supersaturation of R-enantiomer within the current critical value (0.0020 kg/kg). This is
also shown in the FBRM observations (Figures 7. 20 and 7.21). Therefore, under current
experimental conditions, the optimal operation time could be further reduced to circa 8.5
hours. From the economic viewpoint in industrial applications, cutting operation time
means low investment cost and/or efficient usage of equipment and so on.
However, when the supersaturation exceeds this critical point, i.e. 0.0022 kg/kg
solvent, the product optical purity begins to decrease to circa 85%. As discussed

202
previously, this purity drop could again come from the induced S-enatiomer nucleation
(Furberg and Hassel, 1950; Hongo et al., 1981; Black et al., 1989; Collins et al., 1997;
Qian and Botsaris, 1998) when the supersaturation surpasses a certain level. Indeed, as
shown in Figure 7.22, a sudden nucleation was observed from the in-situ chord length
distribution using FBRM.
Figure 7.23. Product purities with different operating supersaturations

203
Table 7.2 Final crystal products properties with different operating supersaturations
In the aspect of crystal size distribution and crystal habits, it is interesting to find
that there is no significant difference for the three operations at different supersaturations.
Figure 7.24 presents the crystal distribution for the final crystal products. The SEM
imagines are shown in Figure 7.25. All the crystal products show good crystal habits
although more small crystals can be seen from the SEM imagines when ∆c= 0.0022 kg/kg
was used, which could be due to the observed nucleation from FBRM observations
(Figure 7.22). As mentioned before, many efforts have been tried to optimize batch
crystallization using various objectives, such as mean crystal size and coefficient of
variation (Chianese et al., 1984; Choong and Smith, 2004; Costa and Maciel Filho, 2005),
seed ratio (Bohlin and Rasmuson, 1992; Matthews and Rawlings, 1998; Chung et al.,
1999) and even shape (Ma et al., 2002). But for preferential crystallization process, current
results show that the supersaturation is the most important factor to get high optical purity.
Experiment DSC sample, mg
Temperature, oC
Polarimeter sample,
mg/10g IPA
α Optical purity, ee%
∆c=0.0018 kg/kg
3.54 155 180 0.2602 100
∆c=0.0020 kg/kg
3.31 155 180 0.2601 100
∆c=0.0022 kg/kg
5.24 153 180 0.2217 85.2
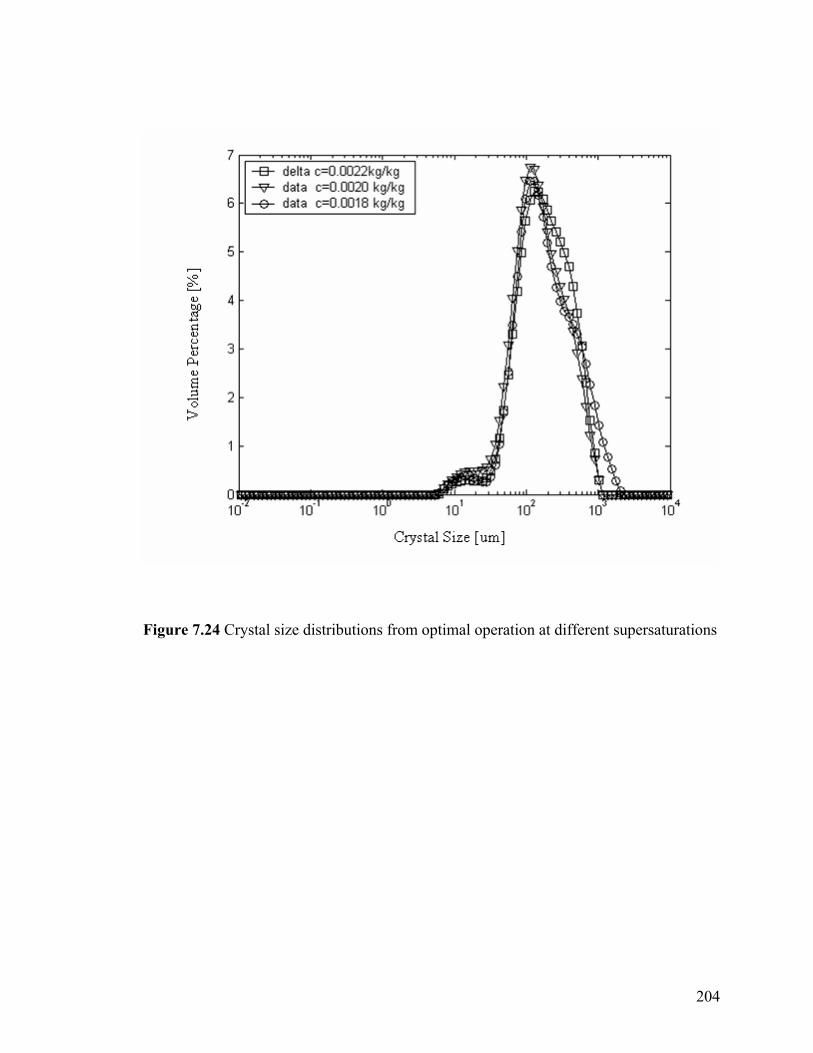
204
Figure 7.24 Crystal size distributions from optimal operation at different supersaturations
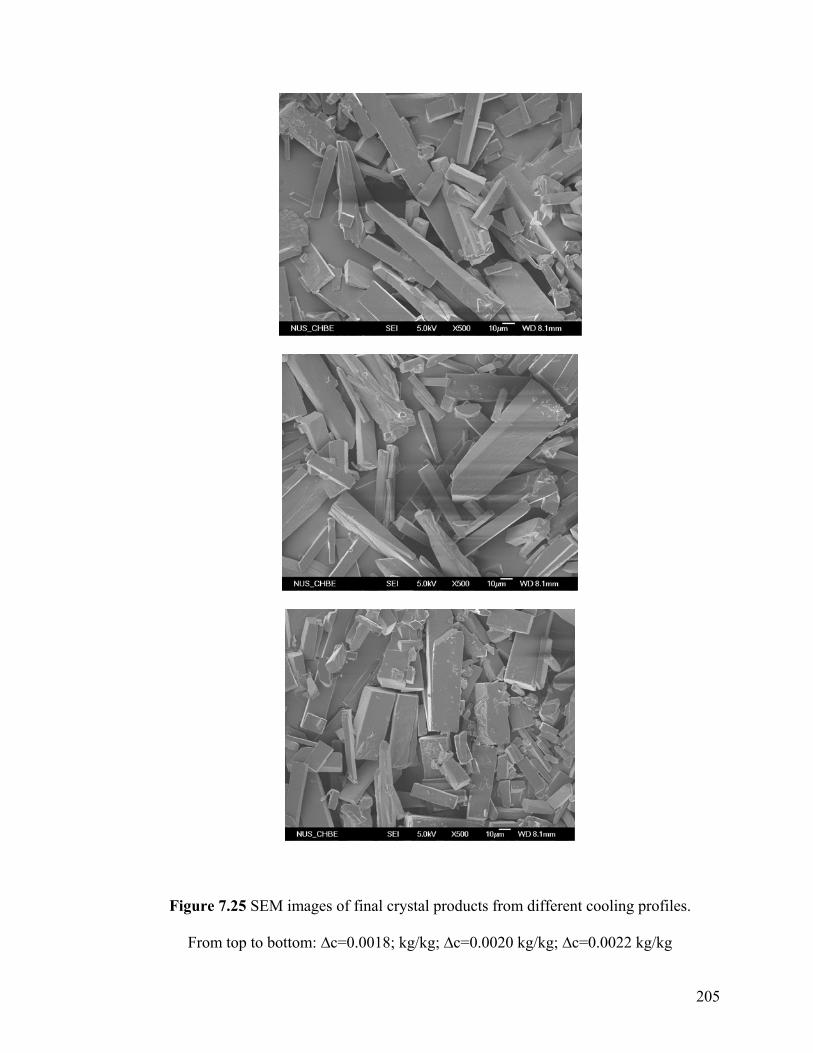
205
Figure 7.25 SEM images of final crystal products from different cooling profiles.
From top to bottom: ∆c=0.0018; kg/kg; ∆c=0.0020 kg/kg; ∆c=0.0022 kg/kg
206
7.7 Summary
The critical supersaturation control in preferential crystallization was proposed.
Mathematical model and solution were developed for batch cooling preferential
crystallization process. The orthogonal collocation method and the second momentum
were combined to solve the population balance and mass balance equations. The
methodology was successfully used in establishing the cooling profiles for the preferential
crystallization of 4-hydroxy-2-pyrrolidone in isopropanol. A series of batch operations of
4-hydroxy-2-pyrrolidone were experimentally studied under various supersaturatiuons.
In-situ monitoring showed that relatively high supersaturation of the target
enantiomer induced spontaneous nucleation of the undesired enantiomer, which
accordingly resulted in low optical purity and poor crystal size distribution. The proposed
optimal temperature trajectory to control the critical supersaturation successfully inhibited
the induced nucleation of the undesired enantiomer, and hence produced almost pure
crystals with good habits. Further investigations presented the optional operating strategy
without sacrifice of product optical purity. The critical supersaturation control used here is
expected to be applicable widely for preferential resolution. The integration of
thermodynamics, crystallization kinetics and population balance modeling was proved
essential and helpful to establish this control strategy.
Part of results in this chapter has been reported on Chemical Engineering Science (Vol 61,
pp.2406-2417. 2006)
207
CHAPTER 8 APPLICATION OF DIRECT
CRYSTALLIZATION FOR RACEMIC
COMPOUND PROPRANOLOL
HYDROCHLORIDE
8.1 Introduction
Direct crystallization plays an important role in the resolution of a racemic
conglomerate (preferential crystallization) or purification of a partially resolved racemic
compound (direct crystallization) whenever it is applicable. As illustrated in Chapter 7,
direct crystallization is feasible for the resolution of a conglomerate, which has been also
highlighted by many authors (Collet et al., 1980; Sheldon, 1993; Jacqueas et al., 1994;
Beilles et al., 2001; Elsner et al., 2005). With the big progress made in the field of
asymmetric synthesis and SMB chromatography etc, the partially resolved chiral samples
are easily available. However, these samples are often highly diluted and the enantiomeric
purity is insufficient. It would require much more extra efforts to acquire an optically pure
product rather than a partially resolved sample using asymmetric synthesis or SMB alone.
Instead, direct crystallization can be applied to further purify these partially resolved
samples. In the aspects of low cost and advantages of solid product, direct crystallization
also shows big advantages for the enrichment of chiral compounds (Lorenz, et al, 2001;
Schroer et al, 2001). This Chapter will explore the application of direct crystallization to
racemic compound coupling with chromatography.
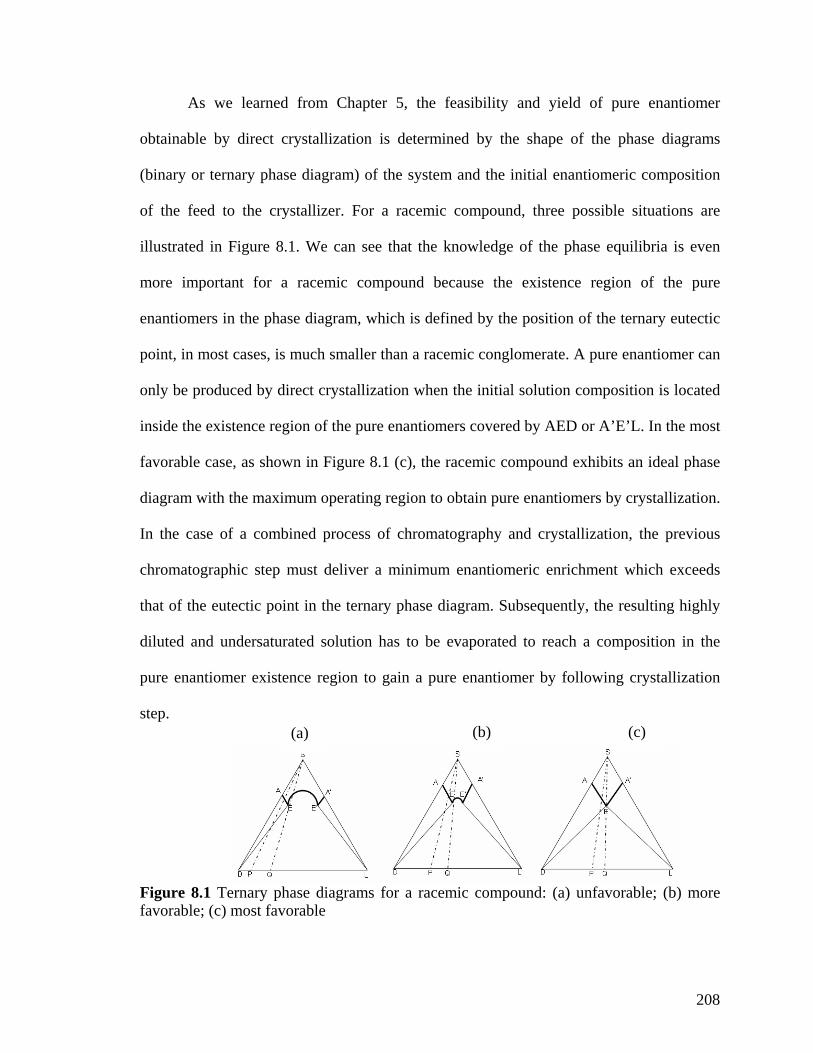
208
As we learned from Chapter 5, the feasibility and yield of pure enantiomer
obtainable by direct crystallization is determined by the shape of the phase diagrams
(binary or ternary phase diagram) of the system and the initial enantiomeric composition
of the feed to the crystallizer. For a racemic compound, three possible situations are
illustrated in Figure 8.1. We can see that the knowledge of the phase equilibria is even
more important for a racemic compound because the existence region of the pure
enantiomers in the phase diagram, which is defined by the position of the ternary eutectic
point, in most cases, is much smaller than a racemic conglomerate. A pure enantiomer can
only be produced by direct crystallization when the initial solution composition is located
inside the existence region of the pure enantiomers covered by AED or A’E’L. In the most
favorable case, as shown in Figure 8.1 (c), the racemic compound exhibits an ideal phase
diagram with the maximum operating region to obtain pure enantiomers by crystallization.
In the case of a combined process of chromatography and crystallization, the previous
chromatographic step must deliver a minimum enantiomeric enrichment which exceeds
that of the eutectic point in the ternary phase diagram. Subsequently, the resulting highly
diluted and undersaturated solution has to be evaporated to reach a composition in the
pure enantiomer existence region to gain a pure enantiomer by following crystallization
step.
Figure 8.1 Ternary phase diagrams for a racemic compound: (a) unfavorable; (b) more favorable; (c) most favorable
(a) (b) (c)

209
Propranolol hydrochloride, as shown in Figure 8.2, is a synthetic beta-adrenergic
receptor blocking agent widely used in the treatment of hypertension. Although it is
administrated as the racemate form, only (S)-enantiomer has the desired beta-adrenergic
blocking effect. In Chapter 4, it was identified as a racemic compound forming system.
The ternary phase diagram of propranolol hydrochloride dissolved in the mixture of
methanol and isopropanol (Figure 5.17) has the most favorable shape as shown in Figure
8.1 (c) for obtaining the pure enantiomer by direct crystallization. The mixture having the
eutectic composition is the racemate. The racemate can be readily separated by
chromatography. Furthermore, the two pure enantiomers are commercially available at a
reasonable price. Therefore, propranolol hydrochloride dissolved in the mixture of
methanol and isopropanol was chosen as a suitable model system to explore the
combination of chromatographic and crystallization separation techniques.
HO
(R)
HN
OHCl
R-propranolol hydrochloride
HO(S)
HN
OHCl
S-propranolol hydrochloride
Figure 8.2 Chemical structure of (R)- and (S)-propranolol hydrochloride
The resolution of propranolol hydrochloride via chromatography has been reported
by Ching et al. (2000) and Gritti & Guiochon (2004). However, the mechanism of
crystallization process for propranolol hydrochloride, which is a racemic compound, has

210
been rarely investigated. This Chapter presents such an effort to obtain a certain
enantiomerically enriched propranolol hydrochloride starting from a racemic composition
using a HPLC with a semi-preparative chiral column. A subsequent systematical study of
direct crystallization process starting from the same enantiomeric composition with the
partially resolved propranolol hydrochloride from the HPLC was conducted. The critical
supersaturation control strategy and the scheme to obtain pure enantiomer via direct
crystallization for the partially resolved racemic compound propranolol hydrochloride
were investigated. The crystallization progression was illustrated in terms of the diagram
of solubilities and metastable zone widths with different compositions.
8.2 Experimental setup and procedure
Semi-preparative HPLC separation of propranolol hydrochloride was performed
using an Agilent 1100 series HPLC system with Chiralcel OD-H semi-preparative column
(10mm ID x 250mm L). The mobile phase was 100% isopropanol. The flow rate was 1.0
ml/min. Isopropanol was chosen as the main eluant for HPLC separation due to the
solubility of propranolol hydrochloride in pure alcohols such as 100% isopropanol or
methanol are much higher than hexane/isopropanol solvent mixtures.
The batch direct crystallization experiments with and without seeding were carried
out using the experimental set-up shown in Figure 3.9. The 36.7%ee (consistent with the
above HPLC partial separation composition) R-enantiomer saturated solutions were
prepared at 35 oC. For seeding experiments, after slightly supersaturated, that is to say, at
34 oC, pure R-enantiomer seeds were added into the solutions and cooled down from 35
oC to 23 oC, 20.5 oC, and 17 oC, respectively. The seeds were prepared by fast cooling the

211
solution of certain amount of pure R-enantiomer in isopropanol. Typical load of
crystallizer was a solute mixture of 3.602 g of (RS)-propranolol hydrochloride and 2.091 g
(R)-propranolol hydrochloride dissolved in 471 ml of solvent mixture of methanol and
isopropanol (V:V = 1:5).
The optical purity was measured using an Agilent 1100 series HPLC system with
Chiralcel OD-H analytical column. The mobile phase was a mixture of
hexane/isopropanol (v/v = 80/20). The flow rate was 1.0 ml/min. The detection
wavelength was 254 nm.
The optical purity of crystal products were also verified using a Mettler Toledo
DSC 822e Module (heat flux DSC), together with the STARe software. Samples of 2-4 mg
were prepared in standard 40 µl aluminum crucibles. The crucibles were sealed with a
perforated cover. Preceding investigation of samples, a calibration curve of standard
samples with different enantiomerical excess was recorded. The examination for each
sample was conducted under three different heating rates - 2, 5, and 10 oC/min. The
reproducible results indicate the melting temperature is independent of the heating rates
within 2 – 10 oC/min.
The crystal size distribution was measured using a Malvern Mastersizer 2000 with
a Hydro 2000µP dispersion cell unit. Analytical hexane, in which propranolol
hydrochloride is almost insoluble, was used as the liquid dispersion medium. The crystal
morphology was investigated using a Jeol JSM-6700F Field Emission SEM. A small
amount of samples were scattered on double-sided adhesive carbon tabs mounted on SEM
stubs, and were coated with Au/Pd in a Cressington 208 sputter coater.
8.3 Results and discussion

212
8.3.1 Semi-preparative HPLC separation of propranolol hydrochloride using
Chiralcel OD-H column
The loading capacity of propranolol hydrochloride on Chiralcel OD-H column
(10mm ID x 250mm L) was determined by injecting different amount of sample onto the
column. Propranolol hydrochloride shows almost baseline separation on Chiralcel OD-H
at 8.95mg loading. As sample loading increased to up to 14.56mg, partial separation of
propranolol hydrochloride was obtained as shown in Figure 8.3. Through semi-preparative
chiral HPLC separation (14.56mg per analysis), we had isolated the R and S enantiomer
from its racemate, by collecting at two different fractions at retention time, t =15-25 mins
(fraction a) and at t =25-30 mins (fraction b) as shown in Figure 8.4. The enantiopurities
of these two fractions were analysed on analytical column (Chiralcel OD-H, 4.6mm ID x
250mm L) using hexane/isopropanol (80/20 v/v) as the mobile phase and flow rate of
1.0ml/min (shown in Figure 8.5). From the obtained chromatographic data, fraction (a)
consisted of R enantiomer with 36.7 % ee and fraction (b) consisted of S enantiomer with
100% ee. Upon continuous HPLC separation using an autosampler and automated fraction
collector, these two fractions could be accumulated until a certain volume (e.g. 1000ml)
and transferred into separate jacketed crystallizers for direct crystallization of respective
enantiomers.

213
Figure 8.3 Partial separation of propranolol on Chiralcel OD-H semi-preparative HPLC column (dimension 250mm L x 10mm I.D) at different loadings (8.95mg and 14.56mg per injection) using 100% IPA as mobile phase, at 25oC column temperature, flow rate of 1ml/min and UV-Vis detection at 254nm.
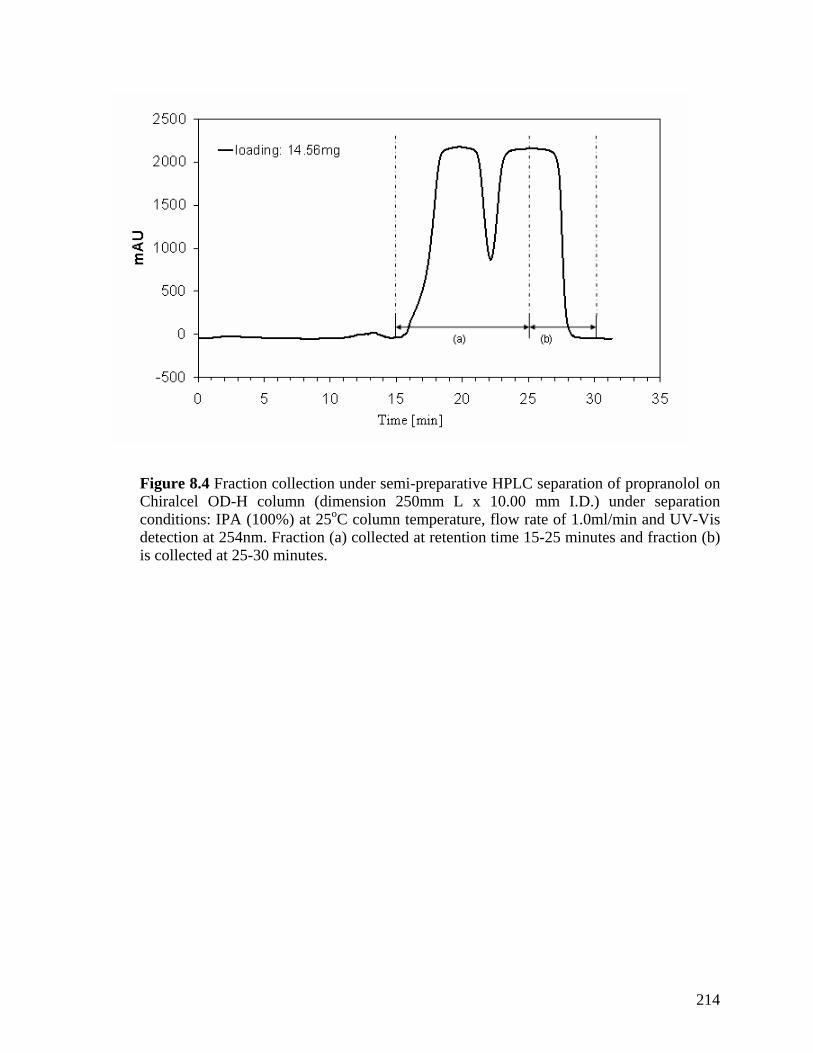
214
Figure 8.4 Fraction collection under semi-preparative HPLC separation of propranolol on Chiralcel OD-H column (dimension 250mm L x 10.00 mm I.D.) under separation conditions: IPA (100%) at 25oC column temperature, flow rate of 1.0ml/min and UV-Vis detection at 254nm. Fraction (a) collected at retention time 15-25 minutes and fraction (b) is collected at 25-30 minutes.

215
Figure 8.5 Chromatogram of two fractions (a) and (b) obtained through semi-preparative HPLC separation of propranolol on Chiralcel OD-H analytical column (dimension 250mm L x 4.6 mm I.D.) under separation conditions: Hexane/IPA (80/20 v/v) at 25oC column temperature, flow rate of 1.0ml/min and UV-Vis detection at 254nm.
216
8.3.2 Solubility and metastable zone width
As described in Chapter 5, the selection of a suitable solvent for an effective
crystallization operation is crucial. A mixture of two or more solvents is sometimes found
to possess the best properties for a particular crystallization purpose. It was found that the
solubility of propranolol hydrochloride in methanol or water was too high. Thus the
mixture of solvents was considered. The solubility of propranolol hydrochloride with
different composition in the mixture of methanol and acetone was measured in my
previous study (Wang et al, 2002). However, it was found that propranolol hydrochloride
was easily decomposed in the presence of acetone at ambient temperature. In this study,
the mixture of methanol and isopropanol was employed.
The solubilities and metastable zone widths of propranolol hydrochloride in the
mixture of methanol and isopropanol were determined in Chapter 5. From the ternary
phase diagram Figure 5.18, it can be seen that the eutectic composition is the one of the
racemate, which is the most favorable situation for a racemic compound. The solubility of
propranolol hydrochloride with different composition in the mixture of methanol and
isopropanol (V:V =1:5) properly increases with temperature over the range of 12 – 35 oC.
This suggests that the cooling crystallization for the chosen system is more favorable as
temperature decreases. As illustrated by Wood (Collins et al., 1997), the difference of the
saturation temperatures of (RS)- and (R)-propranolol hydrochloride at their respective
concentrations is suitable for the cooling crystallization process.
The solubilities and supersolubilities of (R)- and (RS)-propranolol hydrochloride
at cooling rate of 5 oC/h are shown in Figures 8.6. It was found that the MSZWs did not
change obviously with the cooling rate at the range of 1 - 10 oC/h. These results show that

217
the characteristic of solubility and the widths of metastable zone over the experimental
temperature range are favorable for direct crystallization process.
Figure 8.6 Solubility and supersolubility of (R)- and (RS)-propranolol hydrochloride
8.3.3 Progression of direct crystallization
Four batches of direct crystallization of propranolol hydrochloride in mixture of
methanol and isopropanol were carried out starting from the same solution containing
36.7% ee (R)-enantiomer with four different modes, which are (a) Exp01: with seeding
and final temperature at 23 oC; (b) Exp02: with seeding and final temperature at 20.5 oC;
8
10
12
14
16 C
once
ntra
tion
[mg
solu
te /
ml s
olve
nt]
RS_solubility R_solubility RS_supersolubilityR_supersolubility
0
2
4
6
-20 -10 0 10 20 30 40 Temperature [oC]
218
(c) Exp03: with seeding and final temperature at 18 oC; (d) Exp04: without seeding until
nucleation occurred.
As described in Figure 8.7, a saturated solution at 35 oC containing 36.7% ee (R)-
enantiomer is represented by point A. From the diagram of solubility and metastable zone
widths of (R)- and (RS)-propranolol hydrochloride in Figure 8.6, the solution was
saturated in the (R)-enantiomer at 30 oC represented by point B, and in the (RS)-
propranolol hydrochloride at 18 oC represented by point C. The solution was then seeded
with (R)-enantiomer crystals and cooled to 23 oC, 20.5 oC and 18 oC, respectively. It was
found that at temperature greater than 18 oC, the product crystals were in the form of pure
(R)-enantiomer, but at temperature lower than 18 oC, the product crystals were in the form
of mixture of (R)- and (RS)-propranolol hydrochloride. This might imply that there is no
selectivity of crystal growth of the pure enantiomer and racemate for a racemic compound
when both (R) and (RS) reach supersaturation. It suggests that only the excess enantiomer
can be crystallized out and no further resolution is attainable for a racemic compound.
This is unlike preferential crystallization of a conglomerate, where the crystallization rates
of two opposite enantiomers can be controlled to some extent and certain resolution can
be achieved by carefully designed and controlled entrainment procedure. However, as
mentioned before, as partially resolved solutions are readily obtained by other purification
processes, when it is well designed and controlled, direct crystallization is a good way to
get pure enantiomer.
When the solution was cooled to 17 oC without seeding, the primary nucleation
occurred after it exceeded the metastable zone of propranolol hydrochloride with initial
composition of 36.7% ee, and the mixture crystals of (R)- and (RS)-propranolol

219
hydrochloride were always obtained. This again might be due to the crucial characteristic
of a racemic compound – no selectivity of nucleation between the pure enantiomer and
racemate for a racemic compound. The corresponding consequences of different cooling
extent were reflected in the following product properties.
Figure 8.7. Progression of direct crystallization
8.3.4 Optical purity of final products
The optical purity of the final crystal products were analyzed by means of HPLC
method which was mentioned in Section 8.2. The chromatograms of the final crystal
products are shown in Figures 8.8- 8.11.

220
Figure 8.8 Chromatogram of final crystal product obtained from exp01 on Chiralcel OD-H analytical column (dimension 250mm L x 4.6 mm I.D.) under separation conditions: Hexane/IPA (80/20 v/v) at 25oC column temperature, flow rate of 1.0ml/min and UV-Vis detection at 254nm.

221
Figure 8.9 Chromatogram of final crystal product obtained from exp02 on Chiralcel OD-H analytical column (dimension 250mm L x 4.6 mm I.D.) under separation conditions: Hexane/IPA (80/20 v/v) at 25 oC column temperature, flow rate of 1.0ml/min and UV-Vis detection at 254nm.

222
Figure 8.10 Chromatogram of final crystal product obtained from exp03 on Chiralcel OD-H analytical column (dimension 250mm L x 4.6 mm I.D.) under separation conditions: Hexane/IPA (80/20 v/v) at 25oC column temperature, flow rate of 1.0ml/min and UV-Vis detection at 254nm.

223
Figure 8.11 Chromatogram of final crystal product obtained from exp04 on Chiralcel OD-H analytical column (dimension 250mm L x 4.6 mm I.D.) under separation conditions: Hexane/IPA (80/20 v/v) at 25oC column temperature, flow rate of 1.0ml/min and UV-Vis detection at 254nm
The optical purity of the final crystal products was also verified by means of DSC
measurement. Prior to determining the optical purity of crystallization products by means
of DSC, a calibration curve of melting temperature with enantiomeric excess (ee%) was
constructed in Figure 8.12. The DSC thermograms of final crystal products obtained from
the experiments at different temperature as well as the pure (R)- and (RS)-propranolol
hydrochloride are shown in Figure 8.13.
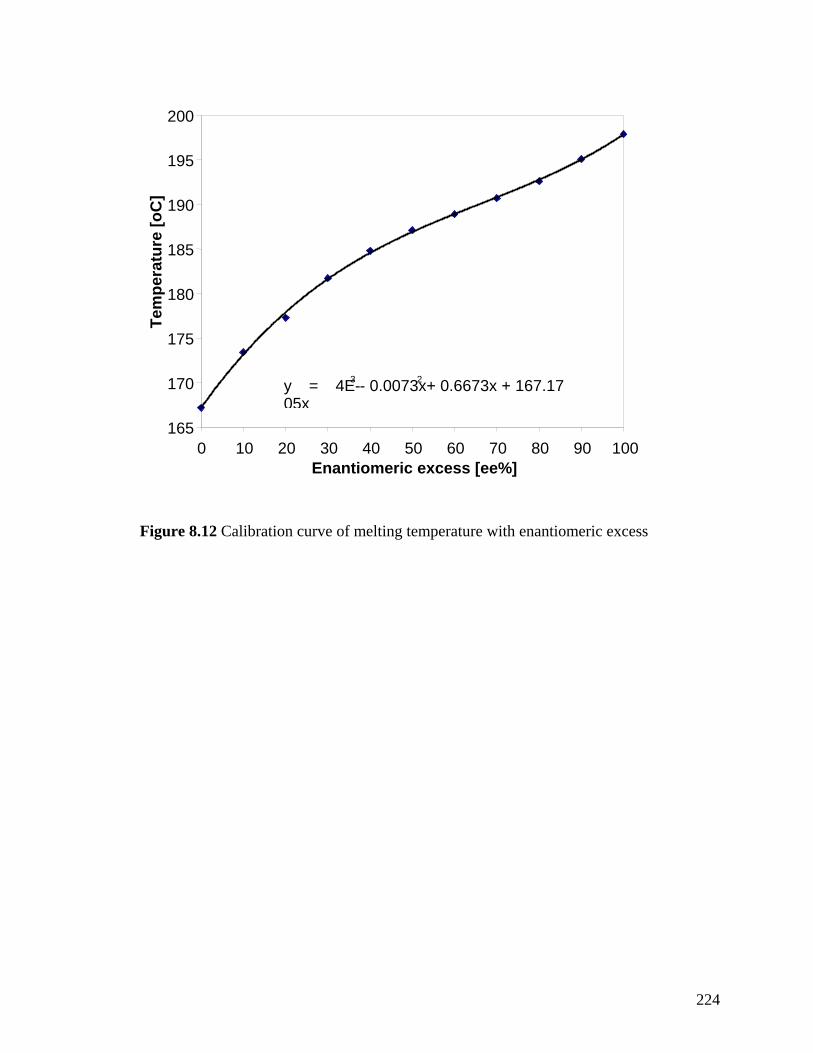
224
Figure 8.12 Calibration curve of melting temperature with enantiomeric excess
y = 4E-05x
3 - 0.0073x2 + 0.6673x + 167.17
165
170
175
180
185
190
195
200
0 10 20 30 40 50 60 70 80 90 100 Enantiomeric excess [ee%]
Tem
pera
ture
[oC
]

225
exp_01
50 70 90 110 130 150 170 190 210 230
Pure_R_PN.Cl
exp_02
exp_03
exp_04
RS_PN.Cl
Figure 8.13 DSC thermograms for final crystallization products and pure R- and RS-propranolol hydrochloride
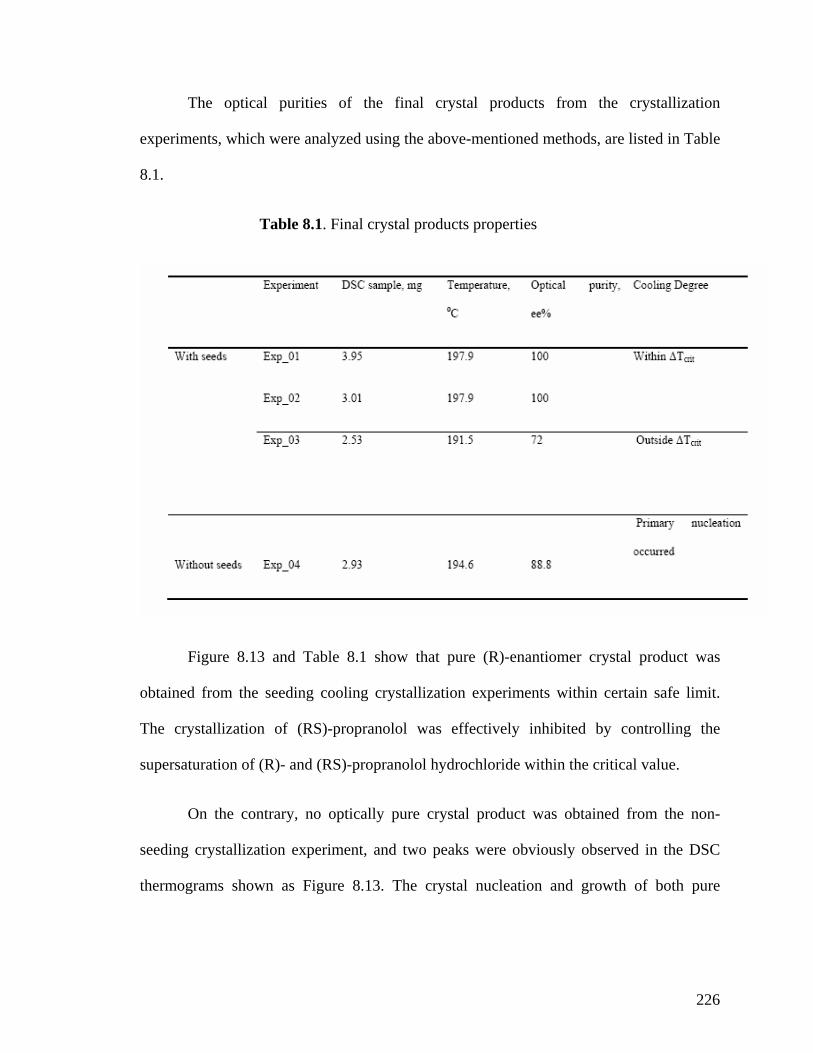
226
The optical purities of the final crystal products from the crystallization
experiments, which were analyzed using the above-mentioned methods, are listed in Table
8.1.
Table 8.1. Final crystal products properties
Figure 8.13 and Table 8.1 show that pure (R)-enantiomer crystal product was
obtained from the seeding cooling crystallization experiments within certain safe limit.
The crystallization of (RS)-propranolol was effectively inhibited by controlling the
supersaturation of (R)- and (RS)-propranolol hydrochloride within the critical value.
On the contrary, no optically pure crystal product was obtained from the non-
seeding crystallization experiment, and two peaks were obviously observed in the DSC
thermograms shown as Figure 8.13. The crystal nucleation and growth of both pure
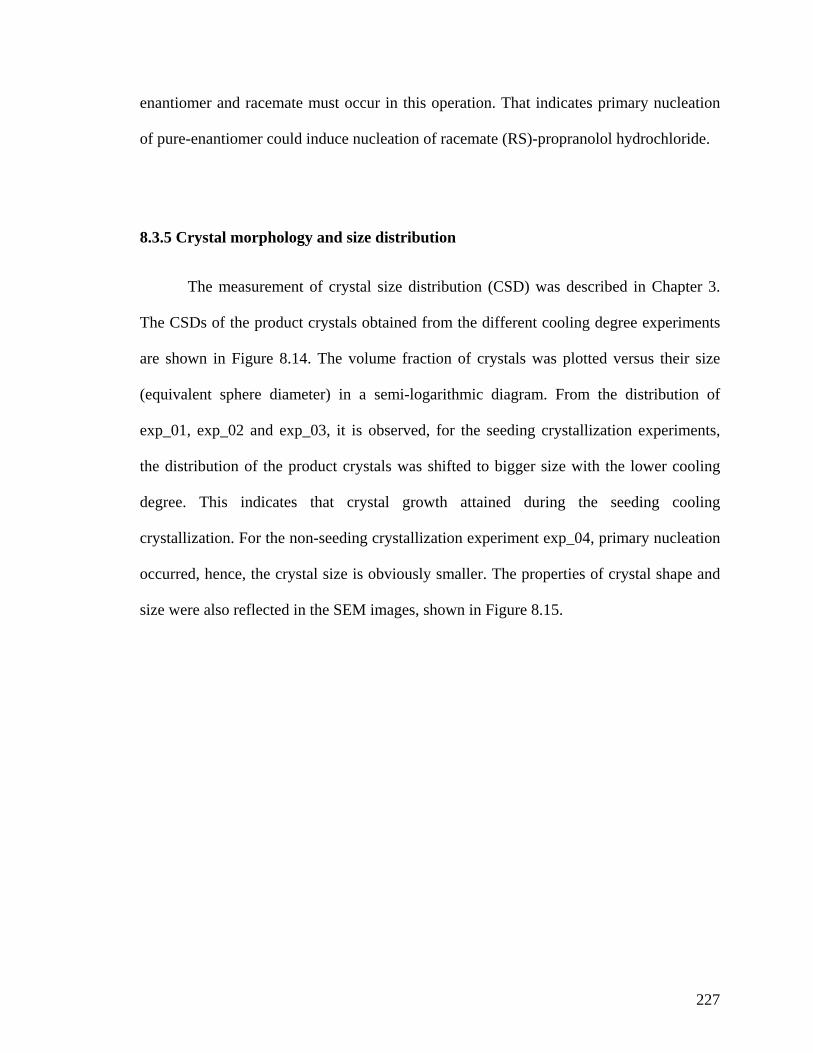
227
enantiomer and racemate must occur in this operation. That indicates primary nucleation
of pure-enantiomer could induce nucleation of racemate (RS)-propranolol hydrochloride.
8.3.5 Crystal morphology and size distribution
The measurement of crystal size distribution (CSD) was described in Chapter 3.
The CSDs of the product crystals obtained from the different cooling degree experiments
are shown in Figure 8.14. The volume fraction of crystals was plotted versus their size
(equivalent sphere diameter) in a semi-logarithmic diagram. From the distribution of
exp_01, exp_02 and exp_03, it is observed, for the seeding crystallization experiments,
the distribution of the product crystals was shifted to bigger size with the lower cooling
degree. This indicates that crystal growth attained during the seeding cooling
crystallization. For the non-seeding crystallization experiment exp_04, primary nucleation
occurred, hence, the crystal size is obviously smaller. The properties of crystal shape and
size were also reflected in the SEM images, shown in Figure 8.15.
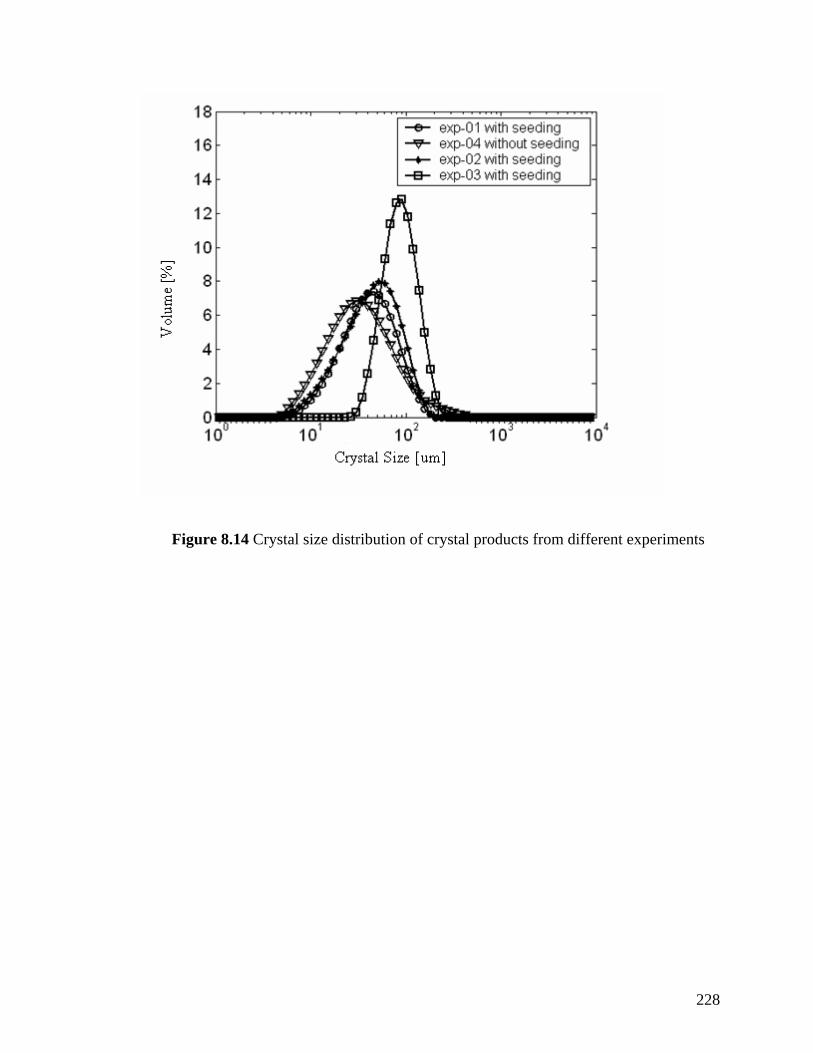
228
Figure 8.14 Crystal size distribution of crystal products from different experiments
229
Figure 8.15 SEM images of crystals produced from different conditions: (a) exp_01_with seeds; (b) exp_02_with seeds; (c) exp_03_with seeds; (d) exp_04_without seeds
(a) (b)
(c) (d)

230
8.4 Summary
This Chapter performed an exploratory investigation to extend the application of
direct crystallization to racemic compound coupling with chromatography. The partially
resolved propranolol hydrochloride with 36.7% ee was obtained from HPLC with semi-
preparative column. Subsequently, the direct crystallization of propranolol hydrochloride
with initial composition 36.7% ee was systematically studied in an automated reactor
system. Based on the solubilities and MSZWs of (R)- and (RS)-propranolol
hydrochloride, the direct crystallization progression was clearly illustrated under seeding
and non-seeding processes. The optical purity of product crystals was accurately
determined using HPLC and DSC methods. It was found that the direct crystallization was
successfully applied to the enrichment of its partially resolved sample and optically pure
crystal product could be obtained within certain safe supersaturation limit. There was no
selectivity of crystal growth or nucleation between the pure enantiomer and its racemate
when the solution reaches the temperature lower than the temperature of the
supersaturated limit of the pure-enantiomer. The relative solubility and critical
supersaturation control of the solution with respect to the pure enantiomer and racemate
were found essential to obtain the pure enantiomer.
231
CHAPTER 9 CONCLUSIONS AND FUTURE
WORK
9.1 Conclusions
The present work systematically studied the application of preferential
crystallization in the optical resolution of chiral pharmaceutical intermediates from the
system engineering perspective. In particular, the preferential crystallization of 4-hydroxy-
2-pyrrolidone in isopropanol, and the direct crystallization of propranolol hydrochloride in
the mixture of methanol and isopropanol (Vol 1:5) were investigated from
characterization, thermodynamics measurement and analysis, metastable zone width
measurement and interpretation, crystal growth and nucleation kinetics estimation and
process optimization and online monitoring. The results provided a systematic engineering
approach to study preferential crystallization. Especially, the importance of critical
supersaturation control and the integration of thermodynamics, crystallization kinetics and
process modeling were proved essential to obtain pure enantiomer crystal products.
In Chapter 4, three types of racemic crystals, namely racemic conglomerates,
racemic compounds and pseudoracemates were identified with thermal analysis and
structural characterizations. 4-hydroxy-2pyrrolidone and N-methylephedrine were
classified as racemic conglomerate forming systems with a eutectic composition of a
racemic mixture (R:S=50%:50%) using binary melting phase diagrams. Thermodynamic
analysis showed positive values of the difference in the enthalpies of fusion (1600 and
5100 J mol-1) of pure-enantiomer and racemic mixture and a typical values (close to ideal
232
Rln2) of entropies of mixing of the enantiomers in the liquid states. On the other hand,
although propranolol hydrochloride showed similar characteristic of melting point phase
diagram to that of a conglomerate forming system, the obviously negative value of the
difference in the enthalpies of fusion of (S)- and (RS)-propranolol hydrochloride indicates
it is a racemic compound favoring system. The close match of the FTIR, Raman spectra
and the PXRD patterns of pure-enantiomer and of its corresponding racemic mixture for
4-hydroxy-2-pyrrolidone and N-methylephedrine and the significant difference of the FT-
IR, Raman spectra, PXRD patterns and NMR spectra for propranolol hydrochloride
confirmed the above claims. Thermal analysis indicates that atenolol is an ideal
pseudoracemate forming system.
In Chapter 5, the thermodynamic properties in solution were investigated using
Lasentec FBRM and PVM for the above-mentioned four systems. Suitable solvents were
firstly chosen and the solubilities, metastable zone widths and ternary phase diagrams at
different enantiomer excess (ee) were subsequently measured. In the aspect of solubility,
4-hydroxy-2-pyrrolidone in isoprapanol and N-methylephedrine in the mixture of
isopropanol and water (Vol 1:3) showed similar characteristics of higher solubility with
lower ee. The racemic compound propranolol hydrochloride in the mixture of methanol
and isopropanol (Vol = 1:5) also showed the similar solubility characteristics. However,
their MSZW properties were found quite different. The metastable zone widths of both
studied conglomerates 4-hydroxy-2-pyrrolidone and N-methylephedrine were independent
of enantiomer excess, which is consistent with the characteristic of two enantiomers
forming separate crystals in solution. On the other hand, for the racemic compound
propranolol hydrochloride, the metastable zone widths of racemate and pure enatiomer
were different. The properties of the evenly distributed molecules in the crystal lattice of a

233
racemic compound were contributed to this difference with nucleation theory. Three
MSZW possibilities were raised for different solubility ratio of racemate to pure
enantiomer for a racemic compound, where a cut value of 2 was highlighted.
Furthermore, for the conglomerate 4-hydroxy-2-pyrrolidone, different orders of primary
nucleation rate at different enantiomeric excess were found, which indicate there may be a
critical supersaturation beyond which the nucleation of opposite isomer could occur. This
appears to be the first detailed experimental investigation of metastable zone widths of
different types of racemates in solution.
In Chapter 6, the dynamic method was used to measure the crystal nucleation and
growth kinetics of (R)-4-hydroxy-2-pyrrolidone and (S)-4-hydroxy-2-pyrrolidone in
isopropanol. S-plane analysis was developed and applied to the crystallization kinetics
parameters estimation and a more suitable transform s was found for the studied system.
The regressed crystal nucleation and growth kinetics for both (R)- and (S)-enatiomers
from each four batch measurements were pretty similar. No size dependent crystal growth
was found and the crystal nucleation rate could be thought as temperature independent
under the studied experimental conditions.
In Chapter 7, the concept of critical supersaturation control was proposed for
preferential crystallization. With combination of the thermodynamics properties and
crystallization kinetics, a detailed mathematical modelling for batch crystallization was
established and the orthogonal collocation method was employed to solve the population
balance equation to predict the cooling profiles for the preferential crystallization of 4-
hydroxy-2-pyrrolidone in isopropanol. A simplified population balance model was found
to be suitable for control the critical supersaturation for this system. A series of forced
cooling and optimal operations of 4-hydroxy-2-pyrrolidone were experimentally studied

234
in the automated LabMax with online monitoring with FBRM and PVM. The in-situ
monitoring shows that relatively high supersaturation of the target enantiomer induced
spontaneous nucleation of the undesired enantiomer, which accordingly resulted in low
optical purity and poor crystal size distribution. The proposed optimal temperature
trajectory to control the critical supersaturation successfully inhibited the induced
nucleation of the undesired enantiomer, and hence produced almost pure crystals with
good habits. Further investigations under various supersaturations indicate that there could
be an optimal supersaturation which would not lose optical purity. The importance and
efficiency of critical supersaturation control was theoretically and experimentally proven.
The integration of thermodynamics, crystallization kinetics and population balance
modelling was proved essential and helpful to establish this control strategy.
In Chapter 8, an exploratory investigation was carried out to extend the
supersaturation control to the direct crystallization of racemic compound propranolol
hydrochloride coupling with chromatography. The direct crystallization started with an
initial composition of 36.7% ee which can be obtained from semi-preparative HPLC. The
progression of direct crystallization with and without seeding was illustrated on the
solubility and MSZW diagram. Optically pure crystal product could be obtained within
certain carefully controlled supersaturation limit using partially chromatography resolved
sample. No selective crystal nucleation and growth was found with respect to the pure
enantiomer and its racemate when the solution passed the pure-enantiomer supersaturation
limit.
9.2 Suggestions for Future Work

235
The current optimal crystallization time might be relatively longer for industrial
application, although it may be still worth have such an optimal operation to obtain the
value-added optically pure pharmaceuticals. As crystallization time is determined by
system thermodynamics and crystallization kinetics, for other systems, the crystallization
time could be as short as 1-2 hours. It would be attractive for industrial application to find
such kind of systems. Furthermore, for the process scale-up, there could be more factors to
investigate to determine the value of critical supersaturation.
The development of process analytical technology (PAT) is very fast recently. This
technique could be implemented with the current model-based critical supersaturation
control from laboratory to large scale on chiral crystallization process.
Although the systematic characterization of different racemic species has been
studied, substantial investigation on the melting mechanism of N-methylephedrine during
DSC measurement is needed.
Although some exploratory work has been done for the characteristic of MSZWs
for three different types of racemic species, in order to further confirm the general
relationship of MSZWs with different racemic species, more detailed experimental
measurements for many other chiral systems are needed.
To obtain the optimal operating strategy for preferential crystallization, further
research can be focused on the seeding programs, e.g. different seed size, seeding
temperature.
Further studies on mechanism of crystal nucleation and growth of pure enantiomer,
racemate and eutectic mixture are necessary for the purification of racemic compound by
direct crystallization.

236
REFERENCES
Abegg, C. F.; J. D. Stevens and M. A. Larson. Crystal Size Distributions in Continuous
Crystallizers When Growth Rate Is Size Dependent. AIChE Journal 14(1), pp. 118-
122. 1968.
Agranat, I. and H. Caner. Intellectual Property and Chirality of Drugs. Drug Discovery
Today, 4, pp.313-321. 1999.
Allen, T. Particle Size Measurement, Volume 1. London: Chapman & Hall. 1997.
Amiard, G. Direct Resolution of Threonine By Entrainment. Bulletin de la Societe
Chimique de France, 447. 1956.
Amiard, G. Resolution by entrainment. The Idea of "Residual" Supersaturation.
Experientia. 15, pp. 38-40. 1959.
Ammon, H. L., D. B. Howe, W. D. Erhardt, A. Balsamo, B. Macchia, F. Macchia and W.
E. Keefe. The Crystal Structures of Dichloroisoproterenol, Propranolol and Propranolol
Hydrochloride. Acta Crystallographica Section B: Structural Science, 33, pp.21-29. 1977.
Angelov, I., J. Raisch, M. P. Elsner and A. Seidel-Morgenstern. Optimization of Initial
Conditions for Preferential Crystallization.

237
Industrial and Engineering Chemistry Research, 45, pp.759-766. 2006.
Anon. FDA's Policy Statement for the Development of New Stereoisomeric Drugs. US
Food and Drug Administration Guidance. Washington, DC. 1992.
Anon. Market Trends in Chiral Separations. Universal Pharma Technologies LLC
Report. North Andover, MA. 1993.
Aubé, J., Y. Wang, S. Ghosh and K. L. Lnghans. Oxaziridine-Mediated Ring Expansions
Of Substituted Cyclobutanones: Synthesis of (-)-γ-Amino-β-Hydroxybutyric Acid
(GABOB). Synthetic Communications, 21, pp.693-701. 1991.
Barrans, P. Y. and M., Cotrait. Conformations Cristallines d’Adrenolytiques β-Bloquants:
Propranolol et Alprenolol. Acta Crystallographica Section B: Structural Science, 29,
pp.1264-1272. 1973.
Barrett, P. and B. Glennon. In-Line FBRM Monitoring of Particle Size in Dilute Agitated
Suspensions. Particle and Particle Systems Characterization, 16, pp.207-211. 1999.
Barrett, P. and B. Glennon. Characterizing the Metastable Zone Width and Solibility
Curve Using Lasentec FBRM and PVM. Chemical Engineering Research and Design, 80,
pp.799–805. 2002.
238
Barrett, P., B. Smith, J. Worlitschek, V. Bracken, B. O. Sullivan and D. O. Grady. A
Review of the Use of Process Analytical Technology for the Understanding and
Optimization of Production Batch Crystallization Processes. Organic Process Research &
Development, 9, pp.348-355. 2005.
Barthe, S. and R. W. Rousseau. Utilization of Focused Beam Reflectance Measurement
in The Control of Crystal Size Distribution in A Batch Cooled Crystallizer. Chemical
Engineering & Technology, 29(2), pp. 206-211. 2006.
Beilles, S., P. Cardinael, E. Ndzié, S. Petit and G. Coquerel. Preferential Crystallisation
and Comparative Crystal Growth Study Between Pure Enantiomer and Racemic Mixture
of A Chiral Molecule: 5-Ethyl-5-Methylhydantoin. Chemical Engineering Science, 56,
pp. 2281-2294. 2001.
Berglund, K. A. and M.A. Larson. Growth of Contact Nuclei of Citric Acid
Monohydrate. AIChE Symposium Series. 78(215), pp. 9-13. 1982.
Berry, D. A. and K. M. Ng. Synthesis of Reactive Crystallization Processes. AIChE
Journal 43(7), pp.1737-1750. 1997.
Berry, D. A. and K. M. Ng. Synthesis of Crystallization-Distillation Hybrid Separation
Processes. AIChE Journal, 43(7), pp.1751-1762. 1997.

239
Bettinetti, G., F. Giordano, G. Fronza, A. Italia, R. Pellegata, M. Villa and P. Ventura.
Sobrerol Enantiomers and Racemates-Solid-State Spectroscopy. Thermal-Behavior, and
Phase Diagrams. Journal of Pharmaceutical Sciences, 79, pp.470-475. 1990.
Black, S. N., L. J. Williams, R. J. Davey, F. Moffatt, R. V. H. Jones, D. M. McEwan and
D. E. Sadler. The Preparation of Enantiomers of Paclobutrazol: A Crystal Chemistry
Approach. Tetrahedron, 45(9), pp.2677-2682. 1989.
Bohlin, M. and A. C. Rasmuson. Application of Controlled Cooling and Seeding in Batch
Crystallization. The Canadian Journal of Chemical Engineering, 70, pp.120-126. 1992.
Botsaris, G. D., R. Y. Qian and A. Barrett. New Insights into Nucleation through Chiral
Crystallization. AIChE Journal, 45, pp.201-203. 1999.
Botting, J. The History of Thalidomide. Drug News & Perspective, 15(9), pp. 604-611.
2002.
Bredikhin, A. A., D. V. Savelev, Z. A. Bredikhina, A. T. Gubaidullin and I. A. Litvinov.
Crystallization of Chiral Compounds. 2. Propranolol: Free Base and Hydrochloride.
Russian Chemical Bulletin, 52, pp.853-861. 2003.
Bredikhin, A. A., Z. A. Bredikhina, A. T. Gubaidullin, D. B. Krivolapov and I. A.
Litvinov. Rational Approach to A Conglomerate-Forming Propranolol Derivative:
240
Pointed Modifications of the Crystal Structure. Mendeleev Communications, 14, pp.268-
270. 2004.
Brock, C. P., W. B. Schweizer and J. D. Dunitz. On the Validity of Wallach’s Rule: On
the Density and Stability of Racemic Crystals Compared with Their Chiral Counterparts.
Journal of the American Chemical Society, 113, pp.9811-9820. 1991.
Brugidou, J., H. Christol and R. Sales. Apparatus for The Resolution of Conglomerates.
Bulletin de la Societe Chimique de France, 9-10, Pt. 2, pp.2033-2034. 1974.
Buser, HR., P. Thomas and M. Markus D. Changed Enantiomer Composition of
Metolachlor in Surface Water Following the Introduction of the Enantiomerically
Enriched Product to the Market. Environmental Science and Technology, 34(13),
pp.2690-2696. 2000
Burger, A., J. M. Rollinger and W. Lindner. Fundamentals and Predictions of Resolution
of Enantiomer Mixtures by Crystallization in the Example of Phase Diagrams of Atenolol
and Atenolol Hydrochloride Salt. Pharmazie, 54, pp.47-51. 1999.
Caldwell, J. and B. E. Leonard. An Introduction to the ‘Enantiomer Debate’. Human
Psychopharmacology Clin Exp, 16, pp.65. 2001.
241
Caldwell, J. Do Single Enantiomers Have Something Special to Offer?. Human
Psychopharmacology Clin Exp, 16, pp.67-71. 2001.
Challener, C.A. (ed). Chiral Intermediates. pp. 3-109, New York: John Wiley & Sons
Limited.2001.
Chianese, A., S. Di Cave and B. Mazzarotta. Investigation on Some Operating Factors
Influencing Batch Cooling Crystallization, Industrial Crystallization: Proceedings of the
Symposium, 84, pp.443-446. 1984. Amsterdam.
Ching, C. B., P. Fu, S. C. Ng and Y. K. Xu. Effect of Mobile Phase Composition on the
Separation of Propranolol Enantiomers Using A Perphenylcarbamate Beta-Cyclodextrin
Bonded Chiral Stationary Phase. Journal of Chromatography A, 898, pp.53-61. 2000.
Choong, K. L. and R. Smith. Optimization of Batch Cooling Crystallization. Chemical
Engineering Science, 59, pp.313–327. 2004.
Chung, S.H., D. L. Ma and R. D. Braatz. Optimal Seeding in Batch Crystallization. The
Canadian Journal of Chemical Engineering, 77, pp.590–596. 1999.
Clontz, N. A., and W. L. McCabe. Contact Nucleation of Magnesium Sulfate
Heptahydrate. Chemical Engineering Progress Symposium, Series 67 (110), pp. 6–17.
1971.

242
Collet, A., M. J. Brienne and J. Jacques. Optical Resolution by Direct Crystallization of
Enantiomer Mixtures. Chemical Reviews, 80, pp.215-230. 1980.
Collet, A. Resolution of Racemates: Did You Say “Classical”? Angewandte Chemie
International Edition, 37, pp.3239-3241. 1998.
Collet, A. Separation and Purification of Enantiomers by Crystallization Methods.
Enantiomer, 4, pp.157 – 172. 1999.
Collins, A. N., G. N. Sheldrake and J. Crosby. (ed). Chirality in Industry II. pp. 119-155,
Chichester: John Wiley and Sons. 1997.
Coquerel, G., R. Bouaziz and M. J. Brienne. Optical Resolution of (+/-)-Fenfluramine
and (+/-)-Nonfenfluramine by Preferential Crystallization, Chemistry Letters, 7, pp.1081-
1084. 1988.
Coquerel, G., R. Bouaziz and M. J. Brienne. Optical Resolution of (±)-N-
Acylnorfenfluramine Derivatives by Preferential Crystallization. Tetrahedron Letters, 31,
pp.2143-2144. 1990.
243
Coquerel, G. and S. Petit. Recognition of Enantiomers through Morphology of Single
Crystals; Application to Some 5-Alkyl-5-Aryl-Hydantoin Derivatives. Journal of Crystal
Growth, 130(1-2), pp. 173-80. 1993.
Coquerel, G., M. N. Petit and R. Bouaziz. Method of Optical Resolution by
Crystallization. PCT Int. Appl. pp. 77. 1995.
Coquerel, G. Review on the Heterogeneous Equilibria Between Condensed Phases in
Binary Systems of Enantiomers. Enantiomer, 5, pp.481-498. 2000.
Coquerel, G. Chirality and Crystallisation. Present and Prospects. Chimica Oggi,
21(3/4), pp. 56-57. 2003.
Costa., C. B. B. and R. Maciel Filho. Evaluation of Optimisation Techniques and Control
Variable Formulations for a Batch Cooling Crystallization Process. Chemical
Engineering Science, 60, pp.5312 – 5322. 2005.
Courvoisier, L., E. Ndzié, M. N. Petit, U. Hedtmann, U. Sprengard and G. Coquerel.
Influence of the Process on the Mechanisms and the Performances of the Preferential
Crystallization: Example with (+/-)-5-(4-Bromophenyl)-5-Methylhydantoin. Chemistry
Letters, 4, pp.364-365. 2001.
244
Courvoisier, L., L. Mignot, M. N. Petit, U. Sprendgard, U. Hedtman and G. Coquerel.
Preferential Crystallization of (F)-5(4V-Bromophenyl)-5-Methylhydantoin. Comparison
between SIPC and AS3PC Processes at 2L and 10L Scales. Proceedings of the 9th
International Workshop on Industrial Crystallization (BIWIC). 2002. Germany.
Courvoisier, L., L. Mignot, M. N. Petit and G. Coquerel. Combined Effect of
Polymorphism and Process on Preferential Crystallization: Example with (±)-5(4′-
Methylphenyl)-5-Methylhydantoin. Organic Process Research and Development, 7, pp.
1007-1016. 2003.
Crosby, J. Synthesis of Optically Active Compounds: A Large Scale Perspective.
Tetrahedron, 47, pp.4789-4846. 1991.
Davey, R. J., S. N. Black, L. J. Williams, D. McEwan and D. E. Sadler. The Chiral Purity
of a Triazolylketone Crystallized from Racemic Solutions. Journal of Crystal Growth,
102, pp.97–102. 1990.
Denk, E. G. and G. D., Botsaris. Mechanism of Contact Nucleation. Journal of Crystal
Growth, 13(1), pp. 57-60. 1972.
Denk, E. G. and G. D. Botsaris. Fundamental Studies in Secondary Nucleation, Journal of
Crystal Growth, 13-14, pp.493–499. 1972.
245
DIN 51004, 1994, Normenausschuß für Materialprüfung (NMP) im DIN, DIN 51004,
Thermische Analyse (TA), Bestimmung der Schmelztemperaturen Kristalliner Stoffe mit
der Differenzialthermoanalyse (DTA) (engl.: Thermal Analysis, Determinition of Melting
Temperatures of Crystalline Materials by Differential Thermal Analysis), Deutsches
Institut für Normung e.V., 1994, (German Standards, 1994).
Di Silvestro, G., G. Palmisano and R. Pellegata. Phase Diagram of (R)- and (S)-4
Hydroxy-2-Pyrrolidone; Mixtures: A New Case of a Conglomerate-Forming System.
Journal of Pharmaceutical Sciences, 82, pp.758-760. 1993.
Doki, N., M. Yokota, S. Sasaki and N. Kubota. Simultaneous Crystallization of D- and L-
Asparagines in the Presence of a Tailor-Made Additive by Natural Cooling Combined
with Pulse Heating. Crystal Growth & Design, 4, pp.1359-1363. 2004.
Dolling, U. H., A. W. Douglas, E. J. J. Grabowski, E. F. Schoenewaldt, P. Sohar, and M.
Sletzinger. Synthesis and Resolution of 3-Fluoro-D,L-Alanine-2-d: A Selective
Deuteration via Reductive Amination With Sodium Borodeuteride. Journal of Organic
Chemistry, 43(9), pp.1634-1640. 1978.
Dowling, B. B. Resolution of Racemic Glutamic Acid. US 2898358. 1959.
Druot, S., M. N. Petit, S. Petit, G. Coquerel and N. B. Chanh . Experimental Data and
Modelling of The Interactions in Solid State and in Solution Between (R)-and (S)-N-
246
Acetyl-Alpha-Methylbenzylamine. Influence on Resolution by Preferential
Crystallization. Molecular Crystals and Liquid Crystals Science and Technology, Section
A-Molecular Crystals and Liquid Crystals, 275: pp.271-291. 1996.
Dufour, F., C. Gervais, M. N. Petit, G. Perez and G. Coquerel. Investigations on the
Reciprocal Ternary System (±)-2-Phenylpropionic Acid-(±)-α-Methylbenzylamine.
Impact of an Unstable Racemic Compound on the Simultaneous Resolution of Chiral
Acids and Bases by Preferential Crystallisation. Journal of the Chemical Society, Perkin
Transactions 2, pp. 2022-2036. 2001.
Dufour, F., G. Perez and G. Coquerel. A Priori Assessment of the Maximum Possible
Entrainment Effect Attainable during Preferential Crystallization. The Case of the
Simultaneous Resolution of (±)-Ephedrine and (±)-Mandelic Acid. Bulletin of the
Chemical Society of Japan, 77, pp.79-86. 2004.
Duschinsky, R. Spontaneous Resolution of A Racemic Compound (Histidine
Monohydrochloride). Chemistry & Industry (London, United Kingdom), 10. 1934.
Dwivedi, S. K., S. Sattari, F. Jamali and A. G. Mitchell. Ibuprofen Racemate and
Enantiomers: Phase Diagram, Solubility and Thermodynamic Studies.
International Journal of Pharmaceutics, 87, pp.95-104. 1992.

247
Elsner, M. P, H. Lorenz and A. Seidel-Morgenstern. Preferential Crystallization for
Enantioseparation - New Experimental Insights Indispensable for a Theoretical Approach
and an Industrial Application. Coquerel, G. (ed). Proceedings of the 10th International
Workshop on Industrial Crystallization (BIWIC), pp. 18 – 25. 2003. Rouen.
Elsner, M. P., D. F. Menendez, E. A. Muslera and A. Seidel-Morgenstern. Experimental
Study and Simplified Mathematical Description of Preferential Crystallization. Chirality,
17, pp. S183-S195. 2005.
Evans, T.W., G. Margolis and A. F. Sarom. Mechanisms of Secondary Nucleation in
Agitated Crystallizers. AIChE Journal. 20, pp. 950–958. 1974
Ewing, G.W. Instrumental Methods of Chemical Analysis. New York: McGraw-Hill.
1985.
Farrell R. J. and Y. C. Tsai. Modeling, Simulation and Kinetic Estimation in Batch
Crystallization Parameter Processes. AIChE J, 40, pp.586-593. 1994.
Fung, K. Y., K. M. Ng and C. Wibowo. Synthesis of Chromatography-Crystallization
Hybrid Separation Processes. Industrial & Engineering Chemistry Research, 44, pp.910-
921. 2005.
248
Furberg, S. and O. Hassel. Phenylglyceric Acids. Acta Chemica Scandinavica, 4 pp.
1020-1023. 1950.
Garside, J., A. Mersmann and J. Nývlt. Measurement of Crystal Growth and Nucleation
Rates. Institution of Chemical Engineers (IChemE). 2002.
Garside, J., L. G. Gibilaro and N. S. Tavare. Evaluation of Crystal Growth Kinetics from
A Desupersaturation Curve Using Initial Derivatives. Chemical Engineering Science, 37,
pp.1625-1628. 1982.
Garside, J. and S. J. Jancic. Growth and Dissolution of Potash Alum Crystals in the
Subsieve Size Range. AIChE J, 22, pp.887-894. 1976.
Gerson, A. R., K. J. Roberts and J. N. Sherwood. An Instrument for the Examination of
Nucleation from Solution and Its Application to the Study of Precipitation from Diesel
Fuels and Solutions of N-Alkanes, Powder Technology, 65, pp.243-249. 1991.
Gervais, C., S. Beilles, P. Cardinael, S. Petit and G. Coquerel. Oscillating Crystallization
in Solution between (+)- and (-)-5-Ethyl-5-Methylhydantoin under the Influence of
Stirring. Journal of Physical Chemistry B, 106, pp.646-652. 2002.
Gervais, C. and G., Coquerel. Simple Model Designed to Generate New Crystal
Structures Derived From a Mother Phase. Acta Cryst. B58, pp. 662-672. 2002.
249
M. W. Girolami and R. W. Rousseau. Initial Breeding in Seeded Batch Crystallizers.
Industrial & Engineering Chemistry Process Design and Development, 25(1), pp.66-70.
1986.
Gritti, F. and G. Guiochon. Effect of the Ionic Strength of Salts on Retention and
Overloading Behavior of Ionizable Compounds in Reversed-Phase Liquid
Chromatography: II. Symmetry-C18. Journal of Chromatography A, 1033, pp.57-69.
2004.
Halfon, A. and S. Kaliaguine. Alumina Trihydrate Crystallization. Canadian Journal of
Chemical Engineering, 54, pp.160-172. 1976.
Harada, K., H. Mizumoto, M. Nomoto and S. Wakita. Optical Resolution of
Monoammonium DL-Malate by Preferential Crystallization. Chemistry and Industry, 20,
pp.68-69. 1986.
Heath, A. R., P. D. Fawell, P. A. Bahri and J. D. Swift. Estimating Average Particle Size
by Focused Beam Reflectance Measurement (FBRM). Particle and Particle Systems
Characterization, 19, pp.84–95. 2002.
250
Herráez-Hernández, R. and P. Campíns-Falcó. Chiral Separation of Ephedrines by Liquid
Chromatography Using β-Cyclodextrines. Analytica Chimica Acta, 434, pp.315-324.
2001.
Hongo,C., M. Shibazaki, S. Yamada and I. Chibata. Preparation of Optically Active
Proline. Optical Resolution of N-Acyl-DL-Proline by Preferential Crystallization
Procedure. Journal of Agricultural and Food Chemistry, 24, pp.903-906. 1976.
Hongo,C., S. Yamada and I. Chibata. The Stability of Supersaturation State in Optical
Resolution by the Preferential Crystallization Procedure. Bulletin of the Chemical
Society of Japan, 54, pp.1905-1910. 1981.
Hongo, Chikara; S., Yamada and I., Chibata. The Prediction of The Optical Resolution
Process By The Use of The Preferential Crystallization Procedure Res. Lab. Appl.
Biochem.. Bulletin of the Chemical Society of Japan , 54(7), pp.1911-13. 1981.
Hongo, C., R. Yoshioka, M. Tohyama, S. Yamada and I. Chibata. Racemization of
Optically Active Amino Acid Salts and an Approach to Asymmetric Transformation of
DL-Amino Acids. Bulletin of the Chemical Society of Japan, 56, pp.3744-3747. 1983.
Houllemare-Druot, S. and G. Coquerel. How Far Can an Unstable Racemic Compound
Affect the Performances of Preferential Crystallization? Example with (R) and (S)-α-
Methylbenzylamine Chloroacetate. Journal of the Chemical Society. Perkin Transactions,
251
2, pp. 2211-2220. 1998.
Hu, Q., S. Rohani, D. X. Wang and A. Jutan. Nonlinear Kinetic Parameter Estimation for
Batch Cooling Seeded Crystallization. AIChE J, 50, pp.1786-1794. 2004.
Huang, P. Q., X. Zheng, S. L. Wang, J. L. Ye, L. R. Jin, and Z. Chen. A New Approach
to (S)-4-Hdroxy-2-Pyrrolidone and Its 3-Substituted Analogues. Tetrahedron:
Asymmetry, 10, pp.3309-3317. 1999.
Hulburt, H. M. and S. Katz. Some Problems in Particle Technology: A Statistical
Mechanical Formulation. Chemical Engineering Science, 19, pp.555-574,1964.
Inoue, T. and S. Suzuki. The Metabolism of (±)-Methylephedrine in Rat and Man.
Xenobiotica, 20, pp.99-106. 1990.
Ishigooka, J., Y. Yoshida and M. Murasaki. Abuse of BORN – A Japanese OTC Cough
Suppressant Solution Containing Methylephedrine, Codeine, Caffeine and
Chlorpheniramine, Progress in Neuro-Psychopharmacology&Biological Psychiatry, 15,
513ff. 1991.
Jacobsen, C., J. Garside and M. Hoare. Nucleation and Growth of Microbial Lipase
Crystals from Clarified Concentrated Fermentation Broths. Biotechnology and
Bioengineering, 57, pp. 666-675, 1998.

252
Jacques, J., A. Collet and S. H. Wilen. Enantiomers, Racemates and Resolution Malabar,
Florida: Krieger Publishing Company. 1994.
Jones, A. G. and J. W. Mullin. Programmed Cooling Crystallization of Potassium
Sulphate Solutions. Chemical Engineering Science, 29, pp.105–118. 1974.
Jones, A. G. Optimal Operation of A Batch Cooling Crystallizer. Chemical Engineering
Science, 29, pp.1075–1087. 1974.
Juza, M., M. Mazzotti and M. Morbidelli. Simulated Moving-Bed Chromatography and
its Application to Chirotechnology. Tibtech, 18, pp.108-118. 2000.
Kawasuji, T., K. Koike and H. Saito. Chronotropic Effects of Optical Isomers of
Ephedrine and Methylephedrine in the Isolated Rat Right Atria and in Vitro Assessment
of Direct and Indirect Actions on β1-Adrenoceptors. Biological & Pharmaceutical
Bulletin, 19, pp.1423-1428. 1996.
Kauffman, G. B. and R. D. Myers. The Resolution of Racemic Acid. A Classic
Stereochemical Experiment for The Undergraduate Laboratory. Journal of Chemical
Education, 52(12), pp. 777-781. 1975.
253
Kim, K. J. and S. K. Ryu. Nucleation of Thiourea Adduct Crystal with
Cyclohexane}Methylcyclopentane. Chemical Engineering Communications, 159(1), pp.
51. 1997.
Kim, K. J. and A. Mersmann. Estimation of Metastable Zone Width in Different
Nucleation Processes. Chemical Engineering Science, 56, pp.2315-2324. 2001.
Kommuru, T. R., M. A. Khan and I. K. Reddy. Racemate and Enantiomers of
Ketoprofen: Phase Diagram, Thermodynamic Studies, Skin Permeability, and Use of
Chiral Permeation Enhancers. Journal of Pharmaceutical Sciences, 87, pp.833-840. 1998.
Kondepudi, D. K., R. J. Kaufman and N. Singh. Chiral Symmetry Breaking in Soldium
Chlorate Crystallization, Science, 250, pp.975-977. 1990.
Kondepudi, D. K., K. L. Bullock, J. A. Digits, J. K. Hall and J. M. Miller. Kinetics of
Chiral Symmetry Breaking in Crystallization. Journal of the American Chemical Society,
115, pp.211-216. 1993.
Kondepudi, D. K., K. L. Bullock, J. A. Digits and P. D. Yarborough. Stirring Rate as a
Critical Parameter in Chiral Symmetry Breaking Crystallization.
Journal of the American Chemical Society. 117, pp.401-404. 1995.
254
Kondepudi D. K. and Culha M. Chiral Interaction and stochastic kinetics in stirred
crystallization of amino acids. Chirality. 10, pp.238–245,1998.
Kougoulos, E., A. G. Jones and M. W. Wood-Kaczmar. Estimation of Crystallization
Kinetics for an Organic Fine Chemical Using a Modified Continuous Cooling Mixed
Suspension Mixed Product Removal (MSMPR) Crystallizer. Journal of Crystal Growth.
273, pp.520–528. 2005.
Kougoulos, E., A. G. Jones, K. H. Jennings and M. W. Wood-Kaczmar. Use of Focused
Beam Reflectance Measurement (FBRM) and Process Video Imaging (PVI) in a
Modified Mixed Suspension Mixed Product Removal (MSMPR) Cooling Crystallizer.
Journal of Crystal Growth, 273, pp.529–534. 2005.
Kunsman, G. W., R. Jones, B. Levine and M. L. Smith. Methylephedrine Concentrations
in Blood and Urine Specimens. Journal of Analytical Toxicology, 22, pp.310-313. 1998.
Leusen, F. J. J., J. H. Noordik and H. R. Karfunkel. Racemate Resolution via
Crystallization of Diastereomeric Salts: Thermodynamic Considerations and Molecular
Mechanics Calculations. Tetrahedron, 49, pp.5377-5396. 1993.
Leusen, F. J. J. Crystal Structure Prediction of Diastereomeric Salts: A Step Toward
Rationalization of Racemate Resolution. Crystal Growth and Design, 3, pp. 189-192.
2003.

255
Levkin, P. A., Y. A. Strelenko, K. A. Lyssenko, V. Schurig and R. G. Kostyanovsky.
Temperature-Dependent Racemic Compound-Conglomerate Crystallization of 2,3:6,7-
Dibenzobicyclo[3.3.1]Nona-2,6-Diene-4,8-Dione. Tetrahedron-Asymmetry, 14, pp.2059-
2066. 2003.
Li, Z. J. and J. W. Grant. Relationship Between Physical Properties and Crystal
Structures of Chiral Drugs. Journal of Pharmaceutical Science, 86, pp.1073-1078. 1997.
Li, Z. J., M. T. Zell, E. J. Munson and J. W. Grant. Characterization of Racemic Species
of Chiral Drugs Using Thermal Analysis, Thermodynamic Calculation, and Structural
Studies. Journal of Pharmaceutical Science, 88, pp.337-346. 1999.
Li, Z. J., W. H. Ojala and D. J. W. Grant. Molecular Modeling Study of Chiral Drug
Crystals: Lattice Energy Calculations. Journal of Pharmaceutical Science, 90, pp.1523-
1539. 2001.
Lim, B.G., C. B. Ching, R. B. H. Tan and S. C. Ng. Recovery of (–)-Praziquantel from
Racemic Mixtures by Continuous Chromatography and Crystallisation. Chemical
Engineering Science, 50, pp.2289-2298. 1995.
Lin, G.Q., Y. M. Li and A. S. C. Chan. Principles and Applications of Asymmetric
Synthesis. New York: John Wiley and Sons. 2001.

256
Lorenz, H., P. Sheehan and A. Seidel-Morgenstern. Coupling of Simulated Moving Bed
Chromatography and Fractional Crystallisation for Efficient Enantioseparation, Journal
of Chromatography A, 908, pp.201-214. 2001.
Lorenz, H., D. Sapoundjiev and A. Seidel-Morgenstern. Study of Solubility Equilibria in
Chiral Systems. Chianese, A. (ed). Proceedings of 15th International Symposium on
Industrial Crystallization. Italy, pp.167-172, 2002.
Lorenz, H. and A. Seidel-Morgenstern. Binary and Ternary Phase Diagrams of Two
Enantiomers in Solvent Systems. Thermochimica Acta, 382, pp.129-142. 2002.
Lorenz H, D. Sapoundjiev and A. Seidel-Morgenstern. Enantiomeric Mandelic Acid
System-Melting Point Phase Diagram and Solubility in Water. Journal of Chemical
Engineering Data, 47, pp.1280-1284. 2002.
Lu, Y. H. and C. B. Ching. Study on the Metastable Zone Width of Ketoprofen. Chirality,
18, pp.239-244. 2006.
Maciel, G. E., N. R. Jagannathan and J. S. Frye. Solid-state NMR: Opportunities and
Challenges. In NMR and X-ray Crystallography: Interfaces and Challenges; Etter, M. C.,
Ed.; Trans. Am. Crystallogr. Assoc. 24, pp. 1-23, 1988.

257
Ma, D. L., D. K. and R. D. Braatz. Optimal Control and Simulation of Multidimensional
Crystallization Processes, Computers and Chemical Engineering, 26, pp.1103–1116.
2002.
Maier, N. M., P. Franco and W. Lindner. Separation of Enantiomers: Needs, Challenges,
Perspectives. Journal of Chromatography A, 906, pp.3-33. 2001.
Matsumoto, T., W. Trueb, R. Gwinner and C. H. Eugster. Isolierung von (-)-R-4-
Hydroxy-2-Pyrrolidon-(2) und Einigen Weiteren Verbindungen aus Amanita Muscaria.
Helvetica Chemica Acta, 52, pp.716-720. 1969.
Matsuoka, M., H. Hasegawa and K. Ohori. Purity Decrease of L-Threonine Crystals in
Optical Resolution by Batch Preferential Crystallization. In Myerson, A. S. and K.
Toyokura. (ed). Crystallization as a Separations Process. pp. 251-260, Washington, DC:
American Chemical Society. 1990.
Matsuoka, M. Purity Drop in Optical Resolution of Racemic Mixtures. In: Botsaris, G. D.
and K. Toyokura. (ed). Separation and Purification by Crystallization. pp. 59-72,
Washington, DC: American Chemical Society. 1997.
Matthews H. B. and J. B. Rawlings. Batch Crystallization of a Photochemical: Modeling,
Control, and Filtration. AIChE J, 44, pp.1119-1127. 1998.

258
Mayrhofer B. and J. Nyvlt. Programmed Cooling of Batch Crystallizers. Chemical
Engineering Process, 24, pp.217-220. 1988.
Meyerhoffer, W. The Breaks in The Solubility Curves. Journal of Physical Chemistry,
8(8), pp.571-575. 1904.
McBride, J. M. and R. L. Carter. Spontaneous Resolution by Stirred Crystallization.
Angewandte Chemie-International Edition, 30, pp.293-295. 1991.
McCague, R. Crystallisation and Industrial Chiral Synthesis. Manufacturing Chemist, 69,
pp.13-15,17. 1998.
McCague, R. Enantiomeric Purity with Conglomerates. Manufacturing Chemist, 69, pp.
22-23. 1998.
Merck Company, MERCK Achievement – First Commercial, Continuous Process to Use
Selective Crystallization Separates Optically Active Isomers, Chemical Engineering, 8,
pp.247-248. 1965.
Mersmann A. Crystallization Technology Handbook. New York: Marcel Dekker. 1995.
Mersmann, A. Supersaturation and Nucleation. Chemical Engineering Research and
Design, 74(1), pp. 812. 1996.

259
Mersmann, A. and K., Bartosch. How to Predict the Metastable Zone Width. Journal of
Crystal Growth, 183, pp.240., 1997.
Miller, S. M. Modelling and Quality Control Strategies for Batch Cooling Crystallizers.
PhD Thesis, University of Texas at Austin, 1993.
Miyazaki, H., H. Morita, T. Shiraiwa and H. Kurokawa. Optical Resolution by
Preferential Crystallization and Replacing Crystallization of DL-Allothreonine. Bulletin
of the Chemical Society of Japan, 67, pp.1899-1903. 1994.
Mullin, J. W. and J. Nyvlt. Programmed Cooling of Batch Crystallizers. Chemical
Engineering Science, 26, pp.369–377. 1971.
Mullin, J. W. and S. J. Jancic. Interpretation of the Metastable Zone Width. Trans
IChemE, 57, pp.188-193. 1979.
Mullin, J. W. Crystallization. Oxford: Butterworth-Heinemann. 2001.
Murakami, K., M. Ohashi, A. Matsunaga, Y. Yamamoto, A. Tomiguchi and H. Nohira.
Optical Resolution by Preferential Crystallization of 2-(3,4-Carbonyldioxyphenyl)-2-
(Phthalimidooxy)Acetic Acid, a Key Intermediate of Cephalosporin Antibiotic M-
14659. Bulletin of the Chemical Society of Japan, 65, pp. 3288-3293. 1992.
260
Murakami, K., M. Ohashi, A. Matsunaga, I. Yamamoto and H. Nohira. Asymmetric
Transformation of a Racemic α-(Phthalimidooxy)Arylacetic Ester by a Combination of
Preferential Crystallization and Simultaneous Racemization. Chirality, 5, pp.41-48. 1993.
Myerson, A. S. and R. Ginde. Crystals, Crystal Growth, and Nucleation. Handbook of
Industrial Crystallization. Oxford: Butterworth-Heinemann. pp. 33-65. 2002.
Nass, K. K. Rational Solvent Selection for Cooling Crystallizations. Industrial and
Engineering Chemistry Research, 33, pp.1580-1584. 1994
Ndzié, E., P. Cardinael, A. R. Schoofs and G. Coquerel. An Efficient Access to the
Enantiomers of α-Methyl-4-Carboxyphenylglycine via a Hydantoin Route Using a
Practical Variant of Preferential Crystallization. AS3PC (Auto Seeded Programmed
Polythermic Preferential Crystallization). Tetrahedron Asymmetry, 8, pp. 2913-2920.
1997.
Ndzié, E., P. Cardinael, M. N. petit and G. Coquerel. Enantiomeric Resolution of (+/-)-5-
Ethyl-5-Methylhydantoin by Means of Preferential Nucleation. Enantiomer, 4, pp.97-
101. 1999.
Neau, S. H., M. K. Shinwari and E. W. Hellmuth. Melting Point Phase Diagrams of Free
Base and Hydrochloride Salts of Bevantolol, Pindolol and Propranolol. International
Journal of Pharmaceuticals, 99, pp.303-310. 1993.

261
Nelson, H. S., G. Bensch, W. W. Pleskow., R. DiSantostefano, S. DeGraw, D. S.
Reasner, T. E. Rollins and P. D. Rubin. Improved Bronchodilation with Levalbuterol
Compared with Racemic Albuterol in Patients with Asthma. Journal of Allergy and
Clinical Immunology, 102(6, Pt. 1), pp.943-952. 1998.
Noyori, R., M. Tokunaga and M. Kitamura. Stereoselective Organic Synthesis via
Dynamic Kinetic Resolution. Bulletin of the Chemical Society of Japan, 68(1), pp.36-
56. 1995.
Nyvlt, J. and V. Vaclavu. Cooling Rate in A Batch Crystallizer. Chemicky Prumysl.
14(2), pp.79-81, 1964.
Nyvlt, J. Kinetics of Nucleation in Solutions. Journal of Crystal Growth, 3,4, pp.377-383.
1968.
Nyvlt, J., R. Rychly, J. Gottfried and J. Wurzelova. Metastable Zone-Width of Some
Aqueous Solutions. Journal of Crystal Growth, 6, pp.151-162. 1970.
Nyvlt, J., F. Moudry and V. Veverka. Mathematical Models of a Cascade of Ideally
Agitated Crystallizers. Collection of Czechoslovak Chemical Communications. 38(7),
pp.1815-1839,1973.
262
Nyvlt, J. Optimal Crystallization Temperature. Chemicky Prumysl. 33(9), pp. 463-6,
1983.
Nyvlt, J., O. Sohnel, M. Matuchova and M. Broul. The Kinetics of Industrial
Crystallization. pp. 47-65, Amsterdam: Elsevier. 1985.
Nyvlt, J. Calculation of the Kinetics of Crystallization Based on a Single Batch
Experiment. Collection of Czechoslovak Chemical Communications, 54, pp.3187. 1989.
O'Dell, F. P. and R.W. Rousseau. Magma Density and Dominant Size for Size Dependent
Crystal Growth. AIChE Journal, 24(4), pp. 738-741.1978.
O'Dell, F. P.; R.W. Rousseau and W.L. McCabe. Selective Nucleation of Mutually
Soluble Substances. Institution of Chemical Engineers Symposium Series,
54(Alternatives Distill.), pp.13-20. 1978.
Omran, A. M. and C. J. King. Kinetics of Ice Crystallization in Sugar Solutions and Fruit
Juices. AIChE. Journal, 20, pp.795-803. 1974.
Ostwald, W. Studies on the Formation and Inversion of Solids. First paper:
Supersaturation and Supercooling. Zeitschrift fuer Physikalische Chemie, Stoechiometrie
und Verwandtschaftslehre, 22 pp.289. 1897.

263
Pallavicini, M., C. Bolchi, R. DiPumpo, L. Fumagalli, B. Moroni, E. Valoti and F.
Demartin. Resolution of 5-Hydroxymethyl-2-Oxazolidinone by Preferential
Crystallization and Investigations on the Nature of the Racemates of Some 2-
Oxazolidinone Derivatives. Tetrahedron-Asymmetry, 15, pp.1659-1665. 2004.
Pasteur, L. Mémoire sur la relation qui peut exister entre la forme cristalline et la
composition chimique, et sur la cause de la polarisation rotatoire. Compt. Rend. Acd
Sci.,26(21), pp. 535-538.1848.
Pena, R., A. Chauvet, J. Masse, J. P. Ribet and J. L. Maurel. Phase Diagram of R(+)-S(-)
Efaroxan Hydrochloride. Journal of Thermal Analysis and Calorimetry, 53, pp. 697-709.
1998.
Perez-Garcia, L. and D. B. Amabilino. Spontaneous Resolution under Supramolecular
Control. Chemical Society Reviews, 31, pp.342-356. 2002.
Perlberg, A., H. Lorenz and A. Seidel-Morgenstern. Determination of Crystallization
Relevant Data for Enantioseparation Purposes. Chianese, A. (ed). Proceedings of 15th
International Symposium on Industrial Crystallization. pp.173-178. 2002.
Perlberg, A., H. Lorenz and A. Seidel-Morgenstern. Determination of Crystallization
Kinetics in Chiral Systems. Coquerel, G. (ed). Proceedings of 10th International
Workshop on Industrial Crystallization (BIWIC). pp.180-187. 2003.

264
Perlberg, A., H. Lorenz and A. Seidel-Morgenstern. Aspects of Crystal Growth in Chiral
Systems on the Example of Mandelic Acid in Water, VDI-Berichte 1901 II, pp. 689-694.
2005.
Perlberg A., H. Lorenz and A. Seidel-Morgenstern. Crystal Growth Kinetics via
Isothermal Seeded Batch Crystallization: Evaluation of Measurement Techniques and
Application to Mandelic Acid in Water. Industrial & Engineering Chemistry Research.
44 (4), pp. 1012-1020, 2005.
Petit, M. N. and G. Coquerel. Resolution of Pasteur Salts by Auto-Seeded Preferential
Crystallization. Mendeleev Communications, 3, pp. 95-96. 2003.
Pons, MN, K. Milferstedt and E. Morgenroth. Modeling of Chord Length Distributions.
Chemical Engineering Science. 61, pp. 3962-3973, 2006.
Prankerd, R. J. and M. Z. Elsabee. Thermal Analysis of Chiral Drug Mixtures: the DSC
Behaviour of Mixtures of Ephedrine HCl and Pseudoephedrine HCl Enantiomers.
Thermochimica Acta, 248, pp.147-160. 1995.
Prigogine and R. Defay. Thermodynamique Chimique conformément aux méthodes de
Gibbs et De Donder (2 Tomes), Liège, Desoer, 1944-1946. Or the translation in English:
Chemical Thermodynamics, translated by D.H. Everett, Langmans 1954, 1962.

265
Profir, V. M. and M. Matsuoka. Processes and Phenomena of Purity Decrease during the
Optical Resolution of DL-Threonine by Preferential Crystallization. Colloids and
Surfaces A: Physicochemical and Engineering Aspects, 164, pp.315-324. 2000.
Profir V. M. and A. C. Rasmuson. Influence of Solvent and the Operating Conditions on
the Crystallization of Racemic Mandelic Acid. Crystal Growth & Design, 4, pp.315-323.
2004.
Qian, R.Y., Z. D. Chen, H. G. Ni, Z. Z. Fan and F. D. Cai. Crystallization Kinetics of
Potassium Chloride from Brine and Scale-up Criterion. AIChE Journal 33, 1690–1697.
1987.
Qian, R.Y., X. S. Fang and Z. K. Wang. Supersaturation and Crystallization Kinetics of
Potassium Chloride. Industrial and Engineering Chemistry Research. 28, pp.844–850,
1989.
Qian, R.Y. and G. D. Botsaris. Laboratory Simulation of Industrial Crystallizer Cycling.
Industrial and Engineering Chemistry Research. 35, pp.1163–1172, 1996.
Qian, R. Y. and G. D. Botsaris. A New Mechanism for Nuclei Formation in Suspension
Crystallizers: the Role of Interparticle Forces. Chemical Engineering Science, 52,
pp.3429–3440. 1997.

266
Qian, R. Y. and G. D. Botsaris. Nuclei Breeding from a Chiral Crystal Seed of NaClO3.
Chemical Engineering Science, 53, pp.1745–1756. 1998.
Qian, R. Y. and G. D. Botsaris. The Effect of Seed Preparation on the Chirality of the
Secondary Nuclei. Chemical Engineering Science, 59, pp.2841–2852. 2004.
Qiu, Y. and A. C. Rasmuson. Crystal Growth Rate Parameters from Isothermal
Desupersaturation Experiments. Chemical Engineering Science, 46, pp.1659-1667. 1991.
Qiu, Y. and A. C. Rasmuson, A. Estimation of Crystallization Kinetics from Batch
Cooling Experiments. AIChE Journal, 40, pp.799-812. 1994.
Randolph, A. D. and M. A. Larson. Transient and Steady State Size Distributions in
Continious Mixed Suspension Crystallizers. AIChE Journal, 8, pp.639-645. 1962.
Randolph, A. D. and M. A. Larson. Theory of Particulate Processes: Analysis and
Techniques of Continuous Crystallization. San Diego California: Academic Press. 1988.
Rawle, A. The Basic Principles of Particle Size Analysis. Malvern Instruments Ltd.
available at: http://www.malvern.co.uk
267
Rawlings, J. B., S. M. Miller and W. R. Witkowskit. Model Identification and Control of
Solution Crystallization Processes: A Review, Industrial and Engineering Chemistry
Research, 32, pp.1275-1296. 1993.
Reinhold, D. F., R. A. Firestone, W. A. Gaines, J. M. Chemerda and M. Sletzinger.
Synthesis of L-α-Methyldopa from Asymmetric Intermediates. The Journal of Organic
Chemistry, 33, pp.1209-1213. 1968.
Rekoske, J. E. Chiral Separations. AIChE Journal, 47, pp.2-5. 2001.
Roberts, R. J. and R. C. Rowe. The Unit Cell Dimensions of (R, S)-Propranolol
Hydrochloride-A Confirmatory Study using Data from Powder X-ray Diffraction.
International Journal of Pharmaceutics, 109, pp.83-87. 1994.
Rodrigo, A. A., H. Lorenz and A. Seidel-Morgenstern. Online Monitoring of Preferential
Crystallization of Enantiomers. Chirality, 16, pp.499-508. 2004.
Rodriguez-Hornedo, N. and D. Murphy. Significance of Controlling Crystallization
Mechanisms and Kinetics in Pharmaceutical Systems. Journal of Pharmaceutical
Sciences, 88, pp.651-660. 1999.
Rohani, S. and J. R. Bourne. A Simplified Approach to the Operation of a Batch
Crystallizer. The Canadian Journal of Chemical Engineering, 68, pp.799–806. 1990.

268
Roozeboom, H.W.B. Löslichkeit und Schmelzpunkt als Kriterien für Racemische
Verbindungen, Pseudoracemische Mischkristalle und Inaktive Konglomerate, Zeitschrift
für Physikalische Chemie, XXVIII, pp.494-517. 1899.
Rosanoff, M. A. On Fischer's Classification of Stereo-Isomers. Journal of the American
Chemical Society, 28(1), pp.114-21.1906.
Rousseau, R. W., W. L. McCabe and C. Y. Tai. Stability of Nuclei Generated by Contact
Nucleation. AIChE Journal. 21(5), pp.1017-19, 1975.
Rousseau, R. W., K. K. Li and W. L. McCabe. The Influence of Seed Crystal Size on
Nucleation Rates. AIChE Symposium Series, 72(153), pp. 48-52. 1976.
Rousseau, R. W. Handbook of Separation Process Technology. New York: John Wiley &
Sons. 1987.
Rouhi, A.M. Chiral Roundup. Chemical & Engineering News, 80, pp.43-50. 2002.
Routhven, D. M. and C. B. Ching. Counter-Current and Simulated Counter-Current
Adsorption Separation Processes. Chemical Engineering Science, 44, pp.1011-1038.
1989.

269
Ruf, A., J. Worlitschek and M. Mazzotti. Modeling and Experimental Analysis of PSD
Measurements through FBRM. Particle and Particle Systems Characterization, 17,
pp.167-179. 2000.
Sato, N., T. Uzuki, K. Toi and T. Akashi. Direct Resolution of DL-lysine-3,5-
Dinitrobenzoate. Agricultural and Biological Chemistry, 33(7), pp. 1107, 1969.
Schröder, I. Über die Abhängigkeit der Löslichkeit eines festen Körpers von seiner
Schmelztemperatur, Zeitschrift für Physikalische Chemie, XI, pp.29-30. 1893.
Schroer, J. W., C. Wibowo and K. M. Ng. Synthesis of Chiral Crystallization Processes.
AIChE Journal, 47, pp.369-387. 2001.
Schroer, J. W. and K. M. Ng. Process Paths of Kinetically Controlled Crystallization:
Enantiomers and Polymorphs. Industrial & Engineering Chemistry Research, 42,
pp.2230-2244. 2003.
Secor, R. M. Resolution of Optical Isomers by Crystallization Procedures. Chemical
Reviews, 63, pp.297-309. 1963.
Shankland, K. and K. S. Knight. Some Observations on the Crystal Structure of (R, S)-
Propranolol Hydrochloride. International Journal of Pharmaceutics, 137, pp.255-259.
1996.

270
Sheldon, R.A. Chirotechnology - Industrial Synthesis of Optically Active Compounds.
New York: Marcel Dekker, Inc. 1993.
Sheldon, R. A. Chirotechnology : Designing Economic Chiral Syntheses. Journal of
Chemical Technology & Biotechnology, 67(1), pp.1-14. 1996.
Shiraiwa, T., S. Sakata, H. Natsuyama, K. Fujishima, H. Miyazaki, S. Kubo, T. Nitta and
H. Kurokawa. Racemization of Optically-Active Aromatic N-Acetylamino Acids and
Asymmetric Transformation of N-Acetyl-2-(4-Hydroxyphenyl)Glycine via Salt
Formation with Optically-Active Alpha-Methylbenzylamine. Bulletin of the Chemical
Society of Japan, 65, pp.965-970. 1992.
Shiraiwa, T., Y. Ohki, Y. Sado, H. Miyazaki and H. Kurokawa. Optical Resolution by
Preferential Crystallization of 4-Methylpiperidinium Hydrogen (RS)-
Phenylsuccinate. Chirality 6, pp.202-206. 1994.
Shiraiwa, T., H. Miyazaki and H. Kurokawa. Successive Optical Resolution by Replacing
Crystallization of DL-Threonine. Chirality, 6, pp.654-657.1994.
Shiraiwa, T., H. Miyazaki, M. Ohkubo, A. Ohta, A. Yoshioka, T. Yamane and H.
Kurokawa. Optical Resolution by Preferential Crystallization of (RS)-2-Amino-3-
Chloropropanoic Acid Hydrochloride. Chirality, 8, pp.197-200.1996.

271
Shiraiwa, T., H. Miyazaki, A. Ohta, Y. Waki, M. Yasuda, T. Morishita and H. Kurokawa.
Optical Resolution by Preferential Crystallization of (RS)-α-Amino-γ-Butyrolactone
Hydrochloride. Chemical and Pharmaceutical Bulletin, 44, pp.2322-2325. 1996.
Shiraiwa, T., H. Miyazaki, T. Watanabe and H. Kurokawa. Optical Resolution by
Preferential Crystallization of DL-Methionine Hydrochloride. Chirality, 9, pp.48-51.
1997.
Shiraiwa, T., H. Miyazaki, A. Ohta, K. Motonaka, E. Kobayashi, M. Kubo and H.
Kurokawa. Optical Resolution by Preferential Crystallization of (2RS,3SR)-2-Amino-3-
Chlorobutanoic Acid Hydrochloride. Chirality, 9, pp.656-660. 1997.
Shiraiwa, T., M. Ohkubo, H. Miyazaki and M. Kubo. Optical Resolution by Preferential
Crystallization of (RS)-Bromosuccinic Acid. Bulletin of the Chemical Society of Japan
71, pp. 735-739. 1998.
Shirawai, T., K. Tadokoro, H. Tanaka, K. Nanba, N. Yokono, K. Shibazaki and M. Kubo.
Synthesis of Optically Active 1,4-Thiazane-3-Carboxylic Acid via Optical Resolution by
Preferential Crystallization of (RS)-2-Amino-3-[(2-Chloroethyl)Sulfanyl]Propanoic Acid
Hydrochloride. Bioscience Biotechnology and Biochemistry, 62, pp.2382-2387. 1998.

272
Shiraiwa, T., M. Ohkubo, M. Kubo, H. Miyazaki, M. Takehata, H. Izawa, K. Nakagawa
and H. Kurokawa. Optical Resolution of (RS)-Mercaptosuccinic Acid and Syntheses of
Four Stereoisomers of 2-Amino-3-[(1,2-Dicarboxyethyl)Sulfanyl]propanoic Acid.
Chemical and Pharmaceutical Bulletin, 46, pp.1364-1369. 1998.
Shiraiwa, T., M. Kubo, M. Watanabe, H. Nakatani, M. Ohkubo and H. Kurokawa.
Optical Resolution by Preferential Crystallization of (RS)-2-Amino-3-(2-
Carboxyethylthio)Propanoic Acid. Bioscience Biotechnology and Biochemistry, 62,
pp.818-820. 1998
Shiraiwa, T., M. Suzuki, Y. Sakai, H. Nagasawa, K. Takatani, D. Noshi and K.
Yamanashi. Optical Resolution by Preferential Crystallization of (RS)-2-Benzoylamino-
2-Benzyl-3-Hydroxypropanoic Acid and Its Use in Synthesizing Optically Active 2-
Amino-2-Methyl-3-Phenylpropanoic Acid. Chemical and Pharmaceutical Bulletin, 50,
pp.1362-1366. 2002.
Shiraiwa, T., K. Fukuda and M. Kubo. Preparation of Optically Active Allothreonine via
Optical Resolution by Replacing Crystallization. Chemical and Pharmaceutical Bulletin,
50, pp.287-291. 2002.
Shiraiwa, T., R. Saijoh, M. Suzuki, K. Yoshida, S. Nishimura and H. Nagasawa.
Preparation of Optically Active Threo-2-Amino-3-Hydroxy-3-Phenylpropanoic Acid
(Threo-β-Phenylserine) via Optical Resolution. Chemical and Pharmaceutical Bulletin,

273
51, pp. 1363-1367. 2003.
Shiraiwa, T. and R. Kiyoe. Optical Resolution by Preferential Crystallization of
(1RS,3RS)-1,2,3,4-Tetrahydro-6,7-Dihydroxy-1-Methyl-3-Isoquinolinecarboxylic Acid.
Chemical and Pharmaceutical Bulletin, 53, pp.1197-1199. 2005.
Sohnel, O. and J. Nyvlt. Evaluation of Experimental Data on Width of Metastable Region
in Aqueous Solutions. Collection of Czechoslavak Chemical Communications, 40, pp.
511. 1975.
Soichiro, A. Various Procedures for Preferential Crystallization of Ionizable Racemic
Mixtures. Resolution of (±) 3, 4-Dihydroxy-Beta-Phenylalanine. Industrial &
Engineering Chemistry Process Design and Development, 22, pp.429-432. 1983.
Sparks, R. G. and C. L. Dobbs. The Use of Laser Backscatter Instrumentation for the On-
Line Measurement of Particle Size Distribution for Emulsions. Particle and Particle
Systems Characterization, 10, pp.279-289. 1993.
Stinson, S.C. Chiral Pharmaceuticals. Chemical & Engineering News, 79, pp.79-97.
2001.
Tadayyon, A. and S. Rohani. Determination of Particle Size Distribution by Partec 100:
Modeling and Experimental Results. Particle and Particle Systems Characterization, 15,

274
pp.127-135. 1998.
Tadayon, A., S. Rohani and M. K. Bennett. Estimation of Nucleation and Growth
Kinetics of Ammonium Sulfate from Transients of a Cooling Batch Seeded Crystallizer.
Industrial & Engineering Chemistry Research, 41(24), pp.6181-6193. 2002.
Tamura, R., D. Fujimoto, Z. Lepp, K. Misaki, H. Miura, H. Takahashi, T. Ushio and K.
Hirotsu. Mechanism of Preferential Enrichment, an Unusual Enantiomeric Resolution
Phenomenon Caused by Polymorphic Transition During Crystallization of Mixed
Crystals Composed of Two Enantiomers. Journal of the American Chemical Society,
124, pp. 13139-13153. 2002.
Tavare, N. S. and J. Garside. Simultaneous Estimation of Crystal Nucleation and Growth
Kinetics from Batch Experiments. Chemical Engineering Research Design, 64, pp.109-
118. 1986.
Tavare, N. S. Industrial Crystallization: Process Simulation, Analysis and Design. New
York: Plenum. 1995.
Teja, A. S. and R. W. Rousseau. Thermodynamics of Crystallization. Chemical
Thermodynamics for Industry, pp. 230-242. Publisher: Royal Society of Chemistry,
Cambridge, 2004.
275
Ting, H. H. and W. L. McCabe. Supersaturation and Crystal Formation in Seeded
Solutions. Journal of Industrial and Engineering Chemistry (Washington, D. C.), 11
pp.1201-1207. 1934.
van Annum, P. Single Enantiomer Drugs Keep Pace. Chemical Market Reporter, Jan. 18.
1999.
Velluz, L., G. Amiard and R. Joly. Resolution of DL-threo-1-p-nitrophenyl-2-
aminopropane-1,3-diol. Bulletin de la Societe Chimique de France, pp. 342-344. 1953.
Velluz, L and G., Amiard. Direct Resolution of DL-threonine. Bulletin de la Societe
Chimique de France, pp. 903-904. 1953.
Villadsen, J. and M. L. Michelsen. Solution of Differential Equation Models by
Polynomial Approximation, Prentice-Hall, Englewood Cliffs, NJ, 1978.
Wang, X. and C. B. Ching. Chiral Separation of ß-Blocker Drug (Nadolol) by Five-Zone
Simulated Moving Bed Chromatography. Chemical Engineering Science, 60, pp.1337-
1347. 2005.
Wang, X., X. J. Wang and C. B. Ching. Solubility, Metastable Zone Width, and Racemic
Characterization of Propranolol Hydrochloride. Chirality, 14, pp.318-324. 2002.
276
Wang X. J., J. Lu and C. B. Ching. Aspects of Enantioselective Crystallization for Chiral
Drugs and Intermediates. Chianese, A. (ed). Proceedings of 15th International Symposium
on Industrial Crystallization. pp.1059-1064. 2002.
Wang, X. J., H. Wiehler and C. B. Ching. Physicochemical Properties and the
Crystallization Thermodynamics of the Pure Enantiomer and the Racemate for N-
Methylephedrine. Journal of Chemical and Engineering Data, 48, pp.1092-1098. 2003.
Wang, X. J., H. Wiehler and C. B. Ching. Study of the Characterization and
Crystallization of 4-Hydroxy-2-Pyrrolidone. Chirality, 16, pp.220-227. 2004.
Wang, X. J. and C. B. Ching. A Systematic Approach for Preferential Crystallization of
4-Hydroxy-2-Pyrrolidone: Thermodynamics, Kinetics, Optimal Operation and In-Situ
Monitoring Aspects. Chemical Engineering Science, 61, pp.2406-2417. 2006.
Watanabe, T. and G. Noyori. Optical Resolution of Racemic Glutamic Acid. VII.
Reasonable Selection of Resolution Procedures for Optical Resolution by Fractional
Crystallization. Kogyo Kagaku Zasshi, 72(5), pp. 1083-6. 1969.
Way, J. S. Analysis of Batch Crystallization Process, Chemical Engineering
Communication, 35, pp.231-252. 1985.
Weissbuch, I., M. Lahav and L. Leiserowitz. Toward Stereochentical Control,

277
Monitoring, and Understanding of Crystal Nucleation. Crystal Growth & Design, 3,
pp.125-150. 2003.
Werner, A. The Asymmetric Cobalt Atom. XI. Oxalodiethylenediaminocobalti Salts and
a New Method for Splitting Racemic Inorganic Compounds. Ber. 47 pp.2171-2182.
1914.
Wermester, N., E. Aubin, S. Coste and G. Coquerel, Preferential Crystallization of the
Ethanolamine Salt of (±) Mandelic Acid: The Unusual Case of Conglomerate with Partial
Solid Solutions. VDI-Berichte 1901 I, Dresden, pp. 223-228. 2005.
Wibowo, C. and K. M. Ng. Unified Approach for Synthesizing Crystallization-Based
Separation Processes. AIChE Journal, 46, pp.1400-1421. 2000.
Wibowo, C. and L. O'Young. Chromatographic Resolution Coupled with Crystallization
Can Be Your Best Option for Manufacturing Chirally Pure Products. Chemical
Engineering Progress, 101(11), pp. 22-27. 2005.
Wilen, S. H., A. Collet and J. Jacques. Strategies in Optical Resolutions. Tetrahedron, 33,
pp.2725-2736. 1977.
278
Witkowski, W. R., S. M. Miller and J. B. Rawlings. Light-Scattering Measurements to
Estimate Kinetic Parameters of Crystallization. ACS Symposium Series, 438, pp.102-
114. 1990.
Worlitschek, J. and M. Mazzotti. Choice of the Focal Point Position using Lasentec
FBRM. Particle and Particle Systems Characterization, 20, pp.12-17. 2003.
Worlitschek, J., T. Hocker and M. Mazzotti. Restoration of PSD from Chord Length
Distribution Data Using the Method of Projections onto Convex Sets. Particle & Particle
Systems Characterization. 22, pp. 81-98, 2005.
Yamada, S., M. Yamamoto and I. Chibata. Optical Resolution of DL-amino Acids by
Preferential Crystallization Procedure. Journal of Organic Chemistry, 38(26), pp.4408.
1973.
Yamada, S., M. Yamamoto and I. Chibata. Optical Resolution of N Acyl DL Amino
Acids by Preferential Crystallization Procedure. Preparation of L DOPA and L α Methyl
DOPA. Journal of Organic Chemistry, 40, pp.3360-3362. 1975.
Yokota, M. and K. Toyokura. Heterogeneous Nucleation of D-SCMC on the Surface of
L-SCMC Crystal. AIChE Annual Meeting, Florida. 1992.

279
Yokota, M., A. Sato and N. Kubota. A Simple Method for Evaluating Kinetic Parameters
in Non-Isothermal Batch Crystallization. Chemical Engineering Science, 55, pp.717-722.
2000.
Young, S. W. and W. J. Van Sicklen. “The Mechanical Stimulus to Crystallisation”.
Journal of American Chemical Society, 35, pp. 1067-1078, 1913.
Zaugg, H. E. A Mechanical Resolution of DL-Methadone Base. Journal of the American
Chemical Society, 77, pp.2910. 1955.
Zhang, G. P. and S. Rohani. On-line Optimal Control of a Seeded Batch Cooling
Crystallizer. Chemical Engineering Science, 58, pp.1887–1896. 2003.
Zumstein, R. C. and R.W. Rousseau. Growth Rate Dispersion in Batch Crystallization
with Transient Conditions. AIChE Journal, 33(11), pp.1921-1925, 1987.
Zumstein, R. C. and R. W. Rousseau. Growth Rate Dispersion by Initial Growth Rate
Distributions and Growth Rate Fluctuations. AIChE Journal, 33(1), pp.121-129. 1987.
Zumstein, R. C. and R. W. Rousseau. Experimental and Theoretical Analyses of Growth
Rate Dispersion Technology. Proceedings, 6(Ind. Cryst. 87), pp.211-214. 1989.

280
LIST OF PUBLICATIONS
Wang, X., X. J. Wang and C. B. Ching. Solubility, Metastable Zone Width, and Racemic
Characterization of Propranolol Hydrochloride. Chirality, 14, pp.318-324. 2002.
Wang X. J., J. Lu and C. B. Ching. Aspects of Enantioselective Crystallization for Chiral
Drugs and Intermediates. Chianese, A. (ed). Proceedings of 15th International Symposium
on Industrial Crystallization. pp.1059-1064. 2002.
Wang, X. J., H. Wiehler and C. B. Ching. Physicochemical Properties and the
Crystallization Thermodynamics of the Pure Enantiomer and the Racemate for N-
Methylephedrine. Journal of Chemical and Engineering Data, 48, pp.1092-1098. 2003.
Wang, X. J., H. Wiehler and C. B. Ching. Study of the Characterization and
Crystallization of 4-Hydroxy-2-Pyrrolidone. Chirality, 16, pp.220-227. 2004.
Wang, X. J. and C. B. Ching. Determination of Thermodynamic Data and Kinetics for
Chiral Crystallization. Proceedings of 16th International Symposium on Industrial
Crystallization. pp.47-53. 2005.
Wang, X. J. and C. B. Ching. A Systematic Approach for Preferential Crystallization of
4-Hydroxy-2-Pyrrolidone: Thermodynamics, Kinetics, Optimal Operation and In-Situ
Monitoring Aspects. Chemical Engineering Science, 61, pp.2406-2417. 2006.

281
Wang, X. J. and C. B. Ching. Implications of MSZW and Nucleation Mechanism for
Different Chiral Racemic Species. In preparation.
Wang, X. J. and C. B. Ching. Application of Direct Crystallization for Racemic
Compound: Propranolol Hydrochloride. Journal of Pharmaceutical Sciences. In
press,2007.