a systematic approach to quality function deployment · pdf filea systematic approach to...
TRANSCRIPT
Available online at www.sciencedirect.com
Omega 33 (2005) 119–139www.elsevier.com/locate/dsw
A systematic approach to quality function deployment with afull illustrative example
Lai-Kow Chan∗, Ming-Lu WuDepartment of Management Sciences, City University of Hong Kong, 83 Tat Chee Avenue, Kowloon, Hong Kong
Received 22 June 2001; accepted 23 March 2004
Abstract
This paper presents a systematic and operational approach to quality function deployment (QFD), a customer-drivenquality management system for product development. After a comprehensive description of the relevant elements in houseof quality (HOQ), the 4rst and most in5uential phase of the QFD system, a 9-step model is proposed to help build suchan HOQ. A number of 9-point scales are developed whose uses could help unify the various measurements in HOQ toavoid arbitrariness. Special attention is paid to the various subjective assessments in the HOQ process, and symmetricaltriangular fuzzy numbers (STFNs) are suggested for use to capture the vagueness in people’s linguistic assessments. Insteadof using the quite subjective sales-point concept, entropy method is introduced to conduct competitive analysis and derivecompetitive priority ratings. A thorough explanation is given to address the concepts, computations and implementationsin the proposed HOQ model, followed by a full example for a fried Chinese vegetable to illustrate step by step all therelevant details with the purpose of facilitating the understanding and application of the QFD process. Two di=cult partsomitted from our model, especially the correlation matrices, are discussed in some detail 4nally, and possible approachesare also suggested to deal with them in a potentially more complete HOQ model.? 2004 Elsevier Ltd. All rights reserved.
Keywords: Quality function deployment; House of quality; Measurement scale; Symmetrical triangular fuzzy number; Entropy
1. Introduction
Quality function deployment (QFD) is “a system to assure that customer needs drive the product design and productionprocess” (Ref. [1]). Typically, a QFD system can be broken down into four inter-linked phases to fully deploy the customerneeds phase by phase (Refs. [1–5]). In QFD, each phase’s important outputs (HOWs), generated from the phase’s inputs(WHATs), are converted into the next phase as its inputs (new WHATs). So each phase can be described by a matrixof “WHATs” and “HOWs”, which is easy and convenient to deal with in practice. The four QFD phases include: PhaseI to translate customer needs into product design attributes which we will call technical measures; Phase II to translateimportant technical measures into parts characteristics; Phase III to translate important parts characteristics into processoperations; and Phase IV to translate key process operations into day to day production requirements.
The 4rst phase of QFD, usually called house of quality (HOQ), is of fundamental and strategic importance in the QFDsystem, since it is in this phase that the customer needs for the product are identi4ed and then, incorporating the producingcompany’s competitive priorities, converted into appropriate technical measures to ful4ll the needs. In other words, HOQ
∗ Corresponding author. Tel.: +852-2788-8550; fax: +852-2788-9891.E-mail address: [email protected] (L.-K. Chan).
0305-0483/$ - see front matter ? 2004 Elsevier Ltd. All rights reserved.doi:10.1016/j.omega.2004.03.010

120 L.-K. Chan, M.-L. Wu /Omega 33 (2005) 119–139
links the “voice of the customer” to the “voice of the technician” through which process and production plans can bedeveloped in the other phases of the QFD system. The structures and analyzing methods of the other three QFD phasesare essentially the same as the 4rst one, so we will study the HOQ phase only. In fact, most QFD studies focus mainlyon its 4rst phase (for exceptions, see Refs. [1,3,5]).
A house of quality (HOQ) involves the collection and analysis of the “voice of the customer” which includes thecustomer needs for a product, customers’ perceptions on the relative importance of these needs and the relative performanceof the producing company and its main competitors on the needs. It also requires the generation and analysis of the “voiceof the technician” which includes the technical measures converted from the customer needs, technicians’ evaluations onthe relationship between each customer need and each technical measure, and the performance of the relevant companiesin terms of these technical measures. With such a large amount of information to be collected and processed, buildingan HOQ may be too complex to be complete and comparable. Systematization of the HOQ process is thus a necessity.Many studies have been done (Refs. [1–9]) and a number of QFD information systems have also been proposed (e.g.,Refs. [10,11]) towards this purpose. However, most of these works are incomplete in the sense that either they do notcontain all the important elements of HOQ or their quanti4cations are not very satisfactory.
On the other hand, most information involved in the HOQ process is generated from human beings’ perceptions andlinguistic assessments that are quite subjective and vague. Both the “voice of the customer” and the “voice of thetechnician” contain ambiguity and multiplicity of meaning. “Customer need #1 is very important”, “technical measure#2 has weak relationship with customer need #3” and “company #4 performs well on customer need #5” are examplesof these “voices” which are imprecise in terms of breadth of meaning. EOorts should therefore be made to deal withthe vagueness in these “voices” involved in the HOQ process. Among a few studies in this aspect, Khoo and Ho [12]provide a fuzzy QFD framework to perform QFD analysis using symmetrical triangular fuzzy numbers (STFNs). However,they exclude competitive analysis from their framework. Chan et al. [13] also use STFNs to analyze the “voice of thecustomer”, but their study does not involve the “voice of the technician”.
This paper presents a systematic and operational approach to the QFD process. After a detailed description and analysisof the HOQ elements, we provide a 9-step process to build an HOQ. Then, we suggest some feasible methods on howto collect and analyze the information from both the customers and the technicians. We especially address the various“voices” in HOQ using symmetrical triangular fuzzy numbers (STFNs) and some of the proposed HOW steps are fuzzi4edto produce fuzzy results, which are generally more representative than traditional crisp approaches of using simple numbers.We also suggest the use of entropy method to perform competitive analyses and obtain competitive priority ratings for bothcustomer needs and technical measures. A fried Chinese vegetable example is given to fully illustrate our approach. Twodi=cult parts omitted from our model—the probability factors for achieving the goals set for the HOWs and especiallythe correlation matrices among the WHATs and HOWs—are discussed in some detail 4nally, and possible approachesare also suggested to deal with them in a potentially more complete HOQ model.
2. The HOQ process
2.1. The HOQ elements
According to many works (Refs. [1–9,14]), a typical HOQ contains some of the following elements or concepts:1. Customers: At 4rst the customers of a product or service concerned should be identi4ed by the producing company.2. Customer needs (WHATs): These are the requirements of customers for the product expressed in customers’
languages.3. Structuring customer needs: If there are many customer needs, grouping them into meaningful hierarchies or cate-
gories is necessary for easy understanding and analysis.4. Correlation matrix of customer needs: This matrix contains the correlation between each pair of customer needs
(WHATs) through empirical comparisons. The information is provided by customers and usually is di=cult to obtainsince a lot of pairwise comparisons are needed. The purpose of completing this correlation matrix is for the company toidentify where trade-oO decisions and further research may be required. Correlation is usually described by the following5-point scale (Refs. [2,5,7,9]):
(1)

L.-K. Chan, M.-L. Wu /Omega 33 (2005) 119–139 121
5. Relative importance ratings of customer needs: These are the relative importance of customer needs perceived bythe customers, usually expressed and measured through a 5-point scale such as:
(2)
Sometimes the following scale emphasizing more on the right-hand side is used to measure relative importance (Ref. [9]),which was preferred by the Japanese:
(3)
Other scales such as a 9-point scale from 1 to 9 or 100-point scale from 1 to 100 may also be used. For comparison ofsome scales to measure relative importance, see Ref. [8].
6. Competitors: For the product concerned, the producing company should identify the main competitors in the relevantmarkets.
7. Customer competitive assessment: This is to let the customers assess the relative performance of the producingcompany’s product and its main competitors’ similar products on the customer needs identi4ed, usually expressed andmeasured by the following 5-point scale:
(4)
8. Goals for customer needs: The producing company can set performance goals on each WHAT to work on in orderto better satisfy customer needs. The scale for measuring these goals is the same as (4).
9. Sales-point: A sales-point is a kind of possibility which will give your company a unique business position (Refs.[1,2,6,7]). A “strong” sales point is reserved for important WHATs where each comparing company is rated poorly.A “moderate” sales point means the importance rating or competitive opportunity is not so great. And a “no” salespoint means no business opportunity. Numerically, 1.5, 1.25 and 1 are assigned to strong, moderate and no sales pointrespectively (Refs. [1,7]).
10. Final importance ratings of customer needs: For each WHAT its 4nal importance rating (or row total, planningweight) is calculated by the following formula (Refs. [1,7]):
Final importance rating = relative importance × improvement ratio × sales point; (5)
where improvement ratio equals to goal performance level divided by current performance level.11. Technical measures (HOWs): These are design speci7cations, substitute quality characteristics, engineering
attributes or methods, which can relate to and measure customer needs.12. Correlation matrix of the HOWs: This matrix is to help the producing company establish which HOWs are corre-
lated and determine the extent of these correlations, which can be obtained through engineering analysis and experience.The scale for measuring correlations among the HOWs is the same as (1).13. Relationship matrix of WHATs vs. HOWs: This matrix is a systematic means for identifying the level of relation-
ship between each WHAT and each HOW. Usually these relationships are measured by the following scale that, similarto (3), puts more weights on strong relationship (Refs. [2,5,7,9]):
(6)
14. Improving directions of the HOWs: It is helpful to identify in which direction each HOW should be improvedto better satisfy customer needs. Basically there are three types of improving directions: maximizing (or increasing),minimizing (or decreasing), and meeting targets (or guidelines, standards).
15. Technical competitive assessment: This is to technically evaluate the performance of the company’s product andits main competitors’ similar products on each HOW.
16. Goals for the HOWs: The producing company can set performance goals on each HOW to be more technicallycompetitive.
122 L.-K. Chan, M.-L. Wu /Omega 33 (2005) 119–139
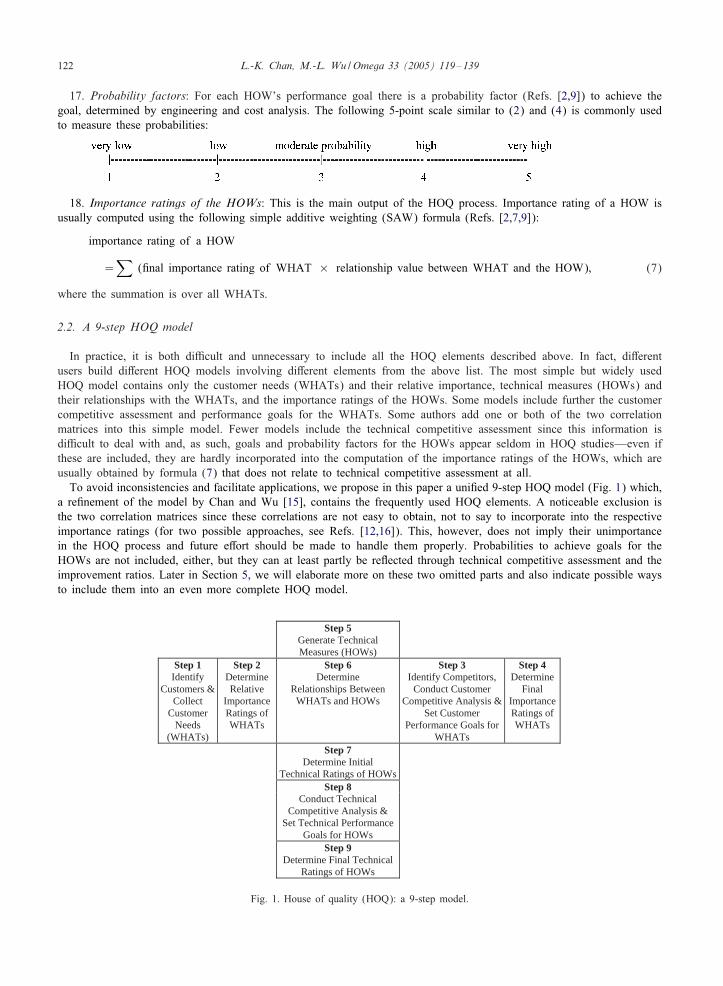
17. Probability factors: For each HOW’s performance goal there is a probability factor (Refs. [2,9]) to achieve thegoal, determined by engineering and cost analysis. The following 5-point scale similar to (2) and (4) is commonly usedto measure these probabilities:
18. Importance ratings of the HOWs: This is the main output of the HOQ process. Importance rating of a HOW isusually computed using the following simple additive weighting (SAW) formula (Refs. [2,7,9]):
importance rating of a HOW
=∑
(4nal importance rating of WHAT × relationship value between WHAT and the HOW); (7)
where the summation is over all WHATs.
2.2. A 9-step HOQ model
In practice, it is both di=cult and unnecessary to include all the HOQ elements described above. In fact, diOerentusers build diOerent HOQ models involving diOerent elements from the above list. The most simple but widely usedHOQ model contains only the customer needs (WHATs) and their relative importance, technical measures (HOWs) andtheir relationships with the WHATs, and the importance ratings of the HOWs. Some models include further the customercompetitive assessment and performance goals for the WHATs. Some authors add one or both of the two correlationmatrices into this simple model. Fewer models include the technical competitive assessment since this information isdi=cult to deal with and, as such, goals and probability factors for the HOWs appear seldom in HOQ studies—even ifthese are included, they are hardly incorporated into the computation of the importance ratings of the HOWs, which areusually obtained by formula (7) that does not relate to technical competitive assessment at all.
To avoid inconsistencies and facilitate applications, we propose in this paper a uni4ed 9-step HOQ model (Fig. 1) which,a re4nement of the model by Chan and Wu [15], contains the frequently used HOQ elements. A noticeable exclusion isthe two correlation matrices since these correlations are not easy to obtain, not to say to incorporate into the respectiveimportance ratings (for two possible approaches, see Refs. [12,16]). This, however, does not imply their unimportancein the HOQ process and future eOort should be made to handle them properly. Probabilities to achieve goals for theHOWs are not included, either, but they can at least partly be re5ected through technical competitive assessment and theimprovement ratios. Later in Section 5, we will elaborate more on these two omitted parts and also indicate possible waysto include them into an even more complete HOQ model.
Step 5Generate TechnicalMeasures (HOWs)
Step 1Identify
Customers & Collect
CustomerNeeds
(WHATs)
Step 2DetermineRelative
ImportanceRatings of WHATs
Step 6Determine
Relationships Between WHATs and HOWs
Step 3Identify Competitors,
Conduct Customer Competitive Analysis &
Set CustomerPerformance Goals for
WHATs
Step 4Determine
Final ImportanceRatings of WHATs
Step 7Determine Initial
Technical Ratings of HOWsStep 8
Conduct TechnicalCompetitive Analysis &
Set Technical PerformanceGoals for HOWs
Step 9Determine Final Technical
Ratings of HOWs
Fig. 1. House of quality (HOQ): a 9-step model.

L.-K. Chan, M.-L. Wu /Omega 33 (2005) 119–139 123
2.3. Scales and fuzziness
As summarized in Section 2.1, there are many scales used in the HOQ process to measure diOerent concepts. Forexample, it is common to use scale (1) to measure the correlation between each pair of WHATs or HOWs, scale (6) tomeasure the relationship between each WHAT and each HOW, scale (2) to measure the relative importance of WHATs,and scale (4) to measure the companies’ current and goal performance in terms of WHATs. But there is not a rule asto which element must or should be measured by a designated scale and, in fact, diOerent users may use diOerent scalesto measure the same concept. For example, while many authors adopt scale (2) to measure the importance of WHATs,some people prefer to use scale (3) for the same purpose.
On the other hand, it is well recognized that people’s assessments of concepts are always subjective and thus imprecise,and the linguistic terms people use to express their judgements are vague in nature. Using objective, de4nite and precisenumbers to represent linguistic assessments are, although widely adopted, not very reasonable. A more rational approachis to assign fuzzy numbers to linguistic assessments so that their vagueness can be captured. For example, rather thanusing numbers 1 and 5 to represent “very low” and “very high” importance in scale (2), we may assign symmetricaltriangular fuzzy numbers (STFNs) such as [0.5,1.5] and [4.5,5.5] to these two linguistic assessments to express theirvagueness. Here an STFN, in the form of [a, c], is a special fuzzy set representing a fuzzy concept “approximately b”where b= (a+ c)=2 (see Appendix for a brief account of fuzzy set and STFN).To operate the HOQ process and make relevant computations comparable, it is necessary to unify the various scales used
in HOQ. We propose a few 9-point 1-to-9 scales to measure the respective concepts in our proposed HOQ model. Thesescales can be represented by either conventional numbers or STFNs according to practical requirements. The rationale ofadopting such 1-to-9 rating scales is proved by the many tests made by Saaty [17]. On the other hand, since 5-point scaleis simple and easy to use and also includes enough information people provide on the attributes measured (Refs. [18–20]),we suggest that for each of the following 9-point scales proposed, a 5-point subscale 1-3-5-7-9 (or corresponding STFNs[0,2]-[2,4]-[4,6]-[6,8]-[8,10]) be used as much as possible. Only when compromises must be made or some uncertaintyexists, the numbers 2, 4, 6, 8 (or corresponding STFNs [1,3], [3,5], [5,7], [7,9]) are adopted. These suggested scales are:
• For measuring the relative importance of WHATs:
(8)
• For measuring the companies’ current and goal performance in terms of WHATs:
(9)
• For measuring the relationship between each WHAT and each HOW:
(10)
3. Descriptions of the HOQ model
According to the above preparations, our proposed 9-step HOQ model (Fig. 1) can be described as follows. Thesedescriptions, both qualitative and quantitative, are based on the ideas from Refs. [1–9,13–15].
Step 1. Identify customers and collect their needs (WHATs): The producing company should know who are thecustomers for the product concerned. There are generally three types of customers, internal customers such as shareholders,managers and employees, intermediate customers such as wholesale people and retailers, and ultimate customers such asrecipients of service, purchasers, institutional purchasers. Usually the main focus is on the ultimate customers who couldbe identi4ed through previous information and marketing research.

124 L.-K. Chan, M.-L. Wu /Omega 33 (2005) 119–139
Understanding what customers need for a product is important for the company, otherwise you cannot know how tosatisfy your customers and thus how to keep your business successful. Available methods to collect customer needs includefocus group, individual interviews, listening and watching, and using existing information. It is suitable and economicalto gather customer needs through focus group and individual interviews (Ref. [2]). As for how many customers shouldbe interviewed, see Refs. [7,8] for analysis and guidelines.
Grouping related customer needs into a category is helpful in analyzing the needs. A=nity Diagram (Refs. [2,6,7]), amethod of arranging random data into natural and logical groups, can be used to organize customer needs. Cluster analysiscan also be used for this purpose (Ref. [8]). Usually customer needs can be organized as a tree-like structure with anincreasing number of items moving from left/top (higher levels) to right/bottom (lower levels).
Suppose that, through appropriate ways, K customers have been selected and M customer needs have been identi4edbased on the opinions of these K customers. The M customer needs are denoted as W1; : : : ; WM . These needs could beclassi4ed into some meaningful categories according to practical situation.
Step 2. Determine the relative importance ratings of customer needs: Customer needs (WHATs) usually are of diOerentdegrees of importance and it is a common practice for the company to focus more on the important WHATs. The relativeimportance of the WHATs is usually expressed as a set of ratings that can be determined by letting the customers revealtheir perceptions on the relative importance of the WHATs and then averaging their perceptions. The appropriate ways ofobtaining customers’ perceptions are by individual interviews and mail surveys.
Suppose that for customer need Wm, customer k supplies a relative importance rating gmk to it according to scale (9),where gmk is one of the nine crisp numbers or STFNs in scale (8). Then the resulting average relative importance ratingfor Wm is computed by
gm = (gm1 + gm2 + · · · + gmK)=K =K∑k=1
gmk=K; m= 1; 2; : : : ; M: (11)
It should be noted that if STFNs are used in scale (8), then gm computed by (11) is also an STFN. For convenience, therelative importance ratings of the M customer needs can be described as an M -dimensional vector, g = (g1; g2; : : : ; gM ).
Step 3. Identify competitors and conduct customer competitive analysis: Competitors who produce the similar productsshould be identi4ed by the company under study. Knowing the company’s strengths and constraints in all aspects of aproduct and in comparison with its main competitors is essential for a company if it wishes to improve its competitivenessin the relevant markets. This kind of information can be obtained by asking the customers to rate the relative performanceof the company and its competitors on each WHAT and then to aggregate the customers’ ratings. Useful ways of conductingthis kind of comparison analysis are also via mailed surveys and individual interviews.
Denote the company in question by C1. Suppose that L − 1 competitors are identi4ed, denoted as C2; : : : ; CL. Thenthe K customers are requested to provide their perceptions on the relative performance of these L companies’ productsof the similar type in terms of the M customer needs. Suppose that customer k supplies a rating xmlk on company Cl’sperformance in terms of Wm using scale (9), where xmlk is one of the nine crisp numbers or STFNs in scale (9). Thenthe performance rating of company Cl on customer need Wm is given as
xml = (xml1 + xml2 + · · · + xmlK)=K =K∑k=1
xmlk =K; m= 1; 2; : : : ; M; l= 1; 2; : : : ; L: (12)
Thus, the companies’ performance ratings on the customer needs can be denoted by an M × L matrix, called customercomparison matrix:
X =
C1 C2 : : : CL
W1
W2
· · ·WM
x11 x12 · · · x1L
x21 x22 · · · x2L
· · · · · · · · · · · ·xM1 xM2 · · · xML
M×L
:
Based on this X information, customer competitive priority ratings on the WHATs for the producing company C1 canbe obtained, usually using the quite subjective sales point concept (see Element 9 of Section 2.1), as e = (e1; e2; : : : ; em)where em is company C1’s priority rating on customer need Wm. This set of priority ratings can also be derived by themore objective entropy method as introduced in the Appendix.
According to company C1’s current performance on the WHATs in relation to its competitors’ performance, performancegoals on the WHATs can be set for the company. These goals should be set competitively and realistically by the company,which is a highly strategical activity involving many considerations from relevant management. Assume that for customer
L.-K. Chan, M.-L. Wu /Omega 33 (2005) 119–139 125
need Wm, a proper performance goal am has been set according to scale (9). Thus the company has a goal performancevector in terms of the customer needs, denoted as a= (a1; a2; : : : ; aM ). In most cases, each goal performance level shouldnot be lower than current performance level, implying the need or desire for further improvement. From this we can alsoset the company’s improvement ratio for Wm as um=am=xm1. It is obvious that the higher the improvement ratio, the morethe company should work on the WHAT, and thus the more important the WHAT for the company.
Step 4. Determine the 7nal importance ratings of customer needs: Customer needs with higher relative importanceperceived by customers and higher competitive priorities and improvement ratios should receive higher attention. Thus,according to (5), customer need Wm’s 4nal importance rating for the company is determined jointly by its relativeimportance gm, competitive priority em and improvement ratio um as
fm = um × gm × em; m= 1; 2; : : : ; M: (13)
WHATs with high such 4nal ratings indicate both importance and potential business bene4t to the company.Of course, a (weighted) sum of um, gm and em can also produce a reasonable fm, if preferred. In any case, we will
denote the 4nal importance ratings for the customer needs as a vector, f = (f1; f2; : : : ; fM ).Step 5. Generate technical measures (HOWs): After customers reveal their needs for the product, the company’s
technicians or product development team should develop a set of HOWs to capture the customer needs in measurable andoperable technical terms. HOWs could be generated from current product standards or selected by ensuring through cause–eOect analysis that the HOWs are the 4rst-order causes for the WHATs (Ref. [5]). Assume that N technical measures havebeen developed, denoted as H1; H2; : : : ; HN . Their measurement units and improving directions should also be determined,which is usually easy to do and important for the company to conduct technical competitive analysis for the HOWs. Ifnecessary, these HOWs could be organized into some manageable categories using, e.g., the A=nity Diagram method(Refs. [2,6,7]).
Step 6. Determine the relationships between HOWs and WHATs: This is an important work in HOQ/QFD which isperformed carefully and collectively by technicians. The relationship between a HOW and a WHAT is usually determinedby analyzing to what extent the HOW could technically relate to and in5uence the WHAT. All these relationships forma matrix with the WHATs as rows and the HOWs as columns. It is suitable to complete this matrix in a column- orHOW-wise manner since once a HOW is de4ned we usually begin establishing to what extents it relates to the WHATs(Ref. [2]). Let the relationship value between technical measure Hn and customer need Wm be determined as rmn accordingto scale (10). Then we can form the following relationship matrix between the HOWs and the WHATs:
R =
H1 H2 · · · HN
W1
W2
· · ·WM
r11 r12 · · · r1N
r21 r22 · · · r2N
· · · · · · · · · · · ·rM1 rM2 · · · rMN
M×N
:
Step 7. Determine initial technical ratings of HOWs: Initial technical ratings of HOWs are decided by two factors,4nal importance ratings of WHATs and the relationships between the HOWs and the WHATs. These ratings indicate thebasic importance of the HOWs developed in relation to the WHATs. They are usually computed using the simple additiveweighting (SAW) formula (7). That is, for technical measure Hn, its initial technical rating is computed as the followingsimple weighted average over its relationships with the WHATs:
tn = f1 × r1n + f2 × r2n + · · · + fM × rMn =M∑m=1
fm × rmn; n= 1; 2; : : : ; N: (14)
Other methods to obtain comprehensive ratings for a set of choices in relation to a number of performance criteria,such as the technique for order preference by similarity to ideal solution (TOPSIS) (Refs. [21,22]) and the operationalcompetitiveness rating (OCRA) procedure (Refs. [23,24]), can also be used to compute initial technical ratings (Ref. [15]).We will denote, in any case, the HOWs’ initial technical ratings by a vector, t = (t1; t2; : : : ; tN ).
Step 8: Perform technical competitive analysis: This step can be done through marketing. Although some technicalparameters and know-hows of the competitors’ products cannot be easily obtained and some may even be kept con4dential,the producing company should make every eOort to acquire this information and failing to do so may result in anunfavorable position for the company in the market place. In case of extreme di=culty in obtaining the technical parametersof the competitors’ products on some HOWs, careful technical assessments should be made to give reliable scores (in asuitable scale such as (9)) representing the technical performance of the competitors’ products on the said HOWs.
126 L.-K. Chan, M.-L. Wu /Omega 33 (2005) 119–139
Let the technical parameter or performance score of company Cl’s product on technical measure Hn be determined asynl. Then we can form the technical comparison matrix of the companies’ products on the HOWs:
Y =
C1 C2 · · · CL
H1
H2
· · ·HN
y11 y12 · · · y1L
y21 y22 · · · y2L
· · · · · · · · · · · ·yN1 yN2 · · · yNL
N×L
:
From this Y information technical competitive priority ratings on the HOWs can be obtained for the producing companyusing the entropy method as described in the Appendix. We will denote these ratings as a vector, z=(z1; z2; : : : ; zN ), wherezn represents the company’s technical competitive priority with respect to Hn.
Based on the above matrix Y , company C1 could also set performance goals on the HOWs. It should be noted thatthese goals are diOerent from design speci4cations. Essentially they represent levels of performance on the HOWs whichthe company believes is required for its product to be of technical competitiveness in the relevant markets in comparisonwith its competitors’ similar products. The goals should also be reachable according to the company’s technical resources.Suppose that the company sets a goal performance level bn for its product on Hn, then we have a technical performancegoal vector, b=(b1; b2; : : : ; bN ). Compared to these goals we can de4ne improvement ratios vn’s for the current performanceof company’s product on the HOWs:
vn = bn=yn1 for Hn to be maximized; or when bn¿ yn1 for Hn to meet target;
vn = yn1=bn for Hn to be minimized; or when bn ¡yn1 for Hn to meet target;
or in a uniform manner:
vn =max{yn1; bn}=min{yn1; bn}: (15)
Step 9. Obtain 7nal technical ratings of the HOWs: Those HOWs with higher initial technical ratings (tn’s), highertechnical competitive priorities (zn’s) and higher improvement ratios (vn’s) indicate working focuses and market opportu-nities for the producing company. Final technical rating is a useful measure to re5ect this point which, with respect toHn, can be computed for the company’s product by integrating all these factors using a formula similar to (5) or (13)for computing the 4nal importance ratings for the WHATs:
sn = vn × tn × zn; n= 1; 2; : : : ; N: (16)
Thus we have a 4nal technical rating vector on the HOWs, s = (s1; s2; : : : ; sN ). HOWs with higher 4nal technical ratings,implying greater importance for the company’s product to be successful in the competitive markets, are transferred intothe second phase of QFD, parts deployment, which translates important technical measures (new WHATs) into partscharacteristics (new HOWs).
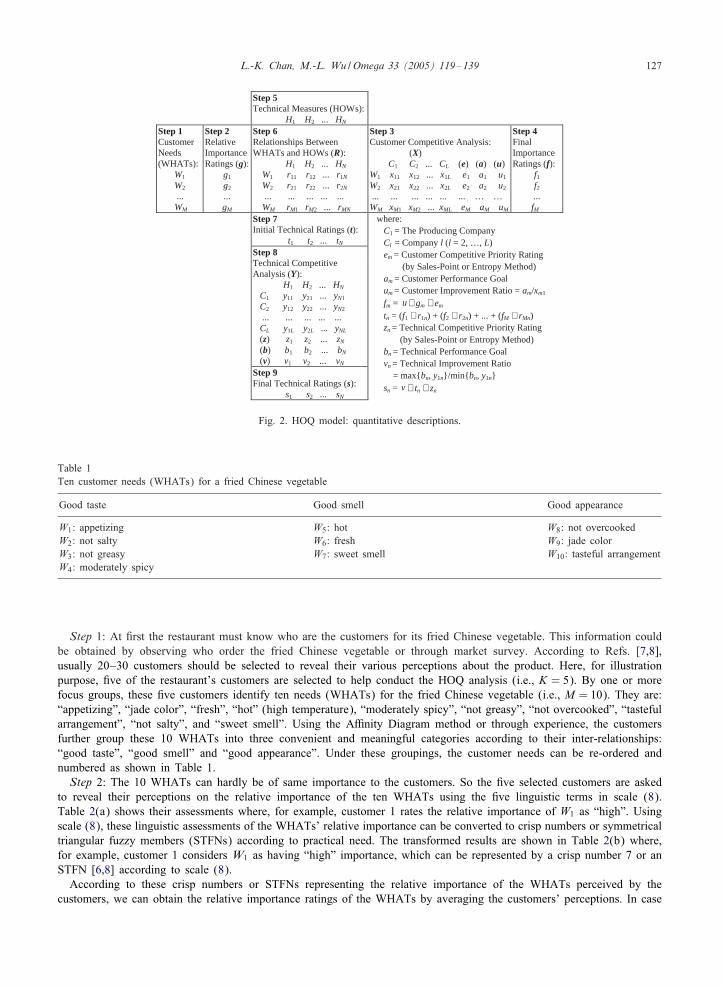
The above quantitative descriptions of our proposed HOQ model are summarized in Fig. 2. In the next Section, we willdemonstrate step by step the concepts and operations of the model through an easy-to-understand fried Chinese vegetableexample. To make our HOQ model fully operable, we will use fuzzy method to handle the vagueness of people’s linguisticassessments and entropy method to derive competitive priority ratings for the company’s product. A brief introduction tothese two methods is given in the Appendix.
4. A full illustrative example
Complete QFD examples to fully illustrate the procedure of QFD do not appear frequently in the literature. But theyare helpful for practitioners to follow. Here we present a fried Chinese vegetable example to illustrate the concepts andcomputations in our proposed HOQ model in details. A Chinese restaurant, called restaurant C1, wishes to make animprovement on a fried Chinese vegetable it cooks and sells everyday in response to the competition of other Chineserestaurants in the same district. HOQ technique can help C1 make the appropriate decision resulting in better improvement.The basic idea is (i) to understand what are customer needs for a fried Chinese vegetable (such as “not greasy” and“fresh”) and then to identify the important ones through customer surveys, and (ii) to associate the customer needs withappropriate technical measures or solutions (such as “amount of edible oil used” and “duration of vegetable storage”)and then to 4nd the important ones through technical analyses. In what follows we will build the HOQ model for thisexample step by step according to the qualitative and quantitative descriptions in Section 3.
L.-K. Chan, M.-L. Wu /Omega 33 (2005) 119–139 127
Step 5Technical Measures (HOWs):
H1 H2 ... HN
Step 1CustomerNeeds (WHATs):
W1
W2
... WM
Step 2RelativeImportance Ratings (g):
g1
g2
... gM
Step 6Relationships Between WHATs and HOWs (R):
H1 H2 ... HN
W1 r11 r12 ... r1N
W2 r21 r22 ... r2N
... ... ... ... ...WM rM1 rM2 ... rMN
Step 3Customer Competitive Analysis:
(X) C1 C2 ... CL (e) (a) (u)
W1 x11 x12 ... x1L e1 a1 u1
W2 x21 x22 ... x2L e2 a2 u2
... ... ... ... ... ... … … WM xM1 xM2 ... xML eM aM uM
Step 4FinalImportanceRatings (f):
f1
f2
... fM
Step 7Initial Technical Ratings (t):
t1 t2 ... tN
Step 8Technical CompetitiveAnalysis (Y):
H1 H2 ... HN
C1 y11 y21 ... yN1
C2 y12 y22 ... yN2
... ... ... ... ... CL y1L y2L ... yNL
(z) z1 z2 ... zN
(b) b1 b2 ... bN
(v) v1 v2 ... vN
Step 9Final Technical Ratings (s):
s1 s2 ... sN
where:C1 = The Producing CompanyCl = Company l (l = 2, …, L) em = Customer Competitive Priority Rating
(by Sales-Point or Entropy Method) am = Customer Performance Goalum = Customer Improvement Ratio = am/xm1
fm = × gm × em
tn = (f1 × r1n) + (f2 × r2n) + ... + (fM × rMn)zn = Technical Competitive Priority Rating
(by Sales-Point or Entropy Method) bn = Technical Performance Goalvn = Technical Improvement Ratio
= max{bn, y1n}/min{bn, y1n} sn = × tn × znv
u
Fig. 2. HOQ model: quantitative descriptions.
Table 1Ten customer needs (WHATs) for a fried Chinese vegetable
Good taste Good smell Good appearance
W1: appetizing W5: hot W8: not overcookedW2: not salty W6: fresh W9: jade colorW3: not greasy W7: sweet smell W10: tasteful arrangementW4: moderately spicy
Step 1: At 4rst the restaurant must know who are the customers for its fried Chinese vegetable. This information couldbe obtained by observing who order the fried Chinese vegetable or through market survey. According to Refs. [7,8],usually 20–30 customers should be selected to reveal their various perceptions about the product. Here, for illustrationpurpose, 4ve of the restaurant’s customers are selected to help conduct the HOQ analysis (i.e., K = 5). By one or morefocus groups, these 4ve customers identify ten needs (WHATs) for the fried Chinese vegetable (i.e., M = 10). They are:“appetizing”, “jade color”, “fresh”, “hot” (high temperature), “moderately spicy”, “not greasy”, “not overcooked”, “tastefularrangement”, “not salty”, and “sweet smell”. Using the A=nity Diagram method or through experience, the customersfurther group these 10 WHATs into three convenient and meaningful categories according to their inter-relationships:“good taste”, “good smell” and “good appearance”. Under these groupings, the customer needs can be re-ordered andnumbered as shown in Table 1.Step 2: The 10 WHATs can hardly be of same importance to the customers. So the 4ve selected customers are asked
to reveal their perceptions on the relative importance of the ten WHATs using the 4ve linguistic terms in scale (8).Table 2(a) shows their assessments where, for example, customer 1 rates the relative importance of W1 as “high”. Usingscale (8), these linguistic assessments of the WHATs’ relative importance can be converted to crisp numbers or symmetricaltriangular fuzzy members (STFNs) according to practical need. The transformed results are shown in Table 2(b) where,for example, customer 1 considers W1 as having “high” importance, which can be represented by a crisp number 7 or anSTFN [6,8] according to scale (8).According to these crisp numbers or STFNs representing the relative importance of the WHATs perceived by the
customers, we can obtain the relative importance ratings of the WHATs by averaging the customers’ perceptions. In case

128 L.-K. Chan, M.-L. Wu /Omega 33 (2005) 119–139
Table 2
(a) Five customers’ perceptions on the relative importance of the 10 WHATs
WHATs Customer 1 Customer 2 Customer 3 Customer 4 Customer 5
W1 High Very high High Moderate Very highW2 Moderate Very high Moderate High ModerateW3 Very high Moderate Very high Moderate LowW4 High Low Moderate Very high LowW5 Low Very low Low Moderate HighW6 Very high High High Moderate Very highW7 Moderate Low Very high High ModerateW8 High Moderate Moderate High HighW9 Low Moderate Very low Low ModerateW10 Very low Low Moderate Very low Low
(b) Relative importance ratings of the 10 WHATs based on the 7ve customers’ perceptions
WHATs Customer 1 Customer 2 Customer 3 Customer 4 Customer 5 Relative importance(Wm) ratings
Crisp Fuzzy Crisp Fuzzy Crisp Fuzzy Crisp Fuzzy Crisp Fuzzy Crisp Fuzzy(gm1) (g̃m1) (gm2) (g̃m2) (gm3) (g̃m3) (gm4) (g̃m4) (gm5) (g̃m5) (gm) (g̃m)
W1 7 [6, 8] 9 [8, 10] 7 [6, 8] 5 [4, 6] 9 [8, 10] 7.4 [6.4, 8.4]W2 5 [4, 6] 9 [8, 10] 5 [4, 6] 7 [6, 8] 5 [4, 6] 6.2 [5.2, 7.2]W3 9 [8, 10] 5 [4, 6] 9 [8, 10] 5 [4, 6] 3 [2, 4] 6.2 [5.2, 7.2]W4 7 [6, 8] 3 [2, 4] 5 [4, 6] 9 [8, 10] 3 [2, 4] 5.4 [4.4, 6.4]W5 3 [2, 4] 1 [0, 2] 3 [2, 4] 5 [4, 6] 7 [6, 8] 4.0 [3.0, 5.0]W6 9 [8, 10] 7 [6, 8] 7 [6, 8] 5 [4, 6] 9 [8, 10] 7.4 [6.4, 8.4]W7 5 [4, 6] 3 [2, 4] 9 [8, 10] 7 [6, 8] 5 [4, 6] 5.8 [4.8, 6.8]W8 7 [6, 8] 5 [4, 6] 5 [4, 6] 7 [6, 8] 7 [6, 8] 6.2 [5.2, 7.2]W9 3 [2, 4] 5 [4, 6] 1 [0, 2] 3 [2, 4] 5 [4, 6] 3.4 [2.4, 4.4]W10 1 [0, 2] 3 [2, 4] 5 [4, 6] 1 [0, 2] 3 [2, 4] 2.6 [1.6, 3.6]
that crisp numbers are used, these relative importance ratings are computed by (11) as
g = (g1; g2; : : : ; g10) = (7:4; 6:2; 6:2; 5:4; 4:0; 7:4; 5:8; 6:2; 3:4; 2:6):
For example, the crisp form relative importance rating of W1; g1, is computed by
g1 = (g11 + g12 + g13 + g14 + g15)=5 = (7 + 9 + 7 + 5 + 9)=5 = 37=5 = 7:4;
where gmk is customer k’s relative importance perception on Wm in crisp form. If STFNs are used, the relative importanceratings are computed by (11) and the arithmetic for STFNs as
g̃ = (g̃1; g̃2; : : : ; g̃10) = ([6:4; 8:4]; [5:2; 7:2]; [5:2; 7:2]; [4:4; 6:4]; [3:0; 5:0]; [6:4; 8:4];
[4:8; 6:8]; [5:2; 7:2]; [2:4; 4:4]; [1:6; 3:6]);
where, for example, the STFN form relative importance rating of W1; g̃1, is computed by
g̃1 = (g̃11 + g̃12 + g̃13 + g̃14 + g̃15)=5 = ([6; 8] + [8; 10] + [6; 8] + [4; 6] + [8; 10])=5 = [32; 42]=5 = [6:4; 8:4];
and g̃mk is customer k’s relative importance perception on Wm in STFN form.Step 3: This step is for restaurant C1 to identify competitors and conduct customer competitive analysis. In the district’s
fried Chinese vegetable market, restaurant C1 has three main competitors, called restaurants C2, C3 and C4, each of whichmakes a similar type of fried Chinese vegetable. In order to understand the fried Chinese vegetable market and itsrelative position in the market, and to 4nally 4nd out the priorities for further improvement, restaurant C1 asks the 4veselected customers to rate the relative performance of its own fried Chinese vegetable and the three competitors’ similarproducts in terms of the ten WHATs using scale (9). The 4ve customers’ assessments are shown in Table 3(a) in crispnumbers, where, for example, customer 1 rates the performance of C2’s product on W3 as “neutral” using scale (9), which

L.-K. Chan, M.-L. Wu /Omega 33 (2005) 119–139 129
Table 3
(a) Customer competitive analysis
Wm Customer 1, Customer 2, Customer 3, Customer 4, Customer 5, Customer comparison emX1 = [xmn1]10×4 X2 = [xmn2]10×4 X3 = [xmn3]10×4 X4 = [xmn4]10×4 X5 = [xmn5]10×4 matrix, X = [xmn]10×4
C1 C2 C3 C4 C1 C2 C3 C4 C1 C2 C3 C4 C1 C2 C3 C4 C1 C2 C3 C4 C1 C2 C3 C4
W1 5 7 5 3 7 3 7 7 9 5 7 5 5 5 7 5 7 3 3 7 6.6 4.6 5.8 5.4 0.1000W2 3 3 5 5 5 7 3 5 3 5 3 7 7 5 5 3 5 5 7 5 4.6 5.0 4.6 5.0 0.1006W3 7 5 3 7 9 5 5 7 7 7 5 5 5 3 5 3 7 5 7 5 7.0 5.0 5.0 5.4 0.0999W4 3 5 7 5 1 3 5 5 5 5 3 7 7 5 5 3 5 3 5 5 4.2 4.2 5.0 5.0 0.1004W5 1 3 1 1 3 1 1 3 1 5 3 1 5 5 3 3 3 3 5 3 2.6 3.4 2.6 2.2 0.0997W6 7 5 3 5 9 7 7 7 5 3 5 3 7 7 3 7 7 3 5 5 7.0 5.0 4.6 5.4 0.0997W7 9 7 9 5 7 9 7 7 5 3 3 5 7 7 7 3 9 7 7 9 7.4 6.6 6.6 5.8 0.1004W8 3 3 7 3 5 3 5 5 3 5 5 3 1 5 7 5 7 5 7 5 3.8 4.2 6.2 4.2 0.0992W9 5 3 5 7 7 7 7 5 7 3 5 3 5 5 7 7 3 3 3 5 5.4 4.2 5.4 5.4 0.1003W10 7 7 3 5 9 7 5 5 7 5 7 3 5 7 5 5 7 9 7 7 7.0 7.0 5.4 5.0 0.0998
(b) Goals and improvement ratios for the 10 WHATs
WHATs Customer comparison matrix, X = [xml]10×4 Goals for WHATs (am) Improvement ratios for WHATs (um = am=xm1)
C1 C2 C3 C4
W1 6.6 4.6 5.8 5.4 7 1.0606W2 4.6 5.0 4.6 5.0 5 1.0870W3 7.0 5.0 5.0 5.4 8 1.1429W4 4.2 4.2 5.0 5.0 5 1.1905W5 2.6 3.4 2.6 2.2 4 1.5385W6 7.0 5.0 4.6 5.4 8 1.1429W7 7.4 6.6 6.6 5.8 9 1.2162W8 3.8 4.2 6.2 4.2 5 1.3158W9 5.4 4.2 5.4 5.4 6 1.1111W10 7.0 7.0 5.4 5.0 8 1.1429
corresponds to a crisp number of 5, i.e., x321 =5. We will not consider using STFNs to represent performance assessmentssince it is too complex to incorporate STFNs into the following entropy computations.
According to the 4ve customers’ assessments of the relative performance of the four restaurants’ similar products interms of the 10 WHATs, a customer comparison matrix X = [xmn]10×4 can be obtained by averaging the customers’assessments. The elements of this matrix are shown in Table 3(a) where, for example, restaurant C1’s performance ratingon W2 is computed by (12) as
x21 = (x211 + x212 + x213 + x214 + x215)=5 = (3 + 5 + 3 + 7 + 5)=5 = 23=5 = 4:6;
where xmlk is customer k’s assessment of restaurant Cl’s performance on Wm.Applying the entropy method as illustrated in the Appendix, we can obtain restaurant C1’s competitive priority ratings
on the 10 customer needs based on the above customer comparison matrix X . For example, the “distribution” of W1 onthe four restaurants’ products is composed of the four restaurants’ performance ratings on W1: (6.6, 4.6, 5.8, 5.4), which isthe 4rst row of matrix X . Then we can compute the total score of W1 : x1=x11+x12+x13+x14=6:6+4:6+5:8+5:4=22:4,and obtain the “probability distribution” of W1:
p11 = x11=x1 = 6:6=22:4 = 0:2946; p12 = x12=x1 = 4:6=22:4 = 0:2054;
p13 = x13=x1 = 5:8=22:4 = 0:2589; p14 = x14=x1 = 5:4=22:4 = 0:2411:
The entropy of W1 is then computed using (A.2) as
E(W1) = −!4
4∑l=1
p1l ln(p1l) = −[0:2946 ln(0:2946) + 0:2054 ln(0:2054)
+ 0:2589 ln(0:2589) + 0:2411 ln(0:2411)]=ln(4) = 0:9940:
130 L.-K. Chan, M.-L. Wu /Omega 33 (2005) 119–139
We can obtain in the same way the entropy for each of the 10 customer needs as
(E(W1); E(W2); : : : ; E(W10))
= (0:9940; 0:9994; 0:9925; 0:9973; 0:9909; 0:9905; 0:9973; 0:9859; 0:9961; 0:9919):
Finally, according to (A.3) we can obtain restaurant C1’s competitive priority ratings on the Wj’s:
e = (e1; e2; : : : ; e10) = (0:1000; 0:1006; 0:0999; 0:1004; 0:0997; 0:0997; 0:1004; 0:0992; 0:1003; 0:0998);
where, for example,
e1 = E(W1)
/10∑m=1
E(Wm)
= 0:9940=(0:9940 + 0:9994 + · · · + 0:9919) = 0:9904=9:9357 = 0:1000:
This set of competitive priority ratings are shown in the last column of Table 3(a) from which we know that W2 is ofthe highest competitive priority for the restaurant, followed by W4; W7 and W9.
Based on the resources available and the relative performance of the four restaurants on the 10 WHATs, restaurant C1
can set improving goals on each WHAT to better satisfy the customer needs. After various considerations, restaurant C1
decides the following performance goals on the WHATs using scale (9):
a = (a1; a2; : : : ; a10) = (7; 5; 8; 5; 4; 8; 9; 5; 6; 8):
This set of goals is shown in Table 3(b). It is noted that all goal performance levels are higher than C1’s currentperformance levels represented by the 4rst column of customer comparison matrix X . If C1’s performance on a WHATis poorer or much poorer than the performance of most of its competitors, then the goal level is set to be much higherthan its current level to be of competitiveness. Otherwise, if C1’s performance on a WHAT is better than the performanceof most of its competitors, then the goal level is only set to be slightly higher than its current level which is enough forC1 to keep and enhance its established competitiveness. We do not consider setting goals in STFN form either, since thisresults in some computational and explanatory di=culties.
According to restaurant C1’s current and goal performance levels on the ten WHATs, its improvement ratios withrespect to the customer needs can be easily computed according to the formula um = am=xm1:
u = (u1; u2; : : : ; u10) = (1:0606; 1:0870; 1:1429; 1:1905; 1:5385; 1:1429; 1:2162; 1:3158; 1:1111; 1:1429):
Step 4: According to each WHAT’s relative importance rating, competitive priority rating and improvement ratio,restaurant C1 could now reach the 4nal importance rating of the WHAT using (13). In case that the relative importanceratings are crisp numbers, the 4nal importance ratings are also given as the following crisp numbers:
f = (f1; f2; : : : ; f10)
= (0:7852; 0:6779; 0:7078; 0:6453; 0:6137; 0:8431; 0:7081; 0:8095; 0:3787; 0:2966):
Here, for example, the 4nal importance rating of W1 in crisp form, f1, is computed by (13) as
f1 = u1 × g1 × e1 = 1:0606 × 7:4 × 0:1000 = 0:7852:
From f we can 4nally rank the importance of the ten WHATs in the following order:
W6 � W8 � W1 � W7 � W3 � W2 � W4 � W5 � W9 � W10 (17)
where “�” means “more important than”.If relative importance ratings are STFNs, 4nal importance ratings are also given as STFNs:
f̃ = (f̃1; f̃2; : : : ; f̃10) = ([0:6791; 0:8913]; [0:5685; 0:7872]; [0:5937; 0:8220];
[0:5258; 0:7647]; [0:4603; 0:7671]; [0:7292; 0:9570]; [0:5860; 0:8302]; [0:6789; 0:9400];
[0:2673; 0:4901]; [0:1825; 0:4107]):
Here, for example, the 4nal importance rating of W1 in STFN form, f̃1, is computed by (13) and the scalar multiplicationrule of STFNs as
f̃1 = u1 × g̃1 × e1 = 1:0606 × [6:4; 8:4] × 0:1000 = [0:6791; 0:8913]:

L.-K. Chan, M.-L. Wu /Omega 33 (2005) 119–139 131
Table 4Crisp and fuzzy 4nal importance ratings of the 10 WHATs
WHATs Final importance ratings Scaled 4nal importance ratings
Crisp (fm) Fuzzy (f̃ m) Crisp Fuzzy
W1 0.7852 [0.6791, 0.8913] 0.9313 [0.7096, 0.9313]W2 0.6779 [0.5685, 0.7872] 0.8040 [0.5941, 0.8225]W3 0.7078 [0.5937, 0.8220] 0.8396 [0.6203, 0.8589]W4 0.6453 [0.5258, 0.7647] 0.7653 [0.5494, 0.7991]W5 0.6137 [0.4603, 0.7671] 0.7279 [0.4810, 0.8016]W6 0.8431 [0.7292, 0.9570] 1.0000 [0.7619, 1.0000]W7 0.7081 [0.5860, 0.8302] 0.8399 [0.6123, 0.8675]W8 0.8095 [0.6789, 0.9400] 0.9601 [0.7094, 0.9823]W9 0.3787 [0.2673, 0.4901] 0.4492 [0.2794, 0.5121]W10 0.2966 [0.1825, 0.4107] 0.3519 [0.1907, 0.4292]
Using the fuzzy ranking principle (see Appendix), these fuzzy ratings produce the following partial ranking order for theWHATs’ 4nal importance:
W6 � {W8; W1} � {W7; W3} � W2 � {W4; W5} � W9 � W10; (18)
where {W8; W1} means that W8 and W1 are not so easy to be compared, so do {W7; W3} and {W4; W5}. Although thecrisp and fuzzy 4nal importance ratings for the ten WHATs may not result in the same ranking order due to possibleincomparability between the fuzzy ratings of W8 and W1, of W7 and W3, and of W4 and W5, it is quite clear from (17)and (18) that the two sets of ratings show an identical trend. Both sets of ratings indicate that W6 is the most importantWHAT, followed by W8 and W1, and then by W7 and W3.
These 4nal importance ratings of the WHATs, expressed as both crisp numbers and STFNs, are shown in the secondcolumn of Table 4. In order to be comparable, the crisp and fuzzy 4nal importance ratings are both scaled to havemaximum ratings of unity, which are also shown in Table 4. More clearly, the scaled ratings are obtained for crisp caseby dividing all the ratings by their maximum, 0.8431, and for fuzzy case by dividing all the STFNs by the maximum oftheir upper limits, 0.9570. From these scaled ratings we can see that, although the crisp and fuzzy ratings result in thesame ranking order, crisp ratings are very close to the upper limits of the corresponding fuzzy ratings and quite far awayfrom the lower limits. This shows that fuzzy ratings are more representative of the variations of the WHATs’ importance,which would make the restaurant more 5exible to capture and satisfy the customer needs for a fried Chinese vegetable.
Step 5: Now it is time to convert customer needs into product design speci4cations. After careful considerations,restaurant C1’s cooks propose nine technical measures (HOWs) that relate to and can help realize the ten WHATs. TheseHOWs can be grouped into two categories, “cooking material” and “cooking quality”. Further, the improving directionfor each HOW is also determined by experience or technical analysis: two HOWs are to be minimized and the remainingseven HOWs are to meet targets. The HOWs, their improving directions and measurement units are shown in Table 5.
Step 6: Then the cooks begin to establish the relationships between the HOWs and the WHATs, or to examine towhat extent each HOW is related to and can technically measure each WHAT. This step is usually done simultaneouslywith Step 5 since in the process of generating HOWs, each HOW’s relationships with the WHATs are always examinedonce the HOW is considered. The relationships between the HOWs and the WHATs are determined by technical analysis
Table 5Nine technical measures (HOWs) for the 10 customer needs (WHATs)
Cooking material Cooking quality
H1: [ ↔ ] amount of soy sauce used (ml) H6: [ ↓ ] duration of vegetable storage (hour)H2: [ ↔ ] amount of salt used (g) H7: [ ↓ ] duration between 4nished and served (minute)H3: [ ↔ ] amount of pepper used (mg) H8: [ ↔ ] duration of cooking (minute)H4: [ ↔ ] amount of vegetable used (g) H9: [ ↔ ] duration of high temperature used in cooking (second)H5: [ ↔ ] amount of edible oil used (ml)
Note: “↔” represents to meet a target and “↓” to minimize/decrease.

132 L.-K. Chan, M.-L. Wu /Omega 33 (2005) 119–139
Table 6Crisp and fuzzy relationship matrix of HOWs vs. WHATs
Crisp (R = [rmn]10×9) Fuzzy (R̃ = [r̃mn]10×9)
H1 H2 H3 H4 H5 H6 H7 H8 H9 H1 H2 H3 H4 H5 H6 H7 H8 H9
W1 9 7 1 1 5 3 1 7 5 [8, 10] [6, 8] [0, 2] [0, 2] [4, 6] [2, 4] [0, 2] [6, 8] [4, 6]W2 7 9 5 5 5 5 5 5 7 [6, 8] [8, 10] [4, 6] [4, 6] [4, 6] [4, 6] [4, 6] [4, 6] [6, 8]W3 7 7 3 1 5 1 3 7 5 [6, 8] [6, 8] [2, 4] [0, 2] [4, 6] [0, 2] [2, 4] [6, 8] [4, 6]W4 7 7 1 1 5 1 3 5 7 [6, 8] [6, 8] [0, 2] [0, 2] [4, 6] [0, 2] [2, 4] [4, 6] [6, 8]W5 3 3 9 9 7 3 3 5 5 [2, 4] [2, 4] [8, 10] [8, 10] [6, 8] [2, 4] [2, 4] [4, 6] [4, 6]W6 5 5 3 3 9 3 3 5 5 [4, 6] [4, 6] [2, 4] [2, 4] [8, 10] [2, 4] [2, 4] [4, 6] [4, 6]W7 3 3 1 1 7 1 1 3 3 [2, 4] [2, 4] [0, 2] [0, 2] [6, 8] [0, 2] [0, 2] [2, 4] [2, 4]W8 5 5 3 3 7 9 7 3 5 [4, 6] [4, 6] [2, 4] [2, 4] [6, 8] [8, 10] [6, 8] [2, 4] [4, 6]W9 1 1 1 1 5 7 9 1 1 [0, 2] [0, 2] [0, 2] [0, 2] [4, 6] [6, 8] [8, 10] [0, 2] [0, 2]W10 1 1 1 3 3 5 5 7 7 [0, 2] [0, 2] [0, 2] [2, 4] [2, 4] [4, 6] [4, 6] [6, 8] [6, 8]
and empirical judgement, and usually may not be precise. So it is quite appropriate to use STFNs to represent this kindof relationships. For each HOW with respect to each WHAT, the cooks determine the relationship 4rst in linguisticterm using scale (10) and then convert this relationship into corresponding crisp number and STFN. The full matrix ofthese relationships, both in crisp numbers and STFNs, are shown in Table 6 where, for example, the cooks consider therelationship between H1 and W1 as “very strong” that corresponds to a crisp number of 9 and an STFN [8,10].
Step 7: According to the WHATs’ 4nal importance ratings and the relationship values between the HOWs and theWHATs, the HOWs’ initial technical ratings can be computed usually through the simple additive weighting (SAW)formula (7). When crisp numbers are used, the initial technical ratings are given as
t = (t1; t2; : : : ; t9) = (34:1866; 33:9720; 18:8076; 17:9852;
39:3707; 23:5959; 23:8702; 31:3584; 32:6375):
Here, for example, crisp initial technical rating of H1; t1, is computed as the weighted average over H1’s crisp relationshipvalues with the ten WHATs, r11; r21; : : : ; r101, which correspond to the 4rst column of the crisp relationship matrix R, andthe weights are the crisp 4nal importance ratings of the ten WHATs, f1; f2; : : : ; f10, i.e.,
t1 =10∑m=1
fm × rm1 = 0:7852 × 9 + 0:6779 × 7 + · · · + 0:2966 × 1 = 34:1866:
From these crisp initial technical ratings, the technical measures (HOWs) can be ranked in the following order:
H5 � H1 � H2 � H9 � H8 � H7 � H6 � H3 � H4: (19)
If STFNs are used, the initial technical ratings are also given as STFNs:
t̃ = (t̃1; t̃2; : : : ; t̃9) = ([23:2850; 47:4773]; [23:0639; 47:2691]; [9:9597; 30:0446];
[9:1375; 29:2221]; [27:0869; 54:0437]; [13:7766; 35:8043]; [13:8342; 36:2954];
[20:3964; 44:7095]; [21:3973; 46:2669]):
Here, for example, the initial technical rating of H1 in STFN form, t̃1, is computed as the weighted average over H1’sSTFN form relationship values with the ten WHATs, r̃11, r̃21; : : : ; r̃101, which correspond to the 4rst column of theSTFN form relationship matrix R̃, and the weights are the 4nal importance ratings of the ten WHATs in STFN form,f̃1; f̃2; : : : ; f̃10, i.e.,
t̃1 =10∑m=1
f̃ m × r̃m1 = [0:6791; 0:8913] × [8; 10] + [0:5685; 0:7872] × [6; 8] + · · · + [0:1825; 0:4107] × [0; 2]
= [23:2850; 47:4773]:
According to the principle in the Appendix, these fuzzy ratings have the following ranking order for the HOWs’ initialimportance:
H5 � H1 � H2 � H9 � H8 � H7 � H6 � H3 � H4: (20)

L.-K. Chan, M.-L. Wu /Omega 33 (2005) 119–139 133
Table 7Crisp and fuzzy initial technical ratings of the nine HOWs
HOWs Initial technical ratings Scaled initial technical ratings
Crisp (tn) Fuzzy (t̃n) Crisp Fuzzy
H1 34.1866 [23.2850, 47.4773] 0.8683 [0.4309, 0.8785]H2 33.9720 [23.0639, 47.2691] 0.8629 [0.4268, 0.8746]H3 18.8076 [9.9597, 30.0446] 0.4777 [0.1843, 0.5559]H4 17.9852 [9.1375, 29.2221] 0.4568 [0.1691, 0.5407]H5 39.3707 [27.0869, 54.0437] 1.0000 [0.5012, 1.0000]H6 23.5959 [13.7766, 35.8043] 0.5993 [0.2549, 0.6625]H7 23.8702 [13.8342, 36.2954] 0.6063 [0.2560, 0.6716]H8 31.3584 [20.3964, 44.7095] 0.7965 [0.3774, 0.8273]H9 32.6375 [21.3973, 46.2669] 0.8290 [0.3959, 0.8561]
Table 8Technical competitive analysis, goals and improvement ratios for HOWs
HOWs Measurement Technical comparison Technical competitive Goal Improvementunits matrix (Y = [ynl]9×4) priority rating (zn) (bn) ratio (vn)
C1 C2 C3 C4
H1 ml 11 13 8 9 0.1115 9 1.2222H2 g 6 9 9 10 0.1116 8 1.3333H3 mg 20 25 15 30 0.1104 25 1.2500H4 g 250 350 300 300 0.1124 300 1.2000H5 ml 7 11 10 10 0.1119 9 1.2857H6 h 8 10 5 6 0.1101 6 1.3333H7 min 2.5 2 1.5 3 0.1104 2 1.2500H8 min 3 4 3.5 3.5 0.1125 3.5 1.1667H9 s 20 30 15 15 0.1093 15 1.3333
It is noticed from (19) and (20) that the crisp and fuzzy ratings exhibit the same ranking order. Both sets of ratingsindicate that H5 is of the highest initial importance, followed by H1; H2 and H9.
The crisp and fuzzy initial technical ratings of the nine HOWs are shown in Table 7. Also shown there are the scaledcrisp and fuzzy ratings that are easier to be compared. Same as in the case for the WHATs’ 4nal importance ratings(Table 4), crisp initial technical ratings tend to be close to the upper bounds and far away from the lower bounds of thecorresponding fuzzy ratings, indicating more 5exibility and higher reliability represented by the fuzzy ratings.
Step 8: Now turn to technical competitive analysis which is to 4nd and establish competitive advantages or to furtherenhance the existing advantages for restaurant C1, through comparing all the restaurants’ similar fried Chinese vegetables interms of their technical performance on the nine identi4ed HOWs. Although it is always not easy to acquire the technicalperformance levels of competitors’ products on the HOWs, restaurant C1 must try all the means to obtain this valuableinformation in order to know its technical strengths and weaknesses and hence to improve or enhance its competitiveness.Through a lot of eOorts restaurant C1 obtains all the technical parameters of its own and its competitors’ fried Chinesevegetables in terms of the nine HOWs. This information forms a technical comparison matrix Y = [ynl]9×4 as shown inTable 8 where, for example, amount of soy sauce the four restaurants use to make fried Chinese vegetables (H1) are 11,13, 8 and 9 ml, respectively, which form the 4rst column of the technical comparison matrix Y .
Applying entropy method to Y in the same manner as in customer competitive analysis (Step 3), technical competitivepriority ratings can be obtained for restaurant C1’s fried Chinese vegetable on the nine HOWs:
z = (z1; z2; : : : ; z9) = (0:1115; 0:1116; 0:1104; 0:1124; 0:1119; 0:1101; 0:1104; 0:1125; 0:1093):
These ratings are shown in Table 8 from which we know that H8 and H4 are of the highest competitive priorities.According to the technical performance of its own and the other three restaurants’ fried Chinese vegetables in terms of
the nine HOWs, restaurant C1 could set technical performance goal on each of the HOWs for its fried Chinese vegetable

134 L.-K. Chan, M.-L. Wu /Omega 33 (2005) 119–139
to better ful4ll the customer needs. These goals should be determined both competitively and realistically. Suppose thatrestaurant C1’s relevant personnel agrees with the following performance goals on the HOWs for further improvement:
b = (b1; b2; : : : ; b9) = (9; 8; 25; 300; 9; 6; 2; 3:5; 15):
From these goal (bn) and current (yn1) technical performance levels, improvement ratios for restaurant C1’s fried Chinesevegetable to be competitive in terms of the HOWs can be easily computed using (15) as
v = (v1; v2; : : : ; v9) = (1:2222; 1:3333; 1:2500; 1:2000; 1:2857; 1:3333; 1:2500; 1:1667; 1:3333):
These goals and improvement ratios are shown in the last two columns of Table 8.Step 9: This is the last step of our proposed HOQ model. Integrating the initial technical ratings, technical competitive
priority ratings and improvement ratios of the HOWs, 4nal technical ratings can be computed by (16). If initial technicalratings are crisp numbers, the 4nal technical ratings are also crisp numbers and given as
s = (s1; s2; : : : ; s9) = (4:6595; 5:0541; 2:5948; 2:4250; 5:6622; 3:4637; 3:2933; 4:1163; 4:7578):
Here, for example, the 4nal technical rating of H1 in crisp form, s1, is computed by (16) as
s1 = v1 × t1 × z1 = (y11=b1) × t1 × z1 = (11=9) × 34:1866 × 0:1115 = 4:6595:
From s we can rank the 4nal technical importance of the nine HOWs in the following order:
H5 � H2 � H9 � H1 � H8 � H6 � H7 � H3 � H4: (21)
This 4nal technical importance order diOers from the initial technical importance order (19) in two aspects: (i) H1 is ofhigher initial technical importance but lower 4nal technical importance than H2 and H9, and (ii) H6 is of lower initialtechnical importance but high 4nal technical importance than H7. Since technical competitive priority ratings (zn’s) do notvary too much, these two diOerences are mainly caused by the setting of performance goals (bn’s) or improvement ratios(vn’s): (i) H1’s improvement ratio (1.2222) is lower than H2’s (1.3333) and H9’s (1.3333), and (ii) H6’s improvementratio (1.3333) is higher than H7’s (1.2500).
If initial technical ratings are STFNs, then the 4nal technical ratings are also given as STFNs:
s̃ = (s̃1; s̃2; : : : ; s̃9) = ([3:1736; 6:4709]; [3:4313; 7:0324];
[1:3741; 4:1451]; [1:2321; 3:9402]; [3:8956; 7:7724]; [2:0223; 5:2558];
[1:9086; 5:0075]; [2:6774; 5:8689]; [3:1192; 6:7447]):
Here, for example, the 4nal technical rating of H1 in STFN form, s̃1, is computed by (16) and the arithmetic ofSTFNs as
s̃1 = v1 × t̃1 × z1 = (11=9) × [23:2850; 47:4773] × 0:1115 = [3:1736; 6:4709]:
These fuzzy ratings produce the following ranking order for the HOWs’ 4nal importance:
H5 � H2 � (H9; H1) � H8 � H6 � H7 � H3 � H4: (22)
It is noticed from (21) and (22) that the crisp and fuzzy ratings show an almost identical ranking order for the HOWs’4nal technical importance. Both sets of ratings indicate that H5 is the most important HOW, followed by H2 and then byH9 and H1, and that H4 is the least important HOW, preceded by H3 and H7.
These crisp and fuzzy 4nal technical ratings of the HOWs are shown in Table 9. In order to be comparable, they areboth scaled to have maximum rating or upper limit of unity, which are also shown in Table 9. From these scaled ratingswe can see again that, although the crisp and fuzzy ratings exhibit an identical trend, crisp ratings always tend to beclose to the upper limits of the corresponding fuzzy ratings. This shows that fuzzy ratings are more representative of thepossible variations of the HOWs’ technical importance, which would make the technical improvement more 5exible andthe design process more feasible.
The above nine steps complete the HOQ process for improving the fried Chinese vegetable. The corresponding tables ofresults, after appropriate arrangement, can form an HOQ like Fig. 2 which links customer needs to technical considerationsand exhibits all the relevant elements and their relationships. As a result of this HOQ model, it is concluded that H4
could be deleted from further consideration (in QFD’s second phase, parts deployment) to save technical eOorts withoutdecreasing customer satisfaction. If resource or budget considerations require to further cut down the number of HOWs,H3; H7 and H6 form a good deleting order that will not signi4cantly in5uence the ful4llment of the customer needs.

L.-K. Chan, M.-L. Wu /Omega 33 (2005) 119–139 135
Table 9Crisp and fuzzy 4nal technical ratings of the nine HOWs
HOWs Final technical ratings Scaled 4nal technical ratings
Crisp (sn) Fuzzy (s̃n) Crisp Fuzzy
H1 4.6595 [3.1736, 6.4709] 0.8229 [0.4083, 0.8326]H2 5.0541 [3.4313, 7.0324] 0.8926 [0.4415, 0.9048]H3 2.5948 [1.3741, 4.1451] 0.4583 [0.1768, 0.5333]H4 2.4250 [1.2321, 3.9402] 0.4283 [0.1585, 0.5069]H5 5.6622 [3.8956, 7.7724] 1.0000 [0.5012, 1.0000]H6 3.4637 [2.0223, 5.2558] 0.6117 [0.2602, 0.6762]H7 3.2933 [1.9086, 5.0075] 0.5816 [0.2456, 0.6443]H8 4.1163 [2.6774, 5.8689] 0.7270 [0.3445, 0.7551]H9 4.7578 [3.1192, 6.7447] 0.8403 [0.4013, 0.8678]
5. About the probability factors and correlation matrices
As mentioned in Section 2.2, our proposed 9-step HOQ model has two major exclusions to make the model simple anduni4ed. One is the probabilities to achieve the goals set for the HOWs, and one is the two correlation matrices. Certainlythese two omitted parts involve some degree of di=culties to be dealt with. But for the completeness of this study, herewe provide some considerations about them and suggest some ways to handle them in a potentially more comprehensiveHOQ model.
5.1. Probabilities to achieve goals for HOWs
A seemingly natural approach is to directly incorporate these probabilities into formula (16) for calculating the HOWs’4nal technical ratings:
4nal technical rating of a HOW (sn)
= improvement ratio (vn) × initial technical rating (tn)
× technical competitive priority (zn) × probability to achieve the goal for the HOW: (23)
However, there is an apparent problem with this approach, i.e., the possibly serious overlapping of information containedin improvement ratios, technical competitive assessments and probability factors. This is because the determination of theprobability factors, no matter easy or not, depends largely on improvement ratios and technical competitive assessments.So the direct inclusion of these probabilities into the calculation of the HOWs’ 4nal technical ratings will overestimate orunderestimate some underlying factors, resulting in the overestimation or underestimation of some HOWs’ 4nal importance.As a result, we suggest that practitioners employ the simpler formula (16) in our proposed 9-step HOQ model rather thanformula (23) to compute the HOWs’ 4nal technical ratings.
5.2. Correlations among WHATs and among HOWs
Correlations among the HOWs are mentioned and included in many QFD studies, but are seldom incorporated into thecalculation of the HOWs’ 4nal ratings. Very few studies include or even mention the correlations among the WHATs,not to say to incorporate such correlations into the calculation of the WHATs’ 4nal ratings. One reason for these is thedi=culty in obtaining the relevant data since, although they can be measured using appropriate scales such as (1), (6) or(10), correlations among the HOWs and among the WHATs require the technicians and the customers to make a lot ofpair-wise comparisons about the degrees to which the HOWs and the WHATs are inter-related. This would be tediousand di=cult from the customer’s perspective, although it is possible from the technician’s side.
Another equal important reason is that, although these correlations are useful in analyzing the WHATs and especiallythe HOWs, there seem few, if any, good methods to incorporate the correlations into the calculation of the WHATs’ andthe HOWs’ 4nal ratings. Most of times people simply use formulas (5) and (7) to obtain these 4nal ratings, ignoring thecorrelations among the HOWs and among the WHATs even if they are available. This seems common not only in QFD,but also in other similar situations. For example, stock index for a given market is simply the weighted average of the
136 L.-K. Chan, M.-L. Wu /Omega 33 (2005) 119–139
prices of the constituent stocks in the market, and no correlations among the stock prices are considered although thesecorrelations are useful as well as available.
Among the very few approaches found in the QFD literature to dealing with the correlations, a noticeable one isproposed by Khoo and Ho [12]. For a target WHAT (or HOW), the approach determines its importance rating as linearcombination of its correlations with other WHATs weighted by the WHATs’ initial importance ratings:
importance rating of a WHAT
=∑
(initial importance rating of other WHAT
×value of correlation between the target WHAT and other WHAT); (24)
where the summation is over all WHATs. This method makes some intuitive sense, although it apparently tends tooverestimate/underestimate the importance ratings of those WHATs (or HOWs) with positive/negative correlations withother WHATs. Therefore, if we have the required correlations and if we think this approach is appropriate, we mayconsider the so obtained importance ratings for WHATs (or HOWs) by formula (24) as the “new” initial importanceratings and then employ our formula (13) (or (16) for HOWs) to get the 4nal importance ratings.
6. Conclusions
In the literature, diOerent authors build diOerent house of quality (HOQ) models that contain diOerent elements andemploy diOerent scales to measure the relevant concepts, which may puzzle the practitioners as which HOQ modelsshould be used. This paper presents a systematic and operational approach to HOQ to help resolve this problem. We 4rstgive a comprehensive description of the relevant elements in HOQ. Then we propose a 9-step HOQ model to unify theHOQ process and a few 9-point scales to unify the measurements in HOQ to avoid arbitrariness and incomparability.We especially address the various “voices” in the HOQ process and suggest the use of symmetrical triangular fuzzynumbers (STFNs) to re5ect the vagueness in people’s linguistic assessments. Furthermore, since the commonly used salespoint concept is quite subjective, we employ the quantitative entropy method to conduct competitive analysis and derivecompetitive priority ratings. All information required, computations involved and feasible methods are clearly indicated togive an applicable framework for practitioners to perform HOQ analysis without confusions and di=culties.
To fully illustrate our proposed HOQ model, we present a fried Chinese vegetable example that involves 10 customerneeds (WHATs), nine technical measures (HOWs) and 4ve restaurants. Although many studies on QFD have been doneand a lot of QFD applications have been reported (see Ref. [25] for a review), there are according to our knowledge fewcomplete QFD cases or examples published. This causes problems for practitioners to apply the QFD technique to theirproduct or service improvement processes. QFD is a complex and time-consuming process that involves many concepts tounderstand, much information to collect and many computations to perform. A complete and operational description of theQFD process will facilitate its wide applications, and a full example illustrating all the concepts, information collecting,computation and implementation steps will undoubtedly be helpful. Our paper, especially the example presented, is towardssuch a purpose.
Our proposed 9-step HOQ model, although quite comprehensive and uni4ed in nature, admittedly makes two majorexclusions: one is the probability factors for achieving the goals for HOWs, another is the two correlation matrices ofthe WHATs and the HOWs. Since these two parts involve certain degrees of di=culties, they are omitted to make ourmodel simpler and more operable. Of course, this does not mean they are unimportant for the QFD process. We discussin some detail the problems associated with the two omitted parts, and also suggest some possible approaches to directlyincorporate them into the relevant calculations within a potentially enlarged HOQ model. Further eOorts in this aspectthrough sharing of research and application experiences are highly welcome to make the QFD process more complete.
Acknowledgements
The authors gratefully acknowledge the support for this study from the Research Grants Council of Hong Kong andthe City University of Hong Kong, and the valuable comments on an earlier version of this paper from an anonymousreferee.

L.-K. Chan, M.-L. Wu /Omega 33 (2005) 119–139 137
Appendix. Fuzzy and entropy methods
A.1. Fuzzy method for vagueness representation
Fuzzy set theory was developed for solving problems in which descriptions of objects are subjective, vague and im-precise, i.e., no boundaries for the objects can be well de4ned. Let X = {x} be a traditional set of objects, called theuniverse. A fuzzy set F̃ in X is characterized by a membership function %F̃ (x) that associates each object in X with amembership value in the interval [0, 1], indicating the degree of the object belonging to F̃ .
A fuzzy number is a special fuzzy set when the universe X is the real line R1: −∞¡x¡+∞. A symmetrical triangularfuzzy number (STFN), denoted as F̃ = [a; c], is a special fuzzy number with the following symmetrical triangular type ofmembership function:
%F̃ (x) = 1 − |x − (c + a)=2|=[(c − a)=2]; a6 x6 c:
STFN is widely used in practice to represent a fuzzy set or concept F̃ = “approximately b” where b = (a + c)=2. Forexample, if customer need W1= “appetizing” is rated as having “very high” importance by a customer, then traditionallywe may assign W1 a number 9 using scale (8). To capture the vagueness of the customer’s subjective assessment, wecan according to the same scale (8) assign W1 an STFN [8,10] which means “approximately 9” and is represented by thefollowing membership function:
%[8;10](x) = 1 − |x − 9|; 86 x6 10:
This means that, for example, the membership value or “possibility” that W1= “appetizing” is assigned a number 9 is%[8;10](9)=1, the “possibility” that W1 is assigned a number 8.5 or 9.5 is %[8;10](8:5)=0:5 or %[8;10](9:5)=0:5. So assigningW1 a number 8.5 or 9.5 is acceptable or “possible” to the degree of 50%.
The basic arithmetic rules for STFNs are as follows:
Addition: [a1; c1] + [a2; c2] = [a1 + a2; c1 + c2].Subtraction: [a1; c1] − [a2; c2] = [a1−c2; c1−a2].Scalar multiplication: k × [a1; c1] = [ka1; kc1]; k ¿ 0.Multiplication: [a1; c1] × [a2; c2] ∼= [a1a2; c1c2], a1¿ 0; a2¿ 0.Division: [a1; c1] ÷ [a2; c2] ∼= [a1=c2; c1=a2], a1¿ 0; a2¿ 0.
For any two STFNs, F̃1 = [a1; c1] and F̃2 = [a2; c2], if one interval is not strictly contained by another then their rankingorder can be easily and intuitively determined. That is
• If c2¿c1 and a2¿ a1, or c2¿ c1 and a2¿a1, then F̃2 � F̃1, where “�” means “is more preferred (important, superior,etc.) than”.
• If c2 = c1 and a2 = a1, then F̃2 = F̃1.
But if one interval is strictly contained by another, i.e., if c2¡c1 and a2¿a1, or c2¿c1 and a2¡a1, then the rankingproblem becomes complex and many possibilities may occur.
For more details about fuzzy set theory, STFNs and fuzzy ranking methods, see Refs. [13,26–29].
A.2. Entropy method for competitive priority ratings
In our HOQ model, Step 3 is to obtain and analyze the following customer comparison matrix:
X =
C1 C2 · · · CL
W1
W2
· · ·WM
x11 x12 · · · x1L
x21 x22 · · · x2L
· · · · · · · · · · · ·xM1 xM2 · · · xML
M×L
;
where xml is the performance of company l’s product on customer need Wm, perceived by the customers. Based on thisX information, the producing company C1 may set priorities for its product on the M customer needs in order to achievea relative competitive advantage over other companies. If company C1 performs much better than many other companies

138 L.-K. Chan, M.-L. Wu /Omega 33 (2005) 119–139
in terms of a customer need Wm, then further improvement may not be urgently needed and thus a lower priority couldbe assigned to Wm. At the other extreme, if C1 performs much worse than many other companies on Wm, then it maybe di=cult for C1 to build a competitive advantage within a short period of time. In both cases, Wm could be assigneda lower priority rating. However, if most companies perform quite similarly on Wm, not too much improvement eOortfrom C1 may result in a better performance of its product and give C1 a unique competitive advantage. Thus a higherpriority could be assigned to Wm. In particular, if all companies’ performances on Wm are the same, it implies a greatmarket opportunity since any improvement would create a signi4cant competitive advantage. So the highest priority couldbe assigned to Wm. This basis of assigning priorities is interestingly related to the entropy concept in information theory.
Entropy is a measure for the amount of information (or uncertainty, variations) represented by a discrete probabilitydistribution, p1; p2; : : : ; pL:
E(p1; p2; : : : ; pL) = −!L
L∑l=1
pl ln(pl); (A.1)
where !L=1=ln(L) is a normalization constant to guarantee 06E(p1; p2; : : : ; pL)6 1. Larger entropy or E(p1; p2; : : : ; pL)value implies smaller variations among the pl’s and hence less information contained in the distribution. For the mth rowof the customer comparison matrix X corresponding to the customer need Wm; xm1; xm2; : : : ; xmL, let xm =
∑Ll=1 xml be the
total score with respect to Wm. Then according to (A.1), the normalized ratings pml = xml=xm for l = 1; 2; : : : ; L can beviewed as the “probability distribution” of Wm on the L companies with entropy as
E(Wm) = −!L
L∑l=1
pml ln(pml) = −!L
L∑l=1
(xml=xm)ln(xml=xm): (A.2)
It is clear that the larger the E(Wm) value, the less information contained in Wm or smaller variations among the pml’s(or xml’s). If all companies’ performance ratings on Wm; xm1; xm2; : : : ; xmL, are the same, Wm has zero variations and E(Wm)achieves its maximum of 1. So E(Wm) can be used to re5ect the relative competitive advantage in terms of the customerneed Wm. All these E(Wm) values, after normalization:
em = E(Wm)
/M∑m=1
E(Wm); m= 1; 2; : : : ; M (A.3)
can be considered as the customer competitive priority ratings for company C1 on the M customer needs, with a largerem indicating higher competitive priority for the corresponding Wm.
For more on entropy and its applications, see Refs. [13,22,30–32].
References
[1] Sullivan LP. Quality function deployment. Quality Progress 1986;19(6):39–50.[2] American Supplier Institute. Quality function deployment (service QFD): 3-day workshop. Dearborn, MI: ASI Press; 1994.[3] Day RG. Quality function deployment: linking a company with its customers. Milwaukee, WI: ASQC Quality Press; 1993.[4] Eureka WE, Nancy ER. The customer-driven company: managerial perspective on quality function deployment, 2nd ed. Dearborn,
MI: ASI Press, Burr Ridge, IL: Irwin; 1994.[5] Hauser JR, Clausing D. The house of quality. Harvard Business Review 1988;66(3):63–73.[6] Bossert JL. Quality function deployment: a practitioner’s approach. Milwaukee, WI: ASQC Quality Press; 1991.[7] Cohen L. Quality function deployment: how to make QFD work for you. Reading, MA: Addison-Wesley; 1995.[8] Gri=n A, Hauser JR. The voice of the customer. Marketing Science 1993;12(1):1–27.[9] Guinta LR, Praizler NC. The QFD book: the team approach to solving problems and satisfying customers through quality function
deployment. New York: Amacom; 1993.[10] Balthazard PA, Gargeya VB. Reinforcing QFD with group support systems: computer supported collaboration for quality in design.
International Journal of Quality & Reliability Management 1995;12(6):43–62.[11] Moskowitz H, Kim KJ. QFD optimizer: a novice friendly quality function deployment decision support system for optimizing product
designs. Computers & Industrial Engineering 1997;32(3):641–55.[12] Khoo LP, Ho NC. Framework of a fuzzy quality function deployment system. International Journal of Production Research
1996;34(2):299–311.[13] Chan LK, Kao HP, Ng A, Wu ML. Rating the importance of customer needs in quality function deployment by fuzzy and entropy
methods. International Journal of Production Research 1999;37(11):2499–518.[14] Chan LK, Wu ML. Quality function deployment: a comprehensive review of its concepts and methods. Quality Engineering
2002;15(1):23–35.[15] Chan LK, Wu ML. Prioritizing the technical measures in quality function deployment. Quality Engineering 1998;10(3):467–79.[16] Belhe U, Kusiak A. The house of quality in a design process. International Journal of Production Research 1986;34(8):2119–31.
L.-K. Chan, M.-L. Wu /Omega 33 (2005) 119–139 139
[17] Saaty TL. The analytic hierarchy process: planning, priority setting, resource allocation. Pittsburgh, PA: RWS Publications; 1988.[18] Elmore PE, Beggs DL. Salience of concepts and commitment to extreme judgements in response pattern of teachers. Education
1975;95(4):325–34.[19] Miller GA. The magic number of seven, plus or minus two. Psychological Review 1965;63:81–97.[20] Olsson U. On the robustness of factor analysis against crude classi4cation of the observations. Multivariate Behavioral Research
1979;14:485–500.[21] Hwang CL, Yoon K. Multiple attribute decision making: methods and applications. Berlin: Springer; 1981.[22] Yoon K, Hwang CL. Multiple attribute decision making: an introduction. Thousand Oaks, CA: Sage; 1995.[23] Parkan C, Wu ML. On the equivalence of operational performance measurement and multiple-attribute decision making. International
Journal of Production Research 1997;35(11):2963–88.[24] Parkan C, Wu ML. Comparison of three modern multi-criteria decision making tools. International Journal of Systems Science
2000;31(4):497–517.[25] Chan LK, Wu ML. Quality function deployment: a literature review. European Journal of Operational Research 2002;143(3):
463–97.[26] Bortolan G, Degani RT. A review of some methods for ranking fuzzy subsets. Fuzzy Sets and Systems 1985;15(1):1–19.[27] Chen SJ, Hwang CL. Fuzzy multiple attribute decision making: methods and applications. Berlin: Springer; 1992.[28] Dubois D, Prade H. Fuzzy sets and systems: theory and applications. New York: Academic Press; 1980.[29] Zimmermann HJ. Fuzzy set, decision making and expert system. Boston: Kluwer; 1987.[30] Alpert MI. De4nition of determinant attributes: a comparison of methods. Journal of Marketing Research 1971;8:184–91.[31] Moinpur R, Wiley JB. Application of multi-attribute models of attribute in marketing. Journal of Business Administration 1974;5(2):
3–16.[32] Zeleny M. Multiple criteria decision making. New York: McGraw-Hill; 1982.